
Effect of Graphene Nanofibers on the Morphological, Structural, Thermal, Phase Transitions and Mechanical Characteristics in Metallocene iPP Based Nanocomposites


 , and
, and
Abstract
1. Introduction
2. Materials and Methods
2.1. Materials
2.2. Extrusion of the Nanocomposites
2.3. Preparation of the Films
2.4. Characterization Techniques
3. Results
3.1. Characterization of Graphene Nanofibers
3.2. Morphological Characterization of Nanocomposites
3.3. Structural Evaluation of Nanocomposites
3.4. Thermal Stability and Phase Transitions
3.5. Final Mechanical Properties
4. Conclusions
Author Contributions
Funding
Institutional Review Board Statement
Informed Consent Statement
Data Availability Statement
Acknowledgments
Conflicts of Interest
References
- Malpass, D.B.; Band, E.I. Introduction to Industrial Polypropylene: Properties, Catalysts, Processes; John Wiley & Sons, Inc.: Hoboken, NJ, USA; Scrivener Publishing LLC.: Salem, MA, USA, 2012. [Google Scholar]
- Caveda, S.; Pérez, E.; Blázquez-Blázquez, E.; Peña, B.; van Grieken, R.; Suárez, I.; Benavente, R. Influence of structure on the properties of polypropylene copolymers and terpolymers. Polym. Test. 2017, 62, 23–32. [Google Scholar] [CrossRef]
- Sinn, H.; Kaminisky, W. Ziegler-Natta Catalysis. Adv. Organomet. Chem. 1980, 18, 99–149. [Google Scholar]
- Wild, F.R.W.P.; Zsolnai, L.; Huttner, G.; Brintzinger, H.H. ansa-Metallocene derivatives IV. Synthesis and molecular structures of chiral ansa-titanocene derivatives with bridged tetrahydroindenyl ligands. J. Organomet. Chem. 1982, 232, 233–247. [Google Scholar] [CrossRef]
- Arranz Andrés, J.; Benavente, R.; Peña, B.; Pérez, E.; Cerrada, M.L. Toughening of a propylene-b-(ethylene-co-propylene) copolymer by a plastomer. J. Polym. Sci. Part B Polym. Phys. 2002, 40, 1869–1880. [Google Scholar] [CrossRef]
- Cerrada, M.L.; Benavente, R.; Pérez, E. Crystalline structure and viscoelastic behavior in composites of a metallocenic ethylene-1-octene copolymer and glass fiber. Macromol. Chem. Phys. 2002, 203, 718–726. [Google Scholar] [CrossRef]
- Prieto, O.; Pereña, J.M.; Benavente, R.; Pérez, E.; Cerrada, M.L. Viscoelastic relaxation mechanisms of conventional polypropylene toughened by a plastomer. J. Polym. Sci. Part B Polym. Phys. 2003, 41, 1878–1888. [Google Scholar] [CrossRef]
- Krache, R.; Benavente, R.; López-Majada, J.M.; Pereña, J.M.; Cerrada, M.L.; Pérez, E. Competition between α, β and γ polymorphs in a β-nucleated metallocenic isotactic polypropylene. Macromolecules 2007, 40, 6871–6878. [Google Scholar] [CrossRef]
- Benavente, R.; Caveda, S.; Pérez, E.; Blázquez, E.; Peña, B.; van Grieken, R.; Suarez, I. Influence of β-nucleation on polymorphism and properties in random copolymers and terpolymers of propylene. Polym. Eng. Sci. 2012, 52, 2285–2295. [Google Scholar] [CrossRef]
- Bento, A.; Lourenço, J.P.; Fernandes, A.; Ribeiro, M.R.; Arranz-Andrés, J.; Lorenzo, V.; Cerrada, M.L. Gas permeability properties of decorated MCM 41/polyethylene hybrids prepared by in situ polymerization. J. Membr. Sci. 2012, 415–416, 702–711. [Google Scholar] [CrossRef]
- Barranco-García, R.; López-Majada, J.M.; Lorenzo, V.; Gómez-Elvira, J.M.; Pérez, E.; Cerrada, M.L. Confinement of iPP chains in the interior of SBA-15 mesostructure ascertained by gas transport properties in iPP-SBA-15 nanocomposites prepared by extrusion. J. Membr. Sci. 2019, 569, 137–148. [Google Scholar] [CrossRef]
- Kubacka, A.; Cerrada, M.L.; Serrano, C.; Fernández-García, M.; Ferrer, M.; Fernández-García, M. Light-driven novel properties of TiO2-modified Polypropylene-based Nanocomposite Films. J. Nanosci. Nanotechnol. 2008, 8, 3241–3246. [Google Scholar] [CrossRef]
- Blázquez-Blázquez, E.; Arranz-Andrés, J.; Ressia, J.; Vallés, E.M.; Marín, P.; Aragón, A.M.; Pérez, E.; Cerrada, M.L. Electromagnetic Interference Shielding Response and Rheological Behavior of Lightweight Nanocomposites based on isotactic Polypropylene and Al Nanoparticles. Polym. Test. 2018, 72, 263–270. [Google Scholar] [CrossRef]
- Barranco-García, R.; Gómez-Elvira, J.M.; Ressia, J.A.; Quinzani, L.; Vallés, E.M.; Pérez, E.; Cerrada, M.L. Effect of iPP molecular weight on its confinement within mesoporous SBA-15 silica in extruded iPP-SBA-15 nanocomposites. Micropor. Mesopor. Mat. 2020, 294, 109945. [Google Scholar] [CrossRef]
- Barranco-García, R.; Gómez-Elvira, J.M.; Ressia, J.A.; Quinzani, L.; Vallés, E.M.; Pérez, E.; Cerrada, M.L. Variation of Ultimate Properties in Extruded iPP-Mesoporous Silica Nanocomposites by Effect of iPP Confinement within the Mesostructures. Polymers 2020, 12, 70. [Google Scholar] [CrossRef]
- Palza, H.; López-Majada, J.M.; Quijada, R.; Pereña, J.M.; Benavente, R.; Pérez, E.; Cerrada, M.L. Comonomer Length Influence on the Structure and Mechanical Response of Metallocenic Polypropylenic Materials. Macromol. Chem. Phys. 2008, 209, 2259–2267. [Google Scholar] [CrossRef]
- Barranco-García, R.; Ferreira, A.E.; Ribeiro, M.R.; Lorenzo, V.; García-Peñas, A.; Gómez-Elvira, J.M.; Pérez, E.; Cerrada, M.L. Hybrid materials obtained by in situ polymerization based on polypropylene and mesoporous SBA-15 silica particles: Catalytic aspects, crystalline details and mechanical behavior. Polymer 2018, 151, 218–230. [Google Scholar] [CrossRef]
- Ahmad, S.R.; Young, R.J.; Kinloch, I.A. Raman spectra and mechanical properties of graphene/polypropylene nanocomposites. Int. J. Chem. Eng. Appl. 2015, 6, 1–5. [Google Scholar]
- Yang, K.; Endoh, M.; Trojanowski, R.; Ramasamy, R.P.; Gentlman, M.M.; Butcher, T.A.; Rafailovich, M.H. The thermo-mechanical response of PP nanocomposites at high graphene loading. Nanocomposites 2015, 1, 126–137. [Google Scholar] [CrossRef][Green Version]
- Al-Saleh, M.A.; Yussuf, A.A.; Al-Enezi, S.; Kazemi, R.; Wahit, M.U.; Al-Shammari, T.; Al-Banna, A. Polypropylene/Graphene Nanocomposites: Effects of GNP Loading and Compatibilizers on the Mechanical and Thermal Properties. Materials 2019, 12, 3924. [Google Scholar] [CrossRef]
- Milani, M.A.; Quijada, R.; Basso, N.R.S.; Graebin, A.P.; Galland, G.B. Influence of the graphite type on the synthesis of polypropylene/graphene nanocomposites. J. Polym. Sci. Part A Polym. Chem. 2012, 50, 3598–3605. [Google Scholar] [CrossRef]
- Milani, M.A.; González, D.; Quijada, R.; Basso, N.R.S.; Cerrada, M.L.; Azambuja, D.S.; Galland, G.B. Polypropylene/graphene nanosheet nanocomposites by in situ polymerization: Synthesis, characterization and fundamental properties. Compos. Sci. Technol. 2013, 84, 1–7. [Google Scholar] [CrossRef]
- Milani, M.A.; González, D.; Quijada, R.; Benavente, R.; Arranz-Andrés, J.; Galland, G.B. Synthesis, characterization and properties of poly(propylene-1-octene)/graphite nanosheet nanocomposites obtained by in situ polymerization. Polymer 2015, 65, 134–142. [Google Scholar] [CrossRef]
- González, D.M.; Quijada, R.; Yazdani-Pedram, M.; Benavente, R.; Galland, G.B.; Milani, M.A. Influence of the Polymeric Matrix and Thermal Treatment on the Properties of Polyolefin-Graphite Nanosheets Nanocomposites. Macromol. Mater. Eng. 2016, 301, 1503–1512. [Google Scholar] [CrossRef]
- Klug, P.; Alexander, L.E. X-ray Diffraction Procedures: For Polycrystalline and Amorphous Materials, 2nd ed.; John Wiley & Sons, Inc.: Hoboken, NJ, USA, 1974. [Google Scholar]
- Mansel, S.; Pérez, E.; Benavente, R.; Pereña, J.M.; Bello, A.; Roll, W.; Kirsten, R.; Beck, S.; Brintzinger, H.H. Synthesis and properties of elastomeric poly (propylene). Macromol. Chem. Phys. 1999, 200, 1292–1297. [Google Scholar] [CrossRef][Green Version]
- Arranz-Andrés, J.; Parrilla, R.; Cerrada, M.L.; Pérez, E. Mesophase Formation in Random Propylene-co-1-Octene Copolymers. Macromolecules 2013, 46, 8557–8568. [Google Scholar] [CrossRef]
- Mezghani, K.; Philips, P.J. The γ-phase of high molecular weight isotactic polypropylene: III. The equilibrium melting point and the phase diagram. Polymer 1998, 39, 3735–3744. [Google Scholar] [CrossRef]
- Bond, E.B.; Spruiell, J.E.; Lin, J.S. A WAXD/SAXS/DSC study on the melting behavior of Ziegler–Natta and metallocene catalyzed isotactic polypropylene. J. Polym. Sci. Part B Polym. Phys. 1999, 37, 3050–3064. [Google Scholar] [CrossRef]
- Baltá-Calleja, F.J. Microhardness Relating to Crystalline Polymers. Adv. Polym. Sci. 1985, 66, 117–148. [Google Scholar]
- Fonseca, C.; Pereña, J.M.; Benavente, R.; Cerrada, M.L.; Bello, A.; Pérez, E. Microhardness and thermal study of the annealing effects in vinyl alcohol-ethylene copolymers. Polymer 1995, 36, 1887–1892. [Google Scholar] [CrossRef]
- Pedrazzoli, D.; Dorigato, A.; Conti, T.; Vanzetti, L.; Bersani, M.; Pegoretti, A. Liquid crystalline polymer nanocomposites reinforced with in-situ reduced graphene oxide. eXPRESS Polym. Lett. 2015, 9, 709–720. [Google Scholar] [CrossRef]
- Ferrari, A.C. Raman spectroscopy of graphene and graphite: Disorder, electron–phonon coupling, doping and nonadiabatic effects. Solid State Commun. 2007, 143, 47–57. [Google Scholar] [CrossRef]
- Marquina, J.; Power, C.; González, J. Raman spectroscopy in monolayer graphene and graphite: Electron-phonon coupling and nonadiabatic effects. Tumbaga 2010, 5, 183–194. [Google Scholar]
- Monti, M.; Rallini, M.; Puglia, D.; Peponi, L.; Torre, L.; Kenny, J.M. Morphology and electrical properties of graphene–epoxy nanocomposites obtained by different solvent assisted processing methods. Compos. Part A Appl. Sci. Manuf. 2013, 46, 166–172. [Google Scholar] [CrossRef]
- Bunch, J.S.; Yaish, Y.; Brink, M.; Bolotin, K.; McEuen, P.L. Coulomb Oscillations and Hall Effect in Quasi-2D Graphite Quantum Dots. Nano Lett. 2005, 5, 287–290. [Google Scholar] [CrossRef]
- Gupta, A.; Chen, G.; Joshi, P.; Tadigadapa, S.; Eklund, P.C. Raman scattering from high-frequency phonons in supported n-graphene layer films. Nano Lett. 2006, 6, 2667–2673. [Google Scholar] [CrossRef]
- Song, P.; Cao, Z.; Cai, Y.; Zhao, L.; Fang, Z.; Fu, S. Fabrication of exfoliated graphene-based polypropylene nanocomposites with enhanced mechanical and thermal properties. Polymer 2011, 52, 4001–4010. [Google Scholar] [CrossRef]
- El Achaby, M.; Arrakhiz, F.E.; Vaudreuil, S.; El Kacem Qaiss, A.; Bousmina, M.; Fassi-Fehri, O. Mechanical, thermal, and rheological properties of graphene-based polypropylene nanocomposites prepared by melt mixing. Polym. Compos. 2012, 33, 733–744. [Google Scholar] [CrossRef]
- Bian, J.; Wang, Z.J.; Lin, H.L.; Zhou, X.; Xiao, W.Q.; Zhao, X.W. Thermal and mechanical properties of polypropylene nanocomposites reinforced with nano-SiO2 functionalized graphene oxide. Compos. Part A Appl. Sci. Manuf. 2017, 97, 120–127. [Google Scholar] [CrossRef]
- Ryu, S.H.; Shanmugharaj, A.M. Influence of hexamethylene diamine functionalized graphene oxide on the melt crystallization and properties of polypropylene nanocomposites. Mater. Chem. Phys. 2014, 146, 478–486. [Google Scholar] [CrossRef]
- Long, J.; Li, S.; Liang, J.; Wang, J.; Liang, B. Preparation and characterization of graphene oxide and it application as a reinforcement in polypropylene composites. Polym. Compos. 2019, 40, 723–729. [Google Scholar] [CrossRef]
- Turner-Jones, A.; Aizlewood, J.M.; Beckett, D.R. Crystalline forms of isotactic polypropylene. Makromol. Chem. 1964, 75, 134–158. [Google Scholar] [CrossRef]
- Brückner, S.; Meille, S.V.; Petraccone, V.; Pirozzi, B. Polymorphism in isotactic polypropylene. Prog. Polym. Sci. 1991, 16, 361–404. [Google Scholar] [CrossRef]
- Varga, J. Supermolecular structure of isotactic polypropylene. J. Mat. Sci. 1992, 27, 2557–2579. [Google Scholar] [CrossRef]
- Lotz, B.; Wittmann, J.C.; Lovinger, A.J. Structure and morphology of poly(propylenes): A molecular analysis. Polymer 1996, 37, 4979–4992. [Google Scholar] [CrossRef]
- Polo-Corpa, M.J.; Benavente, R.; Velilla, T.; Quijada, R.; Pérez, E.; Cerrada, M.L. Development of the mesomorphic phase in isotactic propene/higher α-olefin copolymers at intermediate comonomer content and its effect on properties. Eur. Polym. J. 2010, 46, 1345–1354. [Google Scholar] [CrossRef][Green Version]
- Pérez, E.; Gómez-Elvira, J.M.; Benavente, R.; Cerrada, M.L. Tailoring the formation rate of the mesophase in random propylene-co-1-pentene copolymers. Macromolecules 2012, 45, 6481–6490. [Google Scholar] [CrossRef]
- Poon, B.; Rogunova, M.; Hiltner, A.; Baer, E.; Chum, P.S.; Galeski, A.; Piorkowska, E. Structure and properties of homogeneous copolymers of propylene and 1-hexene. Macromolecules 2005, 38, 1232–1243. [Google Scholar] [CrossRef]
- De Rosa, C.; Dello Iacono, S.; Auriemma, F.; Ciaccia, E.; Resconi, L. Crystal structure of isotactic propylene-hexene copolymers: The trigonal form of isotactic polypropylene. Macromolecules 2006, 39, 6098–6109. [Google Scholar] [CrossRef]
- Pérez, E.; Cerrada, M.L.; Benavente, R.; Gómez-Elvira, J.M. Enhancing the formation of the new trigonal polymorph in isotactic propene-1-pentene copolymers: Determination of the X-ray crystallinity. Macromol. Res. 2011, 19, 1179–1185. [Google Scholar] [CrossRef]
- García-Peñas, A.; Gómez-Elvira, J.M.; Pérez, E.; Cerrada, M.L. Isotactic poly(propylene-co-1-pentene-co-1-hexene) terpolymers: Synthesis, molecular characterization, and evidence of the trigonal polymorph. J. Polym. Sci. Part A Polym. Chem. 2013, 51, 3251–3259. [Google Scholar] [CrossRef]
- García-Peñas, A.; Gómez-Elvira, J.M.; Barranco-García, R.; Pérez, E.; Cerrada, M.L. Trigonal form as a tool for tuning mechanical behavior in poly(propylene-co-1-pentene-co-1-heptene) terpolymers. Polymer 2016, 99, 112–121. [Google Scholar] [CrossRef]
- Pérez, E.; Zucchi, D.; Sacchi, M.C.; Forlini, F.; Bello, A. Obtaining the γ phase in isotactic polypropylene: Effect of catalyst system and crystallization conditions. Polymer 1999, 40, 675–681. [Google Scholar] [CrossRef]
- Ahmad, S.R.; Xue, C.; Young, R.J. The mechanisms of reinforcement of polypropylene by graphene nanoplatelets. Mater. Sci. Eng. B 2017, 216, 2–9. [Google Scholar] [CrossRef]
- An, J.E.; Jeon, G.W.; Jeong, Y.G. Preparation and properties of polypropylene nanocomposites reinforced with exfoliated graphene. Fibers Polym. 2012, 13, 507–514. [Google Scholar] [CrossRef]
- Wang, Y.; Wang, J.-C.; Chen, S.-Z. Role of surfactant molecular weight on morphology and properties of functionalized graphite oxide filled polypropylene nanocomposites. eXPRESS Polym. Lett. 2014, 8, 881–894. [Google Scholar] [CrossRef][Green Version]
- Campos, J.M.; Lourenço, J.P.; Pérez, E.; Cerrada, M.L.; Ribeiro, M.R. Self-Reinforced Hybrid Polyethylene/MCM-41 Nanocomposites: In-Situ Polymerisation and Effect of MCM-41 Content on Rigidity. J. Nanosci. Nanotechnol. 2009, 9, 3966–3974. [Google Scholar] [CrossRef] [PubMed]
- Cerrada, M.L.; de la Fuente, J.L.; Fernández-García, M.; Madruga, E.L. Viscoelastic and mechanical properties of poly(butyl acrylate-g-styrene) copolymers. Polymer 2001, 42, 4647–4655. [Google Scholar] [CrossRef]


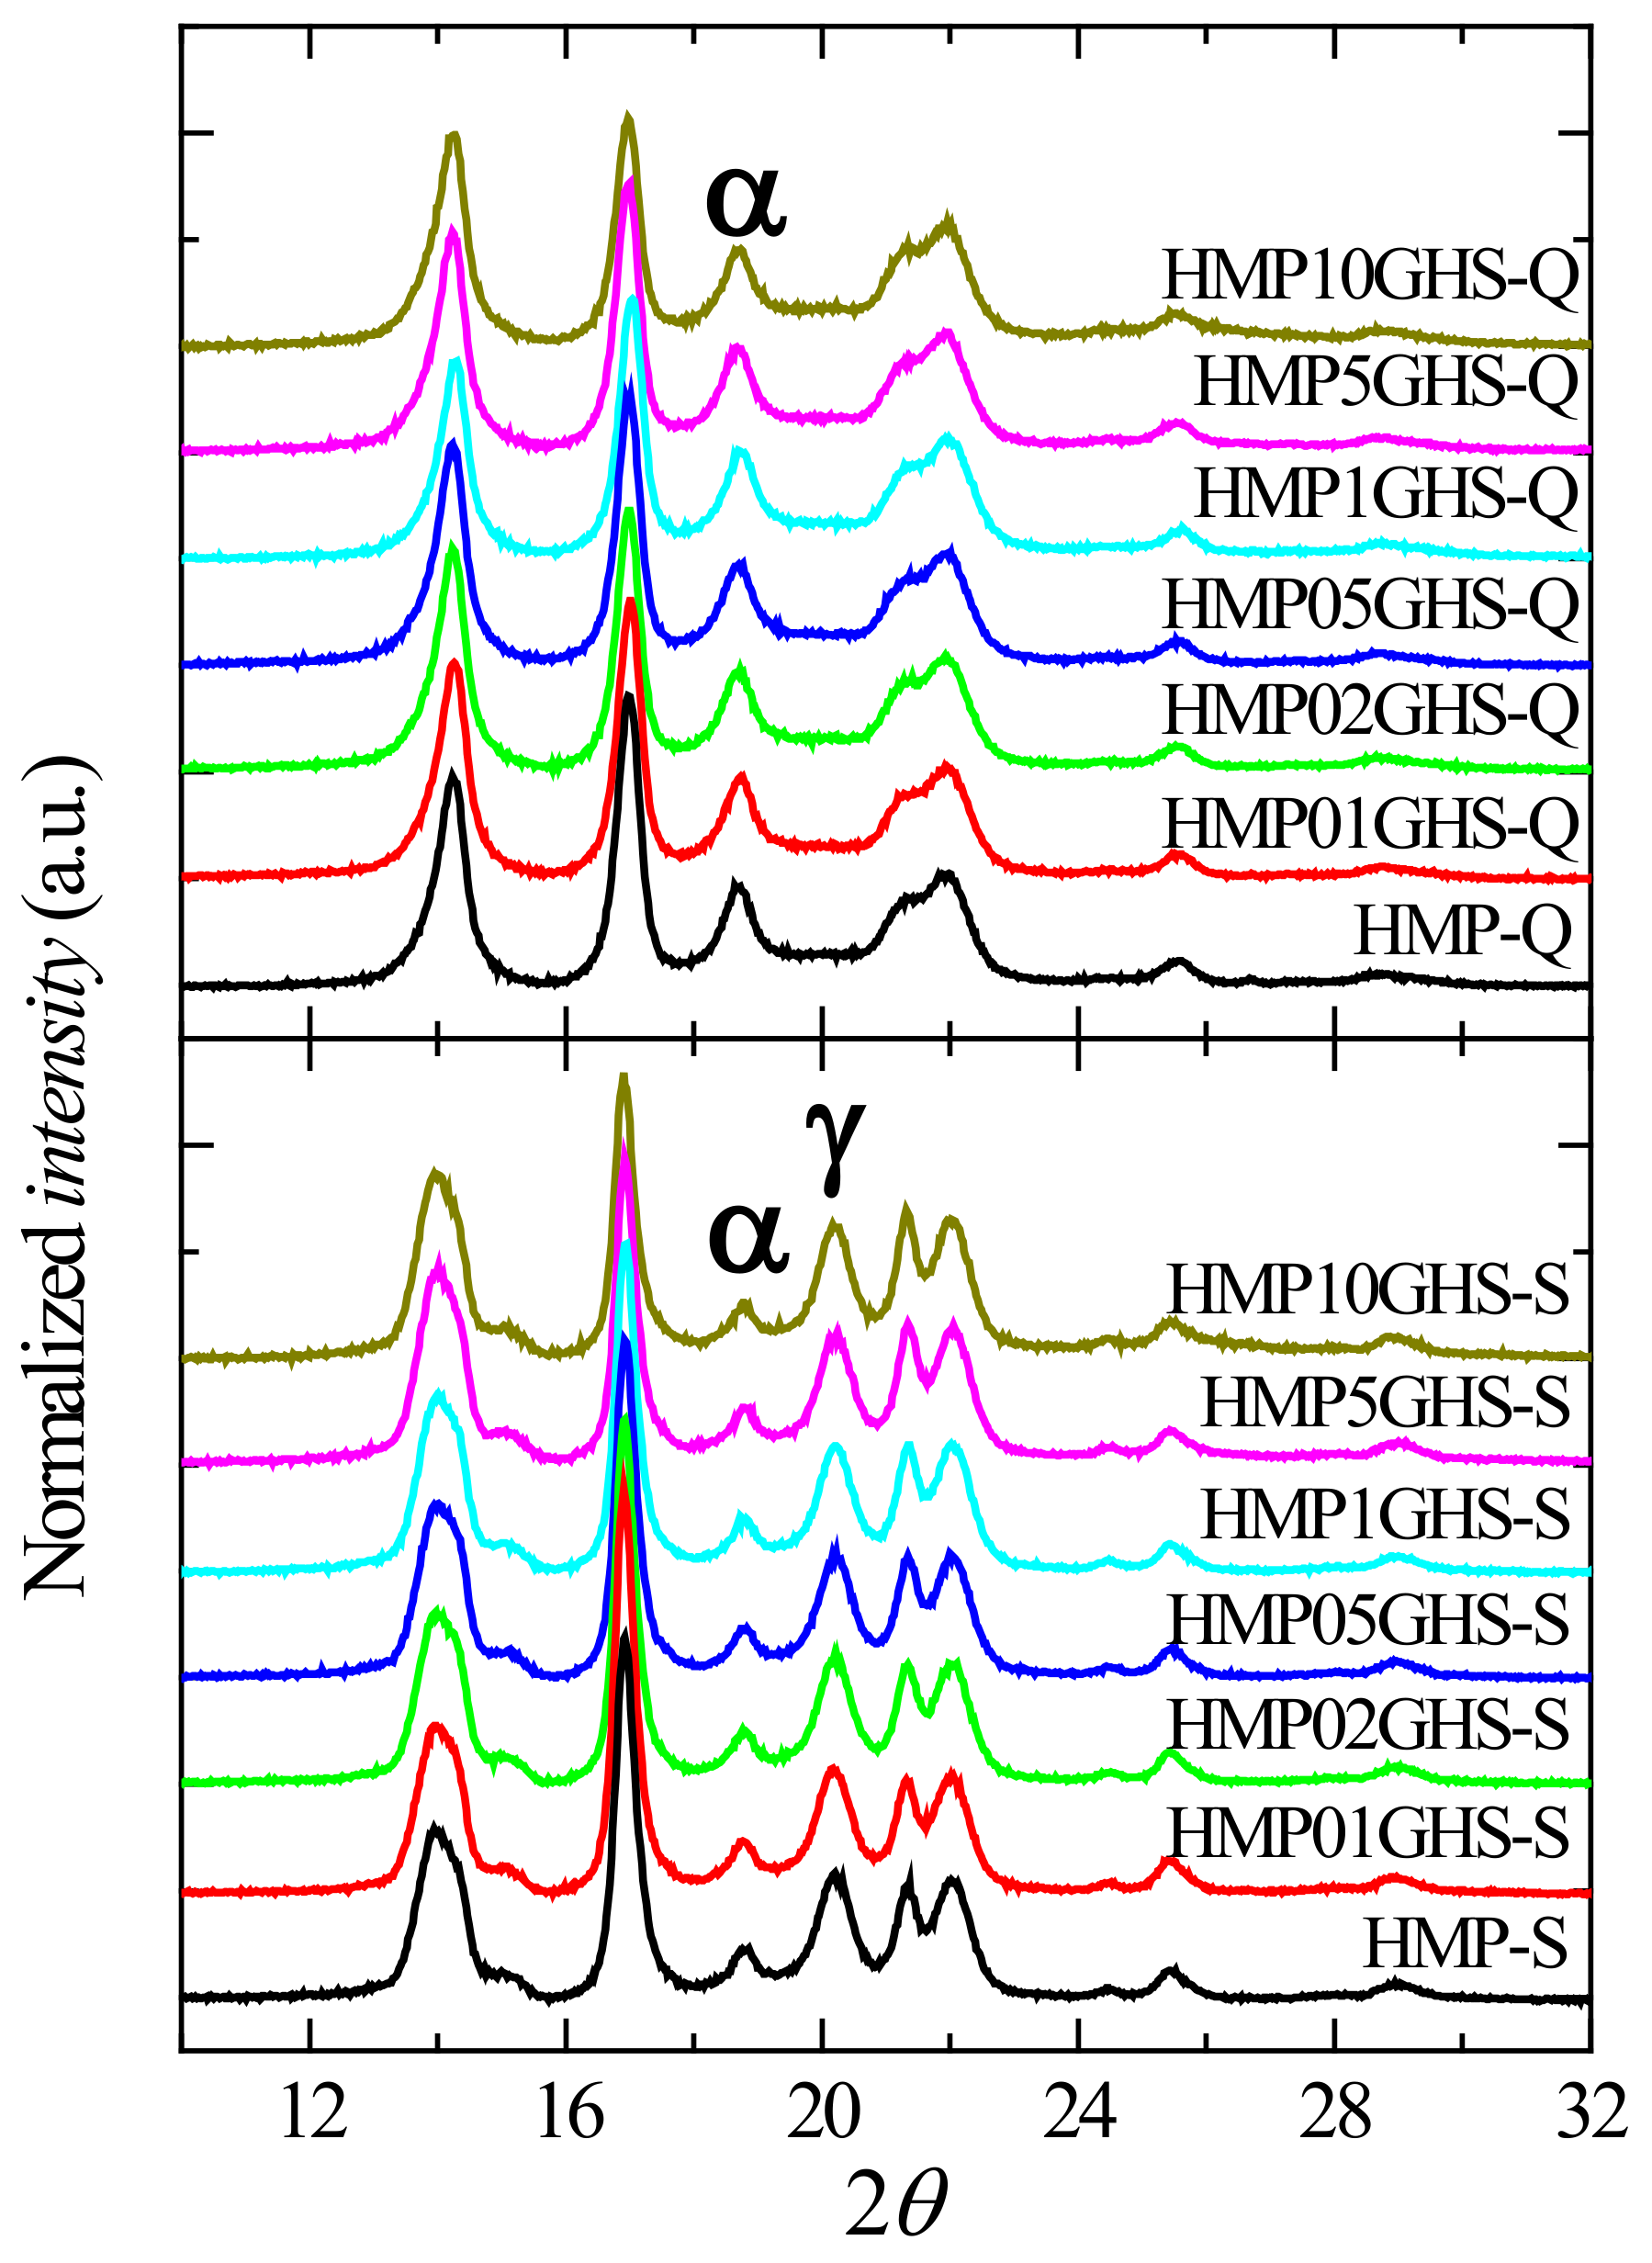
| Sample | fcXRD (%) | Polymorphs Content in the S Specimens | ||
|---|---|---|---|---|
| Q | S | α (%) | γ (%) | |
| HMP | 58 | 62 | 15 | 47 |
| HMP01GHS | 59 | 63 | 13 | 50 |
| HMP02GHS | 60 | 64 | 13 | 51 |
| HMP05GHS | 61 | 65 | 14 | 51 |
| HMP1GHS | 61 | 65 | 13 | 52 |
| HMP5GHS | 62 | 66 | 11 | 55 |
| HMP10GHS | 62 | 67 | 11 | 56 |
| HMP01GLS | 59 | 64 | 14 | 50 |
| HMP02GLS | 59 | 66 | 12 | 54 |
| HMP05GLS | 60 | 66 | 11 | 55 |
| HMP1GLS | 61 | 67 | 11 | 56 |
| HMP5GLS | 61 | 68 | 14 | 54 |
| HMP10GLS | 62 | 69 | 13 | 56 |
| Sample | Tg (°C) | Tm (°C) | fcDSC (%) | Tc (°C) | ||||
|---|---|---|---|---|---|---|---|---|
| Q | S | αQ | γS | αS | Q | S | ||
| HMP | −8 | −6 | 146.0 | 142.0 | 150.5 | 58 | 64 | 112.0 |
| HMP01GHS | −8 | −5 | 146.5 | 141.5 | 150.5 | 59 | 65 | 112.5 |
| HMP02GHS | −6 | −5 | 146.5 | 142.0 | 150.5 | 59 | 65 | 113.0 |
| HMP05GHS | −5 | −5 | 147.0 | 142.0 | 150.0 | 59 | 65 | 113.5 |
| HMP1GHS | −3 | −4 | 147.0 | 142.5 | 150.5 | 59 | 65 | 113.5 |
| HMP5GHS | −3 | −3 | 145.5 | 142.5 | 151.0 | 60 | 67 | 113.5 |
| HMP10GHS | −1 | −2 | 145.0 | 142.5 | 150.0 | 60 | 68 | 115.0 |
| HMP01GLS | −4 | −3 | 147.0 | 142.0 | 150.0 | 59 | 65 | 113.0 |
| HMP02GLS | −3 | −2 | 146.0 | 142.0 | 150.5 | 60 | 66 | 114.0 |
| HMP05GLS | −3 | −1 | 147.0 | 141.0 | 150.0 | 60 | 66 | 114.0 |
| HMP1GLS | −1 | −1 | 147.0 | 141.0 | 150.0 | 60 | 67 | 114.0 |
| HMP5GLS | 0 | 1 | 145.5 | 141.5 | 150.0 | 61 | 68 | 114.5 |
| HMP10GLS | - | - | 145.5 | 141.0 | 150.5 | 62 | 69 | 114.5 |
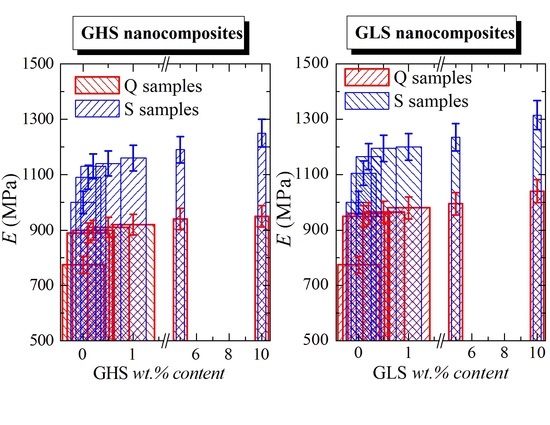
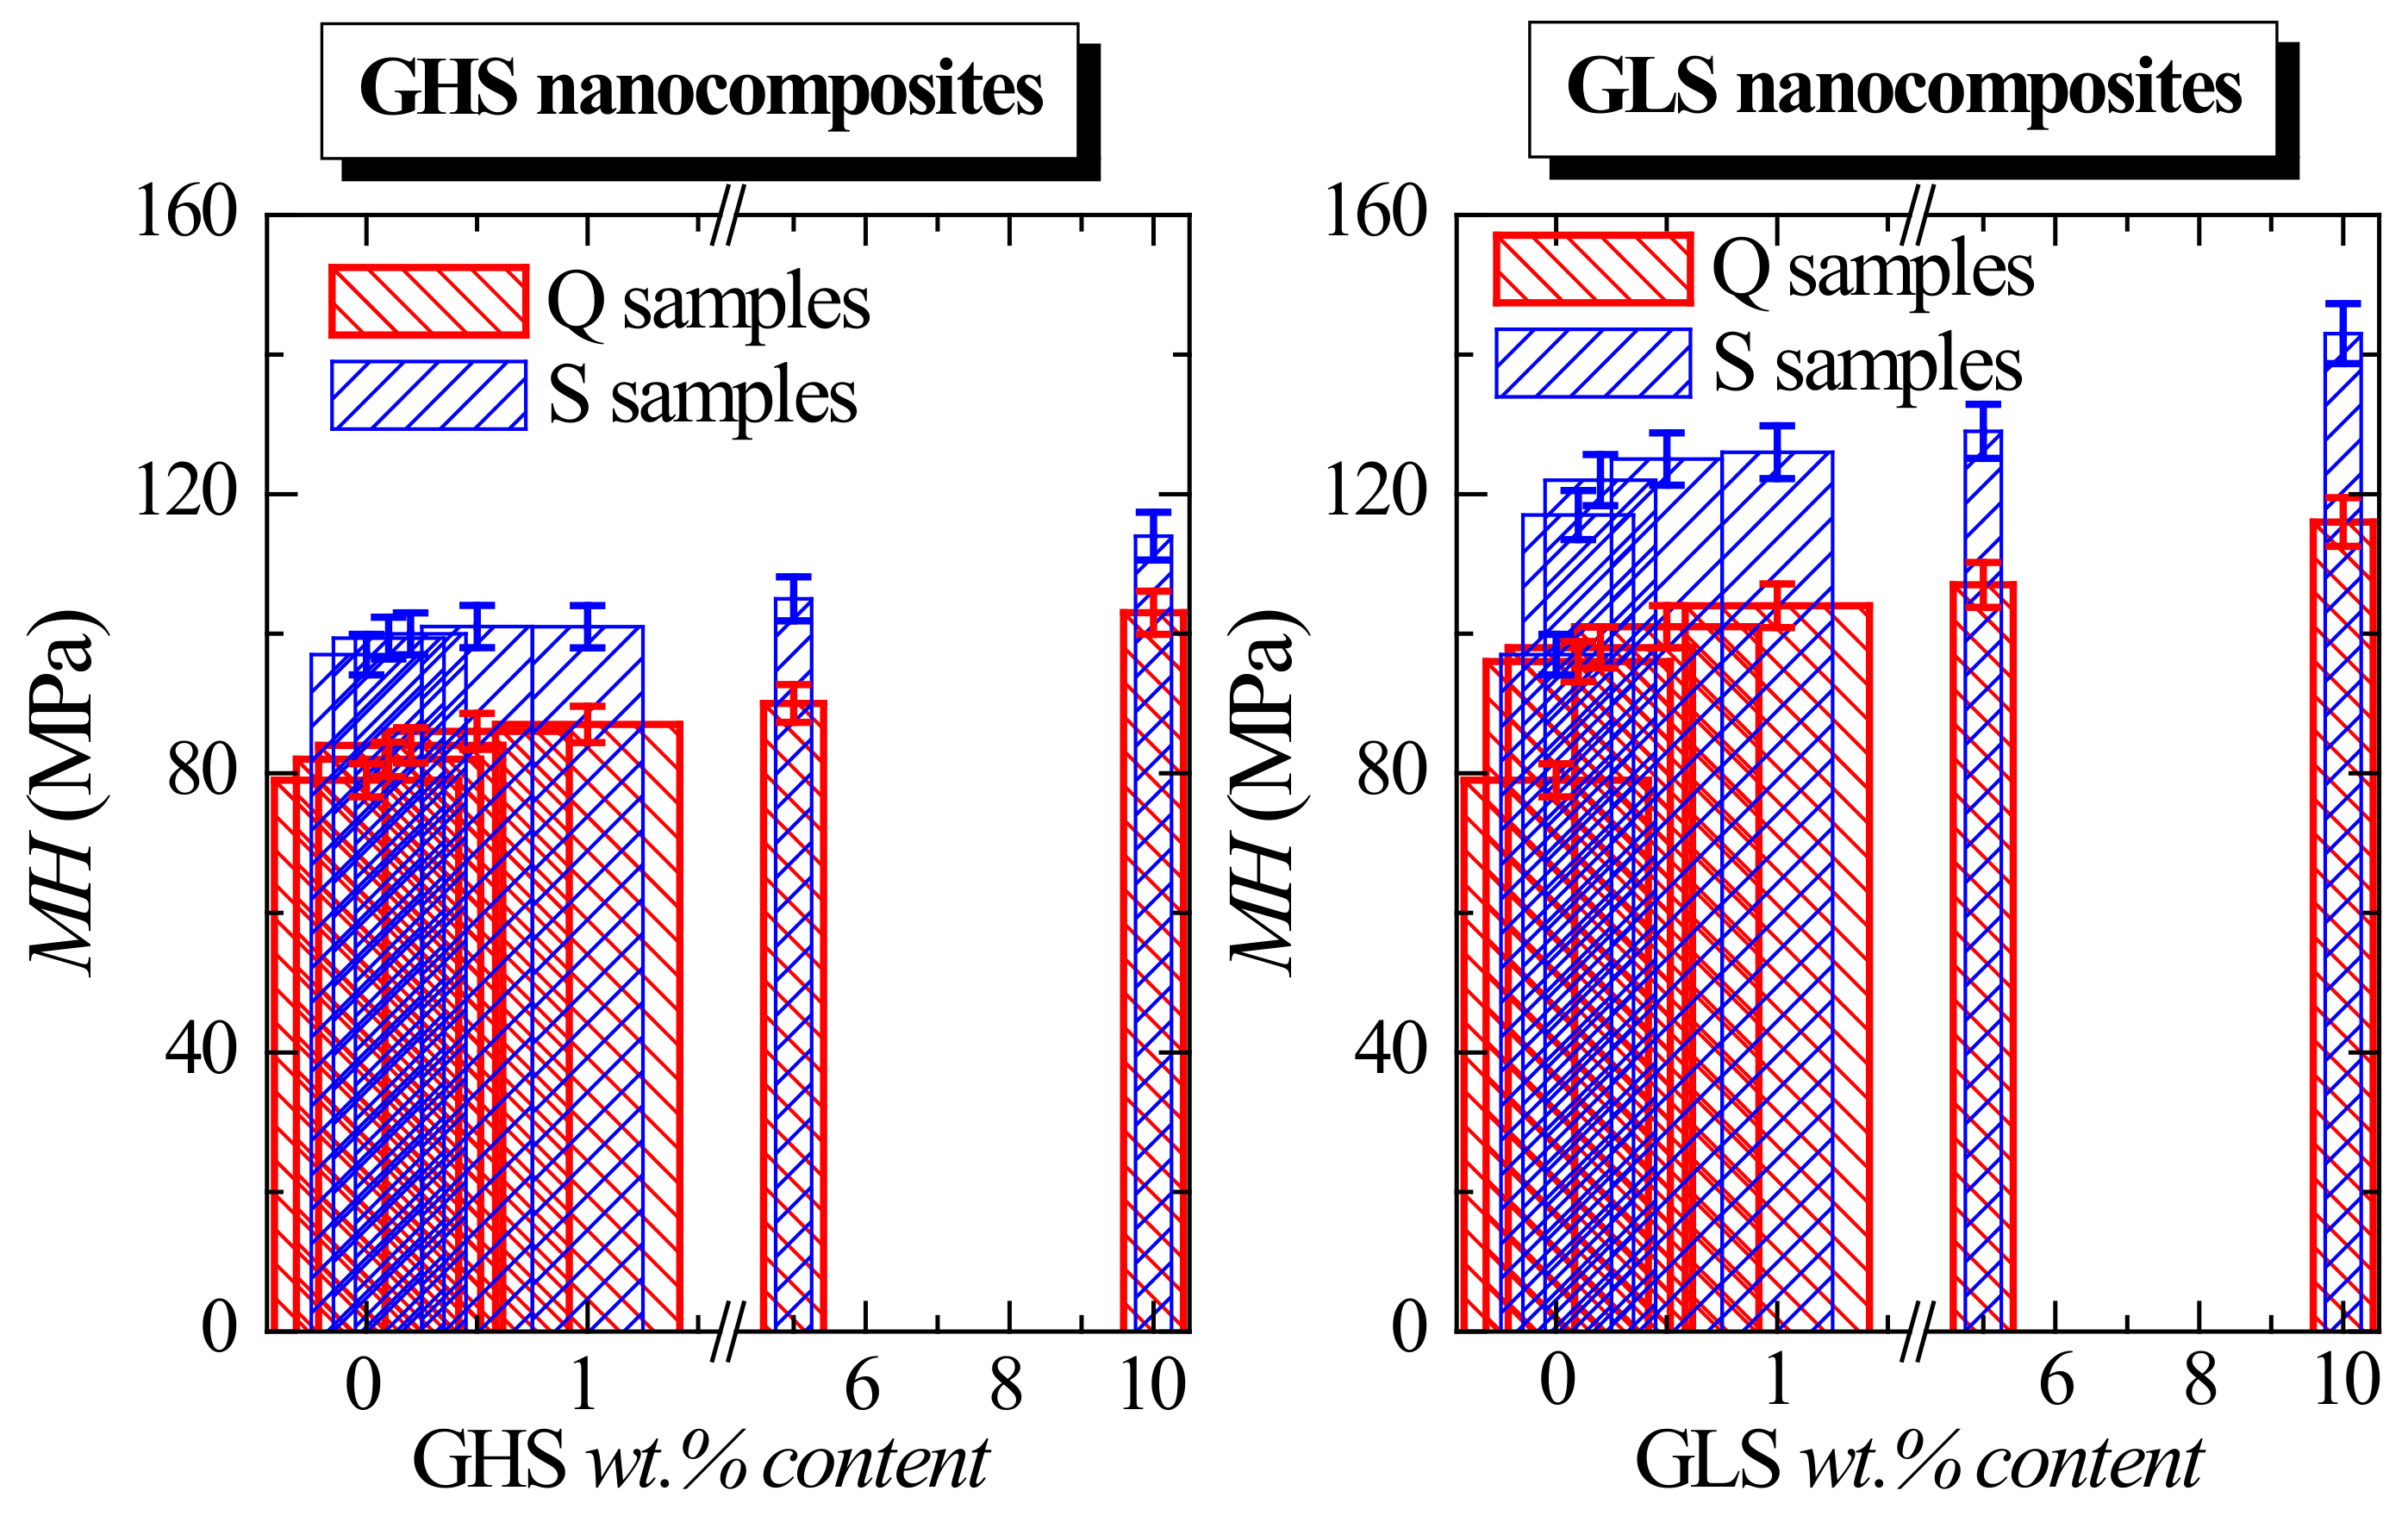
| Sample | E (MPa) | σY (MPa) | εY (%) | σB (MPa) | εB (%) |
|---|---|---|---|---|---|
| Thermal treatment Q | |||||
| HMP-Q | 775 ± 30 | 30.0 ± 1.5 | 10.0 ± 0.5 | 31.0 ± 4.5 | 670 ± 50 |
| HMP01GHS-Q | 890 ±20 | 30.5 ± 1.5 | 6.5 ± 0.5 | 28.0 ± 2.5 | 560 ± 50 |
| HMP02GHS-Q | 900 ± 25 | 31.0 ± 2.0 | 7.5 ± 0.5 | 28.5 ± 3.0 | 565 ± 50 |
| HMP05GHS-Q | 910 ± 40 | 31.5 ± 1.5 | 7.0 ± 2.0 | 25.0 ± 7.0 | 530 ± 50 |
| HMP1GHS-Q | 920 ± 29 | 32.0 ± 1.5 | 7.0 ± 0.5 | 29.0 ± 2.0 | 8 ± 1 |
| HMP5GHS-Q | 940 ± 23 | 33.0 ± 0.5 | 6.5 ± 0.1 | 31.0 ± 0.5 | 9 ± 1 |
| HMP10GHS-Q | 950 ± 10 | a | a | 16.0 ± 1.5 | 5 ± 1 |
| HMP01GLS-Q | 950 ± 15 | 31.0 ± 1.0 | 8.0 ± 0.5 | 30.0 ± 1.0 | 640 ± 30 |
| HMP02GLS-Q | 960 ± 15 | 31.5 ± 1.0 | 7.5 ± 0.5 | 34.0 ± 2.0 | 715 ± 30 |
| HMP05GLS-Q | 965 ± 10 | 32.0 ± 1.0 | 7.0 ± 1.0 | 34.0 ± 2.0 | 715 ± 40 |
| HMP1GLS-Q | 980 ± 10 | 32.5 ± 2.0 | 7.0 ± 1.0 | 25.5 ± 3.0 | 610 ± 30 |
| HMP5GLS-Q | 995 ± 10 | 33.0 ± 2.5 | 6.5 ± 0.5 | 23.0 ± 1.5 | 495 ± 25 |
| HMP10GLS-Q | 1040 ± 20 | a | a | 29.0 ± 1.5 | 9 ± 3 |
| Thermal treatment S | |||||
| HMP-S | 1000 ± 70 | 32.3 ± 2.7 | 8.6 ± 1.0 | 26.5 ± 1.8 | 130 ± 40 |
| HMP01GHS-S | 1090 ± 30 | 35.4 ± 0.8 | 8.2 ± 0.1 | 26.6 ± 0.6 | 30 ± 2 |
| HMP02GHS-S | 1130 ± 20 | 35.2 ± 0.3 | 7.6 ± 0.2 | 28.7 ± 1.1 | 25 ± 3 |
| HMP05GHS-S | 1140 ± 40 | 34.3 ± 0.7 | 7.5 ± 1.1 | 28.9 ± 0.3 | 25 ± 5 |
| HMP1GHS-S | 1160 ± 20 | 35.2 ± 0.1 | 6.2 ± 0.2 | 32.8 ± 0.1 | 20 ± 1 |
| HMP5GHS-S | 1190 ± 30 | 33.8 ± 0.4 | 6.3 ± 0.1 | 31.3 ±1.3 | 18 ± 2 |
| HMP10GHS-S | 1250 ± 20 | a | a | 32.7 ± 0.7 | 10 ± 1 |
| HMP01GLS-S | 1105 ± 17 | 32.6 ± 3.6 | 9.2 ± 0.3 | 27.6 ± 1.3 | 355 ± 60 |
| HMP02GLS-S | 1165 ± 33 | 35.3 ± 0.2 | 8.5 ± 0.7 | 31.2 ± 2.6 | 325 ± 100 |
| HMP05GLS-S | 1195 ± 10 | 35.4 ± 0.3 | 7.2 ± 0.4 | 27.5 ± 1.5 | 250 ± 20 |
| HMP1GLS-S | 1200 ± 20 | 34.7 ± 0.2 | 7.3 ± 0.4 | 26.3 ± 0.7 | 50 ± 10 |
| HMP5GLS-S | 1235 ± 20 | 34.3 ± 0.6 | 6.7 ± 0.4 | 28.5 ± 0.6 | 25 ± 6 |
| HMP10GLS-S | 1315 ± 10 | a | a | 30.9 ± 1.3 | 10 ± 1 |
Publisher’s Note: MDPI stays neutral with regard to jurisdictional claims in published maps and institutional affiliations. |
© 2022 by the authors. Licensee MDPI, Basel, Switzerland. This article is an open access article distributed under the terms and conditions of the Creative Commons Attribution (CC BY) license (https://creativecommons.org/licenses/by/4.0/).
Share and Cite
Novo, S.; Fonseca, C.; Benavente, R.; Blázquez-Blázquez, E.; Cerrada, M.L.; Pérez, E. Effect of Graphene Nanofibers on the Morphological, Structural, Thermal, Phase Transitions and Mechanical Characteristics in Metallocene iPP Based Nanocomposites. J. Compos. Sci. 2022, 6, 161. https://doi.org/10.3390/jcs6060161
Novo S, Fonseca C, Benavente R, Blázquez-Blázquez E, Cerrada ML, Pérez E. Effect of Graphene Nanofibers on the Morphological, Structural, Thermal, Phase Transitions and Mechanical Characteristics in Metallocene iPP Based Nanocomposites. Journal of Composites Science. 2022; 6(6):161. https://doi.org/10.3390/jcs6060161
Chicago/Turabian StyleNovo, Sandra, Carmen Fonseca, Rosario Benavente, Enrique Blázquez-Blázquez, María L. Cerrada, and Ernesto Pérez. 2022. "Effect of Graphene Nanofibers on the Morphological, Structural, Thermal, Phase Transitions and Mechanical Characteristics in Metallocene iPP Based Nanocomposites" Journal of Composites Science 6, no. 6: 161. https://doi.org/10.3390/jcs6060161
APA StyleNovo, S., Fonseca, C., Benavente, R., Blázquez-Blázquez, E., Cerrada, M. L., & Pérez, E. (2022). Effect of Graphene Nanofibers on the Morphological, Structural, Thermal, Phase Transitions and Mechanical Characteristics in Metallocene iPP Based Nanocomposites. Journal of Composites Science, 6(6), 161. https://doi.org/10.3390/jcs6060161