
Improving the Alignment of Dynamic Sheet-Formed Mats by Changing Nozzle Geometry and Their Reinforcement of Polypropylene Matrix Composites


Abstract
:1. Introduction
2. Materials and Methods
2.1. Materials
2.2. Method
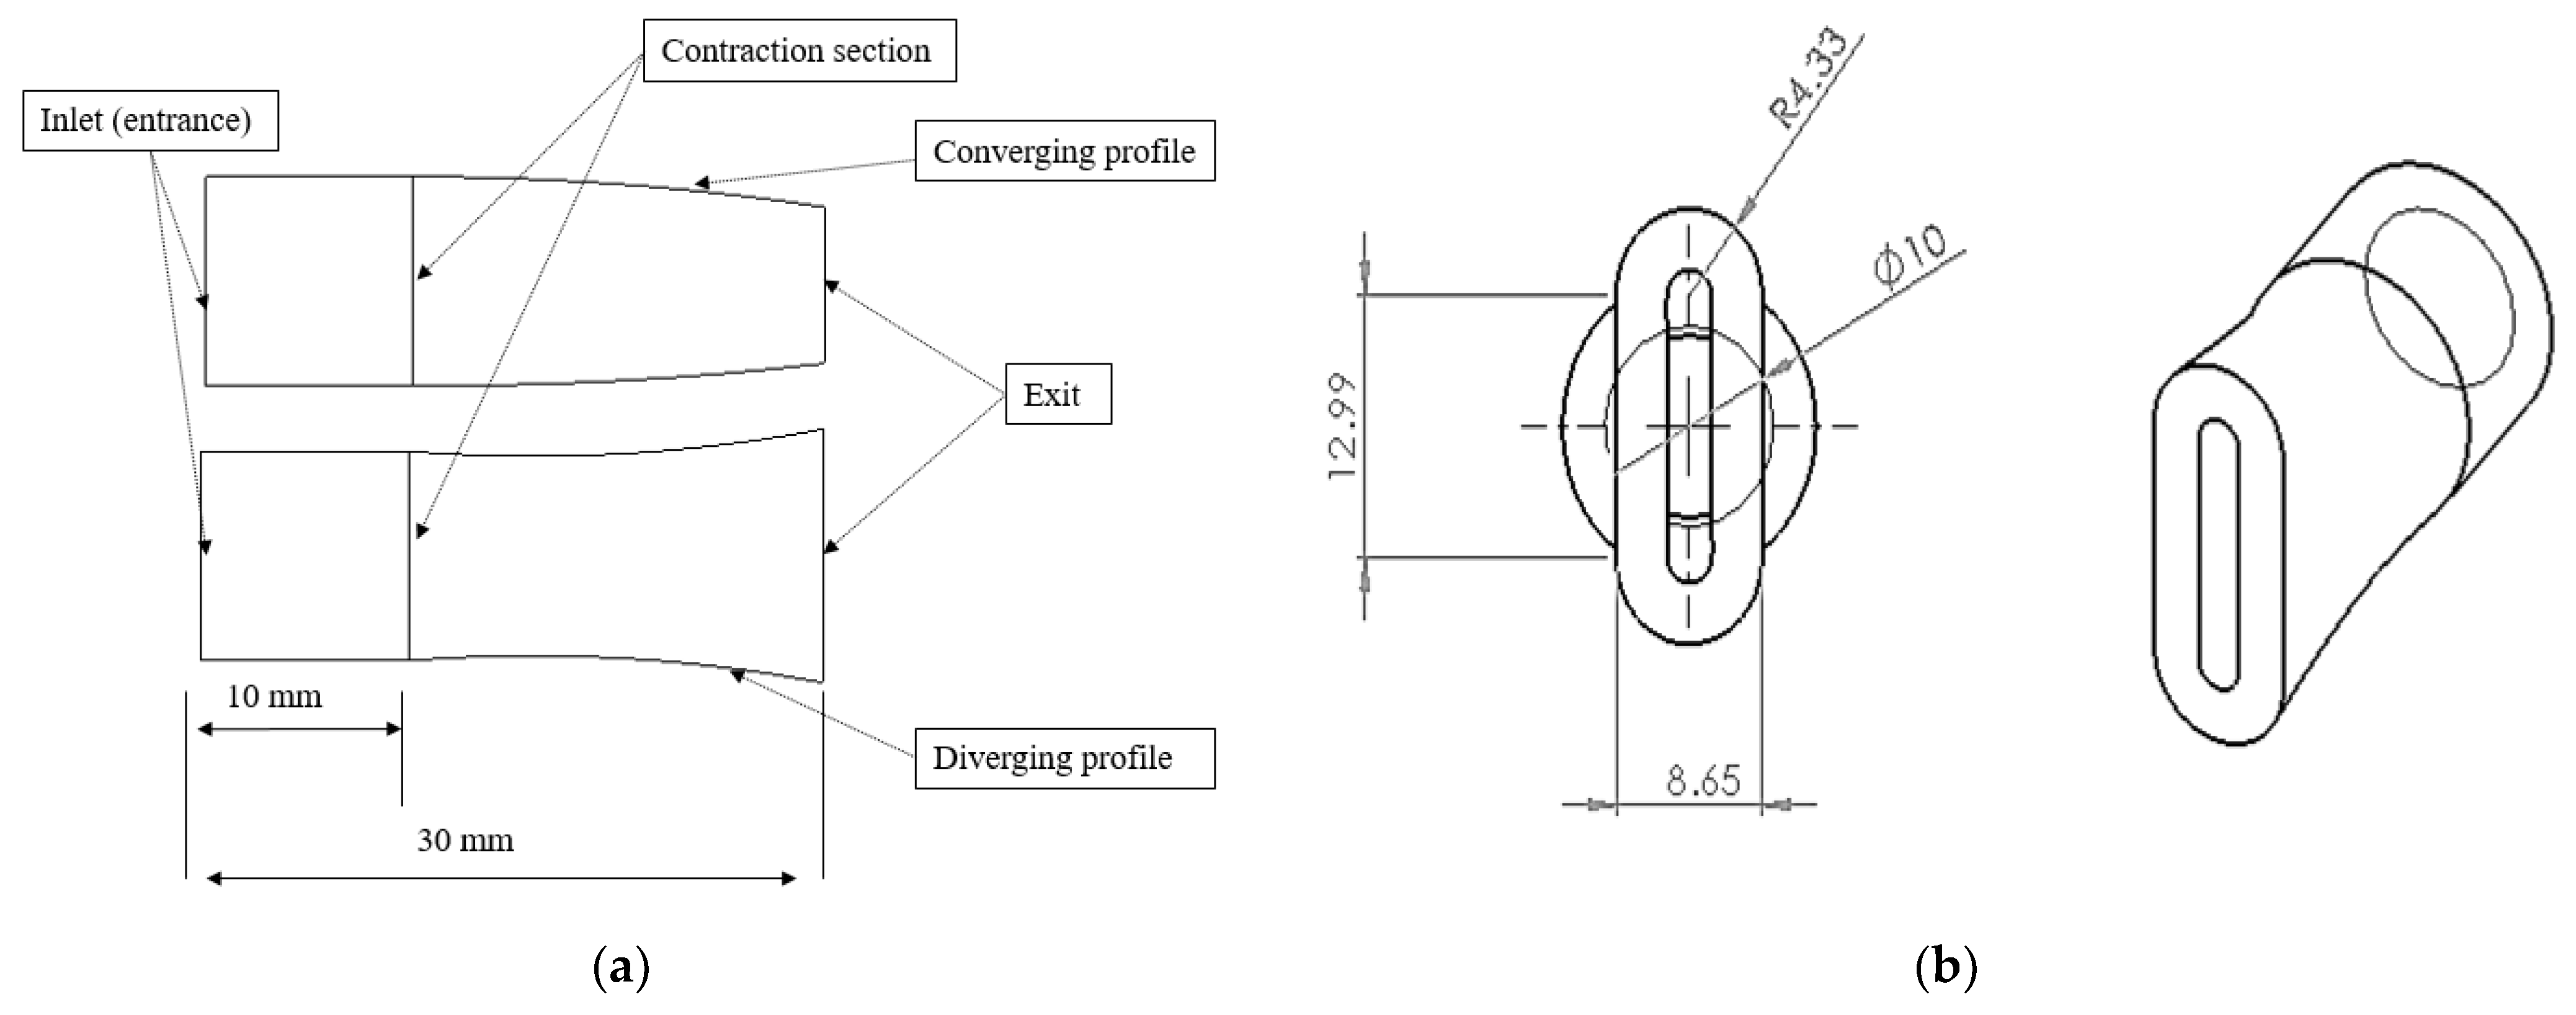
2.2.1. Nozzle Design Details and Manufacturing
2.2.2. Production of Aligned Hemp Fibre Mats and Control Samples
2.2.3. Assessment of Orientation
2.2.4. Production of PP/MAPP Sheets, Composites, and Tensile Testing of Composites
3. Results and Discussion
3.1. Production of Fibre Mats Using Different Nozzles
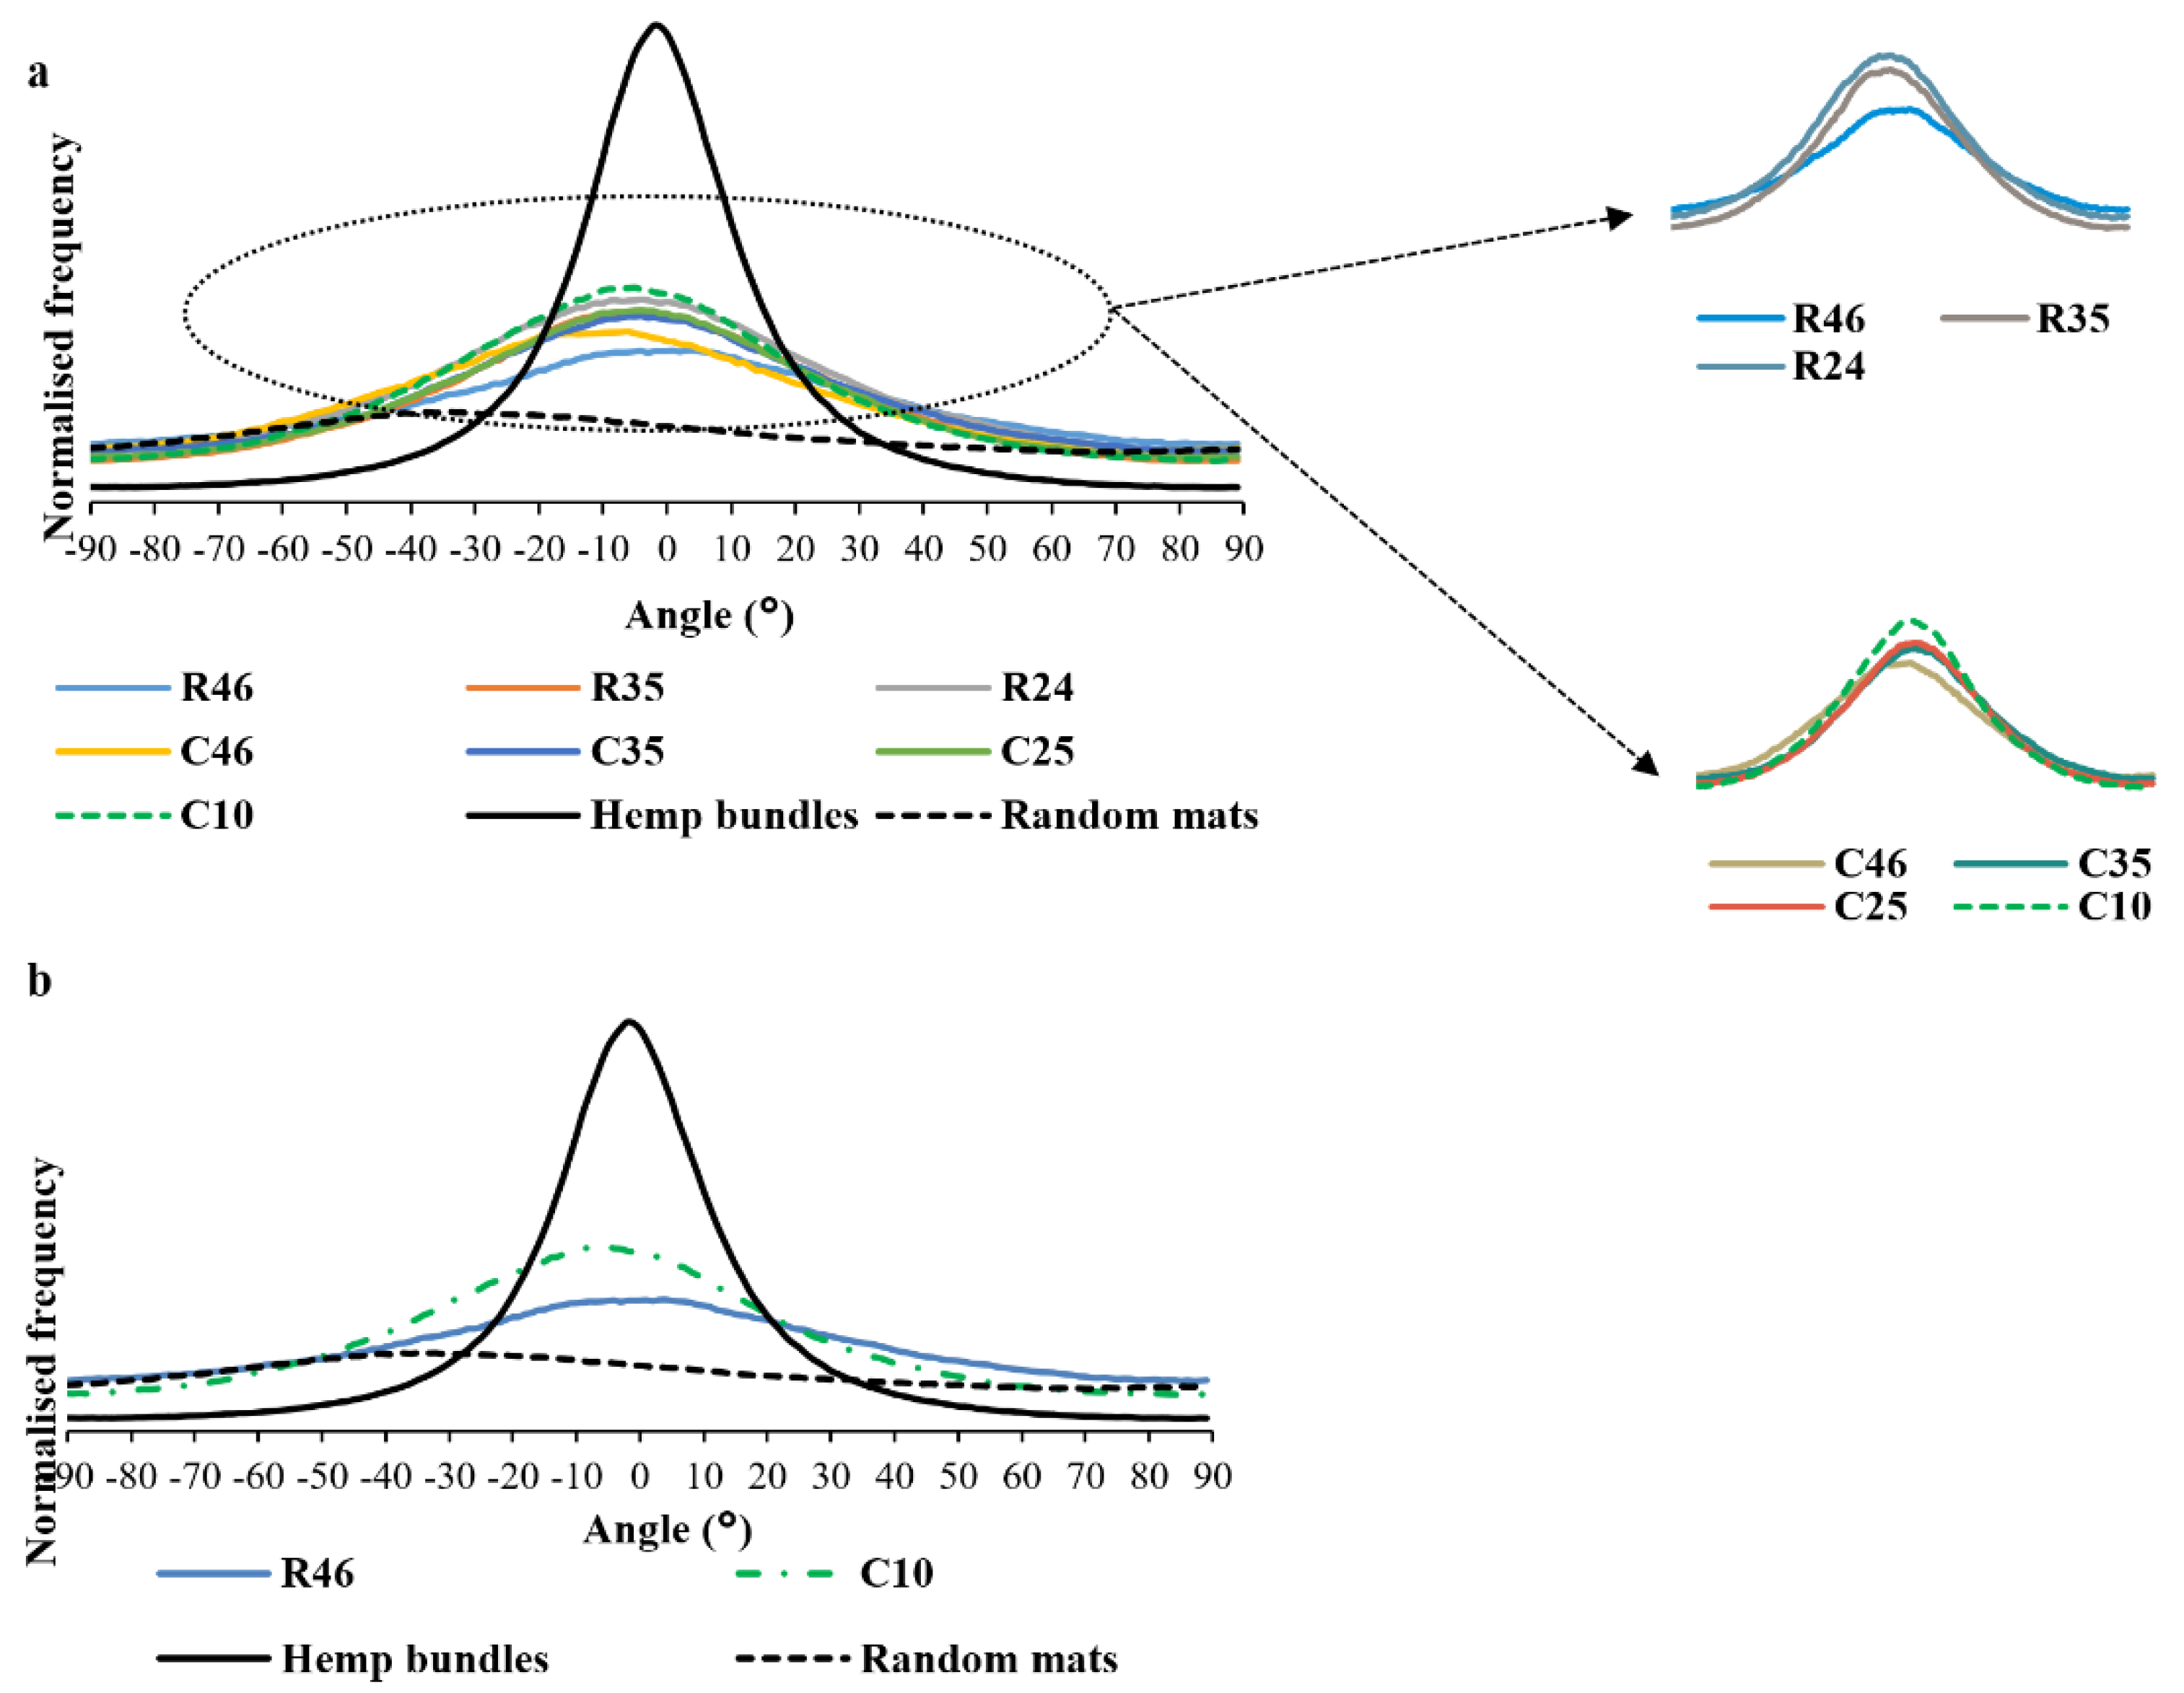
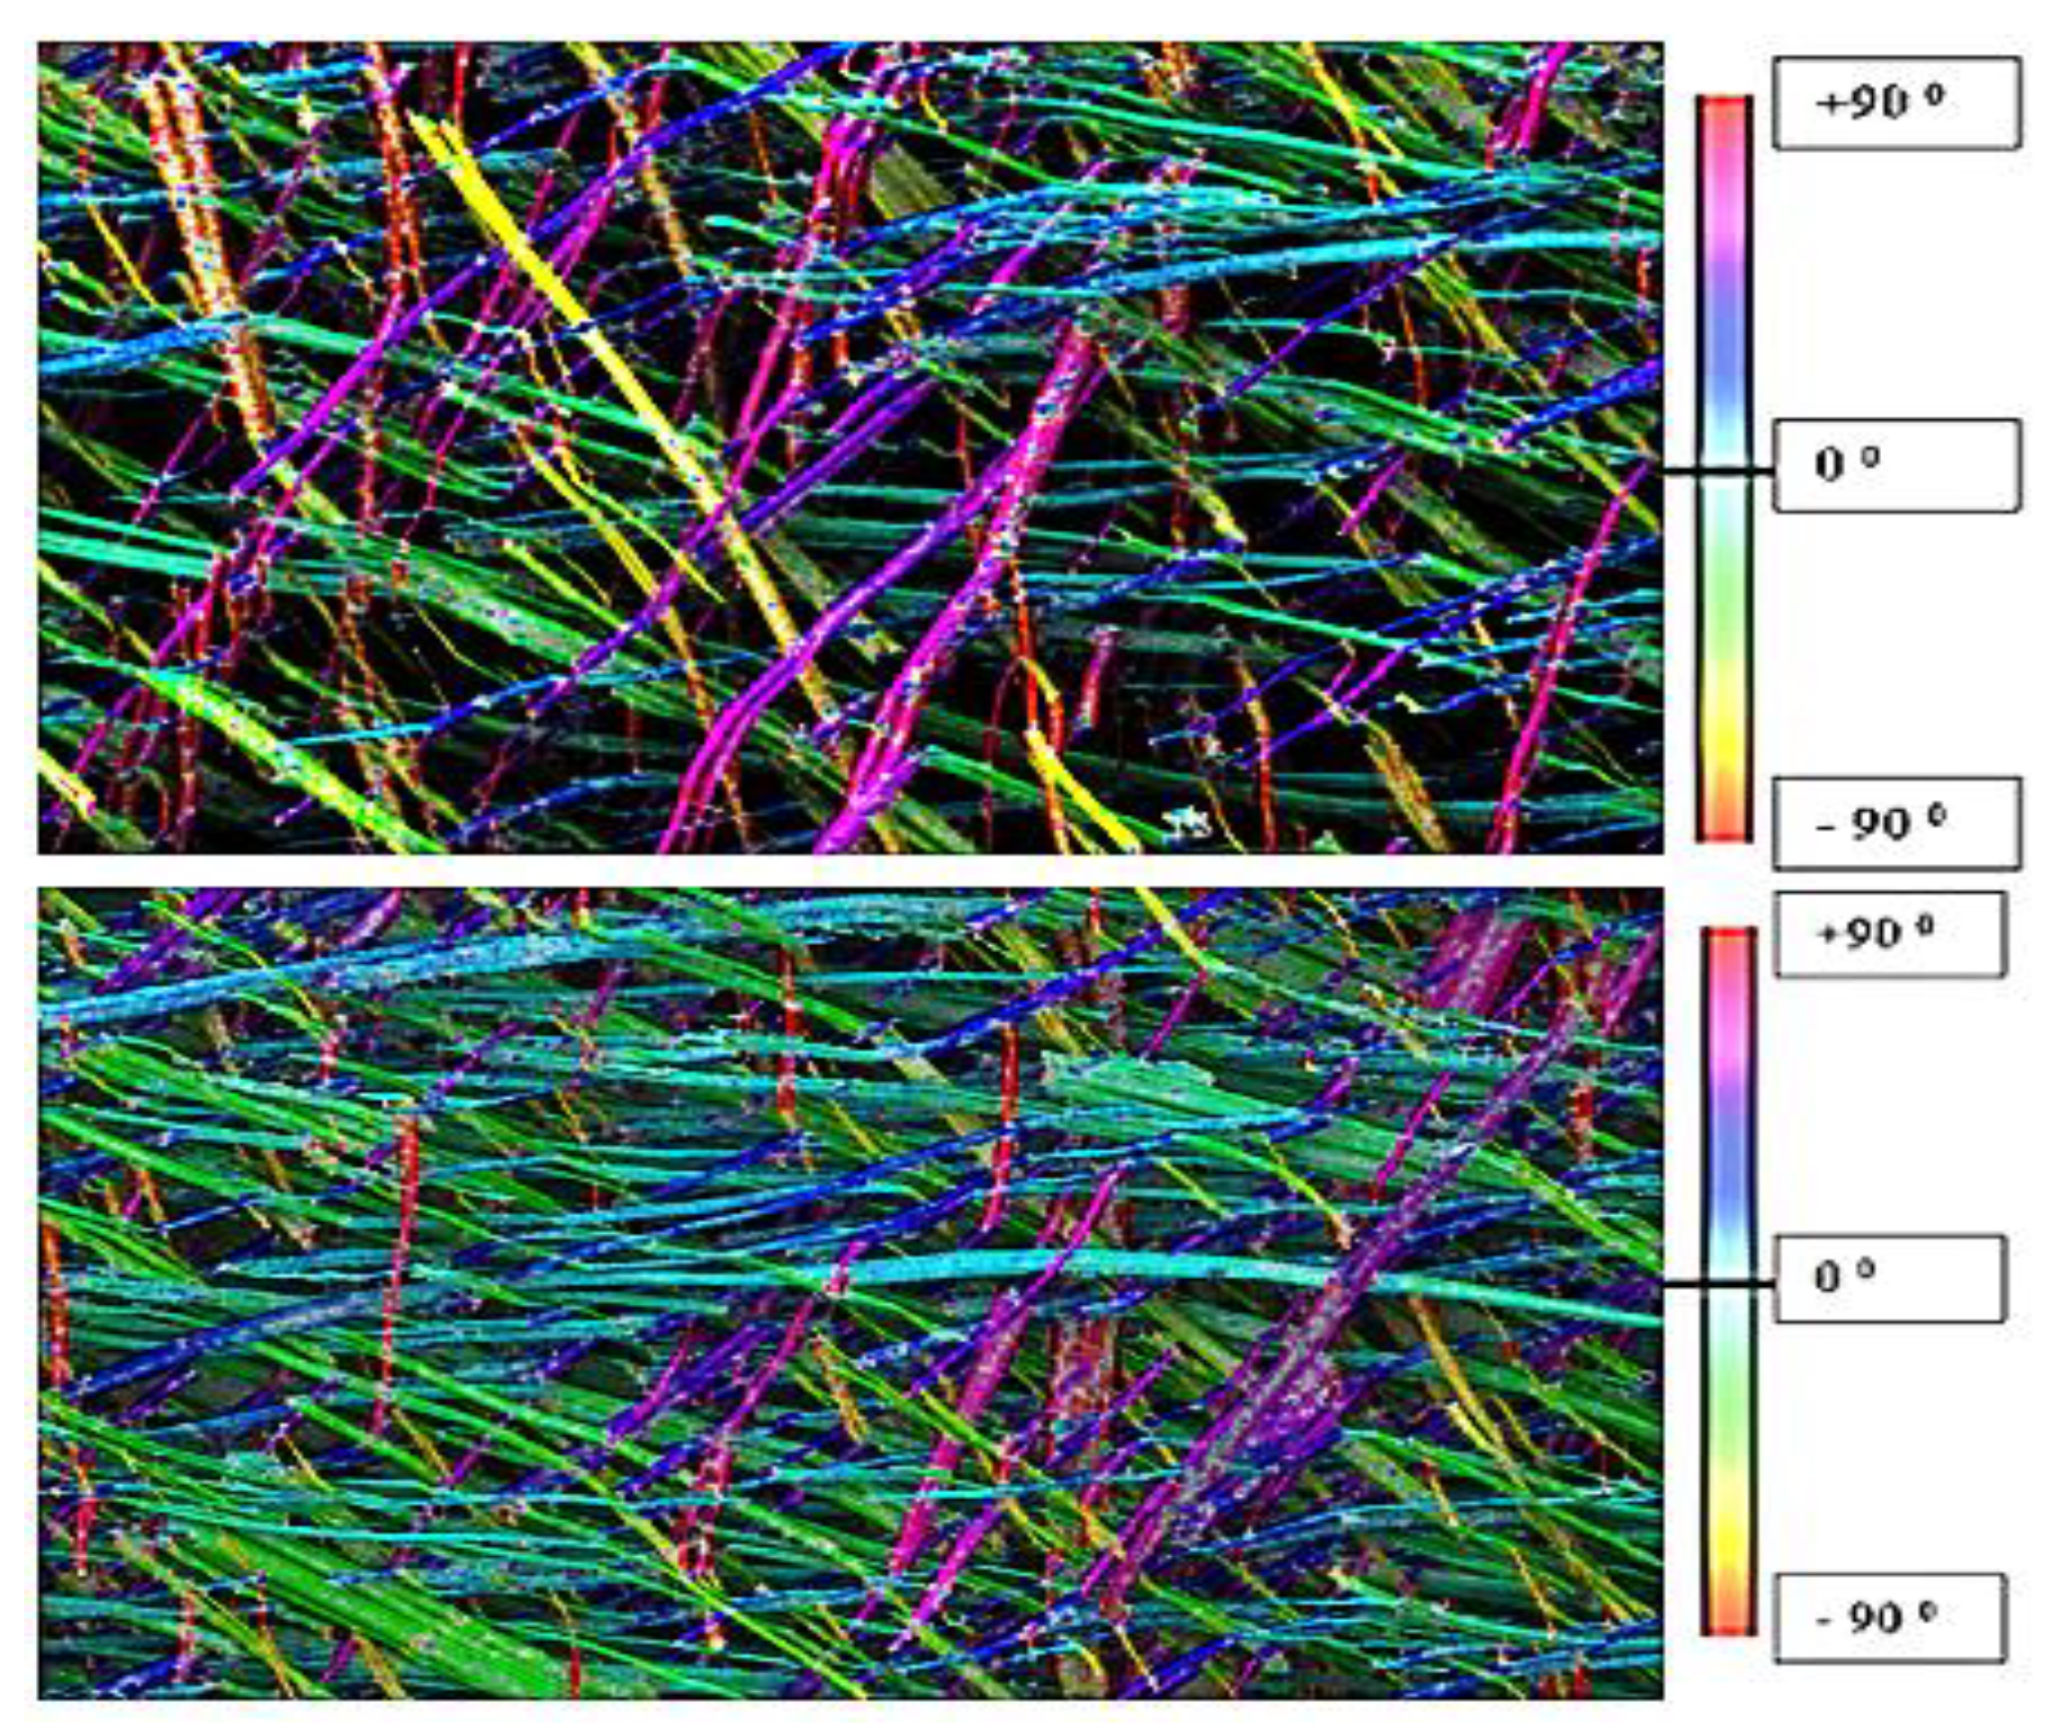
3.2. Orientation Assessment of Fibre Mats Using ImageJ
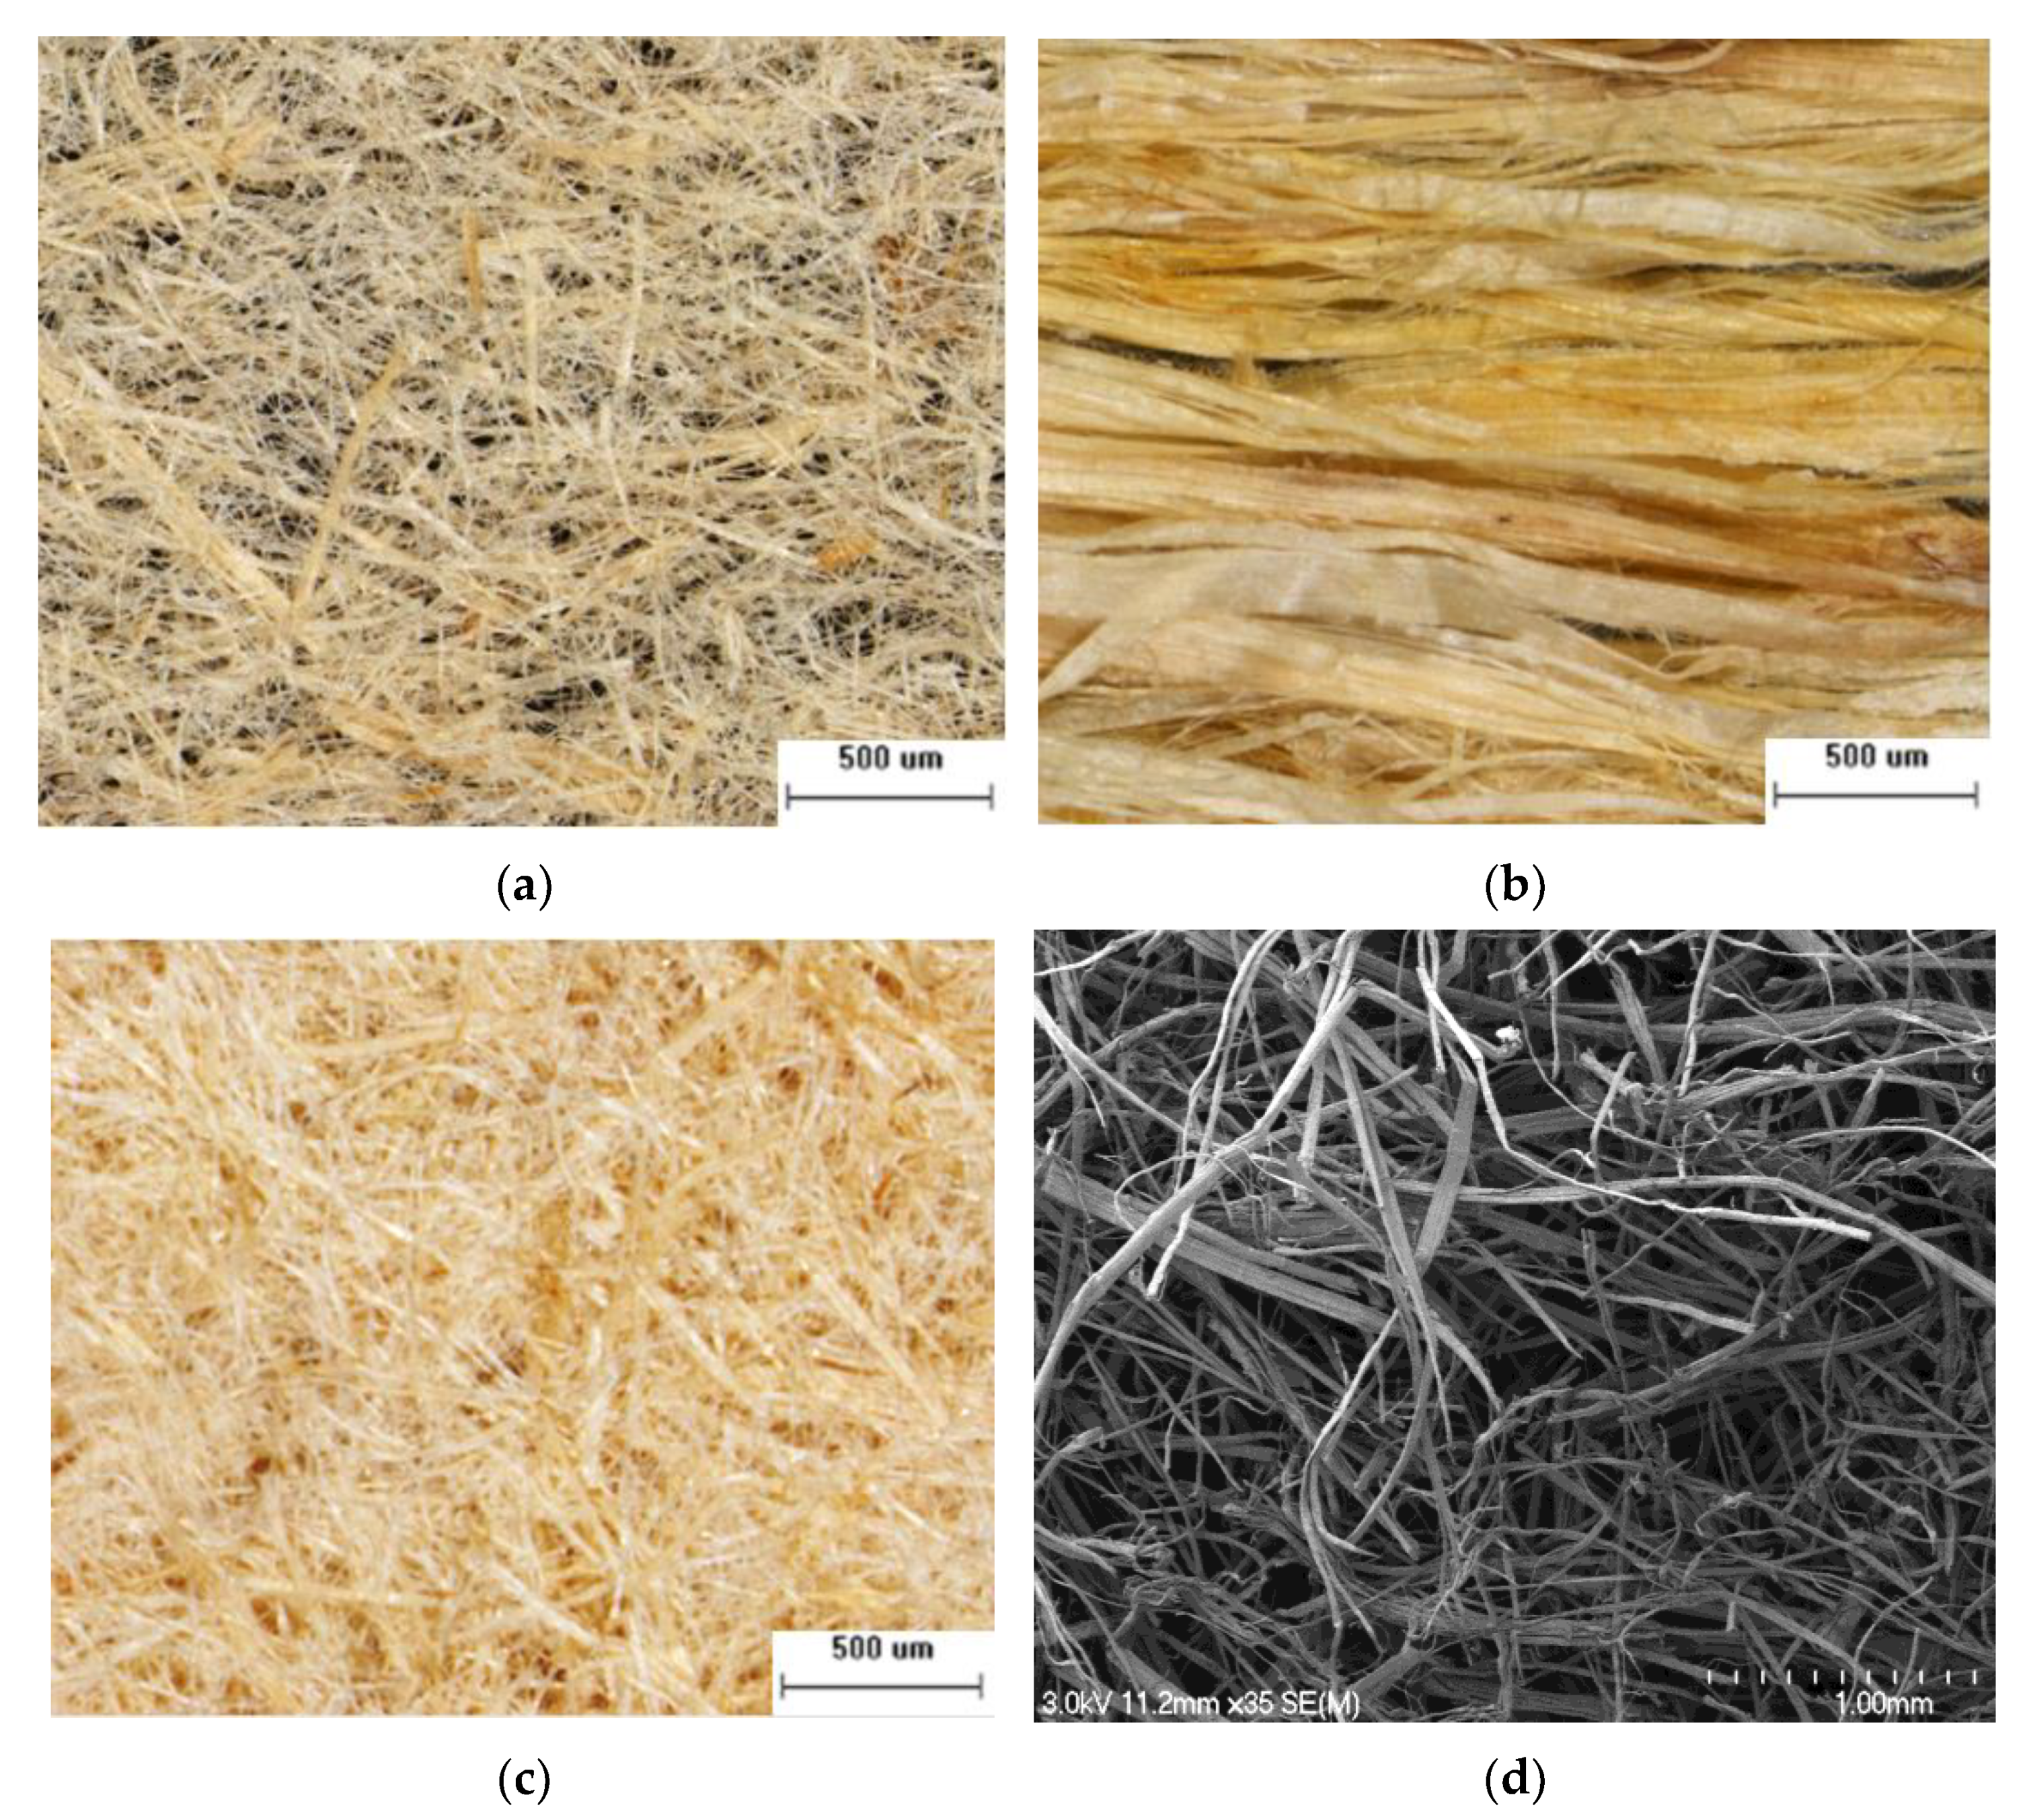
3.2.1. Using Optical Microscopic Images
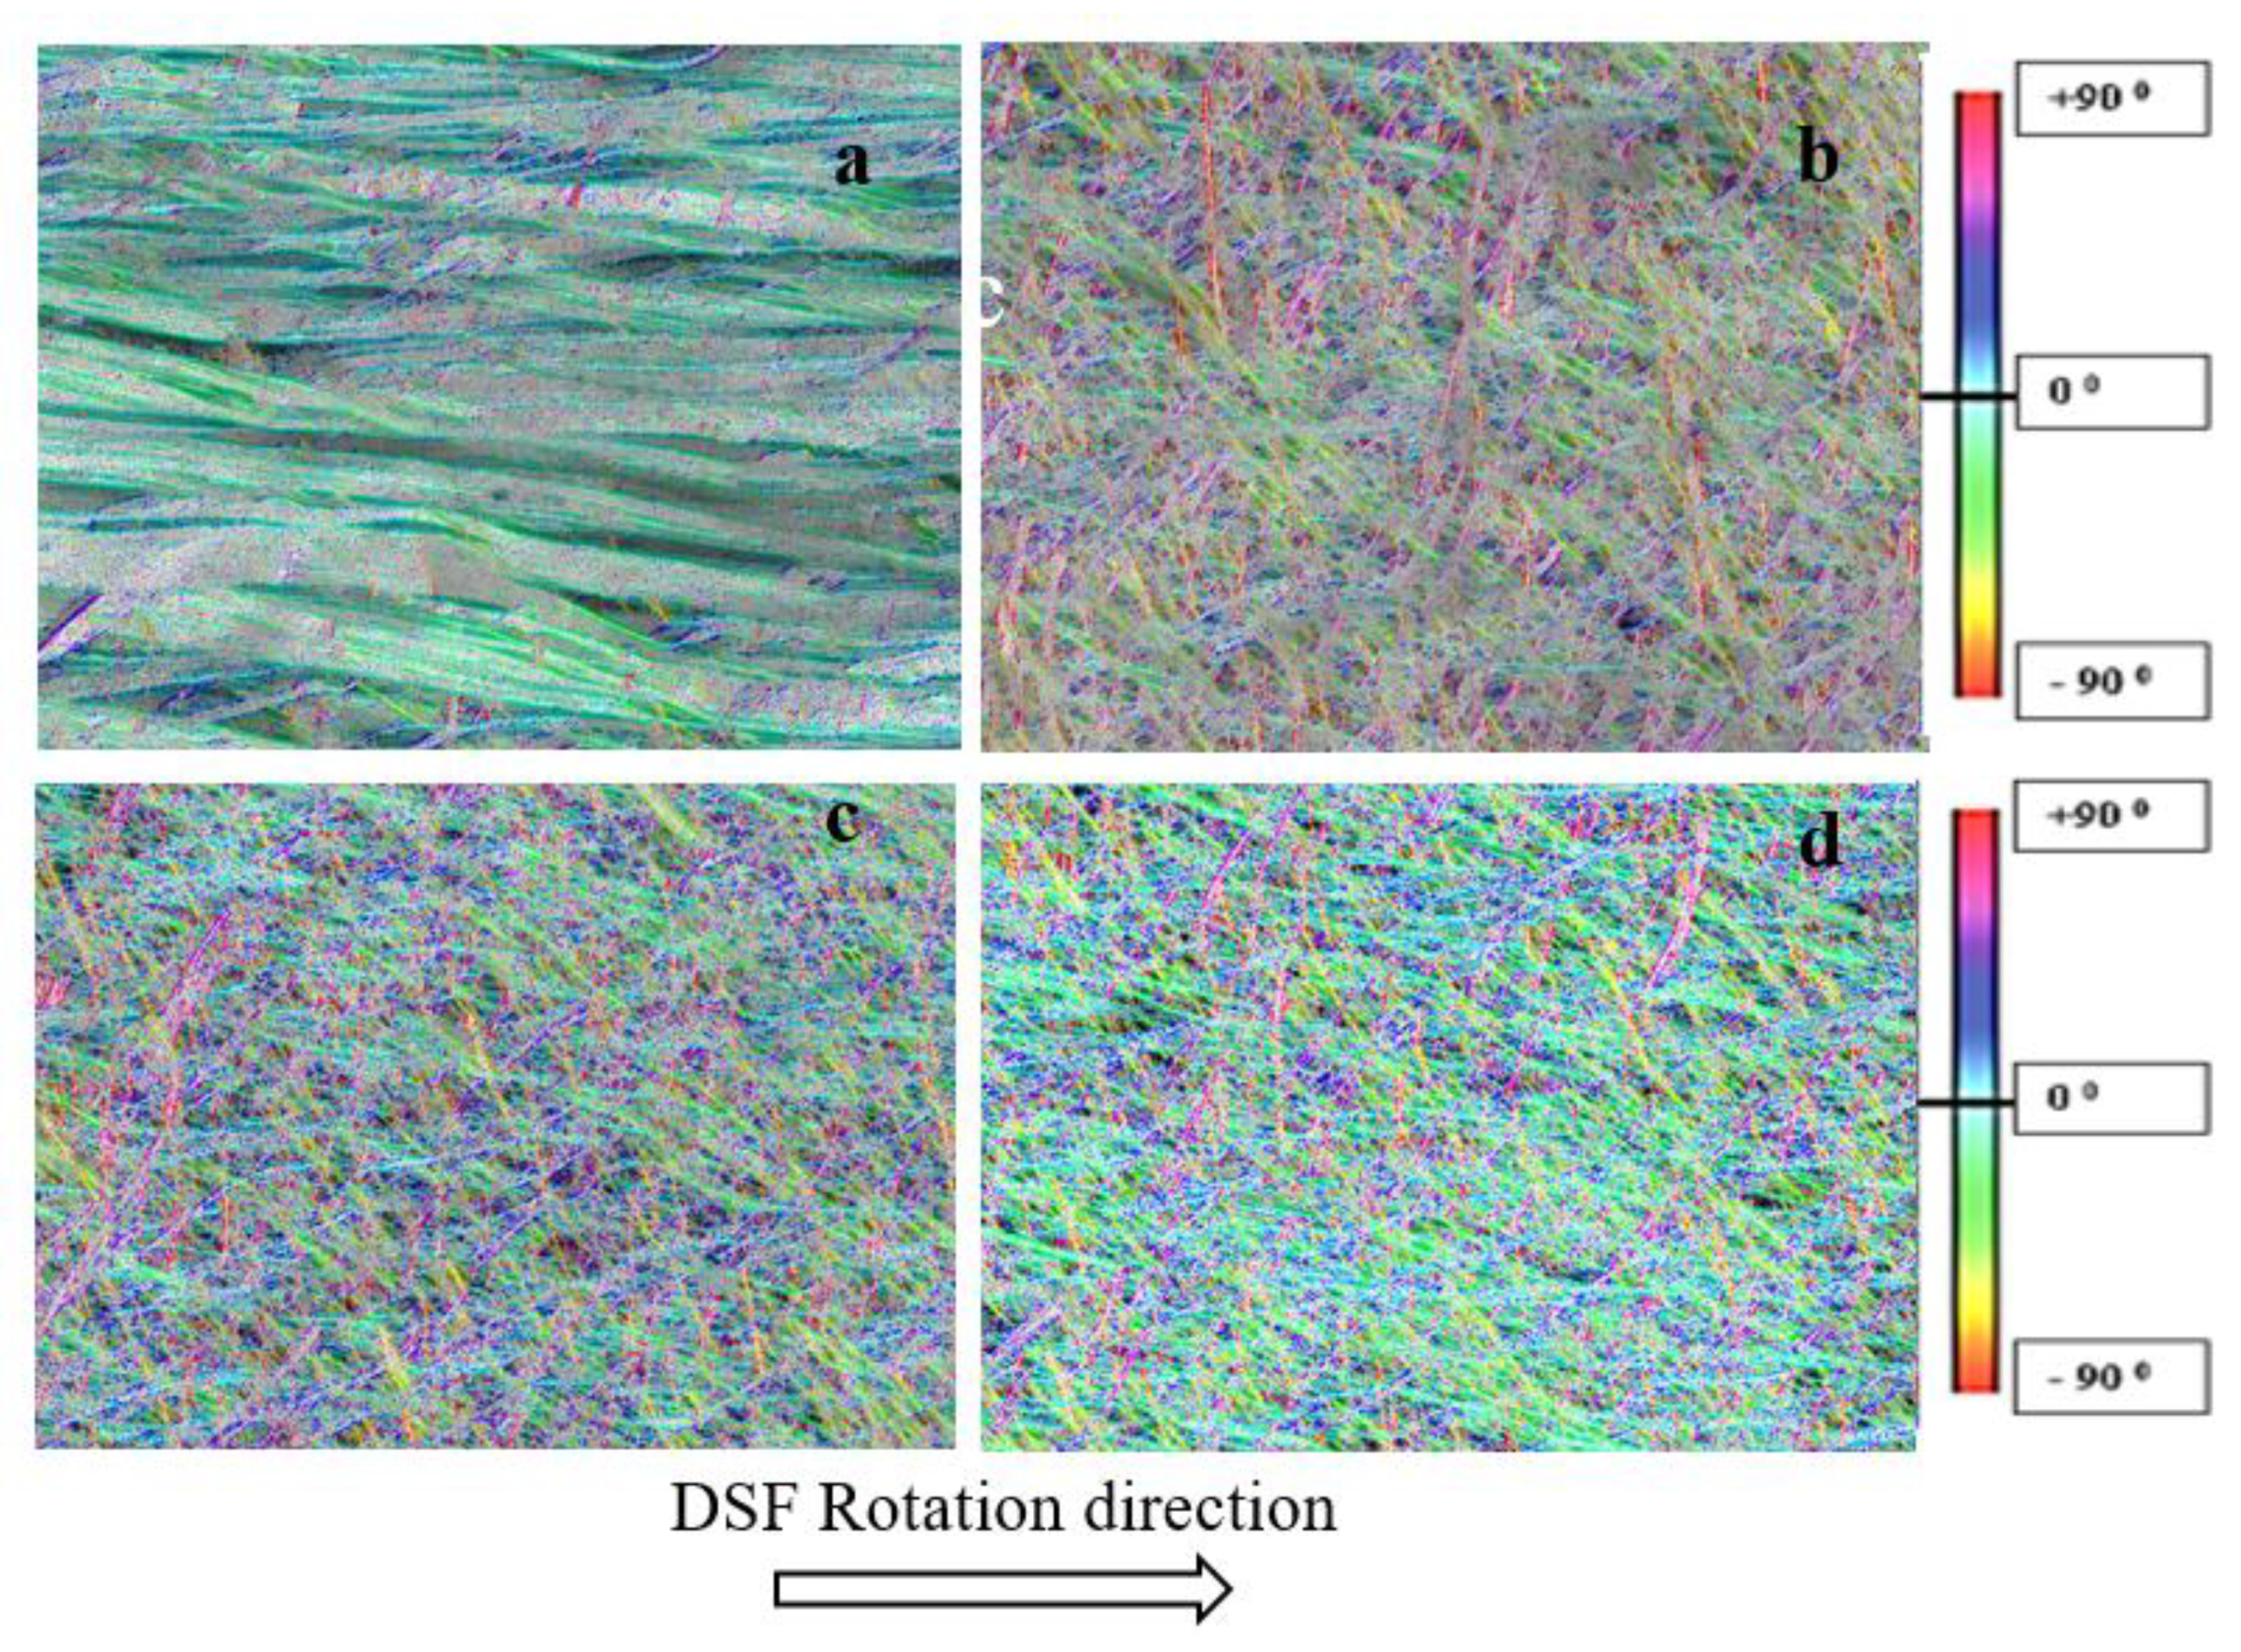
3.2.2. Using Scanning Electron Micrographs
3.3. Orientation Analysis Using XRD
3.4. Evaluation of Composites
4. Conclusions
Author Contributions
Funding
Institutional Review Board Statement
Informed Consent Statement
Data Availability Statement
Acknowledgments
Conflicts of Interest
References
- Such, M.; Ward, C.; Potter, K. Aligned Discontinuous Fibre Composites: A Short History. J. Multifunct. Compos. 2014, 2, 155–168. [Google Scholar] [CrossRef]
- Sunny, T.; Pickering, K.L.; Lim, S.H. Alignment of Short Fibres: An Overview. In Proceedings of the Processing and Fabrication of Advanced Materials-Xxv, Auckland, New Zealand, 22–25 January 2017; pp. 616–625. [Google Scholar]
- Pickering, K.; Efendy, M.A.; Le, T. A Review of Recent Developments in Natural Fibre Composites and Their Mechanical Performance. Compos. Part A 2015, 83, 98–112. [Google Scholar] [CrossRef] [Green Version]
- Lundell, F.; Söderberg, L.D.; Alfredsson, P.H. Fluid Mechanics of Papermaking. Annu. Rev. Fluid Mech. 2011, 43, 195–217. [Google Scholar] [CrossRef]
- Cui, H.; Grace, J.R. Flow of Pulp Fibre Suspension and Slurries: A Review. Int. J. Multiph. Flow 2007, 33, 921–934. [Google Scholar] [CrossRef]
- Bagg, G.E.G.; Dingle, L.E.; Jones, R.H.; Pryde, A.W.H. Process for the Manufacture of a Composite Material Having Aligned Reinforcing Fibers. U.S. Patent 3,617,437, 2 November 1971. [Google Scholar]
- Carlsson, A. Near Wall Fibre Orientation in Flowing Suspensions. Ph.D. Thesis, Royal Institute of Technology, Stockholm, Sweden, 2009. [Google Scholar]
- Sunny, T.; Pickering, K.L.; Lim, S.H. Alkali Treatment of Hemp Fibres for The Production of Aligned Hemp Fibre Mats for Composite Reinforcement. Cellulose 2020, 27, 2569–2582. [Google Scholar] [CrossRef]
- Abràmoff, M.D.; Magalhães, P.J.; Ram, S.J. Image Processing with Imagej. Biophotonics Int. 2004, 11, 36–42. [Google Scholar]
- Gesellchen, F.; Bernassau, A.; Dejardin, T.; Cumming, D.; Riehle, M. Cell Patterning with a Heptagon Acoustic Tweezer–Application in Neurite Guidance. Lab Chip 2014, 14, 2266–2275. [Google Scholar] [CrossRef] [PubMed] [Green Version]
- Schneider, C.A.; Rasband, W.S.; Eliceiri, K.W. Nih Image To Imagej: 25 Years of Image Analysis. Nat. Methods 2012, 9, 671–675. [Google Scholar] [CrossRef] [PubMed]
- Yoshiharu, N.; Shigenori, K.; Masahisa, W.; Takeshi, O. Cellulose Microcrystal Film of High Uniaxial Orientation. Macromolecules 1997, 30, 6395–6397. [Google Scholar] [CrossRef]
- Kim, S.H.; Lee, C.M.; Kafle, K. Characterization of Crystalline Cellulose in Biomass: Basic Principles, Applications, and Limitations of Xrd, Nmr, Ir, Raman, and Sfg. Korean J. Chem. Eng. 2013, 30, 2127–2141. [Google Scholar] [CrossRef]
- Siqueira, G.; Kokkinis, D.; Libanori, R.; Hausmann, M.K.; Gladman, A.S.; Neels, A.; Tingaut, P.; Zimmermann, T.; Lewis, J.A.; Studart, A.R. Cellulose Nanocrystal Inks for 3d Printing of Textured Cellular Architectures. Adv. Funct. Mater. 2017, 27, 1604619. [Google Scholar] [CrossRef]
- Rezakhaniha, R.; Agianniotis, A.; Schrauwen, J.T.C.; Griffa, A.; Sage, D.; Bouten, C.V.; Van De Vosse, F.; Unser, M.; Stergiopulos, N. Experimental Investigation of Collagen Waviness and Orientation in the Arterial Adventitia Using Confocal Laser Scanning Microscopy. Biomech. Model. Mechanobiol. 2012, 11, 461–473. [Google Scholar] [CrossRef] [Green Version]
- Shah, D.U.; Vollrath, F.; Stires, J.; Deheyn, D.D. The Biocomposite Tube of a Chaetopterid Marine Worm Constructed with Highly-Controlled Orientation of Nanofilaments. Mater. Sci. Eng. C 2015, 48, 408–415. [Google Scholar] [CrossRef]
- Bandhakavi, V.S.S.; Aidun, C.K. Analysis of Turbulent Flow in the Converging Zone of a Headbox. In Proceedings of the 1999 TAPPI Engineering/Process & Product Quality Conference, Anaheim, CA, USA, 12–16 September 1999. [Google Scholar]
- Lin, J.; Shi, X.; Yu, Z. The Motion of Fibers in An Evolving Mixing Layer. Int. J. Multiph. Flow 2003, 8, 1355–1372. [Google Scholar] [CrossRef]
- Lewis, D.D.J. Interlaminar Reinforcement of Carbon Fiber Composites from Unidirectional Prepreg Utilizing Aligned Carbon Nanotubes. Ph.D. Thesis, Massachusetts Institute of Technology, Cambridge, MA, USA, 2016. [Google Scholar]
- Palmieri, V.; Lucchetti, D.; Maiorana, A.; Papi, M.; Maulucci, G.; Calapà, F.; Ciasca, G.; Giordano, R.; Sgambato, A.; De Spirito, M. Mechanical and Structural Comparison between Primary Tumor and Lymph Node Metastasis Cells in Colorectal Cancer. Soft Matter 2015, 11, 5719–5726. [Google Scholar] [CrossRef] [PubMed]
- Papathanasiou, T.; Guell, D.C. Flow Induced Alignment in Composite Materials; Woodhead Publishing: Singapore, 1997. [Google Scholar]
- Pratima, B. Biotechnology for Pulp and Paper Processing; Springer: Singapore, 2012. [Google Scholar]
- Reddy, A.N.K.; Sagar, D.K. Half-Width at Half-Maximum, Full-Width at Half-Maximum Analysis for Resolution of Asymmetrically Apodized Optical Systems with Slit Apertures. Pramana 2015, 84, 117–126. [Google Scholar] [CrossRef]
- Tabet, T.A.; Aziz, F.A. Cellulose Microfibril Angle in Wood and Its Dynamic Mechanical Significance. In Cellulose-Fundamental Aspects; Intech: London, UK, 2013. [Google Scholar]
- Dri, F.L.; Hector, L.G.; Moon, R.J.; Zavattieri, P.D. Anisotropy of the Elastic Properties of Crystalline Cellulose I Β from First Principles Density Functional Theory with Van Der Waals Interactions. Cellulose 2013, 20, 2703–2718. [Google Scholar] [CrossRef]
- Torres-Rendon, J.G.; Schacher, F.H.; Ifuku, S.; Walther, A. Mechanical Performance of Macrofibers of Cellulose and Chitin Nanofibrils Aligned by Wet-Stretching: A Critical Comparison. Biomacromolecules 2014, 15, 2709–2717. [Google Scholar] [CrossRef] [PubMed]
- Mohd Ghazali, A.E. Bio-Composites Materials from Engineered Natural Fibres for Structural Applications. Ph.D. Thesis, University of Waikato, Hamilton, New Zealand, 2016. [Google Scholar]


| Nozzle * | Inlet Area/mm2 | Exit Area/mm2 | Contraction Ratio | Flow Velocity at the Entry of Each Nozzle/m/s | Flow Velocity at the Exit of Each Nozzle/m/s |
|---|---|---|---|---|---|
| R56 | 56 | 1.40 | 1.16 | ||
| R46 | 46 | 1.70 | 1.42 | ||
| R35 | 35 | 2.24 | 1.86 | ||
| R24 | 24 | 3.23 | 2.72 | ||
| C46 | 79 | 46 | 1.70 | 0.83 | 1.42 |
| C35 | 35 | 2.24 | 1.86 | ||
| C25 | 25 | 3.13 | 2.61 | ||
| C10 | 10 | 7.50 | 6.52 | ||
| C6 | 6 | 14.22 | 11.81 |
| Sample ** | No. of PP* Sheets | No. of Fibre Mats | Targeted Fibre wt% (Approx.) | Fibre wt% | Arrangement of PP* and Fibre Mat Layers from Bottom to Top | Fibre Loading Direction |
|---|---|---|---|---|---|---|
| PP/MAPP | 4 | 0 | 0 | 0 | 4PP | - |
| R46-15 | 4 | 3 | 15 | 15.7 | 1PP*/1MAT/1PP*/1MAT/1PP*/1MAT/1PP* | Parallel or Perpendicular |
| C10-15 | 14.5 | |||||
| R46-15-P | 15.5 | |||||
| C10-15-P | 15.6 | |||||
| R46-30 | 3 | 6 | 30 | 29.2 | 1PP*/3MATS/1PP*/3MATS/1PP* | Parallel |
| C10-30 | 29.3 |
| Nozzles | Complete Mat |
|---|---|
| R56 | No |
| R46 | Yes |
| R35 | Yes |
| R24 | Yes |
| C46 | Yes |
| C35 | Yes |
| C25 | Yes |
| C10 | Yes |
| C6 | No |
| Samples * | Contraction Ratio | Average Coherency Factor | SD # | Average max/min Frequency Ratio | SD # | FWHM | SD # |
|---|---|---|---|---|---|---|---|
| Random mats | - | 0.11 | 0.04 | 1.80 | 0.21 | - | - |
| Fibre bundles | - | 0.36 | 0.12 | 25.9 | 8.83 | 25.00 | 0.98 |
| R46 | 1.70 | 0.23 | 0.03 | 2.42 | 0.53 | 73.88 | 7.09 |
| R35 | 2.24 | 0.24 | 0.04 | 3.10 | 0.89 | 69.40 | 6.27 |
| R24 | 3.23 | 0.26 | 0.04 | 3.12 | 0.85 | 67.60 | 6.71 |
| C46 | 1.70 | 0.21 | 0.06 | 2.76 | 0.82 | 70.96 | 8.22 |
| C35 | 2.24 | 0.23 | 0.04 | 2.79 | 0.72 | 70.60 | 7.16 |
| C25 | 3.13 | 0.26 | 0.05 | 3.12 | 0.93 | 67.68 | 6.53 |
| C10 | 7.50 | 0.31 | 0.02 | 3.43 | 1.05 | 67.88 | 7.08 |
| Samples | Contraction Ratio | Average Coherency Factor | SD # | Average Frequency Ratio | SD # | Average FWHM | SD # |
|---|---|---|---|---|---|---|---|
| R46 | 1.7 | 0.24 | 0.02 | 4.38 | 0.78 | 68.67 | 6.02 |
| C10 | 7.5 | 0.29 | 0.01 | 5.76 | 0.54 | 20.33 | 3.79 |
| Samples * | Contraction Ratio | Average Intensity Ratio | SD | Herman’s Order Parameter | SD | FWHM | SD | Degree of Ordering (π), % |
|---|---|---|---|---|---|---|---|---|
| Random mats | - | 1.346 | 0.135 | 0.139 | 0.094 | - | - | - |
| R46 | 1.70 | 1.904 | 0.064 | 0.464 | 0.033 | 58.2 | 2.1 | 67.67 |
| R35 | 2.24 | 1.988 | 0.079 | 0.446 | 0.047 | 57.9 | 1.3 | 67.83 |
| R24 | 3.23 | 1.994 | 0.052 | 0.402 | 0.016 | 57.2 | 1.5 | 68.22 |
| C46 | 1.70 | 1.952 | 0.142 | 0.504 | 0.042 | 58.1 | 1.9 | 67.72 |
| C35 | 2.24 | 2.070 | 0.264 | 0.455 | 0.018 | 57.7 | 1.1 | 67.94 |
| C25 | 3.13 | 2.122 | 0.098 | 0.418 | 0.039 | 57.1 | 1.6 | 68.28 |
| C10 | 7.50 | 2.278 | 0.156 | 0.511 | 0.005 | 53.1 | 0.7 | 70.50 |
Publisher’s Note: MDPI stays neutral with regard to jurisdictional claims in published maps and institutional affiliations. |
© 2021 by the authors. Licensee MDPI, Basel, Switzerland. This article is an open access article distributed under the terms and conditions of the Creative Commons Attribution (CC BY) license (https://creativecommons.org/licenses/by/4.0/).
Share and Cite
Sunny, T.; Pickering, K.L.; McDonald-Wharry, J. Improving the Alignment of Dynamic Sheet-Formed Mats by Changing Nozzle Geometry and Their Reinforcement of Polypropylene Matrix Composites. J. Compos. Sci. 2021, 5, 226. https://doi.org/10.3390/jcs5090226
Sunny T, Pickering KL, McDonald-Wharry J. Improving the Alignment of Dynamic Sheet-Formed Mats by Changing Nozzle Geometry and Their Reinforcement of Polypropylene Matrix Composites. Journal of Composites Science. 2021; 5(9):226. https://doi.org/10.3390/jcs5090226
Chicago/Turabian StyleSunny, Tom, Kim L. Pickering, and John McDonald-Wharry. 2021. "Improving the Alignment of Dynamic Sheet-Formed Mats by Changing Nozzle Geometry and Their Reinforcement of Polypropylene Matrix Composites" Journal of Composites Science 5, no. 9: 226. https://doi.org/10.3390/jcs5090226
APA StyleSunny, T., Pickering, K. L., & McDonald-Wharry, J. (2021). Improving the Alignment of Dynamic Sheet-Formed Mats by Changing Nozzle Geometry and Their Reinforcement of Polypropylene Matrix Composites. Journal of Composites Science, 5(9), 226. https://doi.org/10.3390/jcs5090226