Article

A Characterization of the Damage Process under Buckling Load in Composite Reinforced by Flax Fibres

1
Normandie University, ENSICAEN, UNICAEN, CEA, CNRS, CIMAP, 14000 Caen, France
2
University Paris-Est, Marne la Vallée, MSME, 77420 champs-sur-Marne, France
3
National School of Engineers of Sfax (ENIS), LASEM 3038, Tunisia
4
National School of Engineers of Sfax (ENIS), LA2MP 3038, Tunisia
5
Groupe de Physique des Matériaux, CNRS-UMR6634, Université de Rouen, INSA de Rouen, 76800 Saint-Etienne du Rouvray, France
*
Author to whom correspondence should be addressed.
J. Compos. Sci. 2020, 4(3), 85; https://doi.org/10.3390/jcs4030085
Submission received: 25 May 2020 / Revised: 25 June 2020 / Accepted: 27 June 2020 / Published: 30 June 2020
(This article belongs to the Special Issue Advanced Fiber Reinforced Polymer Composites)

Abstract

:
The purpose of this work is to analyze the damage process resulting from buckling load applied on composites reinforced by flax fibre. Continous buckling test was performed on specimens until cracks appeared on their outer face. This test was monitored with an acoustic emission system. The high sensitivity of this method allows the detection of any process or mechanism generating sound waves. Moreover, this technic has the advantage of not causing contact in the deformed zone and thus to overcome the parasitic damage that may result from the stress concentrations in these areas. A multiparametric analysis is used to identify the acoustic signatures corresponding to each damage mechanism involved in the materials, and then follow their evolution in order to identify the most critical mechanisms leading to the final breakage of the material. The presence of these damage mechanisms was confirmed post-test by microscopic observations. Three orientations of laminate specimens (0°, 90° and 45°), relative to flax fabric architecture, were tested in order to characterize and highlight on their own damage process. Similarities as differences were observed between these mechanisms. We have deduced that the high porosity rate found in our composites are resulting from manufacturing parameters. Architecture and properties of the flax fabric influenced negatively the mechanical properties later by accentuating the gap between theoretical and practical values (17% to 22.4%) and by accelerating the development of certain damages such as matrix cracking which acoustic hit density is superior to 70% and fiber/matrix decohesion which occurs very early.

1. Introduction

In recent years, the inclusion of agroresources in the manufacture of structural materials has been gaining more and more interest [1,2], justified mainly by environmental considerations. In this context of ecodesign, the development of new materials totally or partially bio-sourced, such as composite materials reinforced by natural fibres, is therefore a major scientific issue today. The use of natural fibre gained considerable attention in the last decades [3,4,5], the wide applications of composites reinforced by natural fibre are growing rapidly in a various engineering fields such in auto industry [6], building and construction industry, sports, aerospace, and others, for example, panels, window frame, decking, and bicycle frame.
In the present work, flax fibres were chosen as a reinforcement for the tested composites, these fibres present a very interesting alternative, due basically to theirs very competing mechanical characteristics comparing to the conventional fibres as well as their geographical availability. The first attempt to insert flax fibres into composite materials was initiated by Ford in 1941 in cars [7] and since then flax fibre has been increasingly inserted into industrial products [8]. Today, it is presented as the most used vegetable fibre as reinforcement for composites in the automotive and sports equipment. The specific properties of flax fibres are equal or exceed those of some synthetic fibres, in particular those of glass fibres [9]. However, this fibre has several difficulties in its insertion into composite materials due to its significant sensitivity to environmental conditions such as temperature or humidity [3,10,11]. It is mainly the latter that poses the most problems. As flax fibres are very hydrophilic, they tend to capture ambient moisture and swell. This point later influences the quality of the interface and the adhesion between fibres and matrix [12].
The general objective of this paper is to provide information on the mechanical behaviour of composites reinforced with flax fibres and to identify the damage resulting from buckling. The buckling test was chosen because the behaviour of such composites under this type of loading is poorly known, unlike other types of tests such as tensile loading. The material tested is laminate composite specimens containing 8 plies of flax fabric as reinforcement. Three fabric orientations at the composite scale were chosen to be investigated: 0°, 90° and 45°. The acoustic emission (AE) was used to identify the damage. Indeed, this technique, defined as a non-destructive method [13] and developed over the last two decades, represents an efficient method to monitor, in real time, damage growth in materials under mechanical load. Apart from basic cracking modes, it can be argued that every damage mechanism possesses a different acoustic signature which is reflected on the pattern of the signal. Many studies have shown that identification of damage mechanisms from the AE signals is possible using one or more time features, in particular the amplitude signal as shown in Benzeggah [14], Chen [15], Kim [16] and Kotsikos [17] studies. But due to the overlapping of the values, other studies focused on simultaneous analysis of multiple parameters to improve the characterization of a given damage. Some authors combine the amplitude to risetime [18] or amplitude to energy [19], while others authors combine others several parameters at the same time. The multiparametric analysis was chosen in this work to identify damage classes. To this end and referring to the literature [18,19], five main temporal classifiers were selected: amplitude, rise time, duration, signal energy and number of hits at the peak. Due to the absence in the literature of the pre-established classifications for our type of composite, an unsupervised classification, named as the k-means method, was used.

2. Materials and Methods

2.1. Flax Fibre Reinforcement

The flax fabric, provided by Flax Technic company, is marketed under the trade name Twinflax 2D 235. This reinforcement is initially received in the form of rolls of dry tissue and used in manufacturing process without any prior treatment. It is a physically balanced fabric characterized by a basis weight of 235 g/m2 and by 1/1 canvas architecture. The wrap strand is distinguished in brown and the weft strand in white (Figure 1), each strand is made of five individual flax wires, and these ones are interlaced in the canvas architecture. A characterization of the fabric architecture was carried out via observations made by an optical camera. The data collected (diameter of the wires estimated at 0.374 mm, space between two rows of wires) was used to build a digital model using TexGen [20] software and to subsequently determine the fabric filling rate, which is 65%.

2.2. Matrix

The matrix used in manufacturing process is a mixture of epoxy resin and hardener. The resin is developed by Hunstman company and marketed under the name Araldite LY 1564; its viscosity at the temperature of 25 °C is between 10 to 20 mPa·s and its density is between 1.1 to 1.2   g / cm 3 . The hardener is developed by the same company under the name Aradur 3487; its viscosity at 25 °C is between 30 to 70 mPa·s and its density is 0.98 to 1 g/cm3. The optimum blend proposed by the manufacturer is 100 parts by weight of resin for 34 parts for the hardener. On the basis of this mass ratio, the density of the mixture is estimated at 1.14   g / cm 3 . The mixture of these two components is carried out at room temperature and atmospheric pressure.

2.3. Composite Manufacturing and Determination of Porosity Rate

The process used to manufacture the composite plates was the vacuum bagging technique. Eight plies with an average dimension of 300 × 300 mm were deposited manually on the flat face of a flat metal mold (Figure 2), ply by ply, followed by manual impregnation. Special attention has been paid to align the fabric perfectly in the warp direction. After pressurization under 0.9 bar for 24 hours at room temperature, post-curing in an oven is required to obtain a complete polymerization of the epoxy matrix. The post-curing consists of two bearings; the first at 80 °C is for decreasing the viscosity of the resin and promoting its dispersion, the second bearing at 130 °C allows for a complete crosslinking (Figure 3).
Then, the elaborate plates were weighed meticulously using a balance, their volume and their surface were determined by carrying out measurements on the width, length and height on dozens of equidistant points distributed on the plate and averaging thereafter. The grammage and density of the various components supplied by the manufacturer have been checked. We denote by m the mass, V the density fraction, ρ the density, G r the grammage, n the number of folds and f , M and p the indices associated with the fibers, matrix and porosity. The calculation of different volume fractions was established using the following equations:
V f = V o l u m e f i b r e V o l u m e c o m p o s i t e = m f ρ f L . l . h = n . G r . L . l ρ f L . l . h = n . G r ρ f . h ,
V M = V o l u m e M a t r i c e V o l u m e c o m p o s i t e = m M ρ M L . l . h = m c m f ρ M L . l . h = m c m f ρ M . L . l . h ,
V p = 1 ( V f + V M ) ,

2.4. Buckling Test

The specimens prepared for the buckling test were made according to the standard NF T51-120-6. Parallelepiped specimens with a length of 150 mm and a width of 20 mm were extracted from manufactured composite plates with a laser cutting machine following three orientations called 0°, 45° et 90°; the 0° orientation corresponds to the warp fabric axis. The buckling test was carried out on an INSTRON 8800 servohydraulic machine, equipped with a 100 kN force cell and hydraulic jaws, allowing good holding of the specimens. The tests were carried out at room temperature with a travel speed of 2 mm/min. The samples are tested in compression until cracks appear on the external faces. To ensure the repeatability and reproducibility of the test, five samples of each direction were systematically tested.

2.5. Acoustic Emission

In order to identify the damage process of laminated flax/epoxy specimens, the buckling tests were performed with acoustic emission monitoring. The acquisition system used to, consists of two piezoelectric sensors, type micro 80 with a bandwidth of 20 KHz, and a software named AEWIN and supplied by the MISTRAS company which allows the recording in real time of the emitted signals during the solicitation. A coupling gel was used between the sensors and the sample to allow good detection and transmission of acoustic signals from the material to the sensors. Acoustic events were recorded during the test with an acquisition frequency of 1 MHz. The signal acquisition threshold is set at 45 dB. This value is adjusted according to the background noise existing in the test room. Two 40 dB gain preamplifiers were used in order to ensure amplification and signal filtering.

2.6. Scanning Electron Microscopy

In this study, a scanning electron microscope (SEM) was used for the characterization of fracture facies in order to visualize the different damages produced. As it is usually done with composite materials, the acceleration voltage of the beam used is equal to 10 kV and the samples were previously metallized, using a Cressington 108 AUTO metallizer, with a gold film on the surface of the sample to make it conductive. The metallization time was set at 90 s for an optimal thickness deposit.

3. Results

3.1. Analytical Study of the Phenomenon of Buckling

The membrane deformation vector is defined by { ε x 0 ε y 0 γ x y 0 } and the curvature vector by { χ x χ y χ x y } (Figure 4). According to the theory of orthotropic stratified beams [21], membrane deformations and curvatures are expressed as a function of the resultants of forces and moments by the following system:
{ ε x 0 ε y 0 γ xy 0 χ x χ y χ xy } = [ A ij * B ij * B ij * t D ij * ] . { N x N y N xy M x M y M xy } ,
A * , B * and D * are the inverse matrices of A, B and D which represent the stiffness, coupling membrane-flexion-torsion and flexural stiffness matrix. According to the theory of beams, we have N y = N xy = 0 and M y = M xy = 0 in the case of bending along the x-axis.
We pose:
{ N M } = b . { N x M x } ,
Thus, we express the moment M in the following form:
M = B 11 * D 11 * N b D 11 *   χ x ,
The static equilibrium of the deformed beam allows to:
{ N = P . c o s θ ,     M = P . w ,     
θ is defined as the angle between the x-axis (the axis of the specimen) and the tangent to the average fibre of the deformed specimen. According to the approximation of small rotations and the calculation, we obtain:
d 2 w dx 2 + P b   D 11 * w = P b   B 11 * ,
By integrating the Expression (7), we obtain:
w = A cos ( kx ) + B sin ( kx ) + C ,
with k 2 = P b   D 11 * and C = B 11 * D 11 * .
According to the boundary conditions, w   ( 0 ) = 0 and w ( l ) = 0 ,
A = C = B 11 * D 11 * ,
By replacing this expression in the second equation, we obtain:
B sin ( kl ) = B 11 * D 11 *   ( 1 cos ( kl ) ) ,
sin ( kl ) = 0 means that kl = n π , hence the expression of the critical load for n = 1:
P cr 0 = ( π l ) 2 b D 11 * ,

3.2. Theoretical Calculation of the Critical Load

Tensile tests carried out previously allowed to obtain the main mechanical characteristics which are summarized in Table 1.
Which allows to calculate the coefficients Q i j of rigidity which the expression is:
Q 11 = E L 1 υ LT υ TL ,
Q 22 = E T 1 υ LT υ TL ,
Q 12 = E T 1 υ LT υ TL ,
Q 66 =   G LT ,
As the laminate is symmetrical, the stiffness matrices of the constitutive equations are reduced to the membrane matrices and to the flexion/torsion matrices. The stiffness coefficients D i j in bending and torsion are given by:
D ij = 1 3 . [ k = 1 8 ( h k 3 h k 1 3 ) ] Q ij ,
and
D 11 * = D 22 D 11 D 22 D 12 2 ,
where ( h k h k 1 ) denotes the thickness of (k−1)st fold.
By knowing the values of the rigidity tensor components in the main axis of the laminate, we deduce those expressed outside the main axes parameterized by an angle θ which is the angle between the axis of the wires and the stress axis. These values are determined based on the following relationships:
Q 11 = Q 11 . c o s 4 θ + Q 22 . s i n 4 θ + 2 ( Q 12 + 2 Q 66 ) s i n 2 θ . c o s 2 θ
Q 12 = ( Q 11 + Q 22 4 Q 66 ) s i n 2 θ . c o s 2 θ + Q 12 ( s i n 4 θ + c o s 4 θ )
Q 16 = ( Q 11 Q 12 2 Q 66 ) s i n θ . c o s 3 θ + ( Q 12 Q 22 + 2 Q 66 ) s i n 3 θ . c o s θ )
Q 22 = Q 11 . s i n 4 θ + Q 22 . c o s 4 θ + 2 ( Q 12 + 2 Q 66 ) s i n 2 θ . c o s 2 θ
Q 26 = ( Q 11 Q 12 2 Q 66 ) s i n 3 θ . c o s θ + ( Q 12 Q 22 + 2 Q 66 ) s i n θ . c o s 3 θ )
Q 66 = [ Q 11 + Q 12 2 ( Q 12 + Q 66 ) ] s i n 2 θ . c o s 2 θ + Q 66 ( s i n 4 θ + c o s 4 θ )
Subsequently, the stiffness coefficients D i j in bending and torsion are determined from the relation (16) and the coefficient D 11 * from the expression (17). These calculations led us to the results expressed in Table 2.

3.3. Analysis of Experimental Results

The buckling test are carried out on specimens oriented in the 3 warp fabric directions, 0°, 45° and 90°. The data recorded during the test allowed to trace the evolution of the load as a function of the relative longitudinal displacement (Figure 5). It is noted that the critical load is reached for a longitudinal displacement that is almost zero for the 3 configurations, indicating that there has been a very short linear compression phase. Once this load is reached, a continuous decrease in the post-critical load is observed signaling the onset of damage initiation. Sudden drops in load are observed later (8.8% relative displacement for 0°, 4.2% for 90° and 12.6% for 45°) signifying a drop in rigidity and thus the appearance of major degradation phenomena in the material (Figure 5). The critical buckling force was determined experimentally and then compared with a structural calculation (paragraph 3.1—Equation (11)) in order to estimate the errors and to make an inventory of the causes that can generate them. The results obtained are summarized in Table 3.
A fairly clear difference, from 17% to 22.4%, is observed between experimental and theoretical values of the critical load for the 3 specimen configurations (0°, 90° and 45°). In fact, several factors contributed to this gap:
  • Sample geometry: dispersion in the values of l,b and h can lead to differences between the theoretical model and experimental.
  • Existence of an initial defect: presented mainly by the high porosity rate in these materials, which was estimated at 23.3% (calculated according to 2.3). In fact, in addition to reducing the effective volume of composite related to the decrease in the volume of the matrix, the porosities also affect the mechanical properties of the composites and this by presenting local areas of stress concentration. The high porosity rate can be explained by:
    (a)
    the architecture and structure of the flax fabric which is insufficiently filled (initially, void ratio of the flax fabric = 35%) which favours the evacuation and the expulsion of a significant amount of matrix during the depression.
    (b)
    The low compaction rate contributes also to the creation of the porosities between the folds, pressure was applicated at 0.8 bar which is moderately low and therefore does not provide an optimal compaction.
    (c)
    the manual stratification of the folds which does not allow to have a perfect alignment of the wires and the level of depression which affects the level of compaction and the porosity rate is reduced. For operational reasons, it was not possible to adjust this factor and to vary it.
    (d)
    The hydrophilic nature of the flax fabric which leads to a low chemical compatibility with the matrix. In fact, the fibre/matrix compatibility is mainly governed by the surface polarity of the two involved entities. In our case, the presence of polar fibres (hydrophilic) and an apolar epoxy matrix (hydrophobic) leads to a weak adhesion between the two materials. As a result, there will be a weak interface between the reinforcement and the matrix. This last lead to a poor load transfer between the matrix and the fibers and accentuate the gap with the theoretical model.

3.4. Microscopic Analysis of the Rupture

For a more detailed analysis of the mechanisms of damage, observations of fracture facies were made using a scanning electron microscope. These analyses revealed the presence of several types of mechanisms that can easily be distinguished at different scales. Figure 6a,b shows a micrograph of several damaged areas of the matrix on a sample of composites. Note that those matrix cracking are percolating up to the matrix/reinforcement interface, this phenomenon was observed in all tested configurations. Microscopic observations revealed the presence of two types of decohesion; interfacial decohesion between matrix and twisted wire (Figure 7) and a flax fibre/matrix decohesion (Figure 8). This damage is explained firstly by the poor impregnation of the fibres due to the low chemical compatibility between flax fibre and matrix and, secondly, by the difficulty for the matrix to penetrate the heart of the twisted wires. Delamination was observed between the broken folds (Figure 9) as well as a break in the outer folds for the different tested orientations (Figure 10).

3.5. Acoustic Emission Results

3.5.1. Classification Methodology

The k-means supervised classification method has been used in order to segment data into different classes of signals. Five main temporal classifiers were selected for this treatment:
-
the amplitude,
-
the rise time,
-
the duration,
-
the energy of the signal,
-
the number of counts at the peak.
The number of classes is optimized by considering the minimum value of the Davies and Bouldin [22] coefficient RDB. The number of classes to be retained for the classification requires a priori knowledge of the mechanisms of damage that may occur in the studied material. Thus, an optimal segmentation is obtained for k = 4 for the 0° and 90° specimens indicating that these materials present 4 main classes of damage while the 45° specimens has only 3 classes of damage (Figure 11).

3.5.2. Analysis of 0° Specimen Behavior

The 0° specimens have 4 main classes of damage. Figure 12a and Table 4 show the amplitude ranges corresponding to each class. A slight overlap is observed between classes 1 and 2, while classes 2 and 3 shares almost the same range of amplitude with a preponderance for class 2 in terms of number of recorded hits (Table 4). Class 4 is characterized by high amplitude signals between 80 and 100 dB.
Figure 12b shows the evolution and progression of the acoustic intensity of the different classes and serves to detect major events and identify the most energetic classes. Thus, classes 1 and 2 present a very low energy with a rate of less than 5% for the two classes together while class 3 signals have almost one third of the total energy released against nearly two thirds for class 4 (Table 4).

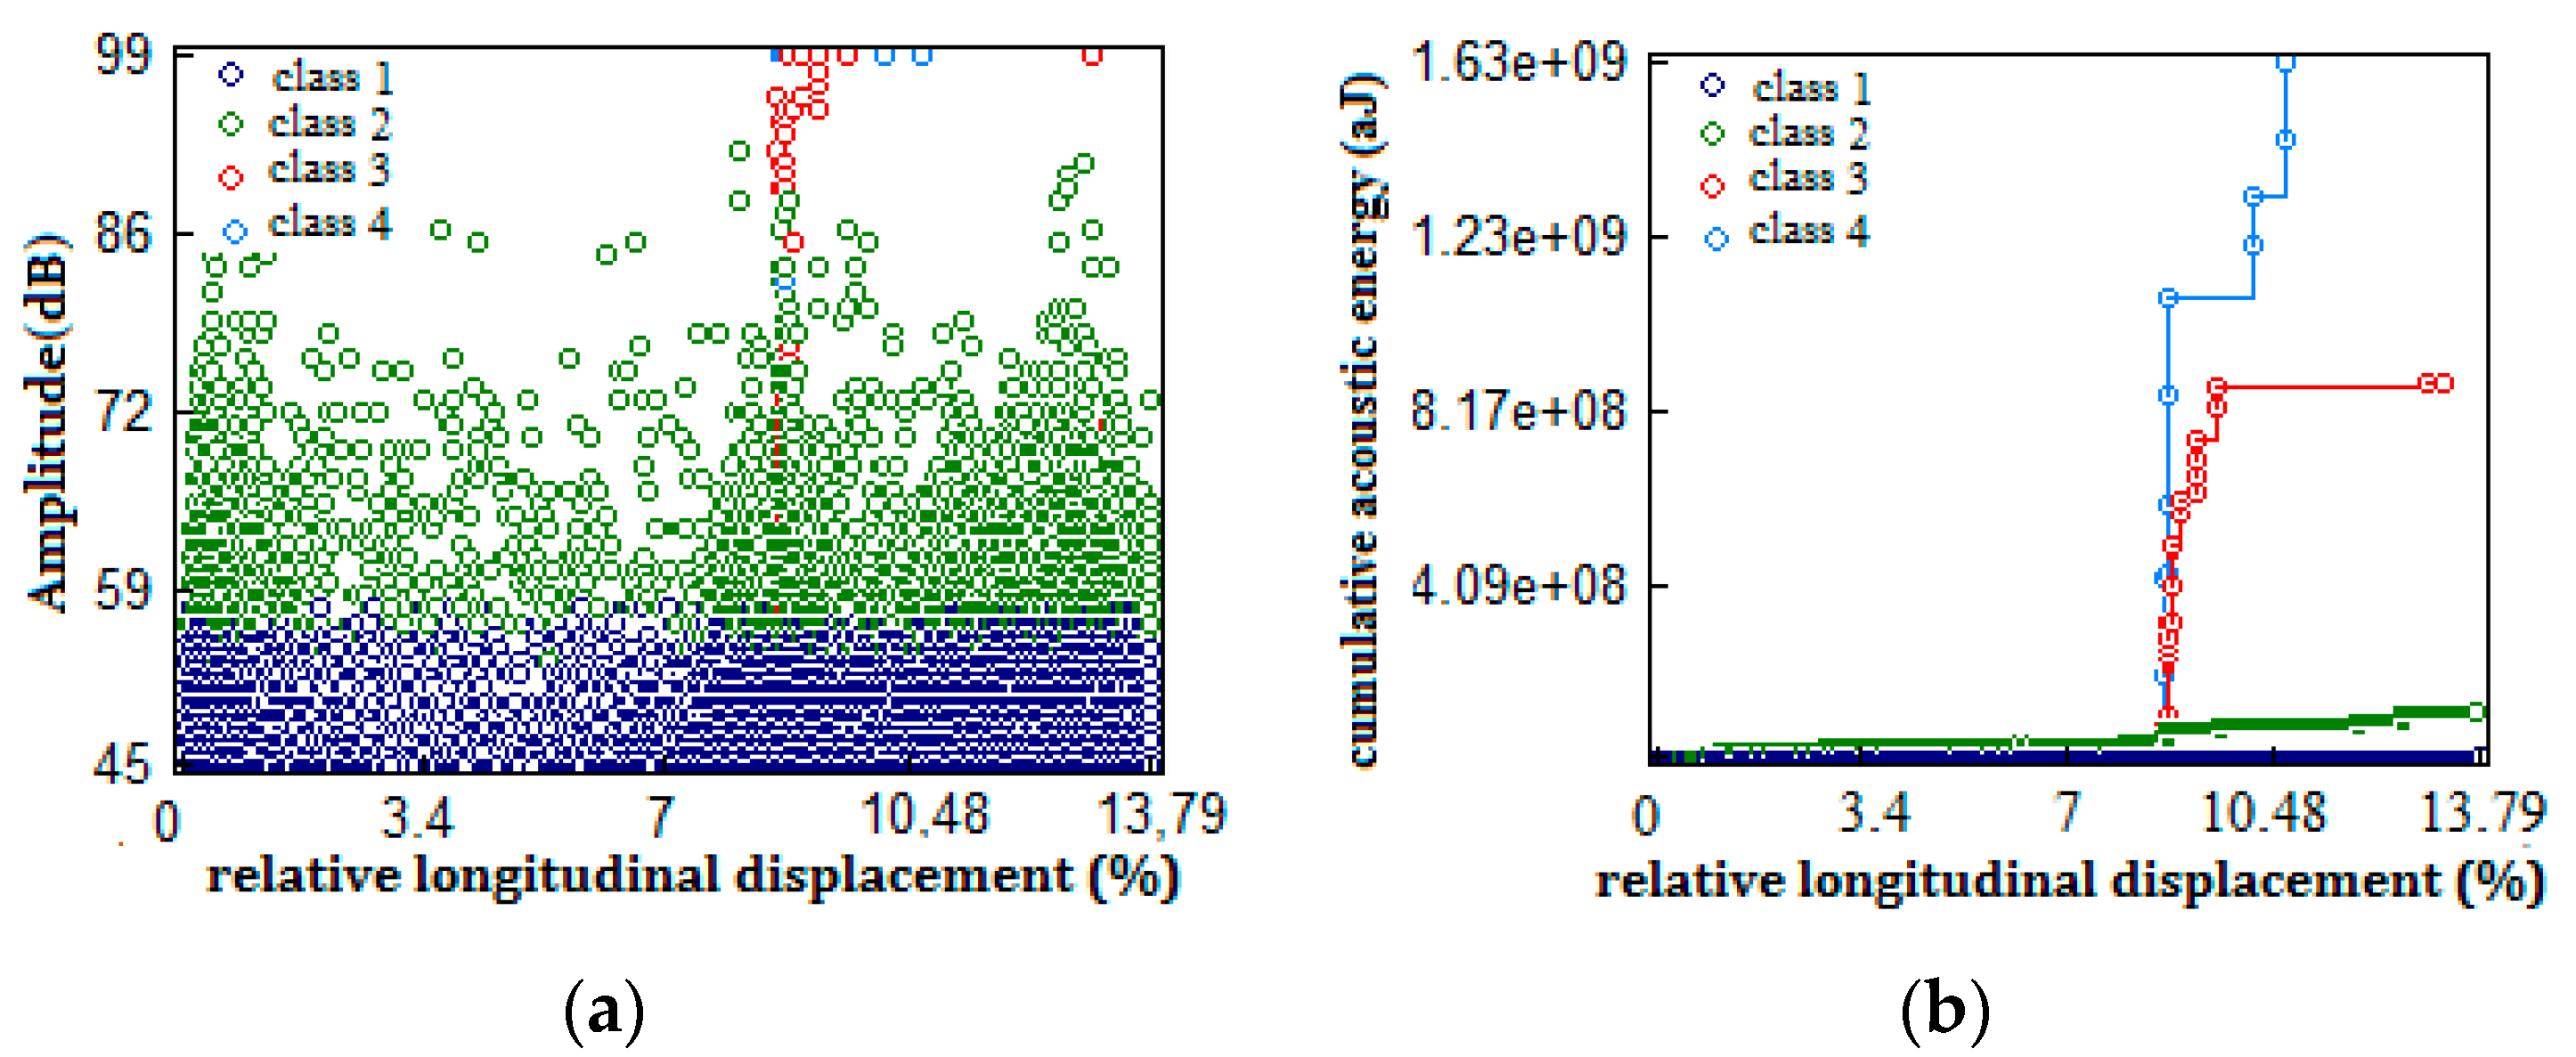
3.5.3. Analysis of 90° Specimen Behavior

According to Figure 11, it is concluded that the optimal number of classes is equal to 4. Figure 13a shows that classes 1 and 2 are distinct with amplitude ranges specific to each class while a large overlap is observed between classes 2, 3 and 4 (Table 5) making assignment of damage mechanisms by referring only to the uncertain amplitude. It is by analyzing the other most discriminating parameters of the EA signals that the class labelling will have to be done.
On the other side, Figure 13b shows the evolution of the acoustic activity of the different classes. Thus, we note that the classes 3 and 4 that occur late, near the end of the test, are very energetic, developing almost all the energy released (Table 5). It can be concluded that these last two are high intensity damage modes that caused a major degradation of the sample while the first two classes are very low energy.

3.5.4. Analysis of 45° Specimen Behavior

In the case of 45° specimens, 3 classes of damage were identified according to the Davies and Bouldin coefficient calculation RDB (Figure 11). Figure 14a and Table 6 show the distribution of amplitude ranges according to classes. A fairly large overlap is observed between the 3 classes, with a small amplitude range for the first class and two other fairly similar ranges for classes 2 and 3, which range from 50 dB to 99 dB. As for the energy rate of each class, we note that it is inversely proportional to the number of signals specific to each class (Table 6). Classes 1 and 2, which have the majority of acoustic bursts, account for only 6% of the total acoustic energy emitted, whereas class 3 signals have a very high energy content, with only 93.95% released energy (Table 6).

3.5.5. Correlation between Acoustic Activity and the Force-Displacement Curve

In order to correlate deformation and acoustic activity, we studied the simultaneous evolution of acoustic energy and the applied load as a function of time (Figure 15). Their simultaneous progression gives a general information on the kinetics of the damage. Thus, at the beginning of the test, the acoustic activity emitted is almost zero, indicating that the material is in the process of energy storing. Then, a sharp and high increase of the energy is observed towards 8.8% of relative displacement for the 0° specimens, 4.2% for the 90° ones and 17.5% for the 45° ones indicating a significant release of energy following the emergence of a critical damage mode and coinciding with an applied load drop. A second larger increase is observed around 23% for the 45° specimens accompanied by a second load drop. These load drops reflect a significant loss of intrinsic rigidity of the material following the degradation of the material. They indicate that the damages that have occurred at this time are very degrading, which allows to identify them among the several possibilities.

3.5.6. Synthesis and Proposal of Attribution to the Mechanisms of Damage

A “spiderweb” representation was chosen to compare the average characteristics of the different signal classes obtained for the three categories of tested specimens and for the five chosen descriptors. Acoustic signatures of the various classes are quite similar from one specimen type to another. Then, we suppose that a class obtained in such configuration corresponds to the same class obtained in another configuration (Figure 16).
Thus, it is deduced from Figure 16 that the signatures of classes 1 and 2 are quite similar for the three types of specimens and it can be assumed that they represent the same mechanism of damage. Likewise, for class 3 we note that the average characteristics are similar for the 3 configurations which leads us to attribute them to the same phenomenon. The last class identified only for the 0° et 90° configuration, are considered to be representative of the same mechanism of damage despite some dispersion in the orders of magnitude of the energy of the signals.
The approach for identifying the signature of the damage mechanisms was established based on the representative and conventional waveforms of the various damage modes of the composites (Table 7) and also on the average characteristics of the different descriptors (Figure 16). For the three types of specimens, the class 1 signals have the lowest amplitude range. These signals are characterized by a slow average rise time and a slow damping compared to the other types as well as a resonant signal shape, a short duration and a low absolute energy. Referring to the literature [15,16,17], we can conclude that these signals correspond to the mechanism of matrix cracking. Since the mechanical properties of the matrix are inferior to that of the reinforcement, the initiation and the development of the damages begin mainly by the matrix cracking. Microcracks are created and propagate from the matrix towards the whole structure causing in its path the creation of other damages. Note that the specific architecture of the fabric presented by an initially high void rate (35% of void rate) and a low compaction capacity favours the creation of porosities. This last is a source of stress concentration and propagation of matrix cracks.
Concerning class 2 signals, the signal shape is of the pulse type, with short rise times, which, in agreement with the literature [22], can be associated with the reinforcement/matrix interface decohesion mechanism. Thus, the microscopic observations established in 4.3 (Figure 7 and Figure 8) shows fibre/matrix decohesions. The following scenario can be assumed for class 2, decohesions begin to form at the fibre/matrix interface progressively, whether fibres on the periphery of the wire or on the inside (we remember that each wire is composed of several fibres). These decohesions start very early and spread on the edge of the wire ending up creating decohesion between wires and matrix.
Class 3 for the 3 tested direction, generate signals of high amplitude and relatively high liberated energy. These signals are detected later and are associated with the breaking of the fibres and precisely those of the outer layers as shown by the microscopic observations (Figure 10). The weak adhesion between reinforcement and matrix (hydrophilic nature of the reinforcement against hydrophobic of the matrix) led to a weak interface. The latter coupled with a high porosity rate in the composite leads to a charge transfer that is not properly ensured and to an anticipated rupture of certain fibers.
Regarding the class 4 signals for 0° and 90° specimens, they appear later, anticipated by the initiation of matrix cracking and interfacial decohesion, it is mainly the accentuation of these two mechanisms which gave birth to this new damage. The signals that correspond to those mechanisms are characterized by very long durations, slow rise times and an impulse waveform, they are quite energetic with a fairly wide range of amplitude. From these properties, and in agreement with Table 7, this class can be attributed to the delamination mechanism. In fact, the low chemical compatibility between the flax fabric and the matrix leads to a poor adhesion between them. Subsequently this weak interface will promote the development of delamination [23] in addition to the fact that the fibre/matrix decohesion leads to a concentration of stress at the interface which becomes the privileged site of the initiation of the damage [24]. These damages then propagate along the fibres in the form of intra-laminar cracks and develop in the adjacent folds or at the interface of these folds causing the appearance of delamination [25]. This type of damage largely contributes to the degradation of the mechanical properties of the structure, which results in a relatively large released acoustic energy. Figure 12b, Figure 13b present energy jumps, showing that the appearance of delamination did not occur in a uniform and progressive manner, but in a series of jerks. The delamination appears at the same time as the rupture of the external folds for these 2 configurations (Figure 12b and Figure 13b). For the 45° configuration, this phenomenon was not noticed which can be explained by stopping the test at the appearance of first cracks on the external faces and due to the fact that the kinetics of development of damage is very slow for this direction, so, it is quite possible that the delamination was posterior to cracks.

4. Conclusions

The study of laminate composites with flax reinforcement tested under buckling allows to obtain the relative force-displacement curve and to deduce the critical load of buckling. For the 3 configurations tested, a load drop is observed once the critical load is reached. The critical load determined for the samples at 0° is estimated at 782 N against 899 N for the 90° specimens and 615 N for the 45° specimens (Figure 5). A comparison of the experimental values with those determined by theoretical calculation revealed a significant difference. The theoretical calculation involved mean values of the different mechanical properties (rigidity, Poisson’s ratio, shear modulus) determined previously. Several causes have been highlighted and which are particularly related to the microstructure and the architecture of the reinforcement (hydrophilic character, low filling rate, low compaction capacity).
The acoustic emission recording coupled with buckling test curves and the microscopic observations revealed the presence of several mechanisms. While the 0° and 90° specimens show 4 classes of damage, the 45° specimens have only 3 classes. Matrix cracking, decohesion and wire breakage of the outer plies were identified for all configurations by analysis of the properties of the main descriptors selected for classification and verified by microscopic observations. On the other hand, the delamination mechanism was identified only in 0° and 90° specimens. Microscopic observations have confirmed the absence of this mechanism in 45° specimens which is, as already mentioned, due to the kinetics of evolution of the damage which is very slow in 45° direction and takes time to manifest as well as the conditions for stopping the test imposed from the beginning. Basically, if we summarize the work above, we say that to improve the mechanical properties of the composite we must control the process parameters (such as the pressure which affects the compaction of the material) to minimize porosity. Also, it is necessary to work on the quality of adhesion between the reinforcement and the matrix. This could be the subject of future work on improving the fiber/matrix interface for composites reinforced by flax fibers by playing on different physical and chemical treatments in order to ensure chemical compatibility between these two constituents and thus a good adhesion and good load transfer.

Author Contributions

Conceptualization, M.F. and A.V.; formal analysis, M.F.; investigation, M.F., A.V. and C.K.; writing—original draft preparation, M.F.; writing—review and editing, M.F., A.V., F.D. and M.H.; supervision, A.V., F.D. and M.H. All authors have read and agreed to the published version of the manuscript.

Funding

This research received no external funding.

Conflicts of Interest

All the authors declare no conflict of interest.

References

  1. Dittenber, D.B.; GangaRao, H.V.S. Critical review of recent publications on use of natural composites in infrastructure. Compos. Part A 2012, 43, 1419–1429. [Google Scholar] [CrossRef]
  2. Cheung, H.Y.; Ho, M.P.; Lau, K.T.; Cardona, F.; Hui, D. Natural fibre-reinforced composites for bioengineering and environmental engineering applications. Compos. Part B 2009, 40, 655–663. [Google Scholar] [CrossRef]
  3. van de Velde, K.; Kiekens, P. Wettability of natural fibres used as reinforcement for composites. Macromol. Mater. Eng. 2000, 272, 87–93. [Google Scholar] [CrossRef]
  4. Misnon, M.I.; Islam, M.M.; Epaarachchi, J.A.; Lau, K.T. Potentiality of utilising natural textile materials for engineering composites applications. Mater. Des. 2014, 59, 359–368. [Google Scholar] [CrossRef]
  5. Gurunathan, T.; Mohanty, S.; Nayak, S.K. A Review of the Recent Developments in Biocomposites Based on Natural Fibres and Their Application Perspectives. Compos. Part A 2015, 77, 1–25. [Google Scholar] [CrossRef]
  6. Huda, M.S.; Drzal, L.T.; Ray, D.; Mohanty, A.K.; Mishra, M. Natural-fibre composites in the automotive sector. Compos. Sci. Eng. 2008, 221–268. [Google Scholar] [CrossRef]
  7. Anonymous. Auto body made of plastics resists denting under hard blows. Pop. Mech. Mag. 1941, 76, 7. [Google Scholar]
  8. Koronis, G.; Silva, A.; Fontul, M. Green composites: A review of adequate materials for automotive applications. Compos. Part B 2013, 44, 120–127. [Google Scholar] [CrossRef]
  9. Ashori, A. Woodplastic composites asp romising green-composites for automotive industries! Bioresour. Technol. 2008, 99, 4661–4667. [Google Scholar]
  10. Placet, V.; Trivaudey, F.; Cisse, O.; Gucheret-Retel, V.; Boubakar, M.L. Diameter dependence of the apparent tensile modulus of hemp fibres: A morphological, structural or ultrastructural effect. Compos. Part A Appl. Sci. Manuf. 2012, 43, 275–287. [Google Scholar] [CrossRef]
  11. Gourier, C.; le Duigou, A.; Bourmaud, A.; Baley, C. Mechanical analysis of elementary flax fibre tensile properties after different thermal cycles. Compos. Part A 2014, 64, 159–166. [Google Scholar] [CrossRef]
  12. Cherif, Z.; Poilane, C.; Falher, T.; Vivet, A.; Ouail, N.; Doudou, B.B.; Chen, J. Influence of textile treatment on mechanical and sorption properties of flax/epoxy composites. Polym. Compos. 2013, 34, 1761–1773. [Google Scholar] [CrossRef]
  13. Roget, J. Essais non Destructifs. L’éMission Acoustique, Mise en Oeuvre et Applications; Association française de normalization: Paris, France, 1988. [Google Scholar]
  14. Benzeggagh, M.L.; Barre, S. On the use of acoustic emission to investigate damage mechanisms in glass-fibre-reinforced polypropylene. Compos. Sci. Technol. 1994, 52, 369–376. [Google Scholar]
  15. Chen, O.; Karandikar, P.; Takeda, N.; Kishi, T. Acoustic emission characterization of a glass-matrix composite. Non Destr. Test. Eval. 1992, 8–9, 869–878. [Google Scholar] [CrossRef]
  16. Kim, H.Y.; Hwang, W. Effect of debonding on natural frequencies and frequency responses functions of honey sandwich beams. Compos. Struct. 2002, 55, 51–62. [Google Scholar] [CrossRef]
  17. Kotsikos, G.; Evans, J.T.; Gibson, A.G.; Hale, J. Use of acoustic emission to characterize corrosion fatigue damage accumulation in glass fibre reinforced polyester laminates. Polym. Compos. 1999, 20, 689–696. [Google Scholar] [CrossRef]
  18. Uenoya, T. Acoustic emission analysis on interfacial fracture of laminated fabric polymer matrix composites. J. Acoust. Emiss. 1995, 13, 95–102. [Google Scholar]
  19. Ativitavas, N.; Fowler, T.; Pothisiri, T. Acoustic emission characteristics of pultruded fibre reinforced plastics under uniaxial tensile stress. In Proceedings of the European WG on AE, Berlin, Germany, 15–17 September 2004; pp. 447–454. [Google Scholar]
  20. Available online: http://texgen.sourceforge.net/ (accessed on 12 May 2020).
  21. Berthelot, J.M. Matériaux Composites: Comportement Mécanique et Analyse Des Structures; Editions Tec &Toc: Paris, France, 1999; pp. 283–301. [Google Scholar]
  22. Huguet, S.; Godin, N.; Gaertnera, R.; Salmonb, L.; Villardb, D. Use of acoustic emission to identify damage modes in glass fibre reinforced polyester. Compos. Sci. Technol. 2002, 62, 1433–1444. [Google Scholar] [CrossRef]
  23. Chen, J.; Bull, S.J. Approaches to investigate delamination and interfacial toughness in coated systems: An overview. J. Phys. D Appl. Phys. 2010, 44, 56–71. [Google Scholar] [CrossRef] [Green Version]
  24. Bonnay, K.; Despringre, N.; Chemisky, Y.; Meraghni, F. Interfacial damage and load transfermodeling in short fiber reinforced composites. In Proceedings of the ECCM17—17th European Conference on Composite Materials, Munich, Germany, 26–30 June 2016. [Google Scholar]
  25. Sorensen, B.F. Delamination fractures in composite materials. In Modeling Damage, Fatigue and Failure of Composite Materials; Talreja, R., Varna, J., Eds.; Woodhead Publishing: Cambridge, UK, 2016; pp. 213–240. [Google Scholar]
Figure 1. Detailed observation of the fabric architecture.
Jcs 04 00085 g001
Figure 2. Vacuum molding process.
Jcs 04 00085 g002
Figure 3. Post-curing cycle.
Jcs 04 00085 g003
Figure 4. Beam element [21].
Jcs 04 00085 g004
Figure 5. Load-relative displacement curve corresponding to (a) 0°, (b) 90° and (c) 45° specimens.
Jcs 04 00085 g005
Figure 6. Visualization of matrix cracking. (a) global view, (b) detailed view.
Jcs 04 00085 g006
Figure 7. Visualization of wire-matrix decohesion.
Jcs 04 00085 g007
Figure 8. Visualization of decohesion between fibre/matrix. (a) global view, (b) detailed view.
Jcs 04 00085 g008
Figure 9. Visualization of delamination.
Jcs 04 00085 g009
Figure 10. Visualization of the breaking of the outer folds.
Jcs 04 00085 g010
Figure 11. Determination of the optimal number of classes by the Davies and Bouldin criterion.
Jcs 04 00085 g011
Figure 12. (a) Representation of events in amplitude/deformation, (b) cumulative acoustic energy of the different classes for the 0° specimen types.
Jcs 04 00085 g012
Figure 13. (a) Representation of events in amplitude/deformation, (b) cumulative acoustic energy of the different classes for the 90° specimen types.
Jcs 04 00085 g013
Figure 14. (a) Representation of events in amplitude/deformation, (b) cumulative acoustic energy of the different classes for the 45° specimen types.
Jcs 04 00085 g014
Figure 15. Simultaneous evolution of the load and cumulative acoustic energy of (a) 0° specimens, (b) 90° specimens, (c) 45° specimens.
Jcs 04 00085 g015
Figure 16. Average characteristics of the different identified classes.
Jcs 04 00085 g016
Table 1. Mechanical characteristics of laminated flax/epoxy.
Mechanical PropertiesValue
Longitudinal Young’s modulus E L (GPa)4.92
Transverse Young’s modulus E T (GPa)5.2
Longitudinal Poisson’s ratio υ L T 0.133
Transverse Poisson’s ratio υ T L 0.182
Shear modulus (GPa)1.17
Table 2. Theoretical values of critical force.
SensSens 0°Sens 90°Sens 45°
Theoretical critical force (N)1008 ± 381082 ± 45740 ± 18
Table 3. Comparison between theoretical and experimental values of the buckling test.
Sens90°45°
Experimental critical force (N)782 ± 22899 ± 11615 ± 28
Theoretical critical force (N)1008 ± 381082 ± 45740 ± 18
Deviation (%)22.41717
Table 4. Distribution of the parameters of the damage classes for the 0° specimen.
ClassClass 1Class 2Class 3Class 4
Amplitude (dB)[45,57][50,92][56,99][82,99]
Number of cumulative hits (%)73.825.50.620.08
Acoustic energy rate (%)0.314.2533.5861.84
Table 5. Distribution of the parameters of the damage classes for the 90° specimens.
Class1234
Amplitude (dB)[45,55][53,92][65,99][70,99]
Number of cumulative hits (%)70.5927.011.90.48
Acoustic energy rate (%)0.010.4144.1955.37
Table 6. Distribution of the parameters of the damage classes for the 45° specimens.
Class123
Amplitude (dB)[45,60][46,91][52,99]
Number of cumulative hits (%)76.0323.080.88
Acoustic energy rate (%)0.165.8893.95
Table 7. Time characteristics of different waveforms.
LabelType AType B
type of signalresonantpulse
Energy releasedlowaverage
Waveform Jcs 04 00085 i001 Jcs 04 00085 i002
LabelType CType D
type of signalpulseresonant
Energy releasedhighVery high
Waveform Jcs 04 00085 i003 Jcs 04 00085 i004

