Article

Enhancing Strength and Toughness of Hierarchical Composites through Optimization of Position and Orientation of Nanotubes: A Computational Study

1
State Key Laboratory of Mechanics and Control of Mechanical Structures, Nanjing University of Aeronautics and Astronautics, Nanjing 210016, China
2
Department of Materials Engineering, KU Leuven, Kasteelpark Arenberg 44 bus 2450, 3001 Leuven, Belgium
*
Author to whom correspondence should be addressed.
J. Compos. Sci. 2020, 4(2), 34; https://doi.org/10.3390/jcs4020034
Submission received: 10 February 2020 / Revised: 21 March 2020 / Accepted: 27 March 2020 / Published: 31 March 2020
(This article belongs to the Special Issue Recent Advances in Carbon Nanotube Composites)

Abstract

:
Hierarchical composites that combine microscopic fibers and carbon nanotubes (CNTs) offer opportunities to further improve mechanical properties. Motivated by the experimental evidence that the spatial distribution of CNTs has a significant effect on the strength and toughness of these composites, we developed a novel modelling tool to help us explore mechanisms of strengthening and toughening in an efficient way. The spatial position and orientation of CNTs are chosen as design variables and their optimization is performed on the example of a unidirectional fiber-reinforced composite (FRC) subjected to transverse tensile loading. The model relies on the use of genetic algorithm and finite element method. Our modelling results show that the CNT network with an optimized morphology suppresses stress concentrations in the matrix near the fibers. The optimized morphology is shown to activate a new strengthening and toughening mechanism—diffusion of damage at micro-scale. It allows substantial increase in the consumption of the strain energy by matrix cracking, delocalization of damage, and with it, improvement of the strength and toughness. When the network morphology of 1.0 wt% of CNTs is optimized, the strength and toughness are increased by 49% and 65%, respectively, compared to the pristine FRC. The same amount of homogenously distributed CNTs in the composite leads to only 2% of the strength increase accompanied by a 13% decrease in toughness. The work emphasizes the importance of optimizing spatial position and orientation of CNTs for the strength and toughness improvements of composites.

1. Introduction

Substantial efforts have been made to improve toughness of fiber-reinforced composites (FRCs), by developing new design principles. Nature has provided a great number of creative solutions to these challenges, and one of them is a hierarchical concept of making interdependent multi-scale structures [1,2]. In the world of synthetic materials, tremendous progress in the fabrication of nanomaterials like carbon nanotubes (CNTs) and graphene has made the hierarchical designs of FRCs possible.
Up to now, introduction of CNTs in FRCs to create hierarchical designs has followed two popular routes: direct dispersion of CNTs in the matrix and grafting CNTs on the fiber surface [3,4]. Vast experimental evidence has demonstrated that CNTs bring significant improvements to the toughness of pristine FRCs. The major mechanism behind this improvement, claimed in the literature, is debonding and pull-out of CNTs [5,6,7]. The spatial distribution of CNTs inside FRCs is often targeted to be as homogeneous as possible to avoid formation of microscopic agglomerates, which are known to act as stress risers and to reduce the beneficial effects of CNTs at the nano-scale [8,9]. However, this view has been recently challenged by new progress in the hierarchical FRCs reinforced by CNTs. For example, in two recent works [10,11], hierarchical FRCs with heterogeneously distributed CNTs (i.e., in small CNT agglomerates instead of homogeneous distribution) exhibited mode I fracture toughness that was 26% higher than that with homogenous distribution [11]. This improvement was attributed to an extra toughening mechanism, i.e., crack pinning and deflection.
The toughening mechanisms in composites with CNTs can be classified into two groups according to the scale at which material damage occurs, i.e., nano-scale and micro-scale mechanisms [12]. Representative examples of the former are the well-known CNT pull-out and crack bridging by CNTs [12,13], which promotes energy consumption at the CNT/matrix interface [5]. The micro-scale toughening mechanisms identified in experiments include crack pinning and deflection [10,11,14] as well as damage diffusion [15,16]. Generally speaking, the nano-scale mechanisms are easy to activate, even for a few CNTs, and therefore they are frequently observed in experiments. However, this is different for the micro-scale mechanisms. They can only occur when CNTs are present in sufficient numbers and are distributed according to a certain network morphology (i.e., certain spatial position and orientation of CNTs) [12]. This was the reason why crack deflection mechanism was observed for heterogeneously distributed CNTs in FRCs and not for homogenously distributed CNTs [10,11].
Due to the crucial role of the CNT-network morphology on the toughness improvement, the interesting questions that arise are “which kind of CNT-network morphology is the most effective in improving the strength and toughness of FRCs?” and “If such a network morphology exists, how to find it?”. It is not practical to answer these questions by experimental trials, and to do virtually a modelling tool is required. Creation of the modelling tool for nanostructure optimization is our motivation of this study. It also seems timely, considering recent development of advanced fabrication technologies, such as magnetic field assisted technique [17,18], chemical self-assembly [19], and 3D printing [20], that open perspectives for creation of elaborate CNT network morphologies.
As for a reliable modelling design tool for hierarchical FRCs with CNTs, the primary requirement is that it is able to describe various mechanisms of energy absorption and their dependence on the morphology of the CNT network in the presence of fibers. The atomistic models [21,22] that only contain a single or few CNTs are incapable of revealing the morphological effects. Modelling many CNTs with realistic dimensions is not feasible with these models due to computational cost. The hierarchical multi-scale models based on a concept of scale separation [23,24,25], in which a CNT-reinforced region is considered as an equivalent material with homogenized properties in the FRC model at the micro-scale, cannot reproduce the synergy between stress heterogeneities induced by CNT network and micro-fibers. The concurrence and interactions of multiple damage mechanisms at different scales [12,26], such as CNT interfacial debonding (nano-scale) and matrix cracking (micro-scale), are impossible to capture by this approach. In recent years, a concept of concurrent multi-scale models was developed to reveal synergistic effects between micro- and nano-scale reinforcements based on the finite element method (FEM) [27,28,29,30,31]. In these advanced models, micro-fibers and CNTs are modelled with real dimensions and simultaneously. The morphological effects of CNT networks on the stress distribution in FRCs were well demonstrated by these models [27,28,29,30]. These models have been, up to now, limited to elastic stress analysis. To make further advancements, we recently proposed an approach that combines embedded element technique and cohesive elements [32,33] to model concurrently multiple damage mechanisms at different scales for CNT-based composites [34]. To the best of the authors’ knowledge, this is the only approach that can account for the synergistic effects of CNT-network morphology and micro-fibers on the behavior of CNT-reinforced hierarchical FRCs to predict strength and toughness.
The second requirement for the modelling design tool is that a specialized optimization algorithm, e.g., generic algorithm (GA), is needed to accelerate the search for an optimal morphology, similar to the optimization design of pristine FRCs [35,36,37]. That is because the exhaustive trials, even based on predictive modelling, are also unacceptable due to the complex and variable effects of CNT-network morphology on the damage mechanisms [3]. Up to now there is still no such a design tool reported for CNT-reinforced hierarchical FRCs.
Motivated by the new opportunity to exploit CNTs’ spatial position and orientation for strengthening and toughening of composites, we propose a modelling tool to explore possible design principles through the optimization of CNTs’ network. This design tool will combine GA with our recently developed predictive model for CNT-reinforced hierarchical FRCs. This new optimization model will be called the GA-FEM optimization model. It is introduced in Section 2. It is then applied to a specific case of a unidirectional composite subjected to tensile transverse loading in Section 3, and its advantages are presented by comparing the results for the optimized CNT position and orientation with the case of homogenously distributed CNTs. Concluding remarks are followed in Section 4.

2. Methodology

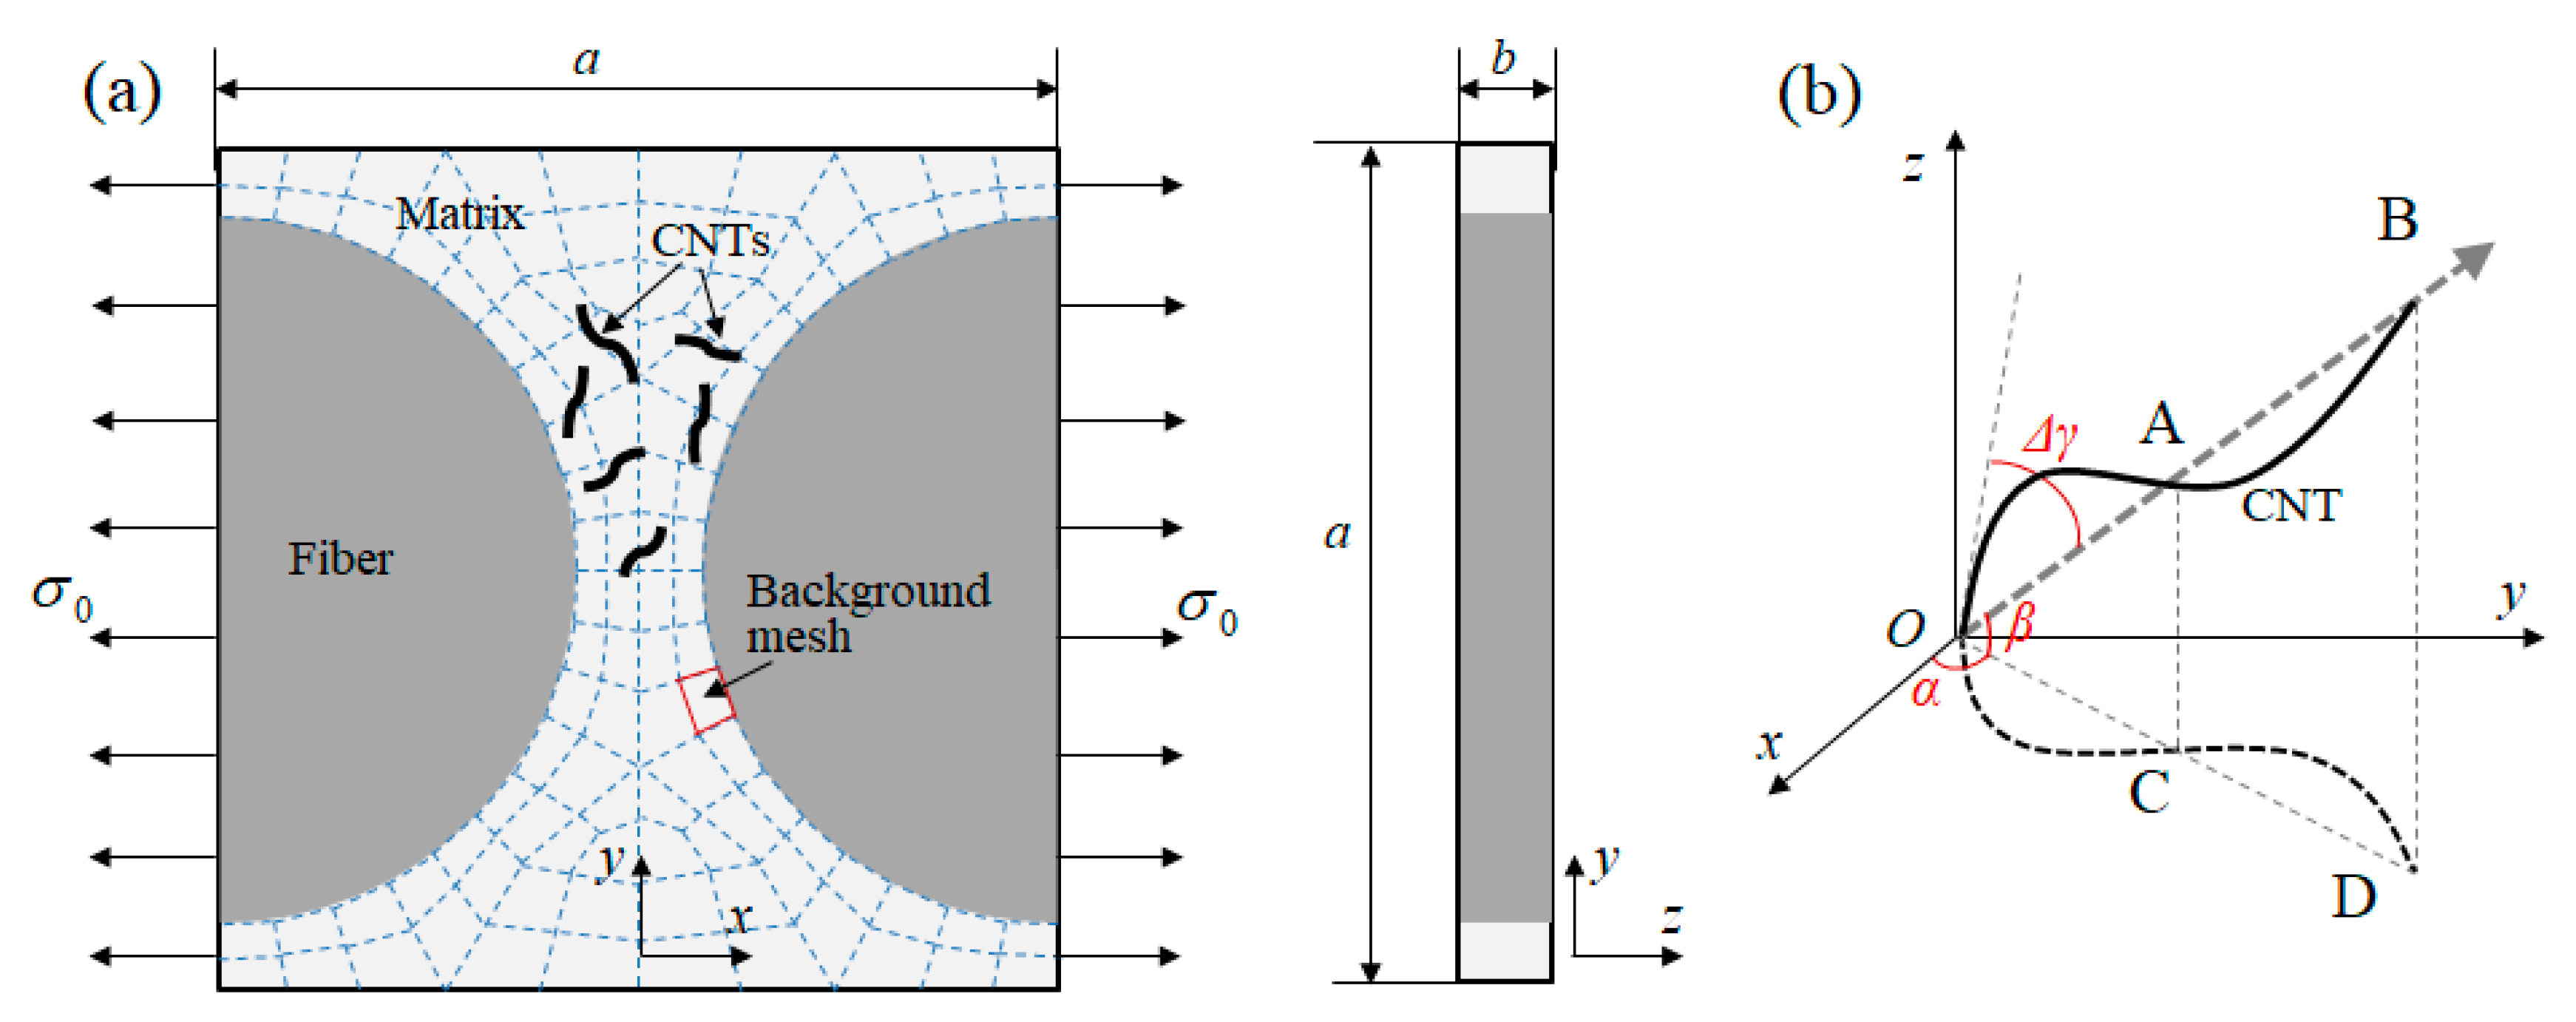
2.1. Description of the Optimization Problem

In this work, the design variables are CNTs’ position and orientations, and the target is maximization of the toughness. Due to the variety and complexity of CNT-network morphologies, the design space is very large and finding an optimal solution is not straightforward. To solve this problem, GA is adopted because it has a good reputation in dealing with optimization problems involving non-convex, discontinuous, and multi-modal solution spaces [38].
Generally, for any kind of an optimization problem, the search for an optimal solution requires a criterion to judge the fitness of a solution, and optimization process involves many fitness estimations of all possible solutions. In this work, the fitness of a solution, i.e., how tough the CNT network with a specific morphology is, is implemented using our previously developed model [34]. To predict the strength and toughness of a CNT-reinforced FRC using this model, the simulation time is mostly three to seven days depending on the number of CNTs. The fitness estimation based on the toughness characteristics is too long to be acceptable for the present optimization. Instead, an alternative method is adopted, namely the stress concentrations in the matrix arising from the presence of fibers are chosen for the fitness estimation. This only requires elastic stress analysis and thus decreases simulation time to around several minutes. Such an approximation is heuristically justifiable as the stiffness mismatch between the fiber and the matrix is believed to result in early damage onset in FRCs and affects the composite properties such as strength and toughness [27]. After an optimal solution for CNT position and orientation is obtained using the elastic stress analysis, the complete tensile behavior of the designed hierarchical FRC is then calculated using the model. The developed modelling design tool is referred here as a GA-FEM optimization tool.
As shown in Figure 1a, a unit-cell model containing two fiber halves is used to represent the microstructure of an FRC. The micro-fibers have a diameter of 7 μm. The unit-cell model has the same length a = 8 µm in x and y directions to satisfy the fiber volume fraction of 60%. The thickness (z-dimension) is set as b = 0.5 µm in order to reduce computation costs. A single CNT is assumed to have ten walls with a total thickness of 3.4 nm. CNT length and diameter are fixed to 0.6 μm and 9 nm, respectively. CNTs have a wavy shape as shown in Figure 1b, which is described by a deviation angle between the global (the direction from an end point to the other one) and local (the tangent direction to the wavy curve) directions of a CNT, Δγ. The value of the deviation angle is assumed to vary randomly from 0° to 10° for different CNTs as also simulated in [27,29].
Similar to our previous work [39], the spatial position and orientation distributions of CNTs are described by the density field (ρ), and two Euler angles (α and β), which are design variables and mathematically expressed as the functions of spatial coordinates, x and y. The design variables are assumed to be constant through the thickness (i.e., z direction) of the FRC model because the thickness is far smaller than the length and width. Generally, it is difficult to describe arbitrary distribution of CNTs’ positions and orientations using a simple function with limited parameters. A discretization strategy is used in this work following [39]. The matrix domain in the FRC model is discretized into a certain number of regions forming a background mesh as shown in Figure 1a, and the joint points of the background-mesh elements are called “controlling points”. The local density and orientation of CNTs within a background mesh element are obtained by interpolating from those at the corresponding four controlling points. By means of this, the densities and Euler angles at all controlling points, which form a vector, can represent the density and orientation fields of CNTs.
The objective of the optimization is to suppress stress concentrations in the matrix, which is expressed as the minimization of a global measure of the stress field, λ, as follows:
ψ = min ( λ ) , λ = 1 V m a t r i x ( σ ( x , y , z ) σ t h ) p   H ( σ ( x , y , z ) σ t h )   d V
H ( ω ) = { 0 ,       ω < 0 1 ,       ω 1
Here σ represents the maximum principal stress, Vmatrix is the volume of the matrix domain, and σth and p are two parameters specified before the optimization. It is clear that λ defines the volume of the material where the maximum principal stress is larger than σ t h , and the contribution of the high-stress region to λ is determined by a power-law in terms of the local stress level. Compared to the well-known stress concentration factor K (i.e., the ratio of the maximum value of σ to the applied stress σ0), the parameter, λ, has been verified to be more effective for the nanostructure optimization in our previous work [39].

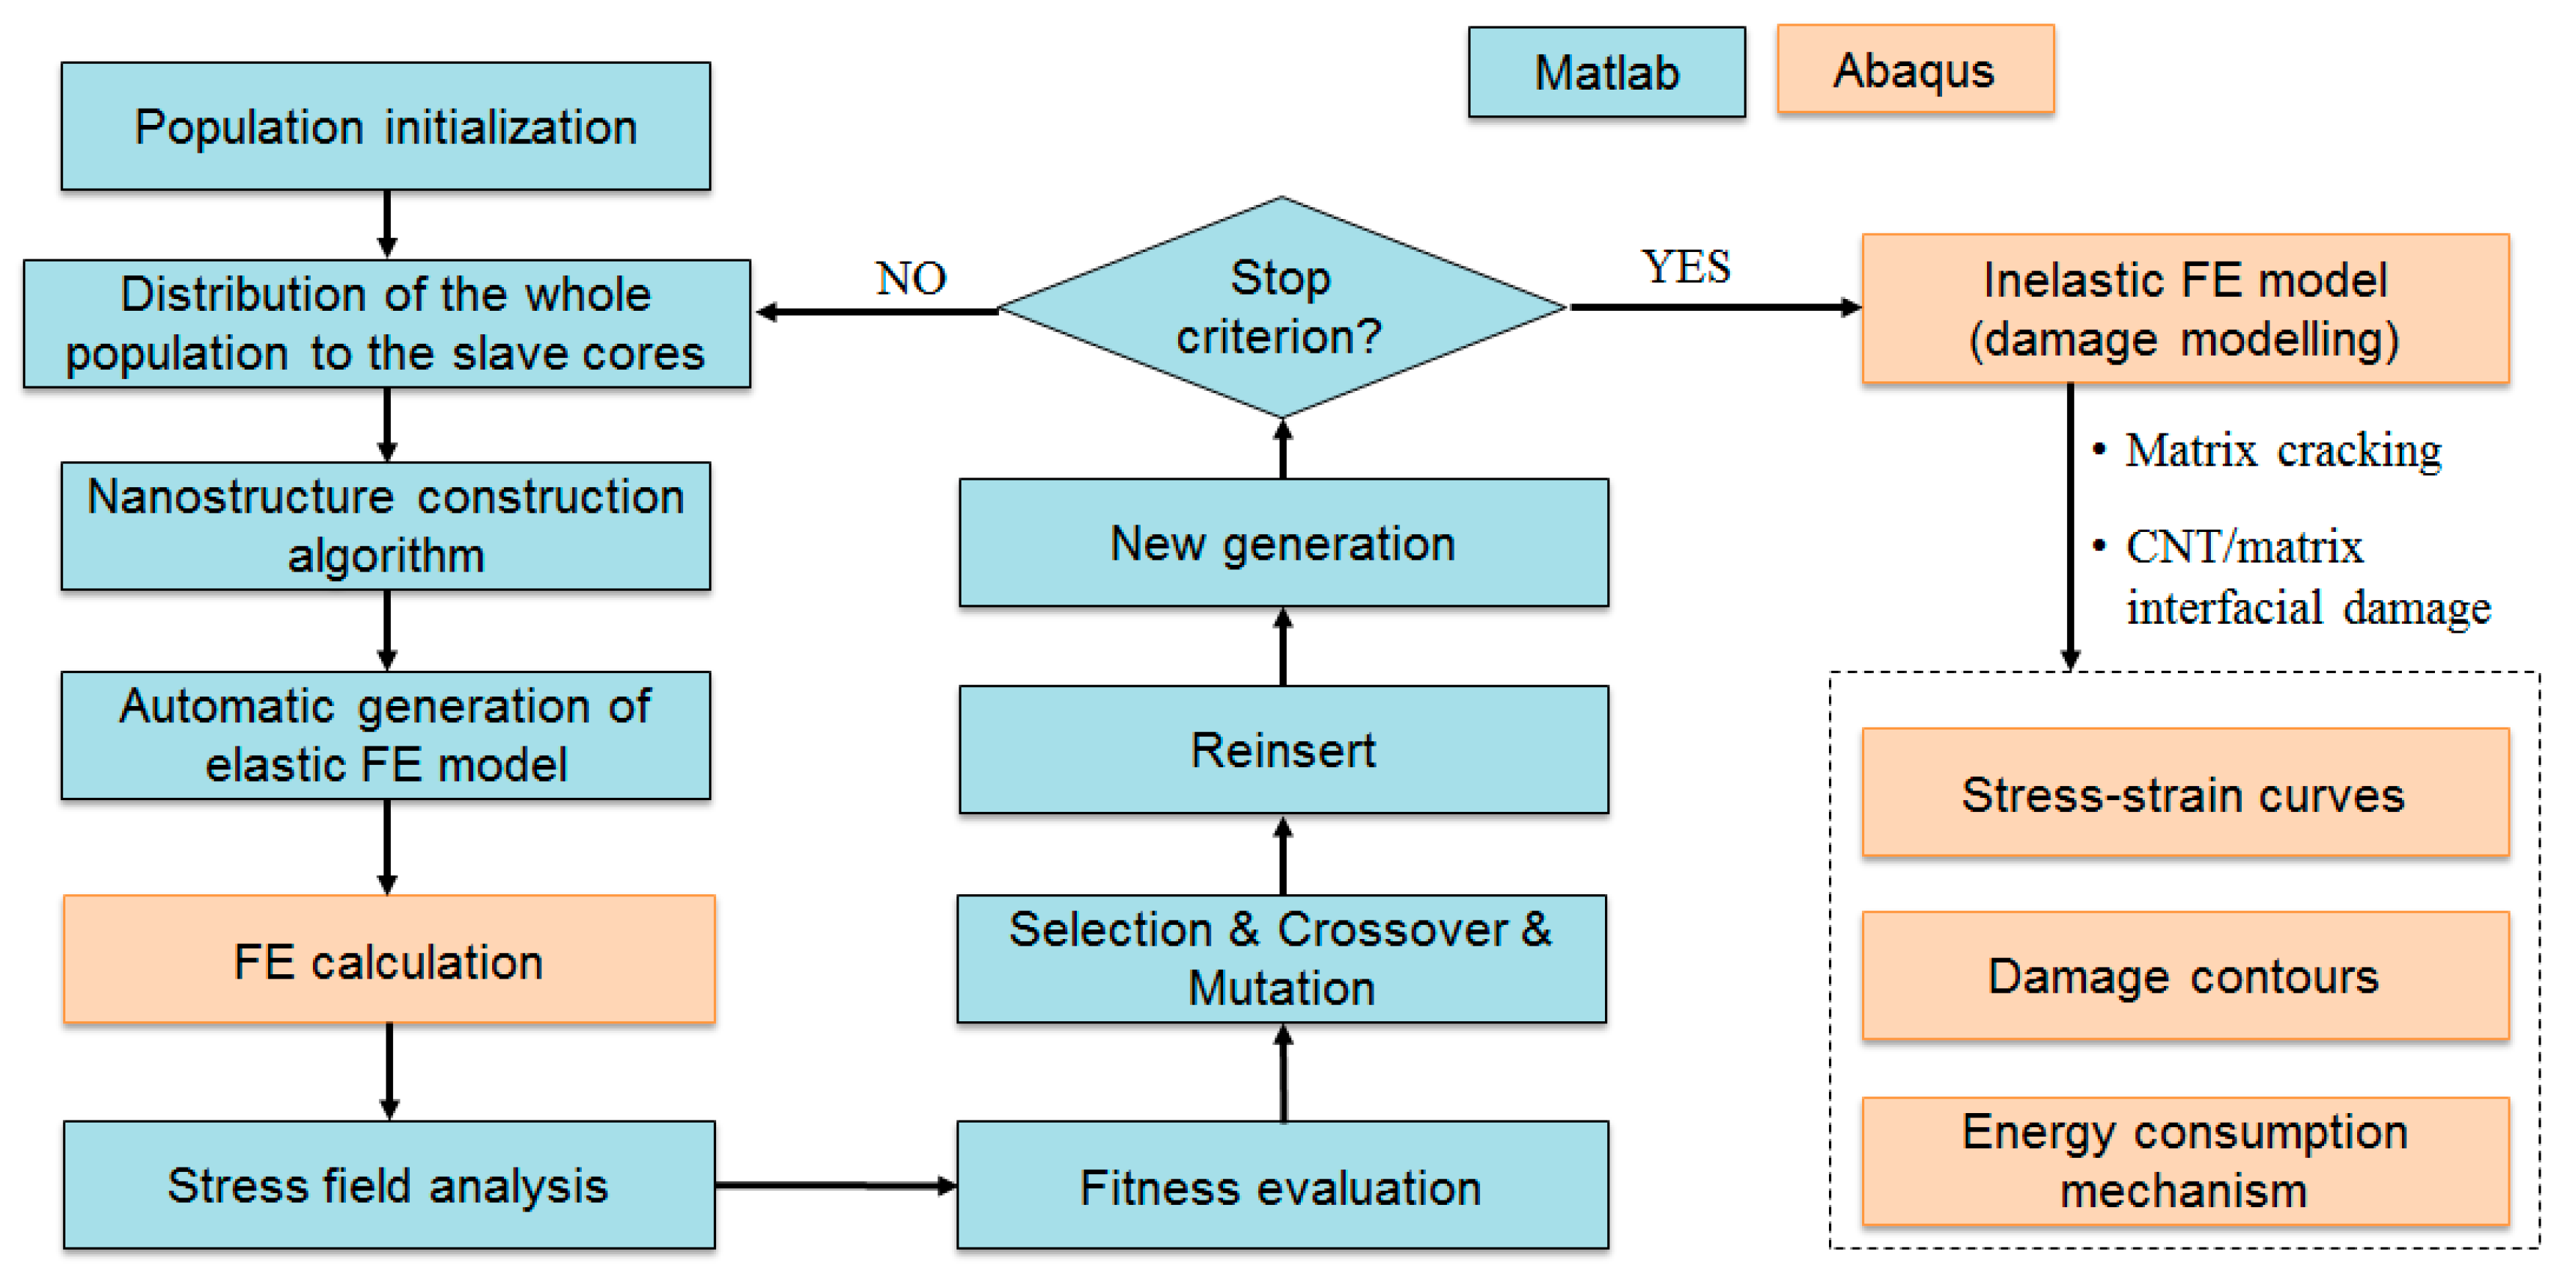
2.2. GA-FEM Optimization Tool

The implementation of the GA-FEM optimization tool is shown in Figure 2. In the context of GA optimization, a possible spatial and orientation distributions of CNTs is called “a chromosome”, which is stored as a vector. At the beginning of an optimization, a certain number of chromosomes are randomly generated (i.e., population is initialized) so that the solution space can be large enough. A GA optimization process updates the chromosomes by the selection, crossover, and mutation, which are based on the mathematical operations of a set of vectors. To establish the link between a vector and a realistic CNT-network morphology, the nanostructure construction algorithm proposed in [39] is adopted in this work. After the information carried by a chromosome is ‘translated’ into a CNT network with specific spatial and orientation distributions, a corresponding finite element (FE) is built and the model is run in Abaqus to obtain the stress field. In order to differentiate the FE model used here and that for toughness estimation, the former is named as elastic FE model and the latter as inelastic one in the flowchart. That is, for the former, only the elastic constitutive laws are activated for the constituent materials.
As shown in Figure 2 after the values of λ are estimated over a generation of chromosomes, the chromosomes with lower λ (i.e., higher fitness) are selected to create new chromosomes in the next generation. As for these selected chromosomes, a small percentage of elites that have the lowest λ are kept unchanged and transferred to the next generation, and others are performed by crossover and mutation functions to update the new remaining chromosomes (the step “reinsert”). More details about the two functions and some other terminology in GA can be found in [38]. The optimization process continues until the best and the mean fitness of the population cannot be further significantly improved. The best solution that has the lowest λ is chosen to build an inelastic FE model incorporating two mechanisms, i.e., the ductile damage in the matrix and CNT/matrix interfacial debonding. The former mechanism is further described in the next section. The modelling of the latter is realized by an explicit introduction of the CNT/matrix interface based on the combination of embedded element technique and cohesive elements proposed in our previous work [32,33]. The effects of the CNT-network morphology are finally investigated in terms of the stress-strain curves, damage contours, and relative contribution of different deformation mechanisms to energy consumption.
The size of population is set as 200 to guarantee that GA works in a sufficiently large search space. The portion of elites is 5%, and the probabilities of the crossover and mutation are taken as 0.7 and 0.25, respectively. For the estimation of λ in Equation (1), the values of σth and p are taken as σth = 10 MPa and p = 2, respectively. For both elastic and inelastic FE models, periodic boundary conditions are applied in y and z directions. The boundary condition in the x direction is applied as normal stress σ0 = 10 MPa in the case of the elastic FE model, and as a tensile displacement in the case of the inelastic model. The value of the displacement is increased to obtain the complete stress-strain diagram of the material.

2.3. Constitutive Model and Material Parameters

In the elastic FE model, it is assumed that all constituents are elastic and free of damage, and the bond between CNTs and matrix is perfect.
Fiber and CNTs are still considered to be elastic in the inelastic FE model due to their relatively high tensile strength. The matrix is assumed to follow the material behavior of a polymer and described by a ductile damage model developed in [40]. The yield criterion is expressed as:
Φ ( σ ,   σ t ,   σ c )   =   6 J 2   +   2 I 1 ( σ c σ t ) 2 σ c σ t
where σ is a stress tensor, I1 is the first invariant of the stress tensor, and J2 is the second invariant of the deviatoric stress tensor, σt and σc are the tensile and compressive yield stresses. Damage is initiated in the matrix when the maximum principal stress exceeds the tensile strength, XT, and failure occurs when the strain energy release rate reaches the fracture energy, Gm_c..The CNT/matrix interfacial behavior is assumed to follow a bilinear traction-separation law. The initial response is expressed as the linear relationship with a stiffness, K,
τ i = K i δ i , i = n ,   s ,   t
where τ i and δ i represent the interfacial stress and displacement in the three directions, n, s, and t, respectively. The damage initiation is governed by a quadratic-stress criterion, i.e.,
( τ n S n 0 ) 2   +   ( τ s S s 0 ) 2   +   ( τ t S t 0 ) 2 = 1
where < > is the Macaulay brackets with <x> = max(0, x), and S n 0 , S s 0 and S t 0 represent the respective interfacial shear stresses (IFSs). The failure of the fiber/matrix interface (i.e., complete debonding) is controlled by the respective fracture energies corresponding to normal and shear tractions, G n , G s and G t .
The Young’s modulus and Poisson’s ratio of CNTs are 475 GPa and 0.35, respectively, the same as those reported in [34]. The two values are set as 100 GPa and 0.3 for fiber, and 5 GPa and 0.4 for the matrix [41]. The tensile yield strength, compressive yield strength, tensile strength, and fracture energy of the matrix are taken as 50 MPa, 67 MPa, 100 MPa, and 1.0 J/m2, respectively, by referring to [40]. Up to now, there is still no definitive experimental data for CNT/matrix interfacial properties in the normal direction, which are assumed to be the same as those in the shear direction in this work. Based on the experimental data in [42], the CNT/matrix interfacial strength and fracture energy are taken as 75 MPa and 0.9 J/m2.

3. Results and Discussions

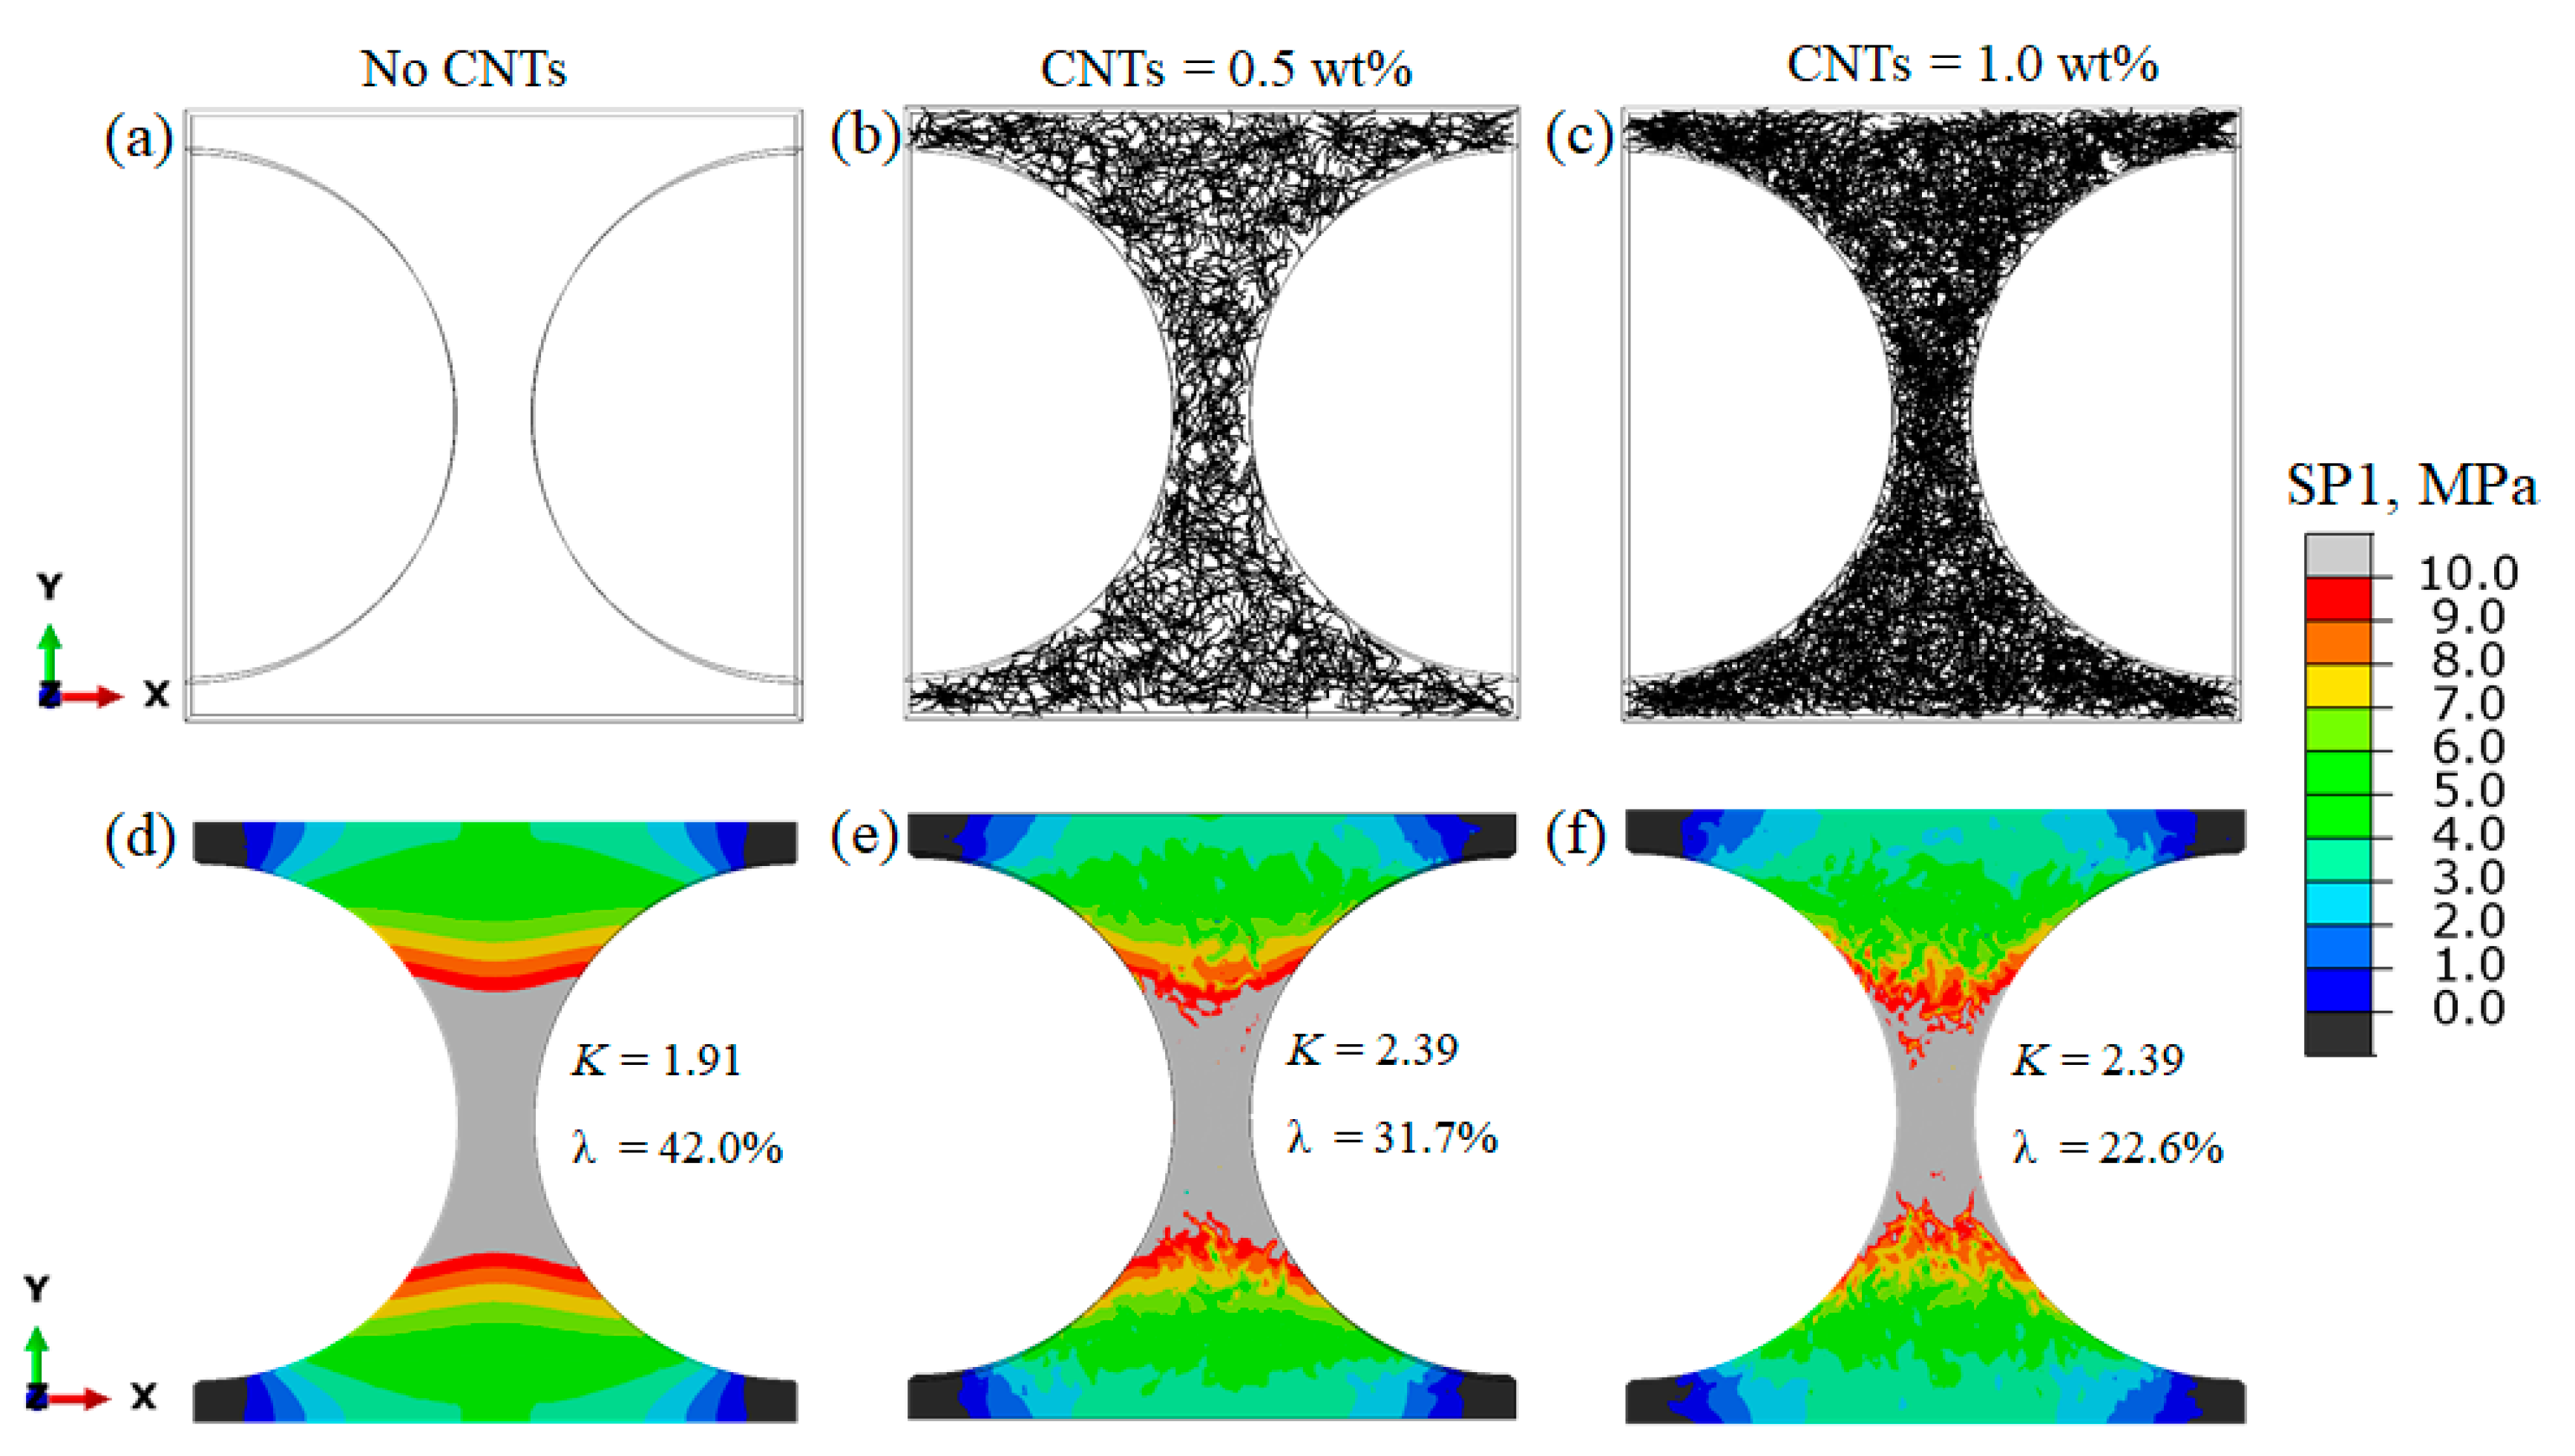
3.1. Effects of CNT-Network Morphology on Elastic Stress Field

In order to demonstrate the effects of CNT-network morphology on stress distribution in the matrix, two reference cases are considered: the pristine FRC (without CNTs, Figure 3a) and the FRCs with CNTs homogeneously dispersed in the matrix (i.e., Figure 3b,c corresponding to CNT contents of 0.5 wt% and 1.0 wt%, respectively). The stress distribution in the matrix is shown in Figure 3d–f for the three cases, respectively. The CNT-network morphology and stress fields are shown in a two-dimensional (2D) view for clarity, but all the models are three-dimensional (3D).
Figure 3d–f shows fields of the maximum principal stress in the matrix, noted as SP1. Stresses in the fibers and CNTs are not shown because they are not a focal point of this study. The matrix domain where the maximum principal stress is larger 10 MPa, i.e., the applied average stress, is referred to as an over-stressed region and is shown by grey color. The region under compressive stress (i.e., SP1 is smaller than 0 MPa) is indicated by black color. For comparative analysis, the same color legend is used for Figure 3d–f. Compared with the pristine FRC, the homogenously distributed CNTs increase the stress concentration factor, K, implying that CNTs serve as stress risers in this particular case. In contrast, the volume of the over-stressed region in the matrix is reduced in the hierarchal composites and this reduction becomes more significant as CNT content increases. This is not surprising as the homogeneously distributed CNTs contribute to load transfer along with the matrix. The overstressed volume λ is still up to 22.6% even with the CNT content as high as 1.0 wt%, while λ is 42% in the case of pristine FRC.
The GA-FEM tool introduced in Section 2 optimized the CNT position and orientation to effectively suppress the stress concentrations. The results are shown in Figure 4a,b corresponding to CNT contents of 0.5 wt% and 1.0 wt%, respectively. In both cases, CNTs in an optimal solution tend to aggregate in the region between the two fibers, where stress level is higher than in other regions in the pristine FRC. With the increase of CNT content, larger regions are occupied by CNTs and the over-stressed volume is further decreased. In the case of 0.5 wt% shown in Figure 4a almost all CNTs agglomerate in a narrow region between the two fibers where stresses are the highest, while in the case of 1.0 wt% shown in Figure 4b CNTs also form two secondary agglomerates away from the region of high concentration, which contains a smaller amount of CNTs. Most CNTs inside the main agglomerate are orientated in the loading direction, i.e., parallel to x direction, which improves the load transfer efficiency from the matrix to these CNTs.
Compared to the reference cases in Figure 3, it is clear that the two optimal CNT networks much more effectively suppress stress concentrations in the matrix. The stress concentration factors are reduced from 1.91 for the pristine case to 1.49 and 1.27 for the optimal CNT networks with 0.5 wt% and 1.0 wt% contents, respectively. More significant reductions are obtained for the over-stressed volume, λ, namely 4.5% for the network containing 0.5 wt% of CNTs and close to 0% for case of 1.0 wt% of CNTs. It is interesting to note that the secondary agglomerates are not close to the main one, but are located in the regions where the stress is relatively low in the pristine FRC.

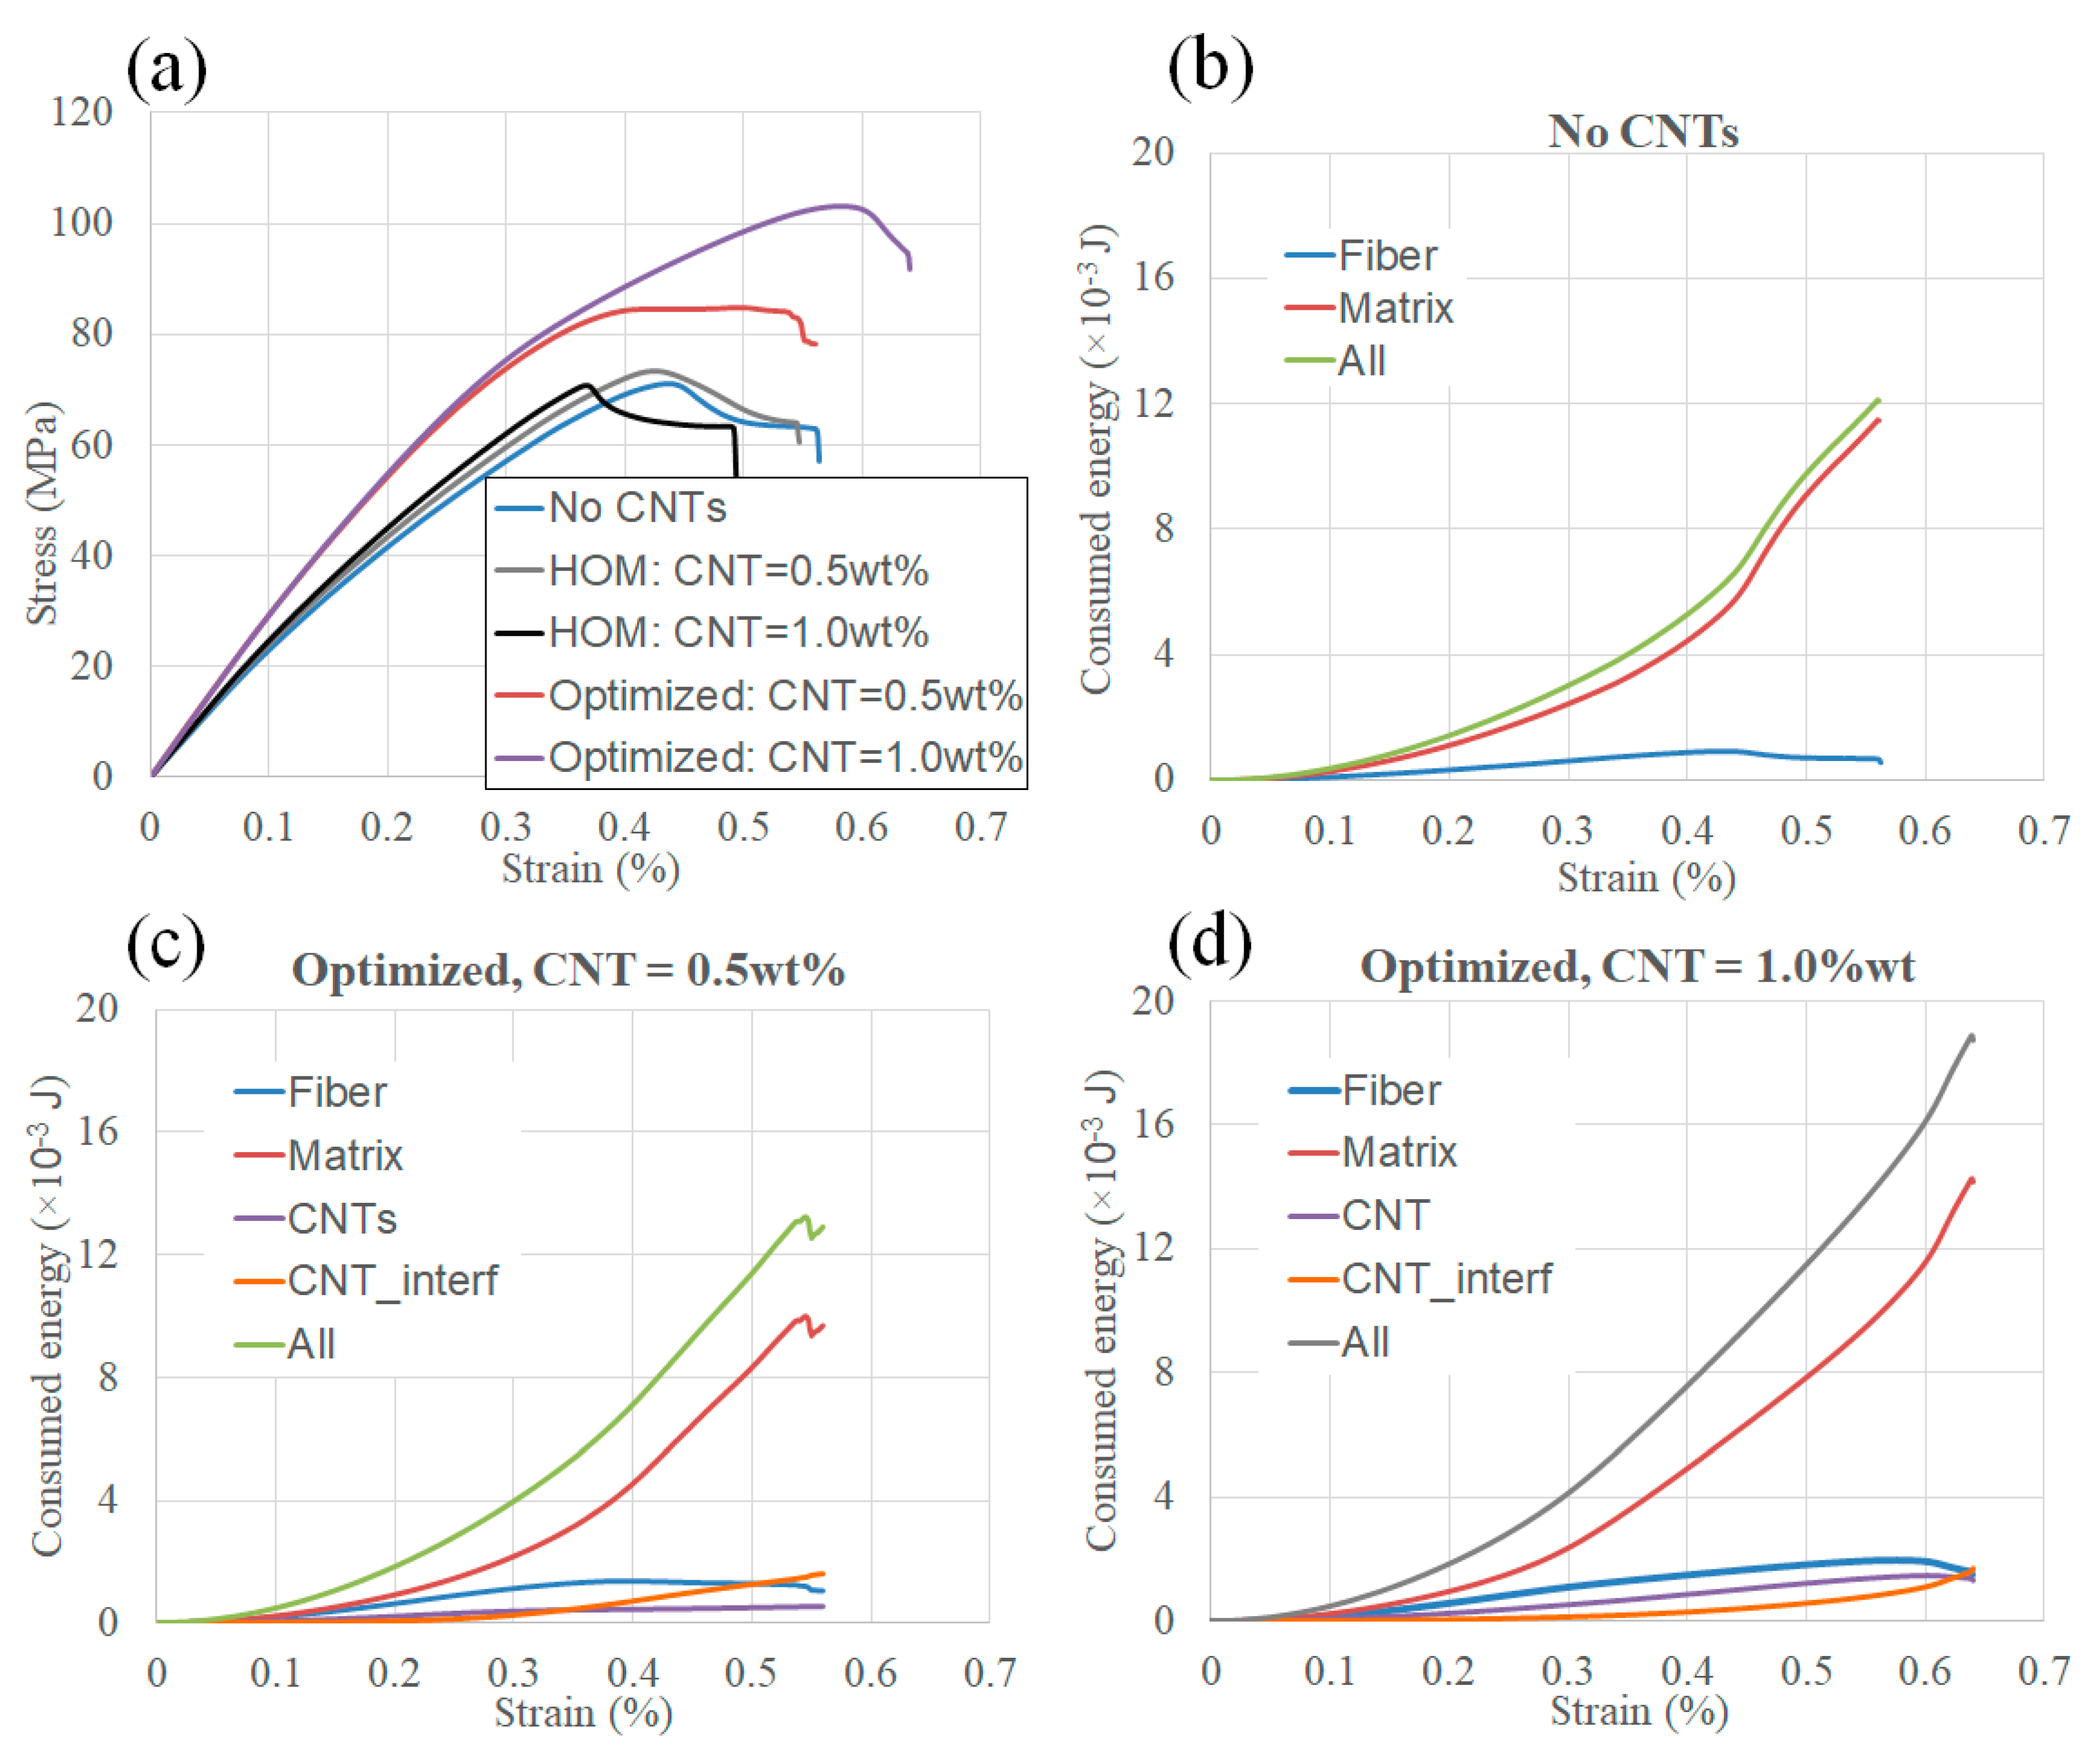
3.2. Effects of CNT-Network Morphology on Stiffness, Strength and Toughness and Underlying Mechanisms

In this section the behavior of the composites and their properties like stiffness, strength, and toughness are investigated using the inelastic FE model introduced in Section 2.
Figure 5a shows the effective stress-strain curves of the pristine FRC, the hierarchical FRCs with homogenous CNTs distribution (denoted as HOM) and optimal CNT networks. Three parameters are defined to represent overall mechanical properties of the pristine and hierarchical FRCs: the apparent stiffness (defined as a slope of the linear part of the curve), strength (as a peak value of the stress), and toughness (as an area under the stress-strain curve), all of which are listed in Table 1. Compared to the pristine FRC, 0.5 wt% and 1.0% homogenously distributed CNTs lead to 6% and 7% increase of the stiffness, respectively. When CNT-network morphology is optimized, the stiffness is increased by 28% and 26%, respectively.
The advantage of having an optimized CNT network is also demonstrated for the tensile strength and toughness of the hierarchical composites. Compared to the pristine FRC, 0.5 wt% of homogenously distributed CNTs lead to 6% increase in the tensile strength and slight decrease in the failure strain. The toughness of the hierarchical FRC is nearly the same as that of the pristine one. By contrast, the optimal network made by 0.5 wt% CNTs increases the composite strength by 22% and the toughness by 26%.
When the content is 1.0 wt%, the homogenously distributed CNTs result in a 2% increase in strength but 13% decrease in the toughness compared to pristine FRC. After the network morphology is optimized, dramatic improvements are observed for both composite strength and toughness, which are 49% and 65%, respectively. Consequently, the CNT network with optimized spatial position and orientation of CNTs is far more efficient in the strengthening and toughening of the composite than homogeneously distributed CNTs.
To understand the source for the significant increase in the strength and toughness arising purely from the optimization of CNT networks, the strain energy consumed by different constituent materials is plotted in Figure 5b–d. In Table 2, the difference of the strain energy consumed by the four studied hierarchical FRCs relative to that of the pristine FRC is given. Meanwhile, the contribution to the total variation of strain energy from the Ith constituent material (vI) is also provided, i.e.,
v I = Γ H i e r I Γ p r i s I Γ p r i s 0 × 100 %
Here Γ p r i s 0 is the total strain energy of pristine FRC, Γ H i e r I and Γ p r i s I are the strain energies consumed by the constituent material I of the hierarchical and pristine FRCs, respectively. Without further specification in the following, the value (in percent) related to a constituent material has the same definition as Equation (6).
For the homogenously distributed CNTs, additional energy consumption by CNTs’ deformation and CNT/matrix interfacial debonding is noted. However, the matrix, which plays an important role in toughening, consumes much less strain energy in this case leading to the decrease in the failure strain and toughness compared to the pristine FRC. This is not surprising because CNTs are stress risers in the matrix. The matrix in the CNT-reinforced region fails earlier than pure matrix when it is under the same load. That is also the reason for why the toughness of CNT nanocomposite (where CNTs are the only reinforcements) becomes lower when CNT content increases as revealed by both experiments and simulations [32]. For the hierarchical FRC reinforced by the optimal CNT network with a content of 0.5 wt%, the strain energy consumed by the two nano-scale mechanisms, i.e., CNTs’ deformation and CNT/matrix interfacial debonding, is much higher than that in the case of homogenously distributed CNTs. Therefore, the optimal CNT network with 0.5 wt% CNTs improves the composites toughness compared to the pristine FRC. Interestingly, the optimal CNT network with a content of 1.0 wt% enhances the energy consumption by engaging mechanisms in the matrix, which finally result in a higher improvement of the toughness.
In order to better understand the improvements in strength and toughness due to the presence of CNTs, it is necessary to investigate local phenomena occurring in the composites. These local phenomena could provide insights into the mechanisms employed by the material to delay initial damage and to delay localization of the macroscopic damage leading to failure. Figure 6 shows damage contours in the matrix and at the interface at different loading levels for the pristine FRC and the hierarchical FRC reinforced by homogeneously distributed CNTs with a content of 0.5 wt%. As the increasing CNT content has no significant effects on the damage evolution when CNTs are homogenously distributed, the contours for the case of 1.0 wt% CNT content are not shown. In the pristine FRC, Figure 6a, damage initiates in the matrix region between the two fibers. It is driven by the stress concentration due to the stiffness mismatch between the fiber and the matrix. The damaged zone continuously expands with the increase of applied strain until it localizes into a band, connecting fibers at 45° to the horizontal direction. Formation of the band reduces the stress transfer in the matrix, which is necessary to achieve a higher strength. Thus, the delay in localization of the damage band is needed in order to achieve significant improvements in the strength and toughness. The homogeneously distributed CNTs do not change the stress distribution significantly: the composite shows similar damage patterns in the matrix as the pristine one (Figure 6b). Due to the lower strength of the CNT/matrix interface (75 MPa) compared to that of the matrix (100 MPa), the damage at CNT/matrix interface is activated earlier than that in the matrix (Figure 6c). Only a small portion of CNTs locates in the domain where the damage in the matrix occurs. CNT debonding and matrix cracking have, thus, very weak interactions. CNTs’ effect on the damage localization in the matrix, contribution to energy absorption through debonding, and as a result, to the load capacity of the homogenous CNTs-reinforced FRCs are limited.
For the optimized hierarchical FRC reinforced by 0.5 wt% CNTs, the damage contours in the matrix and CNT/matrix interface corresponding to different strain levels are shown in Figure 7. Damage in the matrix initiates at a similar location as in the pristine FRC, but develops at a different angle to the loading direction, namely at 90° instead of 45°. As CNTs almost fully concentrate between the two fibers, they bridge the fibers and result in a remarkable stiffening effect. In the meantime, the locally concentrated CNTs greatly enhance interactions between the matrix cracking and CNT interfacial debonding, i.e., crack bridging mechanism. In other words, more CNTs are engaged when failure takes place in the matrix, and a stress plateau is observed on the stress-strain curve in Figure 5a. In this case, the energy consumed by CNTs’ deformation and interfacial debonding is substantial, it is about 28% higher than that in the case of homogenously distributed CNTs. In summary, the data in Figure 7 and Table 2 indicate that the morphological optimization of the CNT network with a content of 0.5 wt% enhances the crack bridging mechanism, and improves toughness primarily by CNT interfacial debonding.
Figure 8 shows the damage contours in the matrix and CNT/matrix interface for the hierarchical FRC reinforced by the optimal CNT network with a 1.0 wt% content. In contrast to the reference cases and the optimized hierarchical composites with 0.5 wt% CNTs, the damage in the matrix initiates and develops in a very different way. Damage starts at four locations around the fibers simultaneously at a strain of 0.25% as shown in Figure 8a, and then develops along the interface between the fiber and matrix. It is not localized but diffused. Such a mechanism has been not observed in the reference FRCs and the optimized FRC with 0.5 wt% CNTs. The distributed damage can also be clearly seen at the CNT/matrix interface as shown in Figure 8b.
As noted in Table 2, the optimal network with 1.0 wt% CNTs has resulted in additional 39% increases in toughness compared to the case with 0.5 wt% CNTs. One may attribute this additional improvement to the enhanced mechanisms of energy consumption at the nano-scale. However, CNTs’ deformation and interfacial debonding lead to only 28% toughness increase for 1.0 wt% CNT content, and 30% for 0.5 wt% content. That is, the nano-scale energy consumption mechanisms are not enhanced when the content of optimal CNT network increases. Instead, increasing CNT content from 0.5 wt% to 1.0 wt% enhances the energy consumption by matrix significantly, which makes the toughness of the optimized hierarchal FRC further increase by 38% relative to that of the pristine FRC. Therefore, mechanisms engaged by the matrix make a dominant contribution to the total toughness improvement (i.e., 39%) arising from the increase of CNT content. According to Figure 8b, it can be inferred that the substantial increase in energy consumed by matrix is due to the damage diffusion mechanism. This mechanism further compliments the crack bridging identified earlier (which is related to the CNTs’ deformation and interfacial debonding).
In summary, in order to design high-performance composites with excellent strength and toughness, an efficient approach is to introduce a nanostructural network that would promote delocalization (diffusion) of damage in the matrix. This additional mechanism increases the energy consumed by the matrix substantially. This goal, however, can be only achieved when the CNT content is high enough (for example, 1.0 wt% in this work) and the network morphology is optimized. The GA-FEM optimization tool developed in this study provides one such approach.

4. Conclusions

In this work, we have explored whether the strength and toughness of CNT-reinforced hierarchical composites can be improved by optimizing the CNT-network morphology. To achieve this goal, a modelling design tool is developed by combining GA and FEM to optimize CNTs’ positions and orientations. The network is predicted based on the minimization of stress concentrations in the matrix. This was a compromise as performing optimization based on the toughness criterion would require significant computational resources. After an optimal CNT network is obtained, its effectiveness is evaluated by modelling the composite behavior in full, which further justifies the design principle proposed in this work. Key conclusions are summarized as follows:
  • The optimal CNT networks have a suppressing effect on the stress concentrations in the matrix, while the homogenously distributed CNTs produce negligible effects on the overstressed region, even when CNT content is high.
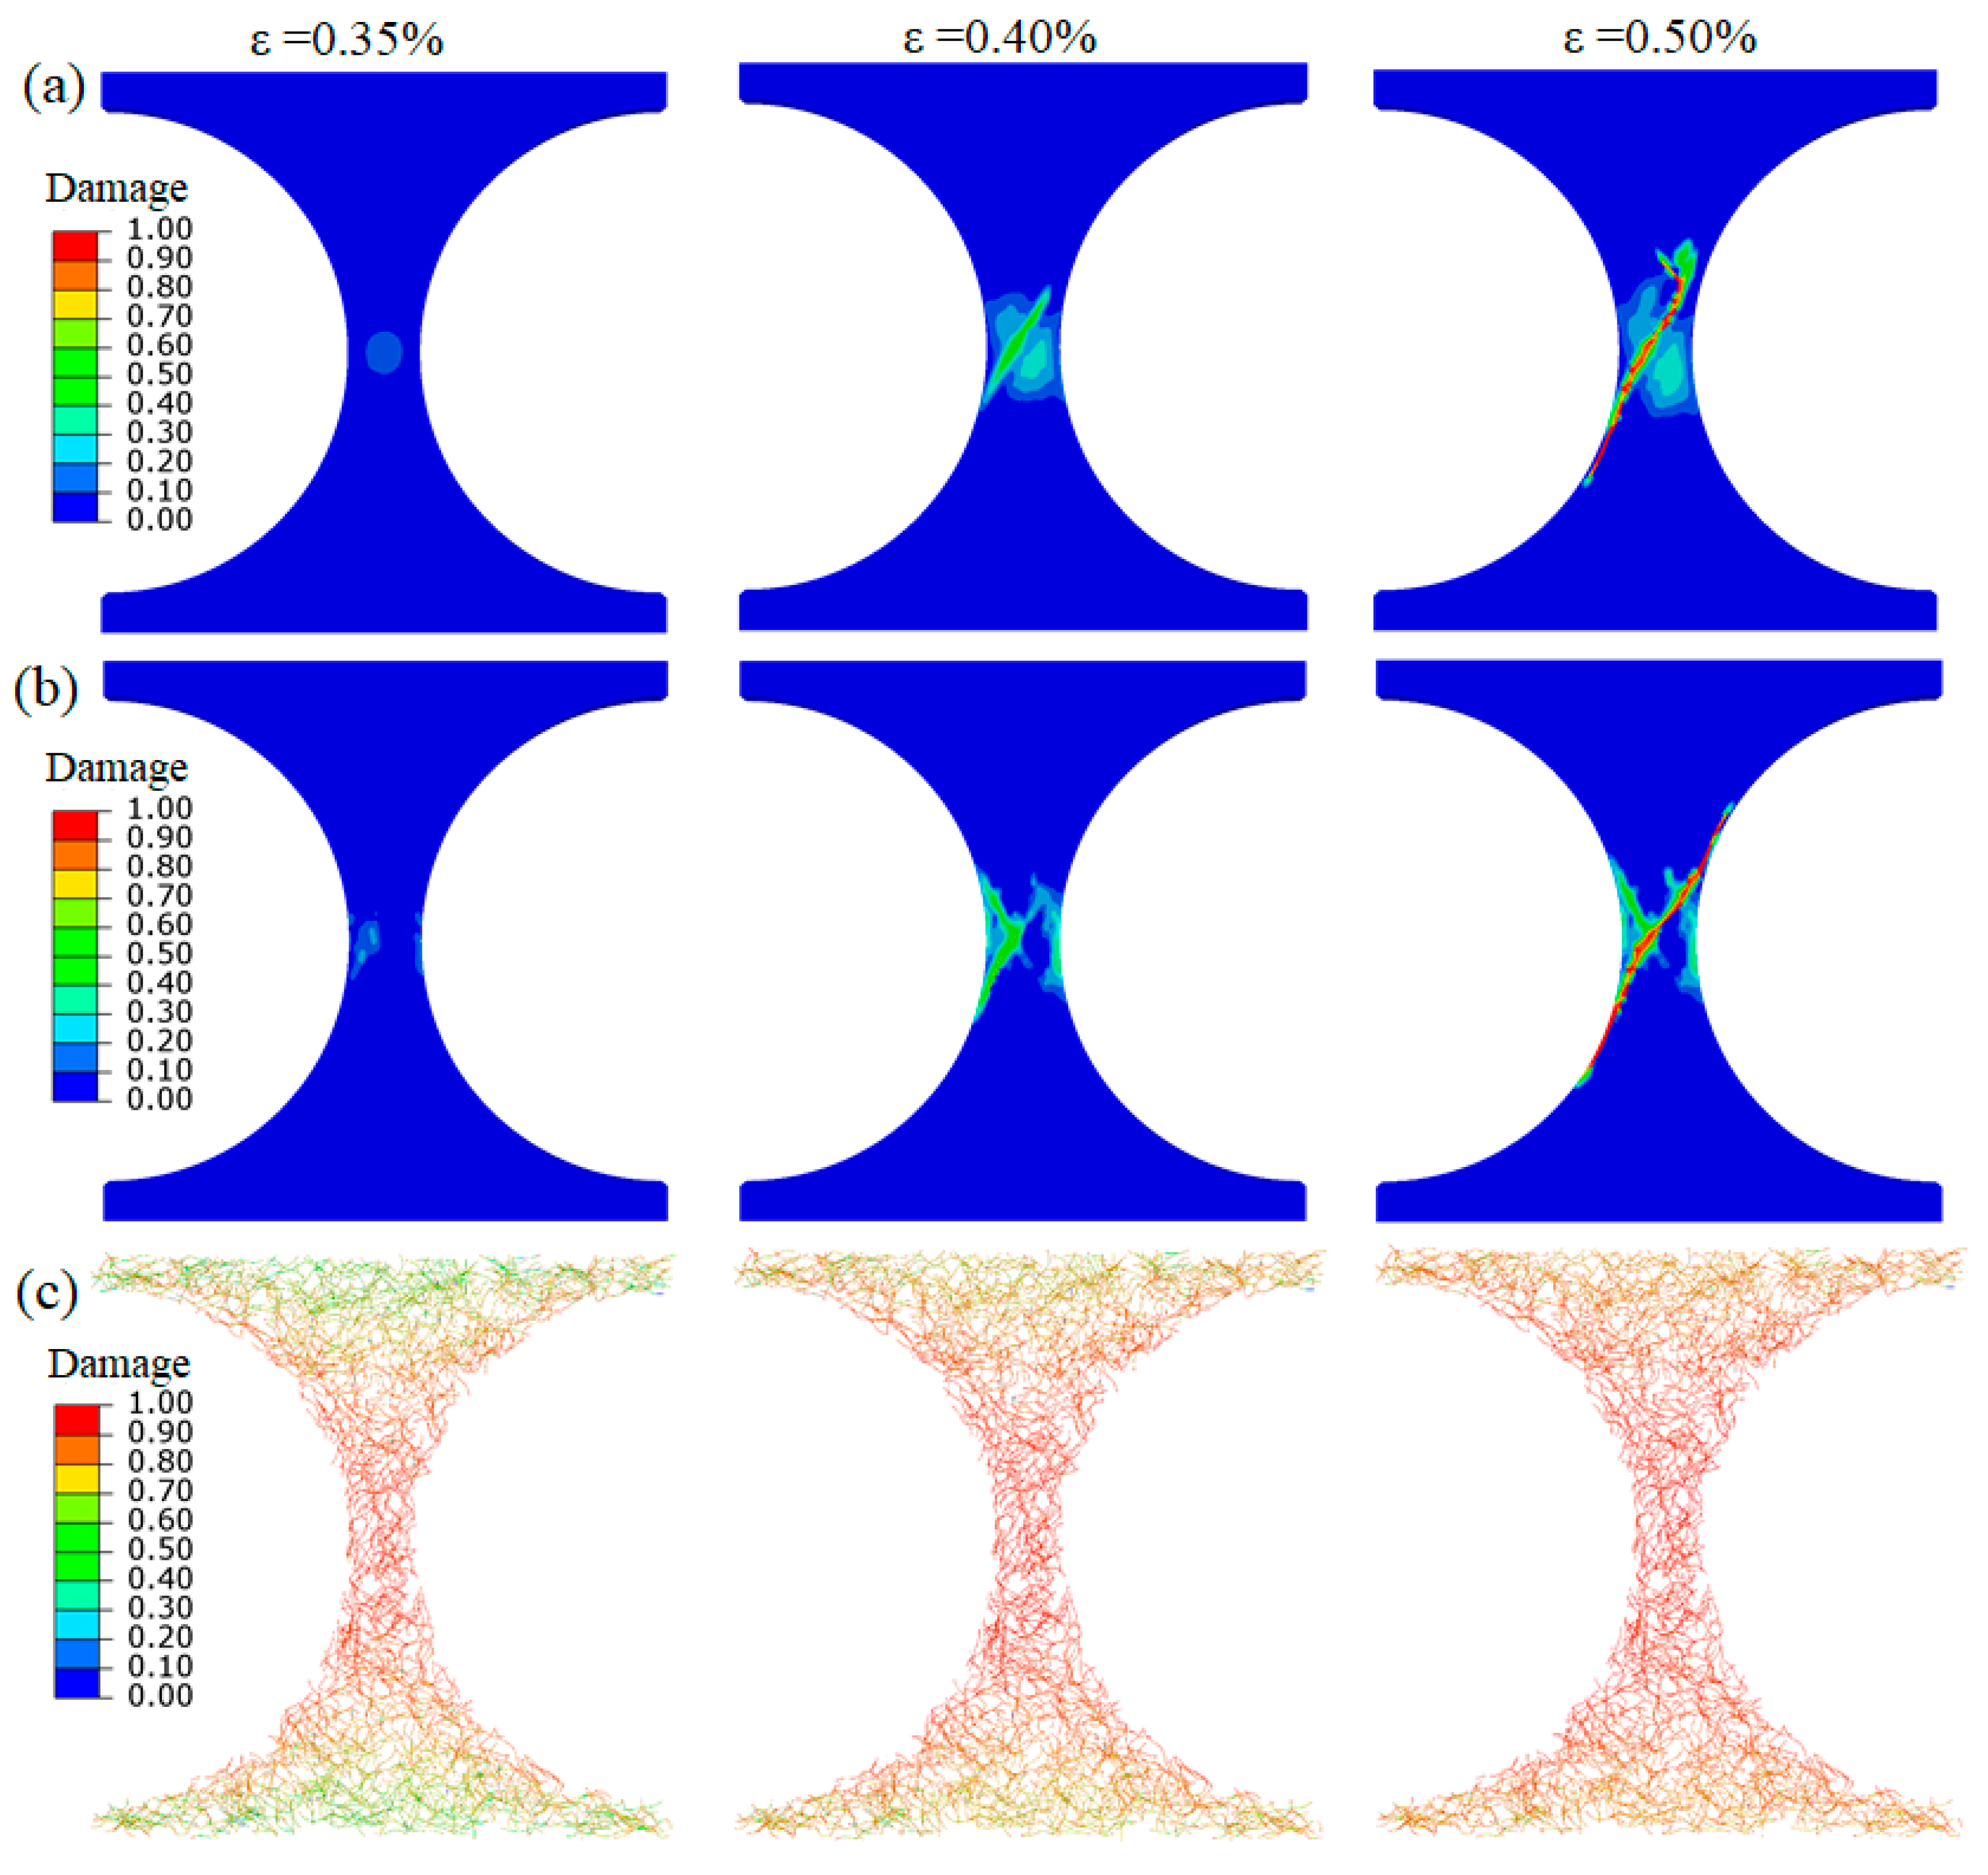
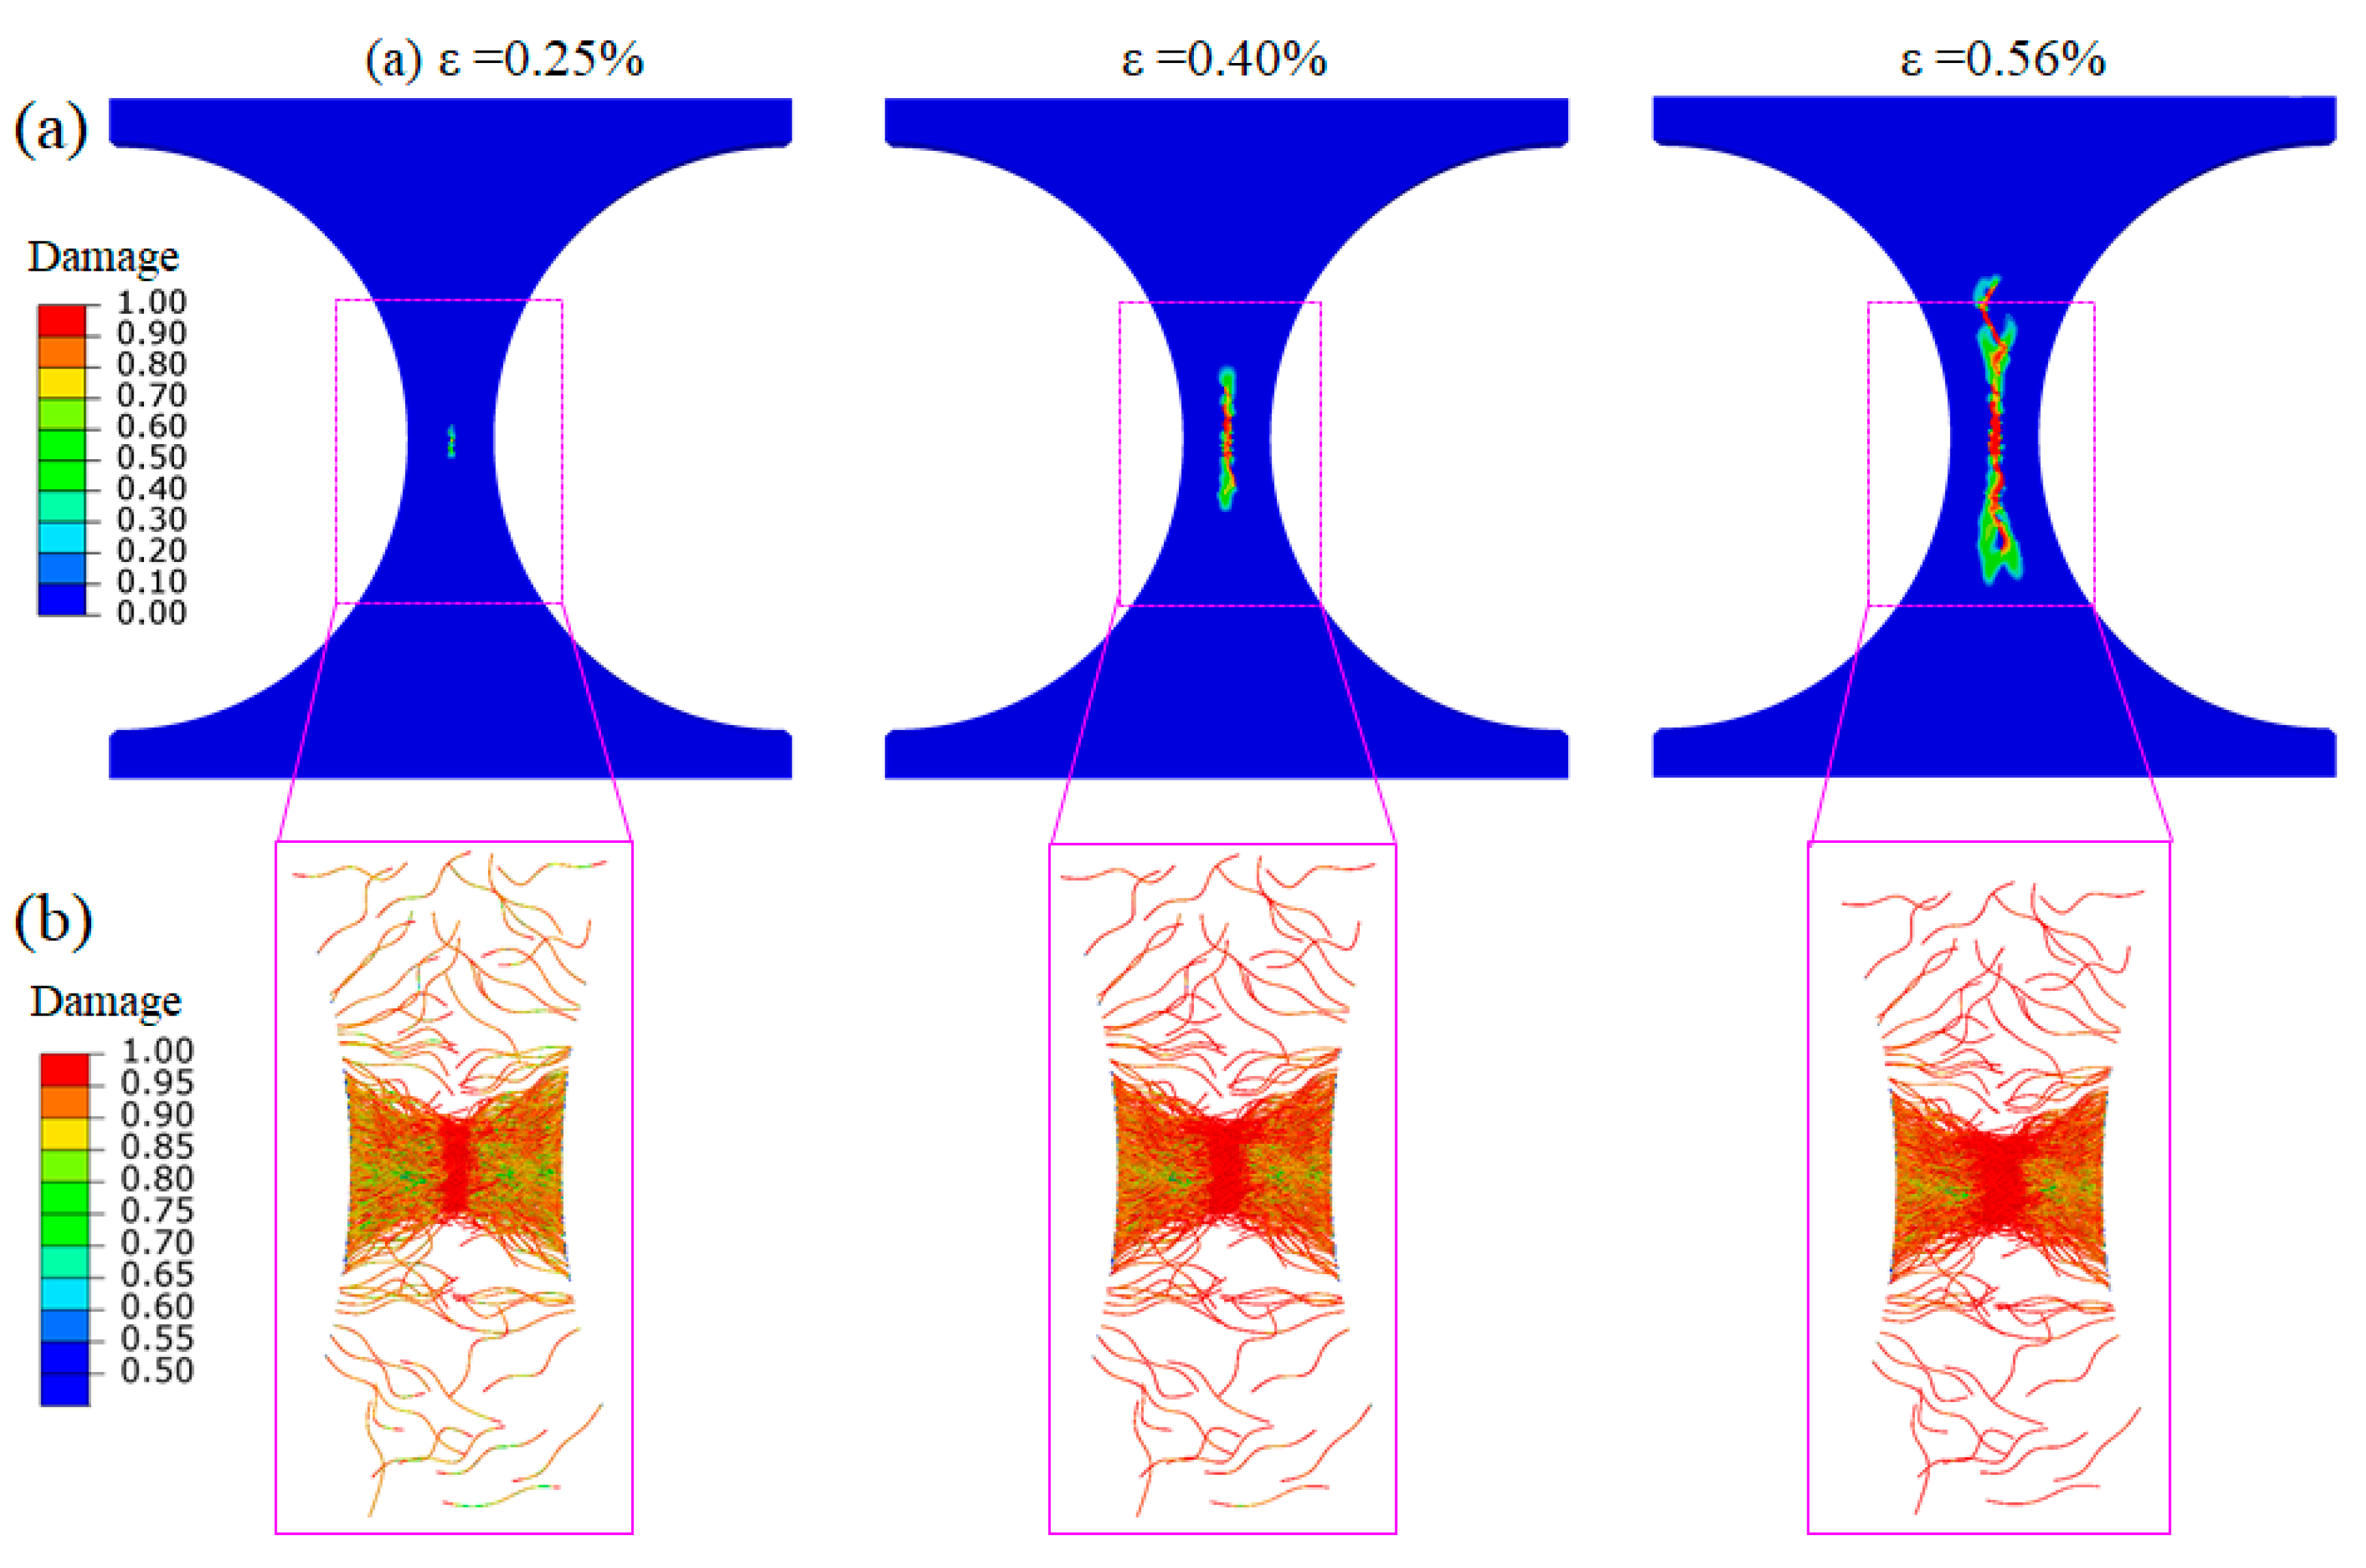
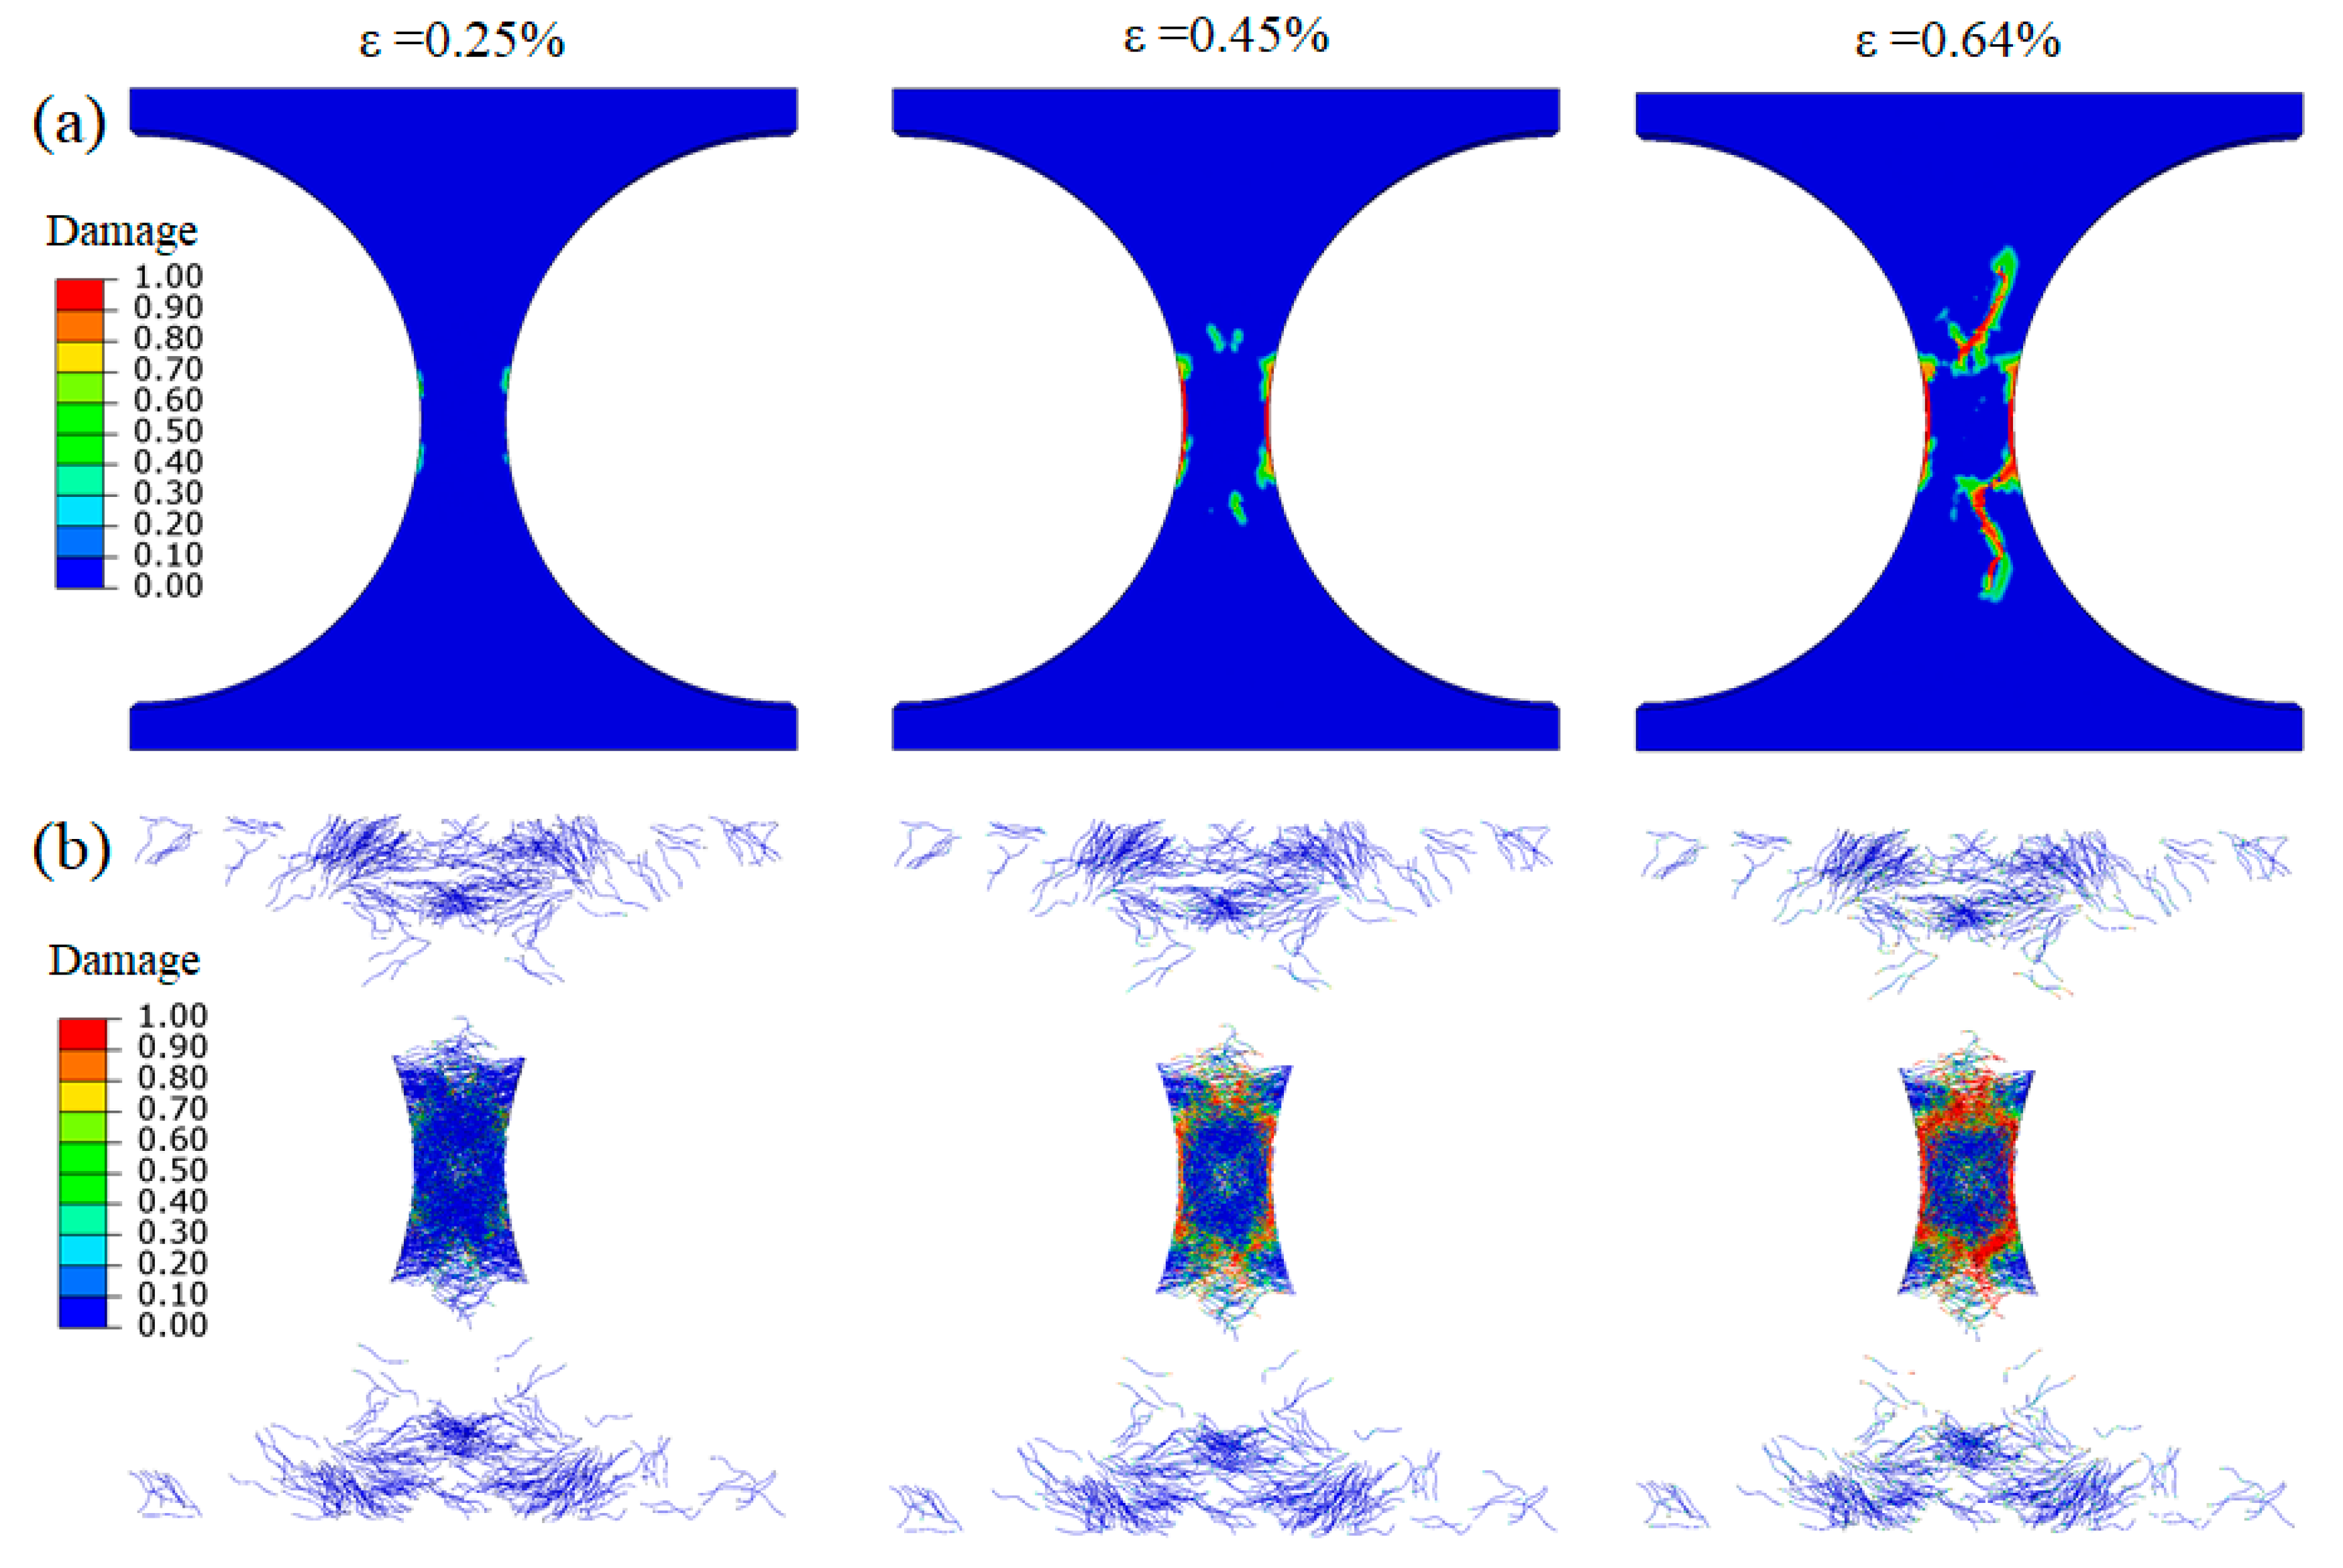
  • Two types of damage mechanisms, i.e., crack bridging (nano-scale) and damage diffusion (micro-scale), are observed in the models. Activation of the damage diffusion is shown to lead to large improvements in the strength and toughness of FRCs. This mechanism further compliments the well-known crack bridging mechanism.
  • Activation of the two damage mechanisms depends on the network morphology of CNTs. In composites with homogenously distributed CNTs, crack bridging is limited and damage diffusion is absent. Therefore, the increase in the composite strength is small in this case, while the toughness even decreases. In composites with optimized CNT distribution and orientation but low CNT content, the mechanism of crack bridging is enhanced, leading to moderate increases of strength and toughness. In composites with an optimized network morphology and higher CNT content, damage diffusion is activated, as yet another mechanism for energy consumption. The diffuse matrix cracking results in significant improvement on the strength and toughness of FRCs.
  • The present modelling results indicate that suppression of stress concentrations in the matrix using CNTs is a viable design principal for strengthening and toughening FRCs. Our work supports recent experimental evidence [10,11] on the critical role of the CNT-network morphology, which extends the design space for CNT-reinforced hierarchical FRCs.

Author Contributions

Conceptualization, Q.L. and L.G.; methodology, Q.L.; investigation, Q.L.; writing—original draft preparation, Q.L.; writing—review and editing, L.G., S.V.L.; visualization, Q.L.; supervision, L.G., S.V.L.; funding acquisition, L.G., S.V.L. All authors have read and agreed to the published version of the manuscript.

Funding

This research was funded by KU Leuven projects, grant numbers C24/16/021 and C24/17/052.

Acknowledgments

The research has received funding from KU Leuven in the framework of the C2 PERMEA C24/16/021 and C24/17/052 projects. S.V. Lomov holds Toray Chair for Composite Materials in KU Leuven, support of which is gratefully acknowledged.

Conflicts of Interest

The authors declare no conflict of interest.

References

  1. Meyers, M.A.; McKittrick, J.; Chen, P.-Y. Structural biological materials: Critical mechanics-materials connections. Science 2013, 339, 773–779. [Google Scholar] [CrossRef] [PubMed] [Green Version]
  2. Wegst, U.G.; Bai, H.; Saiz, E.; Tomsia, A.P.; Ritchie, R.O. Bioinspired structural materials. Nat. Mater. 2015, 14, 23–36. [Google Scholar] [CrossRef] [PubMed]
  3. Zakaria, M.R.; Akil, H.M.; Kudus, M.H.A.; Ullah, F.; Javed, F.; Nosbi, N. Hybrid carbon fiber-carbon nanotubes reinforced polymer composites: A review. Compos. Part B 2019, 176, 107313. [Google Scholar] [CrossRef]
  4. Zhang, Y.; Heo, Y.-J.; Son, Y.-R.; In, I.; An, K.-H.; Kim, B.-J.; Park, S.-J. Recent advanced thermal interfacial materials: A review of conducting mechanisms and parameters of carbon materials. Carbon 2018, 142, 445–460. [Google Scholar] [CrossRef]
  5. Wagner, H.D.; Ajayan, P.; Schulte, K. Nanocomposite toughness from a pull-out mechanism. Compos. Sci. Technol. 2013, 83, 27–31. [Google Scholar] [CrossRef]
  6. Shtein, M.; Nadiv, R.; Lachman, N.; Wagner, H.D.; Regev, O. Fracture behavior of nanotube–polymer composites: Insights on surface roughness and failure mechanism. Compos. Sci. Technol. 2013, 87, 157–163. [Google Scholar] [CrossRef]
  7. Wicks, S.S.; de Villoria, R.G.; Wardle, B.L. Interlaminar and intralaminar reinforcement of composite laminates with aligned carbon nanotubes. Compos. Sci. Technol. 2010, 70, 20–28. [Google Scholar] [CrossRef]
  8. Sahoo, N.G.; Rana, S.; Cho, J.W.; Li, L.; Chan, S.H. Polymer nanocomposites based on functionalized carbon nanotubes. Prog. Polym. Sci. 2010, 35, 837–867. [Google Scholar] [CrossRef]
  9. Haesch, A.; Clarkson, T.; Ivens, J.; Lomov, S.V.; Verpoest, I.; Gorbatikh, L. Localization of carbon nanotubes in resin rich zones of a woven composite linked to the dispersion state. Nanocomposites 2015, 1, 204–213. [Google Scholar] [CrossRef] [Green Version]
  10. Liu, Y.; Wilkinson, A. Rheological percolation behaviour and fracture properties of nanocomposites of MWCNTs and a highly crosslinked aerospace-grade epoxy resin system. Compos. Part A 2018, 105, 97–107. [Google Scholar] [CrossRef] [Green Version]
  11. Abidin, M.S.Z.; Herceg, T.; Greenhalgh, E.S.; Shaffer, M.; Bismarck, A. Enhanced fracture toughness of hierarchical carbon nanotube reinforced carbon fibre epoxy composites with engineered matrix microstructure. Compos. Sci. Technol. 2019, 170, 85–92. [Google Scholar] [CrossRef]
  12. Quaresimin, M.; Schulte, K.; Zappalorto, M.; Chandrasekaran, S. Toughening mechanisms in polymer nanocomposites: From experiments to modelling. Compos. Sci. Technol. 2016, 123, 187–204. [Google Scholar] [CrossRef]
  13. Nadiv, R.; Shachar, G.; Peretz-Damari, S.; Varenik, M.; Levy, I.; Buzaglo, M.; Ruse, E.; Regev, O. Performance of nano-carbon loaded polymer composites: Dimensionality matters. Carbon 2018, 126, 410–418. [Google Scholar] [CrossRef]
  14. Eskizeybek, V.; Yar, A.; Avcı, A. CNT-PAN hybrid nanofibrous mat interleaved carbon/epoxy laminates with improved Mode I interlaminar fracture toughness. Compos. Sci. Technol. 2018, 157, 30–39. [Google Scholar] [CrossRef]
  15. De Greef, N.; Gorbatikh, L.; Lomov, S.V.; Verpoest, I. Damage development in woven carbon fiber/epoxy composites modified with carbon nanotubes under tension in the bias direction. Compos. Part A 2011, 42, 1635–1644. [Google Scholar] [CrossRef]
  16. Herceg, T.M.; Abidin, M.S.Z.; Greenhalgh, E.S.; Shaffer, M.S.; Bismarck, A. Thermosetting hierarchical composites with high carbon nanotube loadings: En route to high performance. Compos. Sci. Technol. 2016, 127, 134–141. [Google Scholar] [CrossRef]
  17. Du, C.; Li, M.; Cao, M.; Feng, S.; Guo, H.; Li, B. Enhanced thermal and mechanical properties of polyvinlydene fluoride composites with magnetic oriented carbon nanotube. Carbon 2018, 126, 197–207. [Google Scholar] [CrossRef]
  18. Ariu, G.; Hamerton, I.; Ivanov, D. Positioning and aligning CNTs by external magnetic field to assist localised epoxy cure. Open Phys. 2016, 14, 508–516. [Google Scholar] [CrossRef] [Green Version]
  19. Derenskyi, V.; Gomulya, W.; Talsma, W.; Salazar-Rios, J.M.; Fritsch, M.; Nirmalraj, P.; Riel, H.; Allard, S.; Scherf, U.; Loi, M.A. On-chip chemical self-assembly of semiconducting single-walled carbon nanotubes (SWNTs): Toward robust and scale invariant SWNTs transistors. Adv. Mater. 2017, 29, 1606757. [Google Scholar] [CrossRef]
  20. Martin, J.J.; Fiore, B.E.; Erb, R.M. Designing bioinspired composite reinforcement architectures via 3D magnetic printing. Nat. Commun. 2015, 6, 8641. [Google Scholar] [CrossRef] [Green Version]
  21. Subramanian, N.; Koo, B.; Venkatesan, K.R.; Chattopadhyay, A. Interface mechanics of carbon fibers with radially-grown carbon nanotubes. Carbon 2018, 134, 123–133. [Google Scholar] [CrossRef]
  22. Subramanian, N.; Rai, A.; Chattopadhyay, A. Atomistically derived cohesive behavior of interphases in carbon fiber reinforced CNT nanocomposites. Carbon 2017, 117, 55–64. [Google Scholar] [CrossRef] [Green Version]
  23. Kundalwal, S.; Ray, M. Effective properties of a novel composite reinforced with short carbon fibers and radially aligned carbon nanotubes. Mech. Mater. 2012, 53, 47–60. [Google Scholar] [CrossRef]
  24. Hassanzadeh-Aghdam, M.K.; Ansari, R.; Darvizeh, A. Micromechanical analysis of carbon nanotube-coated fiber-reinforced hybrid composites. Int. J. Eng. Sci. 2018, 130, 215–229. [Google Scholar] [CrossRef]
  25. Venkatesan, K.R.; Subramanian, N.; Rai, A.; Chattopadhyay, A. Atomistically informed multiscale modeling of radially grown nanocomposite using a continuum damage mechanics approach. Carbon 2019, 142, 420–429. [Google Scholar] [CrossRef]
  26. Gorbatikh, L.; Wardle, B.L.; Lomov, S.V. Hierarchical lightweight composite materials for structural applications. MRS Bull. 2016, 41, 672–677. [Google Scholar] [CrossRef] [Green Version]
  27. Romanov, V.S.; Lomov, S.V.; Verpoest, I.; Gorbatikh, L. Modelling evidence of stress concentration mitigation at the micro-scale in polymer composites by the addition of carbon nanotubes. Carbon 2015, 82, 184–194. [Google Scholar] [CrossRef]
  28. Romanov, V.S.; Lomov, S.V.; Verpoest, I.; Gorbatikh, L. Can carbon nanotubes grown on fibers fundamentally change stress distribution in a composite? Compos. Part A 2014, 63, 32–34. [Google Scholar] [CrossRef]
  29. Romanov, V.; Lomov, S.V.; Verpoest, I.; Gorbatikh, L. Inter-fiber stresses in composites with carbon nanotube grafted and coated fibers. Compos. Sci. Technol. 2015, 114, 79–86. [Google Scholar] [CrossRef]
  30. Romanov, V.S.; Lomov, S.V.; Verpoest, I.; Gorbatikh, L. Stress magnification due to carbon nanotube agglomeration in composites. Compos. Struct. 2015, 133, 246–256. [Google Scholar] [CrossRef]
  31. Rai, A.; Chattopadhyay, A. Multifidelity multiscale modeling of nanocomposites for microstructure and macroscale analysis. Compos. Struct. 2018, 200, 204–216. [Google Scholar] [CrossRef]
  32. Liu, Q.; Gorbatikh, L.; Lomov, S.V. A combined use of embedded and cohesive elements to model damage development in fibrous composites. Compos. Struct. 2019, 223, 110921. [Google Scholar] [CrossRef]
  33. Lu, F.; Liu, Q.; Druzhinin, P.; Vandepitte, D.; Zhou, G.; Lomov, S.V. Reduction of the volume redundancy in combined embedded elements/cohesive zone modelling–Comments on the paper: Liu, Q.; Gorbatikh, L.; Lomov, S.V. A combined use of embedded and cohesive elements to model damage development in fibrous composites. Compos. Struct. 2019, 223, 110921. Compos. Struct. 2019, 226, 111273. [Google Scholar] [CrossRef]
  34. Liu, Q.; Lomov, S.V.; Gorbatikh, L. The interplay between multiple toughening mechanisms in nanocomposites with spatially distributed and oriented carbon nanotubes as revealed by dual-scale simulations. Carbon 2019, 142, 141–149. [Google Scholar] [CrossRef]
  35. Brighenti, R. Fibre distribution optimisation in fibre-reinforced composites by a genetic algorithm. Compos. Struct. 2005, 71, 1–15. [Google Scholar] [CrossRef]
  36. Ghasemi, H.; Brighenti, R.; Zhuang, X.; Muthu, J.; Rabczuk, T. Optimization of fiber distribution in fiber reinforced composite by using NURBS functions. Comp. Mater. Sci. 2014, 83, 463–473. [Google Scholar] [CrossRef]
  37. Wu, C.; Gao, Y.; Fang, J.; Lund, E.; Li, Q. Discrete topology optimization of ply orientation for a carbon fiber reinforced plastic (CFRP) laminate vehicle door. Mater. Des. 2017, 128, 9–19. [Google Scholar] [CrossRef]
  38. Konak, A.; Coit, D.W.; Smith, A.E. Multi-objective optimization using genetic algorithms: A tutorial. Reliab. Eng. Syst. Safe 2006, 91, 992–1007. [Google Scholar] [CrossRef]
  39. Liu, Q.; Lomov, S.V.; Gorbatikh, L. Spatial distribution and orientation of nanotubes for suppression of stress concentrations optimized using genetic algorithm and finite element analysis. Mater. Des. 2018, 158, 136–146. [Google Scholar] [CrossRef]
  40. Melro, A.; Camanho, P.; Pires, F.A.; Pinho, S. Micromechanical analysis of polymer composites reinforced by unidirectional fibres: Part I–Constitutive modelling. Int. J. Solids Struct. 2013, 50, 1897–1905. [Google Scholar] [CrossRef] [Green Version]
  41. Herráez, M.; González, C.; Lopes, C.; de Villoria, R.G.; LLorca, J.; Varela, T.; Sánchez, J. Computational micromechanics evaluation of the effect of fibre shape on the transverse strength of unidirectional composites: An approach to virtual materials design. Compos. Part A 2016, 91, 484–492. [Google Scholar] [CrossRef]
  42. Cooper, C.A.; Cohen, S.R.; Barber, A.H.; Wagner, H.D. Detachment of nanotubes from a polymer matrix. Appl. Phys. Lett. 2002, 81, 3873–3875. [Google Scholar] [CrossRef]
Figure 1. Schematic illustration of the optimization problem: (a) the fiber-reinforced composite (FRC) model (front and side view) with carbon nanotubes (CNTs) dispersed in the matrix and (b) the wavy shape of CNTs.
Jcs 04 00034 g001
Figure 2. Flowchart of the optimization tool with generic algorithm (GA) and finite element method (FEM) combined. FE; finite element.
Jcs 04 00034 g002
Figure 3. Three types of FRCs: (a) pristine (without CNTs), (b) reinforced by 0.5 wt% and (c) 1.0wt% of CNTs that are homogeneously distributed in the matrix (2D view), and (df) the stress distribution in the matrix for the cases in (ac), respectively. The externally applied stress is 10 MPa.
Jcs 04 00034 g003
Figure 4. (a,b) Optimized CNT networks; (c,d) the respective stress fields in the matrix. CNT content: 0.5 wt% (a,c) and 1.0 wt% (b,d).
Jcs 04 00034 g004
Figure 5. The effects of CNT-network morphologies on the mechanical properties of FRCs: (a) stress-strain curves of pristine FRC and the hierarchical FRCs with homogenous and optimized CNT distributions, strain energy consumptions in (b) pristine FRC, the hierarchal FRC with a content of (c) 0.5 wt% and (d) 1.0 wt%.
Jcs 04 00034 g005
Figure 6. Damage development in the matrix of (a) the pristine FRC and (b) FRC with 0.5 wt% of homogeneously distributed CNTs; debonding (c) at CNT/matrix interface in the composite with 0.5 wt% CNTs.
Jcs 04 00034 g006
Figure 7. Damage development in the hierarchical FRC with an optimal CNT network with a content of 0.5 wt% at different applied strains. Contour plots of the damage variable in (a) the matrix and (b) at CNT/matrix interface.
Jcs 04 00034 g007
Figure 8. Damage development in the hierarchical FRC reinforced by the optimal CNT networks with a content of 1.0 wt%. Contour plots of the damage variable in (a) the matrix and (b) at CNT/matrix interface.
Jcs 04 00034 g008
Table 1. Comparisons of the effective mechanical properties of the pristine FRC, the hierarchical FRCs with homogenously distributed CNTs and optimally positioned and oriented CNTs.
CompositesCNT Content, wt%Stiffness
(GPa)
Strength
(MPa)
Toughness
(×109 J/m3)
Pristine FRC023.869.326.7
Homogeneous distribution of CNTs 0.525.373.326.6
Homogeneous distribution of CNTs 1.025.570.923.2
Optimized distribution of CNTs0.530.584.733.6
Optimized distribution of CNTs1.030.0103.144.0
Table 2. The relative difference of the strain energy (in %) of a hierarchical FRC compared to that of pristine FRC, and the contribution from each constituent material (defined by Equation (6)).
Hierarchical FRCsFiberMatrixCNTCNT/Matrix InterfaceAll
Homogeneous, 0.5 wt%0.1−2.71.31.0−0.3
Homogeneous, 1.0 wt%0−1621−13
Optimized, 0.5 wt%6−1062426
Optimized, 1.0 wt%928131565

