Abstract
Carbon nanotubes (CNT)-reinforced polymeric composites are being studied as promising materials due to their enhanced properties. However, understanding the behavior of polymers during non-isothermal crystallization is important once the degree of crystallinity and crystallization processes are affected when nanoparticles are added to matrices. Usually, crystallization kinetics studies are performed using a model-fitting method, though the isoconversional method allows to obtain the kinetics parameter without assuming a crystallization model. Therefore, in this work, CNTs were oxidized (CNT-Ox) and functionalized with gamma-aminobutyric acid (GABA) (CNT-GB) and incorporated into a poly(3-hydroxybutyrate-co-3-hydroxyvalerate) (PHBV) matrix. The influence of the addition and functionalization of CNT in the crystallization kinetics of PHBV was evaluated using the isoconversional method with differential scanning calorimetry (DSC), and by polarized light optical microscopy (PLOM) and Shore D hardness. The incorporation and functionalization of CNT into PHBV matrix did not change the Šesták and Berggren crystallization model; however, the lowest activation energy was obtained for the composite produced with CNT-GB, suggesting a better dispersion into the PHBV matrix. PLOM and Shore D hardness confirmed the results obtained in the kinetics study, showing the smallest crystallite size for CNT-containing nanocomposites and the highest hardness value for the composite produced with CNT-GB.
1. Introduction
Poly(3-hydroxybutyrate-co-3-hydroxyvalerate), PHBV, is a renewable, biodegradable and biocompatible thermoplastic with potential to be used as a substitute for conventional petroleum-based polymers. However, it has some shortcomings as low mechanical properties and a narrow processing window [1,2,3]. PHBV has potential to be used for tissue engineering, drug delivery and implants, as biosensors, packaging, personal hygiene products, in the agricultural sector, and others such as toy and automotive industries [2,4,5,6,7].
To modulate some of PHBV´s properties, carbon nanotubes (CNT) have been studied as a viable and effective nanoparticle, due to their remarkable mechanical, thermal, and electrical properties. Adding CNTs to PHBV can improve mechanical and thermal properties, besides turning the polymer matrices into a semiconductor [1,8,9,10,11]. However, CNTs have a strong tendency to form bundles, hampering their dispersion [12].
Functionalization has been extensively used to improve compatibility and dispersion of CNTs into matrices. There are a lot of possibilities for modifying the CNT´s surfaces, being possible covalent and non-covalent functionalizations [8]. Better results were reported when the functionalization was accomplished with the same polymer used as matrix, or with molecules with a structure similar to the matrix [13,14,15]. CNTs are usually used to produce PHBV nanocomposites after oxidation and reduction functionalizations [1,7,10].
Some modification is necessary to allow for the use of PHBV for industrial purposes, as the incorporation of antioxidant and nucleating agents, to avoid degradation during processing [16]. The incorporation of any particle to a matrix usually changes the crystallization mechanism, and, consequently, the obtained properties. The addition of CNTs into a polymer matrix do not only change the crystallization mechanism, but can also cause changes in the polymer chain configuration, glass transition (Tg), and melt (Tm) temperatures, rate of crystal formation, crystallite shape, and size and activation energy (Ea) [17]. So, it is essential to study the crystallization kinetics and make a correlation with the mechanical properties to understand the final behavior of the material.
Xu et al. [18] evaluated the crystallization kinetics of poly(hydroxybutyrate)—PHB/CNT nanocomposites and reported that the crystallization of PHB is improved in the presence of CNTs due to the heterogeneous nucleating effect.
Reinsch and Kelley [19] studied the crystallization kinetics of PHB and PHBV/wood fiber composites using the nonisothermal Avrami-type analysis. The authors reported that the presence of hydroxyvalerate (HV) units in PHBV affects the kinetics of crystallization. The Avrami exponent was shifted with the addition of fiber reinforcement and cocrystallization.
To the best of our knowledge, the non-isothermal crystallization kinetics of PHBV nanocomposites using the isoconversional method has not been studied. In this paper, PHBV/CNT nanocomposites were produced according to our study previously reported [13], which showed improved compatibility of PHBV with gamma-aminobutyric acid(GABA)-functionalized CNT (CNT-GB). GABA was chosen due to its structural similarity to the main monomer of PHBV, hydroxybutyrate. Concerning dispersion and interaction with PHBV matrix, CNT-GB has proven to be effective and promising to produce biodegradable thermoplastic nanocomposites [13]. The non-isothermal crystallization kinetics was studied using the isoconversional method, the polarized light optical microscopy (PLOM), and Shore D hardness were also evaluated. It is extremely important to evaluate the crystallization kinetics and have information about the dispersion of CNTs into the PHBV matrix, and correlate with their mechanical properties.
2. Theoretical Background
The rate of polymer crystallization can be described using the general equation (Equation (1)) of solid-state reactions [20,21,22]:
where α is the conversion fraction, t is the time, k is the reaction rate constant, and f(α) is the reaction model. The mechanism controlling the reaction, along with the size and shape of the reactive particles, will define f(α). Table 1 lists several reaction models with their mechanisms and equations for f(α) [23,24,25,26,27,28,29,30].

Table 1.
Reaction models with their mechanisms and equations for f(α) [23,24,25,26,27,28,29,30].
Kinetic calculations from differential scanning calorimetry (DSC) curves use the following equation (Equation (2)) for calculating α:
where Ai is the area under the crystallization peak to a Ti temperature, and At is the total area.
Integrating Equation (1) gives the integral rate law representative of the reaction model, g(α) [21,23,25]:
The dependence of temperature on the rate of crystallization reactions is defined by the Arrhenius equation (Equation (4)) [22]:
where A is the pre-exponential (“frequency”) factor, Ea is the activation energy, T is the absolute temperature, and R is the gas constant.
Substituting Equation (4) in the rate expression from (1) and the integrated rate expression from (3) gives (5) and (6):
and
In order to obtain the kinetics parameters of non-isothermal crystallization reactions, the rate expressions must be transformed by Equation (7):
being that
where dα/dT is the non-isothermal crystallization rate, dα/dt is the isothermal crystallization rate, and β is the heating rate.
Substituting Equations (5) and (8) into (7) gives the differential expression of the non-isothermal rate law [22,25,28]:
Integrating Equation (9) gives (10):
Substituting Ea/RT by “x” and changing the integral limits, Equation (10) becomes (11) [21,22,28]:
Equation (11) can be written as (12):
where p(x) is the exponential integral Equation (13):
The exponential integral p(x) has no analytic solution, but many approximations. The Flynn-Wall-Ozawa method is an isoconversional method that uses Doyle’s linear approximation for p(x) [30,31], whereby Equation (12) is transformed into (14):
Differentiating and assuming α constant (Equation (15)) [21,22,24]:
Thus, plotting logβ versus 1/T for each α gives Ea from the angular coefficient of the curve. In this way, the activation energy is calculated for each conversion fraction. Besides, it is possible to verify whether the crystallization mechanism is the same for all heating rates using the kinetic compensation effect [32].
The pre-exponential factor (A) can be determined by the Kissinger method for a first-order reaction, which is f(α) = 1 − α [17]. Substituting on Equation (9):
Deriving Equation (16) and equating it to zero (when the reaction rate is maximum):
where Tm is the maximum temperature of the DSC peak.
Substituting Equation (16) into (17) [17]
Equation (18) allows for the calculation of A for each conversion fraction. If Ea does not vary with α, the reaction occurs in a single step. On the other hand, if Ea varies with α it is assumed that the reaction has a complex mechanism [20,25].
The values of lnA and Ea have a linear relationship, known as kinetic compensation effect. Such linearity indicates that the kinetic model is the same in the range studied. The impact of kinetic compensation is expressed by Equation (19) [21,23,32]:
where a and b are constants.
In order to obtain the kinetic model of the studied reaction, it is necessary to previously define the functions y(α) and z(α), which are described by Ozawa as [33,34]:
where θt is generalized time, denoting the reaction time taken to reach a distinct α at infinite temperature.
Combining Equation (5), (8), and (20), the following expression is obtained [26,35]:
where dα/dθt corresponds to a generalized rate of reaction, and it is obtained by extrapolation of dα/dt to an infinite temperature.
Integrating Equation (21):
Combining Equations (21) and (22), a general expression for z(α) is obtained [27]:
Substituting Equations (20) into (23):
Thus, the functions y(α) and z(α) can be determined, defining the reaction model by the derivative of these functions (ay and az). Figure 1 shows different reaction models according to the values of ay and az [27,36].
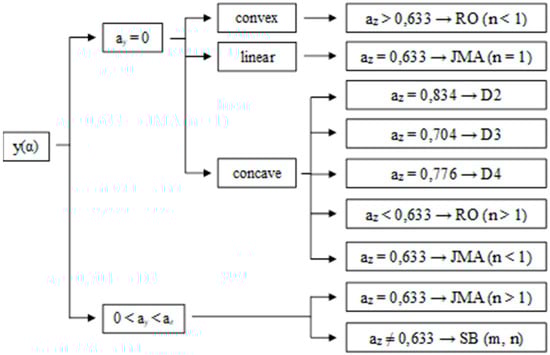
Figure 1.
Schematic diagram of kinetic models using y(α) and z(α) functions [17].
3. Experimental
3.1. Materials
PHBV was provided by NaturePlast (IFS, France), with 2 mol% of hydroxyvalerate units, molecular weight (Mw) from 400.000 to 500.000 g·mol−1, and was used as received. Multi-walled carbon nanotubes (MWCNT) were supplied by Nanostructured & Amorphous Materials, Inc. (Houston, TX, USA) with specification #1229Y, with a minimum purity of 95%. They have a diameter in the range of 20–30 nm and length in the range of 10–30 µm and were used as supplied. The oxidation (CNT-Ox) and gamma-aminobutyric acid (GABA) (CNT-GB) functionalization were performed following previous procedures [13].
3.2. Production of PHBV/CNT Nanocomposites
PHBV/CNT nanocomposites with 0.5 wt% of CNT were produced by melt mixing, followed by hot compression molding. Neat PHBV and PHBV/CNT, PHBV/CNT-Ox, and PHBV/CNT-GB samples were processed in a high-speed mixer (DRAIS mixer produced by MH Equipamentos Ltda, São Paulo, Brazil, model MH50-H) rotating at 3000 rpm and mixing chamber with a capacity of 65 g of material. The mixing, melting, and homogenization of the composites occur due to the high friction generated between the rotor and the material. The polymer mass was previously oven-dried for 4 h at 40 °C. After 1 min of mixing, the homogenized composites were collected and pressed in a hydropneumatic press (MH Equipamentos Ltda, São Paulo, Brazil, model PR8HP) into 3.2 mm thick plates whose dimensions (length 63.5 mm; width 12.7 mm; 3.28 mm thickness) were according to the ASTM D256-06 for the mechanical impact tests. The pressing was done at 200 °C using a pressure of 5 bar for 3 min and then cooled for 2 min.
3.3. Characterization of PHBV/CNT Nanocomposites
The non-isothermal crystallization behavior of neat PHBV and PHBV/CNT nanocomposites was measured by DSC in a Perkin Elmer (Waltham, MA, USA), Pyris 1 calorimeter. Samples (10 mg) were poured inside aluminum pans at inert atmosphere of N2 to avoid thermal-oxidative degradation. For the non-isothermal crystallization experiment, each sample was first melted to 200 °C at a heating rate of 10 °C/min and maintained at this temperature for 5 min. Specimens were then cooled to −30 °C at four different heating rates: 5, 7, 10, and 15 °C/min. The exothermal curves obtained during the non-isothermal crystallization for various cooling rates were used to develop the kinetics study. The degree of crystallinity (Xc, %) was calculated according to the relation:
where ΔHm1 is the total melting enthalpy on heating, WPHBV is the weight fraction of PHBV in the nanocomposite (0.995), and ΔH0m is the theoretical melting heat value of 100% crystalline PHB (146 J/g). This value is considered for PHBV because of the low HV content [6,37].
PLOM was performed using a Leica (Wetzlar, Germany) DMRXP microscope equipped with a Linkam (Waterfield, U.K.) CSS450 hot stage. Neat PHBV and PHBV/CNT nanocomposites were analyzed in the form of thin films that were prepared between microscope coverslips by melting the polymer at 190 °C and then cooling at 30 °C/min until 130 °C. This temperature was maintained until the complete crystallization. The images were recorded every 30 s to analyze the crystallite growth until complete crystallization.
Shore D hardness was measured using an Instrutherm (São Paulo, Brazil) DP-400 durometer following ISO 868. Ten measurements were taken, and mean values were calculated.
Data were expressed as mean ± standard deviation (SD) and analyzed using analysis of variance (ANOVA) and Tukey–Kramer test. P < 0.05 was considered significant.
4. Results
4.1. Differential Scanning Calorimetry (DSC)
Figure 2 shows DSC curves obtained on cooling scans with different rates of 5, 7, 10, and 15 °C/min for PHBV, PHBV/CNT, PHBV/CNT-Ox, and PHBV/CNT-GB. It was determined the crystallization peak temperature (Tp), the onset temperature (Ton), and the absolute crystallinity (Xc) for each cooling rate (β). The results are shown in Table 2.
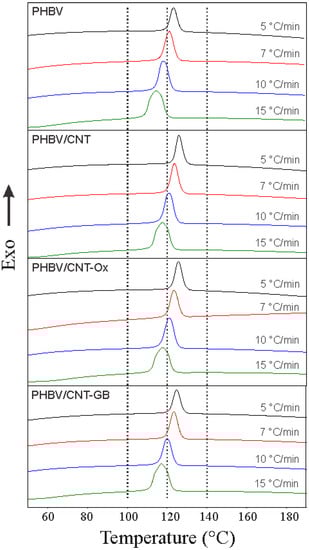
Figure 2.
DSC cooling thermograms for PHBV, PHBV/CNT, PHBV/CNT-Ox, and PHBV/CNT-GB (dot lines delimit an interval to facilitate observation of the peak´s shift).
Table 2.
Summarized DSC results at various cooling rates (5, 7, 10, and 15 °C/min) for PHBV, PHBV/CNT, PHBV/CNT-Ox, and PHBV/CNT-GB.
For all samples, the crystallization process occurs as a single event, which is represented by an exothermic peak at approximately 120 °C. As the cooling rate decreases, the crystallization peak becomes narrower and shifts to higher temperatures, indicating that at lower cooling rates, polymer chains have more time to organize themselves and move from the melt region to the surface of the crystals. In this case, global crystallization occurs at higher temperatures. When the cooling rate increases, polymer chains have little time to organize themselves. Thus, crystallization occurs at lower temperatures and results in wider crystallization peaks resulting from more considerable heterogeneity in the crystals formed [11,38].
Figure 2 shows a comparison of the DSC cooling peaks of PHBV, PHBV/CNT, PHBV/CNT-Ox, and PHBV/CNT-GB samples. For a given cooling rate, peak temperatures are slightly higher for CNT, CNT-Ox, and CNT-GB nanocomposites compared to neat PHBV. This slight increase in Tp can be attributed to the nucleation process caused by the presence of CNTs, inducing crystallization at higher temperatures [38,39]. The conversion fraction as a function of temperature can be determined by Equation (2) using data of Figure 2. Figure 3 shows the temperature and time conversion fraction (relative crystallinity) plots for the samples at the cooling rate of 5 °C/min. Figure 3 shows displacements to the left side for nanocomposites curves in relation to neat PHBV, indicating that the addition of CNTs considerably increased the values of crystallinity temperatures. These displacements are due to the presence of CNTs in nanocomposites, which act as nucleation sites for the crystallization of PHBV.
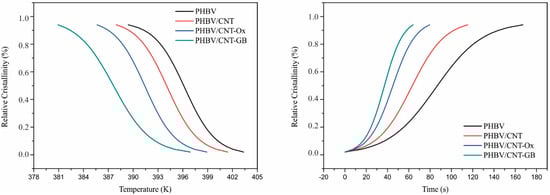
Figure 3.
Relative crystallinity versus temperature (left) and time (right) for PHBV, PHBV/CNT, PHBV/CNT-Ox, and PHBV/CNT-GB, at the cooling rate of 5 °C/min.
With the conversion fraction values for each temperature, the activation energy value for each conversion fraction can be found by plotting the logarithm of the heating rate by the inverse of the temperature. The activation energy is obtained through the angular coefficient of this curve using the Kissinger model. The activation energy curve versus the conversion fraction is shown in Figure 4.
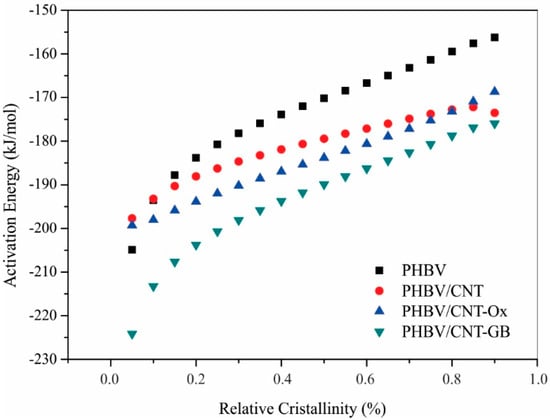
Figure 4.
Activation energy versus relative crystallinity at 5 °C/min for PHBV, PHBV/CNT, PHBV/CNT-Ox, and PHBV/CNT-GB nanocomposites.
For all samples, the activation energy is negative, meaning that as the temperature decreases, crystallization increases, indicating that all samples crystallize upon cooling. For all samples as well, the activation energy increased with increasing relative crystallinity, suggesting that as crystallization proceeds, it becomes more difficult for each polymeric system to continue its crystallization [17].
When comparing the activation energy curves, there is a considerable difference observed for PHBV/CNT-GB sample, which showed lower activation energy, especially for smaller conversion fractions. All nanocomposites had lower activation energy compared to neat PHBV. Recognizing that the lower the activation energy, the greater the ability of the polymeric system to crystallize [40,41], it can be inferred that CNT, CNT-Ox, and CNT-GB are heterogeneous nucleating agents for the crystallization of PHBV, accelerating the crystallization process. In the case of CNT-GB, this effect is even more evident, especially at the beginning of the crystallization process, which may be related to a better dispersion of CNT-GB in the PHBV matrix compared to CNT and CNT-Ox, which turns the nucleating effect more pronounced [42]. Better dispersion and interaction between CNT-GB and PHBV is achieved due to the structural similarity between GABA and hydroxybutyrate, the main monomer of PHBV. Poor dispersion of CNT into the polymer matrix hinders crystallization. When CNTs are well dispersed, greater nucleation sites are available, and the nucleating effect is improved [14].
With the activation energy values for each conversion fraction, the pre-exponential factor value for each conversion fraction can be obtained. The values of Ea and ln A for each PHBV crystalline conversion fraction (α) are given in Table 3.
Table 3.
Values of Ea (kJ/mol) and lnA (min-1) for each PHBV conversion fraction (α).
Table 3 shows that PHBV/CNT-GB sample presented the lowest average activation energy followed by PHBV/CNT and PHBV/CNT-Ox samples, which presented close activation energy values. PHBV presented the highest value among the samples. As previously mentioned, CNT-GB probably acted more effectively as nucleating agents in PHBV, due to their better matrix dispersion. The improvement of dispersion and compatibility between PHBV and PHBV/CNT-GB was shown previously [13]. The data were statistically analyzed using the parametric ANOVA and T-tests, with an established significance of 5% (p < 0.05) to better compare the results. The results are shown in Figure 5 as mean values, with the following significance levels: * p ≤ 0.05; ** p < 0.01; *** p < 0.001; **** p < 0.0001.
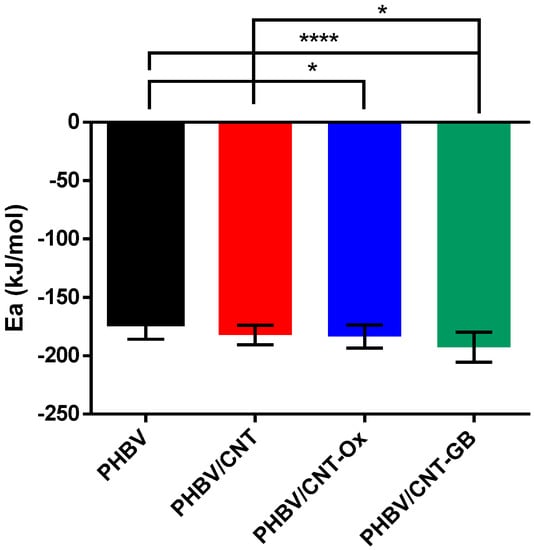
Figure 5.
Statistical analysis of activation energy data for PHBV, PHBV/CNT, PHBV/CNT-Ox, and PHBV/CNT-GB.
From Figure 5, it can be confirmed that the PHBV/CNT-GB sample presented the most significant differences compared to the others, exceptionally pure PHBV. Even with the presence of nucleating agents (present in the raw material used), the addition of CNTs caused changes in the activation energy. It also hastened the nucleation of PHBV crystals, confirming the nucleating effect of CNT, CNT-Ox, and CNT-GB and showing that the functionalization of CNT with GABA was efficient enough to promote their better dispersion in the PHBV matrix.
The effect of kinetic compensation was then verified for each sample by plotting ln A as a function of Ea and calculating its linearity through the correlation factor. Figure 6 presents the obtained graphs.
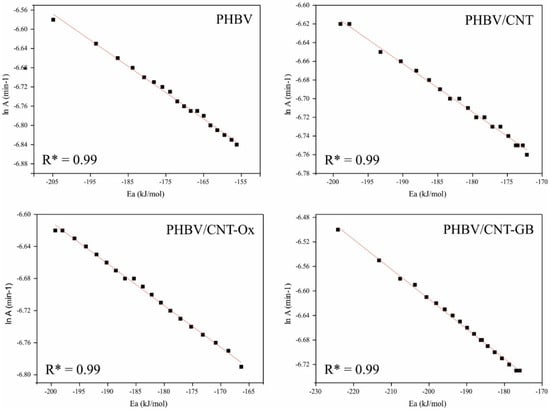
Figure 6.
Effect of kinetic compensation for PHBV, PHBV/CNT, PHBV/CNT-Ox and PHBV/CNT-GB.
From Figure 6, the linearity between the activation energy and the logarithm of the pre-exponential factor can be remarked since the correlation factor of all graphs is 0.99. This linearity, called the kinetic compensation effect, occurs when the reaction mechanism is the same during the interval studied. In this case, a shift in activation energy is counterbalanced by the same change in the logarithm of the pre-exponential factor. Thus, it is possible to determine the reaction mechanism for any heating velocity (among those used in this work) for a given sample. In order to determine the mechanism of the PHBV crystallization reaction, the thermal analysis curves for the heating rate of 10 °C min will be used.
Using Ea values, it is possible to obtain y(α) and z(α), and determine their maximum values, as well as the maximum values for ay and az. The curves y(α) and z(α) and the values obtained for ay and az are shown in Figure 7.
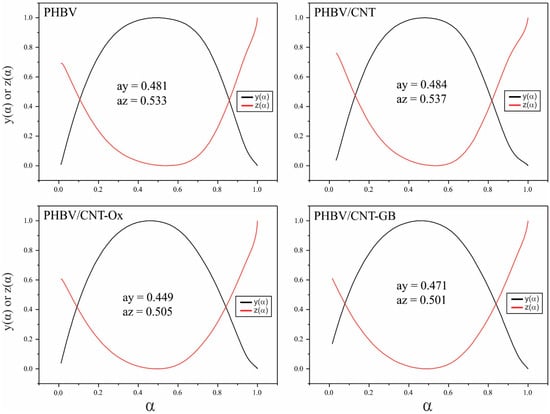
Figure 7.
y(α) and z(α) normalized curves as a function of the conversion fraction for PHBV, PHBV/CNT, PHBV/CNT-Ox and PHBV/CNT-GB.
With the values ay and az and conferring Figure 1, the kinetic crystallization mechanism can be obtained. For all samples, 0 < ay < az, and az is different from 0.633, meaning that all the samples are crystallized by the Šesták and Berggren (SB) model of nucleation and growth, or autocatalytic mechanism [43].
Avrami’s mechanism is usually used to describe the crystallization of PHBV [42,44,45,46,47]. However, he PHBV grade evaluated is particularly intended for injection or industrial purposes. For this reason, there are previous nucleating agents added to the matrix, which were probably responsible for the different crystallization mechanism. In order to determine the coefficients m, n, and A of the SB model, the y(α) curve is adjusted using the equation shown in Table 1. The values obtained with the adjustments are shown in Table 4.
Table 4.
Values of m, n, A, and correlation factor found by fitting the curves to the SB model.
Through the values of Table 4, it can be concluded that the crystallization mechanisms of all samples are similar, since the parameters m and n are alike, not exhibiting significant variations. This result was expected since the crystallization mechanism was the same for all samples evaluated. As for all samples 1 ≤ n ≤ 2, the crystals’ growth will occur in one dimension (as cylinders or fibers) [17,48].
Polymers with granular structure, resulting from many small growth units, usually show small “n” values [17,49]. In this case, the inorganic particles present in the PHBV structure, allied to the CNTs, acted as seeds for crystallization, resulting in crystals with small sizes.
4.2. Polarized Light Optical Microscopy (PLOM)
Polarized light optical microscopy was performed to confirm the data obtained by kinetic calculations, evaluating the microstructure obtained after the addition of CNT. Images were picked at 130 °C isotherm. This temperature was chosen once it allowed the polymer crystallization process to occur, enabling the verification of the crystallization steps. Lower temperatures resulted in extremely fast crystallization, and at higher temperatures, no crystallization occurred.
Figure 8 shows the images obtained for neat PHBV at 130 °C isotherm. At time zero, the polymer is in its molten form, and the presence of solid particles dispersed throughout the material is observed. These particles are the nucleating and antioxidant agents present in PHBV. After 2 min (t = 2), the first growth nuclei appear. After 4 min the spherulites grow, and after 8 min they solidify. It is usually observed the growth of larger and higher perfection spherulites for PHBV [46,50]. However, the nucleating agent particles dispersed by the molten material did not allow the spherulites to grow.
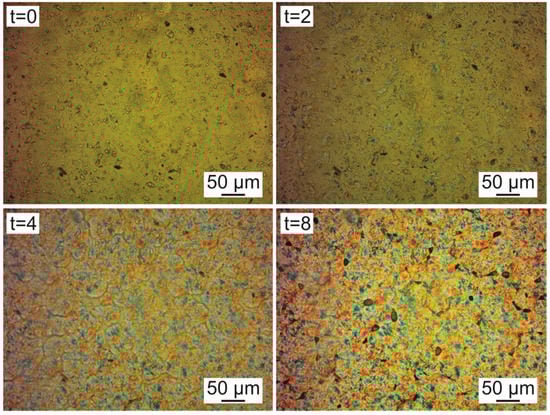
Figure 8.
Polarized light optical microscopy images of neat PHBV at 130 °C and times: t = 0; t = 2 min; t = 4 min, and t = 8 min.
Figure 9 shows the images obtained by polarized light optical microscopy for PHBV/CNT, PHBV/CNT-Ox, and PHBV/CNT-GB nanocomposites. Spherulite nucleation occurred faster in nanocomposites than in pure PHBV, confirming the CNT’s nucleating effect. Comparing the images obtained for neat PHBV from Figure 8 with the PHBV/CNT images from Figure 9, after 4 min, neat PHBV presented more spherulites than PHBV/CNT, probably due to an inefficient dispersion of CNT into the PHBV matrix. However, a more significant difference is observed when comparing neat PHBV with PHBV/CNT-Ox and PHBV/CNT-GB samples, for 4 and also after 2 min of analysis. For the PHBV/CNT-Ox and PHBV/CNT-GB samples, a higher number of nucleation points is observed, compared to PHBV/CNT and neat PHBV. After 4 min, when comparing the nanocomposites of Figure 9, it is noted that PHBV/CNT-Ox and PHBV/CNT-GB samples have crystallites distributed throughout the sample, while the PHBV/CNT sample only presents some nucleation points.
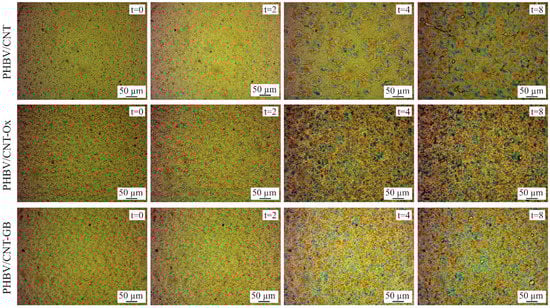
Figure 9.
Polarized light optical microscopy images of PHBV/CNT, PHBV/CNT-Ox, and PHBV/CNT-GB at times t = 0, t = 2 min, t = 4 min, and t = 8 min.
Optical microscopy images confirmed the results of the kinetic calculations, which showed statistically significant differences in activation energy between neat PHBV and PHBV/CNT-Ox and PHBV/CNT-GB nanocomposites. The lower activation energy obtained for these nanocomposites justifies the faster nucleation of the crystallites.
Therefore, it is concluded that CNT functionalization positively acts on the nucleation of the spherulites, making the structure obtained more homogeneous due to a better dispersion of carbon nanotubes in the PHBV matrix.
4.3. Shore D Hardness
Figure 10 shows the average Shore D hardness values obtained for PHBV, PHBV/CNTC, PHBV/CNT-Ox, and PHBV/CNT-GB. Adding CNT, CNT-Ox, and CNT-GB into the PHBV matrix, in general, caused an increase in the average hardness value. PHBV/CNT-GB nanocomposite showed the most substantial growth of approximately 4% when compared to neat PHBV. Despite being a small value, the increase is statistically significant compared to the other samples. A better homogeneity and compatibility of CNT-GB with the PHBV matrix may be responsible for this increase in hardness, due to improved mechanical strength of the PHBV matrix [51].
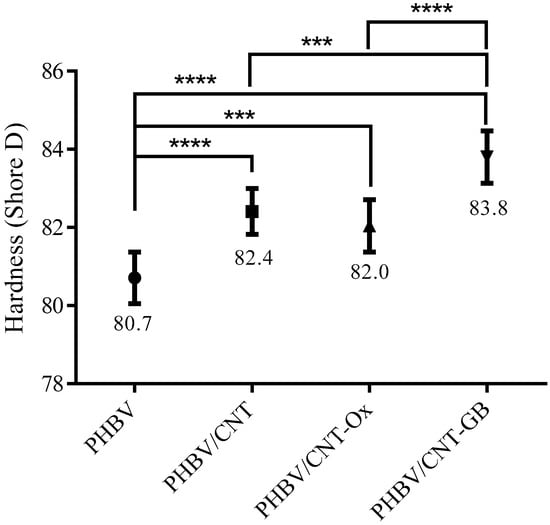
Figure 10.
Shore D hardness for PHBV, PHBV/CNT, PHBV/CNT-Ox and PHBV/CNT-GB. Significance levels: * p ≤ 0.05; ** p < 0.01; *** p < 0.001; **** p < 0.0001.
Sánchez-Safont et al. [52] reported Shore D hardness values for pure PHBV of 81.3 and 83.4 after the addition of 10 wt% of cellulose nanofibers. The authors attributed the increase to the reinforcing effect of cellulose. Similar results were observed in this work for PHBV and nanocomposites after the introduction of CNT, CNT-Ox, and CNT-GB. However, the most remarkable increase was observed for CNT-GB, confirming that GABA functionalization resulted in improved compatibility between CNT-PHBV, leading to better reinforcement.
5. Conclusions
PHBV nanocomposites with 0.5 wt% CNT, CNT-Ox, and CNT-GB were produced to evaluate the crystallization kinetics, as well as to evaluate the compatibility and dispersion of the CNT into the PHBV matrix. The addition of CNT-GB reduced the crystallization activation energy of PHBV, suggesting better dispersion in the matrix. All nanocomposites showed a crystallization reaction mechanism represented by the model of Šesták and Berggren. This result was probably obtained due to the presence of nucleating and antioxidant agents into PHBV. Besides, CNT-Ox and CNT-GB acted as heterogeneous nucleants. The addition of CNT-GB caused an increase in the hardness of the nanocomposites. The results suggest that the compatibility between CNT-GB and PHBV has been significantly increased, being promising in the production of biodegradable thermoplastic nanocomposites.
Author Contributions
Conceptualization, T.L.d.A.M., B.R.C.d.M. and G.P.T.; Data curation, T.L.d.A.M.; Formal analysis, T.L.d.A.M. and B.R.C.d.M.; Funding acquisition, T.L.d.A.M. and G.P.T.; Investigation, T.L.d.A.M., B.R.C.d.M., L.S.M. and C.A.G.B.; Methodology, T.L.d.A.M., B.R.C.d.M., L.S.M., C.A.G.B., J.M., A.P.L. and G.P.T.; Project administration, T.L.d.A.M.; Resources, T.L.d.A.M., J.M., A.P.L. and G.P.T.; Software, T.L.d.A.M., B.R.C.d.M. and C.A.G.B.; Supervision, G.P.T.; Validation, T.L.d.A.M., J.M., A.P.L. and G.P.T.; Visualization, T.L.d.A.M.; Writing – original draft, T.L.d.A.M.; Writing – review & editing, T.L.d.A.M., B.R.C.d.M., L.S.M., C.A.G.B., J.M., A.P.L. and G.P.T. All authors have read and agreed to the published version of the manuscript.
Funding
This study was funded by the following Brazilian funding institutions: FAPESP (Fundação de Amparo à Pesquisa do Estado de São Paulo) [2017/24873-4, 2018/12035-7, 2017/02846-5], FINEP (Financiadora de Estudos e Projetos) [01.13.0328.03] and CAPES (Coordenação de Aperfeiçoamento de Pessoal de Nível Superior).
Conflicts of Interest
The authors declare no conflict of interest.
References
- Montanheiro, T.L.; Campos, T.M.; Montagna, L.S.; da Silva, A.P.; Ribas, R.G.; de Menezes, B.R.; Passador, F.R.; Thim, G.P. Influence of CNT pre-dispersion into PHBV/CNT nanocomposites and evaluation of morphological, mechanical and crystallographic features. Mater. Res. Express 2019, 6, 105375. [Google Scholar] [CrossRef]
- Lemes, A.P.; Montanheiro, T.L.A.; Passador, F.R.; Durán, N. Nanocomposites of Polyhydroxyalkanoates Reinforced with Carbon Nanotubes: Chemical and Biological Properties. In Eco-friendly Polymer Nanocomposites; Springer: New Delhi, India, 2015; pp. 79–108. [Google Scholar]
- Castro-Mayorga, J.L.; Fabra, M.J.; Lagaron, J.M. Stabilized nanosilver based antimicrobial poly(3-hydroxybutyrate-co-3-hydroxyvalerate) nanocomposites of interest in active food packaging. Innov. Food Sci. Emerg. Technol. 2016, 33, 524–533. [Google Scholar] [CrossRef]
- Rivera-Briso, A.; Serrano-Aroca, Á. Poly(3-Hydroxybutyrate-co-3-Hydroxyvalerate): Enhancement Strategies for Advanced Applications. Polymers 2018, 10, 732. [Google Scholar] [CrossRef] [PubMed]
- Montanheiro, T.L.; Montagna, L.S.; Patrulea, V.; Jordan, O.; Borchard, G.; Lobato, G.M.M.; Catalani, L.H.; Lemes, A.P. Evaluation of cellulose nanocrystal addition on morphology, compression modulus and cytotoxicity of poly (3-hydroxybutyrate- co -3-hydroxyvalerate) scaffolds. J. Mater. Sci. Mater. Life Sci. 2019, 54, 7198–7210. [Google Scholar] [CrossRef]
- do Amaral Montanheiro, T.L.; Montagna, L.S.; Patrulea, V.; Jordan, O.; Borchard, G.; Ribas, R.G.; Campos, T.M.B.; Thim, G.P.; Lemes, A.P. Enhanced water uptake of PHBV scaffolds with functionalized cellulose nanocrystals. Polym. Test. 2019, 79, 106079. [Google Scholar] [CrossRef]
- Lemes, A.P.; Montanheiro, T.L.; Silva, A.P.; Durán, N. PHBV/MWCNT Films: Hydrophobicity, Thermal and Mechanical Properties as a Function of MWCNT Concentration. J. Compos. Sci. 2019, 3, 12. [Google Scholar] [CrossRef]
- de Menezes, B.R.C.; Rodrigues, K.F.; da Silva Fonseca, B.C.; Ribas, R.G.; do Amaral Montanheiro, T.L.; Thim, G.P. Recent advances on the use of carbon nanotubes as smart biomaterials. J. Mater. Chem. B 2019, 7, 1343–1360. [Google Scholar] [CrossRef]
- Bezzon, V.D.N.; Montanheiro, T.L.A.; de Menezes, B.R.C.; Ribas, R.G.; Righetti, V.A.N.; Rodrigues, K.F.; Thim, G.P. Carbon nanostructure-based sensors: A brief review on recent advances. Adv. Mater. Sci. Eng. 2019, 2019, 4293073. [Google Scholar] [CrossRef]
- Montanheiro, T.L.A.; Cristóvan, F.H.; Machado, J.P.B.; Tada, D.B.; Durán, N.; Lemes, A.P. Effect of MWCNT functionalization on thermal and electrical properties of PHBV/MWCNT nanocomposites. J. Mater. Res. 2014, 30, 55–65. [Google Scholar] [CrossRef]
- da Silva, A.P.; do Amaral Montanheiro, T.L.; Montagna, L.S.; Andrade, P.F.; Durán, N.; Lemes, A.P. Effect of carbon nanotubes on the biodegradability of poly (3-hydroxybutyrate-co-3-hydroxyvalerate) nanocomposites. J. Appl. Polym. Sci. 2019, 2019, 48020. [Google Scholar] [CrossRef]
- Tasis, D.; Tagmatarchis, N.; Bianco, A.; Prato, M. Chemistry of carbon nanotubes. Chem. Rev. 2006, 106, 1105–1136. [Google Scholar] [CrossRef]
- do Amaral Montanheiro, T.L.; de Menezes, B.R.C.; Ribas, R.G.; Montagna, L.S.; Campos, T.M.B.; Schatkoski, V.M.; Righetti, V.A.N.; Passador, F.R.; Thim, G.P. Covalently γ-aminobutyric acid-functionalized carbon nanotubes: Improved compatibility with PHBV matrix. SN Appl. Sci. 2019, 1, 1177. [Google Scholar] [CrossRef]
- Yu, H.-Y.; Qin, Z.-Y.; Sun, B.; Yang, X.-G.; Yao, J.-M. Reinforcement of transparent poly(3-hydroxybutyrate-co-3-hydroxyvalerate) by incorporation of functionalized carbon nanotubes as a novel bionanocomposite for food packaging. Compos. Sci. Technol. 2014, 94, 96–104. [Google Scholar] [CrossRef]
- Montanheiro, T.L.A.; Montagna, L.S.; Machado, J.P.B.; Lemes, A.P. Covalent functionalization of MWCNT with PHBV chains: Evaluation of the functionalization and production of nanocomposites. Polym. Compos. 2019, 40, 288–295. [Google Scholar] [CrossRef]
- Lai, M.; Li, J.; Yang, J.; Liu, J.; Tong, X.; Cheng, H. The morphology and thermal properties of multi-walled carbon nanotube and poly(hydroxybutyrate-co-hydroxyvalerate) composite. Polym. Int. 2004, 53, 1479–1484. [Google Scholar] [CrossRef]
- de Menezes, B.R.C.; Campos, T.M.B.; do Amaral Montanheiro, T.L.; Ribas, R.G.; de Simone Cividanes, L.; Thim, G.P. Non-Isothermal Crystallization Kinetic of Polyethylene/Carbon Nanotubes Nanocomposites Using an Isoconversional Method. J. Compos. Sci. 2019, 3, 21. [Google Scholar] [CrossRef]
- Xu, C.; Qiu, Z. Nonisothermal Melt Crystallization and Subsequent Melting Behavior of Biodegradable Poly ( hydroxybutyrate )/ Multiwalled Carbon Nanotubes Nanocomposites. J. Polym. Sci. Part B Polym. Phys. 2009, 47, 2238–2246. [Google Scholar] [CrossRef]
- Reinsch, V.E.; Kelley, S.S. Crystallization of Poly (hydroxybutyrate-co-hydroxyvalerate) in Wood Fiber-Reinforced Composites. J. Appl. Polym. Sci. 1997, 64, 1785–1796. [Google Scholar] [CrossRef]
- Ou, R.; Guo, C.; Xie, Y.; Wang, Q. Non-isothermal crystallization kinetics of kevlar fiber-reinforced wood flour/hdpe composites. BioResources 2011, 6, 4547–4565. [Google Scholar]
- López-Fonseca, R.; Landa, I.; Gutiérrez-Ortiz, M.A.; González-Velasco, J.R. Nin-isothermal analysis of the kitetics of the combustion of carbonaceous materials. J. Therm. Anal. Calorim. 2005, 80, 65–69. [Google Scholar] [CrossRef]
- Khawam, A.; Flanagan, D.R. Role of isoconversional methods in varying activation energies of solid-state kinetics I. isothermal kinetic studies. Thermochim. Acta 2005, 429, 93–102. [Google Scholar] [CrossRef]
- Erceg, M.; Kovacic, T.; Perinovi, S. Kinetic analysis of the non-isothermal degradation of poly (3-hydroxybutyrate) nanocomposites. Thermochim. Acta 2008, 476, 44–50. [Google Scholar] [CrossRef]
- Jankovic, B.; Adnadevic, B.; Jovanovic, J. Application of model-fitting and model-free kinetics to the study of non-isothermal dehydration of equilibrium swollen poly (acrylic acid) hydrogel: Thermogravimetric analysis. Thermochim. Acta 2007, 452, 106–115. [Google Scholar] [CrossRef]
- Azimi, H.R.; Rezaei, M.; Abbasi, F.; Charchi, A.; Bahluli, Y. Non-isothermal degradation kinetics of MMA-St copolymer and EPS lost foams. Thermochim. Acta 2008, 474, 72–77. [Google Scholar] [CrossRef]
- Koga, N. Kinetic analysis of thermoanalytical data by extrapolating to infinite temperature. Thermochim. Acta 1995, 258, 145–159. [Google Scholar] [CrossRef]
- Málek, J.; Sesták, J.; Rouquerol, F.; Rouquerol, J.; Criado, J.M.; Ortega, A. Possibilities of two non-isothermal procedures (temperature- or rate-controlled) for kinetical studies. J. Therm. Anal. 1992, 38, 71–87. [Google Scholar] [CrossRef]
- Sestak, J.; Satava, V.; Wendlandt, W.W. The study of heterogeneous processes by thermal analysis. Thermochim. Acta 1973, 7, 333–556. [Google Scholar] [CrossRef]
- Guinesi, L.S.; Alessandra, L.R.; Henrique, L.; Mattoso, C.; Teixeira, E.D.M.; Antonio, A.; Curvelo, S. Kinetics of thermal degradation applied to starches from different botanical origins by non-isothermal procedures. Thermochim. Acta 2006, 447, 190–196. [Google Scholar] [CrossRef]
- Doyle, C.D. Kinetic Analysis of Thermogravimetric Data. J. Appl. Ind. Sci. 1961, 5, 285–292. [Google Scholar] [CrossRef]
- Doyle, C.D. Estimating Isothermal Life from Thermogravimetric Data. J. Appl. Polym. Sci. 1962, 6, 639–642. [Google Scholar] [CrossRef]
- Zeman, S. Kinetic compensation effect and thermolysis mechanisms of organic polynitroso and polynitro compounds. Thermochim. Acta 1997, 290, 199–217. [Google Scholar] [CrossRef]
- Ozawa, T. A New Method of Analyzing Thermogravimetric Data. Bull. Chem. Soc. Jpn. 1965, 38, 1881–1886. [Google Scholar] [CrossRef]
- Ozawa, T. Non-isothermal kinetics and generalized time. Thermochim. Acta 1986, 100, 109–118. [Google Scholar] [CrossRef]
- Gotor, F.J.; Criado, J.M.; Malek, J.; Koga, N. Kinetic Analysis of Solid-State Reactions: The Universality of Master Plots for Analyzing Isothermal and Nonisothermal Experiments. J. Phys. Chem. A 2000, 104, 10777–10782. [Google Scholar] [CrossRef]
- Koga, N.; Malek, J. Accommodation of the actual solid-state process in the kinetic model function. Part 2. Applicability of the empirical kinetic model function to diffusion-controlled reactions. Thermochim. Acta 1996, 282–283, 69–80. [Google Scholar] [CrossRef]
- Deroiné, M.; Le Duigou, A.; Corre, Y.-M.; Le Gac, P.-Y.; Davies, P.; César, G.; Bruzaud, S. Seawater accelerated ageing of poly(3-hydroxybutyrate-co-3-hydroxyvalerate). Polym. Degrad. Stab. 2014, 105, 237–247. [Google Scholar] [CrossRef]
- de Melo, C.C.N.; Beatrice, C.A.G.; Pessan, L.A.; de Oliveira, A.D.; Machado, F.M. Analysis of nonisothermal crystallization kinetics of graphene oxide—Reinforced polyamide 6 nanocomposites. Thermochim. Acta 2018, 667, 111–121. [Google Scholar] [CrossRef]
- Favaro, M.M.; Rego, B.T.; Branciforti, M.C.; Bretas, R.E.S. Study of the Quiescent and Shear-Induced Crystallization Kinetics of Intercalated PTT/MMT Nanocomposites. J. Polym. Sci. Part B Polym. Phys. 2010, 48, 113–127. [Google Scholar] [CrossRef]
- Yu, H.-Y.; Yao, J.-M.; Qin, Z.-Y.; Liu, L.; Yang, X.-G. Comparison of covalent and noncovalent interactions of carbon nanotubes on the crystallization behavior and thermal properties of poly(3-hydroxybutyrate- co -3-hydroxyvalerate). J. Appl. Polym. Sci. 2013, 130, 4299–4307. [Google Scholar] [CrossRef]
- Amico, D.A.D.; Cyras, V.P.; Manfredi, L.B. Thermochimica Acta Non-isothermal crystallization kinetics from the melt of nanocomposites based on poly (3-hydroxybutyrate) and modi fi ed clays. Thermochim. Acta 2014, 594, 80–88. [Google Scholar]
- Zhang, H.; Yu, H.; Wang, C.; Yao, J. Effect of silver contents in cellulose nanocrystal / silver nanohybrids on PHBV crystallization and property improvements. Carbohydr. Polym. 2017, 173, 7–16. [Google Scholar] [CrossRef]
- Ambrosio-Martín, J.; Gorrasi, G.; Lopez-Rubio, A.; Fabra, M.J.; Mas, L.C.; Lõpez-Manchado, M.A.; Lagaron, J.M. On the use of ball milling to develop PHBV-graphene nanocomposites (I)—Morphology, thermal properties, and thermal stability. J. Appl. Polym. Sci. 2015, 132, 42101. [Google Scholar] [CrossRef]
- Wei, L.; McDonald, A.G. Thermophysical properties of bacterial poly(3-hydroxybutyrate): Characterized by TMA, DSC, and TMDSC. J. Appl. Polym. Sci. 2015, 132, 42412. [Google Scholar] [CrossRef]
- Yu, H.; Qin, Z.; Zhou, Z. Cellulose nanocrystals as green fillers to improve crystallization and hydrophilic property of poly(3-hydroxybutyrate-co-3-hydroxyvalerate). Prog. Nat. Sci. Mater. Int. 2011, 21, 478–484. [Google Scholar] [CrossRef]
- Shan, G.-F.; Gong, X.; Chen, W.-P.; Chen, L.; Zhu, M.-F. Effect of multi-walled carbon nanotubes on crystallization behavior of poly(3-hydroxybutyrate-co-3-hydroxyvalerate). Colloid Polym. Sci. 2011, 289, 1005–1014. [Google Scholar] [CrossRef]
- Liu, Q.; Zhu, M.; Chen, Y. Synthesis and characterization of multi-block copolymers containing poly [(3-hydroxybutyrate)-co-(3-hydroxyvalerate)] and poly(ethylene glycol). Polym. Int. 2010, 59, 842–850. [Google Scholar] [CrossRef]
- Mandelkern, L. Crystallization ofPolymers: Kinetics and Mechanisms, 2nd ed.; Cambridge University Press: Cambridge, UK, 2004. [Google Scholar]
- Banks, W.; Gordon, M.; Sharples, A. The crystallization of polyethylene after partial melting. Polymer 1963, 4, 289–302. [Google Scholar] [CrossRef]
- Ten, E.; Jiang, L.; Wolcott, M.P. Crystallization kinetics of poly(3-hydroxybutyrate-co-3-hydroxyvalerate)/cellulose nanowhiskers composites. Carbohydr. Polym. 2012, 90, 541–550. [Google Scholar] [CrossRef]
- Garcia-Garcia, D.; Ferri, J.M.; Boronat, T.; Lopez-Martinez, J.; Balart, R. Processing and characterization of binary poly(hydroxybutyrate) (PHB) and poly(caprolactone) (PCL) blends with improved impact properties. Polym. Bull. 2016, 73, 3333–3350. [Google Scholar] [CrossRef]
- Sánchez-Safont, E.L.; Arrillaga, A.; Anakabe, J.; Gamez-Perez, J.; Cabedo, L. PHBV/TPU/cellulose compounds for compostable injection molded parts with improved thermal and mechanical performance. J. Appl. Polym. Sci. 2019, 136, 47257. [Google Scholar] [CrossRef]
© 2020 by the authors. Licensee MDPI, Basel, Switzerland. This article is an open access article distributed under the terms and conditions of the Creative Commons Attribution (CC BY) license (http://creativecommons.org/licenses/by/4.0/).