Review

A Survey of Scrutinizing Delaminated Composites via Various Categories of Sensing Apparatus

by
Khadijeh Askaripour
1,* and
Arkadiusz Zak
2
1
Department of Civil Engineering, Shahid Bahonar University of Kerman, 76169-14111 Kerman, Iran
2
Faculty of Electrical and Control Engineering, Gdansk University of Technology, ul. Narutowicza 11/12, 80-234 Gdansk, Poland
*
Author to whom correspondence should be addressed.
J. Compos. Sci. 2019, 3(4), 95; https://doi.org/10.3390/jcs3040095
Submission received: 22 August 2019 / Revised: 18 October 2019 / Accepted: 18 October 2019 / Published: 30 October 2019
(This article belongs to the Special Issue Feature Papers in Journal of Composites Science in 2019)

Abstract

:
Scrutinizing delaminated composites is extensively conducted based on measurements of various types of nondestructive sensing apparatus, classified herein as systems of thermographic inspection, piezoelectric inspection, optical interferometric inspection, electromagnetic testing, ultrasonic testing, and visual testing. The development of the subject has been reviewed during 2000–2017. Not only does the substantial corresponding literature strongly indicates numerous increasing industrial demand for composites, including carbon fiber-reinforced polymer, glass fiber-reinforced polymer, and fiber-reinforced metal laminate, but also the significant potential of composites to delaminate when subjected particularly to impact, machining operation or manufacturing imperfections. Conducting a study on the corresponding literature, the subject of delamination inspection within composites is found to be a dynamic, mature field, while lacking a thorough literature review. Therefore, the present study addresses the mentioned gap regarding various sensation systems utilized so as to detect internal anomalies in composites for the review arrangement. To that end, the literature inclusion in terms of citation times is electronically adopted associated with an appropriate combination of keywords. The study may be considered as a comprehensive, up-to-date review covering all delamination inspection techniques founded on sensation systems, thus benefiting the readers with information in an organized configuration.

1. Introduction

Based on estimations made by the American Society of Civil Engineers (ASCE), approximately US $ 3 . 6 trillion must be invested by 2020 to improve the current condition of structurally poor infrastructures [1]. Accordingly, it can be concluded that many infrastructures and aircraft are rapidly aging, leading probably to deterioration of their structural properties. For this reason, expensive inspection programs are required to expand the structure’s operational time. In an in-service aircraft, for example, the costs of operation and support, which involve maintenance and inspection, are estimated to consume ~ 25 % of the lifetime cost [2]. As demonstrated in Figure 1.4 in [3], maintenance costs for a given structure without structural health monitoring (SHM) gradually increase within the life cycle, while the structure’s reliability decreases. However, overdue maintenance can be a crucial act to exacerbate the aging phenomenon. Numerous actual accidents occurred during the manufacturing process and in-service operation of different structures have motivated manufacturers to improve the structure’s safety by real-time monitoring. To remedy the problem, structures can be equipped with sensory systems as analogues to the nervous network of living beings. Continuous diagnosis of the state of structural health over time applying these sensory systems during operational life or at the end of manufacturing prior to the in-service process is referred to as SHM. The SHM process involves the following steps; (a) determining the damage existence and damage location, (b) quantifying damage severity, and (c) predicting the residual life. Effectively, the SHM of structures benefits both manufacturers and end users by offering constant low maintenance costs and high reliability particularly for complex structures [3].
Many nondestructive evaluation (NDE) techniques, as a part of SHM, have been developed to evaluate the internal state of structures. NDE techniques can provide a measurement of structural properties of material usually without causing any permanent damage or dismantling. Using delamination as a frequently occurred internal, invisible damage in composites can consume up to 60 % of the material’s initial stiffness. Therefore, extensive research works have particularly been conducted on the delamination detection in composites applying various sensors since 2000. In the knowledge of the authors, there is no comprehensive review on this topic in the literature even though the topic is a dynamic, mature field to arrange a literature review. Integrating and comparing the research works published on the topic into a literature review, so as to conclude advantages and disadvantages of different NDE techniques, will be a proper way for readers. The present literature aims to review each NDE technique along with its characteristics.
The literature collected to be part of the present review has been searched based on some keywords related to the subject in the electronic database of Web of Science. The advantage of using the database is providing the most comprehensive citation analysis for searching articles and containing a broader journal spectrum. Search is based on a combination of keywords, i.e., both “delamination” and “composite” as well as different NDE expressions considered as individual keywords stated in Table 1.
A literature division of interest may be the rate at which the subject has developed during the recent years post-2000, as depicted in Figure 1a. In this division, a broader scope of all published articles (upper bound) and journal articles of close relevance to the subject (lower bound), including experimental, numerical, and theoretical delamination modeling and identification techniques are taken into account. Then, the review or original journal articles related to delamination detection in composite structures involving experimental studies published has been included to organize the present review. Another criterion for selecting the set of articles is having an acceptable citation where extensive literature is available. Furthermore, the literature identified may be organized into two main categories, in which one category employs contact-based apparatus and the other employs non-contact-based apparatus for data acquisition. With this regard, a chart containing NDE techniques classified into six groups illustrates schematically, a quantitatively approximate of this organization, is depicted in Figure 1b.
The outline of the present paper is organized as follows. The importance of composites the delamination occurrence therein, and, eventually, the necessity of NDE techniques are mentioned in Section 2. Hierarchical structures of six NDE techniques, including thermographic inspection, piezoelectric inspection, optical interferometric inspection, electromagnetic testing, ultrasonic testing, and visual testing, along with the respective references are provided in Section 3. Industrial applications of the NDE techniques are provided in Section 4. Section 5 is devoted to the outstanding characteristics of measurements resulted from aforementioned NDE techniques and a general division thereof. Section 6 and Section 7 are, respectively, dedicated to the review description and some exemplary results of six NDE techniques. Finally, the review is summarized in Section 8 containing advantages and disadvantages of each category.

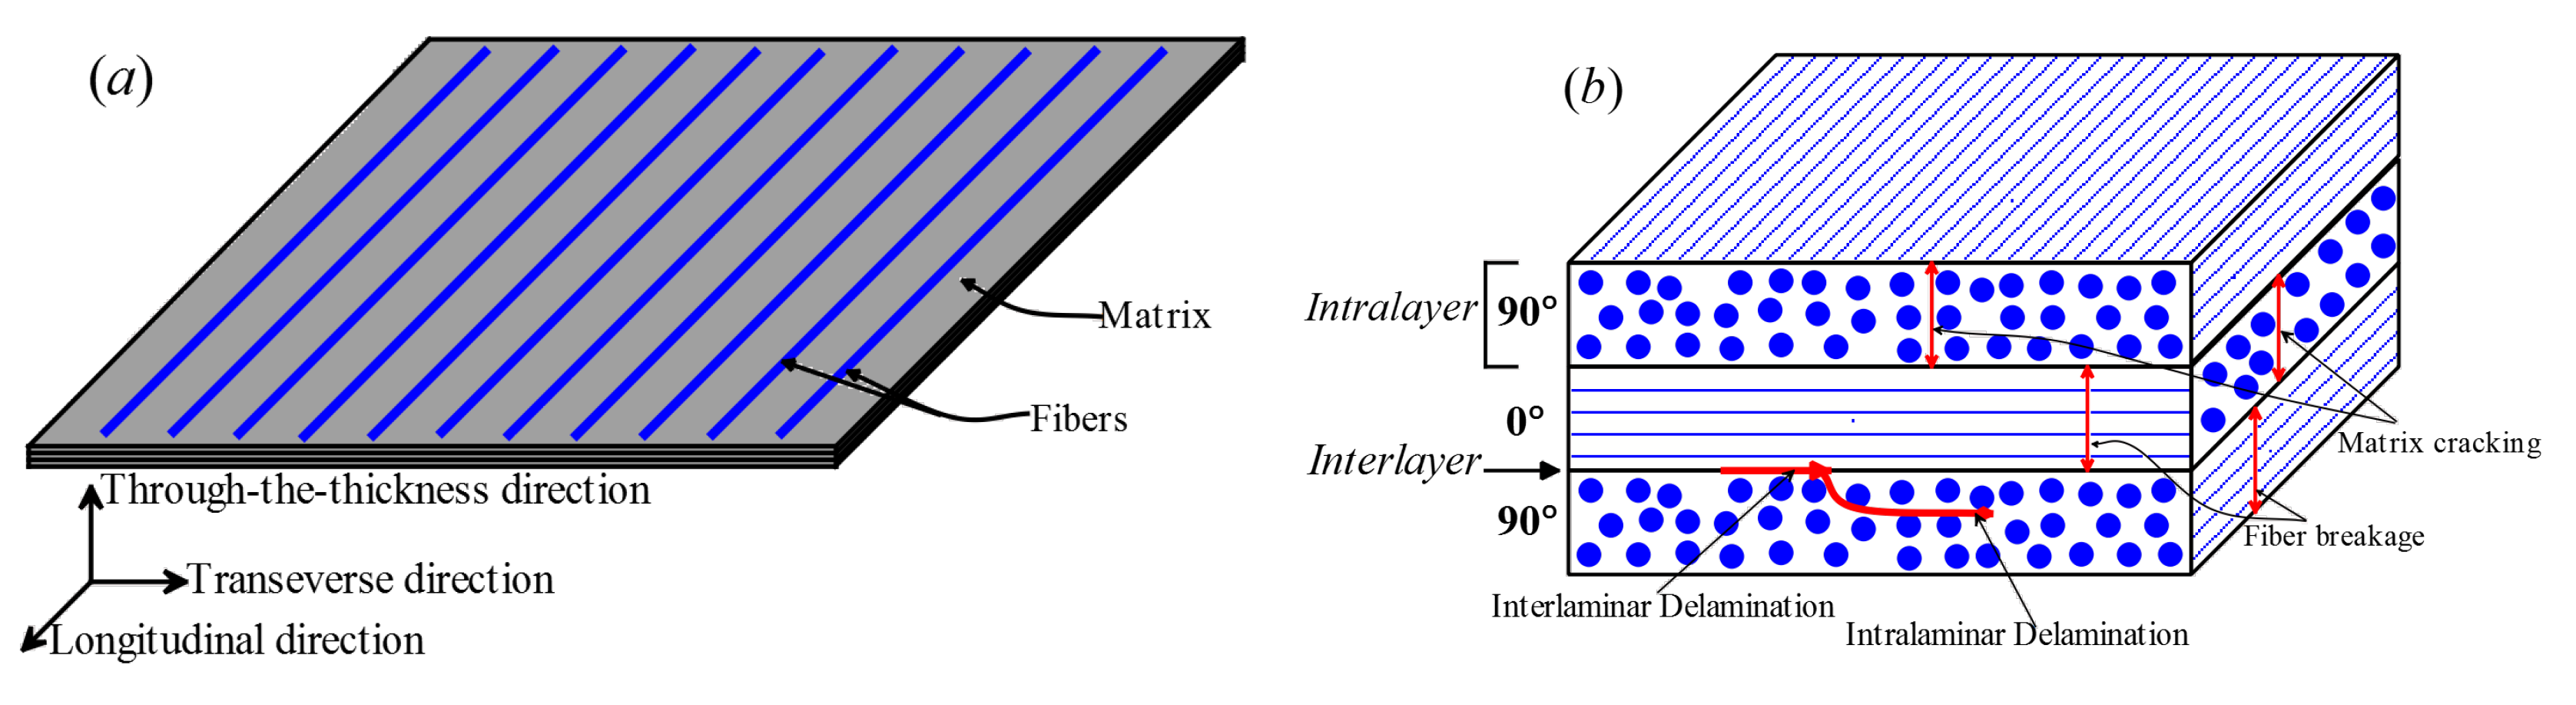
2. Delamination Damage in Composites

Different demands appearing in numerous industries have progressively led to the use of materials of various properties in a single structure, known as the composite structure. To that end, fiber-reinforced laminated composite structures assembling different types of numerous laminas, whose components are fiber and matrix, may provide desired material’s properties in various directions. Various types of fibrous composites including carbon fiber-reinforced polymers (CFRPs), glass fiber-reinforced polymers (GFRPs), and fiber-reinforced metal laminates (FRMLs) have primarily attracted the attention of researchers. With regard to lamina components, geometrical and structural perspectives of anisotropy of fiber will make outstanding mechanical, thermal, and electrical properties lengthwise contribute to those of the composite lamina [4]. The other consequence of fiber’s anisotropy, the high fiber–matrix interaction surface area whose function is load transfer, needs to be assessed to develop perfect adhesion. A schematic illustration of the structure of the laminated composite is shown in Figure 2a. Structural constituents of fiber–matrix adhesion and lamina–lamina adhesion, weak mechanical properties perpendicular to the fiber direction, as well as brittle nature of fiber are, therefore, prone to introducing damage modes into laminated composites and eventually to their failure.
Imperfections due to the composite manufacturing process in either lamina or laminate levels, the machining process to assemble different parts in structure level, and variously directed loading in service particularly low- or high-velocity, out-of-plane impact can be a source of stress concentrator, thus initiating damage modes in laminated composites. Accordingly, the functionality of laminated composites may be influenced by either in-plane damage modes (e.g., matrix shear cracking (splitting), matrix tensile cracking, fiber breakage, and micro-buckling) or out-of-plane damage mode (e.g., delamination) [5]. These dominant damage modes can appear in a sequential arrangement or can be accompanied by each other. For example, a group of matrix shear micro-cracks progressively develops into a matrix splitting macro-crack. Afterward, the splitting crack is accompanied by interlaminar delamination when intersecting lamina–lamina interfaces and by matrix tensile cracking in contiguous laminas. Moreover, matrix cracking is followed by delamination. Figure 2b depicts an illustration of such damage modes. Enormous intellectual attention has been attracted toward interlaminar delamination as one of the most crucial damage modes. The importance of considering delamination in investigation of the structural integrity of composites may be regarded as follows; (a) its certain occurrence under frequently applied in-service impact loading, (b) its invisible nature which almost makes delamination detection impossible by visual techniques and the necessity to consider its actual geometry in modeling, and (c) its dramatic role on degradation of mechanical properties [6].
The occurrence of internal voids or delamination along interlayers and debonding between the matrix–fiber interface during manufacturing process is of high probability in laminated composite structures. Propagation of these hidden damages or their initiation due to high interlaminar stresses in service may happen, as well. Additionally, laminas aligned with different directions may be a potential factor to make delamination owing to changing the in-plane stiffness of laminate through the thickness direction. In other words, delamination within non-unidirectional laminates is smoother to introduce under different loading patterns. Therefore, the application of NDE techniques for monitoring the state of structural health over lifetime will be necessary.
Notably, there have been developed various techniques for reinforcing laminated composites in through the thickness direction. Three-dimensional weaving, stitching, and z-pinning techniques can be placed into this category which enhances the delamination resistance [7]. As a technique for diminution of the delamination growth, the highly effective z-pinning method inserts thin metal or fibrous pins along the thickness direction of laminates. Through-thickness reinforced laminates, compared with unpinned samples under impact, have revealed less damage in c-scan images [8]. For more information in this regard, see [9,10].

3. NDE Techniques

The frequently used NDE techniques for delamination detection associated with sensing equipment can be classified into six following groups: (a) thermographic inspection mainly including Eddy-current thermography, pulsed thermography, step thermography, lock-in thermography, and vibrothermography; (b) piezoelectric inspection including piezoelectric sensors; (c) optical interferometric inspection [11] involving two classes, i.e., camera based interferometry such as moiré interferometry, speckle pattern interferometry, holography and shearography, and detector-based interferometry such as scanning laser Doppler vibrometer and fiber Bragg grating (FBG) sensors [12]; (d) electromagnetic testing including radiography, computed tomography, Terahertz (THz) spectroscopy, and electrode strips; (e) ultrasonic testing usually incorporating a couplant medium including electromagnetic acoustic transducers, air-coupled transducers, ultrasonic C-scan testing, and phased array ultrasonic transducer; and, finally, (f) visual inspection including microscopy.
(a) 
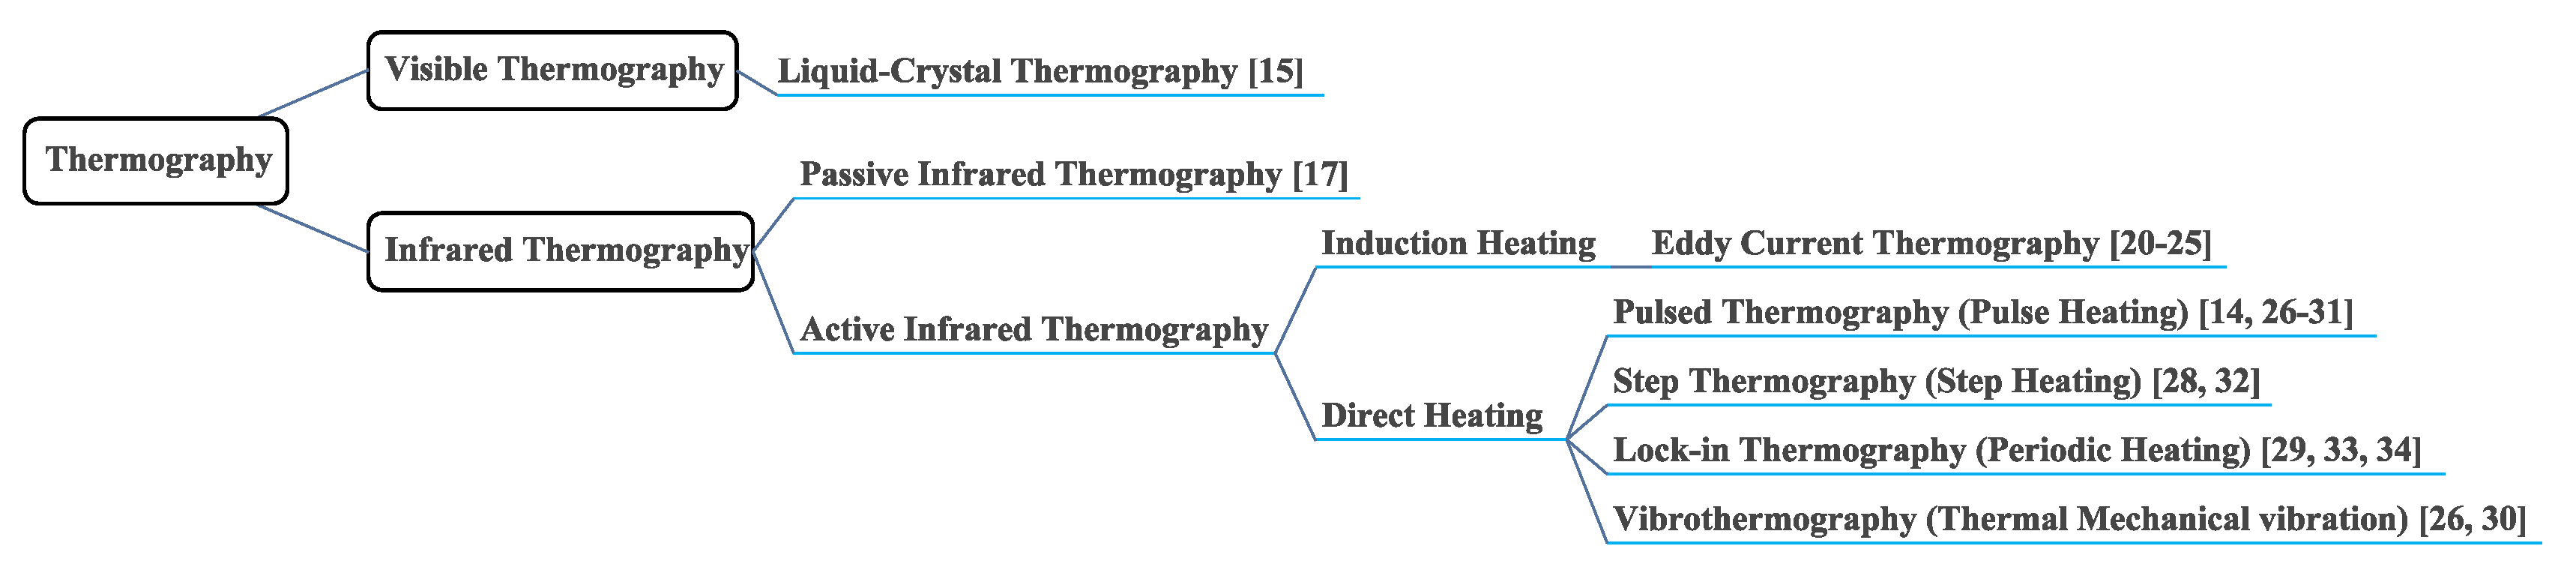
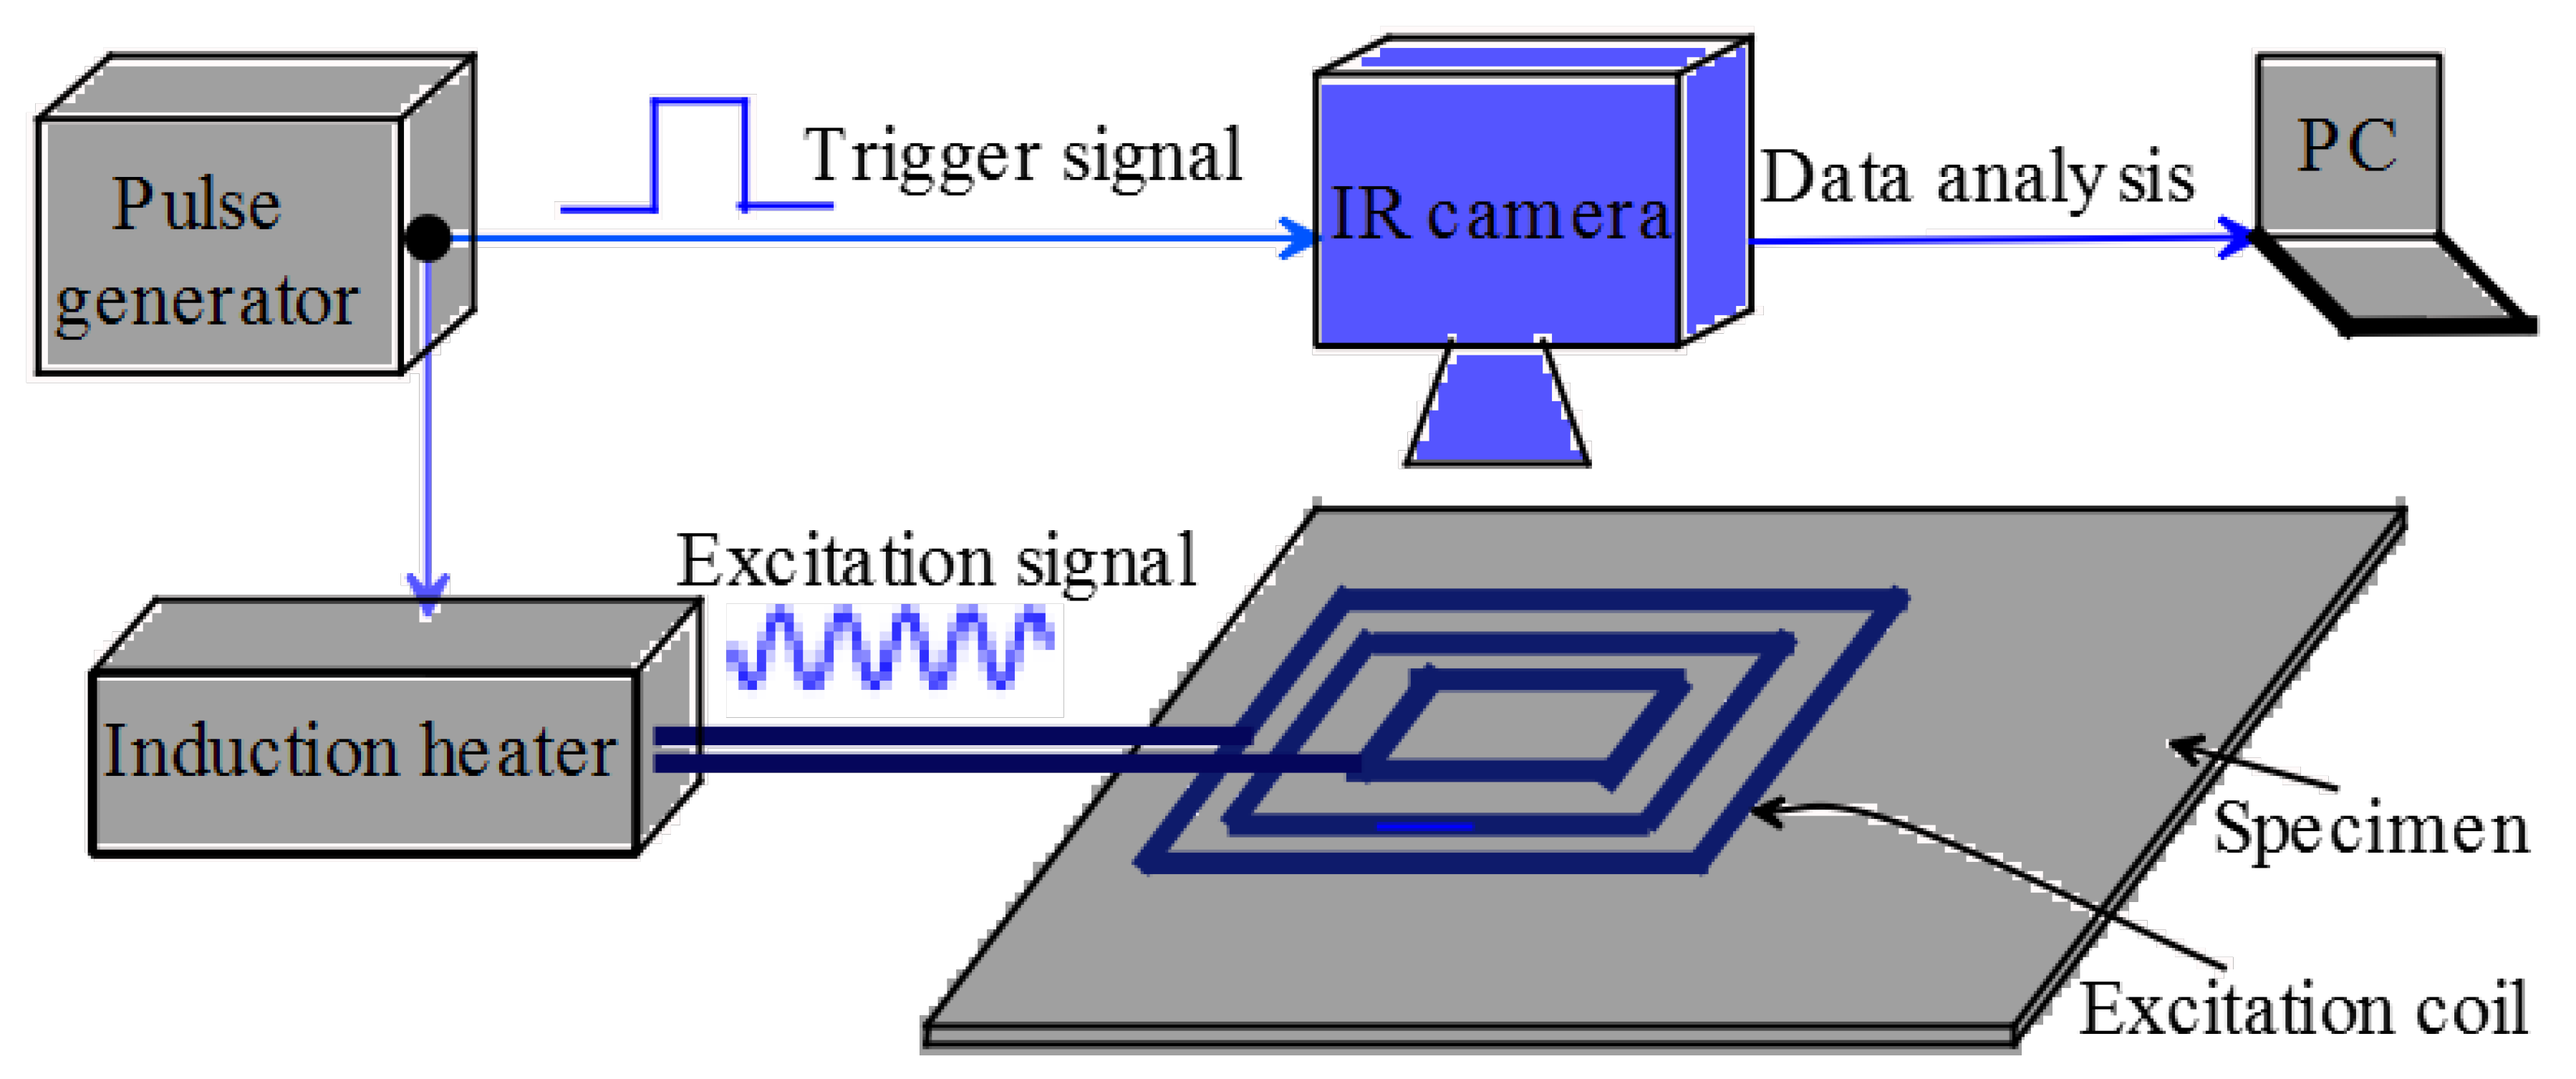
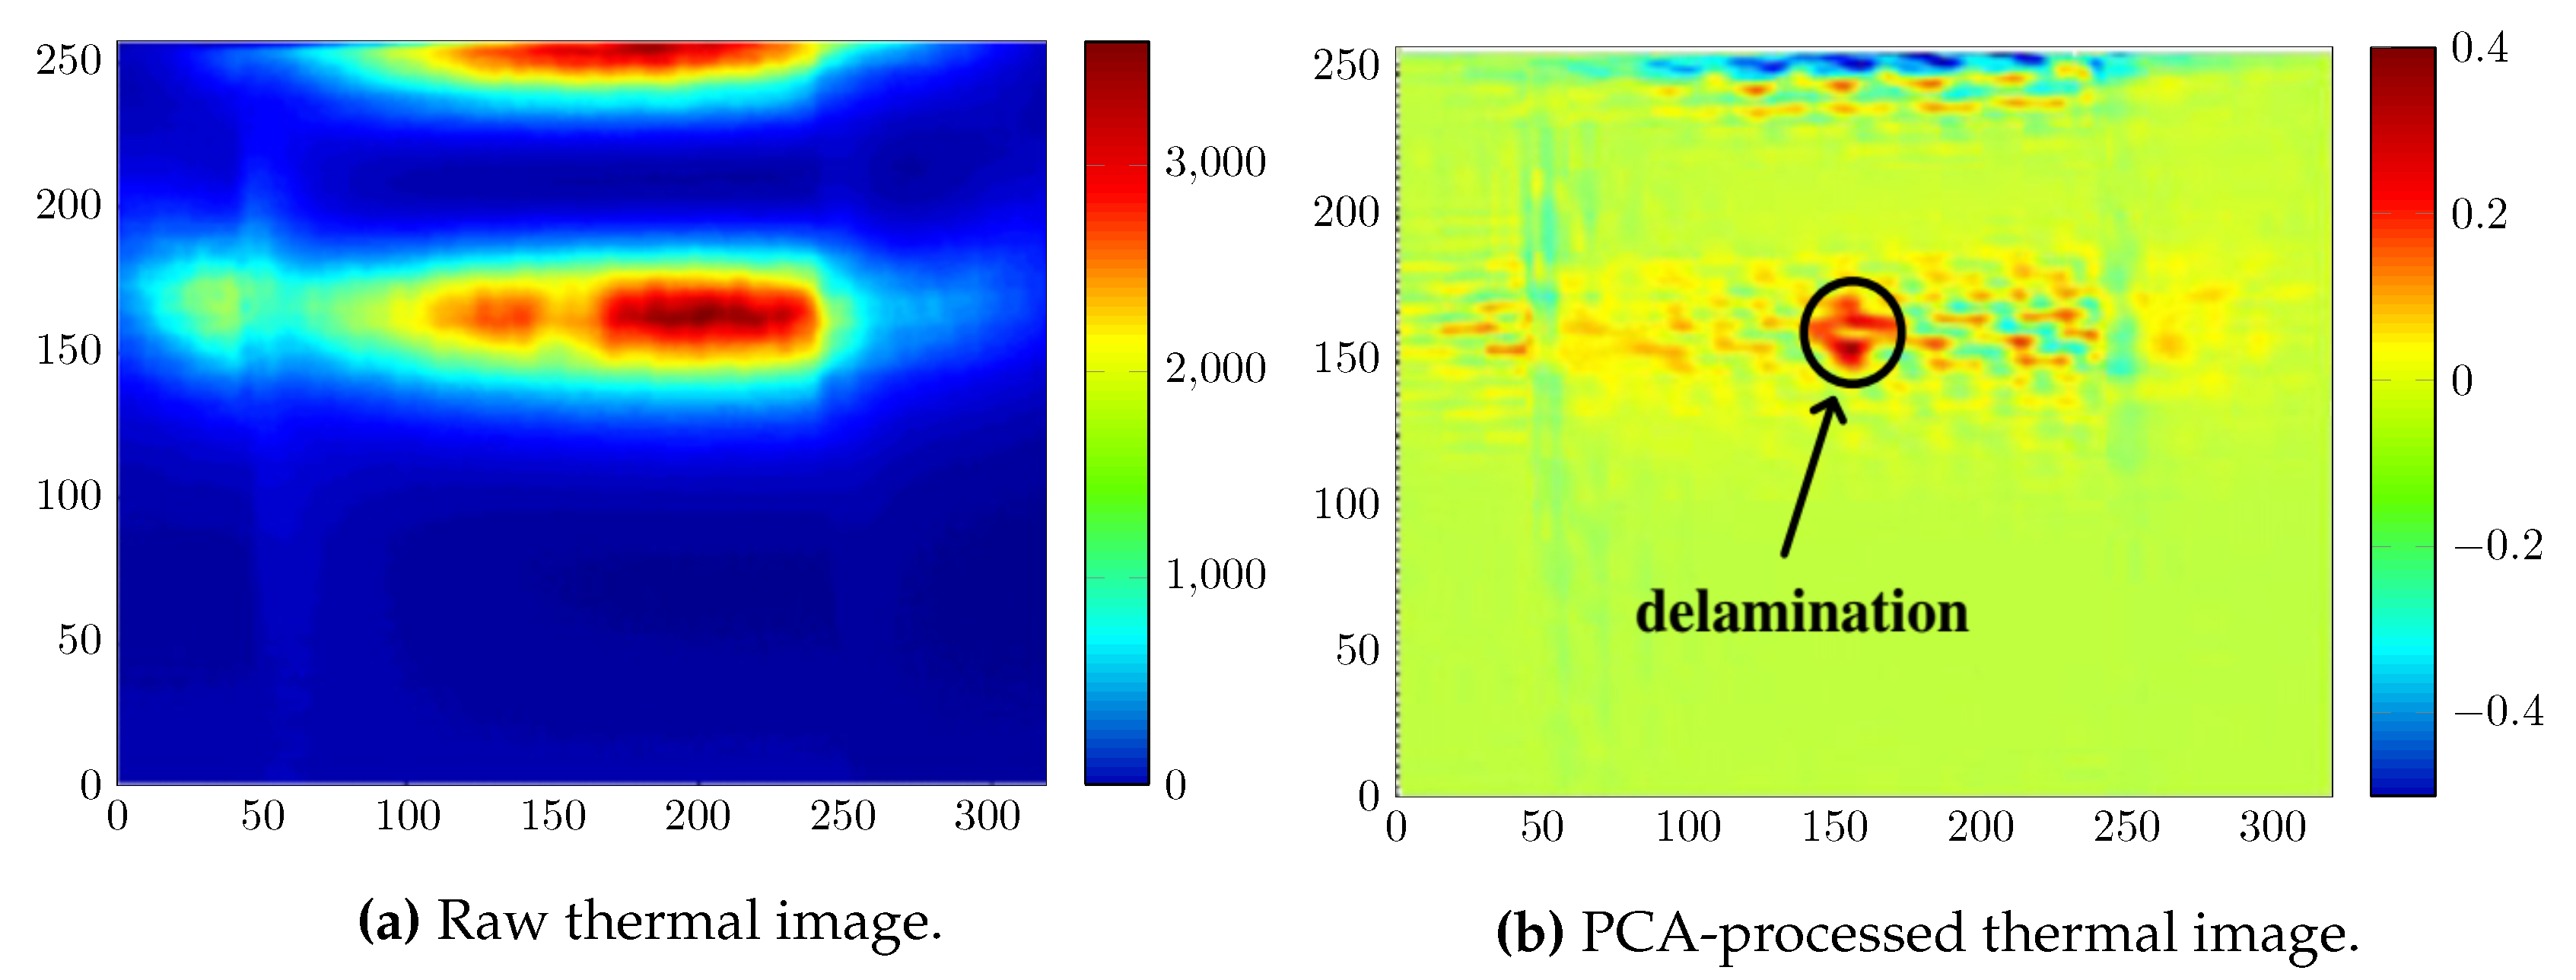
Thermographic inspection: Thermography can be considered as a branch of electromagnetic inspection since heat is a result of the material’s resistance to the input current flowing through it. However, it is separated due to rich information in the field.
Thermography employs the principle that thermal properties of different materials including a host structure and embedded discontinuities cause thermal radiation to differ. The range of thermal radiation in most applications is placed at the infrared area of the wavelength spectrum [13,14]. Therefore, high-precision infrared cameras have extensively been applied to acquire thermal information and convert them into a map of surface temperature, developing infrared ray (IR) thermography. However, visible thermography incorporating color cameras has been used toward an inexpensive technique compared to IR thermography, as well. Thermographic inspection is hierarchically illustrated in Figure 3. Visible liquid–crystal (LC) thermography acts based on the fact that LCs having a dynamic phase between solid and liquid exhibit phase transitions against temperature changes, reflecting visible colors [15]. In [15], LC is sprayed on one side of the sample coated with paint and the other side is heated. Temperature maps appeared in the form of visible lights are captured by a color camera. According to Figure 3, IR thermography is classified into (a) passive infrared (PIR) thermography and (b) active infrared (AIR) thermography [13,16]. PIR thermography without employing any external heat acquires thermal radiation of the specimen’s surface resulted from the in-service operation or natural ambient lights. In this regard, a rotor blade operating under production or repair processes, under frequently changed loads such as heavy wind, or under sun illumination can be pointed out [17]. On the other hand, the specimen’s surface is externally exposed to energy sources, including electromagnetic, optical, and mechanical excitations, to disturb thermal equilibrium in AIR thermography by which the accuracy of the inspection will be increased against environmental noises [18]. Generally speaking, temperature maps of thermography are characterized as full-field, non-contact, fairly fast, and effective for detecting multiple damages in complex composite structures.
AIR thermography has extensively been applied for delamination detection in composite structures, owing to its reliable temperature measurement resulted from the application of controllable heating [19,20,21,22,23,24,25,26,27,28,29,30,31,32,33,34]. Depending on the excitation source used, there are two types of heating techniques: (1) electromagnetic induction heating [20,21,22,23,24,25] and (2) thermal direct heating [26,27,28,29,30,31,32,33,34]. The former technique, known as eddy current (EC) thermography (induction thermography), induces EC in the specimen by an electrical excitation generated through the induction coil placed adjacent to the specimen. The EC induced generates resistive heating by which discontinuities are detected [19]. The latter technique can be organized into pulsed thermography [26,27,28,29,30,31], step thermography [28,32], lock-in (LI) thermography [29,33,34], and vibrothermography [26,30] depending on the type of the excitation source and exposure time. In another classification, non-contact pulsed thermography, step thermography, and LI thermography are included in optical excitation thermography, whereas vibrothermography, as a contact-based technique, is placed in ultrasonic mechanical excitation thermography [30], requiring the excitation source to be coupled to the specimen’s surface. Relating to optical excitation thermography, pulsed thermography technique applies high energy within a short time by means of the heat generated from flash lights; whereas, in step thermography, the specimen’s surface is incrementally heated, for instance, by a halogen lamp within a relatively long time. It has been alluded that step heating is appropriate to inspect composites under impact damage [32]. Furthermore, LI thermography is stimulated by either a halogen lamp, termed optical LI thermography, or a high-frequency guided wave, termed ultrasound LI thermography. In the process, a periodic input stimulation applied to the specimen’s surface penetrates into the specimen while shifting phase. Then, the interference of the reflected part of the wave in the input wave at the specimen’s surface will effect an interference pattern, utilized for detecting internal anomalies and discontinuities. Regardless of the class of IR thermography technique utilized, infrared camera map surface infrared radiation is induced by numerous external stimuli into thermal images within a specified time.
(b) 
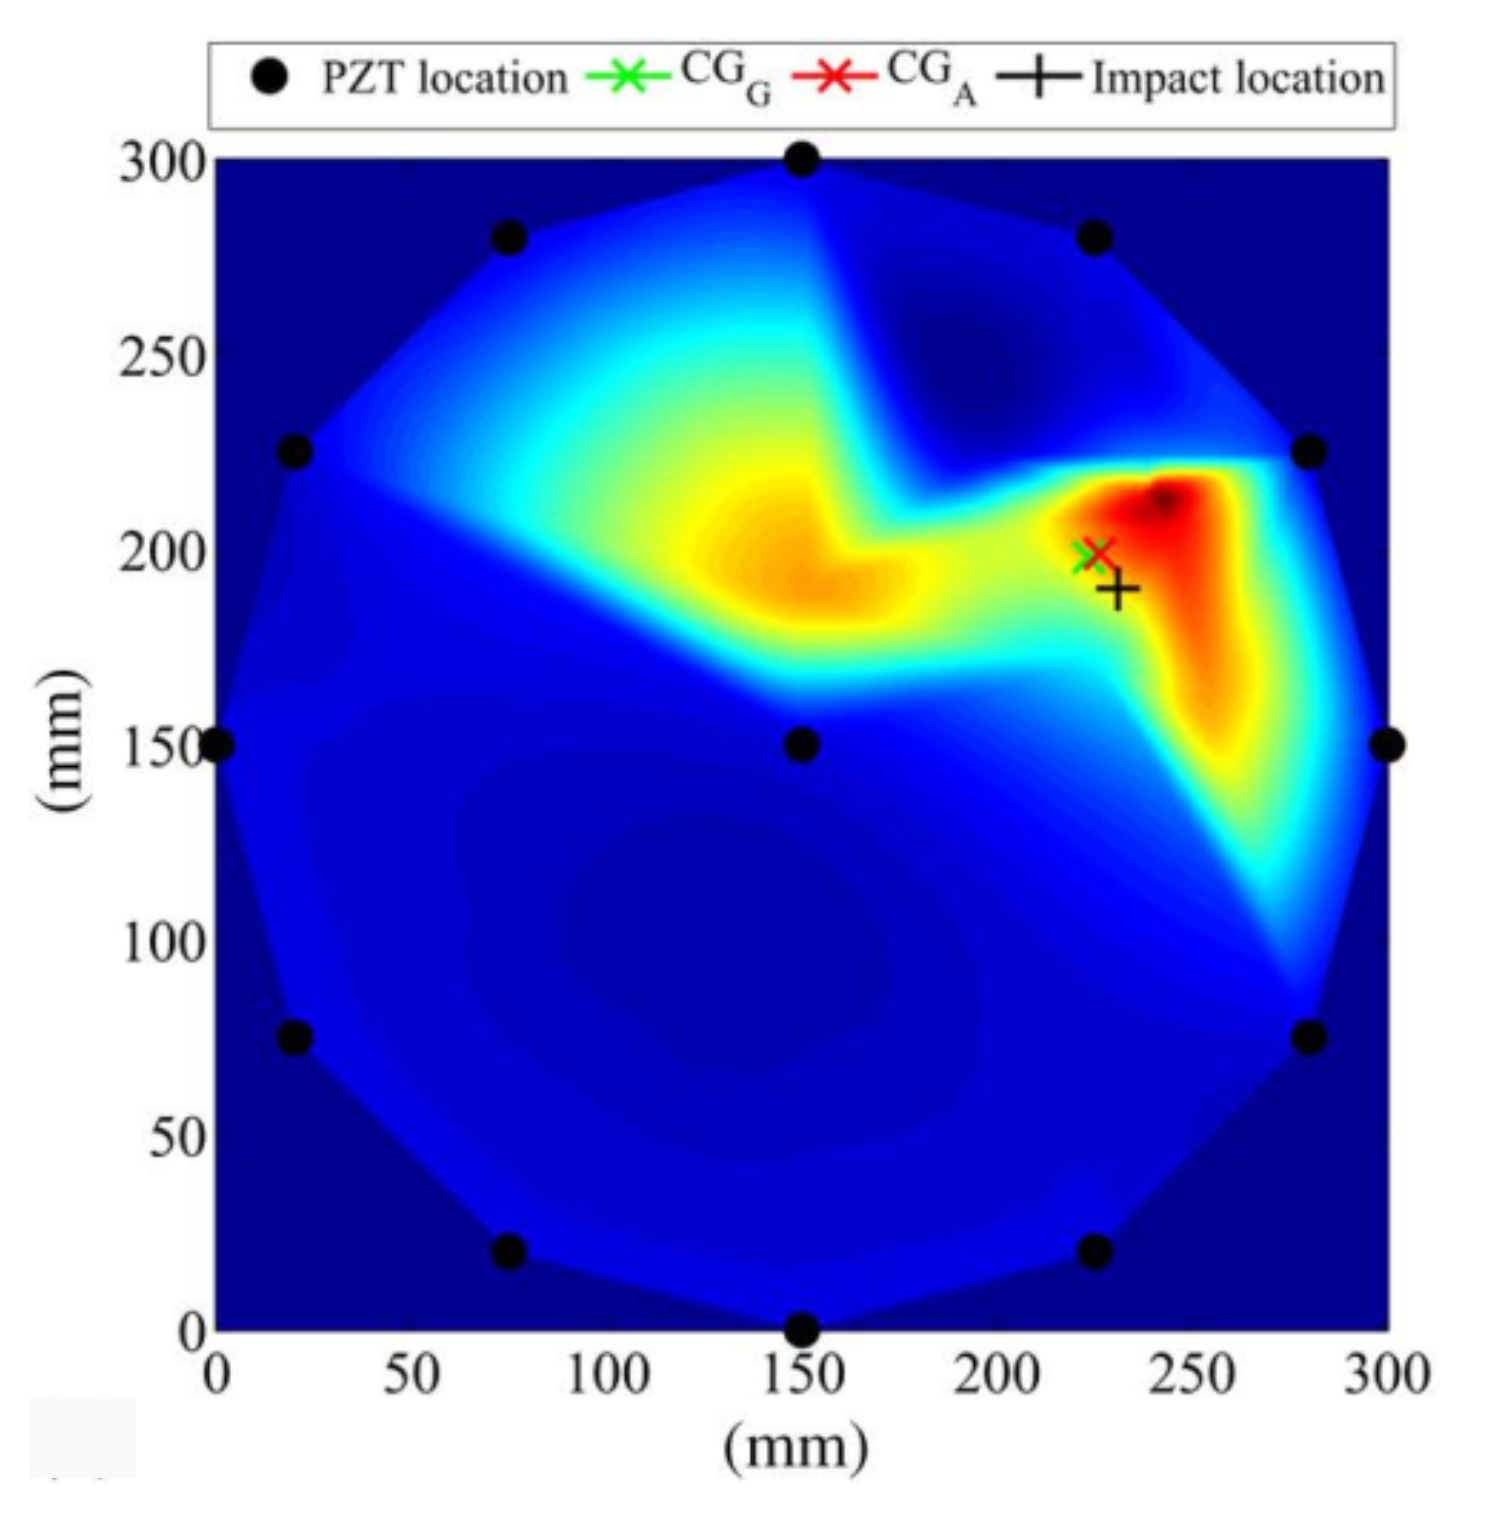
Piezoelectric inspection: Notably, when employing a short ultrasound pulse for detection of materials with high sound conductivity, piezoelectric inspection can be placed into ultrasonic inspection. However, the authors’ preference is to assign a separate section to it due to extensive research works.
Utilizing piezoelectric sensors to inspect composite laminates integrity, termed as piezoelectric inspection, can be considered as one of the active research areas of NDE techniques. The functionality of piezoelectric transducers in this technique is associated with the piezoelectric effect, as a reversible effect between the mechanical deformation and electrical field. Piezoelectric (PZT; lead zirconate titanate) transducers can be bonded with the host composite’s surface (surface-bonded PZT) or be embedded into composite laminates during manufacturing (embedded PZT), out of which the latter allows for developing smart composite structures. The PZT-composite’s surface bond necessitates meticulous surface preparation, and the configuration should also be treated with caution against external loading. Surface-bonded PZT transducers configured in various patterns have extensively been employed to both excite and detect different laminated composite structures subjected to delamination in various actuator–sensor locations associated with pitch-catch or pulse-echo modes, as explained in ultrasonic inspection section. As they represent potentially exciting composites, piezoelectric inspection based on vibration-based methods, acoustic emission, and ultrasonic elastic waves are illustrated in Figure 4, referring to the respective technical literature [2,35,36,37,38,39,40,41,42,43,44,45,46,47,48,49,50,51,52,53,54,55,56,57,58,59,60,61,62].
According to Figure 4, in acoustic emission (AE)-based inspection, AE is referred to those waves resulted from energy release in a structure containing damage, thereby categorized as a passive technique. AE without any external excitation is therefore propagated only in loaded structures while it is usually recorded by means of a PZT sensor, also known as AE sensor. The AE technique has proved the potential to be applied as an NDE technique for damage detection in composites. Not only is this technique prone to localize the AE source, but also to identify damage mode type considering energy emitted in different directions. For example, signals emitted from delamination form low-frequency flexural waveforms, whereas fiber breakage and matrix cracking emit high-frequency extensional waveforms [63].
Elastic waves, known as mechanical waves, requiring an elastic medium to be propagated, can be classified into bulk waves and surface waves, as a consequence of partially constraining the medium [64]. With respect to the motion of medium elements as well as wave propagation direction, bulk waves are divided into longitudinal (primary) and shear (secondary) waves, whereas Rayleigh and Lamb waves are placed in the surface wave class. Elastic wave technique has abundantly been utilized as an NDE technique to inspect composite laminates containing delamination via piezoelectric sensors. PZT transducers can be applied as a wave source to initiate delamination detection.
(c) 
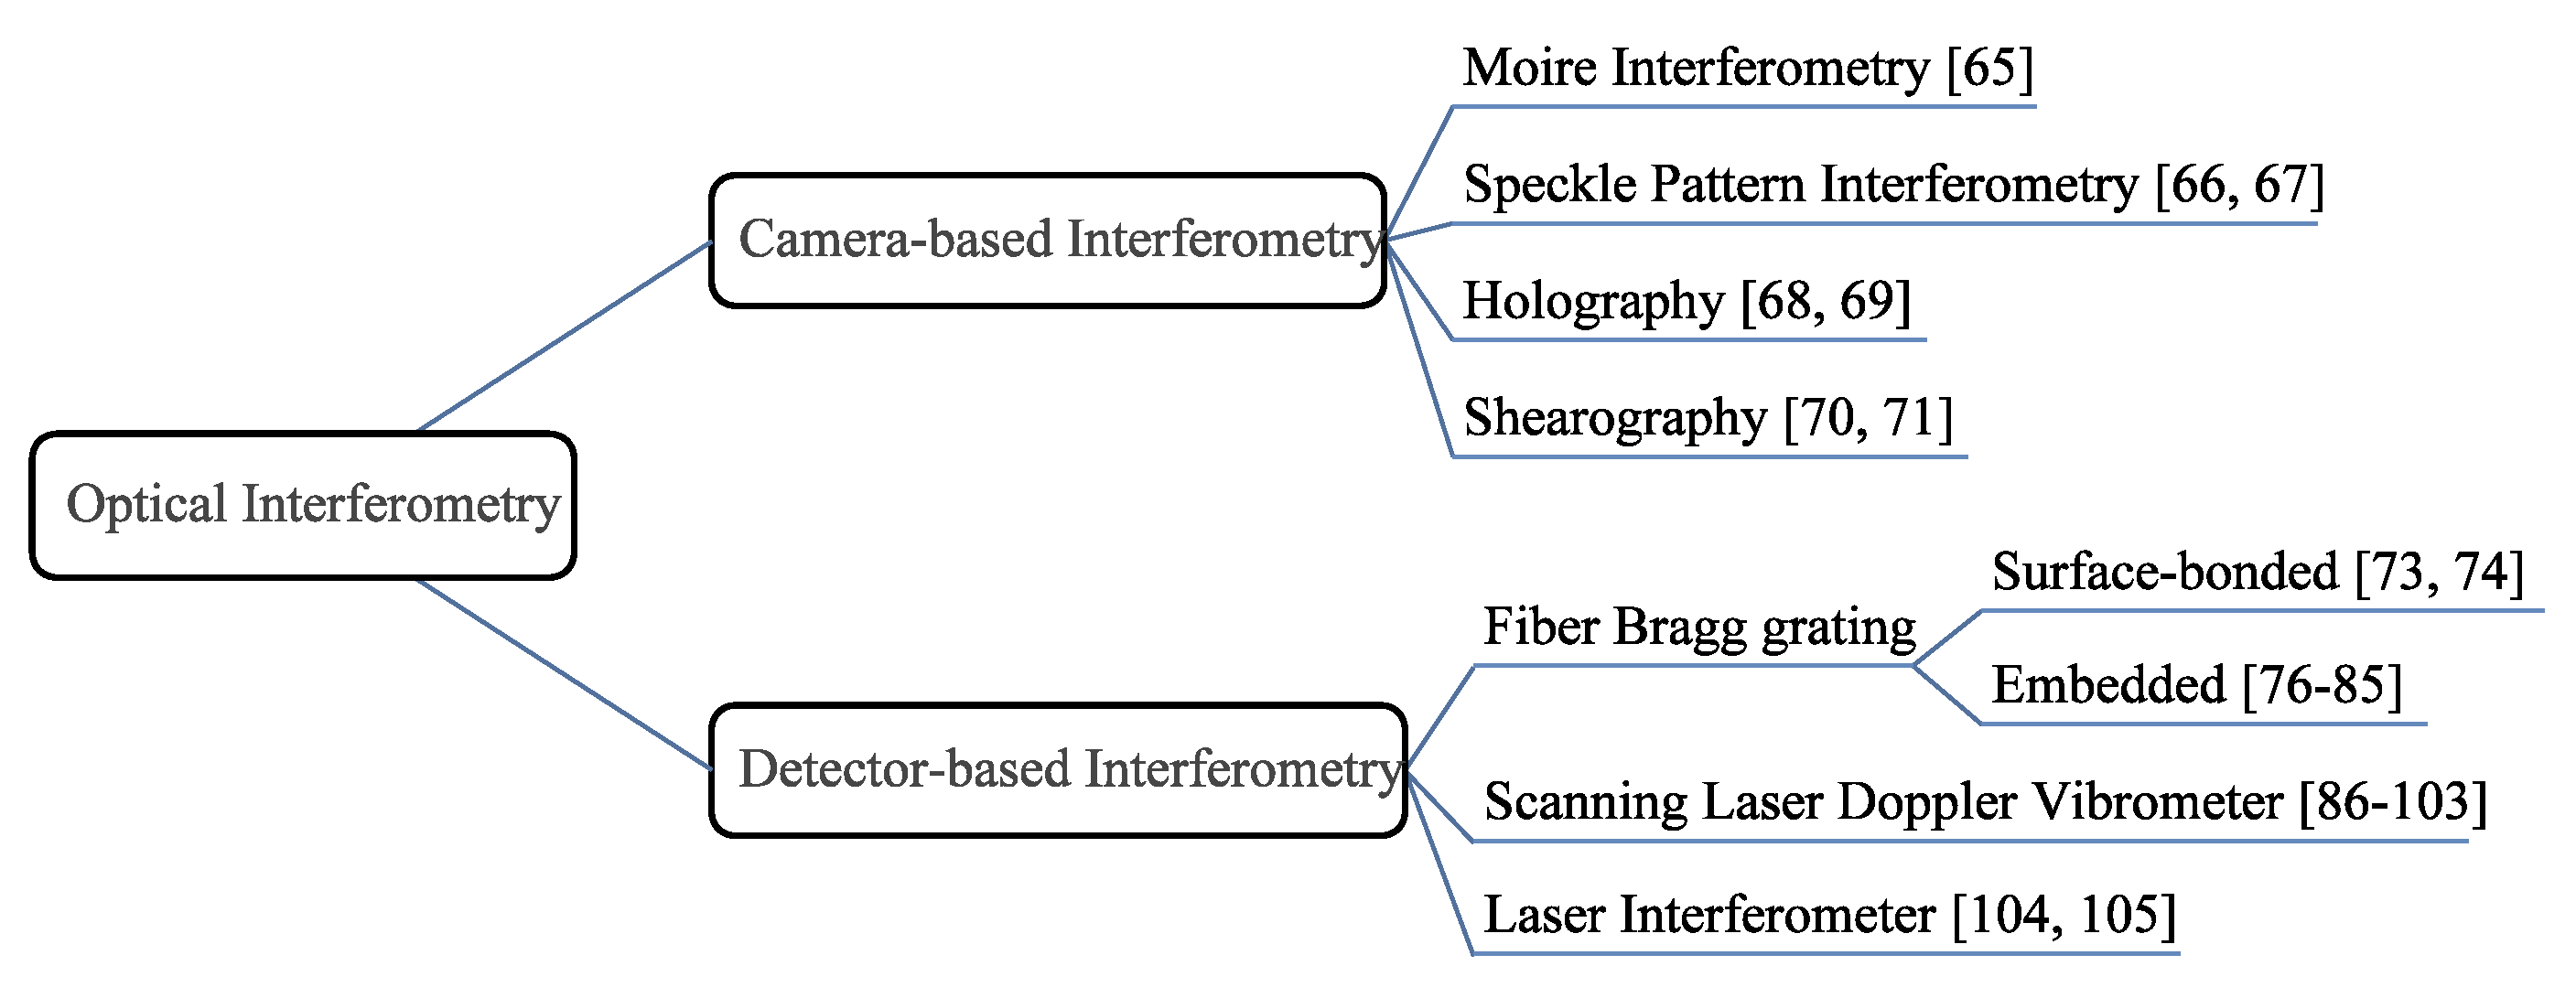
Optical interferometric inspection: NDE techniques based on optical interferometry, emitting a laser light toward the specimen’s surface, make use of the waves principle of superposition effecting the interference phenomenon so as to extract information. To accurately extract output information, various fringe processing strategies such as phase shifting or transform methods need to be incorporated into the system. The basic concept of phase shifting interferometry is inserting a device (e.g., a PZT transducer) into the optical path to incorporate known phase shifts. As depicted in Figure 5, the techniques may classified into camera-based interferometry [65,66,67,68,69,70,71] and detector-based interferometry [72,73,74,75,76,77,78,79,80,81,82,83,84,85,86,87,88,89,90,91,92,93,94,95,96,97,98,99,100,101,102,103,104,105], out of which the former is limited in temporal domain resolution, whereas the latter limited in spatial domain resolution [11].
In second classification, when coupling a broadband light into the fiber, local FBG sensors using Bragg gratings as sensing elements placed within an optical fiber reflect back a narrowband signal whose peak wavelength (Bragg wavelength) depends on the grating’s period and effective refractive index. Bragg wavelength can be affected when exposing FBG sensor to either mechanical strains or temperature changes, requiring thus discrimination of temperature-strain effects by designing an individual temperature compensation FBG [106]. Owing to the benefits of decisive factors such as electromagnetic immunity, small dimensions, lightweight, long lifetime, corrosion, and high-temperature resistance, and multiplex and embedding capabilities compared to strain gauges, the FBG sensor attached in surface-bonded or embedded configuration has found practical applications in composite health monitoring particularly for local average strain measurements [72,73,74,75,76,77,78,79,80,81,82,83,84,85]. However, the FBG’s lower sensitivity to AE signals as well as the higher cost to cover a large area than PZT sensors led to the cooperative application of FBGs and PZTs. Upon drawbacks, FBG’s responses are complicated to be associated with strain field distribution, thus used in short gauge lengths or surface-bonded configuration with limitations imposed on their position and orientation [82]. Embedded FBGs are considered the best option for internal strain monitoring, owing to their high compatibility with composites under harsh situations, the capability of controlling fabrication process-induced thermal residual strain, and not affecting structural properties when embedded parallel to reinforcing fibers. Nevertheless, as this is a challenge relating the output of embedded FBGs to the structure’s strain, the following steps need to be taken; transfer the deformation and wavelength shifts of the reflected signal into the FBG’s strain and transfer FBG’s strain into composite’s strain [75]. The other technique, laser Doppler vibrometry (LDV), as a non-contact NDE technique, yields the target point’s velocity by directing a laser beam toward the specimen’s surface and extracting its vibration components from the Doppler shift of the frequency of the reflected laser.
(d) 
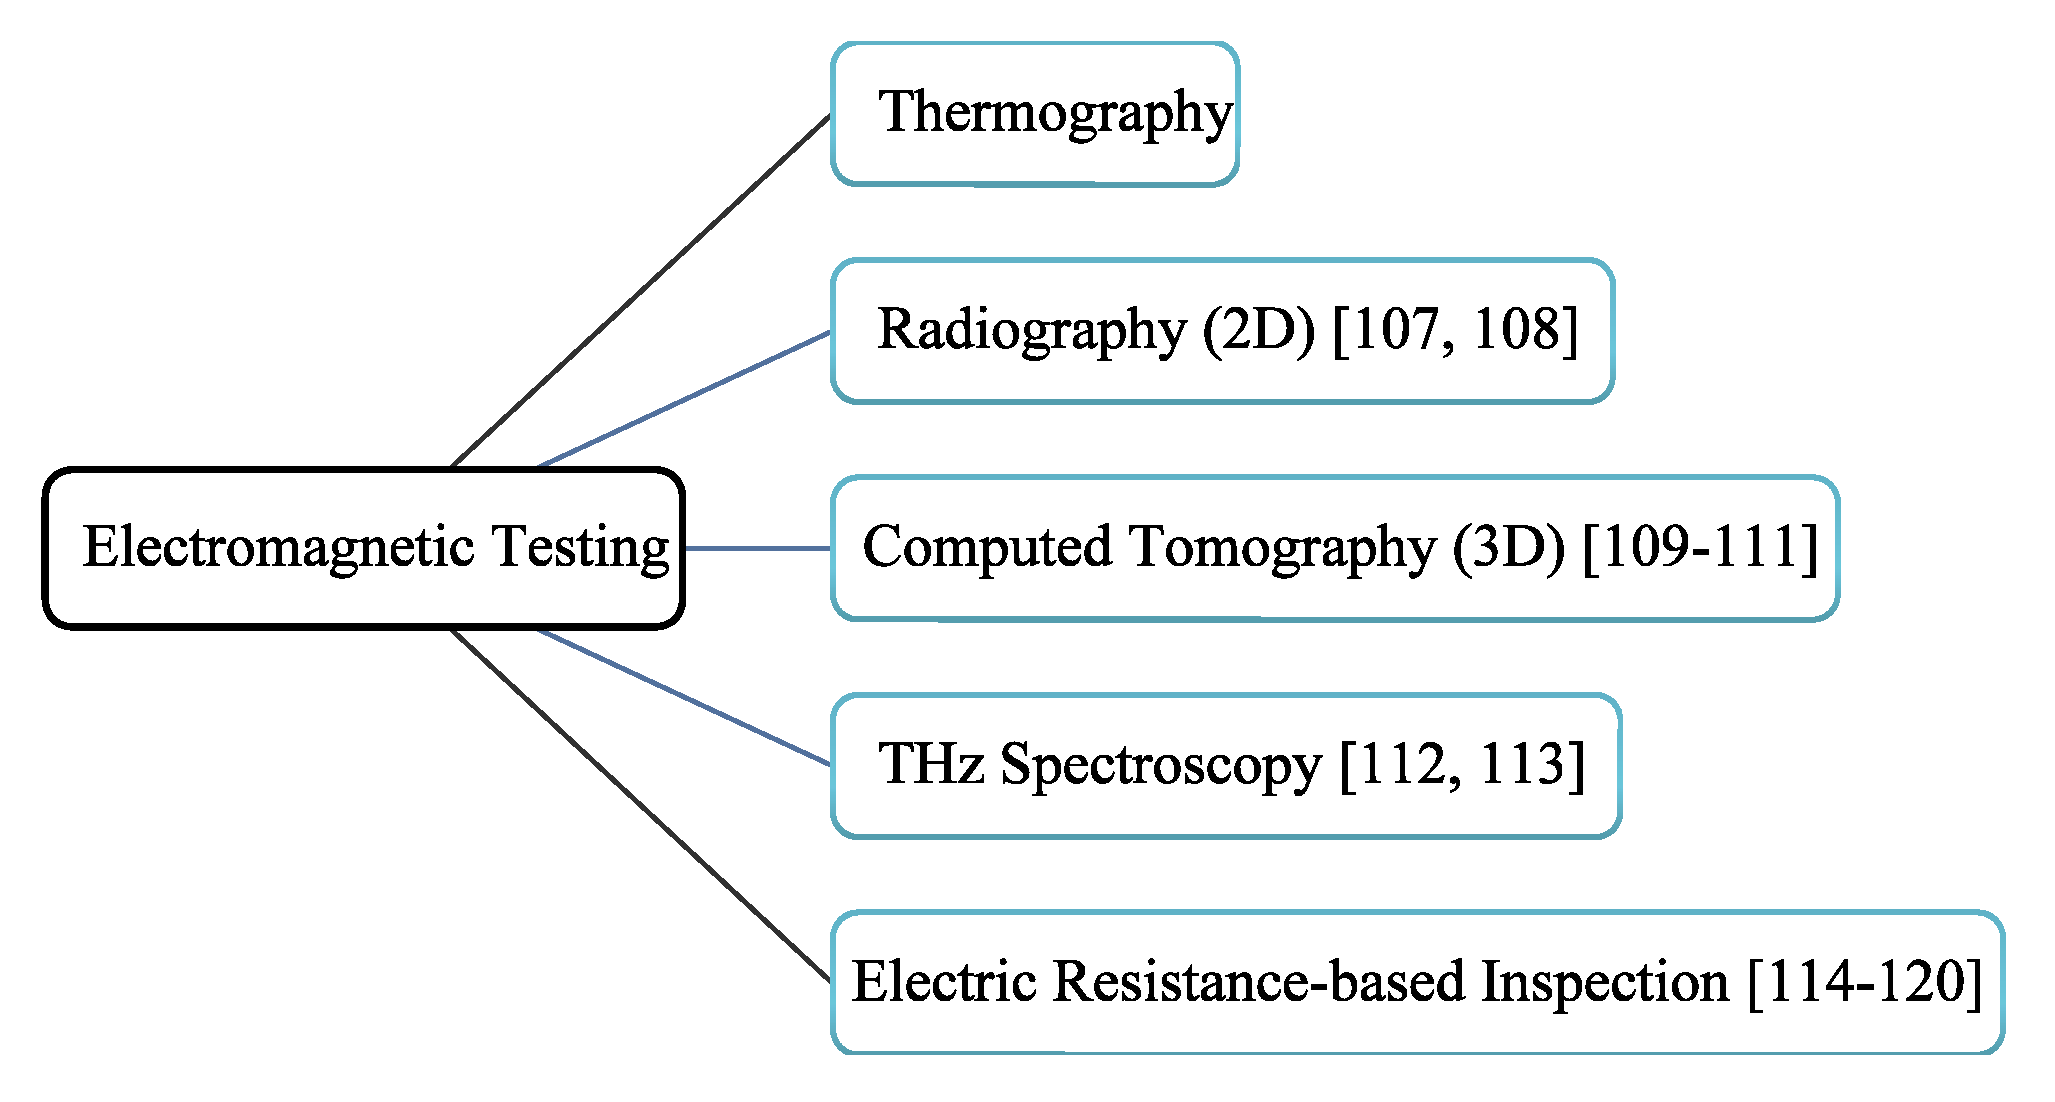
Electromagnetic testing: In NDE electromagnetic testing, composite laminates undergo a process in which the internal anomalies are inspected in terms of electromagnetic responses utilizing electric currents or magnetic fields induced. As shown in Figure 6, radiography, computed tomography, terahertz (THz) spectroscopy, and the electrical resistance change-based method may be included in electromagnetic testing [107,108,109,110,111,112,113,114,115,116,117,118,119,120]. In addition, thermography, as explained above, is a part of electromagnetic testing.
Radiography imaging technique has been applied to inspect the internal structure of composite laminates using an x-ray generator and detector mapped in a 2D representation. For computerized processing X-ray images captured from different angles in either transmission mode or reflection mode, computed tomography (CT) technique produces a 3D representation of the specimen. In another technique, utilizing terahertz (THz) radiation of electromagnetic spectrum, ranging from 100 GHz to 10 THz, THz spectroscopy has recently been introduced for NDE field within fiber-reinforced composites, out of which CFRP inspection owing to the carbon’s conductivity has, to date, demonstrated THz waves to be effective only for near-surface damages, whereas THz waves can penetrate deeper into GFRP composites to detect the composite’s structure and buried damages such as delamination. THz waves are excited using an ultrafast laser within a THz time-domain spectroscopy system, involving a THz transmitter and receiver configured in either transmission mode or reflection mode.
Potential of delamination-induced changes of electric resistance (ER) to inspect composite laminates have been studied by means of piezoelectric sensors as well as electrodes in numerous research works. In this NDE system, composite laminates possess small and very high ER along directions of the fiber such as carbon fiber and matrix, respectively, thus with fiber operating as an internal sensor.
(e) 
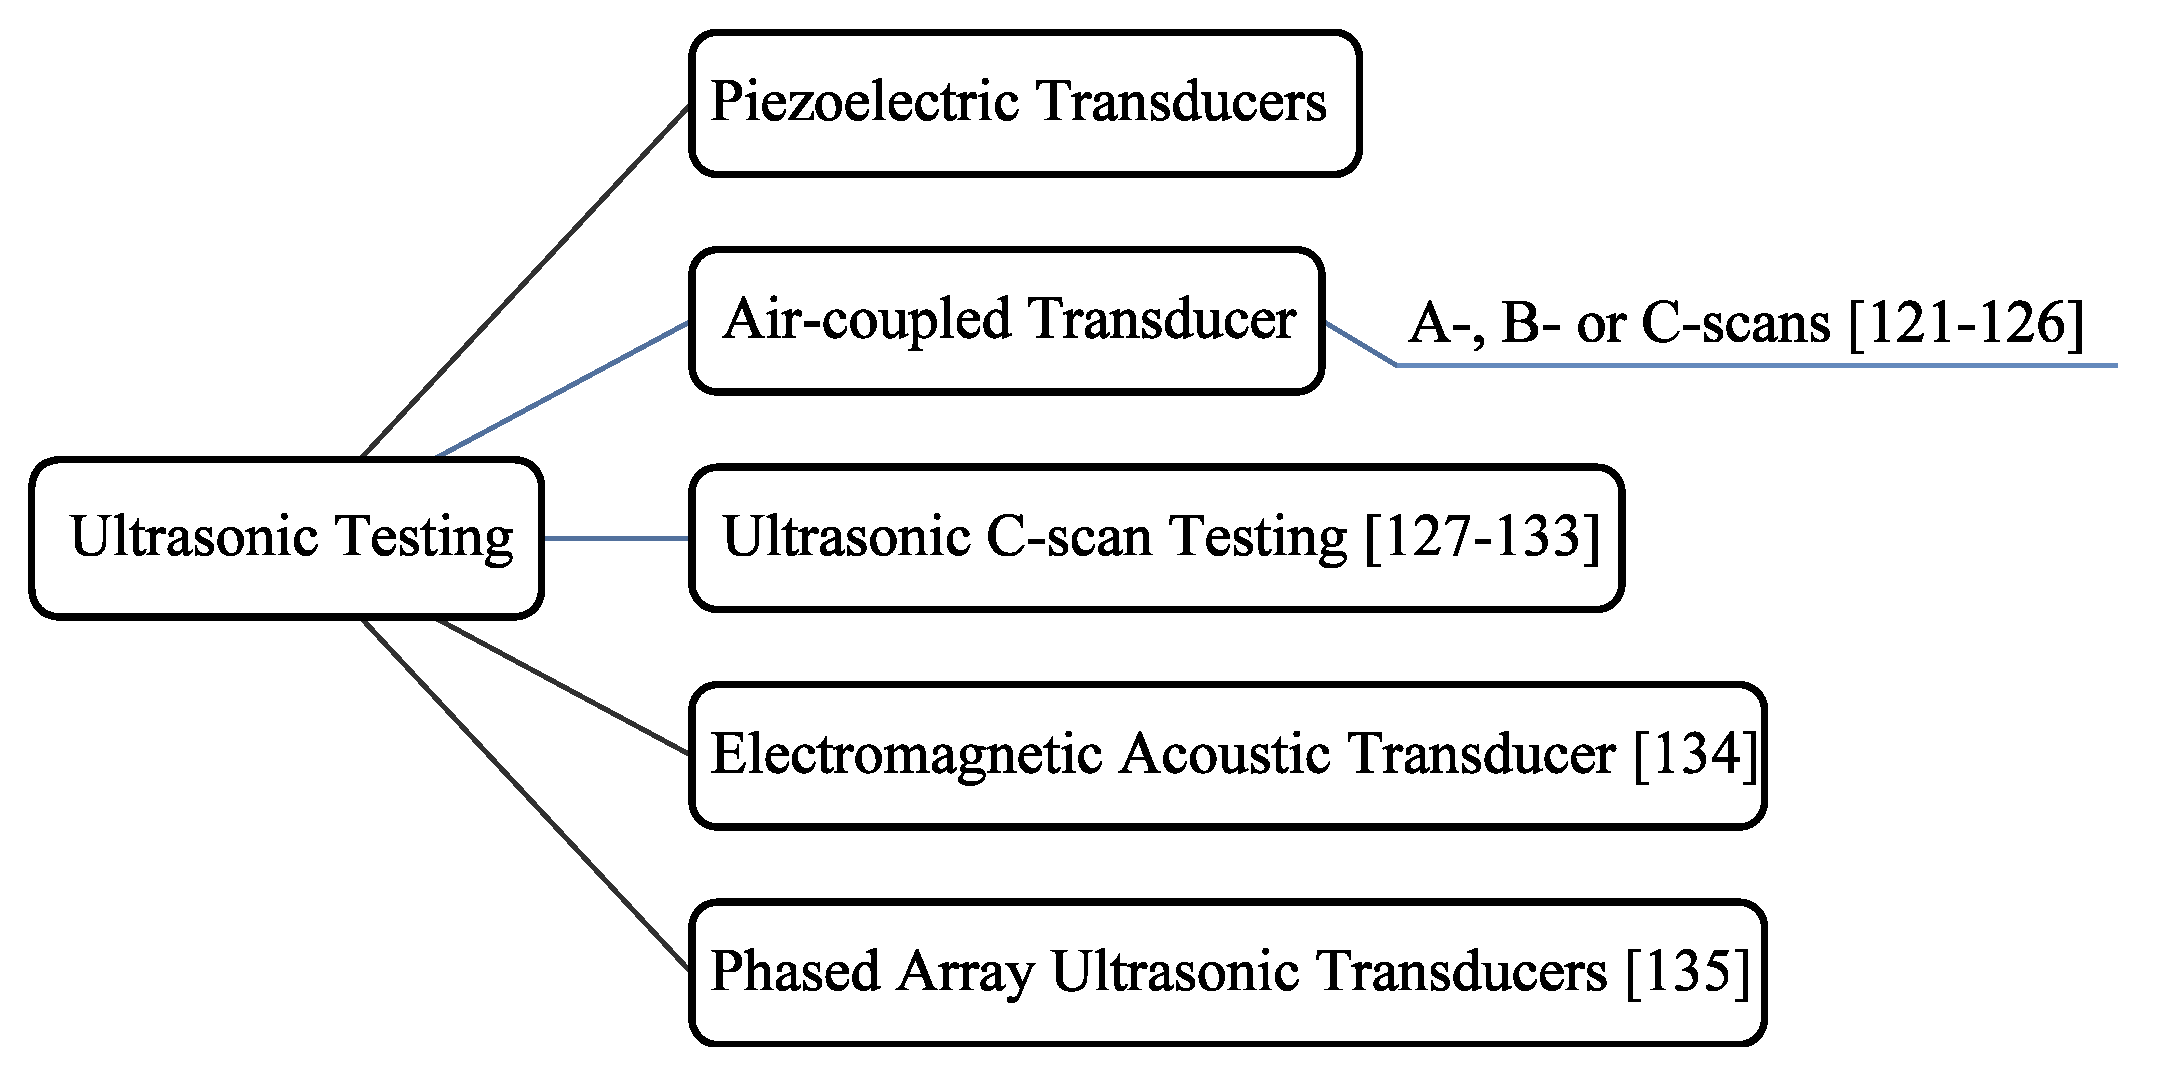
Ultrasonic testing: In NDE ultrasonic testing, a couplant is, in practice, utilized to enable efficient sound penetration into the composite laminates generated from an ultrasonic transducer. When necessitating separate actuator and sensor, three different transducer configurations, i.e., the pulse-echo, through-transmission, and pitch-catch methods, have experimentally been employed to inspect delamination via ultrasonic testing. In the pulse-echo method, one PZT transmitter can be used for both actuating the ultrasonic waves and sensing the waves reflected by either discontinuities or boundaries. Regarding the through-transmission method, actuating the waves is conducted on one side while sensing the waves transmitted through the specimen on the other side. Actuating the waves and sensing the reflected waves from discontinuities in the pitch-catch method is conducted through individual transducers placed on the same side. It should also be noted that A-, B-, and C-scans refer to energy amount vs. time signal, transducer position vs. time image, and a spatial plan view of the specimen features, respectively.
According to Figure 7, air-coupled transducers and ultrasonic C-scan testing may be included in ultrasonic testing [121,122,123,124,125,126,127,128,129,130,131,132,133].
Air-coupled transducers (ACTs), when coupling media, cannot be applied is an attractive alternative to excite ultrasonic waves and receive those leaked into the air. Incident and reception angles of ultrasonic waves as well as transducer–composite distances are the sensitive parameters to be set up on output signals. Contact-based ultrasonic C-scan testing (UCT) as one of the most widely used ultrasonic testing techniques is simple to analysis as well as effective to geometrically localize delamination. In the immersion testing process, a liquid couplant is employed to establish direct contact between a transducer and the composite specimen. Most of the research effort in the technical literature searched regarding the ultrasonic C-scan testing has been focused on either verification of other NDE techniques with ultrasonic C-scan as a reference standard [35,47,89,91,109,112,126] or yielding supplementary information [26,38,105,117,127].
Furthermore, piezoelectric transducers, electromagnetic acoustic transducer [134], and phased array ultrasonic transducers are placed into the category of ultrasonic testing. Employing the transduction mechanisms of either Lorentz force or magnetostriction, non-contact, and couplant-free electromagnetic acoustic transducers (EMATs) can be utilized for both sound excitation and sensation. Employing multiple probe elements, phased array transducers [135] can efficiently illustrate a slice of the target.
(f) 
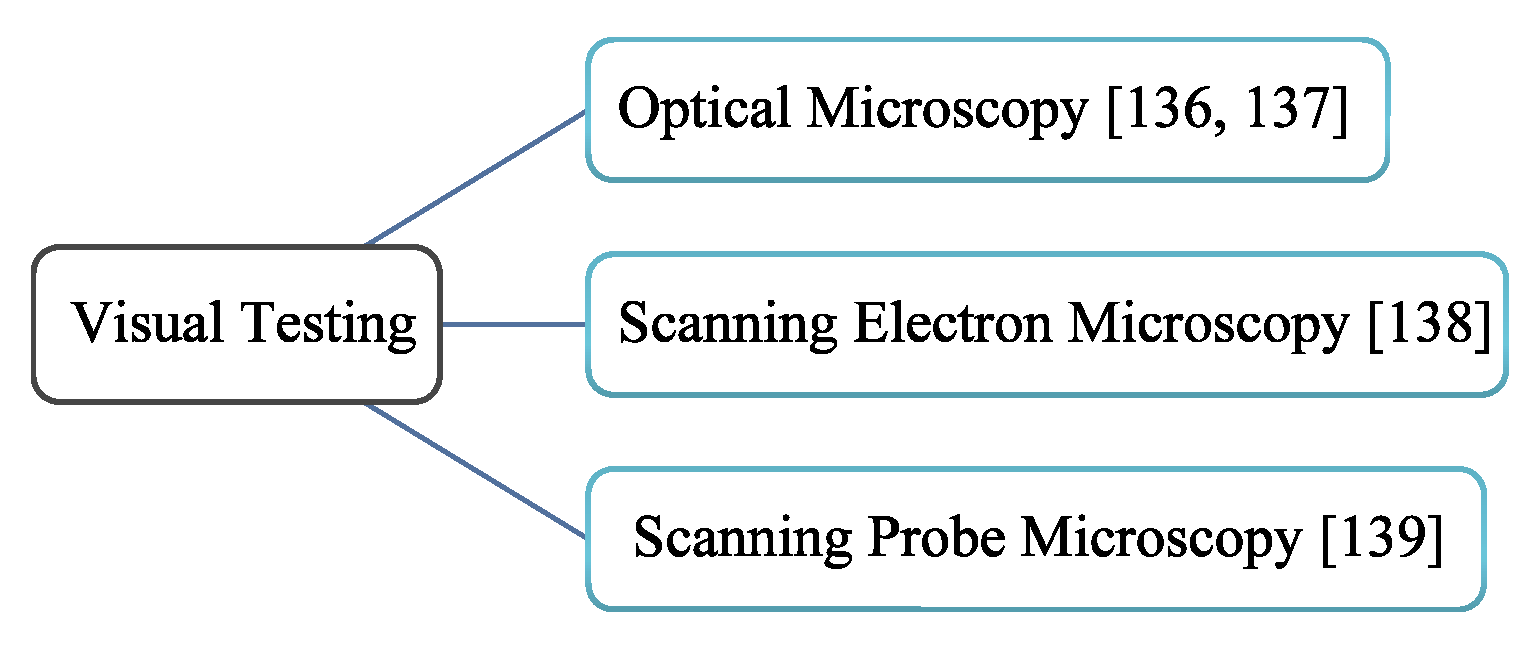
Visual testing: Visual testing focusing on microscopy techniques is referred to non-contact NDE techniques of optical, scanning electron, and scanning probe microscopy, according to Figure 8 [136,137,138,139]. Supplementary information obtained through optical microscopy [24,39,72,119] and scanning electron microscopy [40,41,117] have been utilized along with measurements of other NDE techniques for delamination detection.

4. Industrial Applications of NDE Techniques

Health monitoring of different structures is done through NDE techniques mentioned in the current paper. Table 2 refers to main industrial applications of six categories mentioned earlier.

5. Division of NDE Techniques

This section addresses the notable characteristics of measurements resulted from the aforementioned NDE techniques as listed in Table 3, Table 4, Table 5 and Table 6. Additionally, Table 7 contains a general division of six NDE techniques in terms of different aspects. According to the second column, ultrasonic testing during the immersion process may result in damaging the specimen, and other techniques using severe excitation may initiate the ablation of the specimen’s surface. Vibrothermography (ultrasonic mechanical excitation thermography), ultrasonic testing, piezoelectric inspection, and FBG sensor are contact-based techniques according to the third column. Piezoelectric inspection and FBG Sensor are considered to provide more local information as per the fourth column. In the fifth column, IR thermography, optical interferometric inspection, and visual inspection dependent on the type of microscopy selectively utilize both high- or low-frequency excitations. In the sixth column, piezoelectric inspection and FBG sensor employ vibration-based detection. In the seventh column, passive thermography and AE-based piezoelectric inspection, as passive techniques, can be implemented without excitation.

6. Review Description

6.1. Thermographic Inspection

Thermographic inspection is applied for detection of composite structures by measuring thermal (electromagnetic) radiation patterns emitted through the object’s surface [18]. Arrangements of data acquisition system and excitation source in the thermography process are organized into (a) reflection mode, in which both infrared camera and excitation source are placed on one side of the specimen [15,34], and (b) transmission mode, in which infrared camera and excitation source are on the opposite sides [20,24]. Due to lacking direct access to both sides of a specimen in most applications, reflection mode has extensively been investigated in the literature. Owing to volumetric heating in composites, particularly CFRPs, the performance of the modes is similar. Table 8 lists some characteristics of these two modes. This subsection is arranged within two parts, namely postprocessing of thermograms and corresponding results.

6.1.1. Postprocessing of Thermograms

Situations in which the difference between the delamination area and intact area in raw image sequences captured by cameras is not significant to distinguish between the differences made by environmental noises and structural anomalies; image processing techniques may dramatically enhance the detection sensitivity. Despite the fact that raw thermal images (thermograms) recorded at longer times are supposed to increase delamination detectability through the depth, effects of ambient and system noises including nonuniform heating and blur effects are critical negative factors, thus requiring data processing techniques.
Different image processing techniques have been proposed and applied to thermograms. For example, the raw images have been processed through utilizing both principal component analysis (PCA) and independent component analysis (ICA) [20]. In this process, the selection of the data range is based on the inspection purpose (e.g., cooling phase for delamination detection). The processing radiation response of the infrared camera involving both heating and cooling phase through discrete Fourier transform (FT), phase images, and spectra featuring periodic oscillation has significantly declined the effect of nonuniform heating directed perpendicular to coil axes and local heating of the coil [22]. Delamination highlighted at peak frequencies, carbon fiber and matrix structures, and noise is separately appeared at individual frequencies, as well. However, applying only cooling phase radiation as input for FT, some other features like min phase and its frequency in addition to features appeared from the whole response are shown. This conclusion holds for both transmission and reflection modes. Furthermore, FT has been applied on raw thermograms extracted from step thermography (named step-phase thermography) [32] and Pulsed thermography (pulsed phase thermography) [31], which increased both signal to noise ratio and edge sharpness of images. The reason for using phase obtained as described is that thermal wave phase in contrast to amplitude is independent of surface temperature influenced by the effects of ambient and system noises such as nonuniform heating, ambient reflections, and material’s emissivity differences.
Phasegrams (phase images) extracted from cross-correlation matched filtering (CCMF) using FT and Hilbert transform (HT) have been applied for delamination detection in CFRPs [23]. Raw thermographic data obtained from pulsed thermography being appropriate for delamination detection in angle-ply and cross-ply CFRP laminates have been processed through mathematical techniques of 1D FT and wavelet transform (WT) [14]. Processed data, particularly phasegrams, considerably enhanced damage detection. Different processing techniques including FT, thermal signal reconstruction TSR, WT, differential absolute contrast (DAC), and principal component thermography (PCT) have been applied on data from pulsed thermography; thereby, the inspection results are mainly enhanced via application of TSR and PCT [27]. The second time derivatives derived from TSR and phasegrams of raw thermograms of pulsed thermography have been applied for delamination inserts and impact damages in GLARE composites in order to decrease the effect of ambient and system critical factors [26]. Table 9 illustrates the rate at which some processing techniques have been utilized in the literature chosen for the present review.

6.1.2. Corresponding Results

Results obtained from the application of different thermography techniques on composite structures are here provided. Starting from the upper leaves of thermography in Figure 3, LC thermography technique has been applied for artificial delamination detection within CFRP and GFRP laminates in comparison to IR thermography [15]. Liquid–crystal was applied on the black-painted side of the specimen while heat flow occurs through the thickness. As a result, a lower surface temperature was recorded for the delamination area. Nevertheless, by utilizing the reflection mode in IR thermography, a higher temperature for delamination area was captured owing to the thermal difference of air and laminate’s material. Investigating delamination of different depths with the ratio of delamination and plate areas (DPA) of 2 . 78 % , LC thermography was claimed to show a clearer image of the presence of deeper delamination than IR thermography, whereas the delamination is difficult to be localized through both techniques. The reason was attributed to the distance between scanning surface and delamination area. In addition, raw data recorded from both techniques were failed to detect small delamination of DPA ratio 0 . 45 % .
Pulsed EC (PEC) thermography process is schematically depicted in Figure 9. Delamination detection in CFRP structures under PEC thermography is governed by the high penetration depth of induced EC, called skin depth, and the relatively low thermal penetration depth of pulse excitation. According to the much higher skin depth of ECs than the specimen’s thickness in CFRP, the heating mode is volumetric, thus heating the whole specimen [20]. In this research, the heating time and recording time were 200 and 800 ms, respectively. It is shown that the fiber and matrix structures of CFRP (different conductivity), as well as impact location (decreasing conductivity due to either possible slight decrease in the thickness of impact area or highly probable breaking the carbon structure), are observable at heating phase from processed data. As these factors interact with heat diffusion generated from ECs. As a result, the impact area and fiber appear as hot spots under transmission mode. Although delamination does not change the heat distribution on the rear surface in heating phase due to widespread heat diffusion, it will appear as a dark spot in the cooling phase. The problems of designing the correct global or local coil to induce ECs perpendicular to expected flaws which makes the most interaction, and camera selection having a fast frame rate as well as excellent thermal sensitivity to decrease heating time have concisely been discussed [23].
PEC thermography under transmission and reflection modes analyzed by FT detected artificial delamination made in CFRP laminates; thereby, delamination detectability was improved in the whole response, i.e., heating–cooling phase as well as cooling phase response [22]. The phenomena of nonuniform volumetric heating and periodic carbon fiber structures, consequently, are reduced. Phasegrams and spectra for the heating–cooling phase and cooling phase separate the effects of delamination, fiber–matrix structures, and noise appeared in the individual frequencies. Some features, like min phase, were extracted only from cooling phase, and the result was similar for both modes. It was reminded that an excitation current of higher frequency diffuses a shorter distance with higher speed, whereas that of lower frequency diffuses farther but slower. Deeper delamination thus requires a low frequency for EC excitation. However, the interrelation of delamination depth and excitation frequency was not quantitatively investigated.
Inner delamination detection in a steel specimen under transmission and reflection modes has been investigated using induction thermography (PEC thermography), and thereby delamination cases with lateral delamination size greater than the total thickness of the specimen can be detected [21]. Better delamination detectability due to smaller 3D heating conduction (causing the blur effect) was reported under transmission mode where delamination areas were displayed as dark spots. CFRP laminates under impact loading have been investigated through a selectively heating (SeH) thermography via an EC capable of detecting fiber–matrix structure and surface damages, incorporating CCMF to improve inner delamination effects in thermograms by decreasing nonuniform heating and blur effects [24].
Regarding direct heating, pulsed thermography stimulated by high-power flashes and vibrothermography triggered by contact-based ultrasound transducer have qualitatively been employed to detect delamination inserts and impact damages in a GLARE (GLAss REinforced) composite, a type of FRMLs [26]. The result shows pulsed thermography being straightforward requires to increase surface emissivity by painting and to apply data processing techniques on thermograms. On the other hand, vibrothermography by heating only defective areas reduces surface artifacts. In addition to problems issued by physical contact, vibrothermography was only effective to detect one delaminated specimen. Mid-plane artificial delaminations in angle-ply and cross-ply CFRP laminates of different thicknesses stimulated by a heating lamp have been detected through pulsed thermography [14]. Delamination shape and position are blurrily represented in the raw thermogram suffering nonuniform surface heating; whereas, they are rather enhanced in the thermograms processed by amplitude and particularly phase of 1D FT as well as WT irrespective of ply orientation. Higher thermal conductivity along the in-plane directions compared to that of through-the-thickness direction causes thermal changes via delamination, to be participated with those of material anisotropy, and consequently deformation of the delamination in the in-plane directions.
Pulsed thermography stimulated by high-power flashes operated in reflection mode has been utilized to detect artificial various-sized multiple delaminations having different depths within CFRP panels in conjunction with different processing techniques to enhance the inspection [27]. The smallest DPA ratio was 1 % , and inspection was performed from both front and back sides. A lower frequency for the back-side inspection was involved to provide enough time to detect deeper delamination, as well. Probability-of-detection curves of processing techniques, evaluating the effect of techniques, showed that TSR and PCT are more effective for detecting delamination areas. A cross-ply glass/epoxy composite containing multiple delaminations has been exposed directly to step thermography heating source as halogen lamps [32]. Thermal power of lamps and heating time, taking environmental heat loss into consideration, are decided by means of the FE solution. FT-based phase analysis considerably refined the detection of deeper and smaller delaminations compared to raw thermograms.
To inspect CFRP specimens containing human-made delaminations, LI thermography using halogen lamp heating has been applied, resulting in a sinusoidal temperature modulation [33]. The frequency of thermal wave was varied from higher toward lower values to scan more profound defects. Phasegrams, whose variations represents changes in material properties, were applied to quantitatively measure both dimensions and depth of delamination. The measured results were mainly in good agreement with nominal values, although the measured depths of concentric delaminations located at different interlayers were noticeably diverted from nominal values. The reason was attributed to the fact that thermal diffusivity used for depth detection must be a function of those of above layers, i.e., CFRP and insert material (simulating delamination). Different frequencies required for the different interlayer-located delaminations are referred to as well. Difference between phasegrams determined from 4-point methodology in sinusoidal excitation under LI thermography of delaminated area and intact area (phase contrast) has been utilized to quantitatively detect multiple delaminations in a GFRP plate [34]. One-sided black painting on the specimen’s surface was required to provide a higher and uniform surface emissivity under reflection mode. Excitation frequency to include the highest phase contrast was theoretically obtained using defect depth. The variations of phase contrast vs. excitation frequency was associated with delamination depth and size.

6.2. Piezoelectric Inspection

6.2.1. Vibration Based Inspection

Several studies in which vibrational structural responses are inspected for delamination detection are as follows. Being highly sensitive to small damage, high-frequency response functions (FRFs) have inspected damages under impact in a composite plate [35]. The plate’s surface, which is equipped with a piezoelectric macro-fiber composite (MFC), and PZT transducers were impacted to produce delamination. With regard to PZTs, degradation of the transducer–plate bond; transducer breakage; and, subsequently, false measurement were observed. On the other hand, FRFs were measured via MFC transducers showing robustness and reliability, and while incorporating cross-correlation coefficient metric, FRF data qualitatively assessed the delamination extent. In another study, cross-ply GFRP plates equipped with a few embedded PZT sensors, actuated using an embedded PZT with different delamination sizes, have been inspected by the energy of the structural dynamic response decomposed via wavelet transform [36]. Excitation input containing sufficient frequency contents, excitation position, and actuator–sensor distance were counted as some useful factors to detect small delamination. A DPA ratio of 0 . 13 % is claimed to be the smallest size of detectable delamination. Furthermore, the FRF-based modal parameters along with strain energy have been employed for delamination detection in composite plates actuated and sensed by a PZT and an accelerometer, respectively [37]. In this study, delamination location is predicted via changes of modal damping associated with strain energy distribution overlapped at the first five modes. It is worthwhile mentioning that vibration based inspection generally operates in the light of baseline data extracted from the intact specimen.

6.2.2. Acoustic Emission-Based Inspection

The acoustic emission (AE) technique incorporating neural network classification technique into damage detection process has been applied to CFRP laminates containing damage modes of cut fibers introduced while manufacturing, to develop matrix cracking under fatigue loading and impact-caused delamination [38]. Damage modes have been placed so that there is no interaction between them and boundary effects, as well. Coupling AE signals with classification data allows for separating delamination and matrix-cracking sources. Delamination area appears as a continuously active AE source. AE sensor surface-equipped angle-ply GFRP laminates subjected to the DCB (double cantilever beam) test have been inspected using AE technique so as to evaluate the delamination initiation and propagation [39]. The sensor–specimen contact surface was covered by vacuum grease to increase acoustical coupling. An artificial delamination was introduced into the specimen during layup process. Results illustrate that delamination has been seen through AE data analyzed by HT before than visual microscopic images. Fiber orientation was proved to be a critical factor influencing the matrix-cracking initiation and propagation. In addition, it is stated that as fiber angle increases from zero to 30 degrees a slight increase can be observed in the fracture toughness. However, further increases in angle fiber may result in delamination resistance deterioration in laminates. Therefore, the interface with 30-degree angle fiber is more resistant to delamination. Investigating GFRP laminates with artificial delamination under loading conditions of the frequently occurred modes I and II and their mixed mode has been conducted using the AE technique in conjunction with sentry function and FT analysis [40,41]. A DCB test (mode I) resulted in different AE waves, owing to different levels of failure mechanisms such as fiber breakage, matrix cracking, and debonding occurring during the delamination initiation process, being split into minor initiation and major initiation [40]. Critical strain energy rate required for delamination initiation, Gc has successfully been evaluated in the mode II and mixed mode [41].

6.2.3. Elastic Wave-Based Inspection

Three various excitation methods of elastic waves are listed in Table 10. Table 11 contains several delamination detection indicators used in ultrasonic wave-based piezoelectric inspection. Regarding the time of flight (TOF) indicator, P and S waves propagated through the laminate thickness have numerically and experimentally been applied to detect various depth located delamination characterized by surface delamination and deeper delamination [42,43]. Wave propagation domain to be half space or waveguide is mainly decided by the ratio of the induced wave’s wavelength and sensor–actuator distance. In this study, taking the ratio of wavelength and laminate thickness as the main factor, the propagation of P and S waves is prevented by the delamination presence, thereby reducing the laminate thickness (sensor–actuator distance) to the distance between PZT actuators and delamination. All the recorded time histories of the voltage at each delaminated case and intact case illustrate simultaneously the first peak which was attributed to the surface Rayleigh wave. In addition to the first peak, specimens containing deeper delamination as well as intact specimen show different peaks related to P and S waves progressively shifted in time as delamination depth increases; whereas specimens of surface delamination show no more peak. Moreover, taking a PSD (power spectral density)-based damage index into account, the frequency content of the acquired voltage is approaching that of the excitation signal, as delamination is placed in higher depth in the laminate.
Regarding the wave conversion indicator, a thick aluminum plate considered as a half-space containing delamination-like damage has been inspected by surface Rayleigh waves converted to Ao Lamb waves when encountering delamination area [44]. Half-space or waveguide domain is decided by wavelength and plate’s dimensions. PZT actuating and sensing transducers are configured in the pitch-catch mode while supporting the ultrasound transmission via application of a gel couplant. In-plane Rayleigh wave to Ao wave conversion is illustrated by out-of-plane displacements measured in the damaged specimen in and after delamination area and undamaged specimen, proving its capability for delamination detection while increasing the excitation frequency.
Lamb waves appeared to be symmetric, i.e., S n mode, or antisymmetric, i.e., A n mode, in which n is the mode order, and can be triggered with different phase velocities depending on the excitation frequency and plate’s thickness product, as well as material properties of the plate such as stacking sequence and volumetric fraction of fibers in composite laminates. Fundamental modes A 0 and S 0 , being used extensively for the damage inspection purpose, are excited depending on transducer dimensions and excitation features.
Regarding the Lamb wave class, in general, the potential of the nonlinear waves generated from exposing composite specimens to high-frequency excitation (carrier wave) modulated by low-frequency excitation at one of the structural modal frequencies to inspect delamination has been investigated [45]. The results illustrate attenuating the amplitude of the center peak (carrier frequency), appearing as sideband peaks around the center peak; changing sideband spectra could be an indicator of the delamination area. With regard to correlation coefficient, a damage index (multiplication of probabilities of the damage presence) based on correlation coefficient has been applied for delamination evaluation within cylindrical composite laminates to damaged and undamaged signal sets measured via a sensor network arranged in an L-shape configuration [46]. The multiplication of probabilities illustrates a good indication of the shape of delamination with DPA ratio 0 . 058 % . Delamination emerged when subjected to the low-velocity impact in a composite plate and was detected utilizing signals obtained via the pitch-catch method in a circular configuration of PZT sensors [47]. Those actuator–sensor paths having an energy-based index incorporating baseline data higher than the baseline threshold evaluated through Kolmogorov and Smirnov testing (as damaged paths) were taken into damage detection process. Additionally, condensation correction based reconstruction introduced as weight in damage index improved the reliability of delamination areas detected.
S 0 mode inspection: Regarding the group velocity indicator, a few GLARE aluminum specimens have been inspected for delamination associated with Lamb waves excited and acquired by both the surface bonded (wedge method) and embedded PZTs [48]. Excitation frequencies obtained from dominant frequencies are utilized as the center frequency to excite S 0 mode with the highest level of energy. The results show that the wedge-based measurements of group velocity obtained from ToF of the wave were more accurate than those based on embedded PZT. Increasing delamination area simulated by eliminating glass fiber material and initiated by a vibrating saw was led to the increase of the group velocity of the wave when passing through delamination area, thereby delamination with DPA ratio 0 . 475 % was detected. With regard to ToF indicator, a S 0 mode wave, reflected from delamination within a cross-ply laminate recorded by a PZT sensor placed on the same side of the delamination as actuator, has been investigated to identify the locations of a few individual delaminations out of which the smallest delamination had DPA ratio R = 1 % [49]. As a result, no obvious reflection from both the smallest delamination via the excitation frequency used and from mid-plane (when shear stress being zero) delamination can be noticed. Additionally, the errors encountered in the course of locating delamination were attributed to the overlap between delamination and boundary caused reflections. It was shown increasing the S 0 amplitude reflected from the right end of the delamination makes it appropriate for delamination detection. Performance of the wafer transducer to selectively actuate S 0 mode wave, as well as the capability of S 0 reflections from different depth located damages within undamaged and damaged signals being subtracted, measured via pulse-echo configured single wafer transducer for damage detection, have successfully been evaluated [50].
A 0 mode inspection: The potential of pure A 0 mode reflected from the delamination boundaries with respect to excitation frequency variations has been evaluated for delamination inspection [52]. A 0 pure mode was obtained from the difference of the signals recorded by two PZT sensors attached to the top and bottom surfaces of CFRP beam containing delamination. Moreover, optimal frequencies for exciting A 0 mode so as to develop the highest amplitude of delamination-induced reflections are shown to be placed near the resonance flexural frequencies of the upper and lower delamination area, making a deformation similar to that of the A 0 wave. Upon ToF, transient A 0 reflections measured via sensor arrays made of polyvinylidene fluoride (PVDF) material processed using wavenumber filtering have been applied for the delamination detection (presence and location) in cross-ply laminates [53]. Additionally, wavenumber–frequency variations of fundamental Lamb waves obtained from sensor arrays proved the A 0 mode in different directions is dominated by the specimen’s shear modulus.
The parameters of time delay and amplitude attenuation of the A 0 wave transmitted while bouncing back and forth a few times, within the delamination area extracted from the A 0 wave decomposed from two pitch-catch signals using a decomposition technique, have been utilized for delamination detection [54]. Two pitch-catch signals were obtained by excitation of a dual PZT actuator consisted of inner circular and outer ring PZTs. Likewise, delamination has been indicated by the relative time delay of A 0 mode measured by a dual PZT network incorporating an outlier analysis [55]. Inspecting a stringer-stiffened panel using Lamb waves crossing stringer, the wave amplitude decrease and the waveform changes in the undamaged state; whereas, in the presence of impact-induced stringer-panel debonding, the amplitude increase and group velocity decrease of the wave have been observed [2].
Upon nonlinear effects, higher spectral harmonics emerged due to non-classical contact nonlinearity being predominant at delamination, and their temporal data in the A 0 Lamb wave have been applied to delaminated composite laminates [56,57,58]. Selecting the A 0 mode instead of S 0 was attributed to the following reasons; (a) the S 0 mode is faster, resulting in complexity in arrival time measurement; (b) the A 0 mode has a larger transverse displacement amplitude, being perpendicular to the delamination surface, thereby offering a better correlation in producing higher harmonics; (c) the S 0 mode has a non-flat velocity dispersion curve at the frequency range used, thus emerging higher harmonics with different velocities than the first harmonic. In general, some reasons for choosing A 0 and S 0 to be used into NDE technique are listed in Table 12.
SH mode inspection: With regard to mode conversion, a network of PZT wafers bonded to the CFRP laminate’s surface containing delamination (DPA ratio 0 . 065 % ) has been applied to localize the delamination utilizing the S 0 mode-induced shear mode [51]. WT processed wave components to improve signal resolution show an additional mode wave obtained by conversion of S 0 symmetric mode to S 0 shear mode occurred at delamination area. The time lags between the involved wave modes appeared through each actuator–sensor path were used to localize delamination. Furthermore, the S 0 mode induced a shear horizontal (SH) wave when interacting with delamination processed through digital damage fingerprints (DDF) and has quantitatively been applied for delamination detection in composite laminates [61]. In summary, Table 13 highlights several merits and demerits of ultrasonic elastic wave-based inspection.

6.3. Optical Interferometric Inspection

6.3.1. Camera-Based Interferometry

Moiré interferometry: The capability of fringe patterns of shadow moiré formed through master grating interacting with its shadow on the specimen’s surface has been investigated to detect drilling-caused delamination as a result of high strains caused around machining holes in composite laminates [65]. Delamination size decided as the size and number multiplication of pixels in the delamination area was assessed by out-of-plane surface displacement associated with the fringe’s phase change in CFRP laminates illuminated by a laser source.
Speckle pattern interferometry (SPI): Speckle interferometer as a strain measurement technique incorporating laser beams derives surface displacements. Upon the SPI application to delamination detection, data of digital SPI detecting delamination-induced bulging effect appeared through a sequence of the out-of-plane displacements of the cross-ply CFRP laminate’s surface placed in a vacuum has quantitatively been utilized for delamination detection [66]. Data of largely deformed areas located within bulge borders processed through genetic algorithm along with FE data predicted a thorough identification of delamination. Moreover, electronic SPI displacements measured at in-plane and out-of-plane directions have successfully been applied to inspect composite laminates containing damage mechanisms of splitting, microcrack, and delamination under laser illumination [67].
Holography: Holography as a powerful interferometric technique to measure surface displacement and vibration modes even under noisy environments is a complicated technique in terms of measurement interpretation. In this regard, the shape and location of delamination in CFRP laminate have been estimated through out-of-plane vibrational mode patterns at specific frequencies for each delamination shape measured using pulsed laser holography, emphasizing on the technique’s merit, that is the reduction of the environmental noises [68]. Additionally, amplitudes of the local out-of-plane vibration modes at a specific frequency at a healthy area and delaminated area derived from heterodyne holography were applied for delamination inspection, thereby verifying delamination location with data measured by SLDV and thermography [69].
Shearography: Shearography (speckle pattern shearing interferometry) developed to eliminate limitations of the holography technique and particularly used for inspecting delamination has simplified the optical operation and measurement interpretation. Eliminating the reference beam, it directly renders the first derivative of the out-of-plane displacement difference of the specimen’s surface under applied stress with respect to the unstressed state. With regard to the shearography application to delamination inspection in CFRP laminates, perturbed speckle patterns revealed delamination shape and size while assessing the delamination depth through embedding both resonant frequencies derived from shearography and theoretical ones as a function of delamination depth (within the idealized delaminated area) into an optimization process [70]. In testing composite structures via shearography synchronized with thermography, delamination was dramatically localized through shearography based fringe patterns, particularly when incorporated with phase shifted technique using filtering and color routines [71]. Delamination of a lower depth shows more fringes compared with deeper ones, the fringes number, thus can be an indicator of delamination depth.

6.3.2. Detector-Based Interferometry

Fiber Bragg Grating (FBG) sensors
Surface-bonded FBGs: The functionality of surface-bonded FBGs having a different mechanism of sensor–laminate surface strain transfer than that of embedded FBGs is affected by the thickness of the adhesive layer and its mechanical properties. The following studies evaluate the surface-bonded FBG application to inspect delamination. Transmitted Lamb waves through ideal delamination in CFRP laminates measured by FBGs have been applied for delamination detection; thereby, the amplitude decrease and appearing a new wave (mode conversion) have been noticed [73]. In the experiment, the ratio of FBG’s Gage length and the Lamb wavelength were evaluated to be smaller than 1/7 for obtaining narrow reflection signals with Bragg wavelength shifted, thus enabling Lamb wave detection. Moreover, estimating the maximum amplitude of the reflected signal vs. the propagation angle (0–180 degrees) by a cosine function, the FBG’s sensitivity was observed to be strongly dependent on the Lamb wave direction propagated into the sensor. With regard to applying this sensor to the inspection of the low-velocity impact-induced delamination, time histories of wavelength shift signals deformed under various levels of impact in CFRP laminates have been processed through FT and WT techniques for delamination quantification [74]. The results indicate that the WT technique cannot be used for an entirely quantitative inspection, whereas its functionality can dramatically be enhanced for known suspicious regions.
Embedded FBGs: Several applications of embedded FBGs for delamination detection in composite laminates are concisely mentioned in the following.
Using embedded FBGs posed in the vicinity of crack tip, the relationship between delamination length increases and the reflection spectrum changes, such as spectrum becoming broad under delamination growth, appearing various wavelength peaks due to nonuniform distribution of axial strain induced by the delamination, and peak wavelength shifts in CFRP laminates through four-point bending test, has been evaluated [76]. Moreover, the indicator of changes in two dominant peak intensities was reported to be effective for estimating delamination length. In another study [77], the difference between parameters of failure strain and ultimate tensile strength of CFRP laminates under tensile test at embedding and no-embedding cases have been observed to be little, and the influence of edge delamination growth under cyclic loading on reflection spectra have also been examined. Associated with the studies, FBGs are only capable of sensing a local area of a large structure under loading patterns.
The vibration-based responses of embedded FBGs in composites, including strain natural frequencies and mode shapes [78], integral strain normalized by peak force plotted vs. position [79], and natural frequencies [80], have shown more global inspection technique when FBGs are correctly mapped or applied under distributed loads. Evaluating the feasibility of strain FRF-based natural frequencies and mode shapes to inspect delamination shows strain mode shapes are very effective indicators of quantitative delamination detection particularly for small delamination [78]. Similar to the idea applied in [78], applying quasi-impulse loading at subsequent points along the beam length, integral strain normalized by peak force plotted vs. position shows a drastic change when reaching delamination area [79]. In [80], changes of dynamic strain-derived natural frequencies, which are higher than the FBG measurements’ frequency resolution due to impact-induced delamination measured by two FBGs, show their potential to be employed as an alternative to the accelerometer, laser Doppler vibrometer or strain gauge. Upon application of another embedded optical fiber sensor, named highly birefringent photonic crystal fiber (Hi-Bi PCF), to obtain a delamination detection indicator based on reductions in the first natural frequency of glass composites, the Hi-Bi PCF’s performance compared to the accelerator and its temperature insensitivity has been investigated [81].
Continuing to review the technical literature on delamination detection, baseline Lamb wave signals in GFRP laminates sensed via a FBG whose system uses a laser source owing to providing a higher sensitivity compared to a broadband light source have been investigated utilizing both the surface-bonded and embedded FBGs [82]. Based on the outcome, near-surface delamination was more easily detected than those closer to the middle plane while employing an “accelerated mode” appeared due to A 0 Lamb wave–delamination interaction as the delamination indicator. Regarding investigation of the effects of the embedded FBGs on behaviors of mode II delamination in woven composites, embedded FBG due to increasing the fiber volume fraction causes a brittle behavior for composites, thus leading to reduction in the maximum load which is attainable under loading applied and consequently reduction in the maximum energy release rate [72]. Locating delamination near or in mid-plane of the laminate, detrimental effects of the embedded FBG on delamination behavior are the least, whereas delamination located near or symmetric to FBG causes the most destructive effects. Upon characterizing the distribution of the fiber bridging tractions developed along mode I delamination growth using the embedded FBGs, axial strain distributions in presence of triaxial residual strains are measured to indicate location and direction of the delamination growth and to determine an exponential bridging stress law and the strain energy release rate obtained from fiber bridging [83].
Upon more actual applications of the FBGs to composites, the performance of FBGs is investigated for shrinkage-induced delamination quantification in a composite concrete pavement specimen [84] and for damage detection in a composite wing specimen [85]. In the former study, drastic changes in strain distribution and their magnitude variation measured by distributed embedded FBGs within time appeared along a concrete overlay–substrate interface are elucidated to quantify interfacial delamination onset and expansion; moreover, the conventional FBG structure, including the core, cladding, and inner and outer coatings, is recommended to be protected by an additional coating against shearing action. In the latter study, the integrity inspection of an adaptive wing subject to different damage scenarios was conducted through teaching a neural network utilizing axial strain changes measured via the surface-bonded FBGs. To sum up, some of the challenges encountered during the FBG measurements and their features are listed in Table 14 as a consequence of its different performance than other optical interferometry techniques.
Laser Doppler vibrometry: Single-point LDV has attracted significant attention in recent years. Standing waves, induced by Lamb wave–delamination interaction, emerged within the out-of-plane velocity wavefields analyzed in the wavenumber–frequency domain and have extensively been utilized for delamination indication in composite laminates [86,87,88,89,90,91,92]. In [86], velocity wavefields filtered in the wavenumber–frequency domain, so as to isolate the standing waves, cumulative energies of the standing wave and the whole wavefield, and Laplacian mask-filtered wavefield, have been proved to be effective indicators for delamination detection. In [87], an automated damage detection algorithm employing outlier analysis and cluster analysis applied to wavefields has been evaluated for delamination and disbond detection, and, consequently, Lamb wave interaction with delamination was characterized by high amplitude standing waves, whereas lower amplitude convergent waves, which interfered in incident waves without trapping, were noticed in disbond position. In [88], a delaminated GFRP wind turbine blade subject to variations of temperature and static loading and a debonded CFRP aircraft wing have effectively been inspected utilizing cumulative standing wave energy. In [89], CFRP laminates containing initial delamination grown under impact have been inspected for characterization of the delamination depth through the average wavenumber indicator vs. location at a specific frequency developed using Hann-windowed, filtered velocity wavefields in 3D Fourier domain to include a selective mode at a local region. The larger average wavenumber that occurred within the delamination area compared to the theoretical wavenumbers calculated at different interfaces are associated with delamination depth as a consequence of thickness reduction. In [90], some new components within delamination area, attributed to trapped waves have been revealed in the space-time wavefields of the out-of-plane velocity of cross-ply CFRP laminates scanned along a line crossing the delamination with DPA ratio 0 . 277 % reconstructed from the filtered frequency–wavenumber spectrum. On a full quantitative detection, space–wavenumber spectrum extracted from the space-time wavefield via a short space 2D-FT in the excitation frequency illustrates the delamination length with respect to the location of the new wavenumber while finding out delamination depth using the new wavenumber value fitted with theoretical dispersion curves. In [91], spatial wavenumber image averaged over a frequency range vs. location of scanned points within a squared area developed based on the largest values of the space–wavenumber spectrum has been investigated for impact-induced delamination depth identification as a consequence of wave trapping phenomenon. Similarly, an averaged spatial wavenumber image has been investigated to characterize delamination relying on the double power of values of the space–wavenumber spectrum in [92].
Continuing to review the effects of delamination-Lamb wave interaction, noticeable delamination-induced changes in the amplitude of out-of-plane velocity ( A 0 mode) without requiring baseline measurement or signal postprocessing have been applied for delamination detection [93]. On inspection of a composite stabilizer under measurements of a 3D LDV processed by weighted root mean square (WRMS) technique while simulating damage by attaching additional masses to the stabilizer’s surface, it has been found that damage resolution and sensitivity increases at higher excitation frequencies, whereas inspection area decreases [94]. Inspecting a delaminated CFRP plate, delaminated GFRP honeycomb panel, and delaminated composite panel with stiffeners, delamination location and size have effectively been detected, except for some delaminations within the last case located between stiffeners by use of trapped A 0 mode and S 0 / A 0 mode conversion processed by WRMS [95]. Applying a sparse reconstruction technique to guided wavefields of an artificially delaminated GFRP plate suggests a significant reduction in the number of measurements required for analysis, while effectively estimates the locations of the emitting source and scattering source (delamination) [96]. Inspection of a GFRP wind turbine blade by a 2-level scanning strategy, i.e., course (entire blade) and dense (delamination area) scanning respectively for delamination localization and visualization has effectively been conducted through a TOF-based damage indicator [97].
Upon vibration-based delamination detection, the following studies can be referred to. RMS values of FRF-based information fed into a neural network has effectively been utilized for multiple superficial delamination detection within a GFRP plate [98]. Applying FRF information fed into the processing algorithms of Gapped smoothing (GS), generalized fractal dimension (GFD), and strain energy, LDV displacement mode shape-based results provides better accuracy for delamination detection compared to those of PVDF curvature mode shapes, owing to refined scanning mesh [99]. Mode shape based shear-strain gradient of GFRP laminate containing a hot air blower induced delamination has been proved to be able to reveal shear-strain singularities benefiting delamination detection [100]. Frequency-domain signal amplitude based data of a non-contact time reversal mirror (composed of PZT transducers) incorporating LDV as receiver, which is capable of defect discrimination owing to selectively directional focusing (out-of-plane focusing for delamination and in-plane focusing for crack), has been proven to be effective for damage detection compared to vibrothermography and C-scan [101].
Higher harmonics resulted from Lamb wave ( A 0 mode)-delamination nonlinear interaction owing to clapping phenomenon of two sub-laminates within a cross-ply CFRP laminate are revealed at the frequency domain (FT analysis) and frequency-time domain (WT analysis) [102]. The results demonstrate that no noticeable higher harmonics are generated when delamination is located symmetrically in the through-the-thickness direction; second harmonics with higher magnitude are generated in the transmitted than reflected wave; and increasing damping and propagation distance decrease the second harmonic amplitude. Electromechanical impedance (EI) based delamination detection within cross-ply CFRP specimens incorporating temperature changes has been evaluated in terms of resistance signals, the result of which shows that temperature change is led to the vertical and horizontal shifts in frequency vs. resistance signals depending on the frequency band, and consequently EI-based damage detection necessitates utilizing temperature compensation strategies [103].
Laser interferometer: A laser interferometer, as a highly sensitive sensing technique to out-of-plane displacements, is used for receiving waves, rendering measurements of high resolution. Upon its application to delamination detection, exciting ultrasonic waves by non-contact laser in composite laminates containing drilling-induced delamination damage, it is shown that voltage signals measured by the laser interferometer and processed to be represented in the C-scan forms can effectively characterize delamination [104,105].

6.4. Electromagnetic Testing

6.4.1. Radiography

With respect to delamination detection, estimating the damage type of matrix cracking and delamination developed under fatigue loads, using the data of the PZT transducer smart layer so as to sense Lamb waves attached to composite laminates of different layups to account for the ply orientation influence and X-ray images enhanced by a dye penetrant subjected to signal processing, have been investigated [107]. Layup configuration being capable of inserting an influence on output signals, nevertheless, TOF and the signal’s amplitude can be utilized for damage classification regardless of the layup. On investigating the capability of interface elements to predict delamination onset and growth subject to low-velocity impact, X-radiography images and ultrasonic C-scan have been utilized to verify delamination size and shape developed from tensile matrix cracks [108].

6.4.2. Computed Tomography

Upon delamination detection through CT technique, drilling-induced delamination measured for three various drill geometries within CFRP laminates exploiting CT images as well as an ultrasonic C-scan has efficiently been evaluated [109]. Thrust force-delamination correlation for each drill geometry is also demonstrated. The potential of 3D models of cross section reconstructed through computed microtomography (micro-CT), having a higher resolution than CT images so as to characterize matrix crack and delamination geometries within composites, has been evaluated incorporating a dye penetrant as the contrasting agent [110]. It is found some limitations for defect detection based on the defect growth, while dye penetrant can provide a larger specimen to be investigated and enhance the detection limitations. Enhancing open/close delamination-induced phase contrast effects convolved with a proper kernel appeared within x-ray images reconstructed using CT technique has been demonstrated within CFRP laminates [111].

6.4.3. Terahertz Spectroscopy

With respect to the THz wave application to delamination detection in GFRP laminates, THZ C-scan, and B-scan images, respectively, providing in-plane and through-the-thickness directed information of delamination localization as well as THz time-domain waveforms used to quantify Teflon and laminate thicknesses demonstrate higher lateral and axial spatial resolution than ultrasonic C-scans [112]. Detecting overlapped multi-delamination located at various interlayers presents as a challenging case exploiting both THz and ultrasound waves within GFRP laminates; the respective waveforms and B-scan images of reflection mode illustrate that THz waves can quantitatively determine the through-the-thickness locations of overlapped multi-delamination while only detecting the upmost delamination through ultrasound waves, due to their incapability to penetrate into delamination-induced air gap [113].

6.4.4. Electric Resistance-Based Inspection

The electrical resistance (ER), which is the reciprocal of electrical conductance, measures the object opposition to the electric current passing through it. In the electric resistance change technique, multiple electrodes are mounted on the composite’s surface to obtain ER changes. ER bridge circuits measure ER changes between electrodes. As an advantage, the method’s experimental set-up does not necessitate expensive instrumentation.
It has been confirmed that the ER change method employing response surfaces is sufficient for delamination detection [114]. Response surfaces are adapted as a tool for solving the inverse detection problem. Being improved with standardized data, these surfaces illustrate effective estimations for detection purposes. In another research work, the electrodes optimum selection for delamination identification has been investigated via ER Tomography [115]. This is conducted using the effective independence measure applied to ER measurements and is implemented by singular value decomposition. For an extensive review of research works regarding the ER of CFRPs, see [116].
In what follows, several applications of the inspection system are concisely mentioned with reference to the parameters of ER change, electric potential change, and sensor charge output distribution (SCOD). Regarding the first parameter, there are an increasing amount of ER changes measured using two electrodes (connected with an oscillation circuit) mounted on the cross-ply CFRP laminate’s surface, thereby oscillating frequency changes with respect to the Z-type delamination length obtained have successfully enabled delamination detection [117]. Closing and opening the drastic delamination effects on ER were observed, as well. Moreover, the individual effects of fiber breakage, matrix cracking, and delamination on the ER changes of CFRP laminates measured by means of different patterns configured electrodes have in brief been reported focusing on delamination detection [118]. In this study, the excellent performance of a developed matrix configured electrode network relative to that of a circular network to measure the delamination-induced ER changes was associated to the fact that small delamination accompanied with matrix cracking makes a slight ER increase toward in-plane transverse direction whose electric current is low, consequently requiring closely-spaced electrodes.
Regarding the second parameter, the baseline changes of the electrical potential measured by electrodes arranged at various intervals, in terms of changing the electrode width and number on the Z-type delaminated cross-ply CFRP laminate’s surface, have quantitatively been applied for detecting delamination length and location [119]. Upon predicting the delamination location, the accuracy reduction observed when occurring delamination near the middle of current electrodes would enhance toward lower intervals. Regarding the last parameter, strain based SCOD measured using electrode strips affected by different delamination length, location and gab, as well as different electrode size and number have effectively been applied for delamination detection of composite beams [120]. In summary, some merits, such as inexpensive equipment and no strength reduction, and the demerits of extremely high through-the-thickness directed ER compared with those of the in-plane directions were reported. A sagely developed electrode configuration based on damage mode is required as well.

6.5. Ultrasonic Testing

6.5.1. Air-Coupled Transducers

Upon ACT application for inspection of composites using A 0 Lamb wave–delamination interaction in pitch-catch mode, the following can be referred to. B-scan and C-scan representations of A 0 Lamb wave obtained within honeycomb specimens show leaky Lamb wave over the delamination area [121]. The TOF indicator in A-scan representations of the Lamb wave demonstrating S 0 mode generated by A 0 mode excitation only within delamination area of symmetrically and asymmetrically delaminated CFRP laminates has been discussed for delamination localization respectively in [122] and [123]. Likewise, delamination size has been quantified using TOFs of the waves transmitted through the delamination area in A-scan representations of asymmetrically cross-ply GFRP laminates as a consequence of mode conversion ( A 0 to S 0 ) [124]. Additionally, high percentage variations for S 0 mode velocity due to its dependency on the wave propagation directed in-plane stiffness for sub-laminates has been obtained compared to main laminate.
Upon employment of signal processing techniques, ACT as well as LDV measurements analyzed within the frequency–wavenumber domain to separate wavefield images, in terms of propagation direction (forward and backward waves) and various modes ( A 0 and S 0 modes) as well as remove incident waves to highlight waves scattered from delamination, have been utilized for delamination identification [125]. Exciting A 0 Lamb mode within CFRP laminates containing variously shaped and sized delamination, reconstructed C-scan images obtained by directional ACT measurement incorporating virtual time reversal have been inspected for delamination localization compared to immersion C-scan testing system [126].

6.5.2. Ultrasonic C-scan Testing

Upon sole utilization of UCT to inspect low-velocity impact-induced delamination, several studies have been included [128,129,130,131]. Sandwich composites composed of variable layers in number of carbon fiber skins under various levels of impact energy have been inspected for delamination detection [128]. A-scan representations of delamination-induced echoes highlighted through signal processing techniques including split spectrum processing as well as expectation maximization have quantified delamination location and depth in CFRP laminates [129]. On inspection of intralaminar (matrix–fiber debonding) and interlaminar (delamination) damages within CFRP laminates, delamination shape is predicted to be related to fiber direction within two differently angled plies around the interface while cohesive contact is optimally applied at those interfaces located between differently angled plies, in terms of a trade-off between accuracy and computational time in numerical delamination modeling [130]. Angles of plies located below and above the interface, the interface-impact point distance, impact energy level and the laminate thickness, as well as ply combination with mismatch angles have been demonstrated to be dominant parameters for in-plane and through-the-thickness delamination distribution according to [131].
Drilling-induced delamination detection using UCT, core drill, candle stick drill, saw drill, and step drill have, respectively, operated at higher feed rate without delamination induction than twist drill [132]. Upon evaluation of the self-healing performance of ionomer interlayers utilized to increase the interlayer’s impact resistance within composite laminates, known as ionomer–composite laminates, under modest temperatures, water- and air-coupled UCTs have effectively detected final-stage healing process of artificially made delamination [133].

6.5.3. Electromagnetic Acoustic Transducer

Electromagnetic acoustic transducer (EMAT) is a non-contact, free-couplant tool for sound generation and reception by electromagnetic mechanisms. It is therefore appropriate for automated detection in harsh environments.
Upon utilization of ultrasonic guided wave-based EMAT for delamination inspection into FRML composites (coin dollar) configured in through-transmission method, the observed cyclic behavior in delamination width vs. guided wave amplitude signals owing to mode conversion within delamination area has been demonstrated to be controlled through selective converted modes, thus efficiently detecting delamination [134].

6.5.4. Phased Array Ultrasonic Transducer

Phased array ultrasonic technique (PAUT) utilizes many small ultrasonic elements, each of which can operate independently, to focus and scan beams at intended distances and angles. The terms “phased” and “array” refer to timing and multiple elements, respectively. PAUT leads to outstanding results particularly for anisotropic composites. It has been shown that PAUT, compared with single element ultrasound, has more stable signal parameters, which are obtained at a lower gain value [135]. Regarding the experimental results, PAUT can detect different sizes of flaw through guided waves. Even though the dispersion characteristics of the waves may complicate the detection of the flaw location, PAUT is considered to be a promising technique for CFRP and GFRP health monitoring.

6.6. Visual Testing

Upon evaluating the suitability of optical microscopic images for delamination estimation within CFRP laminates subjected to the drilling operation, delamination features including delamination geometry at the drill entrance and exit and delamination factor as well as brittle behavior of CFRP have satisfactorily been assessed [136]. Additionally, based on optical micrographs, perforation resistance of carbon or glass FRMLs of different ply angles under low- and high-velocity impact have been quantified while showing delamination to be the primary impact energy dissipation mechanism [137]. Upon scanning electron microscopic-based displacement measurements of the composite laminates in the course of mode II delamination evolution, the energy dissipation mechanism is associated with both causing substantial inelastic shear deformations within plies in the vicinity of the delaminating interface and producing new delamination surfaces [138]. A scanning probe microscopic type technique has been employed to evaluate delaminated electrodes [139].

7. Exemplary Results

Some exemplary results of applying various types of the aforementioned NDE techniques, including thermographic inspection, piezoelectric inspection, optical interferometric inspection, electromagnetic testing, ultrasonic testing, and visual testing, having insight into their performance are illustrated in Figure 10, Figure 11, Figure 12, Figure 13, Figure 14 and Figure 15, respectively.
NDE measurements of six groups have been undergone signal processing techniques. In Figure 10a,b, the thermographic inspection, delamination, as well as fiber structure are highlighted in the raw thermal image of impact-induced delaminated CFRP processed by PCA technique. Next, processed measurements of a circular PZT network attached on an impacted composite’s surface display the delamination location, as specified in Figure 11. Afterward, the amplitude of average wavenumber vs. location resulted from postprocessed measurements of LDV (optical interferometric inspection) are depicted in Figure 12a,b for initial and grown stages of damage showing the delamination characteristics within an impacted CFRP. The delamination location and depth found through THz wave images are then depicted in Figure 13 within an impacted GFRP in which there exist two circular defects of 12 and 6 mm diameters between layers 3 and 4. Lamb wave images of air-coupled transducers obtained at different sets of scan directions while processed by two techniques, namely, full summation and full multiplication, demonstrated in Figure 14, show trapezoidal delamination in a CFRP. Finally, the captured and processed optical microscopic images of the drilling-induced delamination area at a hole exit are depicted in Figure 15.

8. Conclusions

Concerning the key role of laminated composites within the industry as well as the occurrence of the delamination phenomenon therein, a review of the dynamic field of nondestructive evaluation of delaminated composites via various categories of sensing apparatus is provided. Accordingly, the associated technical literature is classified into six main groups, namely, thermographic inspection, piezoelectric inspection, optical interferometric inspection, electromagnetic testing, ultrasonic testing, and visual testing. The results of each group divided into subtopics thereof, visually referred to the literature, are dealt with, their main points are tabulated, and finally their exemplary results are provided. Regarding advantages and disadvantages, the following brief conclusions may be drawn.
Thermographic inspection: The wide variety of non-contact thermography methods based on excitation source and exposure time renders it as a potential effective technique for inspecting various applications. Defect inspection by creating the most interaction between flaw type and thermal wave has been investigated by applying either passive thermography for materials under in-service operation or natural lights, having temperature difference with ambient, or different active thermography using frequency variation of thermal wave to detect flaws at different depths.
Some advantages of thermography include non-contact measurement, its capability for assessment of in-service devices and no need for downtime, and its appropriateness for outdoor inspection. In addition to its advantages, some disadvantages can be referred to. For example, nonuniform volumetric heating, weak surface emissivity, and material anisotropy; thereby, different thermal conductivity within composites may complicate flaw detection. Expensive equipment, requiring the expertise in image interpretation, and nonuniform illumination due to heat blockers are among its demerits.
Piezoelectric inspection: This technique, which uses a network of PZT transducers attached onto or embedded into the host composite, may experience the following drawbacks under loading patterns such as impact: degradation of the transducer–plate bond, transducer breakage, and subsequently false measurement. Inefficiency of locating multiple delamination, requiring an innovative concept in transducer configuration and data processing requirement, limited working temperature, and impact-induced embrittlement have been reported as problems within piezoelectric measurements. Its easy bonding to a curved, complicated surface, low price, embedment property, small size, and good frequency response are a few advantages of piezoelectric inspection.
Optical interferometric inspection: Out of the optical interferometric techniques, those classified into detector-based interferometry, including FBG and LDV, although limited in spatial domain resolution, are fascinating to researchers. Local FBG sensors particularly useful for known suspicious regions, as the best option for internal strain monitoring of composites, are functionally degraded within nonuniform strain distribution. When embedding FBGs, the brittle behavior of composites due to increasing the fiber volume fraction has been reported and the FBG position through the thickness to be an important factor on the detrimental behavior of delamination. Efficiently reducing the number of LDV measurements is an attractive subject to optimize the analysis time.
Non-contact base, high-accuracy measurement, and usage ability in hostile environments and hard-to-reach areas make optical interferometry appropriate for industrial application. However, it is susceptible to environmental noises such as vibrations, environmental disturbance, and temperature, and thus requires vibration isolation; it has to be used in environment-controlled optical laboratories. The interpretation of the resultant images is difficult.
Electromagnetic testing: Techniques classified into electromagnetic testing can be limited by their high initial cost and during application on large structures while rendering high-resolution images.
When inspecting delamination within curved surfaces of composites, the damage may not interact properly with absorption contrast using simple projections. Therefore, low contribution to absorption contrast is another difficulty. In some techniques, defect size may set beyond the spatial resolution threshold. Low X-ray attenuation in composite elements and studied specimens with large dimensions will make this category challenging for the inspection purpose.
Ultrasonic testing: Ultrasonic testing of a contact-based nature generally requires liquid coupling to establish direct contact between a transducer and the composite specimen; thereby, a detrimental effect on the specimen is probable. Additionally, Ultrasonic C-scan as a reference standard is mostly utilized for either verification of other NDE techniques or providing supplementary information. On the other hand, air-coupled and electromagnetic acoustic transducers are non-contact and do not require coupling for sound generation and reception by electromagnetic mechanisms. Therefore, they are appropriate for automated detection in harsh environments.
Some of the disadvantages include the requirement for skilled operators and other complementary NDE techniques, difficulty in complicated and out-of-reach surfaces, contact-based nature, couplant requirement and probable detrimental effect, and bonding degradation due to penetrating couplant into the composite. High penetration and sensitivity resulting in detection of the deep and small flaws, portability, and immediate results may be a few advantages of this category.
Phased array ultrasonic technique containing an array of multiple transducers can cover a large area using phased transmission and propagation of waves in different angles and distances. The reduced time scan and improvement in damage detection results are a few of its advantages.
Visual testing: Visual testing through microscopy has mostly been utilized to provide supplementary information along with measurements of other NDE techniques for delamination detection. This category can be an inherent part of all other NDE techniques, and it is considered to be inexpensive, portable, not accurate, and superficial for detection purposes.

Funding

This research received no external funding.

Conflicts of Interest

The authors declare no conflict of interest.

References

  1. Herrmann, A.W. ASCE 2013 Report Card for America’s Infrastructure; IABSE Symposium Report; International Association for Bridge and Structural Engineering: Zürich, Switzerland, 2013; Volume 99, pp. 9–10. [Google Scholar]
  2. Ricci, F.; Monaco, E.; Maio, L.; Boffa, N.D.; Mal, A.K. Guided waves in a stiffened composite laminate with a delamination. Struct. Health Monit. 2016, 15, 351–358. [Google Scholar] [CrossRef]
  3. Balageas, D.; Fritzen, C.P.; Güemes, A. Structural Health Monitoring; John Wiley & Sons: Hoboken, NJ, USA, 2010; Volume 90. [Google Scholar]
  4. Steinmann, W.; Saelhoff, A.K. Essential properties of fibres for composite applications. In Fibrous and Textile Materials for Composite Applications; Springer: Berlin/Heidelberg, Germany, 2016; pp. 39–73. [Google Scholar]
  5. Yang, Q.; Cox, B. Cohesive models for damage evolution in laminated composites. Int. J. Fract. 2005, 133, 107–137. [Google Scholar] [CrossRef]
  6. Liu, D.; Raju, B.B.; Dang, X. Size effects on impact response of composite laminates. Int. J. Impact Eng. 1998, 21, 837–854. [Google Scholar] [CrossRef]
  7. Mouritz, A. Review of z-pinned composite laminates. Compos. Part A Appl. Sci. Manuf. 2007, 38, 2383–2397. [Google Scholar] [CrossRef]
  8. Choi, I.; Ahn, S.; Yeom, C.; Hwang, I.; Lee, D. Manufacturing of z-pinned composite laminates. In Proceedings of the 17 th International Conference on Composite Materials, Edinburgh, UK, 27–31 July 2009; Volume 27. [Google Scholar]
  9. Ladani, R.B.; Pingkarawat, K.; Nguyen, A.T.; Wang, C.H.; Mouritz, A.P. Delamination toughening and healing performance of woven composites with hybrid z-fibre reinforcement. Compos. Part A Appl. Sci. Manuf. 2018, 110, 258–267. [Google Scholar] [CrossRef]
  10. Ravindran, A.R.; Ladani, R.B.; Wang, C.H.; Mouritz, A.P. Hierarchical mode I and mode II interlaminar toughening of Z-pinned composites using 1D and 2D carbon nanofillers. Compos. Part A Appl. Sci. Manuf. 2019, 124, 105470. [Google Scholar] [CrossRef]
  11. Fu, Y.; Pedrini, G.; Li, X. Interferometric dynamic measurement: Techniques based on high-speed imaging or a single photodetector. Sci. World J. 2014, 2014, 232906. [Google Scholar] [CrossRef]
  12. Lee, H.S.; Lee, H.D.; Kim, H.J.; Cho, J.D.; Jeong, M.Y.; Kim, C.S. A fiber Bragg grating sensor interrogation system based on a linearly wavelength-swept thermo-optic laser chip. Sensors 2014, 14, 16109–16116. [Google Scholar] [CrossRef]
  13. Usamentiaga, R.; Venegas, P.; Guerediaga, J.; Vega, L.; Molleda, J.; Bulnes, F.G. Infrared thermography for temperature measurement and nondestructive testing. Sensors 2014, 14, 12305–12348. [Google Scholar] [CrossRef]
  14. Chrysafi, A.; Athanasopoulos, N.; Siakavellas, N. Damage detection on composite materials with active thermography and digital image processing. Int. J. Therm. Sci. 2017, 116, 242–253. [Google Scholar] [CrossRef]
  15. Khatibi, A.A.; Maleki, H.R. On the application of liquid–crystal thermography for the nondestructive detection of delamination in composite structures. Polym. Compos. 2008, 29, 798–803. [Google Scholar] [CrossRef]
  16. Hellstein, P.; Szwedo, M. 3D thermography in nondestructive testing of composite structures. Meas. Sci. Technol. 2016, 27, 124006. [Google Scholar] [CrossRef]
  17. Meinlschmidt, P.; Aderhold, J. Thermographic inspection of rotor blades. In Proceedings of the 9th European Conference on NDT, Berlin, Germany, 25–29 September 2006. [Google Scholar]
  18. Hung, Y.; Chen, Y.S.; Ng, S.; Liu, L.; Huang, Y.; Luk, B.; Ip, R.; Wu, C.; Chung, P. Review and comparison of shearography and active thermography for nondestructive evaluation. Mater. Sci. Eng. R Rep. 2009, 64, 73–112. [Google Scholar] [CrossRef] [Green Version]
  19. Netzelmann, U.; Walle, G.; Lugin, S.; Ehlen, A.; Bessert, S.; Valeske, B. Induction thermography: Principle, applications and first steps towards standardisation. Quant. InfraRed Thermogr. J. 2016, 13, 170–181. [Google Scholar] [CrossRef]
  20. Pan, M.; He, Y.; Tian, G.; Chen, D.; Luo, F. Defect characterisation using pulsed eddy current thermography under transmission mode and NDT applications. NdT E Int. 2012, 52, 28–36. [Google Scholar] [CrossRef]
  21. He, Y.; Pan, M.; Luo, F. Defect characterisation based on heat diffusion using induction thermography testing. Rev. Sci. Instrum. 2012, 83, 104702. [Google Scholar] [CrossRef]
  22. He, Y.; Yang, R. Eddy current volume heating thermography and phase analysis for imaging characterization of interface delamination in CFRP. IEEE Trans. Ind. Informat. 2015, 11, 1287–1297. [Google Scholar] [CrossRef]
  23. Wilson, J.; Tian, G.; Abidin, I.; Yang, S.; Almond, D. Pulsed eddy current thermography: System development and evaluation. Insight-Non Test. Cond. Monit. 2010, 52, 87–90. [Google Scholar] [CrossRef]
  24. Yang, R.; He, Y. Polymer-matrix composites carbon fibre characterisation and damage inspection using selectively heating thermography (SeHT) through electromagnetic induction. Compos. Struct. 2016, 140, 590–601. [Google Scholar] [CrossRef]
  25. Tian, G.; Gao, Y.; Li, K.; Wang, Y.; Gao, B.; He, Y. Eddy current pulsed thermography with different excitation configurations for metallic material and defect characterization. Sensors 2016, 16, 843. [Google Scholar] [CrossRef]
  26. Ibarra-Castanedo, C.; Avdelidis, N.P.; Grinzato, E.G.; Bison, P.G.; Marinetti, S.; Plescanu, C.C.; Bendada, A.; Maldague, X.P. Delamination detection and impact damage assessment of GLARE by active thermography. Int. J. Mater. Prod. Technol. 2011, 41, 5–16. [Google Scholar] [CrossRef]
  27. Duan, Y.; Servais, P.; Genest, M.; Ibarra-Castanedo, C.; Maldague, X.P. ThermoPoD: A reliability study on active infrared thermography for the inspection of composite materials. J. Mech. Sci. Technol. 2012, 26, 1985–1991. [Google Scholar] [CrossRef]
  28. Roche, J.M.; Balageas, D.L. Common tools for quantitative pulse and step-heating thermography–part II: Experimental investigation. Quant. Infrared Thermogr. J. 2015, 12, 1–23. [Google Scholar] [CrossRef]
  29. Sakagami, T.; Kubo, S. Applications of pulse heating thermography and lock-in thermography to quantitative nondestructive evaluations. Infrared Phys. Technol. 2002, 43, 211–218. [Google Scholar] [CrossRef]
  30. Liu, B.; Zhang, H.; Fernandes, H.; Maldague, X. Quantitative evaluation of pulsed thermography, lock-in thermography and vibrothermography on foreign object defect (FOD) in CFRP. Sensors 2016, 16, 743. [Google Scholar] [CrossRef]
  31. Maldague, X.; Galmiche, F.; Ziadi, A. Advances in pulsed phase thermography. Infrared Phys. Technol. 2002, 43, 175–181. [Google Scholar] [CrossRef] [Green Version]
  32. Ghadermazi, K.; Khozeimeh, M.; Taheri-Behrooz, F.; Safizadeh, M. Delamination detection in glass–epoxy composites using step-phase thermography (SPT). Infrared Phys. Technol. 2015, 72, 204–209. [Google Scholar] [CrossRef]
  33. Meola, C.; Carlomagno, G.; Annicchiarico, D.; Giordano, M.; Zarrelli, M. Detection of delamination in carbon-fibre-reinforced polymers with lock-in thermography. Proc. Inst. Mech. Eng. Part G J. Aerosp. Eng. 2010, 224, 1219–1227. [Google Scholar] [CrossRef]
  34. Ranjit, S.; Choi, M.; Kim, W. Quantification of defects depth in glass fiber-reinforced plastic plate by infrared lock-in thermography. J. Mech. Sci. Technol. 2016, 30, 1111–1118. [Google Scholar] [CrossRef]
  35. Park, G.; Rutherford, A.C.; Wait, J.R.; Nadler, B.; Farrar, C.; Claytor, T.N. High-frequency response functions for composite plate monitoring with ultrasonic validation. AIAA J. 2005, 43, 2431–2437. [Google Scholar] [CrossRef]
  36. Yan, Y.; Yam, L. Detection of delamination damage in composite plates using energy spectrum of structural dynamic responses decomposed by wavelet analysis. Comput. Struct. 2004, 82, 347–358. [Google Scholar] [CrossRef]
  37. Yam, L.; Wei, Z.; Cheng, L. Nondestructive detection of internal delamination by vibration-based method for composite plates. J. Compos. Mater. 2004, 38, 2183–2198. [Google Scholar] [CrossRef]
  38. Crivelli, D.; Guagliano, M.; Eaton, M.; Pearson, M.; Al-Jumaili, S.; Holford, K.; Pullin, R. Localisation and identification of fatigue matrix cracking and delamination in a carbon fibre panel by acoustic emission. Compos. Part B Eng. 2015, 74, 1–12. [Google Scholar] [CrossRef] [Green Version]
  39. Nikbakht, M.; Yousefi, J.; Hosseini-Toudeshky, H.; Minak, G. Delamination evaluation of composite laminates with different interface fiber orientations using acoustic emission features and micro visualization. Compos. Part B Eng. 2017, 113, 185–196. [Google Scholar] [CrossRef]
  40. Fotouhi, M.; Najafabadi, M.A. Acoustic emission-based study to characterize the initiation of delamination in composite materials. J. Thermoplast. Compos. Mater. 2016, 29, 519–537. [Google Scholar] [CrossRef]
  41. Fotouhi, M.; Ahmadi Najafabadi, M. Investigation of the mixed-mode delamination in polymer-matrix composites using acoustic emission technique. J. Reinf. Plast. Compos. 2014, 33, 1767–1782. [Google Scholar] [CrossRef]
  42. Pasquali, M.; Lacarbonara, W. Delamination detection in composite laminates using high-frequency P-and S-waves–Part I: Theory and analysis. Compos. Struct. 2015, 134, 1095–1108. [Google Scholar] [CrossRef]
  43. Pasquali, M.; Lacarbonara, W.; Farrar, C.R. Delamination detection in composite laminates using high-frequency P-and S-waves–Part II: Experimental validation. Compos. Struct. 2015, 134, 1109–1117. [Google Scholar] [CrossRef]
  44. Schaal, C.; Samajder, H.; Baid, H.; Mal, A. Rayleigh to Lamb wave conversion at a delamination-like crack. J. Sound Vib. 2015, 353, 150–163. [Google Scholar] [CrossRef]
  45. Chrysochoidis, N.A.; Barouni, A.K.; Saravanos, D.A. Delamination detection in composites using wave modulation spectroscopy with a novel active nonlinear acousto-ultrasonic piezoelectric sensor. J. Intell. Mater. Syst. Struct. 2011, 22, 2193–2206. [Google Scholar] [CrossRef]
  46. Muc, A.; Stawiarski, A. Location of delaminations in curved laminated panels. Compos. Struct. 2015, 133, 652–658. [Google Scholar] [CrossRef]
  47. Memmolo, V.; Maio, L.; Boffa, N.D.; Monaco, E.; Ricci, F. Damage detection tomography based on guided waves in composite structures using a distributed sensor network. Opt. Eng. 2015, 55, 011007. [Google Scholar] [CrossRef]
  48. Rosalie, S.; Vaughan, M.; Bremner, A.; Chiu, W. Variation in the group velocity of Lamb waves as a tool for the detection of delamination in GLARE aluminium plate-like structures. Compos. Struct. 2004, 66, 77–86. [Google Scholar] [CrossRef]
  49. Hu, N.; Shimomukai, T.; Yan, C.; Fukunaga, H. Identification of delamination position in cross-ply laminated composite beams using S0 Lamb mode. Compos. Sci. Technol. 2008, 68, 1548–1554. [Google Scholar] [CrossRef] [Green Version]
  50. Greve, D.; Neumann, J.; Nieuwenhuis, J.; Oppenheim, I.; Tyson, N. Use of Lamb waves to monitor plates: Experiments and simulations. In Smart Structures and Materials 2005: Sensors and Smart Structures Technologies for Civil, Mechanical, and Aerospace Systems; International Society for Optics and Photonics: Bellingham, WA, USA, 2005; Volume 5765, pp. 281–293. [Google Scholar]
  51. Su, Z.; Ye, L. Fundamental Lamb mode-based delamination detection for CF/EP composite laminates using distributed piezoelectrics. Struct. Health Monit. 2004, 3, 43–68. [Google Scholar] [CrossRef]
  52. Hu, N.; Liu, Y.; Li, Y.; Peng, X.; Yan, B. Optimal excitation frequency of Lamb waves for delamination detection in CFRP laminates. J. Compos. Mater. 2010, 44, 1643–1663. [Google Scholar] [CrossRef]
  53. Purekar, A.; Pines, D. Damage detection in thin composite laminates using piezoelectric phased sensor arrays and guided Lamb wave interrogation. J. Intell. Mater. Syst. Struct. 2010, 21, 995–1010. [Google Scholar] [CrossRef]
  54. Yeum, C.M.; Sohn, H.; Lim, H.J.; Ihn, J.B. Reference-free delamination detection using Lamb waves. Struct. Control Health Monit. 2014, 21, 675–684. [Google Scholar] [CrossRef]
  55. Yeum, C.M.; Sohn, H.; Ihn, J.B.; Lim, H.J. Instantaneous delamination detection in a composite plate using a dual piezoelectric transducer network. Compos. Struct. 2012, 94, 3490–3499. [Google Scholar] [CrossRef]
  56. Yelve, N.P.; Mitra, M.; Mujumdar, P.; Ramadas, C. A hybrid method based upon nonlinear Lamb wave response for locating a delamination in composite laminates. Ultrasonics 2016, 70, 12–17. [Google Scholar] [CrossRef]
  57. Yelve, N.P.; Mitra, M.; Mujumdar, P. Detection of delamination in composite laminates using Lamb wave based nonlinear method. Compos. Struct. 2017, 159, 257–266. [Google Scholar] [CrossRef]
  58. Soleimanpour, R.; Ng, C.T. Locating delaminations in laminated composite beams using nonlinear guided waves. Eng. Struct. 2017, 131, 207–219. [Google Scholar] [CrossRef] [Green Version]
  59. Ip, K.H.; Mai, Y.W. Delamination detection in smart composite beams using Lamb waves. Smart Mater. Struct. 2004, 13, 544. [Google Scholar] [CrossRef]
  60. Sohn, H.; Park, G.; Wait, J.R.; Limback, N.P.; Farrar, C.R. Wavelet-based active sensing for delamination detection in composite structures. Smart Mater. Struct. 2003, 13, 153. [Google Scholar] [CrossRef]
  61. Su, Z.; Yang, C.; Pan, N.; Ye, L.; Zhou, L.M. Assessment of delamination in composite beams using shear horizontal (SH) wave mode. Compos. Sci. Technol. 2007, 67, 244–251. [Google Scholar] [CrossRef]
  62. Barnard, D.J. A variable pitch comb fixture for Rayleigh wave generation and reception. In Proceedings of the AIP Conference Proceedings, Omsk, Russia, 26 February–2 March 2018; Volume 894, pp. 1684–1690. [Google Scholar]
  63. Mal, A. Elastic waves from localized sources in composite laminates. Int. J. Solids Struct. 2002, 39, 5481–5494. [Google Scholar] [CrossRef]
  64. Ostachowicz, W.; Kudela, P.; Krawczuk, M.; Zak, A. Guided waves in Structures for SHM: The Time-Domain Spectral Element Method; John Wiley & Sons: Hoboken, NJ, USA, 2011. [Google Scholar]
  65. Seif, M.A.; Khashaba, U.A.; Rojas-Oviedo, R. Measuring delamination in carbon/epoxy composites using a shadow moiré laser based imaging technique. Compos. Struct. 2007, 79, 113–118. [Google Scholar] [CrossRef]
  66. Maranon, A.; Ruiz, P.; Nurse, A.; Huntley, J.; Rivera, L.; Zhou, G. Identification of subsurface delaminations in composite laminates. Compos. Sci. Technol. 2007, 67, 2817–2826. [Google Scholar] [CrossRef]
  67. Hatta, H.; Aly-Hassan, M.S.; Hatsukade, Y.; Wakayama, S.; Suemasu, H.; Kasai, N. Damage detection of C/C composites using ESPI and SQUID techniques. Compos. Sci. Technol. 2005, 65, 1098–1106. [Google Scholar] [CrossRef]
  68. Akhter, N.; Jung, H.C.; Chang, H.S.; Kim, K.S. Location of delamination in laminated composite plates by pulsed laser holography. Opt. Lasers Eng. 2009, 47, 584–588. [Google Scholar] [CrossRef]
  69. Bruno, F.; Laurent, J.; Prada, C.; Lamboul, B.; Passilly, B.; Atlan, M. Non-destructive testing of composite plates by holographic vibrometry. J. Appl. Phys. 2014, 115, 154503. [Google Scholar] [CrossRef] [Green Version]
  70. De Angelis, G.; Meo, M.; Almond, D.P.; Pickering, S.G.; Angioni, S.L. A new technique to detect defect size and depth in composite structures using digital shearography and unconstrained optimization. NdT E Int. 2012, 45, 91–96. [Google Scholar] [CrossRef]
  71. Gryzagoridis, J.; Findeis, D. Simultaneous shearographic and thermographic NDT of aerospace materials. Insight-Non Test. Cond. Monit. 2006, 48, 294–297. [Google Scholar] [CrossRef]
  72. Ling, H.Y.; Lau, K.T.; Lam, C.K. Effects of embedded optical fibre on mode II fracture behaviours of woven composite laminates. Compos. Part B Eng. 2005, 36, 534–543. [Google Scholar] [CrossRef]
  73. Takeda, N.; Okabe, Y.; Kuwahara, J.; Kojima, S.; Ogisu, T. Development of smart composite structures with small-diameter fiber Bragg grating sensors for damage detection: Quantitative evaluation of delamination length in CFRP laminates using Lamb wave sensing. Compos. Sci. Technol. 2005, 65, 2575–2587. [Google Scholar] [CrossRef]
  74. Jang, B.W.; Kim, C.G. Real-time detection of low-velocity impact-induced delamination onset in composite laminates for efficient management of structural health. Compos. Part B Eng. 2017, 123, 124–135. [Google Scholar] [CrossRef]
  75. Luyckx, G.; Voet, E.; Lammens, N.; Degrieck, J. Strain measurements of composite laminates with embedded fibre Bragg gratings: Criticism and opportunities for research. Sensors 2010, 11, 384–408. [Google Scholar] [CrossRef]
  76. Takeda, S.; Okabe, Y.; Takeda, N. Delamination detection in CFRP laminates with embedded small-diameter fiber Bragg grating sensors. Compos. Part A Appl. Sci. Manuf. 2002, 33, 971–980. [Google Scholar] [CrossRef]
  77. Takeda, S.; Okabe, Y.; Yamamoto, T.; Takeda, N. Detection of edge delamination in CFRP laminates under cyclic loading using small-diameter FBG sensors. Compos. Sci. Technol. 2003, 63, 1885–1894. [Google Scholar] [CrossRef]
  78. Ling, H.Y.; Lau, K.T.; Cheng, L. Determination of dynamic strain profile and delamination detection of composite structures using embedded multiplexed fibre-optic sensors. Compos. Struct. 2004, 66, 317–326. [Google Scholar] [CrossRef]
  79. Leung, C.K.; Yang, Z.; Xu, Y.; Tong, P.; Lee, S.K. Delamination detection in laminate composites with an embedded fiber optical interferometric sensor. Sens. Actuators A Phys. 2005, 119, 336–344. [Google Scholar] [CrossRef]
  80. Frieden, J.; Cugnoni, J.; Botsis, J.; Gmür, T. Vibration-based characterization of impact-induced delamination in composite plates using embedded FBG sensors and numerical modelling. Compos. Part B Eng. 2011, 42, 607–613. [Google Scholar] [CrossRef]
  81. Nalawade, S.M.; Mahra, N.; Grattan, K.; Thakur, H.V. Delamination detection in glass composites using embedded Hi-Bi photonic crystal fiber. Smart Mater. Struct. 2011, 20, 055023. [Google Scholar] [CrossRef]
  82. Lam, P.M.; Lau, K.T.; Ling, H.Y.; Su, Z.; Tam, H.Y. Acousto-ultrasonic sensing for delaminated GFRP composites using an embedded FBG sensor. Opt. Lasers Eng. 2009, 47, 1049–1055. [Google Scholar] [CrossRef]
  83. Sorensen, L.; Botsis, J.; Gmür, T.; Cugnoni, J. Delamination detection and characterisation of bridging tractions using long FBG optical sensors. Compos. Part A Appl. Sci. Manuf. 2007, 38, 2087–2096. [Google Scholar] [CrossRef]
  84. Bao, Y.; Valipour, M.; Meng, W.; Khayat, K.H.; Chen, G. Distributed fiber optic sensor-enhanced detection and prediction of shrinkage-induced delamination of ultra-high-performance concrete overlay. Smart Mater. Struct. 2017, 26, 085009. [Google Scholar] [CrossRef]
  85. Mieloszyk, M.; Skarbek, L.; Krawczuk, M.; Ostachowicz, W.; Zak, A. Application of fibre Bragg grating sensors for structural health monitoring of an adaptive wing. Smart Mater. Struct. 2011, 20, 125014. [Google Scholar] [CrossRef]
  86. Sohn, H.; Dutta, D.; Yang, J.; Park, H.; DeSimio, M.; Olson, S.; Swenson, E. Delamination detection in composites through guided wave field image processing. Compos. Sci. Technol. 2011, 71, 1250–1256. [Google Scholar] [CrossRef]
  87. Sohn, H.; Dutta, D.; Yang, J.; DeSimio, M.; Olson, S.; Swenson, E. Automated detection of delamination and disbond from wavefield images obtained using a scanning laser vibrometer. Smart Mater. Struct. 2011, 20, 045017. [Google Scholar] [CrossRef]
  88. Park, B.; An, Y.K.; Sohn, H. Visualization of hidden delamination and debonding in composites through noncontact laser ultrasonic scanning. Compos. Sci. Technol. 2014, 100, 10–18. [Google Scholar] [CrossRef]
  89. Rogge, M.D.; Leckey, C.A. Characterization of impact damage in composite laminates using guided wavefield imaging and local wavenumber domain analysis. Ultrasonics 2013, 53, 1217–1226. [Google Scholar] [CrossRef] [PubMed]
  90. Tian, Z.; Yu, L.; Leckey, C. Delamination detection and quantification on laminated composite structures with Lamb waves and wavenumber analysis. J. Intell. Mater. Syst. Struct. 2015, 26, 1723–1738. [Google Scholar] [CrossRef]
  91. Tian, Z.; Yu, L.; Leckey, C.; Seebo, J. Guided wave imaging for detection and evaluation of impact-induced delamination in composites. Smart Mater. Struct. 2015, 24, 105019. [Google Scholar] [CrossRef]
  92. Tian, Z.; Yu, L.; Leckey, C. Rapid guided wave delamination detection and quantification in composites using global-local sensing. Smart Mater. Struct. 2016, 25, 085042. [Google Scholar] [CrossRef]
  93. Staszewski, W.; Mahzan, S.; Traynor, R. Health monitoring of aerospace composite structures–Active and passive approach. Compos. Sci. Technol. 2009, 69, 1678–1685. [Google Scholar] [CrossRef]
  94. Żak, A.; Ostachowicz, W.; Krawczuk, M. Damage detection strategies for aircraft shell–like structures based on propagation guided elastic waves. J. Phys. Conf. Ser. 2011. [Google Scholar] [CrossRef]
  95. Kudela, P.; Wandowski, T.; Malinowski, P.; Ostachowicz, W. Application of scanning laser Doppler vibrometry for delamination detection in composite structures. Opt. Lasers Eng. 2017, 99, 46–57. [Google Scholar] [CrossRef]
  96. Mesnil, O.; Ruzzene, M. Sparse wavefield reconstruction and source detection using compressed sensing. Ultrasonics 2016, 67, 94–104. [Google Scholar] [CrossRef]
  97. Park, B.; Sohn, H.; Malinowski, P.; Ostachowicz, W. Delamination localization in wind turbine blades based on adaptive time-of-flight analysis of noncontact laser ultrasonic signals. Nondestruct. Test. Eval. 2017, 32, 1–20. [Google Scholar] [CrossRef]
  98. Amraoui, M.; Lieven, N. Laser vibrometry based detection of delaminations in glass/epoxy composites. J. Vib. Acoust. 2004, 126, 430–437. [Google Scholar] [CrossRef]
  99. Qiao, P.; Lu, K.; Lestari, W.; Wang, J. Curvature mode shape-based damage detection in composite laminated plates. Compos. Struct. 2007, 80, 409–428. [Google Scholar] [CrossRef]
  100. Cao, M.; Ostachowicz, W.; Radzieński, M.; Xu, W. Multiscale shear-strain gradient for detecting delamination in composite laminates. Appl. Phys. Lett. 2013, 103, 101910. [Google Scholar] [CrossRef]
  101. Le Bas, P.Y.; Remillieux, M.; Pieczonka, L.; Ten Cate, J.; Anderson, B.; Ulrich, T. Damage imaging in a laminated composite plate using an air-coupled time reversal mirror. Appl. Phys. Lett. 2015, 107, 184102. [Google Scholar] [CrossRef] [Green Version]
  102. Soleimanpour, R.; Ng, C.T.; Wang, C.H. Higher harmonic generation of guided waves at delaminations in laminated composite beams. Struct. Health Monit. 2017, 16, 400–417. [Google Scholar] [CrossRef]
  103. Wandowski, T.; Malinowski, P.; Ostachowicz, W. Delamination detection in CFRP panels using EMI method with temperature compensation. Compos. Struct. 2016, 151, 99–107. [Google Scholar] [CrossRef]
  104. Sun, G.; Zhou, Z.; Chen, X.; Wang, J. Ultrasonic characterization of delamination in aeronautical composites using noncontact laser generation and detection. Appl. Opt. 2013, 52, 6481–6486. [Google Scholar] [CrossRef]
  105. Sun, G.; Zhou, Z. Application of laser ultrasonic technique for non-contact detection of drilling-induced delamination in aeronautical composite components. Opt.-Int. J. Light Electron Opt. 2014, 125, 3608–3611. [Google Scholar] [CrossRef]
  106. Kinet, D.; Mégret, P.; Goossen, K.W.; Qiu, L.; Heider, D.; Caucheteur, C. Fiber Bragg grating sensors toward structural health monitoring in composite materials: Challenges and solutions. Sensors 2014, 14, 7394–7419. [Google Scholar] [CrossRef]
  107. Larrosa, C.; Lonkar, K.; Chang, F.K. In situ damage classification for composite laminates using Gaussian discriminant analysis. Struct. Health Monit. 2014, 13, 190–204. [Google Scholar] [CrossRef]
  108. Aymerich, F.; Dore, F.; Priolo, P. Prediction of impact-induced delamination in cross-ply composite laminates using cohesive interface elements. Compos. Sci. Technol. 2008, 68, 2383–2390. [Google Scholar] [CrossRef] [Green Version]
  109. Tsao, C.; Hocheng, H. Computerized tomography and C-Scan for measuring delamination in the drilling of composite materials using various drills. Int. J. Mach. Tools Manuf. 2005, 45, 1282–1287. [Google Scholar] [CrossRef]
  110. Schilling, P.J.; Karedla, B.R.; Tatiparthi, A.K.; Verges, M.A.; Herrington, P.D. X-ray computed microtomography of internal damage in fiber-reinforced polymer matrix composites. Compos. Sci. Technol. 2005, 65, 2071–2078. [Google Scholar] [CrossRef]
  111. Vavrik, D.; Jakubek, J.; Jandejsek, I.; Krejci, F.; Kumpova, I.; Zemlicka, J. Visualization of delamination in composite materials utilizing advanced X-ray imaging techniques. J. Instrum. 2015, 10, C04012. [Google Scholar] [CrossRef]
  112. Dong, J.; Kim, B.; Locquet, A.; McKeon, P.; Declercq, N.; Citrin, D. Nondestructive evaluation of forced delamination in glass fiber-reinforced composites by terahertz and ultrasonic waves. Compos. Part B Eng. 2015, 79, 667–675. [Google Scholar] [CrossRef]
  113. Ryu, C.H.; Park, S.H.; Kim, D.H.; Jhang, K.Y.; Kim, H.S. Nondestructive evaluation of hidden multi-delamination in a glass-fiber-reinforced plastic composite using terahertz spectroscopy. Compos. Struct. 2016, 156, 338–347. [Google Scholar] [CrossRef]
  114. Todoroki, A.; Tanaka, M.; Shimamura, Y. High performance estimations of delamination of graphite/epoxy laminates with electric resistance change method. Compos. Sci. Technol. 2003, 63, 1911–1920. [Google Scholar] [CrossRef]
  115. Escalona Galvis, L.; Diaz-Montiel, P.; Venkataraman, S. Optimal electrode selection for electrical resistance tomography in carbon fiber-reinforced polymer composites. Materials 2017, 10, 125. [Google Scholar] [CrossRef]
  116. Zhao, Q.; Zhang, K.; Zhu, S.; Xu, H.; Cao, D.; Zhao, L.; Zhang, R.; Yin, W. Review on the Electrical Resistance/Conductivity of Carbon Fiber Reinforced Polymer. Appl. Sci. 2019, 9, 2390. [Google Scholar] [CrossRef]
  117. Matsuzaki, R.; Todoroki, A. Wireless detection of internal delamination cracks in CFRP laminates using oscillating frequency changes. Compos. Sci. Technol. 2006, 66, 407–416. [Google Scholar] [CrossRef]
  118. Todoroki, A. Delamination monitoring analysis of CFRP structures using multi-probe electrical method. J. Intell. Mater. Syst. Struct. 2008, 19, 291–298. [Google Scholar] [CrossRef]
  119. Matsuzaki, R.; Yamamoto, K.; Todoroki, A. Delamination detection in carbon fiber-reinforced plastic cross-ply laminates using crack swarm inspection: Experimental verification. Compos. Struct. 2017, 173, 127–135. [Google Scholar] [CrossRef]
  120. Tan, P.; Tong, L. Delamination detection of composite beams using piezoelectric sensors with evenly distributed electrode strips. J. Compos. Mater. 2004, 38, 321–352. [Google Scholar] [CrossRef]
  121. Kažys, R.; Demčenko, A.; Žukauskas, E.; Mažeika, L. Air-coupled ultrasonic investigation of multi-layered composite materials. Ultrasonics 2006, 44, e819–e822. [Google Scholar] [CrossRef] [PubMed]
  122. Ramadas, C.; Balasubramaniam, K.; Joshi, M.; Krishnamurthy, C. Interaction of the primary anti-symmetric Lamb mode (Ao) with symmetric delaminations: Numerical and experimental studies. Smart Mater. Struct. 2009, 18, 085011. [Google Scholar] [CrossRef]
  123. Liu, Z.; Yu, H.; He, C.; Wu, B. Delamination detection in composite beams using pure Lamb mode generated by air-coupled ultrasonic transducer. J. Intell. Mater. Syst. Struct. 2014, 25, 541–550. [Google Scholar] [CrossRef]
  124. Ramadas, C.; Janardhan Padiyar, M.; Balasubramaniam, K.; Joshi, M.; Krishnamurthy, C. Delamination size detection using time of flight of anti-symmetric (Ao) and mode converted Ao mode of guided Lamb waves. J. Intell. Mater. Syst. Struct. 2010, 21, 817–825. [Google Scholar] [CrossRef]
  125. Michaels, T.E.; Michaels, J.E.; Ruzzene, M. Frequency–wavenumber domain analysis of guided wavefields. Ultrasonics 2011, 51, 452–466. [Google Scholar] [CrossRef]
  126. Liu, Z.; Yu, H.; Fan, J.; Hu, Y.; He, C.; Wu, B. Baseline-free delamination inspection in composite plates by synthesizing non-contact air-coupled Lamb wave scan method and virtual time reversal algorithm. Smart Mater. Struct. 2015, 24, 045014. [Google Scholar] [CrossRef]
  127. Grimberg, R.; Steigmann, R.; Leitoiu, S.; Andreescu, A.; Savin, A. Ultrasound and eddy current data fusion evaluation of carbon–epoxy composites delaminations. Emerg. Technol. Nondestruct. Test. 2008, 349–355. [Google Scholar] [CrossRef]
  128. Freeman, B.; Schwingler, E.; Mahinfalah, M.; Kellogg, K. The effect of low-velocity impact on the fatigue life of Sandwich composites. Compos. Struct. 2005, 70, 374–381. [Google Scholar] [CrossRef]
  129. Benammar, A.; Drai, R.; Guessoum, A. Detection of delamination defects in CFRP materials using ultrasonic signal processing. Ultrasonics 2008, 48, 731–738. [Google Scholar] [CrossRef] [PubMed]
  130. Long, S.; Yao, X.; Zhang, X. Delamination prediction in composite laminates under low-velocity impact. Compos. Struct. 2015, 132, 290–298. [Google Scholar] [CrossRef]
  131. Wang, H.R.; Long, S.C.; Zhang, X.Q.; Yao, X.H. Study on the delamination behavior of thick composite laminates under low-energy impact. Compos. Struct. 2018, 184, 461–473. [Google Scholar] [CrossRef]
  132. Hocheng, H.; Tsao, C. Effects of special drill bits on drilling-induced delamination of composite materials. Int. J. Mach. Tools Manuf. 2006, 46, 1403–1416. [Google Scholar] [CrossRef]
  133. Post, W.; Kersemans, M.; Solodov, I.; Van Den Abeele, K.; García, S.; van der Zwaag, S. Non-destructive monitoring of delamination healing of a CFRP composite with a thermoplastic ionomer interlayer. Compos. Part A Appl. Sci. Manuf. 2017, 101, 243–253. [Google Scholar] [CrossRef]
  134. Gao, H.; Ali, S.; Lopez, B. Efficient detection of delamination in multilayered structures using ultrasonic guided wave EMATs. NDT E Int. 2010, 43, 316–322. [Google Scholar] [CrossRef]
  135. Taheri, H.; Hassen, A.A. Nondestructive Ultrasonic Inspection of Composite Materials: A Comparative Advantage of Phased Array Ultrasonic. Appl. Sci. 2019, 9, 1628. [Google Scholar] [CrossRef]
  136. Davim, J.P.; Rubio, J.C.; Abrao, A. A novel approach based on digital image analysis to evaluate the delamination factor after drilling composite laminates. Compos. Sci. Technol. 2007, 67, 1939–1945. [Google Scholar] [CrossRef]
  137. Cortes, P.; Cantwell, W. The impact properties of high-temperature fiber-metal laminates. J. Compos. Mater. 2007, 41, 613–632. [Google Scholar] [CrossRef]
  138. Jalalvand, M.; Czél, G.; Fuller, J.D.; Wisnom, M.R.; Canal, L.P.; González, C.D.; LLorca, J. Energy dissipation during delamination in composite materials–An experimental assessment of the cohesive law and the stress-strain field ahead of a crack tip. Compos. Sci. Technol. 2016, 134, 115–124. [Google Scholar] [CrossRef]
  139. Yamanaka, K.; Kobari, K.; Tsuji, T. Evaluation of functional materials and devices using atomic force microscopy with ultrasonic measurements. Jpn. J. Appl. Phys. 2008, 47, 6070. [Google Scholar] [CrossRef]
Figure 1. A general quantitative diagram of research published on delamination detection based on: (a) annual research and (b) the non-contact and contact-based sensing apparatus.
Jcs 03 00095 g001
Figure 2. A schematic illustration of (a) structure of the composite laminate and (b) damage modes dominating the behavior of laminated composites.
Jcs 03 00095 g002
Figure 3. A hierarchical structure of thermographic inspection.
Jcs 03 00095 g003
Figure 4. Visually organized piezoelectric inspection.
Jcs 03 00095 g004
Figure 5. A visual representation of optical interferometry-based techniques.
Jcs 03 00095 g005
Figure 6. A classification of electromagnetic testing.
Jcs 03 00095 g006
Figure 7. Ultrasonic testing organization.
Jcs 03 00095 g007
Figure 8. Visual testing organization.
Jcs 03 00095 g008
Figure 9. Schematic process of the pulsed eddy current (EC) thermography under reflection mode.
Jcs 03 00095 g009
Figure 10. Exemplary thermographic maps of a delaminated carbon fiber-reinforced polymer (CFRP). Reproduced with permission from [20].
Jcs 03 00095 g010
Figure 11. Damage map of PZT network processed measurements. Reproduced with permission from [47].
Jcs 03 00095 g011
Figure 12. The average wavenumber map vs. location of laser Doppler vibrometry (LDV) measurement at an excitation frequency of 500 kHz. Reproduced with permission from [89].
Jcs 03 00095 g012
Figure 13. THz images of a delaminated GFRP: (a) C-scan and (b) B-scan representing delamination location and interface. Reproduced with permission from [112].
Jcs 03 00095 g013
Figure 14. Air-coupled Lamb wave images postprocessed by (a) full summation and (b) full multiplication in different scan directions for trapezoidal and circular delamination. Reproduced with permission from [126].
Jcs 03 00095 g014
Figure 15. The captured and processed optical microscopic images at a hole exit drilled with feed rate 0.35 mm/rev and cutting speed 60 m/min in a CFRP. Reproduced with permission from [136].
Jcs 03 00095 g015
Table 1. An illustrative matrix of additional keywords searched for different nondestructive evaluation (NDE) techniques.
TechniqueKeyword (s)
Thermographic inspectionThermography; Thermosonic
Piezoelectric inspectionPiezoelectric (PZT)
Optical interferometryMoiré interferometry; Shearography; Digital holography; Electronic speckle pattern interferometry; Laser vibrometry; Fiber Bragg grating
Electromagnetic testingRadiography; Computed tomography; Terahertz spectroscopy
Ultrasonic testingAir-coupled transducer; Ultrasonic C-scan
Visual testingMicroscope
Table 2. Application of NDE techniques in industry.
CategoryIndustrial Applications
Thermographic inspectionElectrical high-voltage and low-voltage installations such as electrical power grid and electrical cabinets and motor control centers; Mechanical installations such as gearboxes and bearings; Pipework; Construction; Medical imaging; Petrochemical sector; Refractory and petrochemical installations; Flare detection.
Piezoelectric inspectionAutomobile manufacturing; Medical technology; Aerospace and nuclear instrumentation.
Optical interferometryThe optical industry to test the surfaces quality; Power industry.
Electromagnetic testingMedical imaging; Manufacturing; Aerospace and automotive.
Ultrasonic testingAerospace and automotive sectors; Manufacturing; Medical imaging; Pipelines and Construction.
Visual testingMedical; Machinery; Aircraft.
Table 3. Characteristics of thermography measurements.
TechniqueMerits and Demerits
LC thermographyInexpensive; Easy setup; Surface preparation by painting and detector (LC) application; Requiring two-sided accessibility of specimen’s surface; Qualitative measurement
PIR thermographyRequiring no excitation; Low resolution; Qualitative measurement
EC thermographySelectively heating (e.g., pulsed); High resolution; Cooling phase for delamination detection; Lower frequency excitation for deeper delamination; Induction coil directed perpendicular to the defect
Pulsed thermographyQuantitative measurement; Requireing application of processing techniques
Step thermographyAppropriate for impact damages
LI thermographyAbility of decreasing frequencies to inspect deep and small delaminations; quantitative measurement
VibrothermographyContact based nature, thereby varying vibration spectrum by contact
All other thermography techniques offer surface painting to increase surface emissivity, as well.
Table 4. Characteristics of NDE techniques based on optical interferometry.
InputOutput (Data Acquisition)
Different loading patterns: temperature gradient, acoustics, negative pressure, Lamb wavesDifference of the distribution of speckle patterns analyzed for output measurements
Surface illumination by laser light sourceFull-field measurements
Phase shifting technique applied to enhance fringe pattern distribution, thereby extracting desired quantitative measurementsRendering mechanical deformation and its derivatives
Delamination detection by finding highly deformed areas
Non-contact operation but FBG; Lower cost and faster measurement; Susceptible to environmental noises; Difficulty in interpreting the resultant images; The possibility of surface ablation by laser light
Table 5. Characteristics of the electromagnetic testing measurements.
Imaging TechniqueMerits/Demerits
2D and 3D X-ray imagingHigh-resolution images of micro-CT, but low spatial resolution threshold
Lifetime reduction of materials under long term exposure of electromagnetic radiation
High initial cost
Applying dye penetrant to enhance the image contrast
Low-contrast images of radiography
Limited application for large specimens
THz imagingThrough-the-thickness quantitative information
High spatial resolution images
Table 6. Characteristics of the ultrasonic testing measurements.
TechniqueMerits/Demerits
Ultrasonic C-scan testingFull-field measurement
Clear delamination localization due to difference between sound impedance scattered from delamination area and intact area
Limited resolution owing to insufficient operating frequency
Lack of through-the-thickness quantitative information occurred in small ratios of thickness and wavelength
The possibility of liquid coupling requirement (contact-based nature and probable detrimental effect)
Bonding degradation due to penetrating couplant into the composite
Point-wise inspection, and consequently a tedious technique
Air-coupled transducerNon-contact; No couplant requirement
Extracting good A-scans; Air–solid material acoustic impedance misfit
Necessity of setting up the appropriate actuator–sensor distance, transducer–composite distance, and incident and reception angles to actuate and receive a particular wave mode
Table 7. A devision of NDE techniques into different classes.
(A) (B)(C)(D)(E)(F)
destructive/nondestructive/ / / / / /
contact/non-contactvibrothermography / / FBG / / / ACT/
local/gobal/ / FBG / / / /
low/high frequency/ / / / / /
vibration/image based/ / FBG / / / /
active/passive/ / AE based/ / / /
(A): Thermographic inspection; (B): Piezoelectric inspection; (C): Optical interferometric inspection; (D): Electromagnetic testing; (E): Ultrasonic testing; (F): Visual testing.
Table 8. Characteristics of the modes for performing thermographic inspection.
ModeCharacteristics
Transmission modeMore accurate for relatively thin-thickness specimens; High contrast results due to blocking heat conduction (smaller 3D heating conduction)
Reflection modeMore practical; Excitation source blocks camera’s view; Appropriate for deeper defects; Larger 3D heating conduction
Table 9. Application rate of processing techniques for thermograms.
TechniqueReference (s)
Fourier transform[14,22,23,27,31,32]
Wavelet transform[14,27]
Principal component analysis (thermography); Independent component analysis[20,27]
Cross correlation matched filtering[23]
Thermal signal reconstruction; Differential absolute contrast[27]
Table 10. Selective excitation methods of elastic waves using surface-bonded piezoelectrics (PZTs).
Wedge method [48,49,61]Single mode excitationFixed angleHeavy and expensive for widespread use
Variable angle
Comb method [62]Multimode wave problem and requiring data postprocessing
Wafer method [50,51,57]Low cost; Practicality; Minimum invasion; Wider frequency bandwidth
Table 11. Delamination detection indicators used in ultrasonic wave-based piezoelectric inspection.
IndicatorReference (s)
Time of flight or the group velocity[42,43,48,49,51,53,56,57,59]
Wave conversion[44,51,61]
Amplitude signal degradation[46,54,60]
Delamination induced contact nonlinearity[56,57,58]
Statistical-geometrical damage index[46,47]
Wavenumber analysis[53]
Nonlinear wave modulation technique[45]
Table 12. Reasons for choosing A 0 or S 0 for NDE technique.
A 0 S 0
Higher amplitude and smaller wavelength, thereby higher sensitivity to small delaminationFaster mode at the low range of frequency-thickness product; Lower attenuation
Generating a shear stress distribution at low frequency rangeThe strong reflection amplitude dependency on the delamination depth such that the amplitude reflected at mid-plane delamination is zero
More delamination-induced delay and amplitude attenuation as a result of shear strength decrease
No S 0 reflection from symmetrically located delamination (zero shear stress) or no S 0 mode–delamination interactionOverlapping S 0 reflections from boundaries with A 0 modes
Table 13. Merits and demerits of ultrasonic elastic wave-based inspection.
MeritsAppropriate for large area inspection due to low energy and amplitude attenuation; Delamination detection at early stages
DemeritsAnisotropy nature of composites with different multiple laminas requires signal processing techniques. Strong boundary reflected multiple waves; Sensitive to structural geometrical features in addition to discontinuities; Dispersive nature of Lamb waves; Presence of edge reflections; Low through-the-air transmittance
Table 14. The fiber Bragg grating’s (FBG’s) challenges and features of measurements.
ChallengesRequiring temperature-strain discrimination through employing an individual temperature compensation FBG immune to strain changes
Amplitude spectrum demodulation
FBG-surrounding material connection; Calibration requirement
FeaturesFBGs are contact-based and local measuring tools; Compatibility with composite materials

