Although fibre tensile strength is most commonly determined using processes such as the single fibre tensile tests [
20], as mentioned in the Introduction, other methods can also be used with varying levels of accuracy. These are, for example, the methods of fibre fragmentation tests [
21] and fibre bundle tests [
22]. In the most basic form, a single fibre (or single fibre composite in the case of fibre fragmentation tests or a fibre bundle in the case of bundle tests) is subjected to a longitudinal and monotonic tensile load until failure. A single failure value leading to the evaluation of the fibre strength is recorded for the single fibre test but a more complex analysis is required for fragmentation or bundle tests, which provides a large amount of failure data during the test. For the present study, the single fibre testing method was used as it is the most popularly used methodology for the determination of fibre tensile strength.
2.1. Single Fibre Testing
Before subjecting the fibres to a tensile load, fibre specimens need to be carefully prepared. As described in [
23], several techniques for the preparation and mounting of fibres exist. These include processes of sticking, pinching or even knotting the fibre to prepare the specimen. Irrespective of the process used, all these techniques share the following same challenges:
aligning the fibre with the loading direction as perfectly as possible; and
controlling the gauge length as accurately as possible, since fibre strength is length dependent.
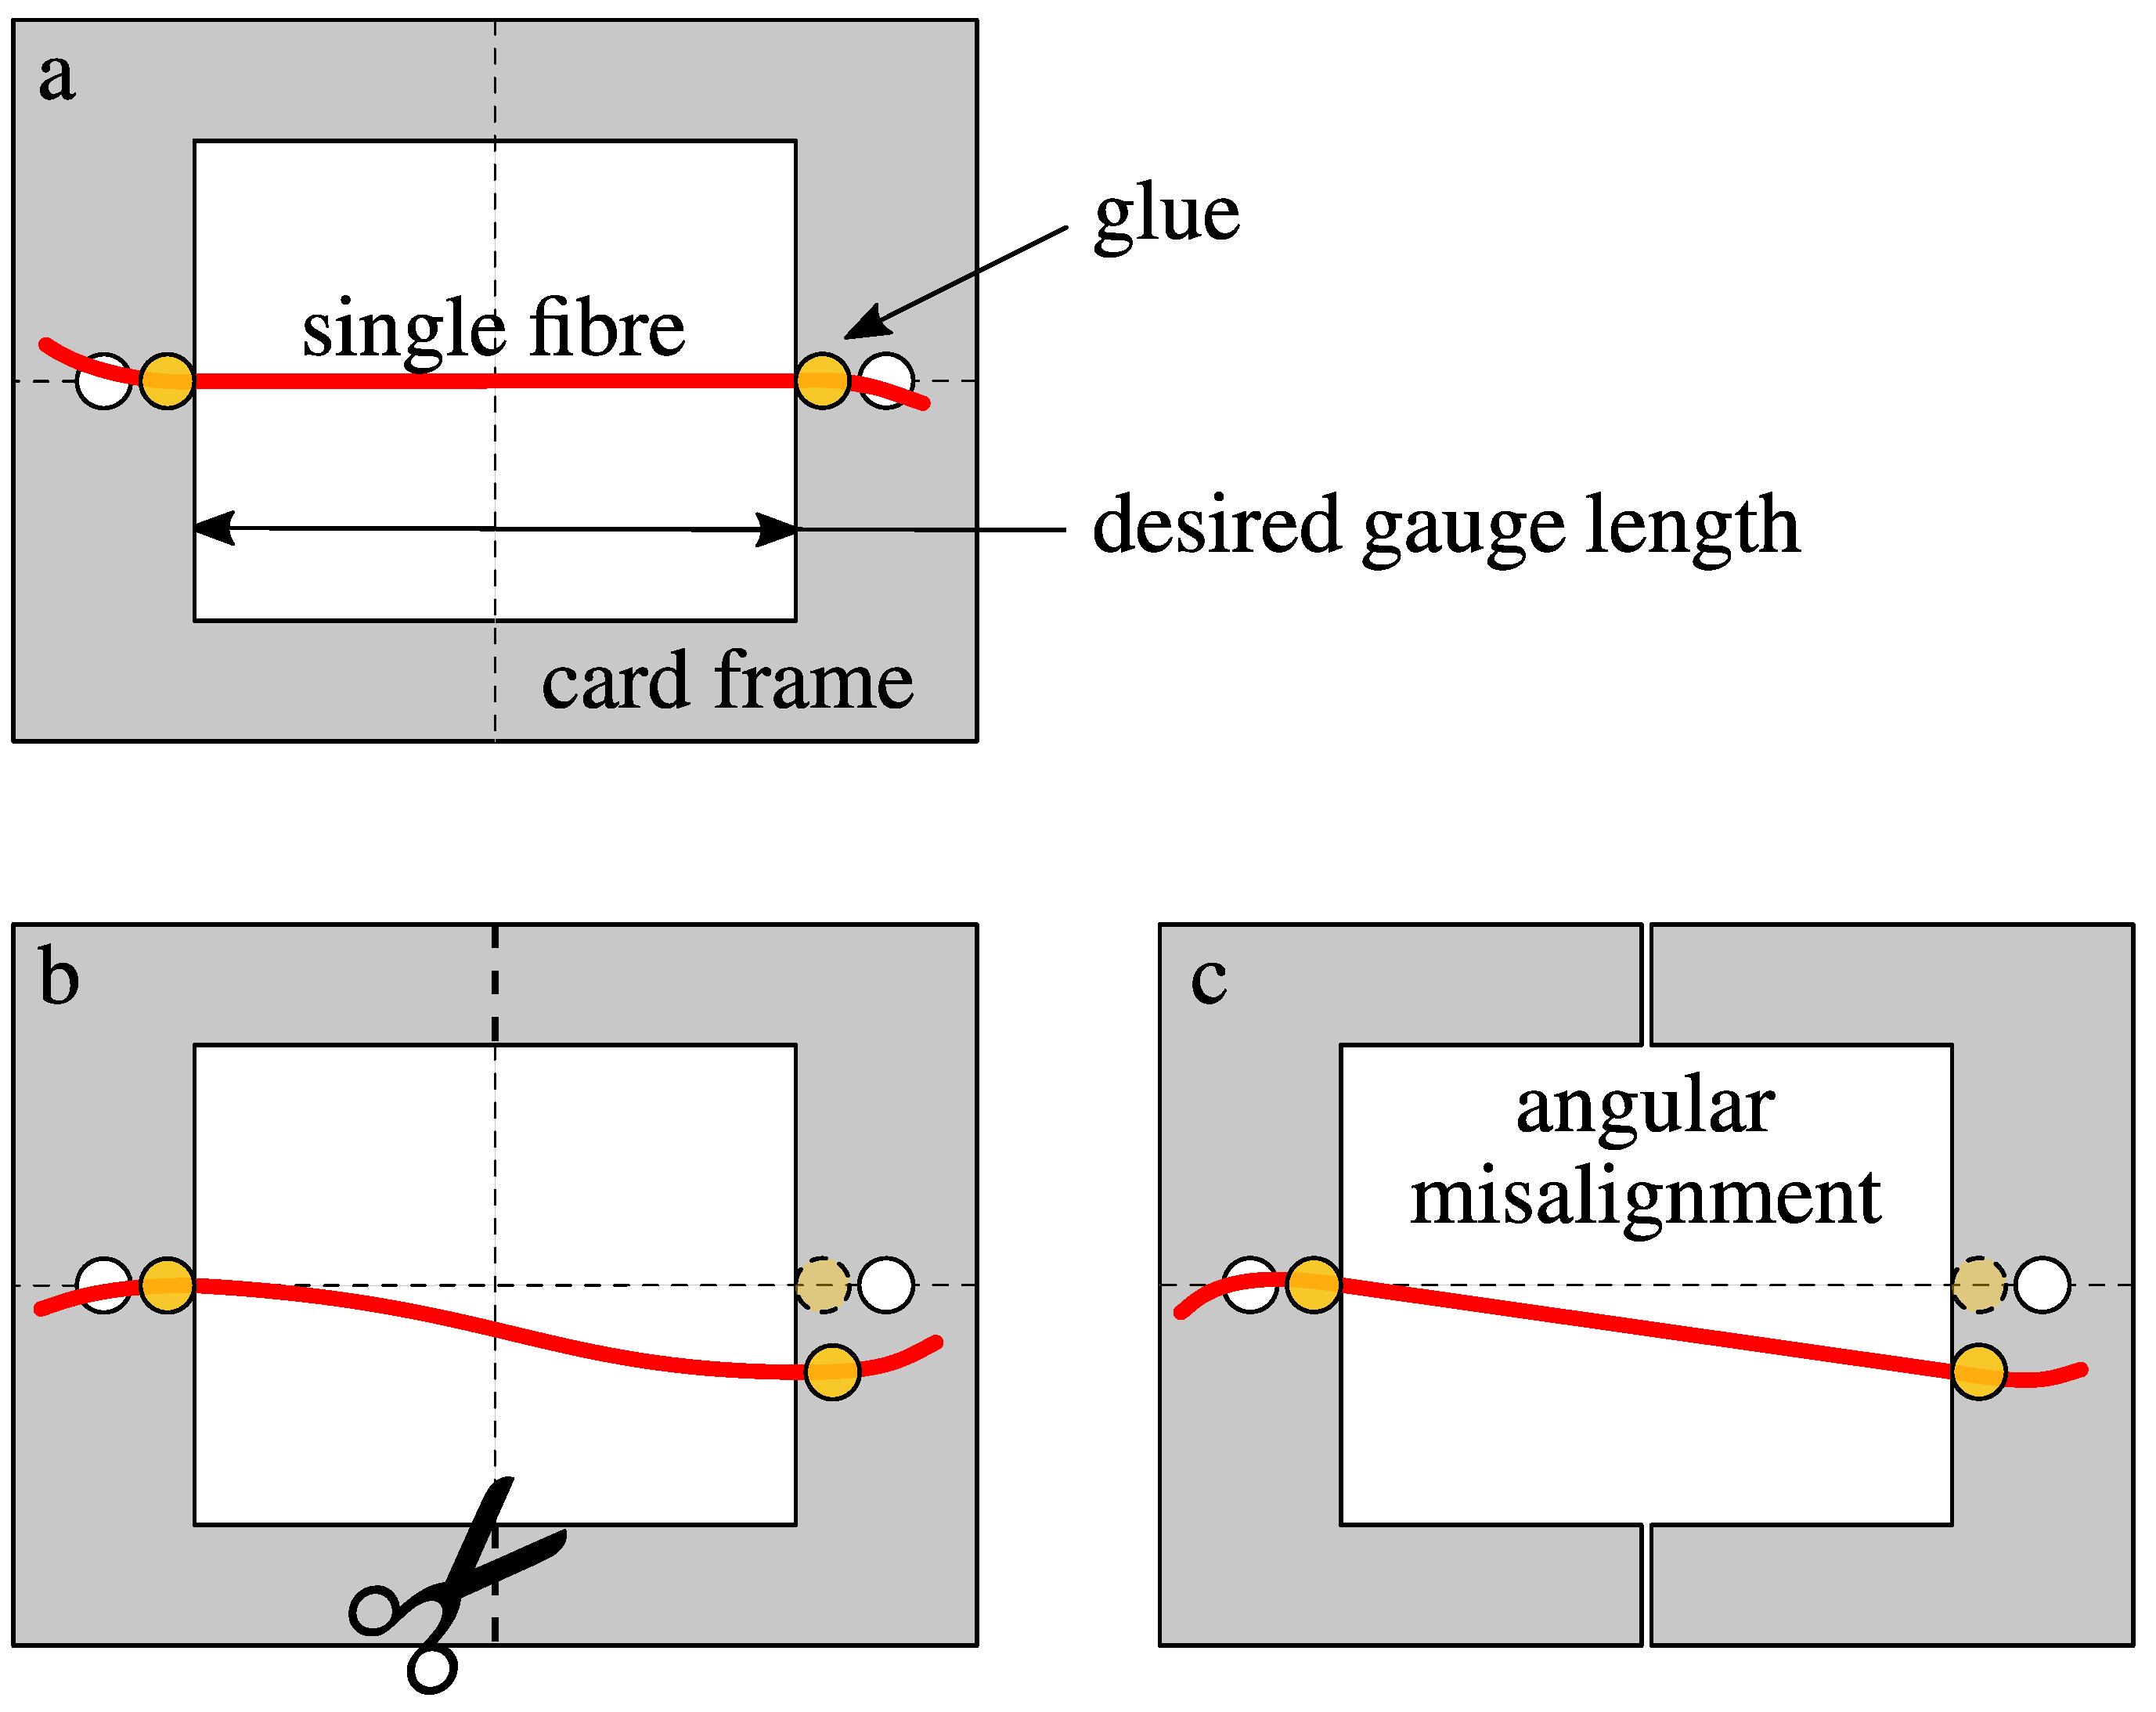
To illustrate these points, the thick paper frame method was used for this study and is detailed with a schematic of the prepared specimen, as shown in
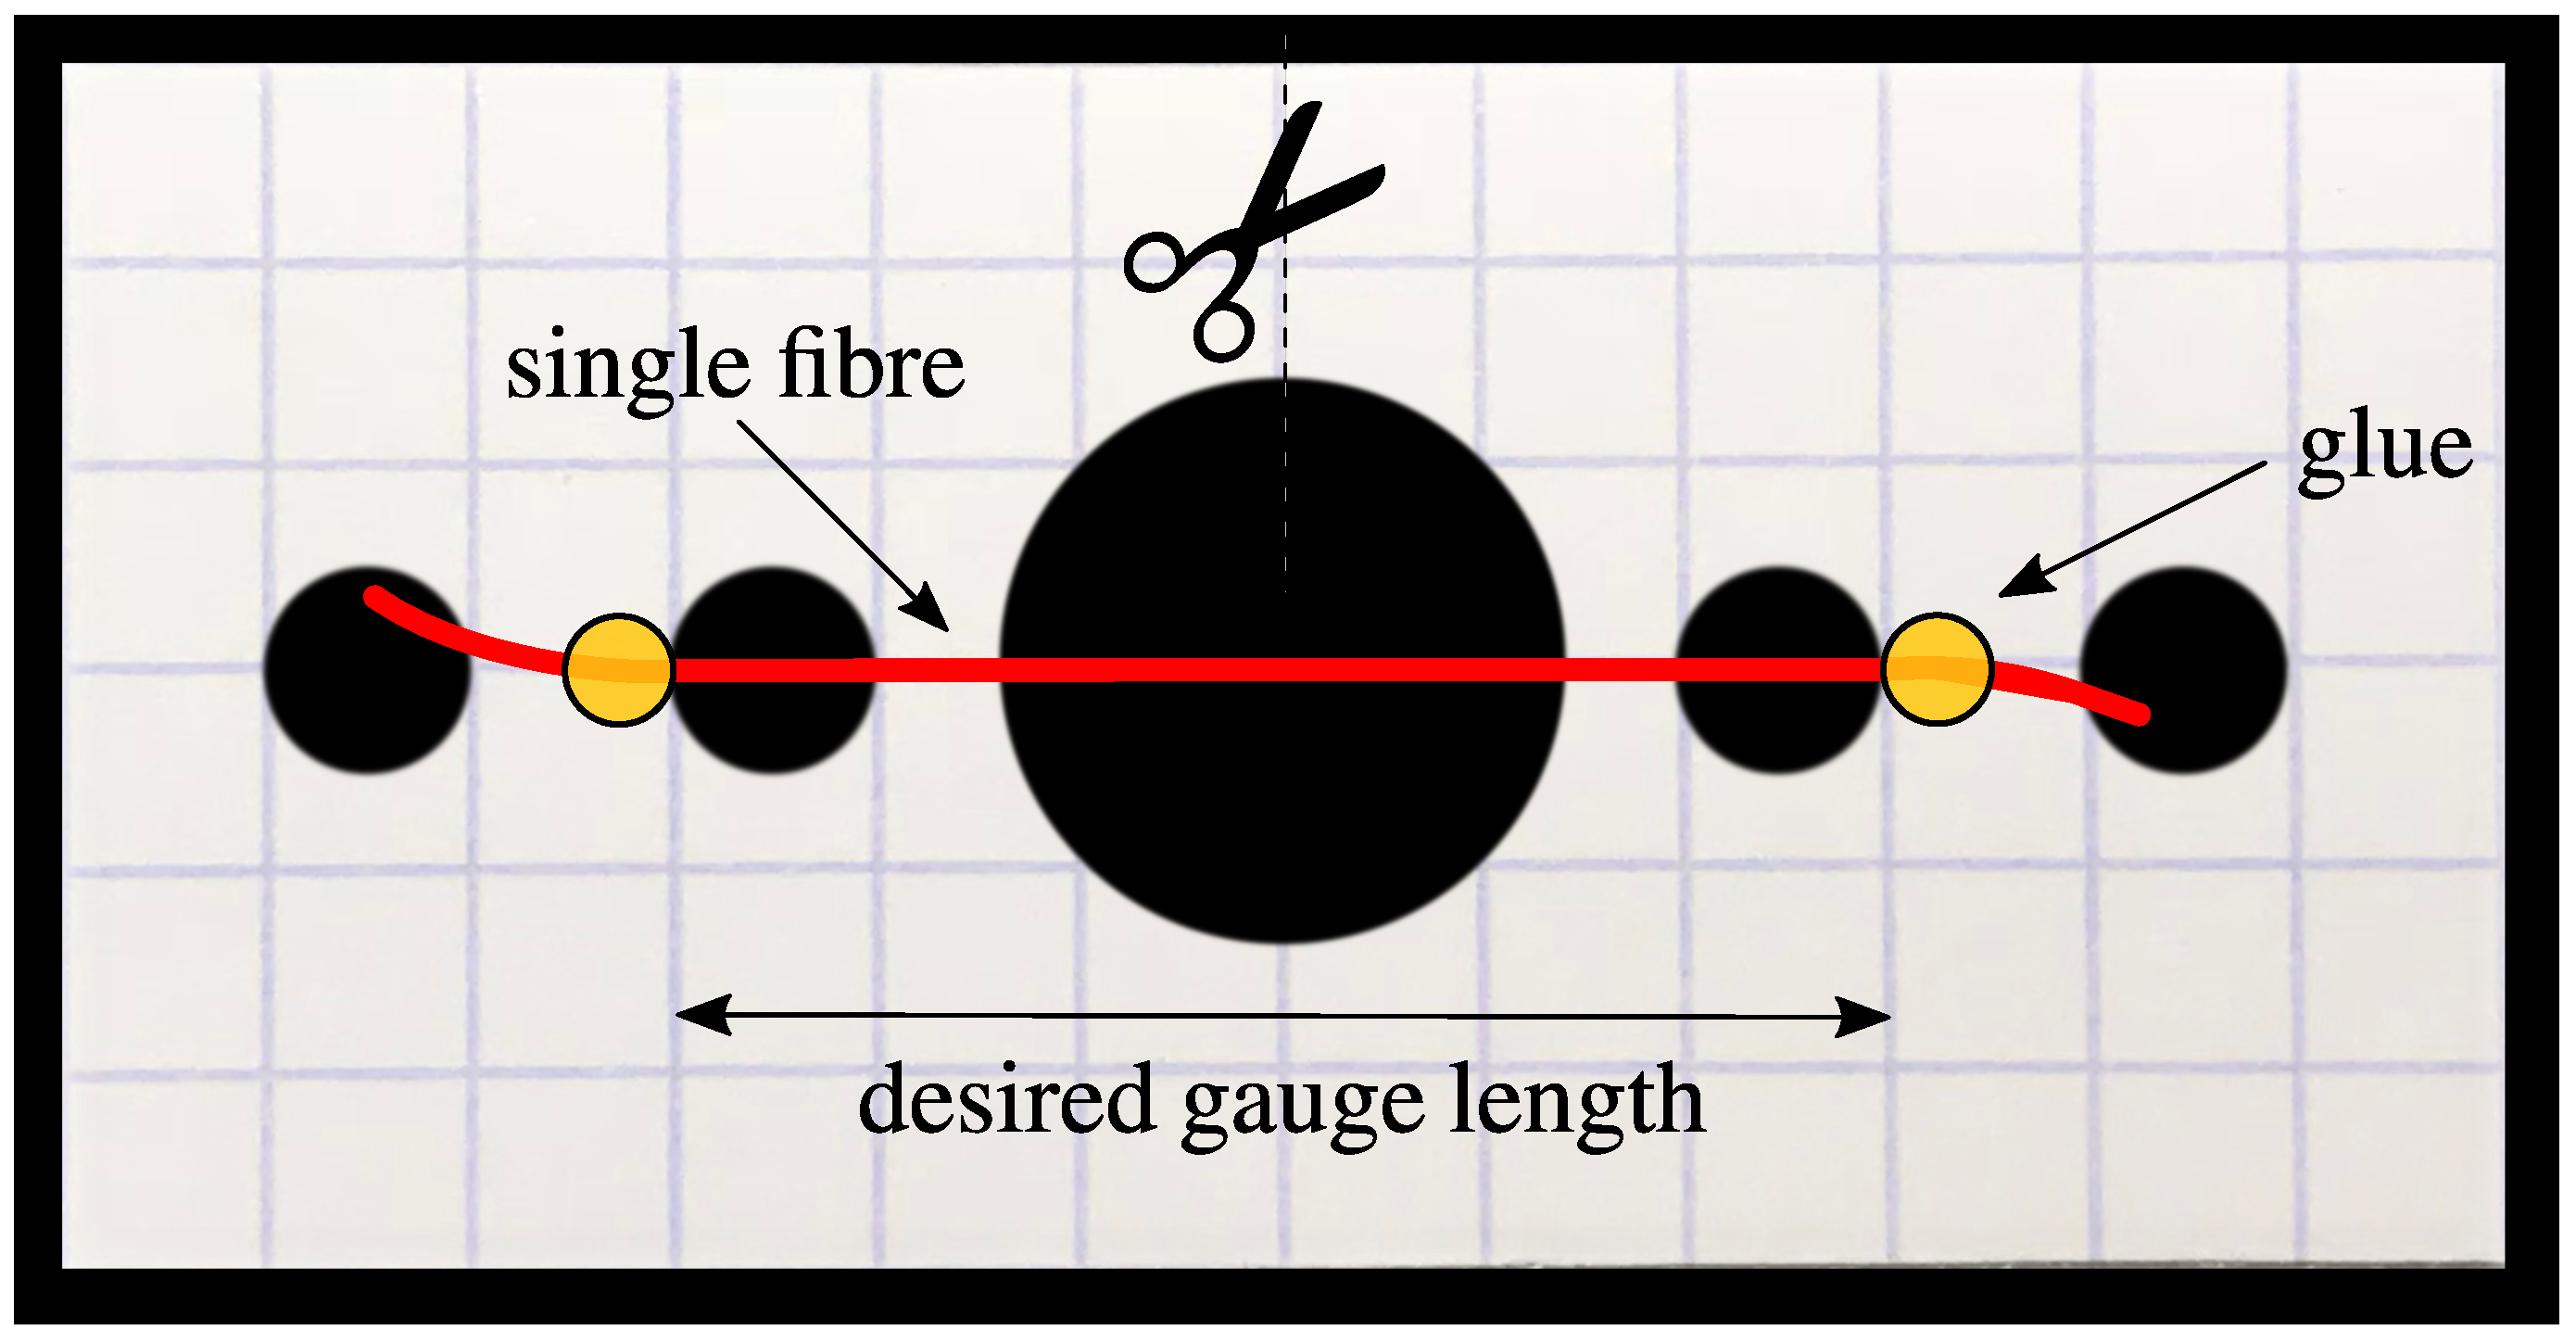
Figure 1a. A single fibre was extracted from a bundle and loaded horizontally on top of a card frame, as shown. There is a central opening in the paper frame, the length of which determines the gauge length of the fibre specimen, as shown in the schematic in
Figure 1a and in the actual paper frame shown in
Figure 2. The available holes at the ends are for attaching the frame to the machine with proper alignment. Two points of glue are affixed to the edges of the central opening. The sides of the frame are cut before subjecting the fibre to a tensile load. The load at which the fibre breaks is recorded [
24]. In fact, it is very difficult to align the fibres perfectly to the centreline and also to fix the gauge length accurately, as can be seen from
Figure 1b. This leads to angular misalignment of the fibre specimen and inaccurate measurement of gauge length, respectively (see
Figure 1c). The tensile machine itself may have a slight offset of the jaws. This is a common error and should be avoided by the tester. This could also lead to alignment inaccuracy between the fibre and the loading direction. For the continuation of this work, no distinction will be made between these different sources of inaccuracies and the concerned quantities will be treated in such a way as to encompass all possible sources. The misalignment parameter is therefore treated as a whole. In particular, no mention will be made of the different fixing techniques and the results would be independent of the machines used for conducting single fibre tensile tests.
2.2. Determination of Tensile Strength
Fibre strengths are not measured directly but are calculated using measured quantities, precisely by dividing the force to failure (the one recorded by the system)
by the cross-sectional area
A of the fibre. Depending on the nature of the fibre, the section area can be constant (as for most synthetic fibres) or it may vary along the length as is the case for natural fibres and for which case the
A-section should correspond to the section at the break point. Unless this breaking section measure can be done in-situ or post-mortem, these data are often inaccessible and, most of the time, a “mean” cross-section is used, which is the case in the present study. Given the high slenderness or aspect-ratio of the tested fibres and the very small sections considered, the notion of average over the length is still questionable. Assumptions which are discussed below in this work must always be considered. Nevertheless, the basic functional relationship for calculating fibre strength (or any stress at time
t, i.e.,
corresponding to the load
; in that case, Equation (
1) will become
)
is given by Equation (
1).
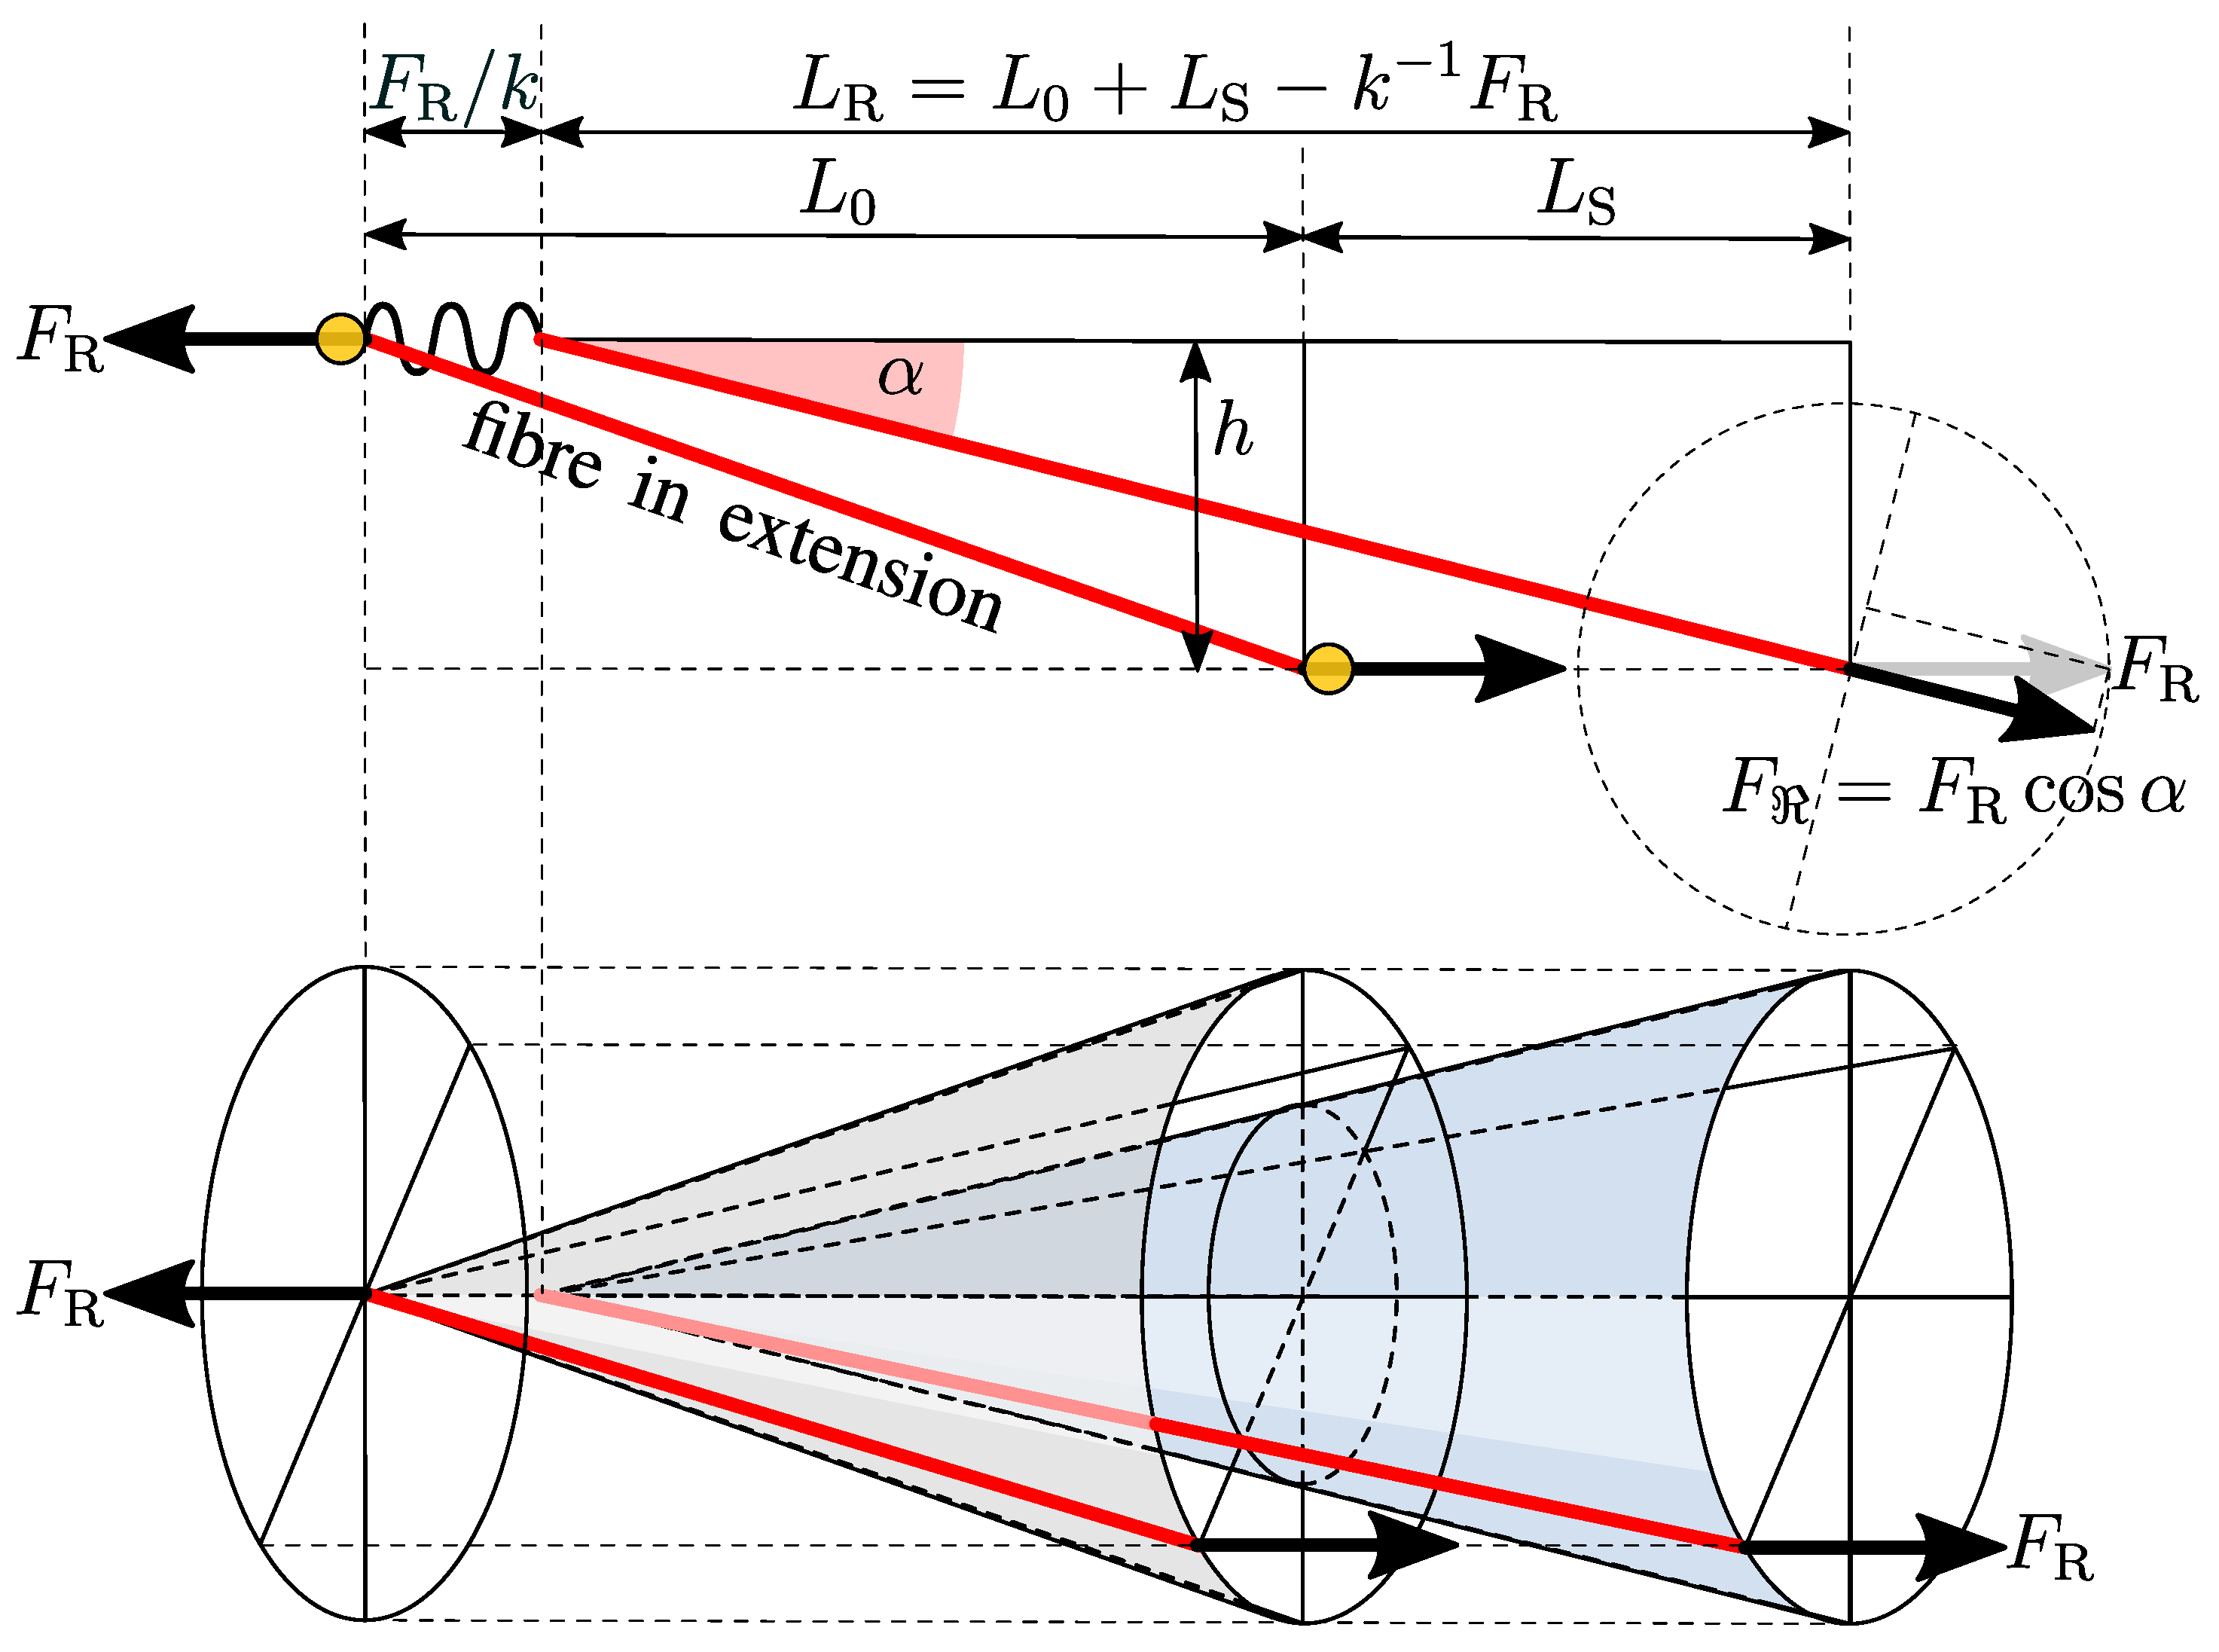
During the testing process, however, the fibres may not always be perfectly aligned to the direction in which the external load is applied, as explained previously. Due to this misalignment, the entire load applied during the test may not be successfully transferred to the fibre. The effective load applied on the fibre would depend on the conic angle of misalignment
.
Figure 3 shows the influence of misalignment on the effective force transferred to the fibre. Only a component
of the applied force
is successfully subjected onto the fibre, which would vary depending on the misalignment angle. For a given angle of misalignment
, the effective force transferred to the fibre is
and the corresponding fibre strength would be obtained by Equation (
2). If an assumption of perfect circularity can be made for the fibre cross-section,
A value can be derived from the measurement of the diameter
D (Very often, only the “apparent” diameter is accessible to measurement and non-convex cross-sections lead to more challenges to determine
A.), which results in Equation (
3).
The misalignment angle
can further be resolved in terms of the misaligned distance
h and
using the laws of trigonometry and is given by Equations (
4) and (
5).
is the recorded length of the fibre specimen and depends on the instantaneous separation of the cross-heads. The misalignment can be in any direction, depending upon the conical angle
, as shown in
Figure 3. From Equations (
3) and (
5), the expression for fibre strength in terms of the measured quantities is obtained and is given by Equation (
6).
can be replaced by
if instantaneous values
F and
are used, since the alignment of the fibre would change with time as the jaws are separated from each other. It is dependent on the initial gauge length of the fibre
, on fibre elongation due to application of tensile stress
, and on the stiffness of the testing system
k (or compliance
) and is given by Equation (
7). This is also shown in
Figure 3. From Equations (
6) and (
7), the expression for fibre strength is obtained, and is given by Equation (
8).
The stiffness
k of the experimental setup is determined by taking the inverse of the system compliance, which is measured as per the guidelines mentioned in the standard [
25]. The stiffness for the experimental setup used, including the fibre fixing system, is calculated to be around
N/m. Such a high stiffness has a negligible influence on the recorded failure length
of the fibre, especially for tests done using fibres up to 30 mm initial gauge length, as in the present case. For such gauge lengths and the T700 fibres considered as example, the different contributions to
are as follows:
for almost 98%,
for about 2% and
less than 0.01%. These contributions clearly depend on the gauge length and if 5 mm gauge lengths were now considered, the system compliance contribution to
would only be around 0.5% as a first approximation. It is clear that the term
can be ignored from the fibre strength expression for the present case since it is compared with
. This is also justified because its contribution to the output is about an order of magnitude smaller than the next significant quantity. These considerations would be completely different if a measure of the failure strain
was desired. Indeed, in that case, failure strain
and the system compliance contributes greatly (about 25% contribution to the total extension in the case of a gauge length of 5 mm) to the extension measurement.
The final expression for fibres strength after ignoring the system compliance contribution is given by Equation (
9).
It can be seen from Equation (
9) that fibre strength is calculated using a number of measured input quantities. These quantities, already introduced, are force measurement from the load cell
, estimated misalignment distance
h, initial gauge length of the fibre
, extension in fibre measured from the displacement sensor
, and the measured value of the diameter
D coming from an appropriate technique. Each input quantity has some level of measurement uncertainty, as no measuring instrument is perfectly accurate. As a result, the calculated tensile strength of the fibre will also have an uncertainty associated with it. Since fibre strength is typically represented using Weibull parameters generated using a set of such fibre strength data points determined in a similar way, the overall uncertainty in the statistical parameters of the Weibull distribution can be very significant. This is also the subject of the ongoing study.
2.3. Measurement Uncertainty
The word “uncertainty” stands for doubt, and thus in a generic sense “measurement uncertainty” means doubt about the validity of a result of a measurement [
19]. It reflects the lack of knowledge on the value of the measured quantity. This uncertainty in measurement of any quantity would also influence other parameters that are calculated using these measured quantities. The measurement uncertainty for any given parameter can be calculated statistically if the variations are known for all quantities on which this parameter depends. This is evaluated by using a mathematical model for the parameter of interest (
Y), which is a function of all input quantities on which it depends
, as also represented by Equation (
10).
Each measured input quantity by itself has some uncertainty associated with it. The uncertainty is determined from a distribution of the possible values for a given quantity. This is usually estimated from a series of observations for this quantity, i.e., a frequency based estimation. This method of evaluation of uncertainty based on frequency distributions is termed as Type A evaluation in statistics. The other method of evaluating uncertainty is from a priori distribution, which is based on some prior knowledge about the quantity. Evaluation of uncertainty based on priori distributions are termed as Type B evaluation. It is recommended to use quantitative data wherever possible for the evaluation of uncertainty, i.e., following the Type A evaluation method. However, either type of uncertainty is treated in the same way while evaluating the combined effect on the output.
2.4. Experimentation
Single fibre tensile tests were conducted following the procedure described in ASTM C1557-14 [
25] to determine the strength of T700 carbon fibres. The equations proposed in this paper remain of course valid for other types of fibres, as long as the few assumptions which have been made are applicable. The universal tensile tester was used for conducting the experiments. It was developed by Bunsell [
26] and has been improved over the years with the introduction of more advanced transducers and sensors and a change from the vertical position to the horizontal position of the system. Those changes have for example made it possible to study the effect of temperature on fibre strength and this improved setup has been used very extensively to study many kinds of technical, natural and textile fibres [
27,
28,
29,
30,
31]. Single fibres were extracted from the fibre bundles and mounted on paper frames containing cut-out slots of 30 mm in the middle which fixed the gauge length (as close as possible to 30 mm)
.
The diameter of each individual fibre specimen was measured at different locations along the fibre length before the fibre was subjected to the tensile test. A Mitutoyo laser scanning micrometre (LSM500) system was used for the measurements. This system allows rapid, non-contact, and accurate fibre dimensional measurements. The fibre is fixed between two grips and a perpendicular laser beam scans across the fibre. The time of obstruction of the light is recorded and the diameter is calculated. A total of 30 fibres were measured following the same procedure and tested as per the given standard. A constant displacement rate of 1 mm/min was applied to stretch the fibres until failure. The failure load was recorded using a 150 g Sensotec Model 31 load-cell and the fibre extension was measured using an LVDT displacement transducer ACT1000A from RDP Electronics Ltd.
Since the stress–strain behaviour of carbon fibres is (almost) linear, the failure load was taken to be the load at which the fibre fracture occurs.
Table 1 shows the measured values of all input quantities for one fibre tensile test example. Using these quantities and Equation (
9), the best estimate value (the value determined experimentally or calculated analytically, i.e., without considering any uncertainties) of fibre strength
for the given example was calculated as follows:
2.5. Evaluation of Measurement Uncertainty in Input Quantities
All quantities necessary for calculating fibre strength were determined through experimental measurements following the method described in the previous section. Each measurement had some amount of uncertainty associated with it. Measured quantities thus are sometimes reported as given by Equation (
12) where
x is the quantity being measured,
is the best estimate or the measured value and
is the corresponding measurement uncertainty.
For each tensile test, the best estimate and the corresponding uncertainty for each input quantity was determined. For fibre diameter, the best estimate was determined by taking the average of all the multiple measurements taken at different locations along the fibre length. For the other quantities, i.e., applied force , misalignment distance h, initial gauge length and elongation in fibre , the best estimate was determined from the only measurement for the fibre tensile test.
Measurement uncertainty in fibre diameter
was determined using the Type A method. The standard deviation was calculated from the different diameter values measured along the length of a fibre, for each specimen. When multiple trials are performed to obtain the best estimate of a quantity, the standard deviation of the mean is an appropriate choice for representing the uncertainty in the measurement [
19]. For example, from the multiple measurements
of the fibre diameter, the best estimate was determined by taking the average of all measurements,
, and the uncertainty,
, was provided by the corrected standard deviation divided by the square root of the number of measures
as given by Equations (
13)–(
15).
For the given example, was evaluated at mm from four recorded values mm and uncertainty in diameter measurement was calculated to be mm.
On the other hand, since, for the other quantities, i.e.,
,
h,
and
, the best estimate was taken from the only measurement coming from the instruments, their corresponding uncertainty was estimated using the Type B method. For this, the limiting precision or the estimation error or the tolerances of the measurement tool was used. The uncertainty for these quantities was estimated on the assumption of the rectangular probability distribution of the measurement tolerances or estimation errors, and can be given by Equation (
16).
where
can be replaced with
,
,
and
, which are the measurement uncertainties for force, misalignment distance, initial gauge length, fibre extension, respectively, while
can be replaced with
,
,
and
, which are the measurement tolerances or estimation errors for the corresponding quantities.
The measurement uncertainty for all the quantities for the given fibre tensile test example is given in
Table 2. For many commercial and industrial applications, it is suggested to also calculate an expanded uncertainty
, which is a measure of the required quality for the given quantity of interest
x. The expanded uncertainty is determined for a required level of confidence using Equation (
17).
where
is a coverage factor for a 95% level of confidence. For critical applications, the recommended level of confidence is 95% [
19]. The value of
is 1.96 if the calculation is based on a very large number of measured quantities, i.e.,
. It should be noted that, if the number
n of measurements is small, the coverage factor should be taken from the T-distribution table for
degrees of freedom. This leads for example to a coverage factor of about 3.18 for
, which is the case for diameters measurements (
).
Table 2 includes these expanded uncertainty values for the given input quantities.
For certain other applications, an even higher level of confidence may be required; a confidence level of 99% is also commonly used. The coverage factor depends on the confidence level used and can be determined from the T-distribution table, as explained above. For a 99% confidence level, the coverage factor
is 2.58 for
and 5.84 for
. The expanded uncertainty values of all input quantities for the given fibre tensile test example, for a confidence level of 99%, are also given in
Table 2.
Measurement uncertainties in these input quantities would also be propagated into the calculated fibre strength. The uncertainty propagated into fibre strength can be evaluated by combining the measurement uncertainties for each input quantity. The evaluation of this combined standard uncertainty is described in
Section 2.6.
2.6. Propagation of Uncertainty to Fibre Tensile Strength
The standard uncertainty for a given parameter that is obtained from the determined uncertainties of a number of other quantities is known as combined standard uncertainty. It is estimated by appropriately combining the uncertainties of the input quantities using the law of propagation of uncertainty, as described in [
19]. It is an estimated standard deviation of the parameter and characterises the dispersion in its values. It is obtained by taking the positive square root of the combined variance of the fibre strength. The combined standard uncertainty for fibre strength
as obtained from the combined variance
is given by Equation (
18).
Each
is a partial derivative or sensitivity coefficient of fibre strength for each of the input quantities on which it depends. It describes how the output estimate, i.e., fibre strength, varies with changes in each input quantity. Each
is a standard uncertainty for an input quantity
, as described in
Section 2.5. Variation in fibre strength arising due to uncertainty in an input quantity
is given by
. The combined variance on fibre strength
can be given by the sum of all variances generated due to uncertainties in each individual quantity
, as given by Equation (
18). This expression is valid when there is no correlation between the quantities on which the parameter depends, as in the present case. The expression for the combined standard uncertainty of fibre strength given by Equation (
18) can be expanded in terms of individual quantities and is given by Equation (
19).
where,
is combined standard uncertainty for fibre strength,
is sensitivity coefficient of fibre strength for applied force,
is sensitivity coefficient of fibre strength for misaligned distance,
is sensitivity coefficient of fibre strength for initial gauge length,
is sensitivity coefficient of fibre strength for fibre extension,
is sensitivity coefficient of fibre strength for measured fibre diameter,
is measurement uncertainty in applied force,
is measurement uncertainty in misaligned distance,
is measurement uncertainty in gauge length,
is measurement uncertainty in fibre extension and
is measurement uncertainty in fibre diameter.
The different sensitivity coefficients are determined as partial derivatives of fibre strength with respect to each input quantity and are given by Equations (
20)–(
24).
For the given fibre tensile test example, the sensitivity coefficient for each quantity is determined using Equations (
20)–(
24) and input data from
Table 1, and the results are given in
Table 3. The combined standard uncertainty for the calculated fibre strength can then be evaluated from Equation (
19), using measurement uncertainty from individual quantities from
Table 2 and sensitivity coefficient values from
Table 3.
The standard uncertainty for fibre strength for the given example was calculated to be:
Fibre strength for the given tensile test example can now be represented as a combination of the best estimate
and the calculated uncertainty
, shown as follows:
Following the determination of combined standard uncertainty
using Equation (
19), the expanded uncertainty
was also calculated. It was determined by using Equation (
17), as explained above. The values of the coverage factors
and
as determined from the T-distribution table for 95% and 99% level of confidence are 1.96 and 2.58, respectively. Using
and
, the expanded uncertainties were calculated from Equation (
17) as
and
. It is necessary to mention the values of coverage factor and level of confidence were used when results are reported in the form of expanded uncertainties. The fibre strength can then be reported as the best estimate
along with its expanded uncertainties
and
as follows:
For all 30 fibre tensile tests conducted, the best estimate for fibre strength
and the corresponding measurement uncertainty
is shown in
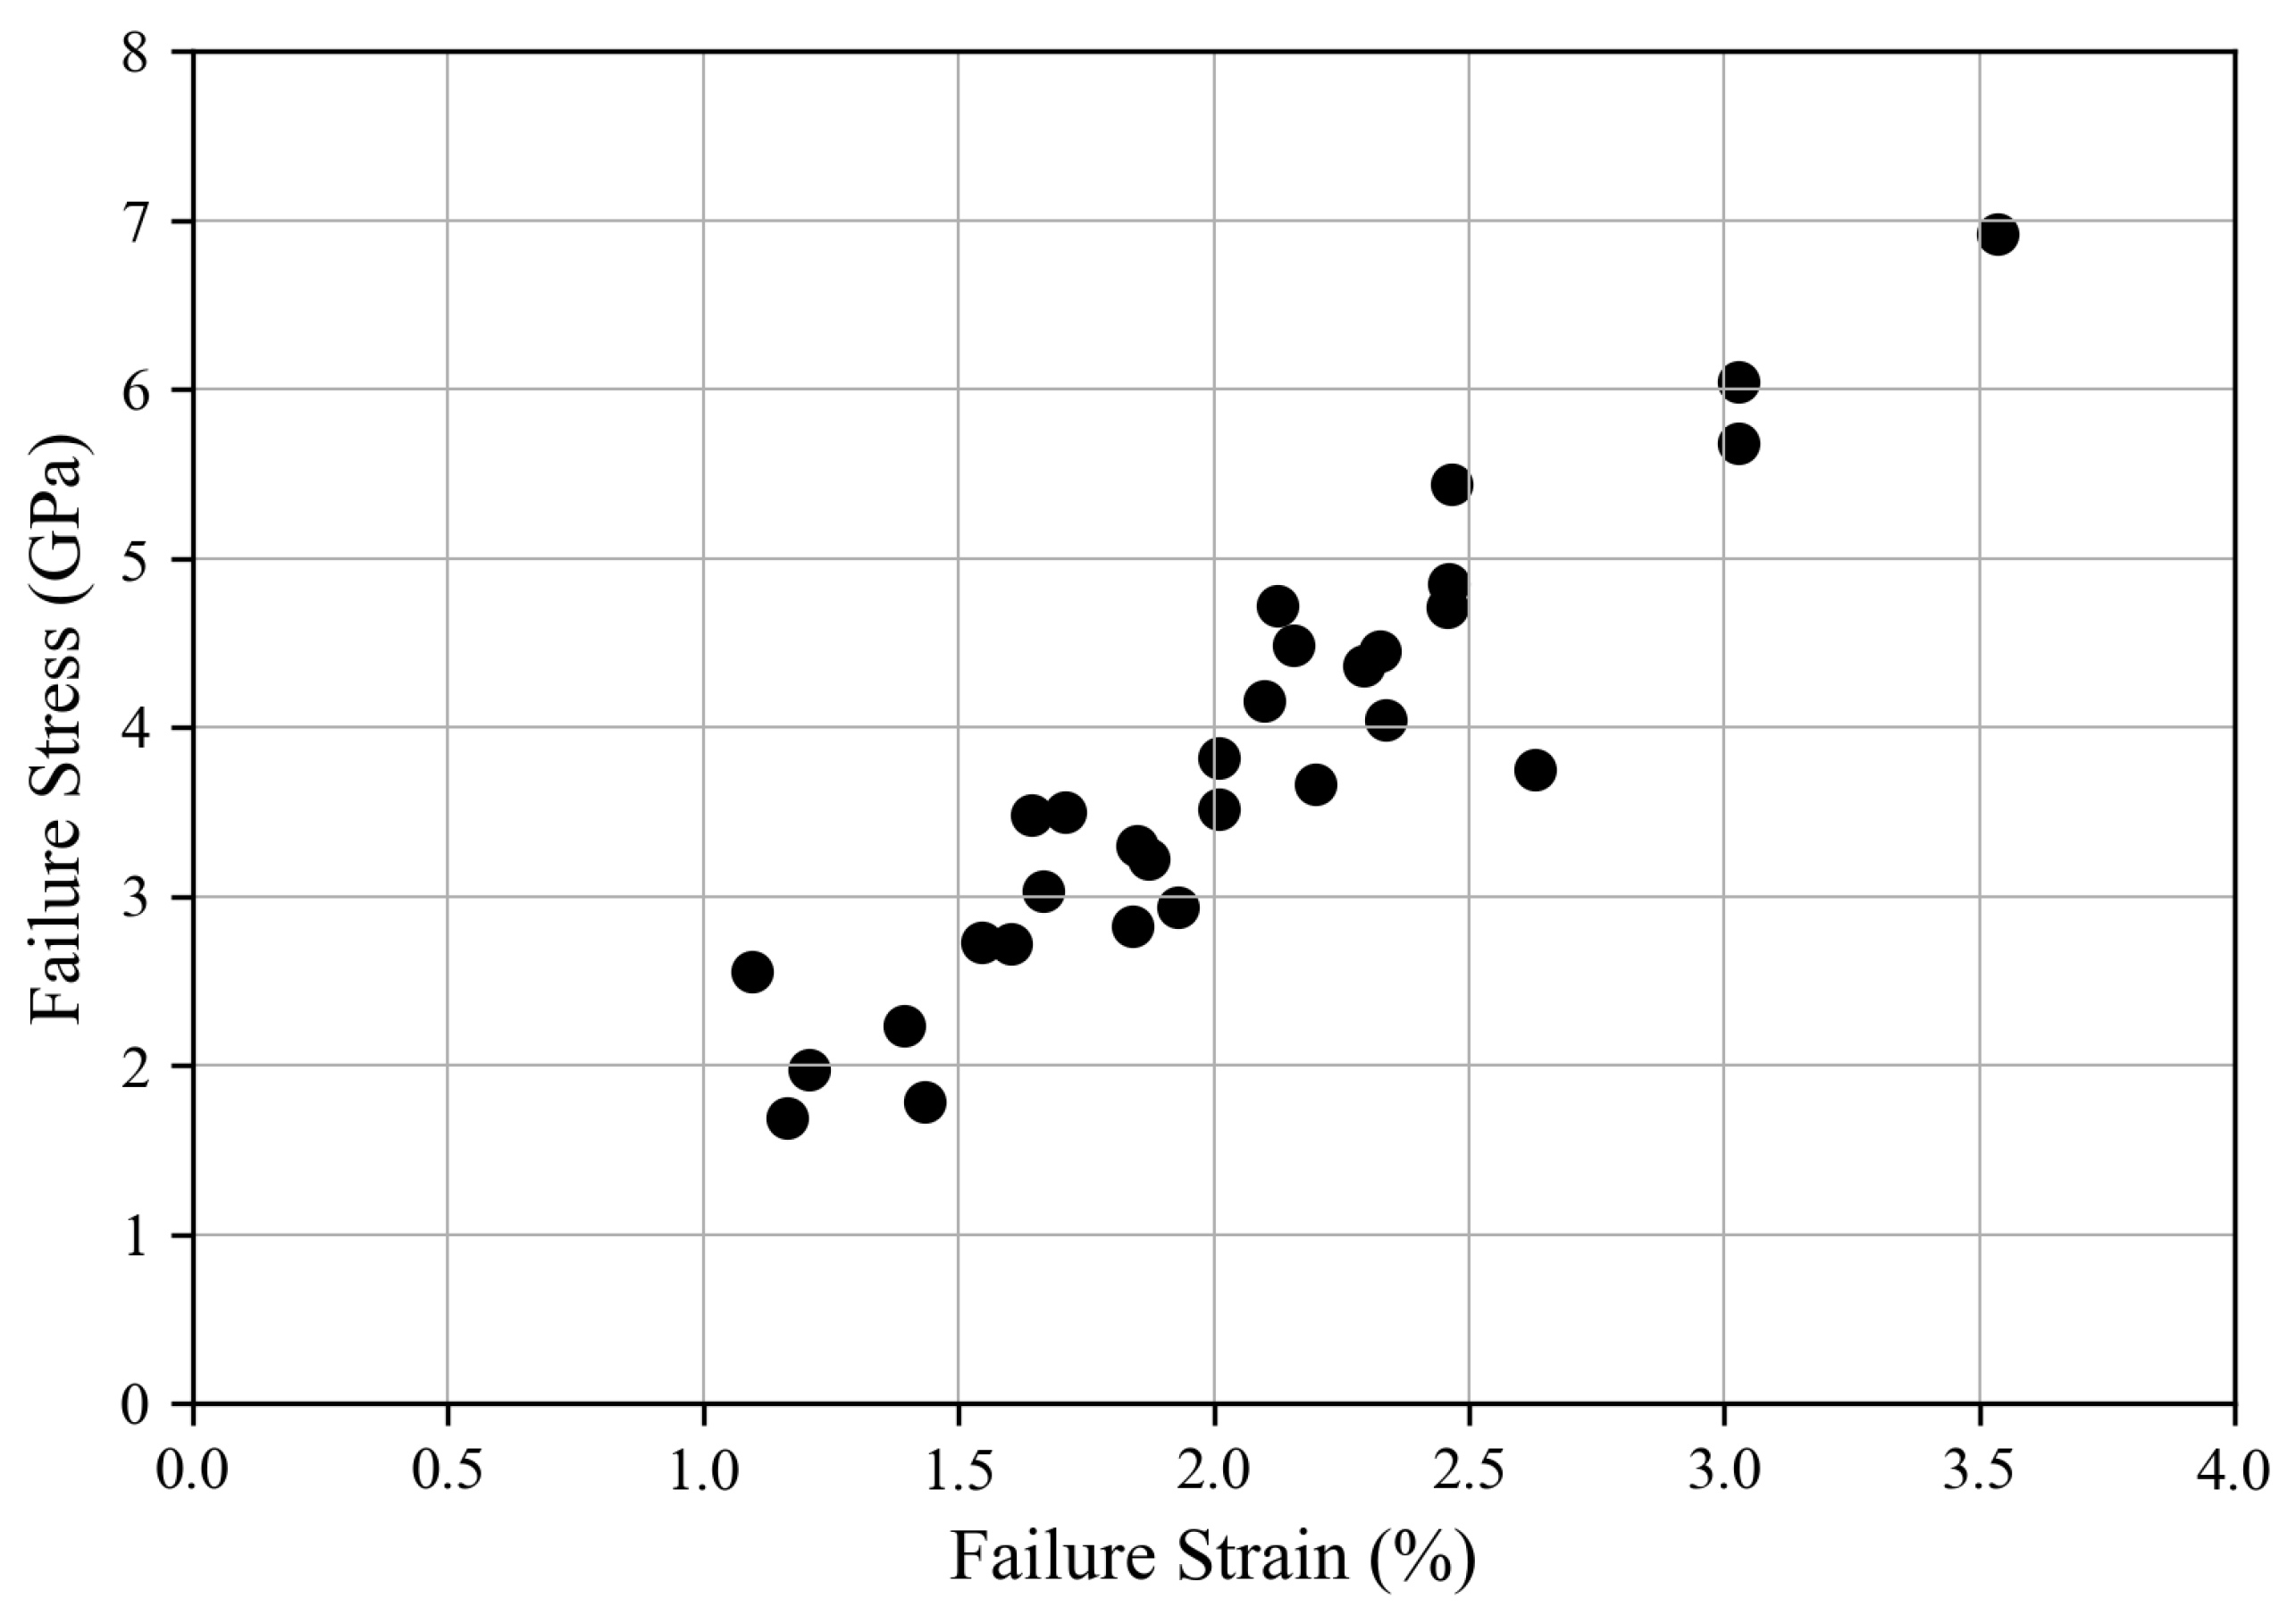
Table 4, in increasing order of strength values. The scatter in failure stress (fibre strength) vs. failure strain is shown in
Figure 4. The strength of fibres vary significantly with each other and hence the strength of fibres cannot be represented using a single average value because not all fibres possess a similar strength. Fibre strength behaviour is therefore typically represented by using an appropriate statistical distribution function such as the one proposed by Weibull [
9]. This distribution considers the inherent variation in strength of fibres due to the stochastic nature of defects present inside them. To determine the parameters of this statistical distribution function, a set of fibre strength data such as the one generated for the present study, was used. Therefore, a sufficient number of fibre tensile tests had to be conducted to generate a representative fibre strength dataset.


