
Article

Topological Optimization of Steel and Concrete Tubular-Floor Trusses Based on CO2 Emission
by
Chayana M. G. Silva
1,
Beatriz V. Afonso
1,
Adenílicia F. G. Calenzani
1,
Moacir Kripka
2 and
Élcio C. Alves
1,*
1
Department of Civil Engineering, Federal University of Espírito Santo, Vitória 29075-910, ES, Brazil
2
Department of Civil Engineering, University of Passo Fundo, Passo Fundo 99001-970, RS, Brazil
*
Author to whom correspondence should be addressed.
J. Compos. Sci. 2026, 10(7), 350; https://doi.org/10.3390/jcs10070350
Submission received: 10 February 2026 / Revised: 18 March 2026 / Accepted: 28 March 2026 / Published: 30 June 2026
(This article belongs to the Section Composites Applications)

Abstract

This paper addresses the topological optimization of composite floor systems, specifically focusing on tubular composite trusses with and without concrete filling in the upper chord. The optimization problem is formulated and solved using particle swarm optimization (PSO) and the Bonobo Algorithm (BO), both with CO2 emissions reduction as the objective. A comparative analysis is conducted against literature models using full-web beams, revealing a notable 20%+ reduction in total CO2 emissions for the proposed composite truss configuration. Additionally, a parametric analysis examines how various design parameters affect the optimization solution. Results indicate that the use of concrete in the upper chord has a substantial effect on reducing overall CO2 emissions, especially with concrete strengths exceeding 25 MPa. Notably, the Bonobo Algorithm outperforms PSO in finding optimal solutions for the composite floor system. The study contributes to the underexplored field of topological optimization for composite truss beams, providing valuable insights into sustainable design practices for structural engineering applications.

1. Introduction

In an era marked by intense global competition and the escalating depletion of natural resources, the application of optimization techniques is a critical strategy, serving as a cornerstone for achieving greater economic efficiency and mitigating the environmental footprint of construction. Structural optimization research primarily focuses on modifying the geometry and topology (layout) of structural systems. In these optimization problems, the objective is to improve the structure’s performance by altering its shape. Therefore, optimization can be viewed as a process aimed at enhancing the physical arrangement and eliminating unnecessary material volume [1]. Within this context, the use of tubular trusses with concrete filling can reduce material usage in composite floor systems, thereby decreasing CO2 emissions from floor materials, as highlighted by Erlacher et al. [2].

1.1. Experimental and Numerical Analysis of Composite Floors

Composite floor systems, known for their strong load capacity, have been widely used in industry and buildings. As demand for this system continues to grow, there is a need to further enhance and consolidate the technical knowledge associated with it. While experimental studies have been conducted to investigate the behavior of composite floor systems, this field remains underexplored.
Cifuentes and Medina [3] conducted experiments to assess the longitudinal shear behavior of composite slabs. The primary aim was to analyze the influence and suitability of Eurocode experimental requirements for obtaining the necessary semi-empirical parameters for the m-k and partial shear connection methods. The main conclusions were that implementing crack inducers in accordance with Eurocode leads to an underestimation of the longitudinal shear strength of slabs, and that prior cyclic loading in accordance with EC-4 requirements did not affect the load-carrying capacity of composite slabs.
Gholamhoseini et al. [4] conducted short-term tests that resulted in the failure of eight composite slabs constructed with four types of profiled steel decking. These tests involved full-scale simply supported slab specimens tested at four flexure points, incorporating shear gaps. The maximum flexural capacity was controlled by slip at the concrete–steel interface for all slabs. A finite element model using interface elements to represent the bond properties between steel decking and the concrete slab was used to investigate slab behavior across the full range of loading. The numerical model is shown to accurately and reliably predict the measured response of the laboratory specimens.
Yang et al. [5] comprehensively examined composite floor components under column-removal scenarios. This study encompassed experimental and numerical investigations, including testing the components under diverse loading conditions and comparing the experimental results with the predictions. Furthermore, the researchers employed a simplified finite element model for analysis and validation.
Ahmed et al. [6] investigated steel–concrete composite floor systems under symmetrical double-line loads. Their primary focus was to assess these systems’ longitudinal shear resistance capacity via the shear bond mechanism or the m-k procedure. Based on the experimental measurements, the authors proposed a new simplification for m-k curves, called ‘λ-q’. This simplification (λ-q) can serve as a guideline for developing a new formula that accounts for other parameters, such as embossments, shears, connectors, slips, and shape factors.
Sheet et al. [7] explored the longitudinal shear connection characteristics in composite steel and concrete slabs. This investigation involved conducting bending tests with various steel shape cross-sections, including rectangular, trapezoidal, and recessed profiles, with and without embossments. The embossments in the profile decks slightly enhanced the longitudinal shear resistance and load-carrying capacity (especially at the end of the plastic stage), and delayed debonding. This study proposes a semi-empirical formula (SEF) to evaluate shear stress by simplifying the m-k method. The proposed SEF method was validated using data from the literature, demonstrating acceptable reliability, and therefore could represent a good alternative to m-k and PC methods.
Grossi et al. [8] conducted both experimental and analytical investigations on composite floors with additional reinforcement bars. Based on experimental results from 11 simply supported specimens with varying levels of additional reinforcement, an analytical model was developed using the m-k method to estimate the longitudinal shear capacity of the composite slab with additional reinforcement. Although different rates of additional reinforcement were tested, all prototypes used the same profiled steel decking, allowing us to conclude that the proposed analytical model should be verified for other types of profiled steel decking.
Wang et al. [9] conducted a study using a finite element model (FEM) to analyze simply supported composite slabs, accounting for non-uniform shrinkage, cracking in the concrete, and concrete creep. The reliability of the FEM was verified by comparing its results with experimental data from existing literature. The results show that non-uniform shrinkage significantly affects the long-term performance of composite slabs. In particular, the non-uniform shrinkage increases the long-term deflection of the composite slabs by 37–285% and enlarges the stress on the profiled steel sheets by 65–98%. A new, simple formula for calculating the deflection of composite slabs was proposed. The proposed calculation formula is in good agreement with the FEM.
Eissa and Celikag [10] conducted an experimental investigation into the behavior of reinforced concrete T-beams with composite slabs. In the slip capacity test, the concrete’s shear forces were transferred by the concrete itself since the beam and slabs were monolithic, and no slip between the slabs and the beam was observed. Moreover, the study included a comparative analysis contrasting reinforced concrete T-beams with composite slabs against four existing slab systems in reinforced concrete frames (solid concrete one-way, two-way, joist, and flat slabs). Comparing the proposed composite slab with commonly used slabs highlighted its ability to reduce overall weight while maintaining the same load-carrying capacity, thereby speeding up construction.
Despite advances in composite steel and concrete elements, advances in calculation procedures for new materials and new beam typologies are needed, as pointed out in the works of Hanifehzadeh and Mousavi [11], Al-Fasih et al. [12,13].
As pointed out in the research (Cifuentes and Medina [3], Gholamhoseini et al. [4], Yang et al. [5], Ahmed et al. [6], Sheet et al. [7], Grossi et al. [8], Wang et al. [9] and Eissa and Celikag [10]), studies on composite floors, whether experimental or numerical, have primarily focused on evaluating the structural behavior of composite slabs supported by beams with full-web steel profiles. Studies on composite slabs supported by composite trusses with tubular profiles are scarce, and the literature offers no work on slabs and trusses using a tubular steel profile filled with concrete, which is the primary motivation for this work.

1.2. Structural Optimization of Composite and Concrete Elements

From a structural optimization perspective, numerous researchers have studied composite beams for long spans, exploring parameters such as live loads and span length, using various metaheuristic algorithms. Notable works in this area include those by Kravanja and Silih [14], Klansek and Kravanja [15], Senouci and Al-Ansari [16], Kaveh and Abadi [17], Kaveh and Massoudi [18], Korouzhdeh and Eskandari-Naddaf [19], and Kravanja et al. [20]. However, it is worth noting that these studies focus on full-web profiles and aim to minimize the final cost of the structure. There are no reports of research on tubular composite trusses that evaluate total CO2 emissions and system performance when the tubes are filled with concrete.
Optimization techniques have also been employed in the analysis of steel structures as observed in Kaveh and Nasrollahi [21] and concrete structures aimed at reducing CO2 emissions, as can be observed in the works of Kaveh and Ardalani [22] for concrete frames; Trés Jr. et al. [23] for human bridges; Santoro and Kripka [24] for reinforced concrete beams, among others.

1.3. Structural Optimization of Composite Floors

The optimization of steel–concrete composite floors remains an underexplored field with limited studies. Poitras et al. [25] made a significant contribution by applying the PSO algorithm to three distinct configurations of composite steel and concrete floors with full-web profiles, focusing on minimizing mass and cost while accommodating design constraints related to human-induced vibration. The findings highlighted that PSO consistently proves effective in identifying optimal floor configurations, achieving mass or cost reduction goals, and ensuring compliance with all design criteria. However, in this work, the authors did not consider the slabs’ span or the concrete’s compressive resistance as variables.
Kaveh and Fakoor [26] developed a computational program to optimize the costs of floor systems supported by castellated beams. The program was thoughtfully designed and implemented using the VPS algorithm to reduce costs. As part of the validation process, the program was used to optimize various floor systems obtained from the existing literature. The results demonstrated that the proposed program not only meets economic requirements but also ensures safety and structural performance, making it a dependable tool for practical applications. However, the authors did not evaluate the optimization of the beam expansion factor or the pitch between the beam openings. As in the work of Poitras et al. [25], the authors did not consider optimizing the slab span or the concrete’s compressive strength.
Arpini et al. [27] addressed the optimization of floor systems featuring full-web beams. They employed both genetic algorithms (GA) and particle swarm optimization (PSO) to evaluate solutions from economic and environmental perspectives. Notably, the authors’ findings highlighted a significant distinction between solutions from economic and environmental perspectives, and PSO provided better solutions than GA for the problems analyzed. Similar to the work of Poitras et al. [25], the authors did not consider the slabs’ span, the concrete’s compressive strength, or other beam types as design variables when solving the optimization problem.
Renedo et al. [28] investigated the damping strategy known as constrained layer damping (CLD). This innovative approach incorporates a viscoelastic layer positioned between the concrete slab and the steel beam in composite floor systems. The study included comprehensive verifications of ultimate limit states, with a meticulous analysis of the vibration serviceability limit state (VSLS) associated with vibrations induced by human activities. The use of CLD technology increases tread damping, ultimately reducing the need for additional mass or stiffness to address VSLS. However, in this study, the authors evaluated only the use of doubly symmetric laminated profiles, leaving open the possibility of studies on monosymmetric welded profiles and other types of beams.
Teixeira et al. [29] proposed an optimization problem for simply supported composite slabs with additional reinforcement, with the objective of minimizing CO2 emissions. These variables encompassed the rate of additional positive reinforcement, the compressive strength of the concrete, the thickness of the concrete layer, and the thickness of the steel formwork. Particle swarm optimization (PSO) and gray wolf optimization (GWO) were used to identify the variables with the greatest impact on CO2 emissions. The authors evaluated only the behavior of the slabs after concrete curing, while considering the shoring system during construction. Conclusions drawn included that optimization algorithms yield nearly identical solutions and that CO2 emissions are significantly reduced when optimization techniques are employed. The optimized solutions resulted in final CO2 emissions approximately 40% lower than those proposed by the steel form manufacturers.
Silva et al. [30] analyzed CO2 emissions from composite floor systems incorporating cellular beams, accounting for both the production impact of cellular beams and the overall floor composition. By comparing cellular beams with full-web-beam systems, the authors concluded that cellular beams could lead to emissions reductions exceeding 20%. However, the authors analyzed only one type of cellular beam and did not evaluate the efficiency of other types, such as Peiner beams, Anglo-Saxon beams, and beams with sinusoidal openings.
Silva et al. [31] present a multiobjective formulation for composite slabs that minimizes CO2 emissions and costs and maximizes the slabs’ load-bearing capacity. The results show that adding reinforcement mesh can improve the load-bearing capacity of slabs at a low increase in costs and emissions.

1.4. Truss Topological Optimization

Trusses as support elements play a crucial role in providing structural support and resistance, particularly in projects with long spans. They offer the advantage of creating lightweight, efficient structures to span such distances. The field of topological optimization for trusses has gained significant attention and development in recent years, as evidenced by studies conducted by Stolpe [32], Carvalho et al. [33], Stolpe [34], Degertekin et al. [35], Shi and Zhou [36], Ching and Carstensen [37], and Fairclough et al. [38]. However, in these studies, the topological or dimensional optimization of trusses was conducted considering only the cross-sectional area of the bars as design variables. These studies did not consider the possibility of tubular sections filled with concrete.
Kravanja and Silih [14] conducted a comparative analysis of the optimization of composite beams with full-web profiles and those with tubular trusses, with the lower flange composed of circular profiles and the upper flange composed of square profiles. The authors concluded that full-web profiles performed better under higher loads, while trusses performed better under lower loads. However, the authors did not evaluate the possibility of filling the upper flange tubes with concrete in this study.
Erlacher et al. [2] shed light on promising results achievable in this area. The study investigated three distinct profile geometries for Pratt, Howe, and Warren truss models: double angles, hollow circular tubes, and concrete-filled circular tubes. Optimization was carried out employing GA and PSO algorithms. The main objective of this study was to evaluate the performance of the trusses in topological and dimensional optimization, without considering the final composite floor topology. Notably, the outcomes showed remarkable consistency across the solutions produced by these algorithms, and PSO performed best compared with GA. The Warren model and the circular tube filled with concrete emerged as standout solutions, particularly for larger spans. Impressively, these solutions yielded emissions reductions of up to 40% compared to the Howe model.

1.5. Optimization Algorithms

Among the metaheuristics already consolidated for structural optimization, the particle swarm optimization (PSO) algorithm stands out for its simple computational implementation and robustness in finding optimal solutions. Originally proposed by Eberhart and Kennedy [39] the algorithm was inspired by the social behavior of flocks of birds or schools of fish. Barbosa and Lemonge [40] proposed the adaptive penalty method (APM) for solving constrained problems. In recent years, PSO has found successful applications in the work of several researchers, including Barroso et al. [41], Mokarram and Banan [42], Biabani et al. [43], Mahapatra et al. [44], Tong et al. [45], and Shao et al. [46]. In the studies by Erlacher et al. [2], Arpinit et al. [27], Teixeira et al. [29], they point out that for different optimization problems of composite steel and concrete structures, PSO obtained better performance than GA, one of the great motivations for its application in this study.
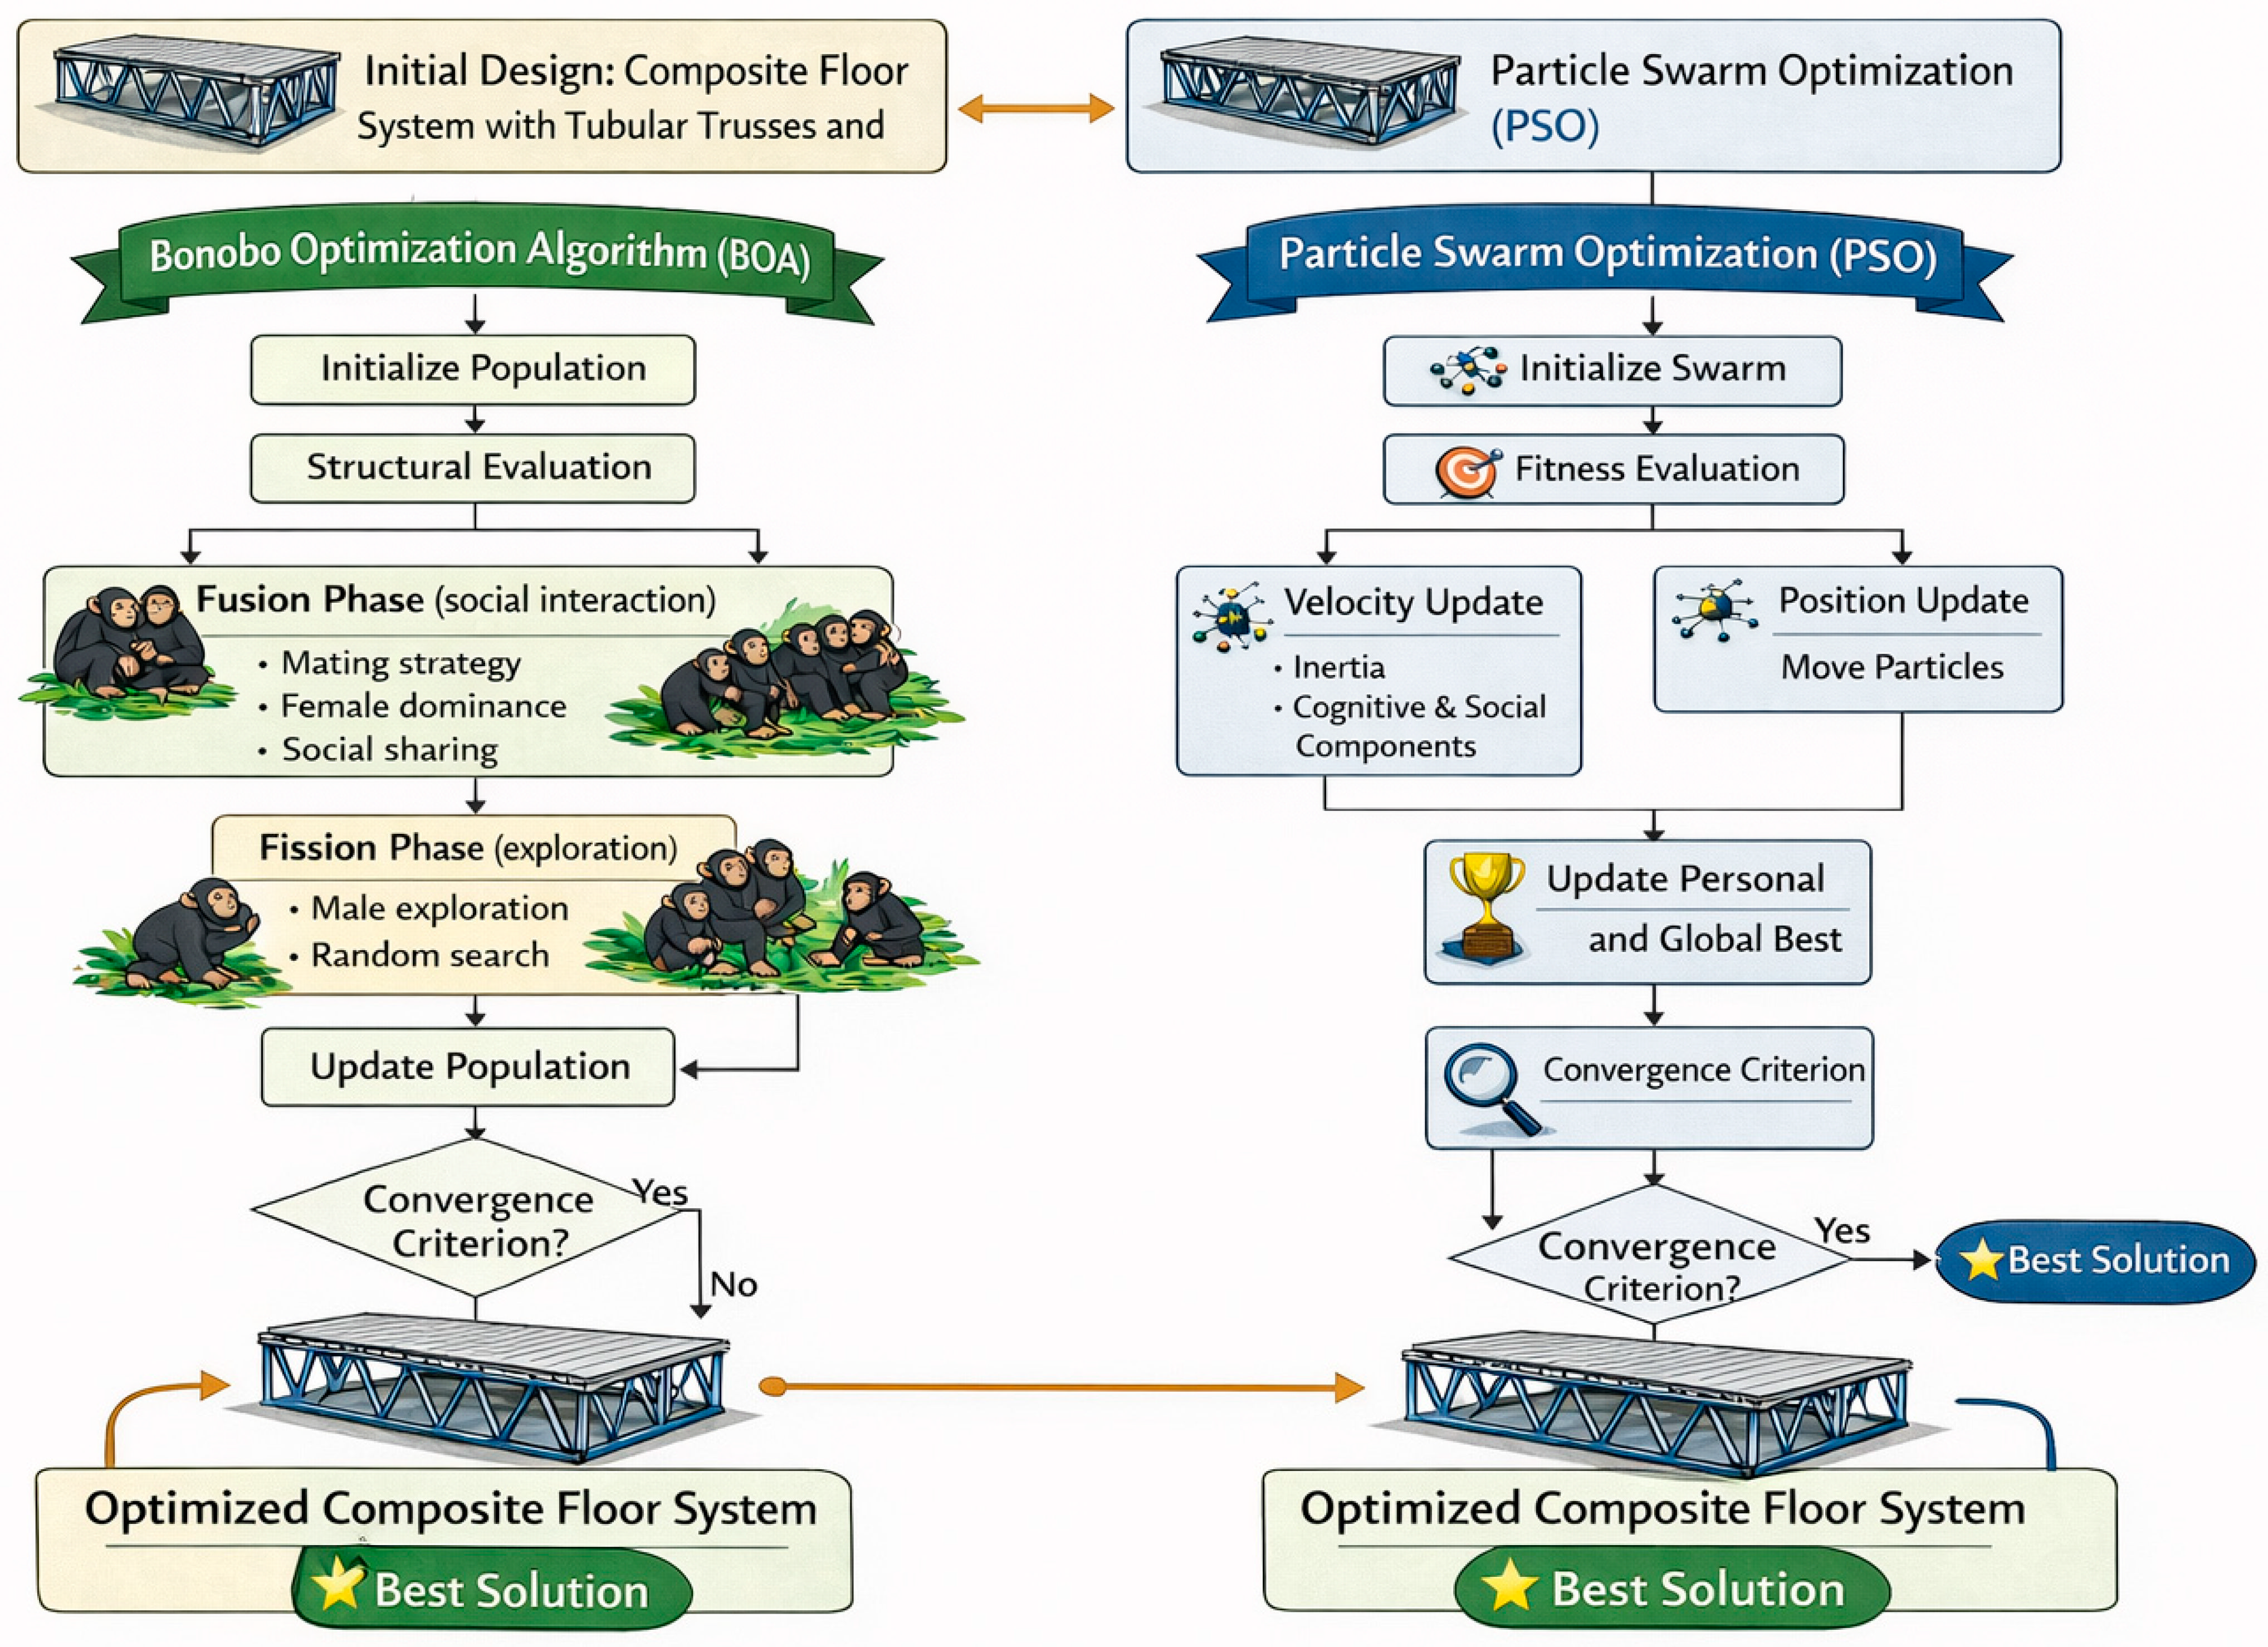
A new metaheuristic, the BO algorithm, was recently developed from the social behavior and reproductive strategies of bonobos, as proposed by Das and Pratihar [47]. The Bonobo Optimizer (BO) is inspired by the social and reproductive behavior of bonobos, particularly their fission–fusion social structure, in which individuals temporarily split into subgroups and later reunite, enabling an efficient exploration of the search space. Since its conception, several studies have been undertaken by researchers such as Das and Pratihar [47], Das et al. [48], Goodarzimehr et al. [49], Das et al. [50] to validate the BO algorithm. These studies have demonstrated its efficiency in finding optimal solutions across a range of problems compared with other algorithms. In applying the Bonobo Algorithm (BO) to composite floor systems, Silva et al. [30], who focused on composite floor systems with cellular beams, demonstrate the robustness of BO results relative to those obtained with PSO. Figure 1 presents a comparative flowchart of the PSO and BO algorithms, highlighting the differences in their search dynamics: while PSO iteratively updates individuals’ positions and velocities, BO simulates the bonobos’ fission–fusion social strategy, alternating between subgroup separation and reunion to balance exploration and exploitation of the search space.
Based on the bibliographic survey, a synthesis of research by subject matter is presented in Table 1, highlighting this research as among the most recently studied topics.

1.6. Synthesis

As shown in Table 1, none of the experimental works in the literature analyzes floors composed of tubular composite trusses. Regarding optimization work on tubular trusses, only the study by Kravanja and Silih [14] was found. Additionally, among composite trusses with concrete filling the upper flange, only the research presented by Erlacher et al. [2] has been identified to date. In terms of research involving composite flooring, only five studies concerning the structural optimization of composite floors were found in the literature, with three studies considering full-web beams (Poitras et al. [25], Arpini et al. [27], and Renedo et al. [28]), one study on castellated beams (Kaveh and Fakoor [26]), and one study on cellular beams (Silva et al. [30]). Given the scenario outlined in Table 1 and the apparent research gap on the optimization of composite floor systems composed of composite trusses, this study addresses the dimensional and topological (layout) optimization of composite floor systems supported by tubular composite trusses, with the upper chord either filled or unfilled with concrete. This study formulates an optimization problem for composite floor systems composed of tubular composite trusses and steel deck slabs, incorporating the option of concrete-filled upper chords. The primary objective is to minimize CO2 emissions associated with the manufacturing process, addressing the problem through three main perspectives:
(i)
Structural system configuration:
The study proposes an integrated structural concept that combines the advantages of tubular truss systems with the benefits of composite floor beam action. By promoting composite action between the tubular truss and the floor slab, the system can achieve increased load-bearing capacity and allow for larger spans. In addition, the concrete filling of the steel tube corresponding to the compressed chord of the truss improves structural performance during construction and may reduce required steel consumption. Although no entirely new structural element is proposed, the work presents an efficient and well-integrated combination of established structural components with modern structural design concepts.
(ii)
Optimization framework and comparative analysis:
The study implements a computational framework that couples structural analysis with optimization, enabling automated evaluation of multiple structural configurations. Within this framework, a comparative analysis between PSO and BO is performed for the studied structural system. While both algorithms are well established in the literature, their performance is evaluated and compared in the context of environmentally oriented structural optimization of composite tubular truss floor systems.
(iii)
Environmental assessment dataset for structural systems:
Although the environmental metric itself is not new, since CO2 emissions are quantified in terms of kgCO2, the study provides a detailed estimation of the emissions associated with the fabrication of all structural components of the proposed system. These calculations were carried out for multiple floor system configurations, generating a consistent dataset that may support future studies involving environmental assessment and optimization of structural systems.
The solution to the optimization problem was obtained using two optimization algorithms: PSO (particle swarm optimization) and BO (Bonobo Optimizer). This paper is structured as follows. Section 1 presents a brief introduction and a description of studies related to the subject. Section 2 presents the optimization problem formulation and the CO2 emissions parameters employed in this study. Section 3 presents the numerical simulations with a parametric analysis. Finally, Section 4 provides the conclusions and guidelines for future work.

2. Optimization Problem Formulation

2.1. Design Variables

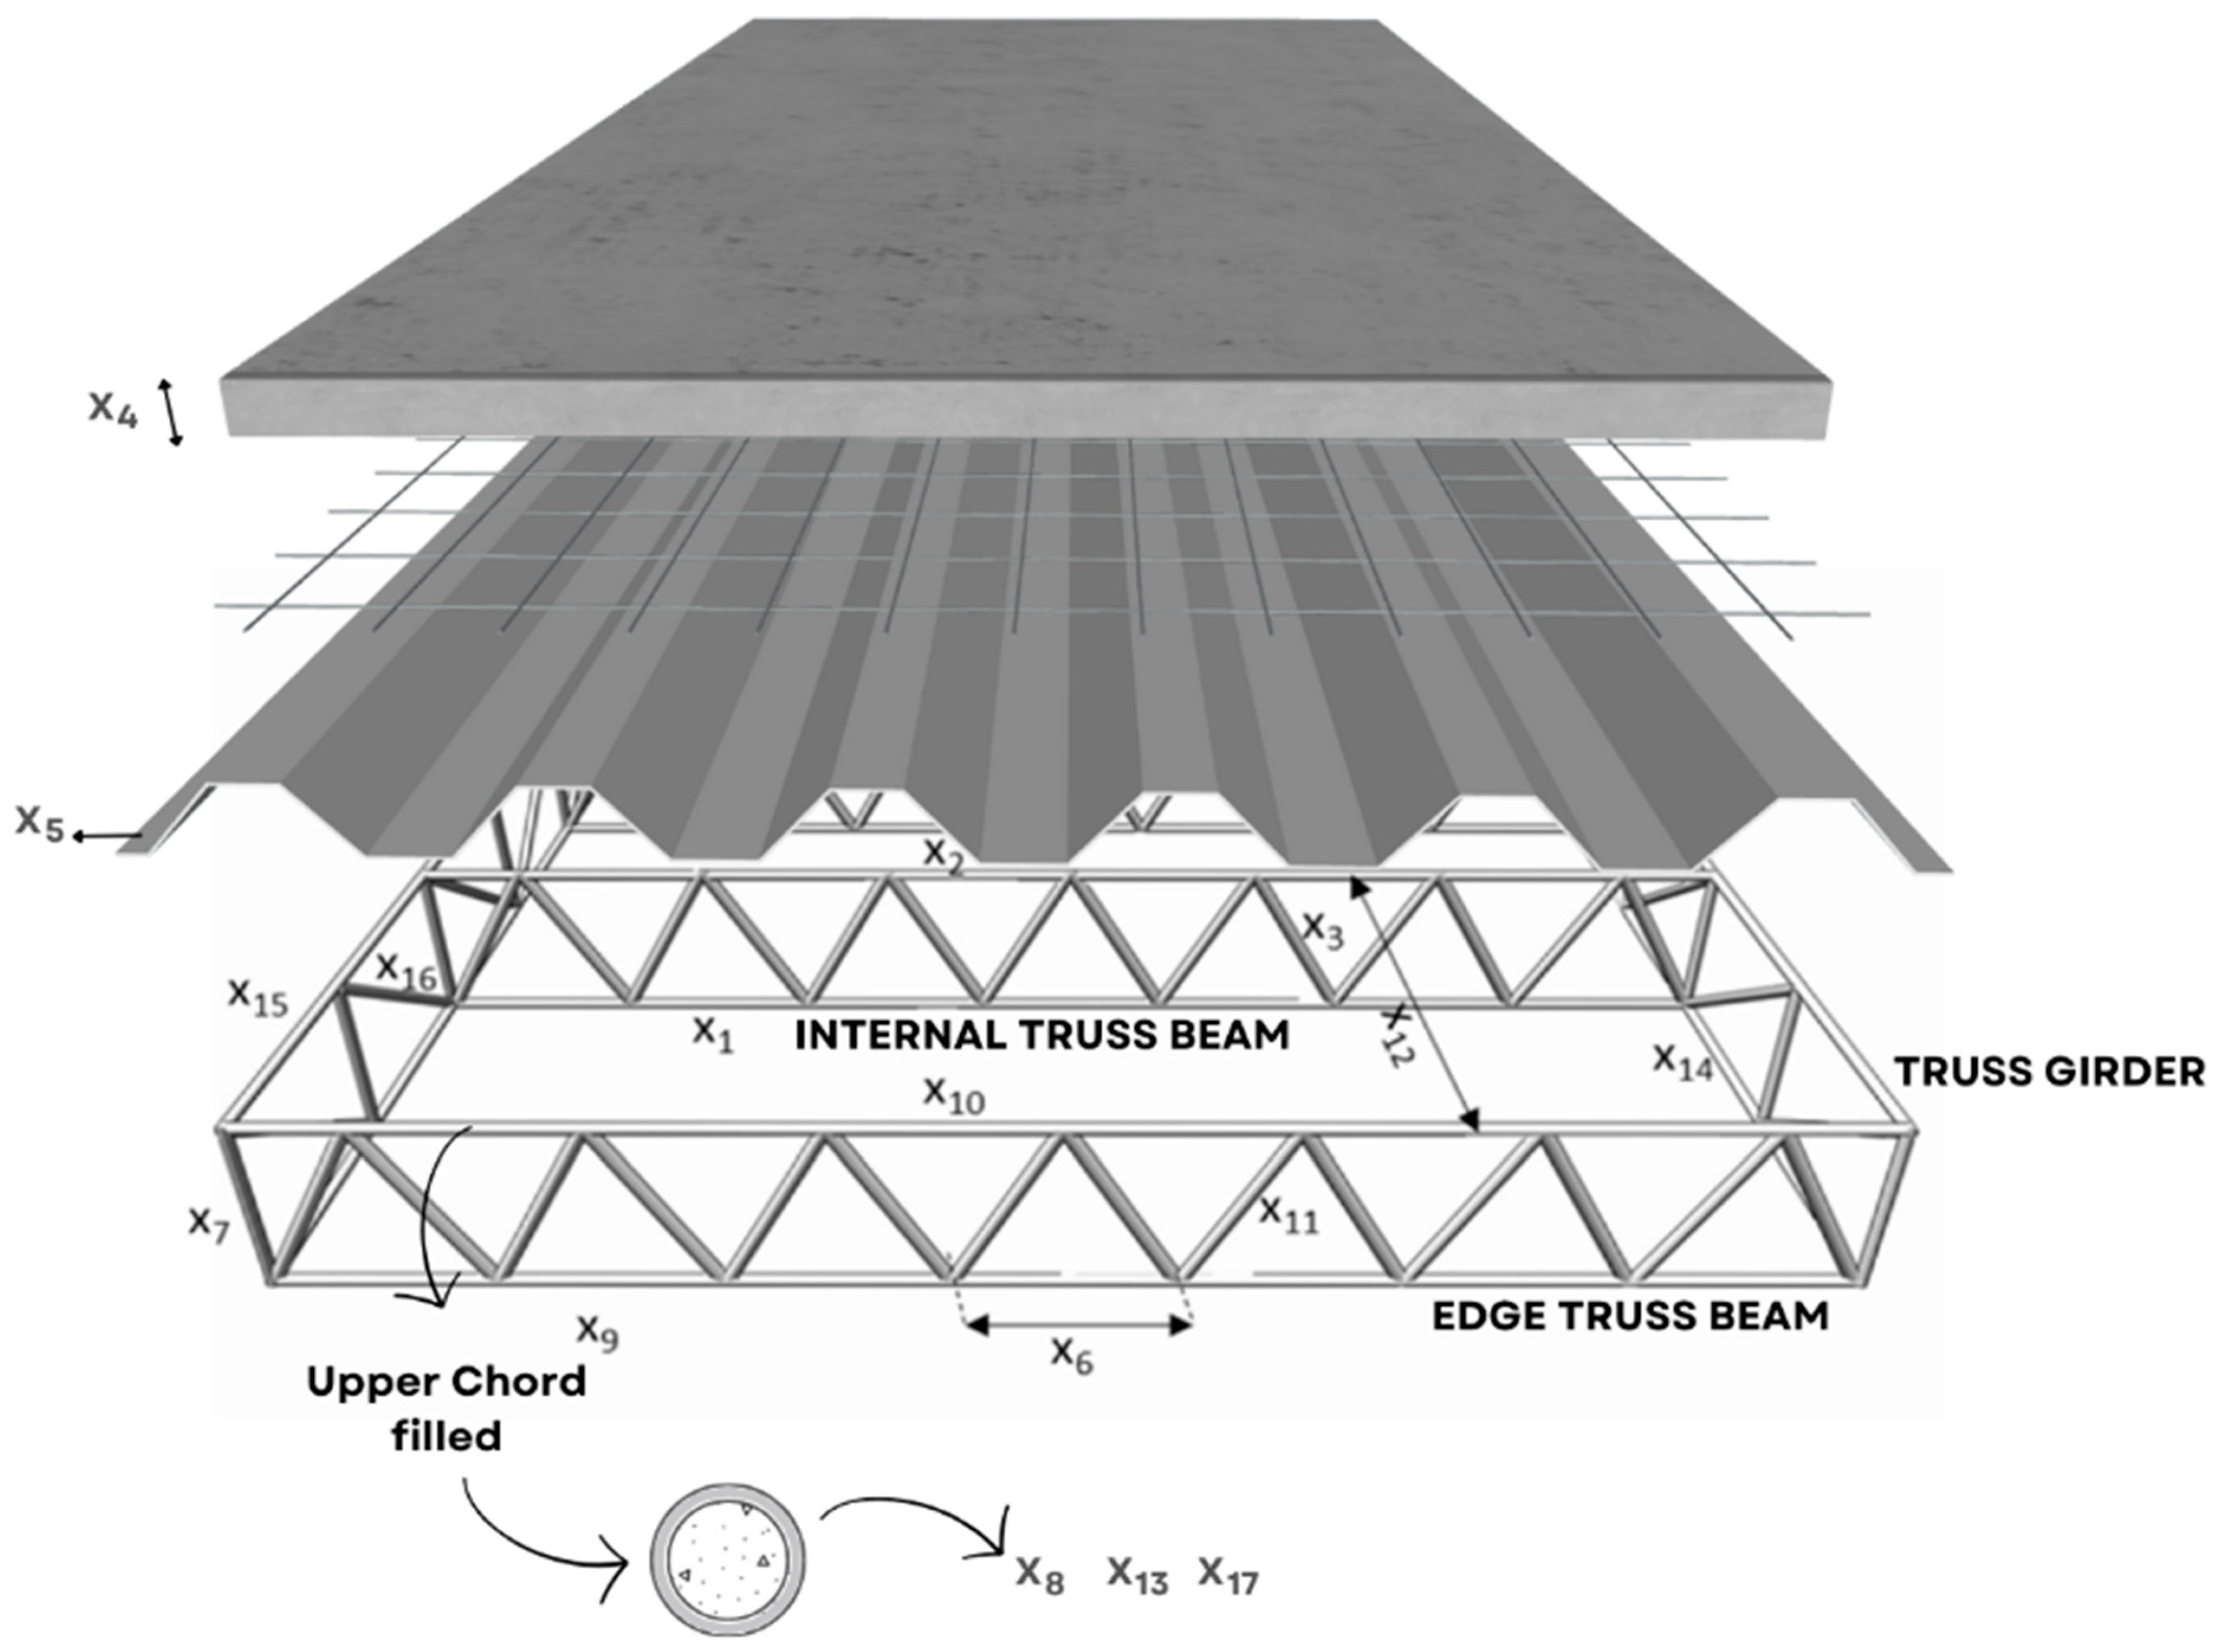
The design variables of the optimization problem of composite floor systems with composite trusses are presented in Figure 2.
Where x1, x2, x3, refer to the circular profile of the lower, upper chord and web members of the internal truss beam; x4: fck of the floor slab; x5: the thickness of the steel deck formwork; x6: the number of truss panels; x7: the height of trusses; x8: fck of the concrete-filled of the upper chord of internal truss beam; x9, x10, x11: the circular profile of the lower, upper chord and web members of the edges truss beam; x12: is the maximum span between trusses according to the Metform catalog [51]; x13: fck of the concrete-filled of the upper chord of edge truss beam; x14, x15, x16: the circular profile of the lower, upper chord and web members of the truss girder; x17: fck of the concrete-filled of the upper chord of truss girder. The Warren-type truss was selected for the secondary trusses, while the Pratt-type truss was chosen for the main truss. This decision was made based on the requirement for an upright to facilitate the connection between the two trusses. According to the findings of Erlacher et al. [2], the Warren and Pratt truss configurations yielded the most favorable optimization results, hence their selection for this study.

2.2. Objective Function

The objective function was considered the total CO2 emission minimization of the materials that compose the composite floor described in Equation (1).
M i n   C O 2 = C O 2 ( c o n c r e t e   s l a b ) + C O 2 ( f o r m w o r k ) + C O 2 ( r e i n f o r c e m e n t ) + C O 2 ( t r u s s ) + C O 2 ( s t u d   b o l t ) + C O 2 ( c o n c _ u c )
where: C O 2 ( c o n c r e t e   s l a b ) , C O 2 ( f o r m w o r k ) , C O 2 ( r e i n f o r c e m e n t ) , C O 2 ( t r u s s ) , C O 2 ( r e i n f ) , C O 2 ( s t u d   b o l t ) , C O 2 ( c o n c _ u c ) refer respectively to the CO2 emission of the concrete slab, the steel formwork, the cracking mesh, the profiles of the internal truss beam, edge truss beam and truss girder, the shear connectors and the concrete filling the upper chord of the internal truss beam, edge truss beam and truss girder.
C O 2 ( c o n c r e t e   s l a b ) = V c o n c / m 2 × A s l a b × U c o n c
C O 2 ( c o n c _ u c ) = ( 2 × V c o n c _ u c _ e d g e × U c o n c _ e d g e + n I T b e a m × V c o n c _ u c _ i n t × U c o n c _ i n t   ) + 2 × V c o n c _ u c _ g i r d e r × U c o n c _ g i r d e r
C O 2 ( f o r m w o r k ) = m f o r m w o r k / m 2 × A s l a b × U f o r m w o r k
C O 2 ( r e i n f o r c e m e n t ) = m r e i n f / m 2 × A s l a b × U r e i n f
C O 2 ( s t u d   b o l t ) = ( 2 × n E T b e a m _ s t u d + n I T b e a m × n I T b e a m _ s t u d + 2 × n T g i r d e r _ s t u d ) × m s t u d × U s t u d
C O 2 ( t r u s s ) = ( 2 × m E T b e a m + n I T b e a m × m I T b e a m + 2 × m T g i r d e r ) × U s t e e l
where V c o n c / m 2 refers to the consumption of concrete (m3/m2); A s l a b refers to the area of the slab (m2); U c o n c refers to the CO2 emission from the concrete slab (kgCO2/m3); V c o n c _ u c _ e d g e , V c o n c _ u c _ i n t and V c o n c _ u c _ g i r d e r refer to the volume of concrete filling the upper chords of the edge truss beam, internal truss beam and truss girder, respectively; n I T b e a m   refers to the number of internal truss beam; U c o n c _ e d g e , U c o n c _ i n t   and U c o n c _ g i r d e r refers respectively to the CO2 emission from the concrete filling the upper chord of the edge truss beam, internal truss beam and truss girder (kgCO2/m3); m f o r m w o r k / m 2 refers to the mass (kg/m2) of steel formwork; U f o r m w o r k refers to the CO2 emission of the steel formwork (kgCO2/kg); U r e i n f refers to the CO2 emission from the cracking mesh (kgCO2/kg); m r e i n f / m 2 refers to the mass (kg/m2) of the cracking mesh; U r e i n f refers to the CO2 emission from the cracking mesh (kgCO2/kg); n E T b e a m _ s t u d , n I T b e a m _ s t u d and n T g i r d e r _ s t u d refers to the number of shear connectors of the edge truss beam, internal truss beam and truss girder respectively; m s t u d refers to the mass of the shear connectors (kg) and U s t u d   refers to the CO2 emission of connectors (kgCO2/unit); m E T b e a m , m I T b e a m and m T g i r d e r refer to the total mass (kg) of the edge truss beam, internal truss beam and truss girder profiles, respectively; U s t e e l   efers to the CO2 emission from truss profiles (kgCO2/kg). Table 2 presents the material CO2 emissions used to compose the objective function.

2.3. Design Constraints

In the topological optimization, the ultimate limit state (ULS) and serviceability limit state (SLS) ([53,54]) are described in Equations (8)–(16) according to Brazilian standards.
C ( 1 ) :   N c , S d , u c , b c N c , R d 1 0
C ( 2 ) :   N c , S d , u c , a c N c , R d 1 0
C ( 3 ) :   N t , S d , l c , b c N t , R d 1 0
C ( 4 ) :   N t ,   S d , l c , a c N t , R d 1 0
C ( 5 ) :   N S d , w m , b c N c , R d 1 0
C ( 6 ) :   N S d , w m , a c N c , R d 1 0
C ( 7 ) :   M S d , c o m p o s i t e M R d 1 0
i f   N S d , b c N R d 0.2         C ( 8 ) :   N S d , b c N R d + 8   M S d , b c 9   M R d 1 0   i f   N S d , b c N R d < 0.2   C ( 8 ) :   N S d , b c 2   N R d + M S d , b c M R d 1 0  
C ( 9 ) :   δ T o t a l δ A d m 1 0
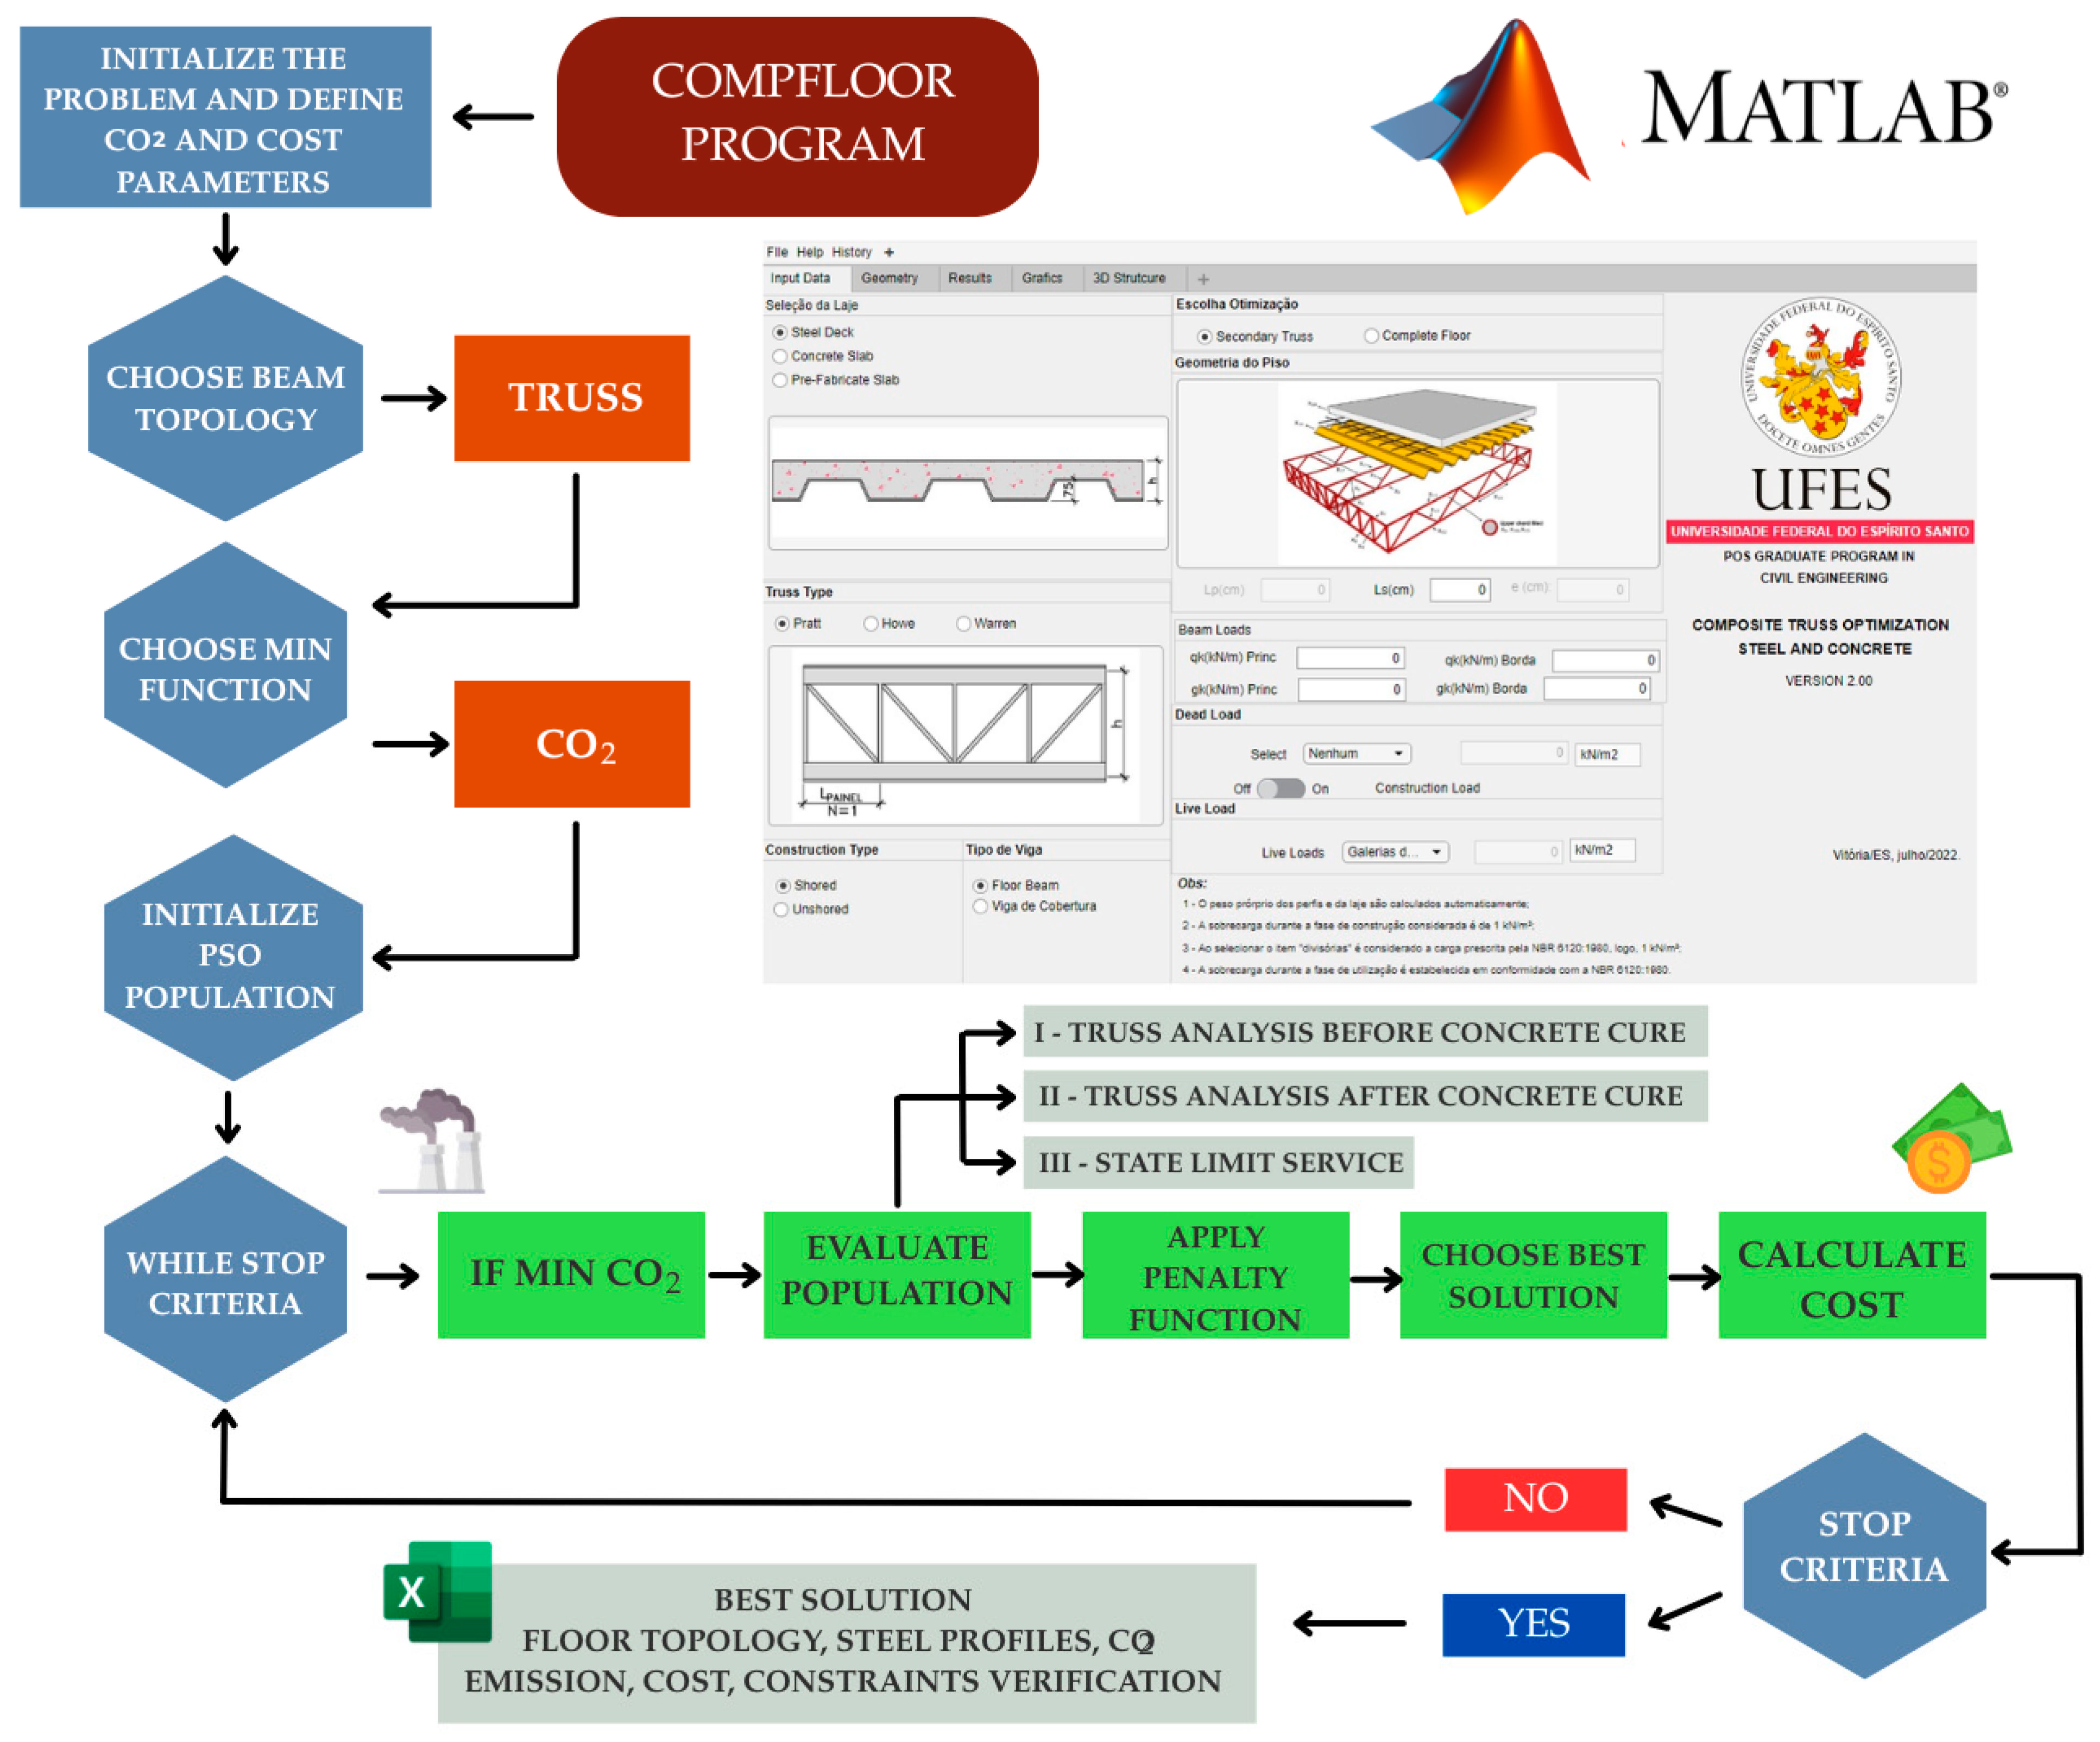
where constraints C(1) to C(6) represent the analysis of upper chord, lower chord, and web members respectively before and after concrete curing according to Brazilian standard NBR 16239:2013 [53]; constraint C(7) represents the composite section analysis of the trusses; constraints C(8) and C(9) represent the analysis of limit total deflection according to Brazilian standard NBR 8800:2008 [54]. All constraints repeat three times for the edge truss beam, internal truss beam, and truss girder, totaling 30 constraints. Figure 3 presents a flowchart of the optimization problem with the program developed.

3. Numerical Analysis and Results

The entire computational implementation was carried out in MATLAB 2020a [55], including structural analysis, constraint verification routines, and PSO and BO optimization methods to minimize CO2 emissions. A linear-elastic structural analysis was performed using the displacement method, considering space truss elements. The truss element with 3 degrees of freedom per node was implemented, with the degrees of freedom referring to the axial displacements of the bar.
To demonstrate the efficiency of the proposed formulation, two problems were analyzed. The first problem concerns a composite floor system composed of full-web beams, studied by Arpini et al. [27]. The second problem involves a parametric analysis that varies the floor dimensions and live load. For both, the adopted PSO and BO parameters were determined through several experiments. It is important to emphasize that metaheuristic optimization methods do not guarantee a globally optimal solution, which is not a practical concern. In this sense, optimization was performed several times for each configuration, using different initial solutions, and the best results were adopted. For both algorithms and for each example, 10 rounds were performed, with a population of 200 individuals generated via Latin hypercube (LHS). For PSO, the parameters c1 and c2 were set to 2.05, with a damping factor w = 0.95. For BO, the parameters used for the different clustering phases are those specified by Das and Pratihar [47].

3.1. Comparative Analysis with Arpini et al. [27]

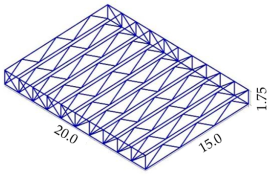
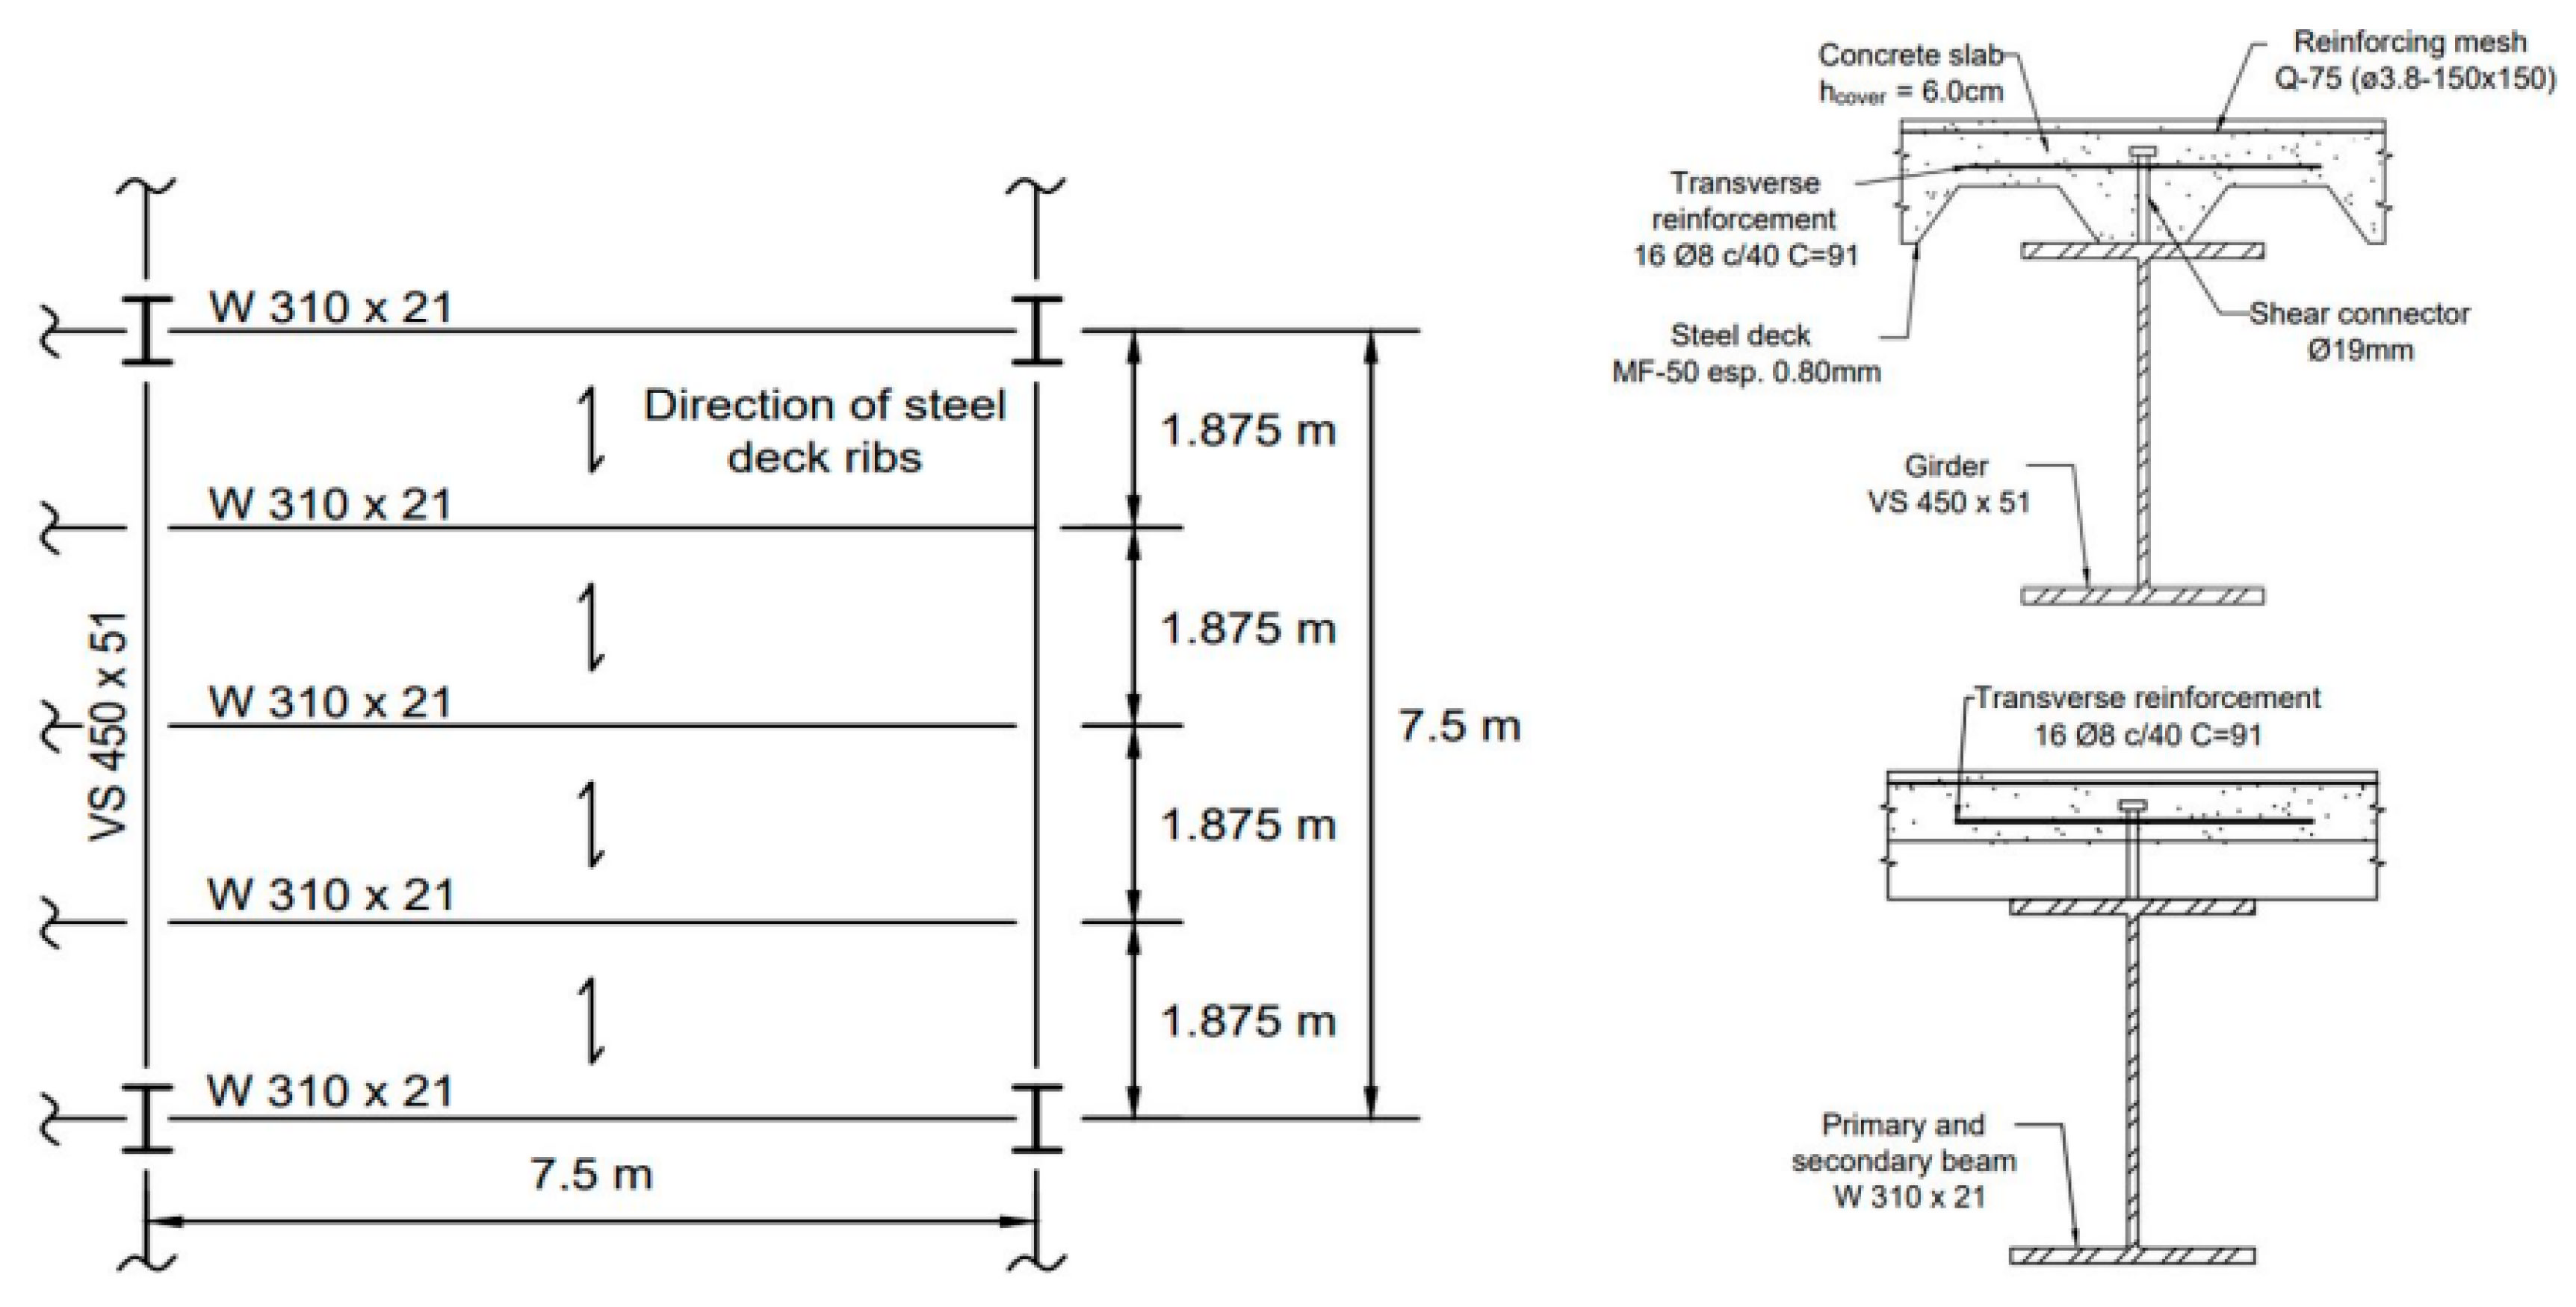
The first example was proposed by Arpini et al. [27], where the optimization of the composite floor system was performed using full-web beams using a genetic algorithm (GA). Authors considered ASTM GR 42 steel with fy of 345 MPa for beam profiles, and steel deck formwork from the Metform catalog [51] produced with ASTM A653 galvanized steel and fy of 280 MPa. The loading included the flooring and steel structure weight, a serviceability static live load of 5 kN/m2. Figure 4 presents the floor system topology.
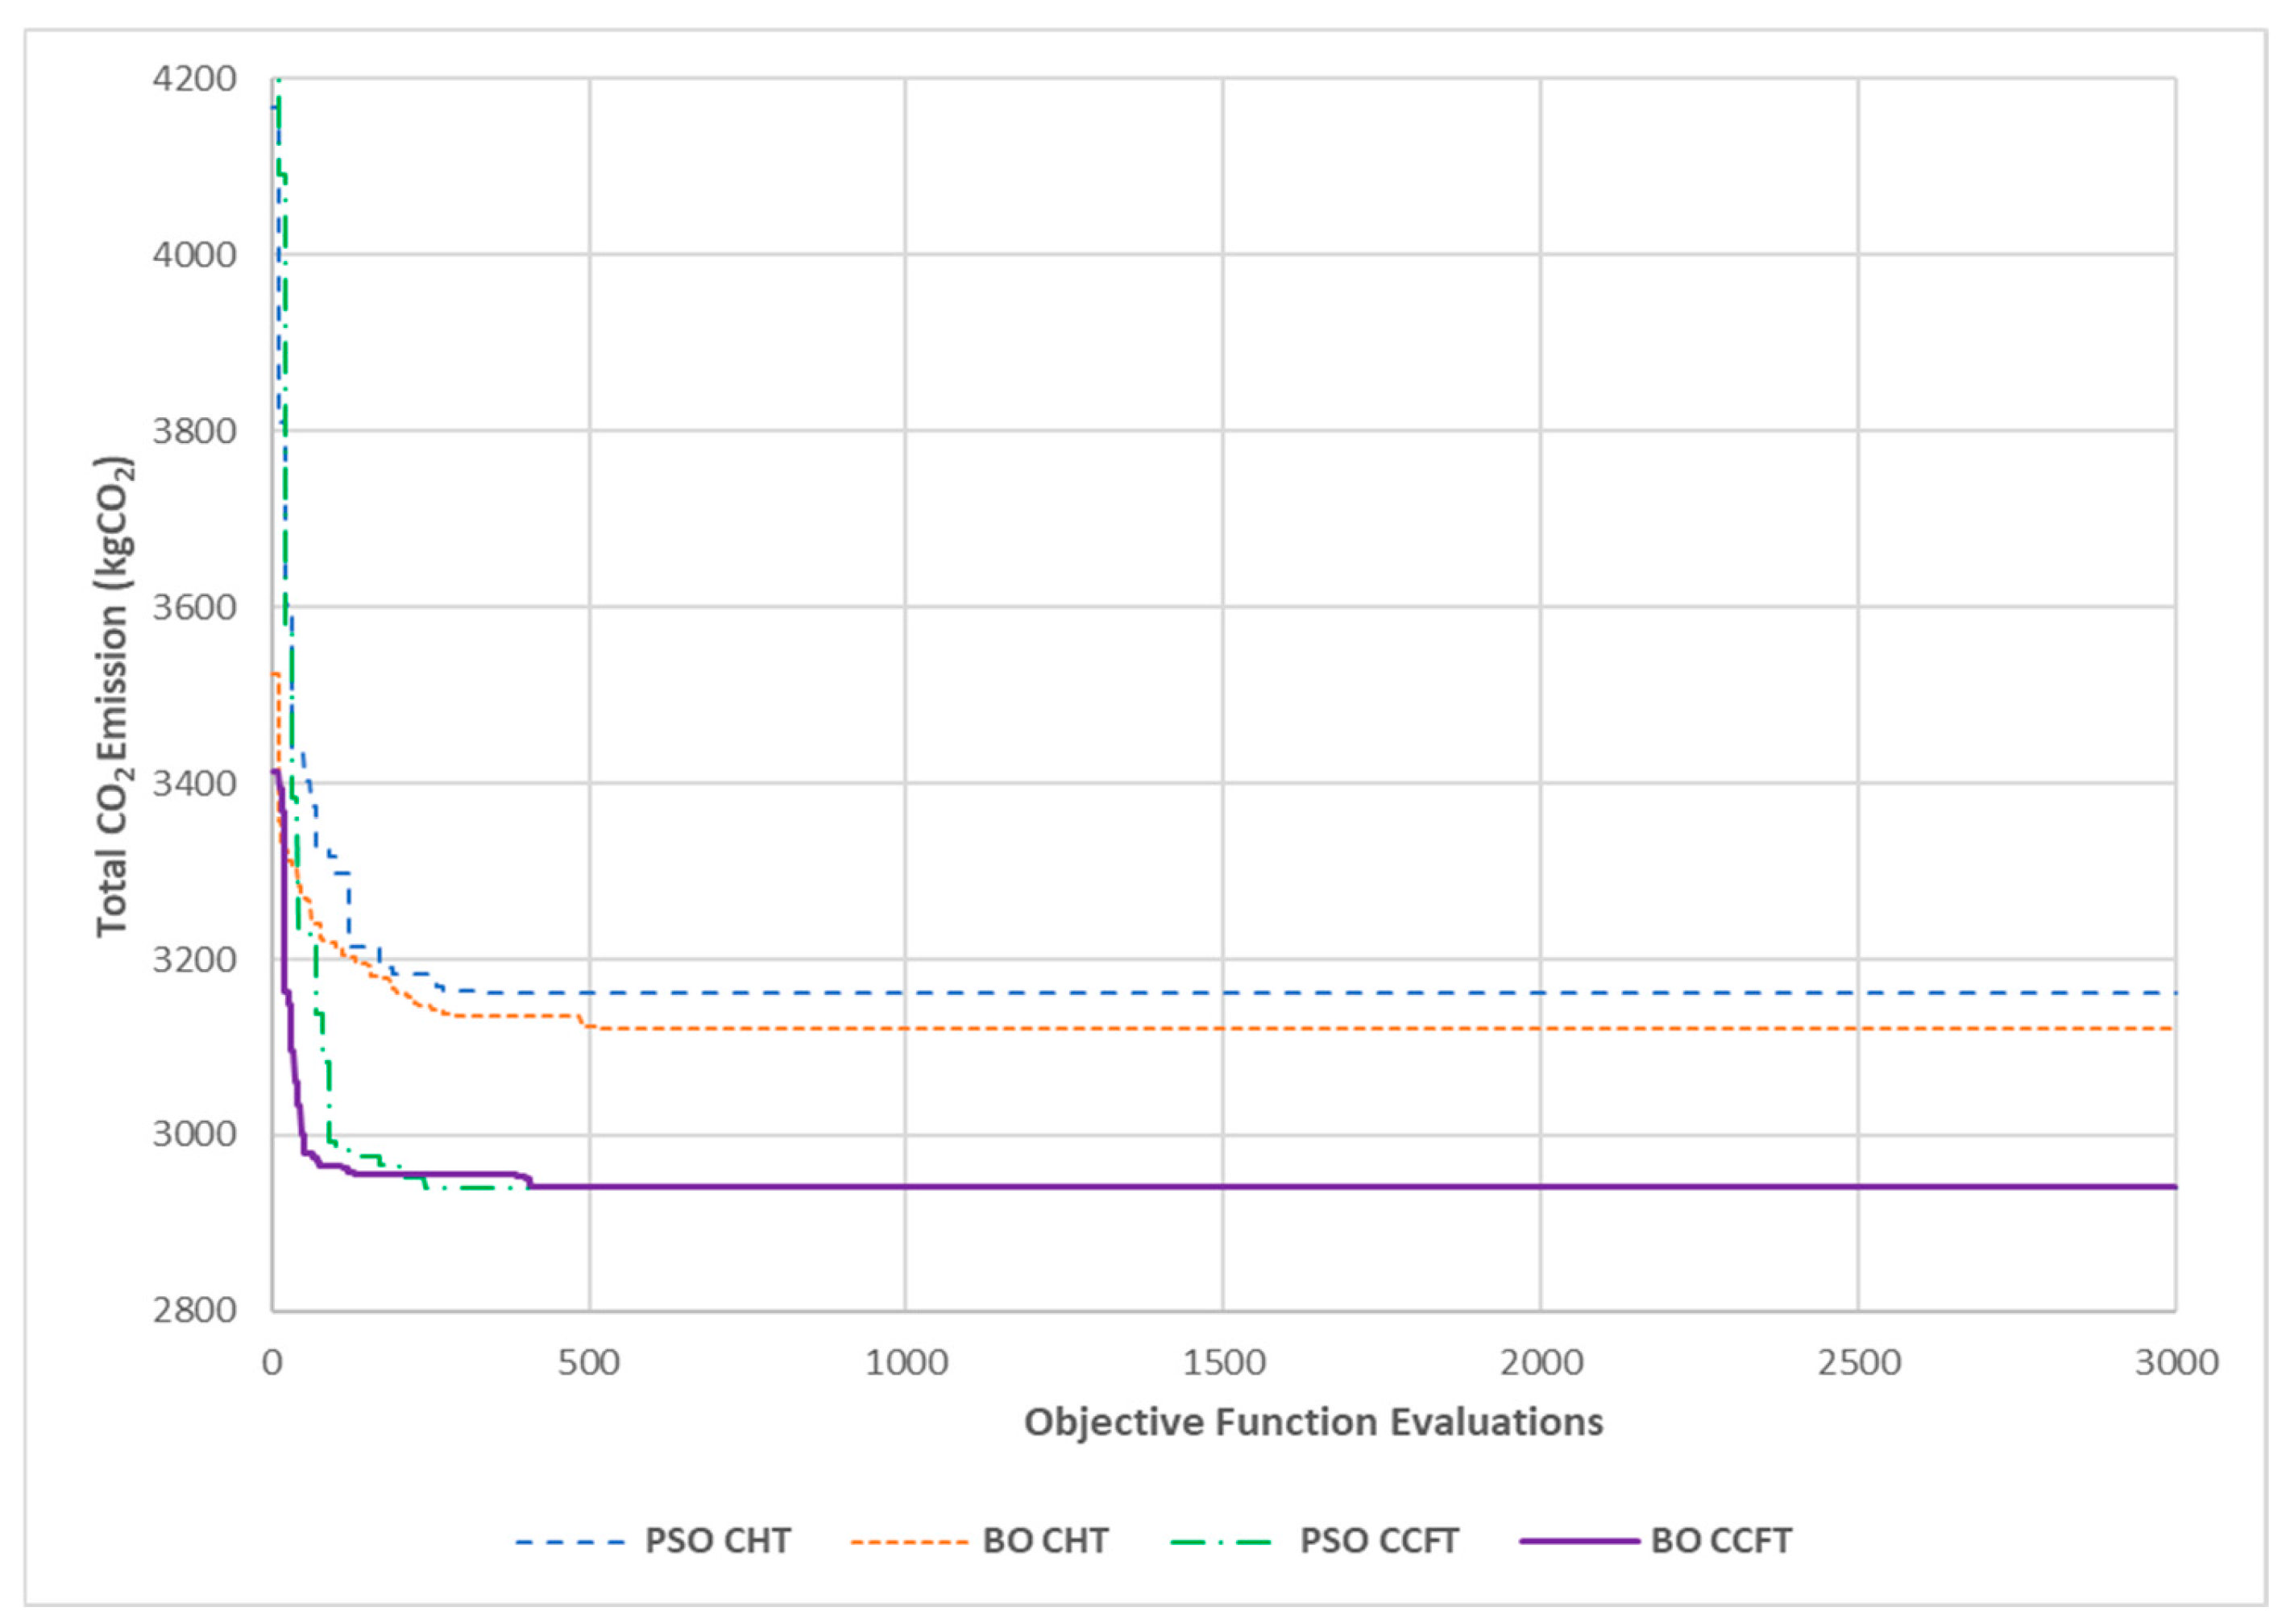
Table 3 presents the steel profiles and Table 4 presents a comparative analysis of solutions obtained in this work with circular hollow profile (CHT) and circular concrete-filled profile (CCFT) with the solutions proposed by Arpini et al. [27], and Figure 5 presents the optimization problem solution evolution.
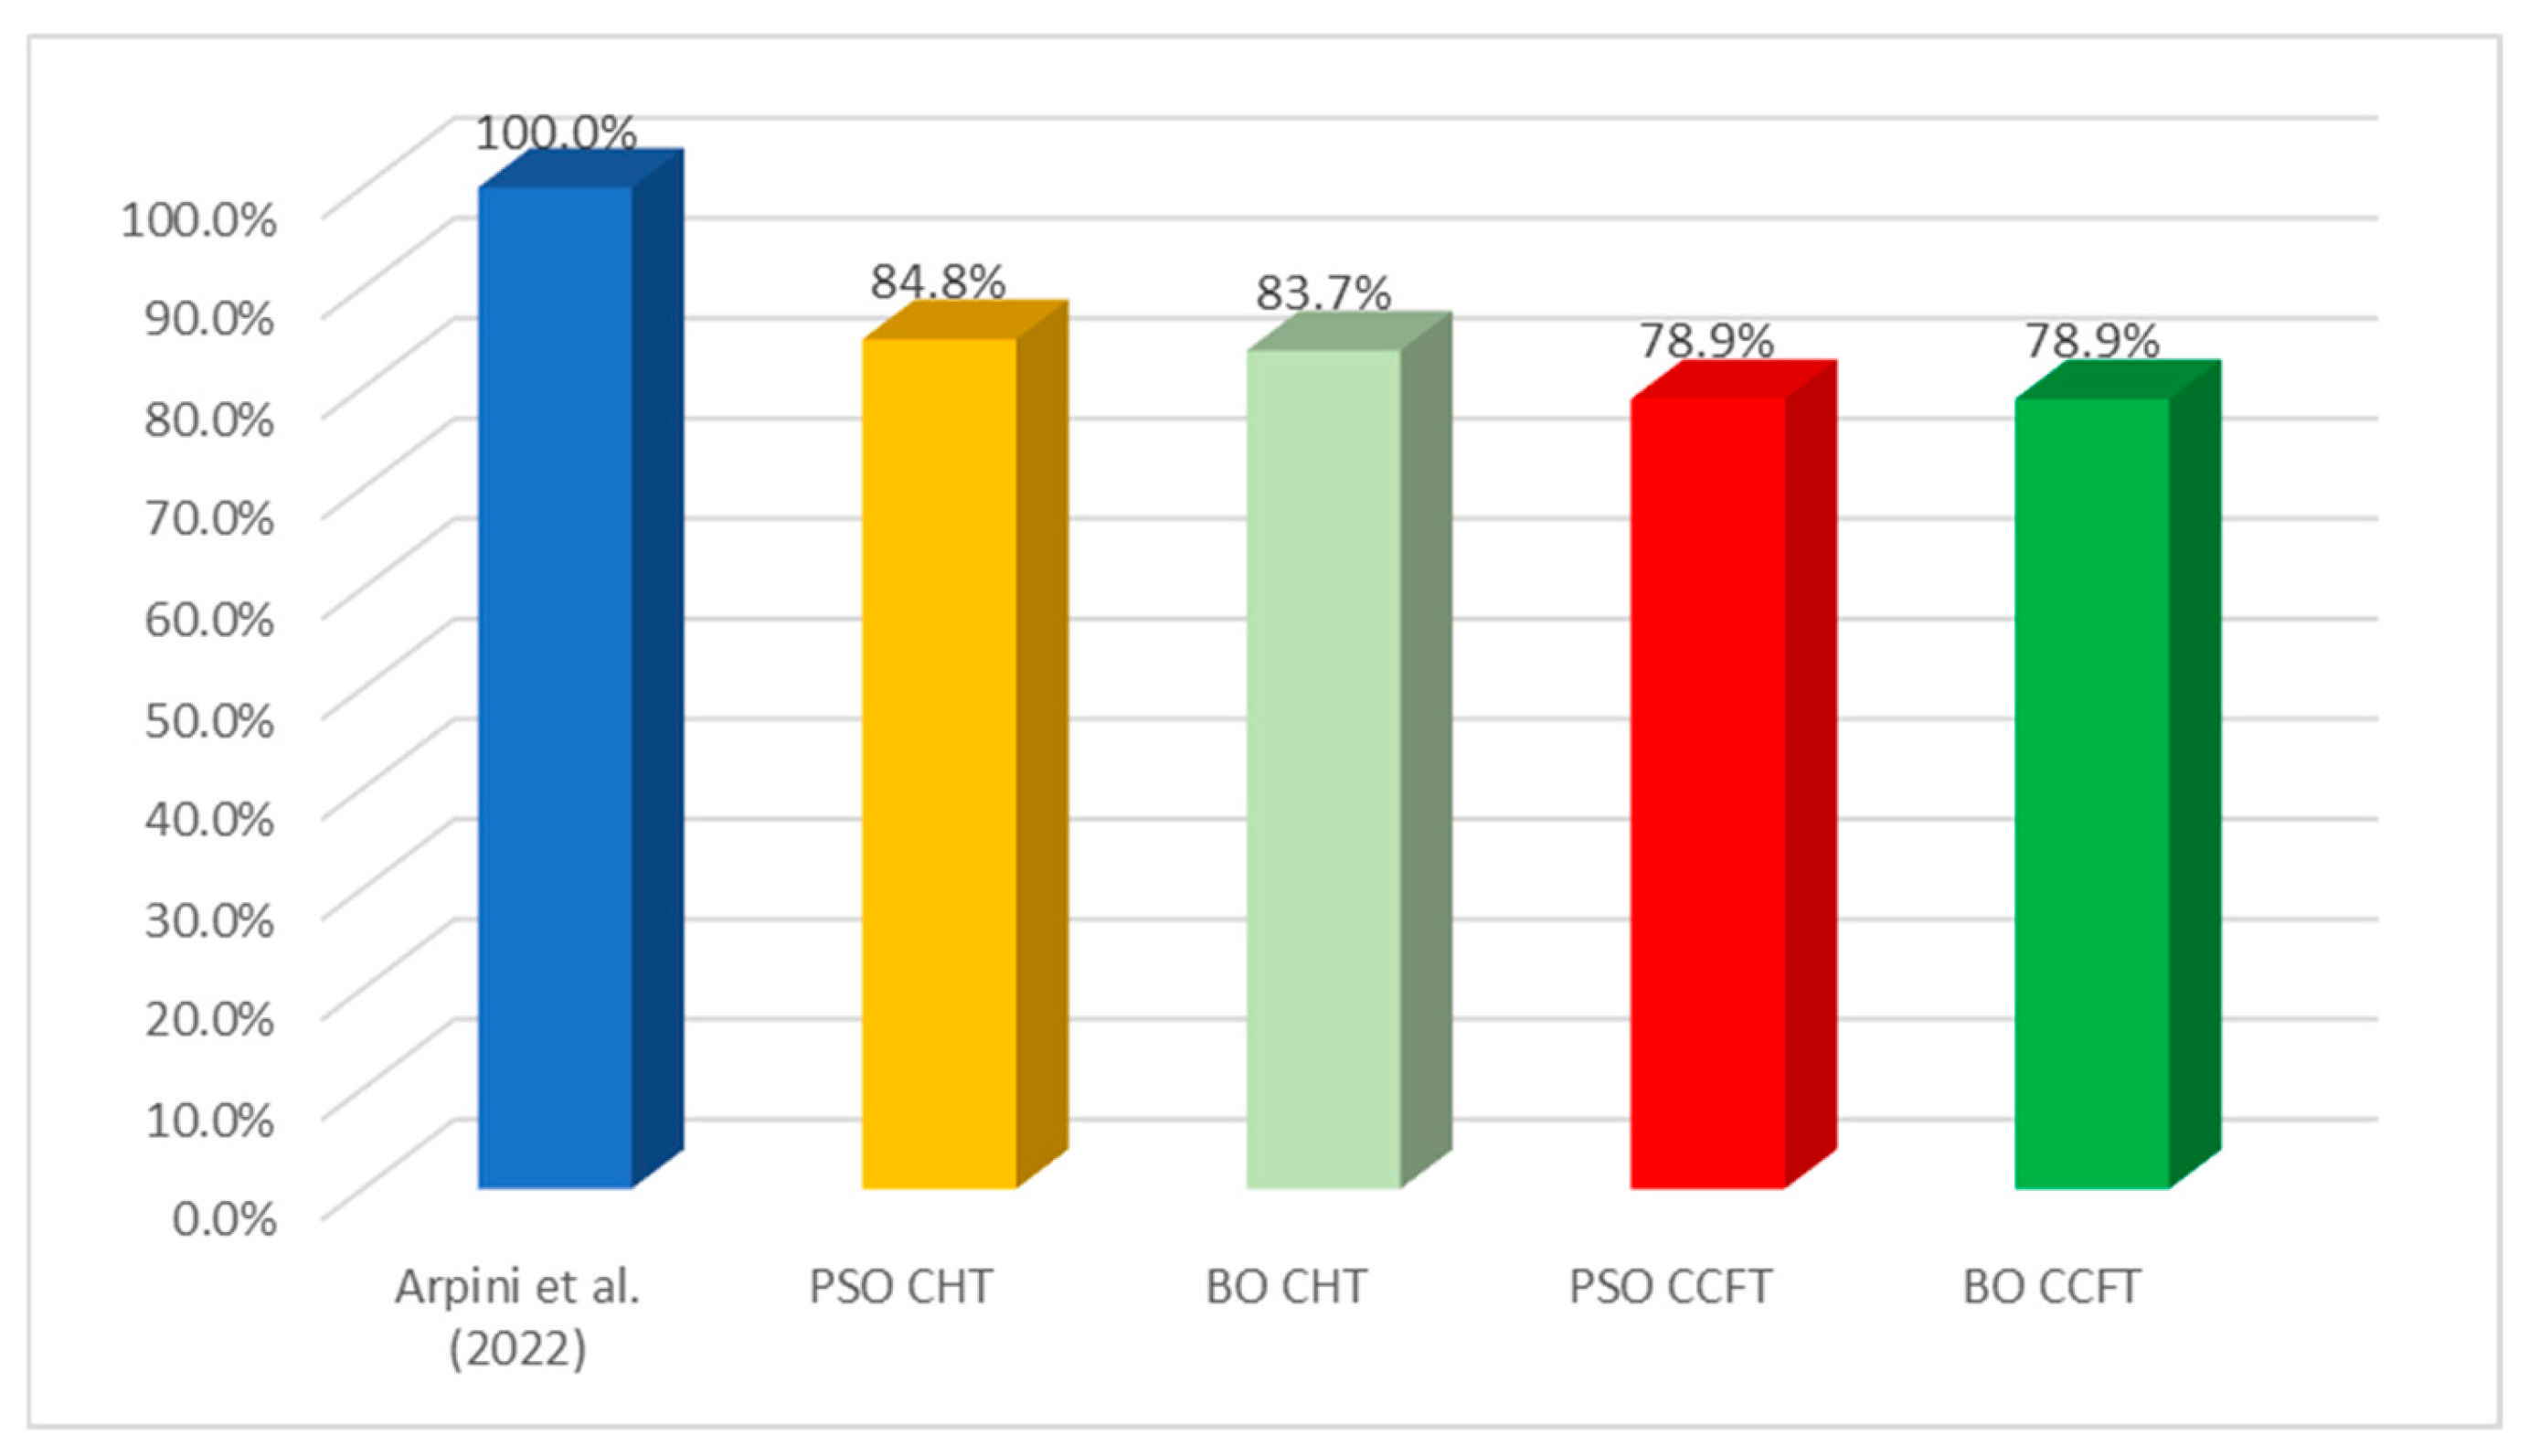
As can be observed in Table 3 and Table 4, BO and PSO found a solution different from that of Arpini et al. [27]. The algorithms reduced one internal truss beam (5 to 4) and increased the slab thickness. The total CO2 emission was reduced for all solutions, and the use of CCHT profiles with concrete over fck 25 MPa and using the BO algorithm was the best solution. Figure 5 presents the normalized solution to the total CO2 emission.
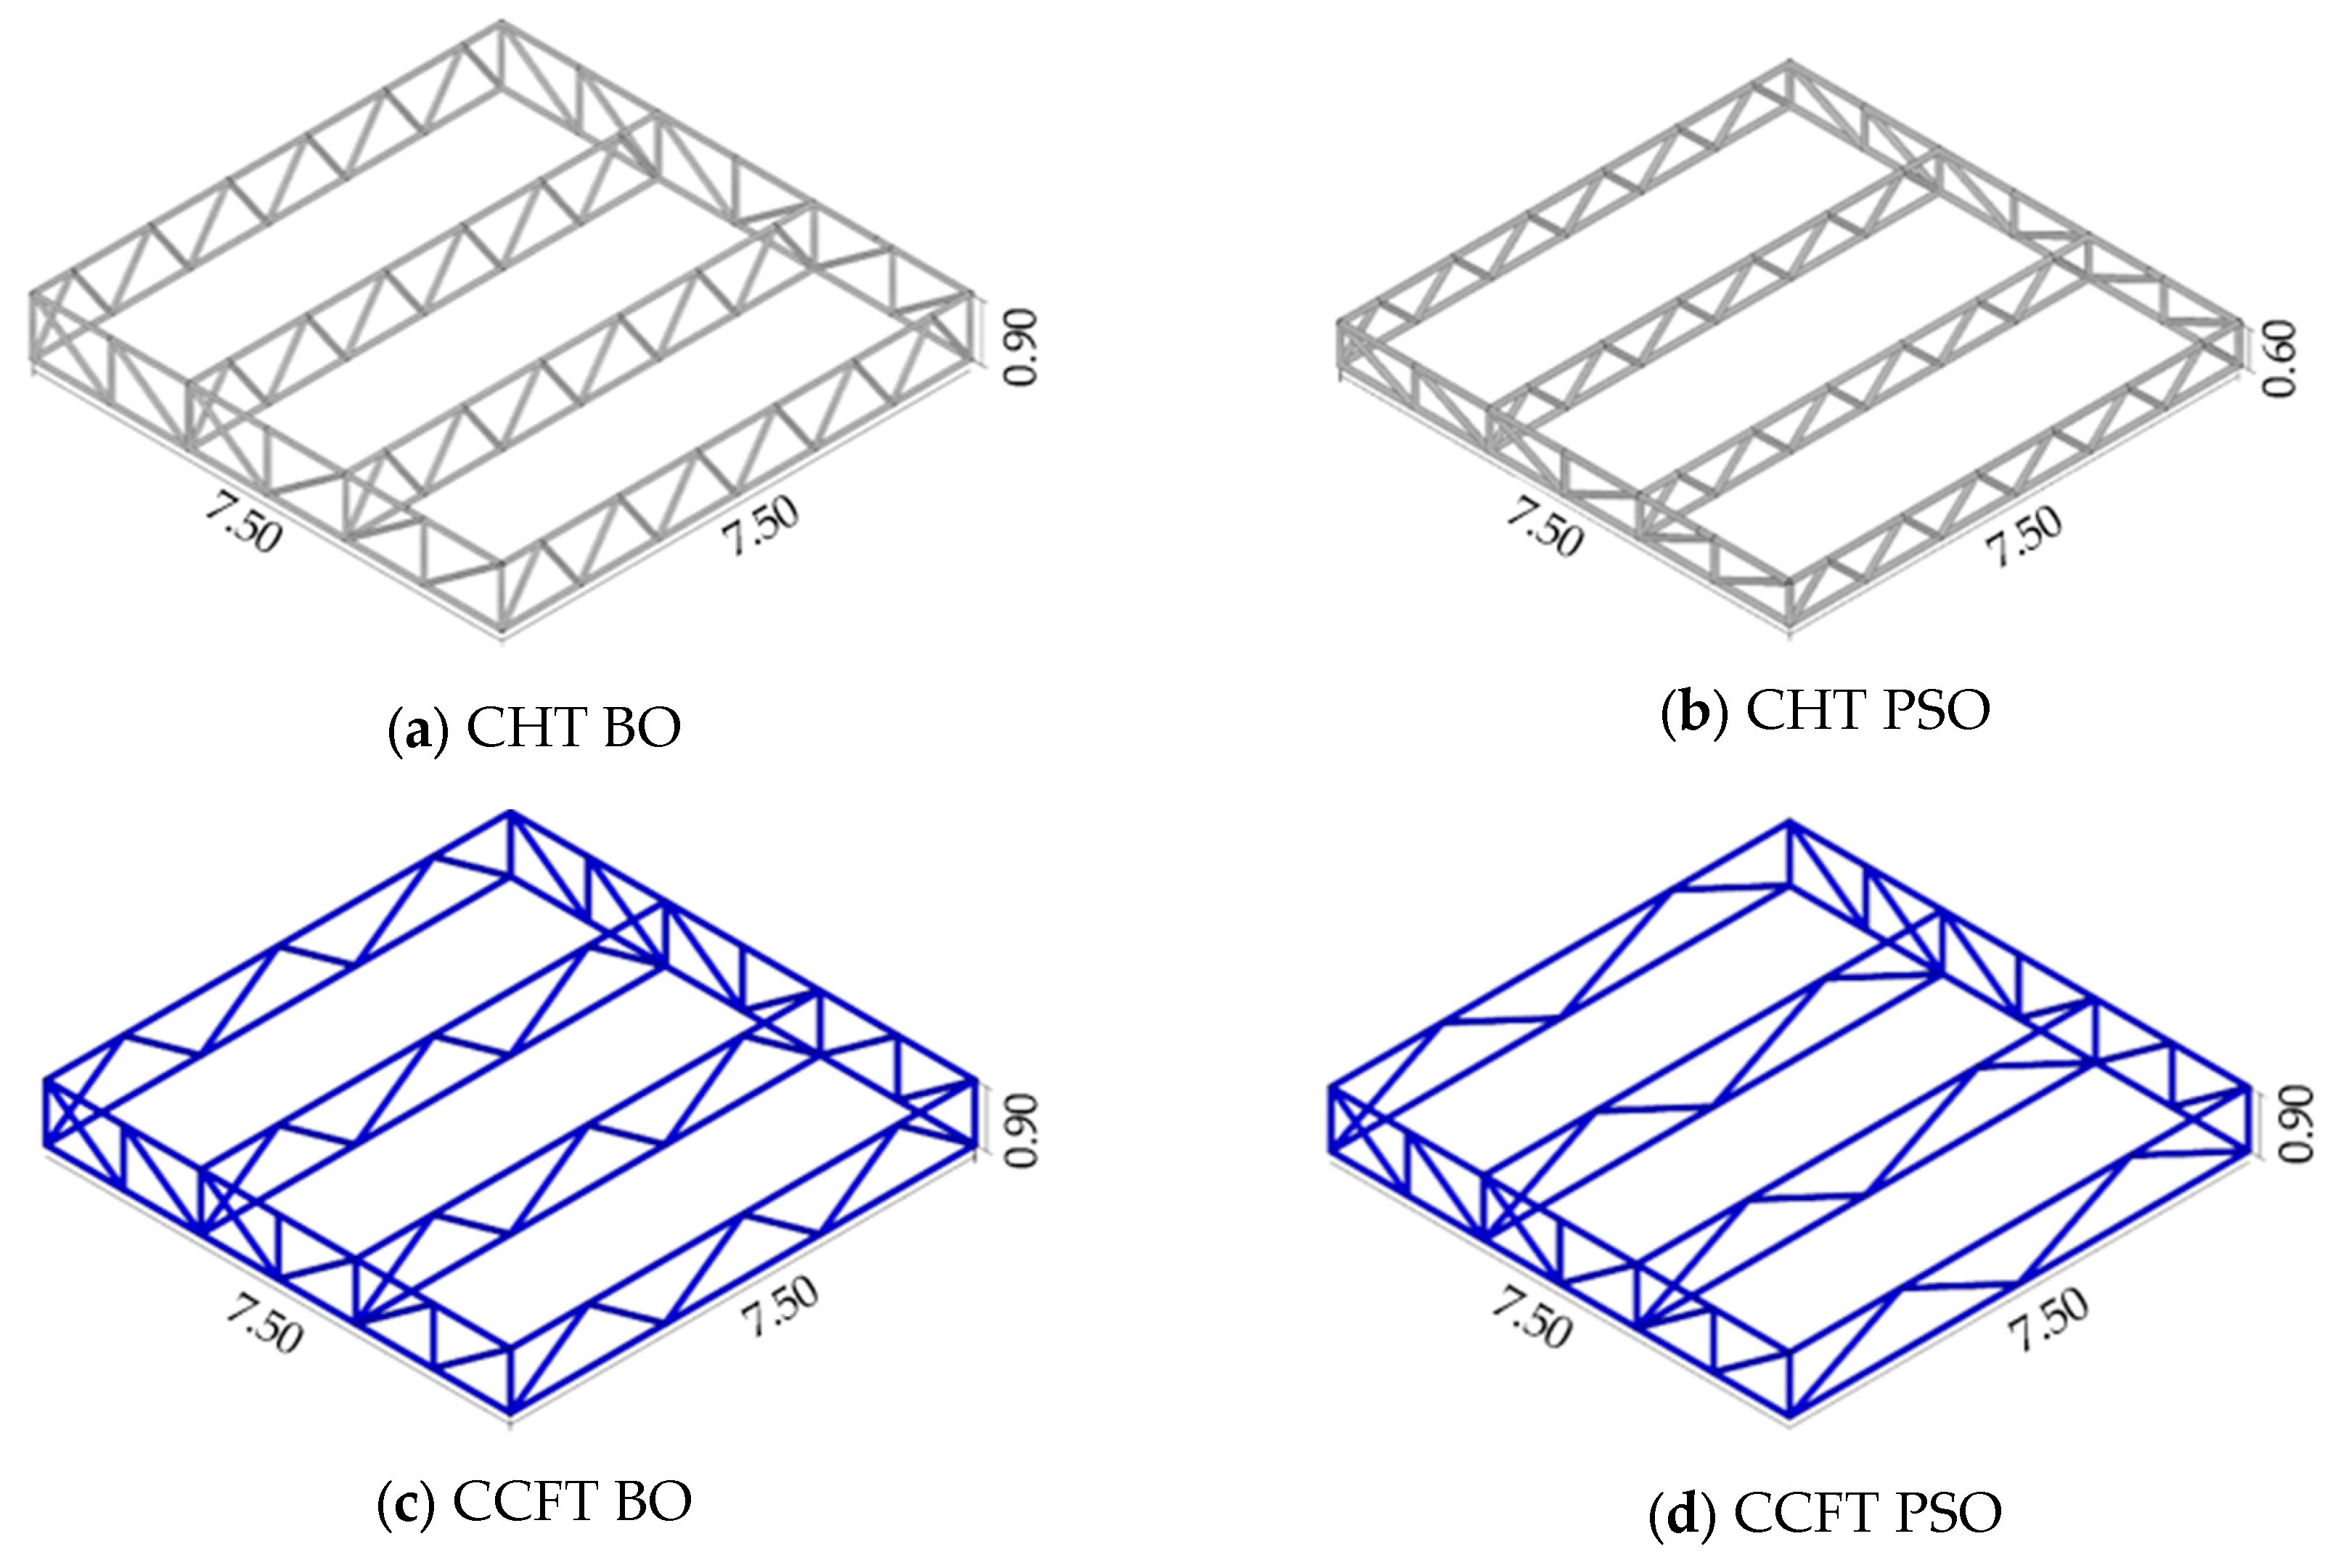
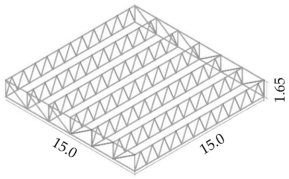
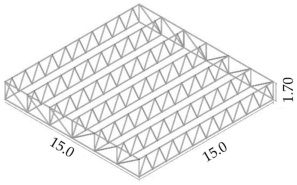
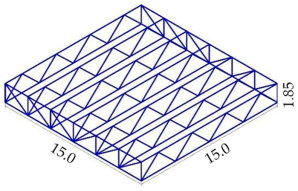
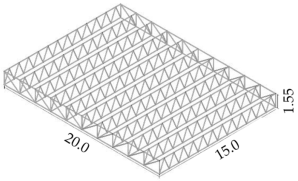
As can be seen in Figure 6, there is a reduction in total CO2 emissions of the floor to all solutions, and the biggest difference was to CCFT trusses, over 22%, and the smallest difference was over 15% to CHT trusses. Figure 7 shows the final topologies found by BO and PSO. This significant difference is due to the fact that, although the truss floor has a greater height than the solid web beam floor, the tubular profiles are relatively lighter than the flange elements that make up the full-web profile and primarily eliminate the web material from the profile, considering the distribution of the bars in the final geometry of the trusses. It is important to note that, for small tubes, the use of lightweight concrete with smaller aggregates is necessary to make execution feasible. Figure 6 shows the final topologies obtained.

3.2. Analysis 02—Parametric Analysis of Composite Floor

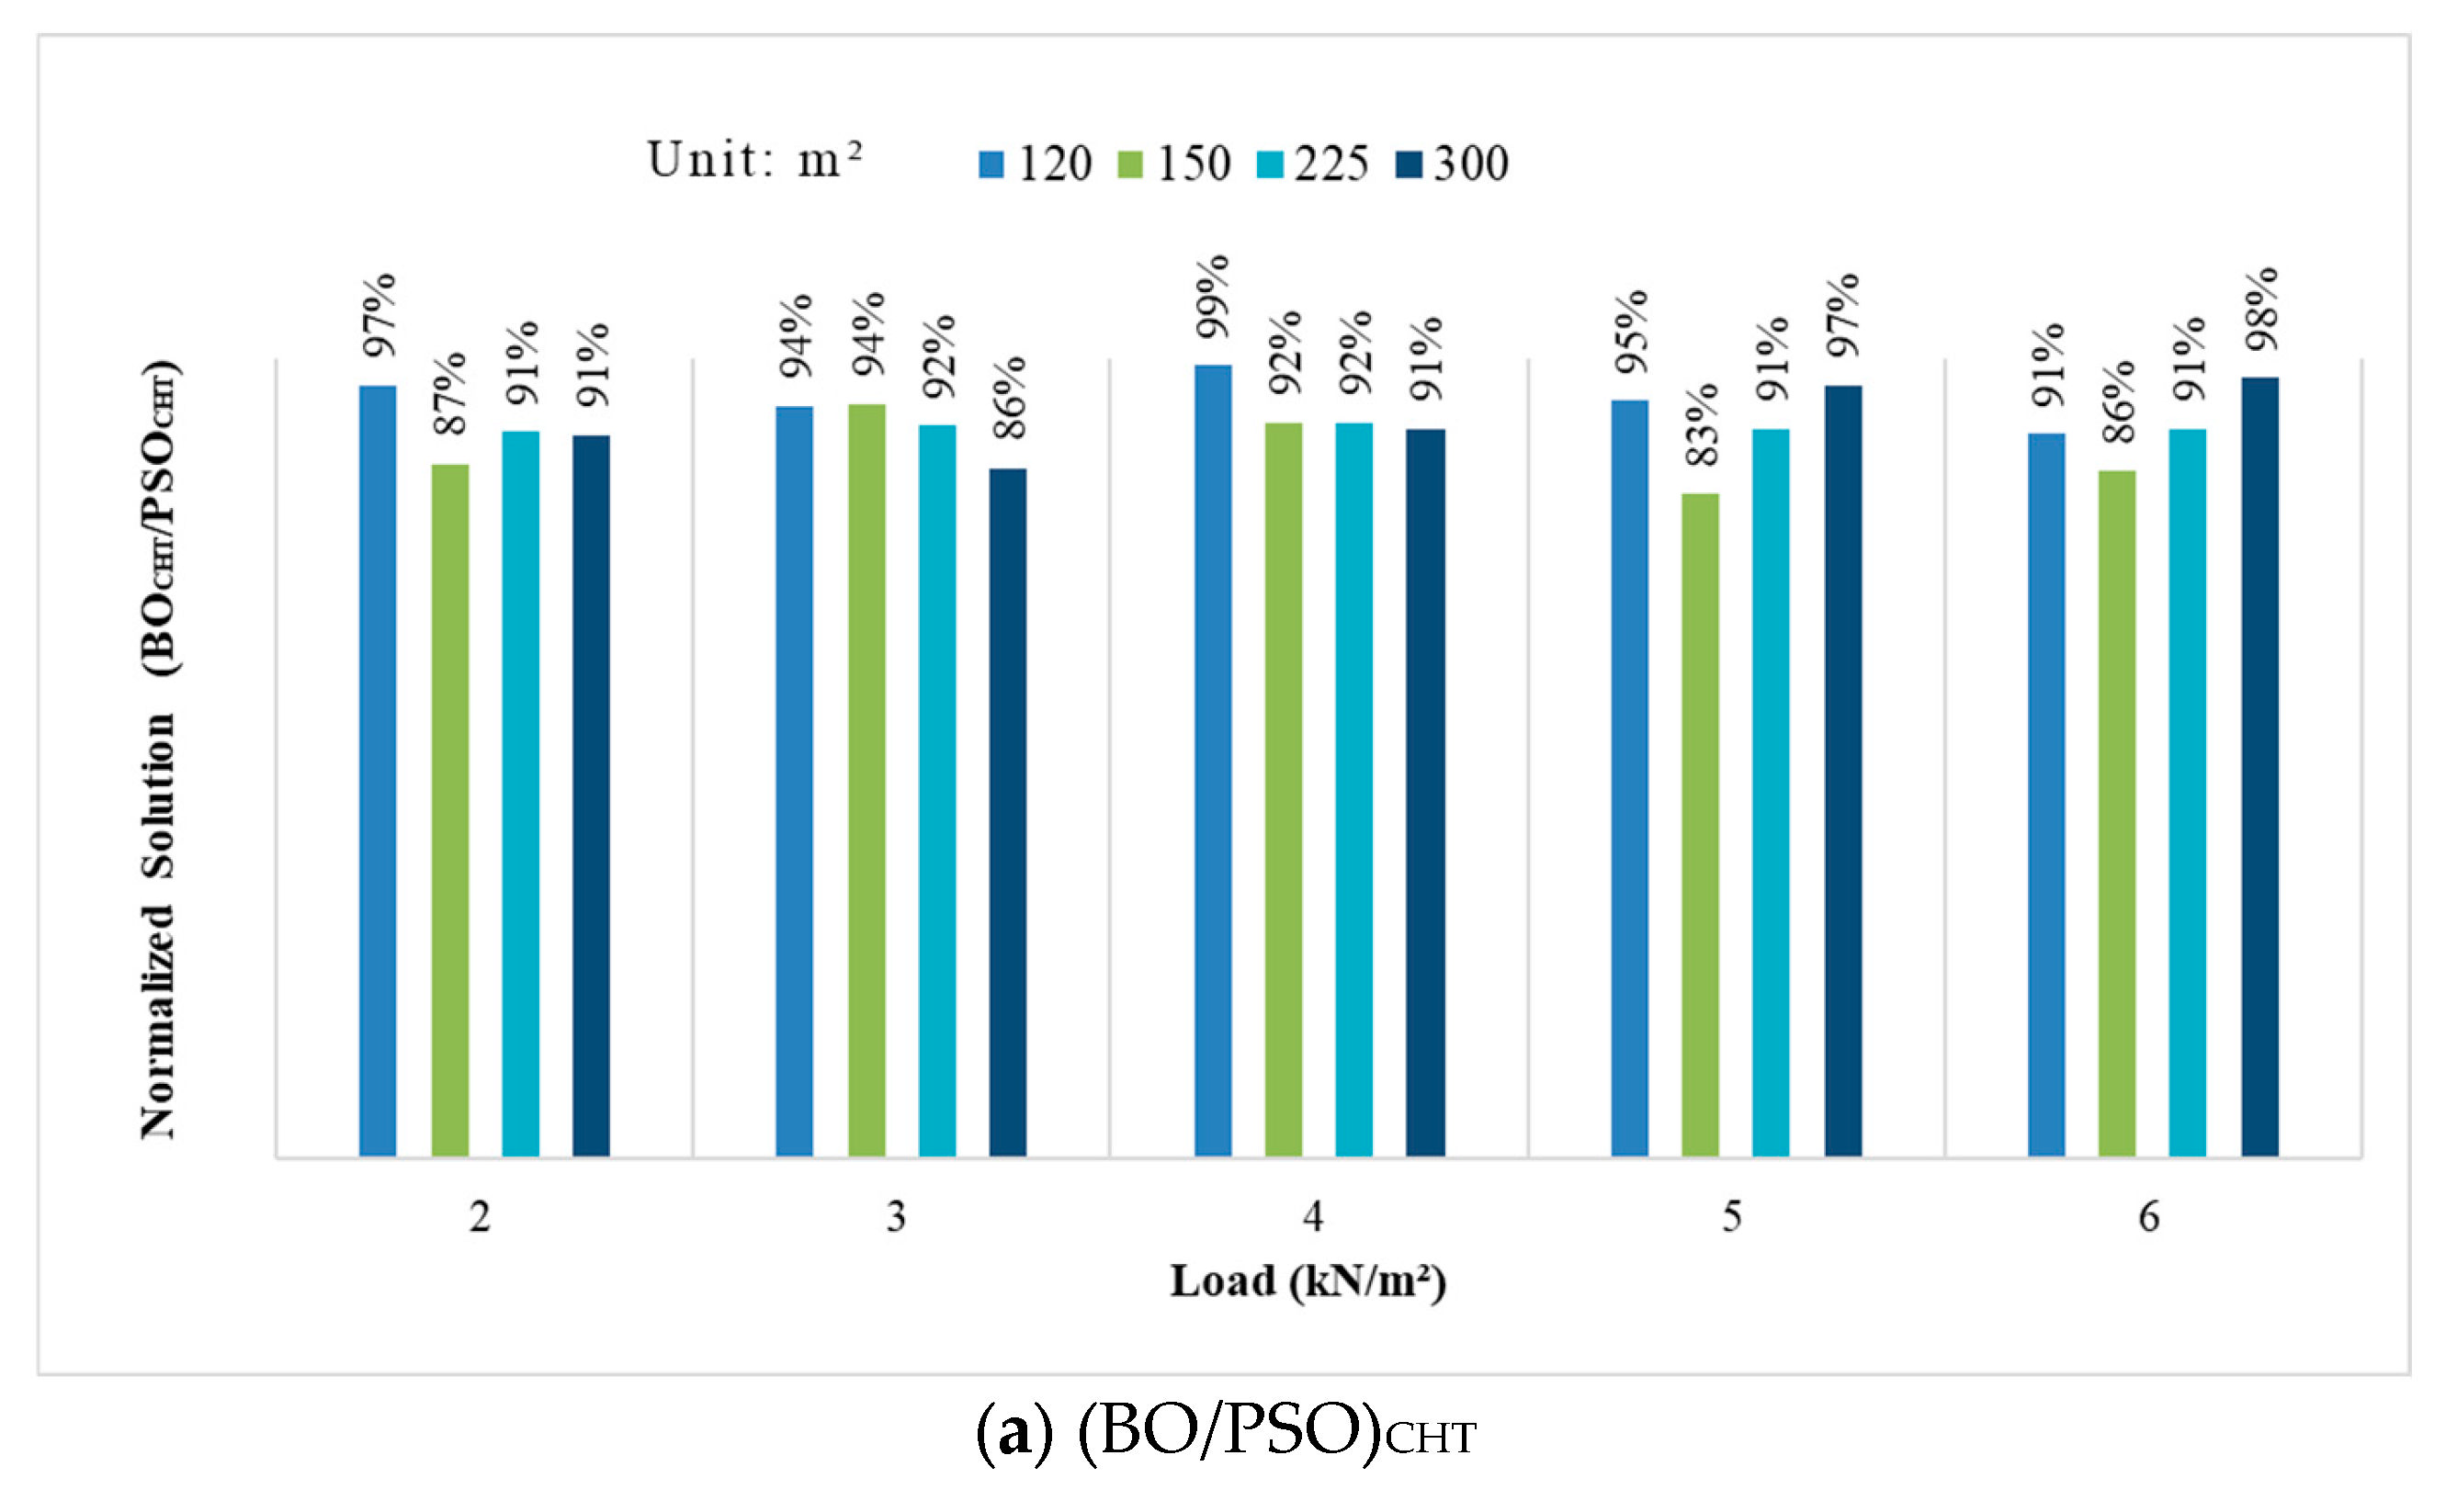
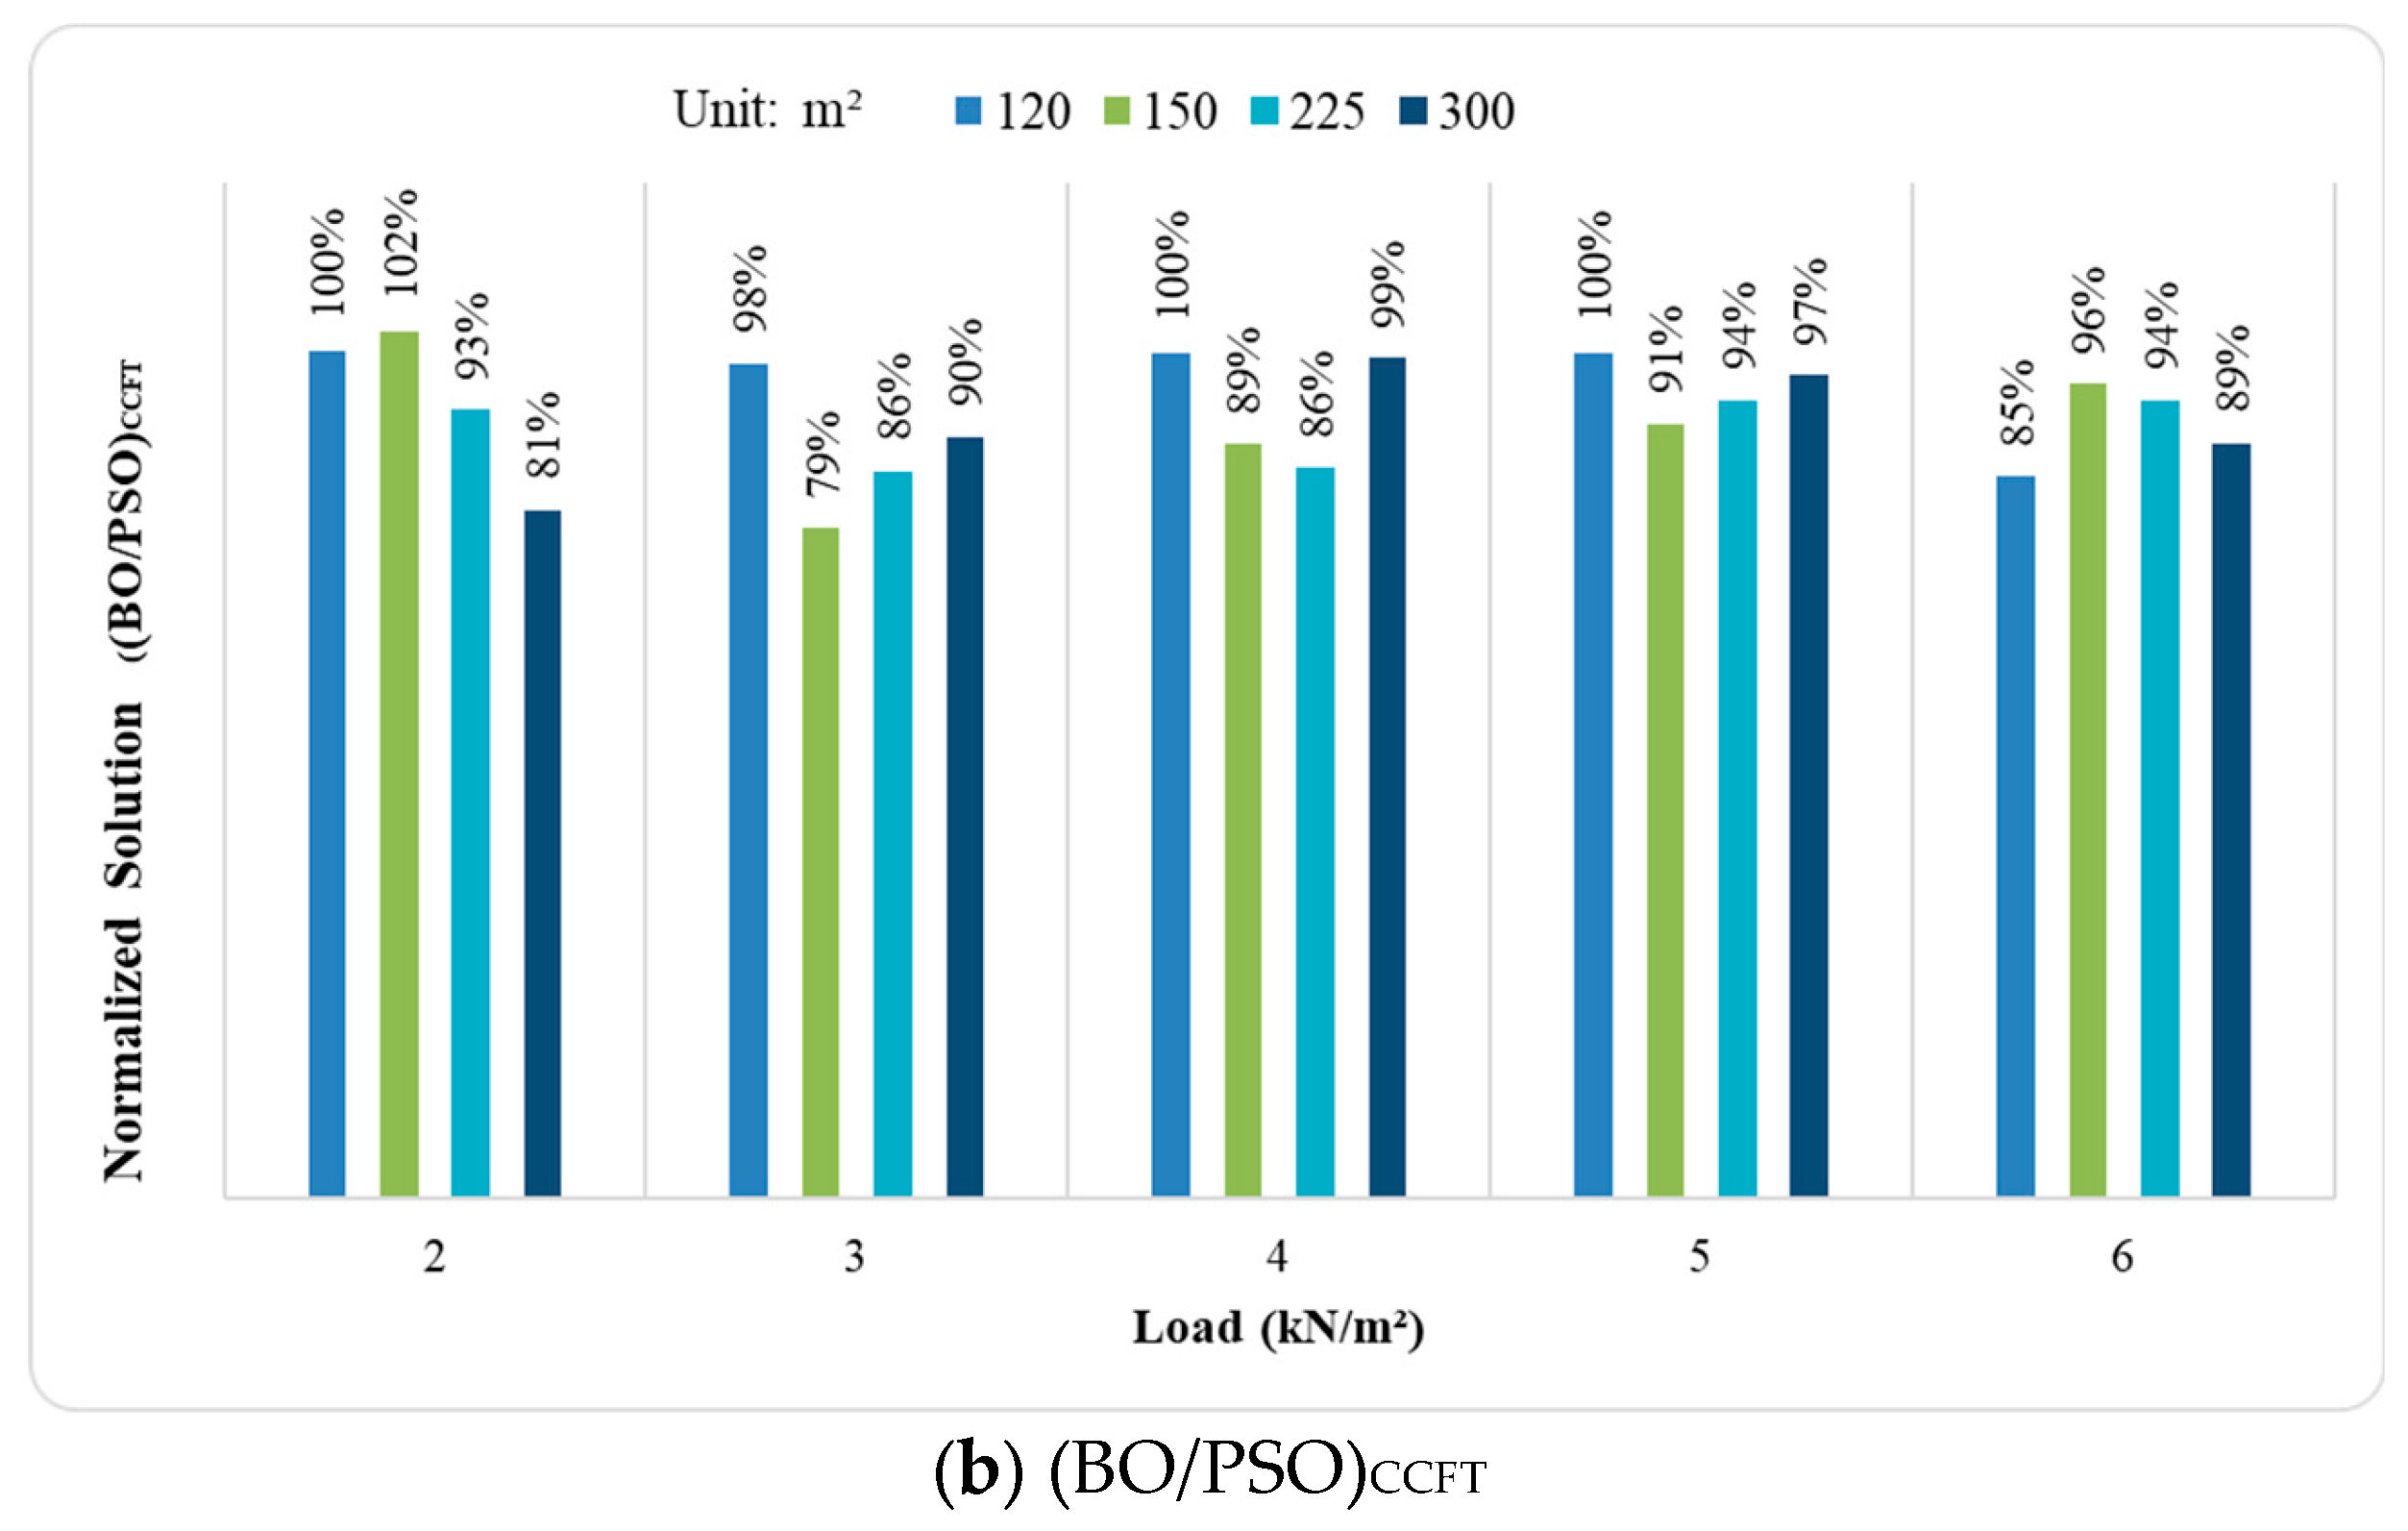
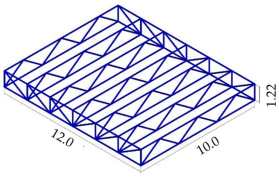
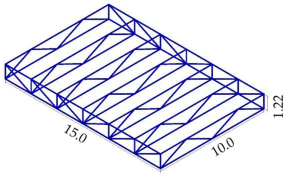
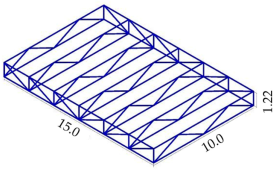
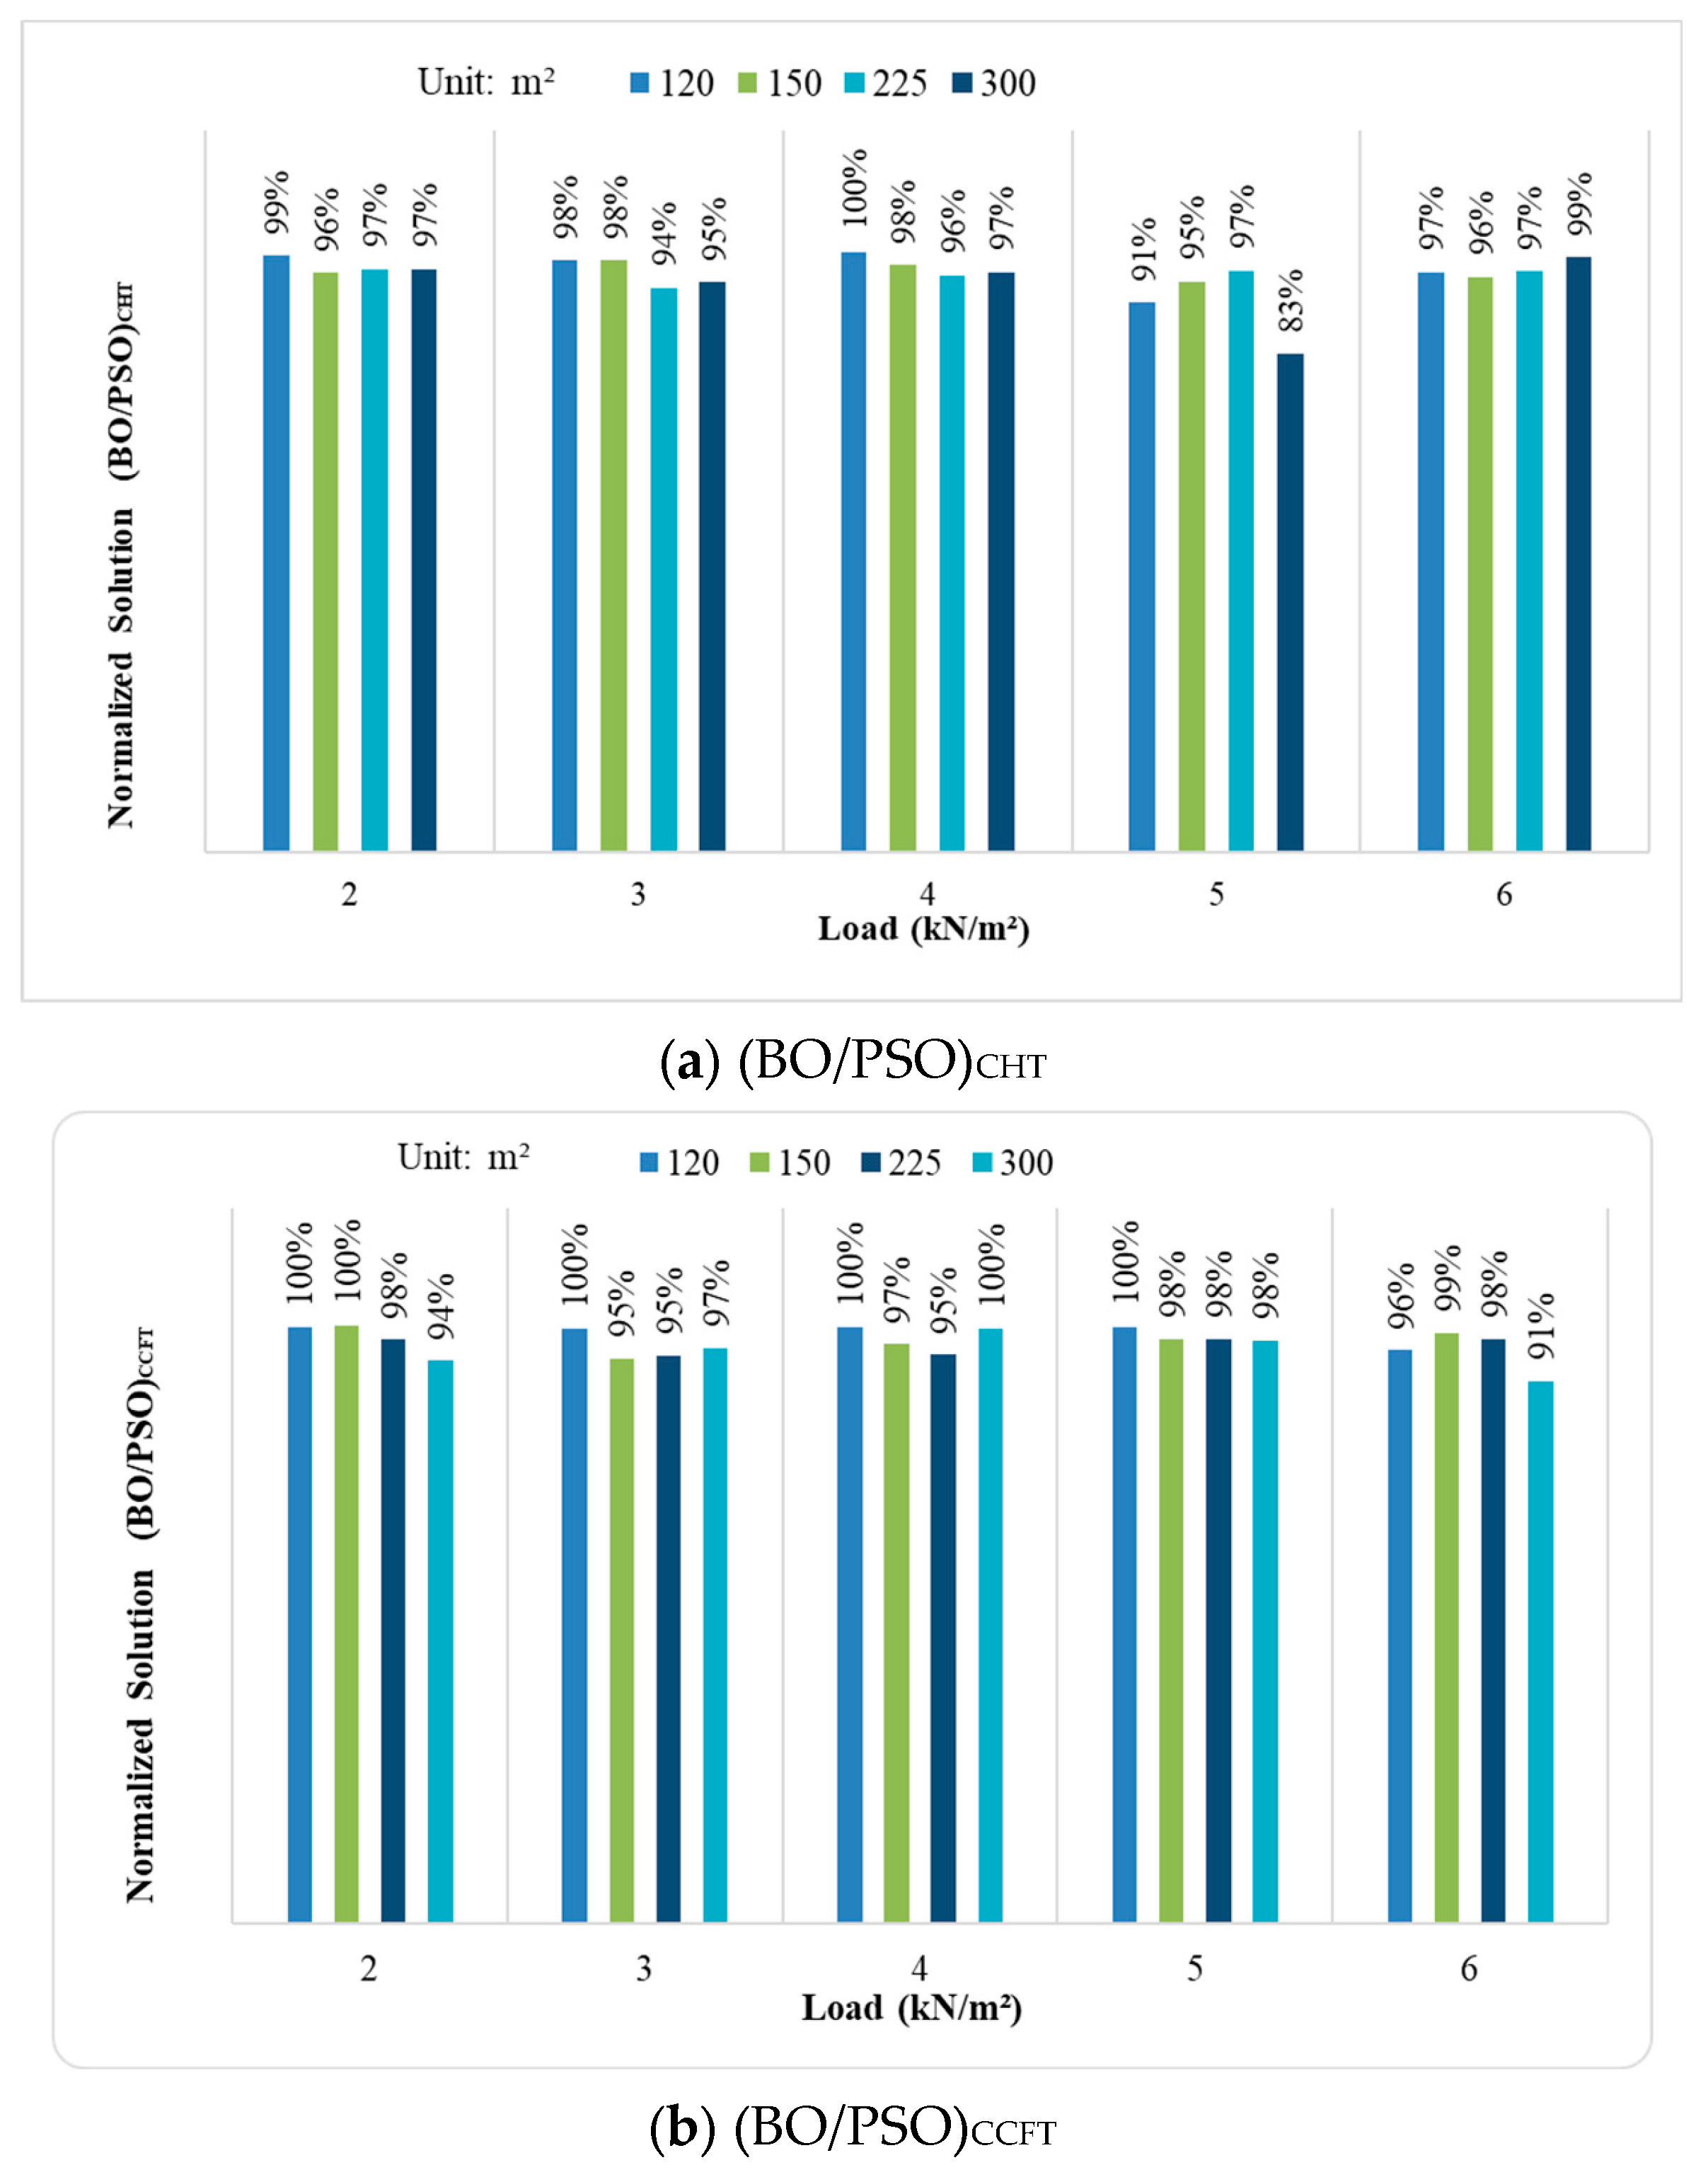
In the second example, a parametric analysis was performed to show the impact of CO2 emissions reductions in different composite floors. In this analysis, the static live load varied from 2.0 kN/m2 to 6.0 kN/m2 with a step of 1.0 kN/m2, the dead load of 0.78 kN/m2, and the self-weight of the structure. The floor dimensions adopted were 12 m × 10 m, 15 m × 10 m, 15 m × 15 m, and 20 m × 15 m. Table 5 and Table 6 present the metrics for floor simulations of both optimization algorithms. As observed across all scenarios, the standard deviation was relatively low, ranging from 2.1% for the 300 m2 floor, 6 kN/m2 load, and filled pipes to 8.6% for the 225 m2 floor, 2 kN/m2 load, and hollow tubes. Figure 8 presents the solution ratio between BO and PSO.
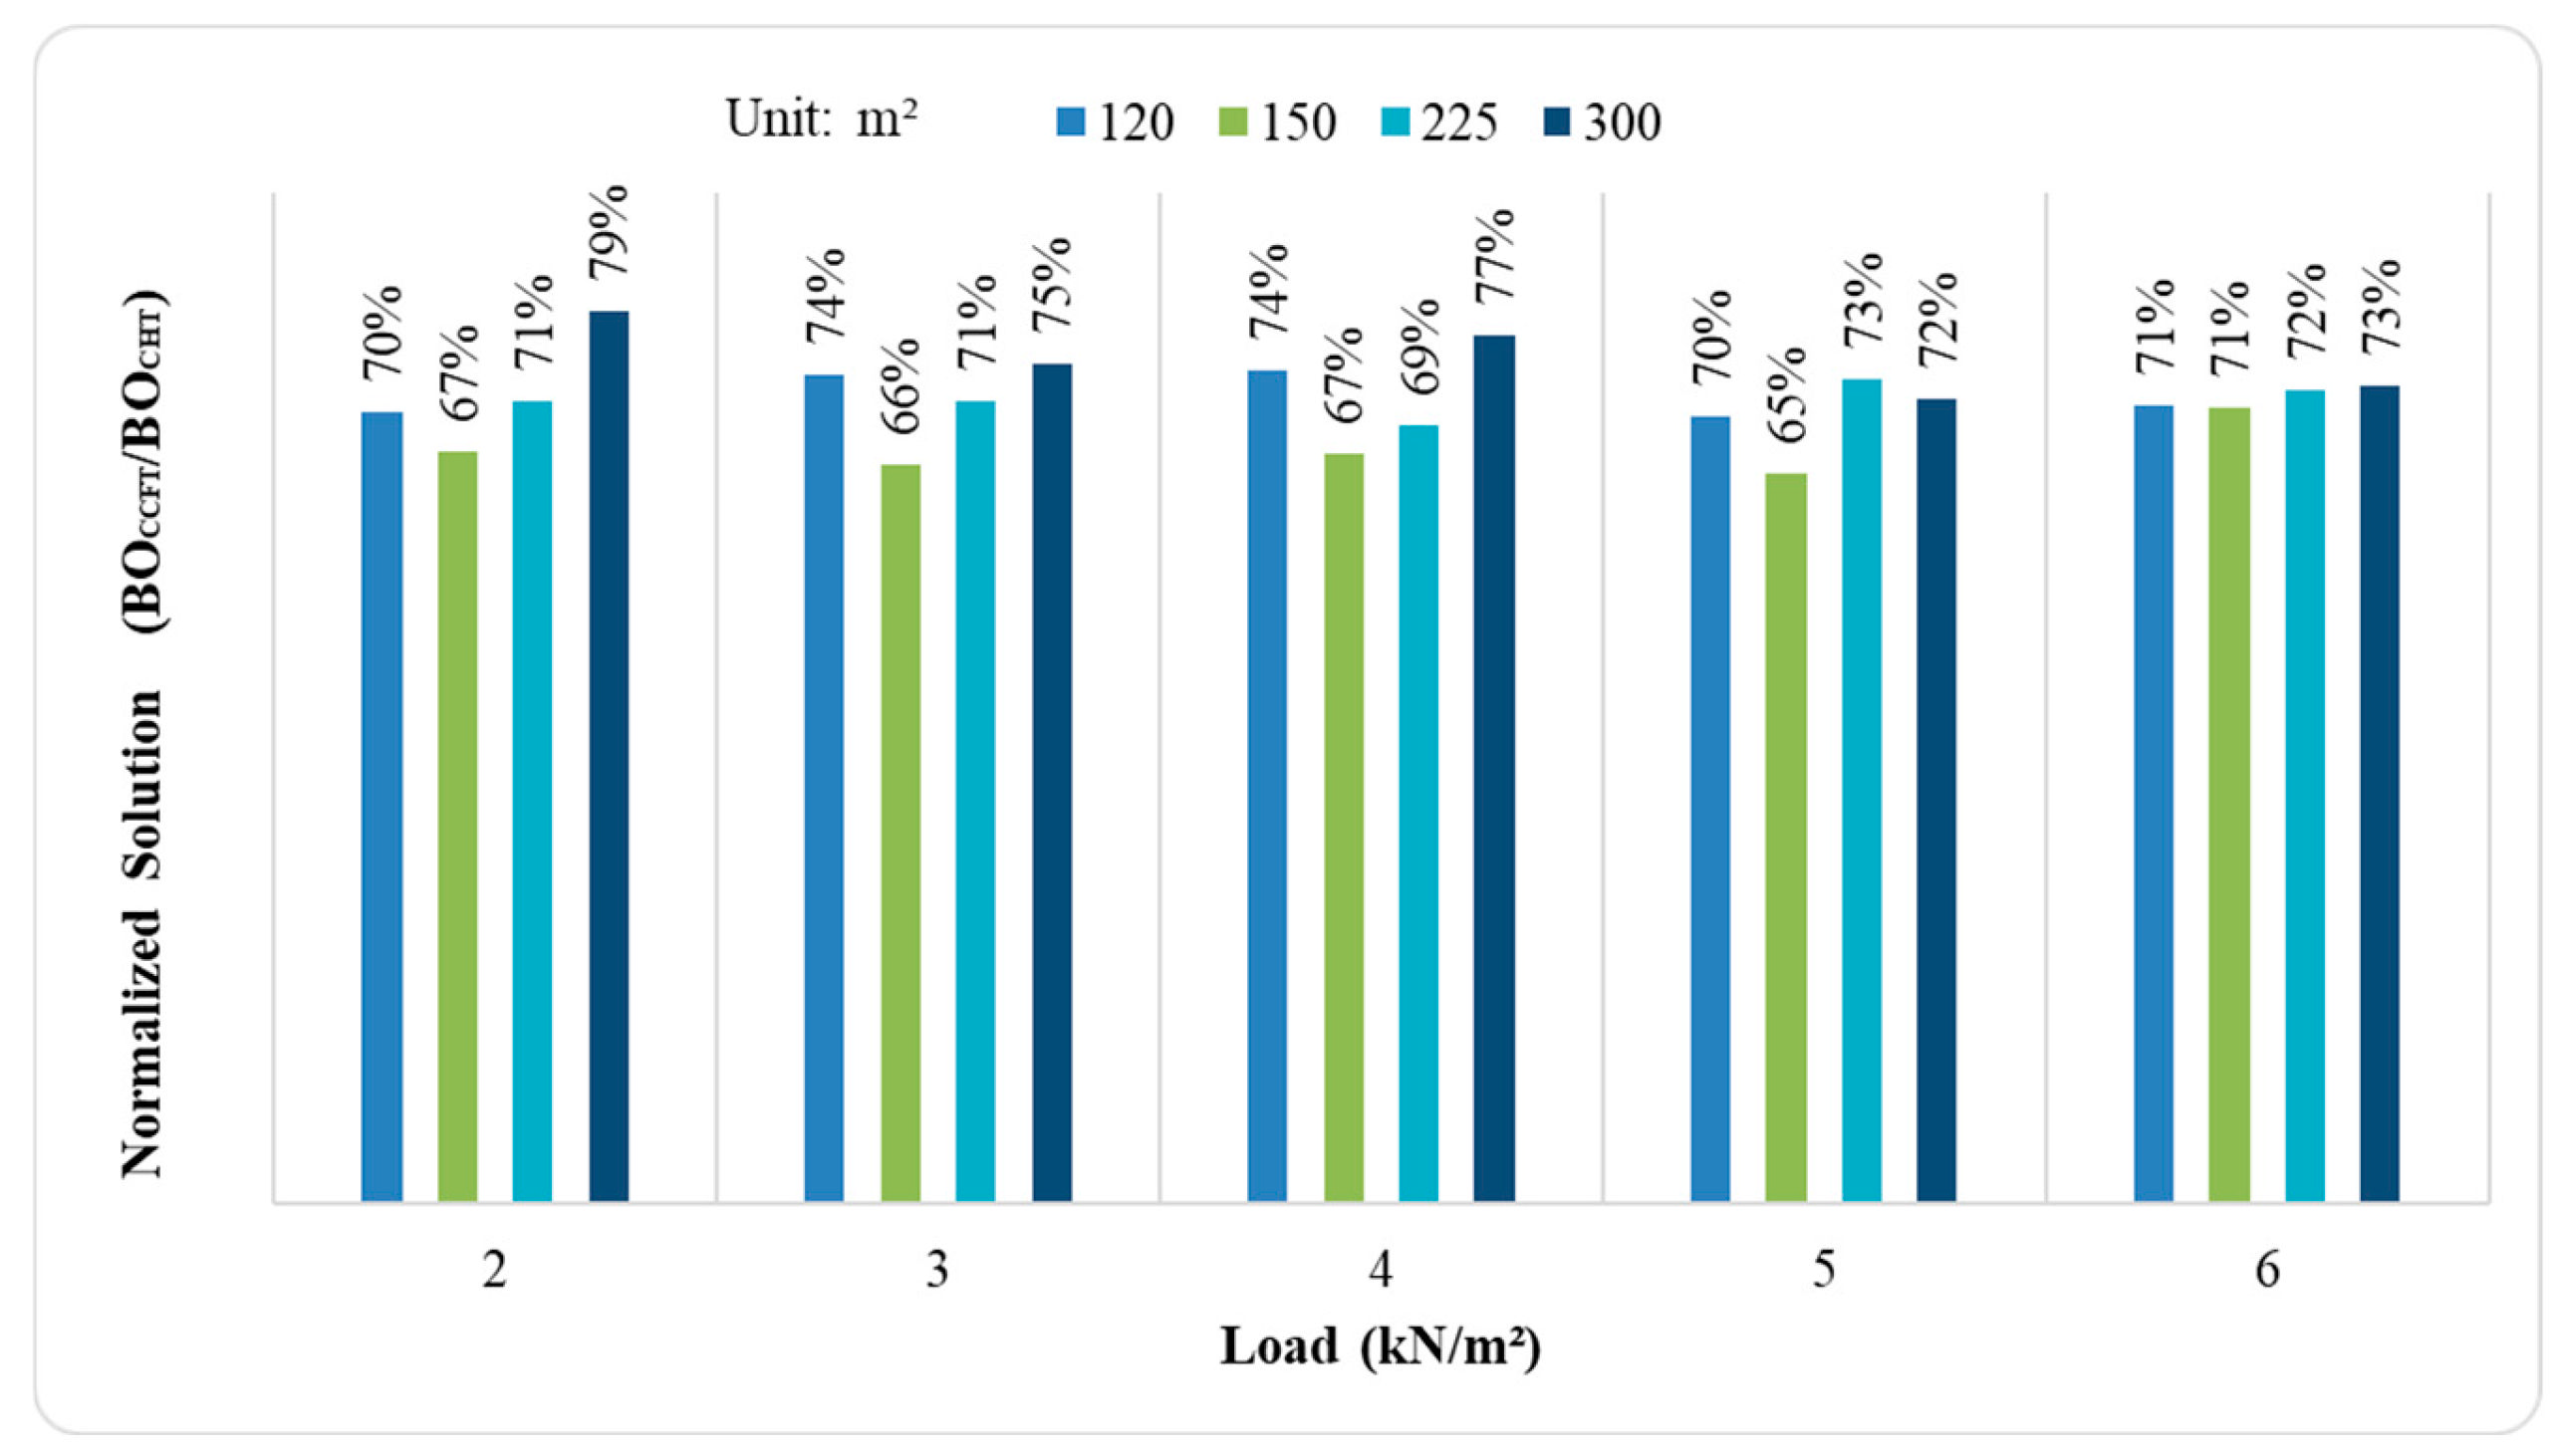
As can be observed in both situations, BO found the best solutions when compared with PSO. For CHT trusses, the maximum difference was to the floor 15 m × 15 m and live load of 5 kN/m2 with 17% difference. To CCFT trusses, the maximum difference was to the floor 10 m × 15 m with a live load of 3 kN/m2, with 21% difference. Figure 9 presents the ratio of the best solution for the CHT and CCFT trusses given by BO.
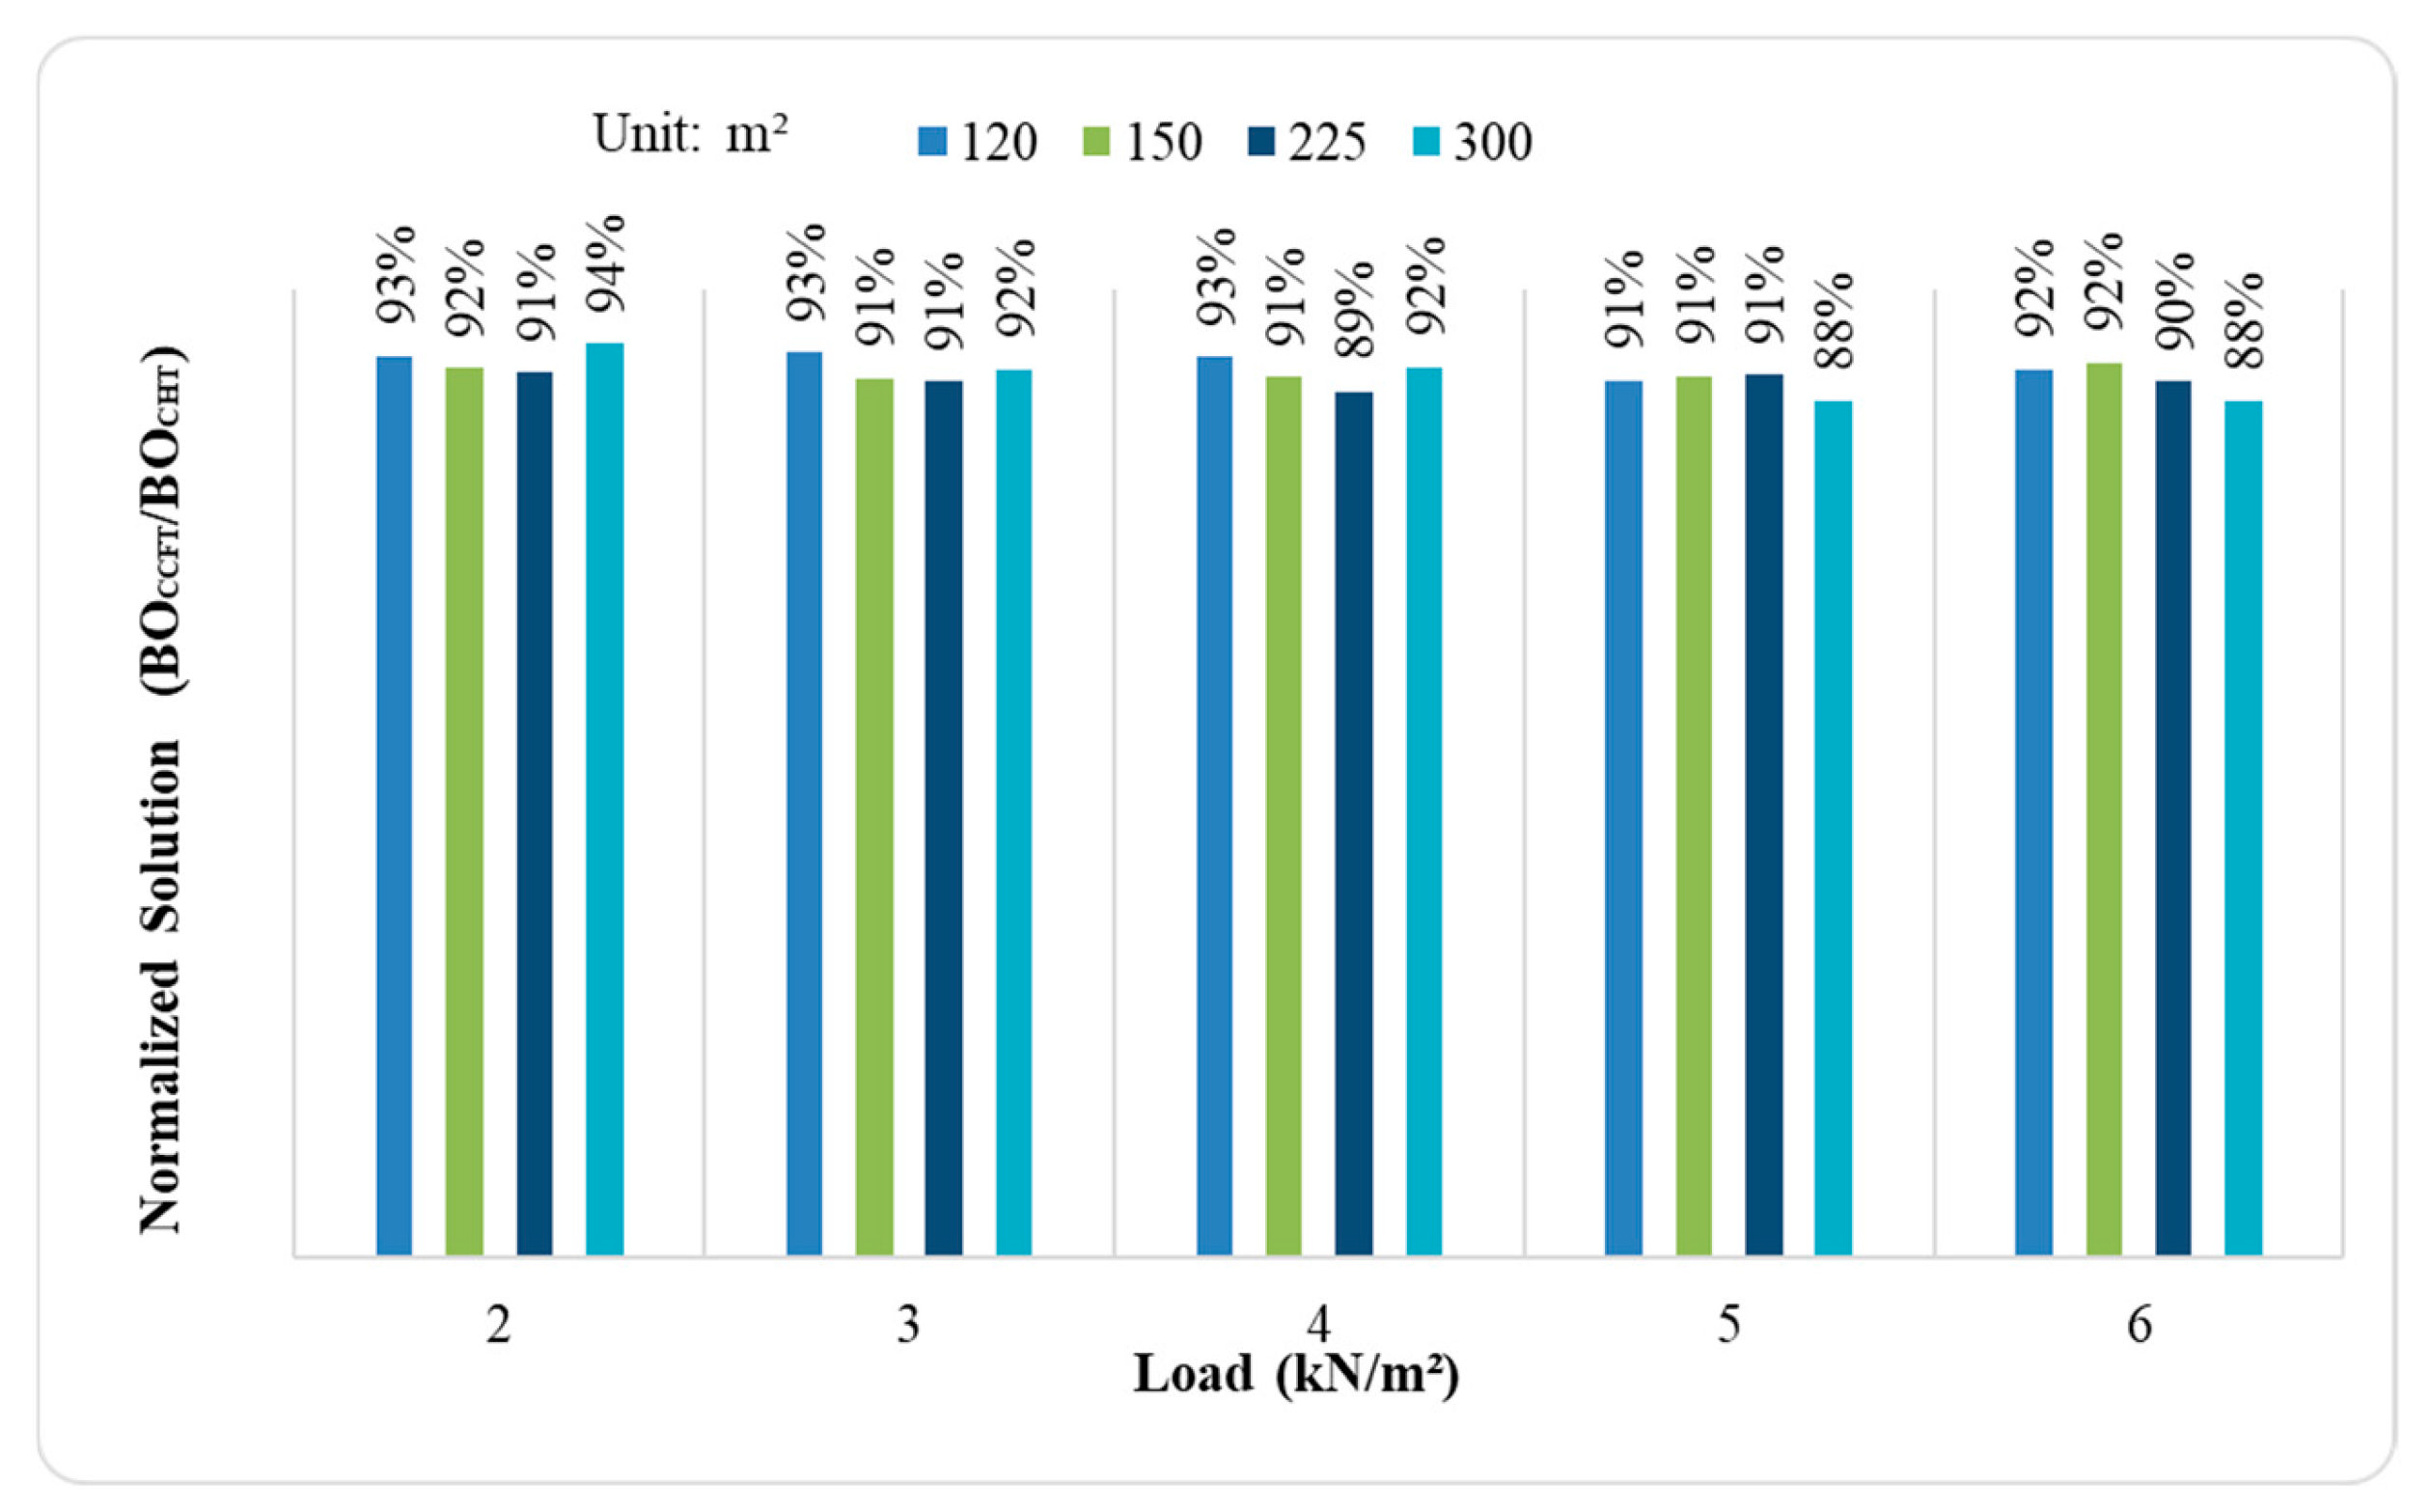
When comparing the best solutions found by BO with CHT and CCFT trusses, a reduction in steel consumption across all analyzed floors is observed. The maximum reduction was to the floor area of 10 m × 15 m, with a value of 35%. Similarly, the reduction in the floor’s total CO2 emissions was analyzed. Figure 10 presents the ratio between BO and PSO for the CHT and CCFT trusses, and Figure 11 presents the ratio solution for the best solution given by BO.
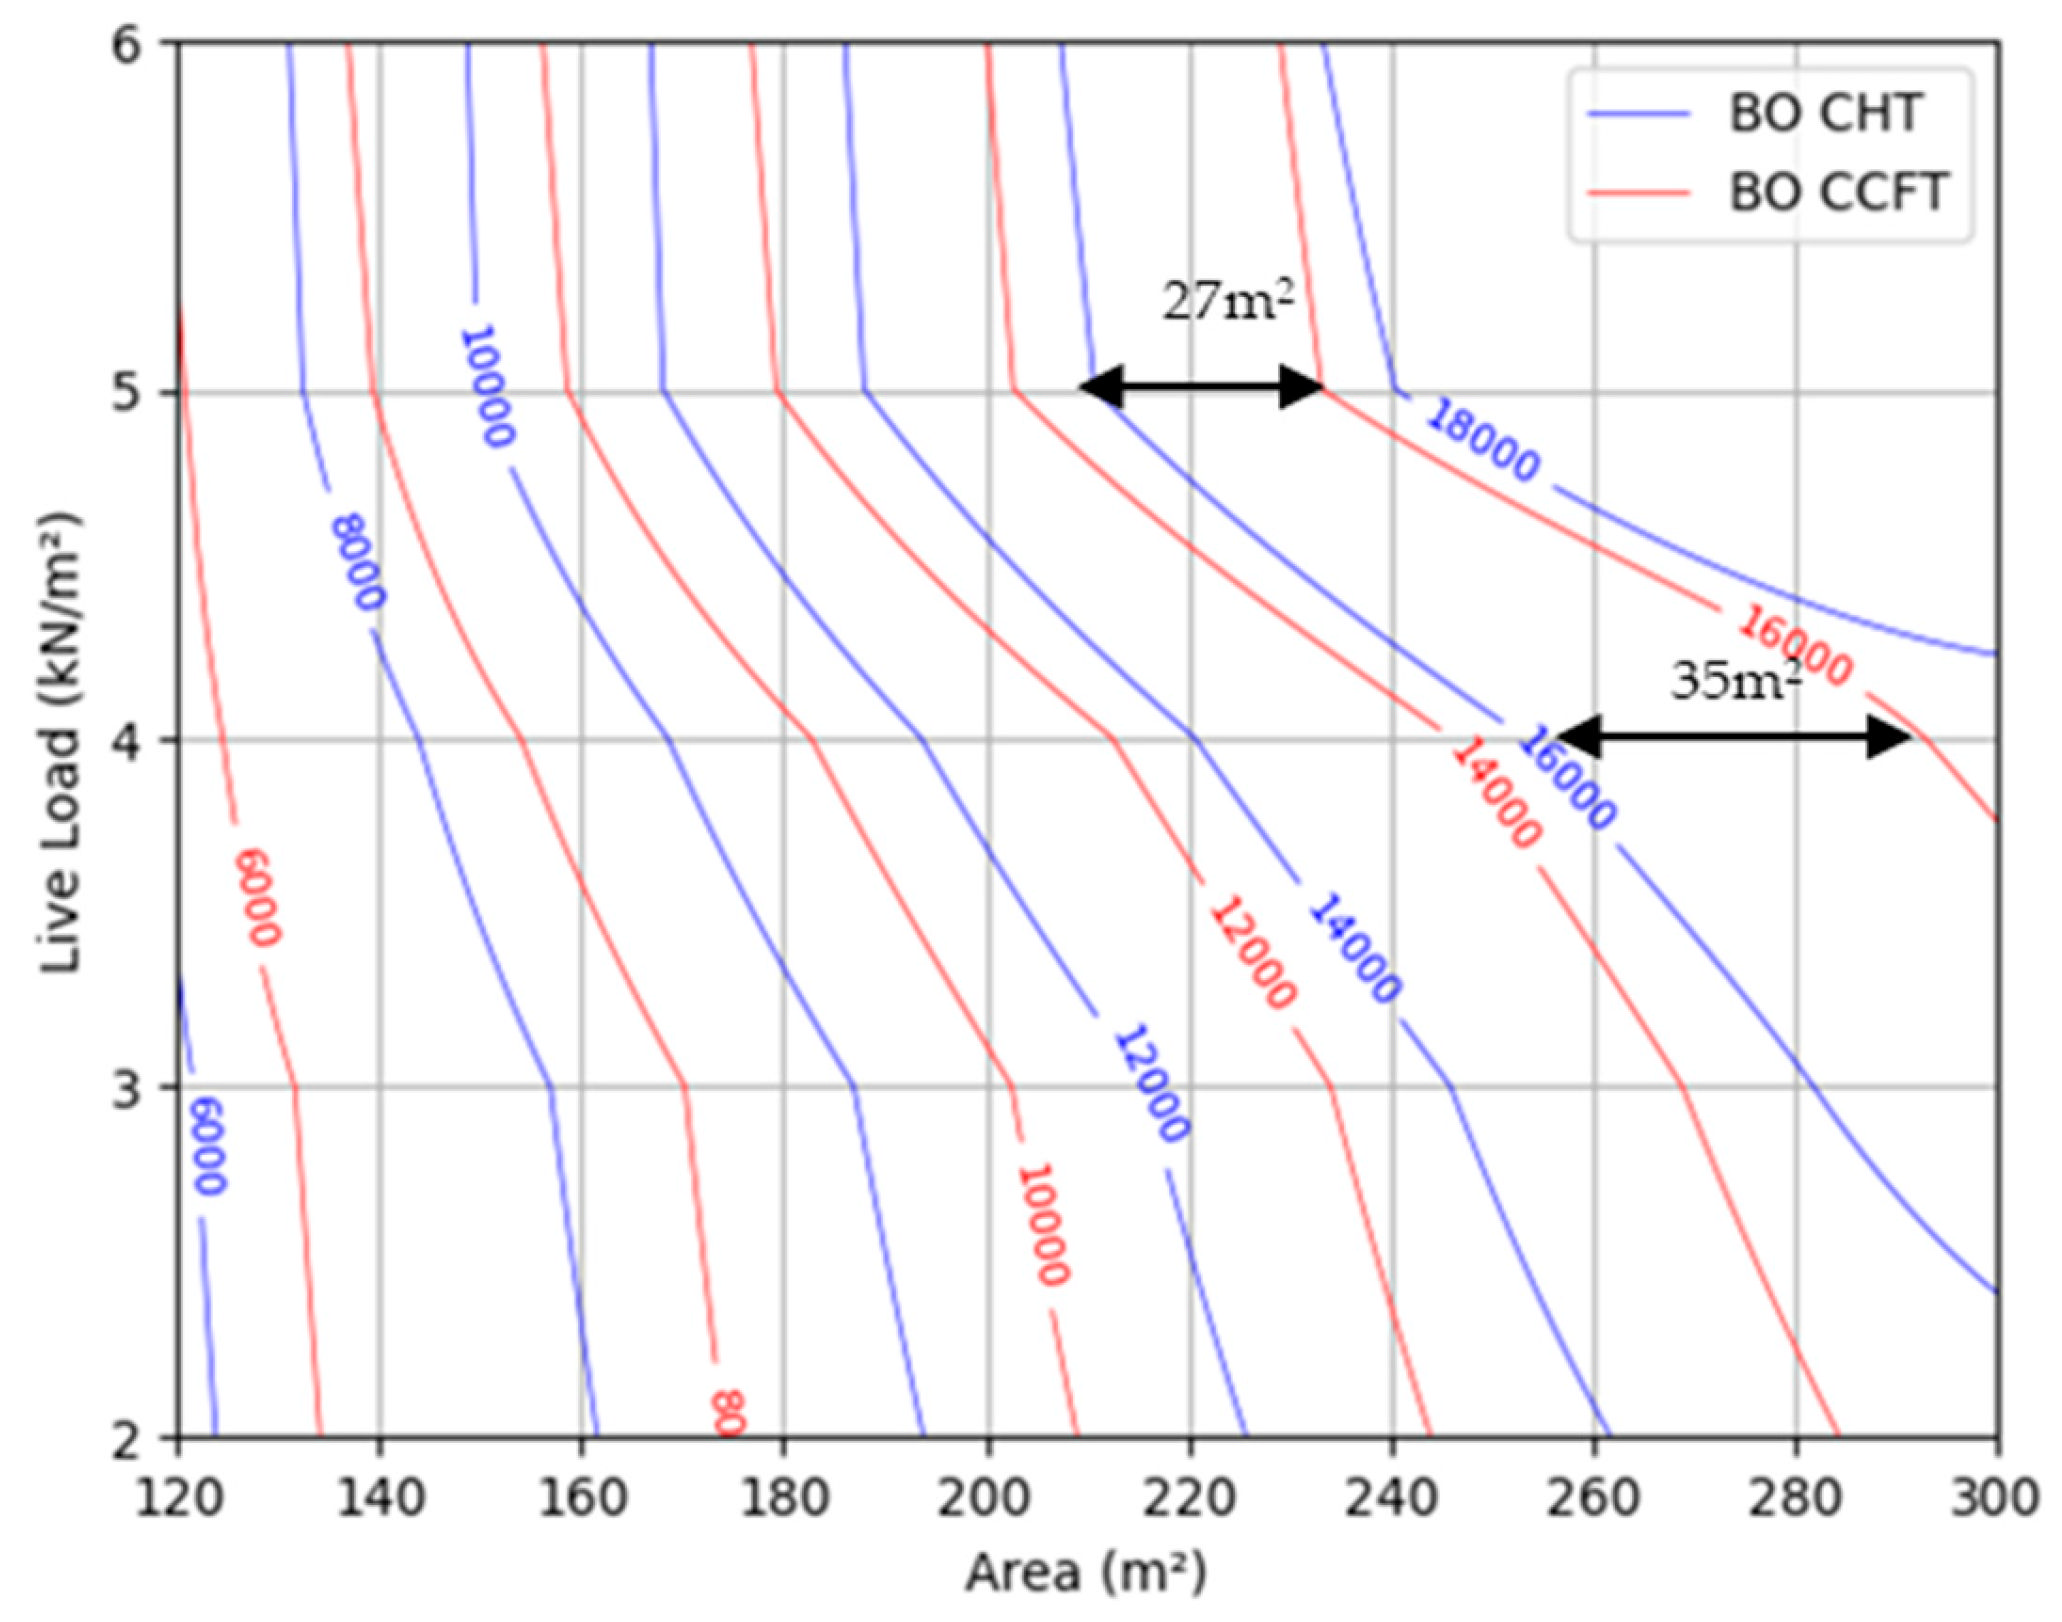
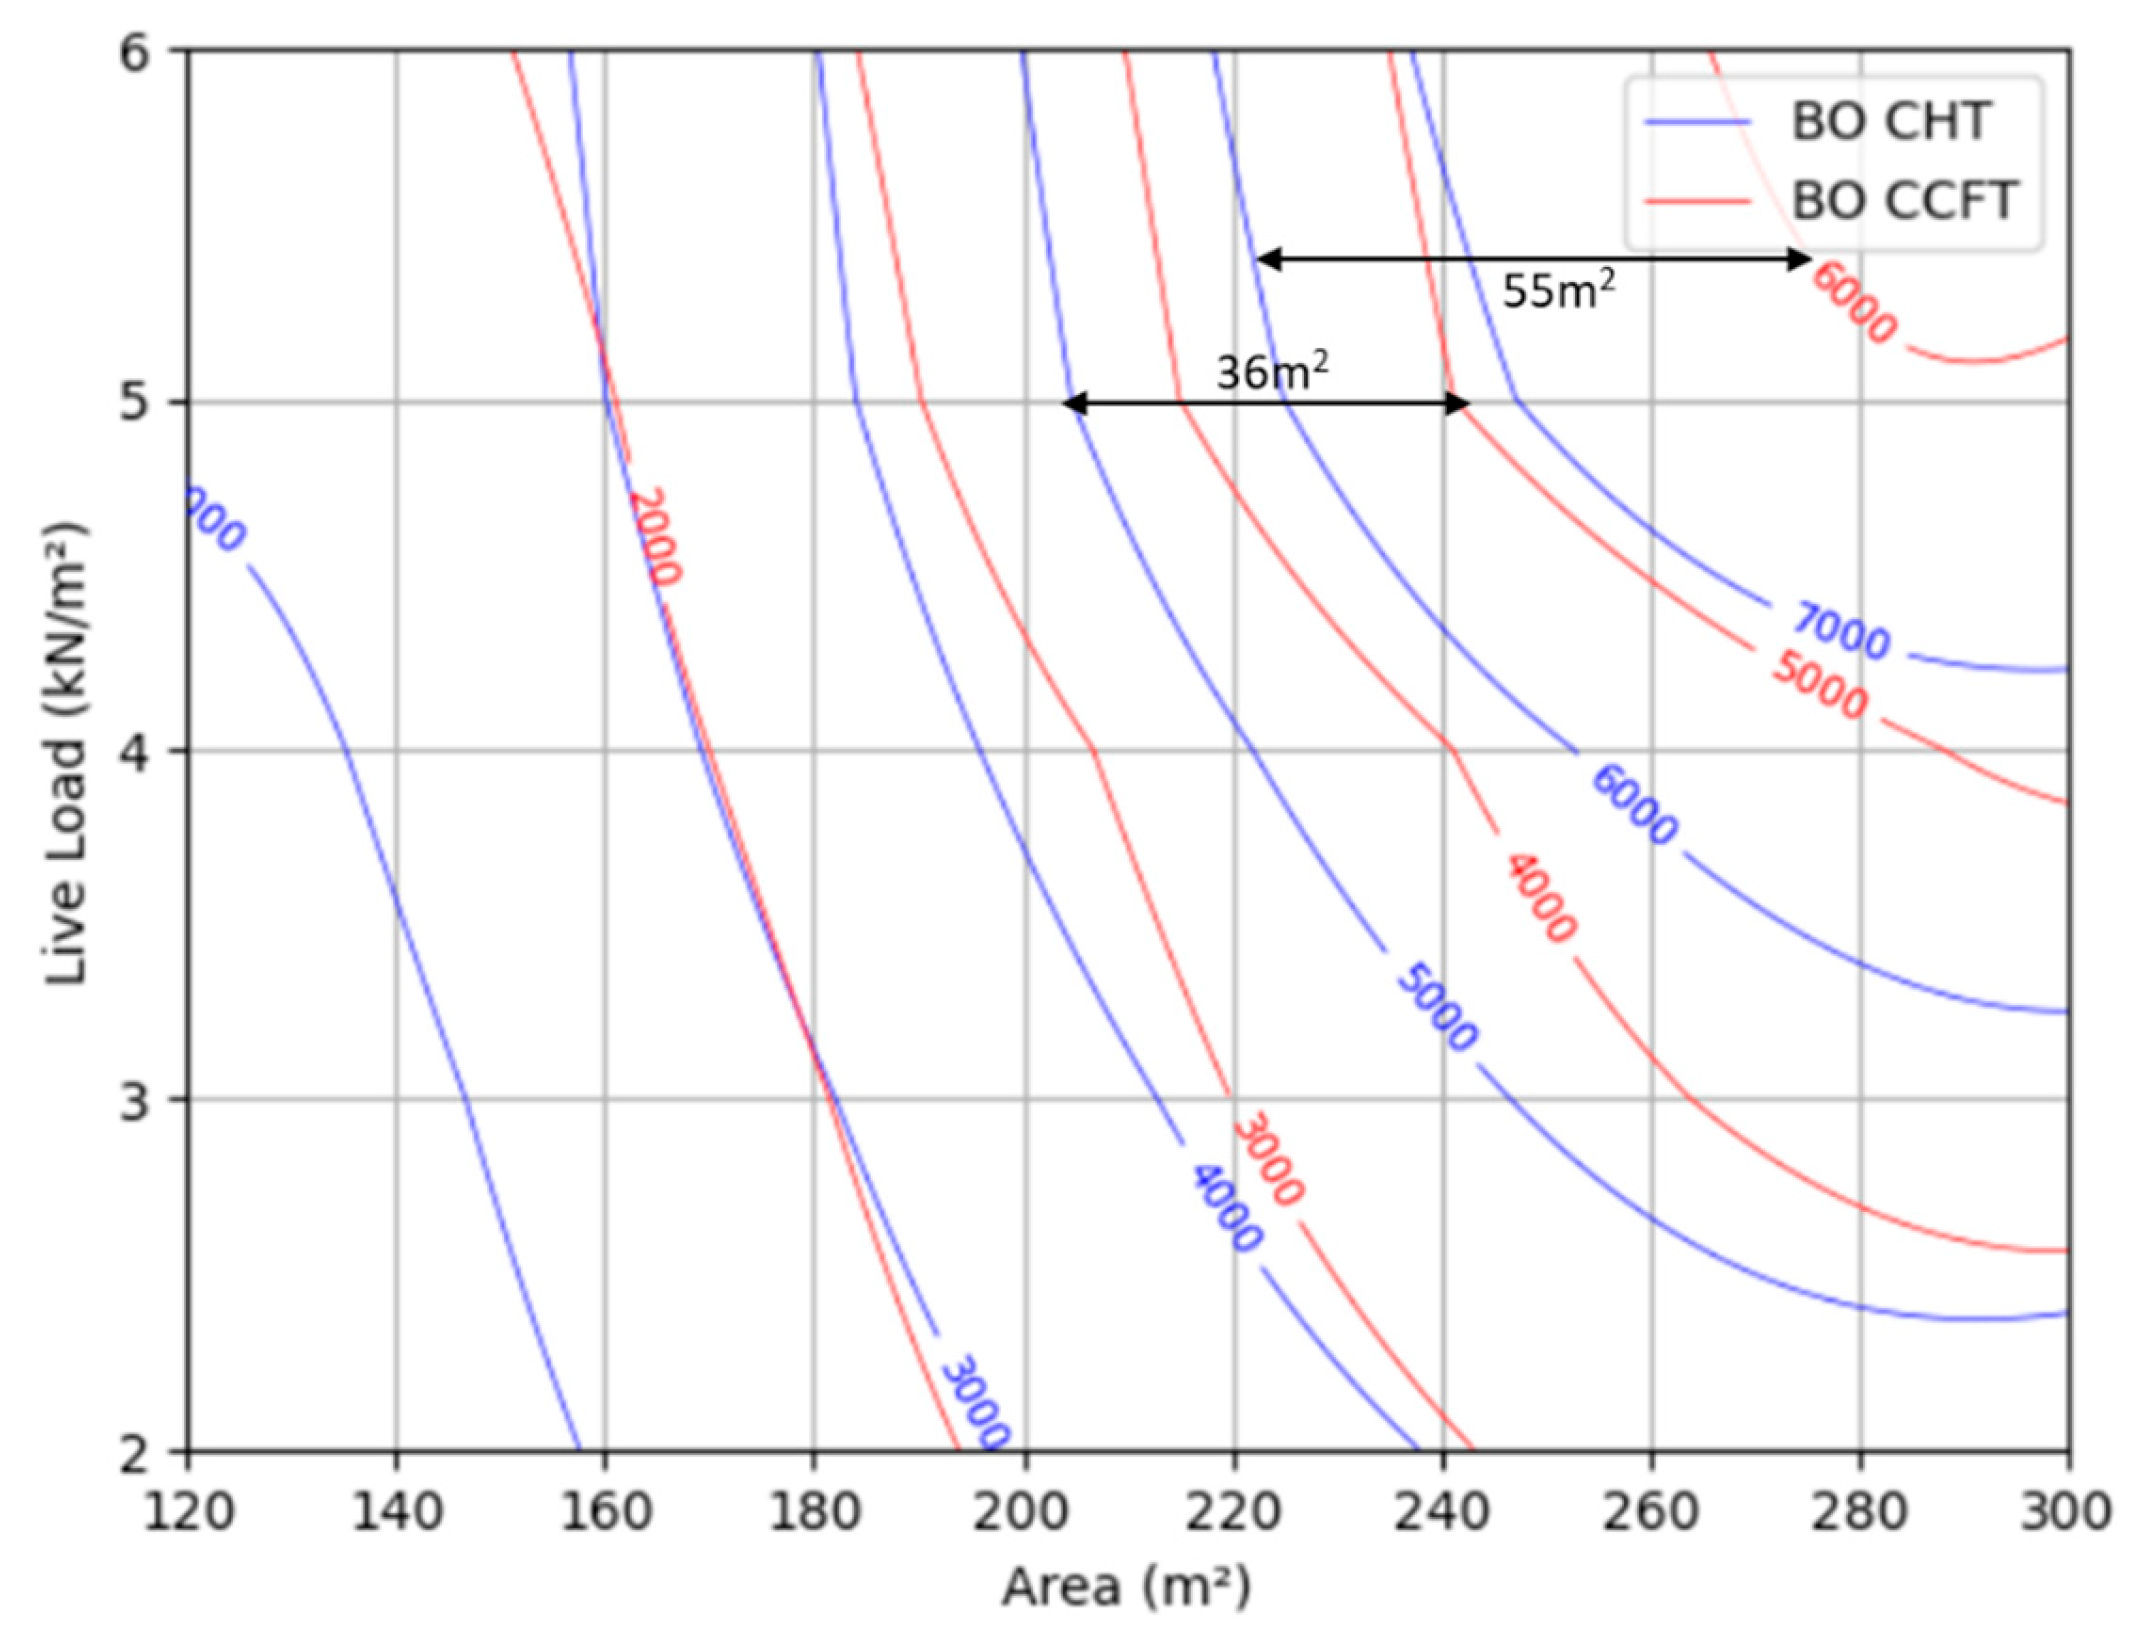
When analyzing the total CO2 emission reduction, BO identified the best solution relative to PSO. The maximum difference was 17% from floor 15 m × 15 m to the trusses with unfilled tubes, with a live load of 5 kN/m2, and 9% from floor 20 m × 15 m to the trusses, with a live load of 6 kN/m2. When comparing the solution for trusses with filled tubes, the maximum reduction is 12% for the 20 m × 15 m floor under live loads of 5 kN/m2 and 6 kN/m2. Figure 12 and Figure 13 present the isolines of steel CO2 emissions and total CO2 emissions distributions for each floor, comparing the best solutions of CHT and CCFT obtained via BO, respectively.
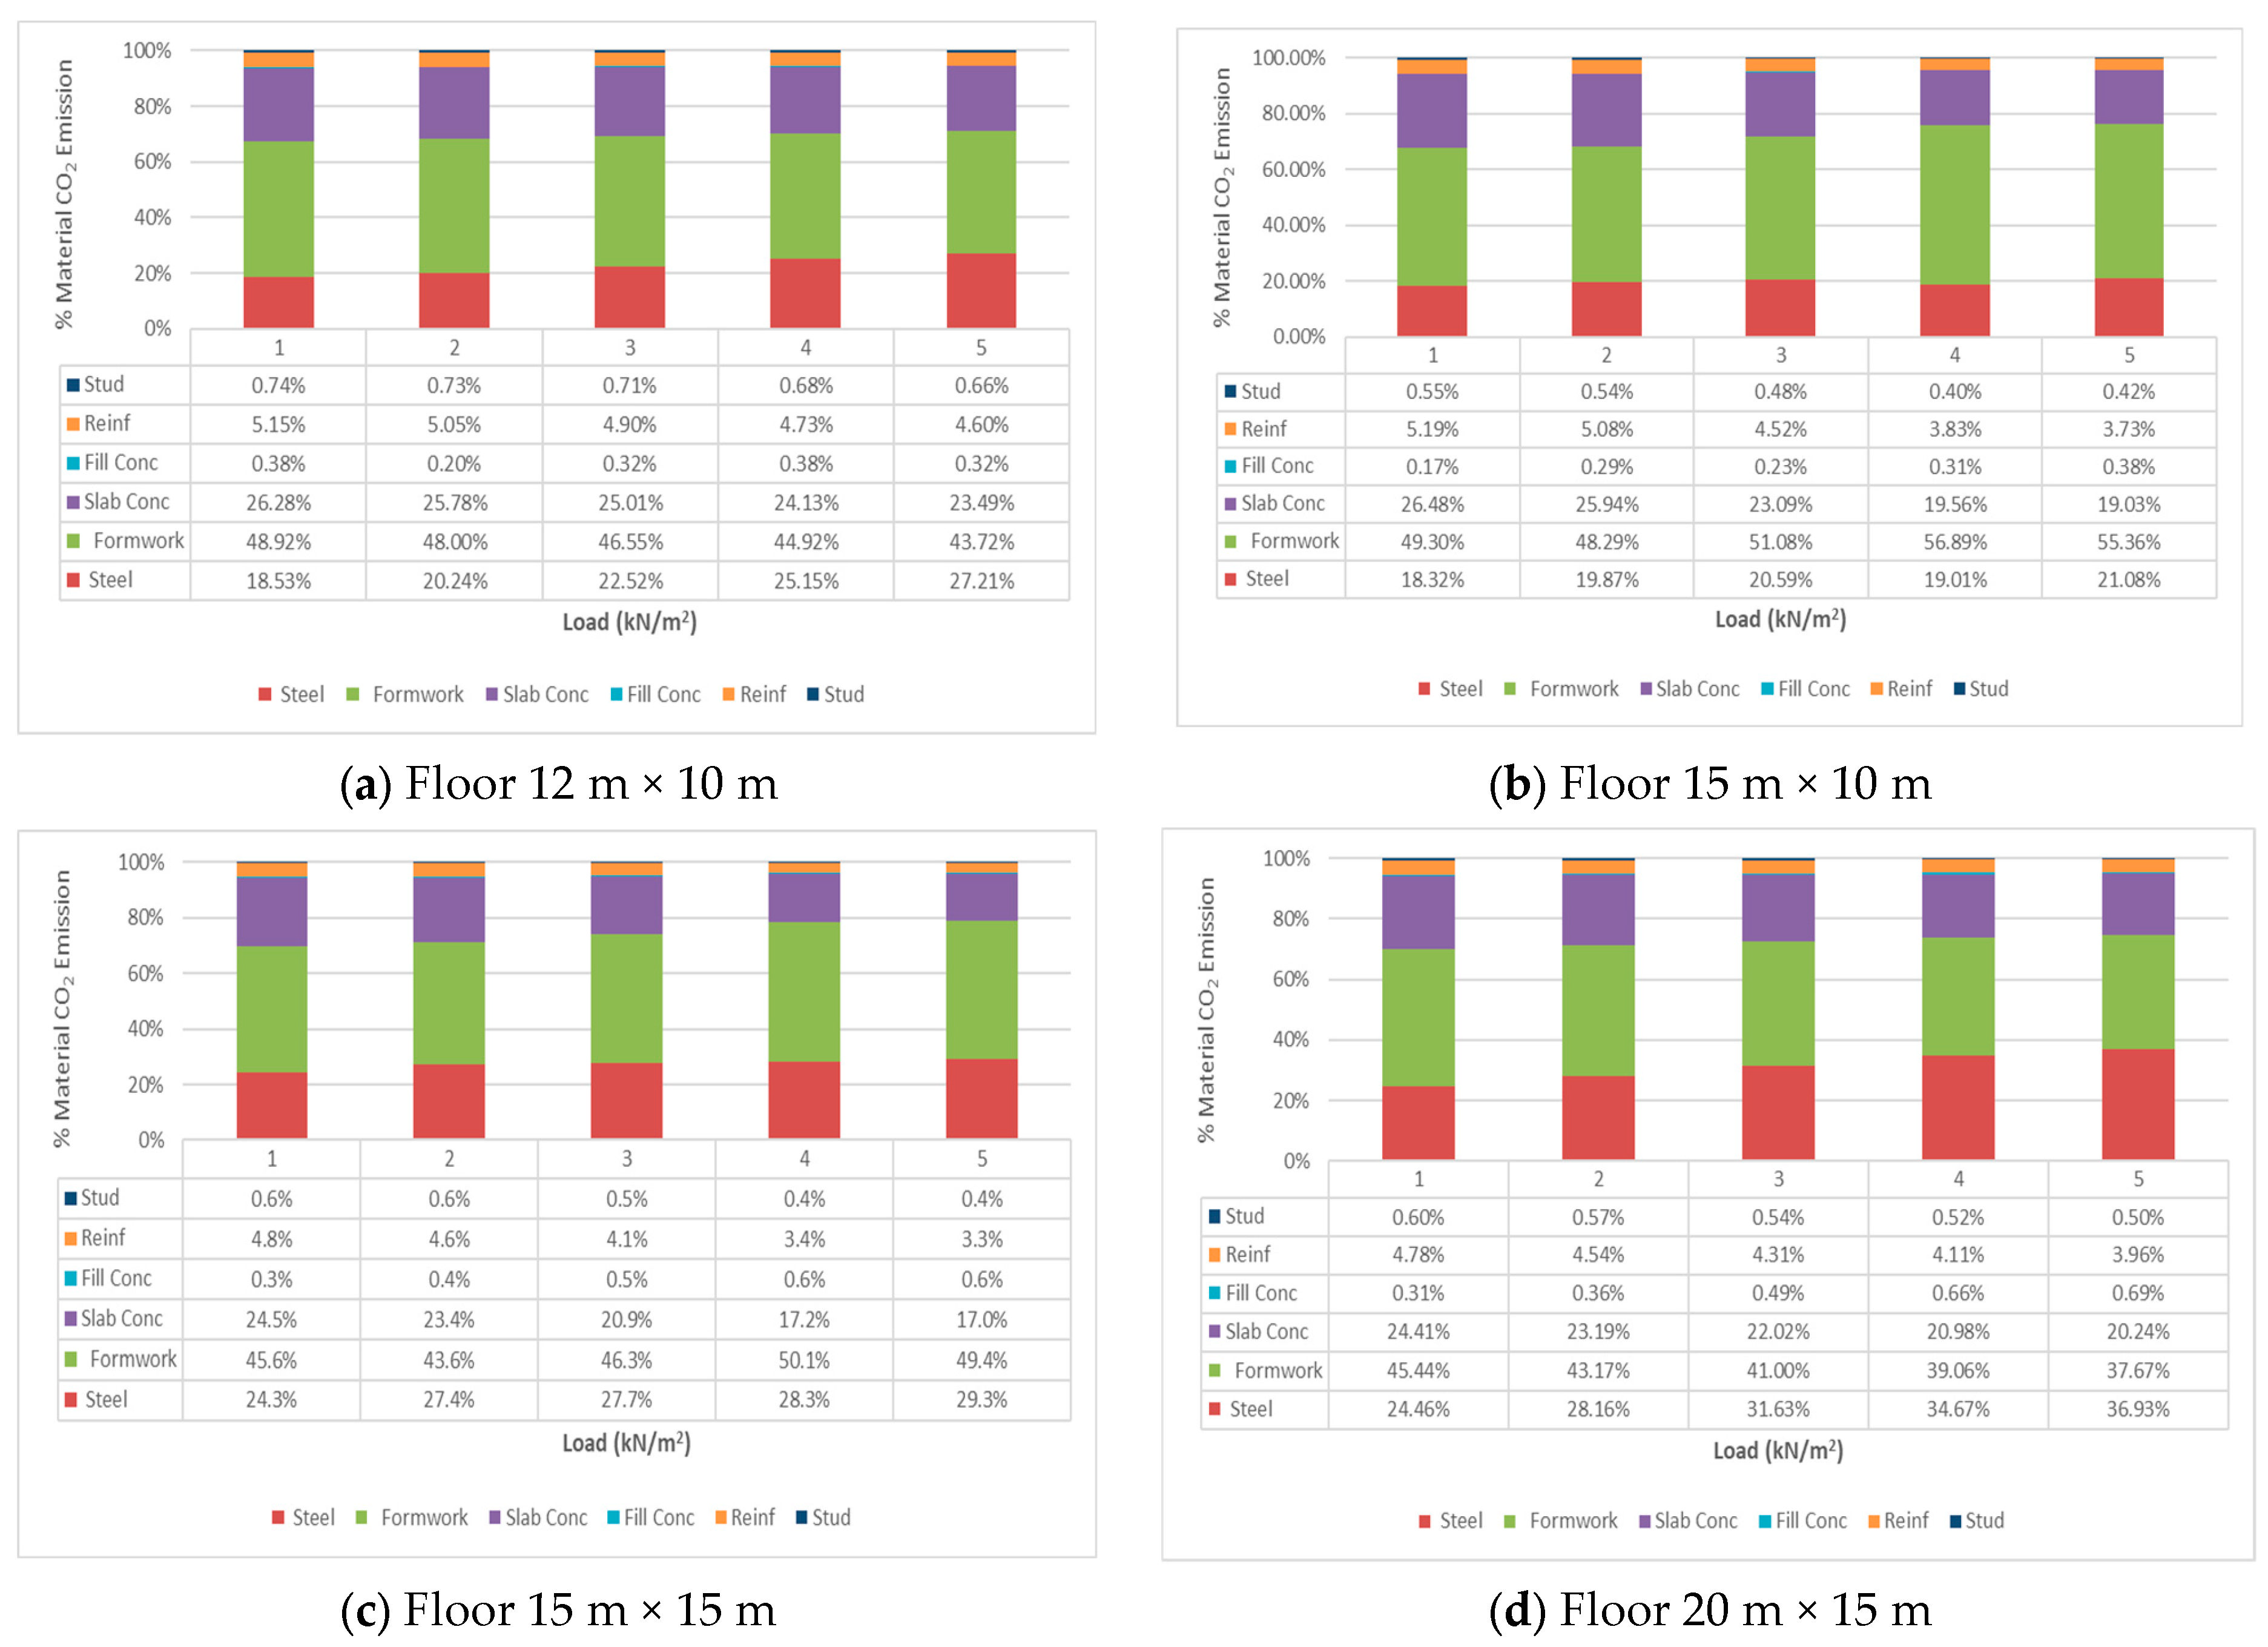
As shown in Figure 12 and Figure 13, the total CO2 emissions and steel CO2 emissions of floors with CCFT are lower than those of CHT floors. The difference between floors with filled and unfilled tubes increases with the largest live loads and spans, as well as with steel CO2 emissions (Figure 11) and total CO2 emissions (Figure 12). Figure 12 shows that, at the same emission level, the difference between floors with filled and unfilled tubes reaches 35 m2. Figure 14 presents the total CO2 emission composition to solutions with CCFT.
As shown in Figure 14, the slab’s concrete CO2 emissions account for 17–25% of the total CO2 emissions, but, considered alone, the concrete CO2 emissions of the upper chords represent less than 1% of the final CO2 emissions. The results indicated that, once concrete on the upper chord is accounted for, using CCFT trusses yields a significant reduction in the floor’s final CO2 emissions. Table 7 presents the final topologies of the floor analyzed.
As observed, the use of CCFT trusses reduces the number of panels across all load levels. This reduction directly translates into lower steel consumption in the final structure, thereby mitigating CO2 emissions from steel production. Table 8 presents the geometric characteristics of the floors to the best solution found with BO with CHT and CCFT trusses.
Table 8 indicates that all solutions were derived for MF50 forms with an 8 mm thickness. The gaps between trusses were 2 m for the 12 m × 10 m and 20 m × 15 m floors, while for the other floors, the gap was 2.5 m. The variation in the span of the secondary trusses increased with their heights, with the tallest trusses observed on the floors without filling the upper tubes. The fck of the slab remained consistent across all solutions. Table 9, Table 10, Table 11 and Table 12 present the geometric characteristics of the profiles obtained with BO using CHT and CCFT trusses.
Regarding Table 9, Table 10, Table 11 and Table 12, it is evident that the solutions involving concrete-filled circular tubes (CCFT) used concrete with compressive strengths exceeding 25 MPa. These outcomes illustrate that while concrete with higher strength contributes to a greater share of CO2 emissions due to its composition, the resultant increase in concrete emissions is offset by the reduction in the final CO2 emissions from the floors.

4. Conclusions

The results demonstrate that the use of tubular trusses in composite floor systems is technically feasible and environmentally advantageous. Compared with conventional full-web-beam floor solutions, systems incorporating tubular trusses achieved CO2 emissions reductions exceeding 20%, confirming their potential as a sustainable alternative.
The incorporation of concrete fill within tubular members proved to be a key factor in improving environmental performance. Although higher-strength concretes (above 25 MPa and up to 50 MPa) may increase embodied CO2 during production, their structural efficiency reduces overall material demand, thereby lowering total floor emissions. This finding highlights the importance of considering global structural optimization rather than isolated material impacts when evaluating sustainability.
Additionally, filling the tubes with concrete significantly reduced the reliance on steel in the truss systems. The optimized topologies consistently exhibited fewer panels and fewer bars, indicating that hybrid steel–concrete interaction enables more material-efficient structural configurations. These results reinforce the importance of exploring alternative structural systems to achieve more sustainable construction solutions.
Across the analyzed scenarios, the Bonobo (BO) algorithm consistently outperformed particle swarm optimization (PSO) for trusses with concrete-filled tubes. The parametric study showed that optimal solutions obtained using BO led to CO2 emission reductions greater than 30% when comparing hollow tubular trusses to concrete-filled tubular trusses.
Further investigations may include assessing vibration performance under human-induced loading and its influence on optimal configurations. Expanding the optimization framework to include slab topology and additional reinforcement parameters could provide deeper insight into their effects on global emissions. Furthermore, a detailed analysis of bar connections should be conducted to assess their impact on final truss dimensions and environmental performance, as well as studies with high-strength concrete, lightweight concrete, and fiber-reinforced concrete with a low carbon footprint.

Author Contributions

Conceptualization, C.M.G.S., A.F.G.C. and É.C.A.; methodology; C.M.G.S., A.F.G.C. and É.C.A.; validation, C.M.G.S., A.F.G.C., M.K. and É.C.A.; formal analysis, C.M.G.S., A.F.G.C., M.K. and É.C.A.; investigation, C.M.G.S., A.F.G.C., B.V.A. and É.C.A.; writing—C.M.G.S., A.F.G.C., B.V.A., M.K. and É.C.A.; writing—review and editing, C.M.G.S., A.F.G.C., B.V.A., M.K. and É.C.A.; visualization, C.M.G.S., A.F.G.C., B.V.A., M.K. and É.C.A.; supervision, A.F.G.C. and É.C.A. All authors have read and agreed to the published version of the manuscript.

Funding

The Article Processing Charge (APC) for the publication of this research was funded by the Fundação de Amaparo a Pesquisa do Espírito Santo—ES Brasil (FAPES).

Data Availability Statement

The raw data supporting the conclusions of this article will be made available by the authors on request.

Acknowledgments

The authors acknowledge the Brazilian Federal Government Agency, CAPES, and the State Government Agency, FAPES, for the financial support provided during the development of this study. The first, third, and fifth authors thank the State Government Agency FAPES for the research productivity grant. The fourth author thanks CNPq for the research productivity grant (No. CNPq 305484/2023-0) and the fifth author thanks FAPES for the postdoctoral fellowship (Grant Term No. 1134/2025-4).

Conflicts of Interest

The authors declare no conflicts of interest.

References

  1. Lagaros, N.D. The environmental and economic impact of structural optimization. Struct. Multidiscip. Optim. 2018, 58, 1751–1768. [Google Scholar] [CrossRef]
  2. Erlacher, G.; Calenzani, A.F.G.; Alves, E.C. Topological optimization of composite trusses considering CO2 emission via metaheuristics algorithms. Rev. IBRACON Estrut. Mater. 2023, 16, e16606. [Google Scholar] [CrossRef]
  3. Cifuentes, H.; Medina, F. Experimental study on shear bond behavior of composite slabs according to Eurocode 4. J. Constr. Steel Res. 2013, 82, 99–110. [Google Scholar] [CrossRef]
  4. Gholamhoseini, A.; Gilbert, R.I.; Bradford, M.A.; Chang, Z.T. Longitudinal shear stress and bond-slip relationships in composite concrete slabs. Eng. Struct. 2014, 69, 37–48. [Google Scholar] [CrossRef]
  5. Yang, B.; Yang, Y.; Zhou, X.H.; Jiang, Q.F.; Kang, S.B. Component tests and numerical simulations of composite floor systems under progressive collapse. J. Constr. Steel Res. 2018, 151, 25–40. [Google Scholar] [CrossRef]
  6. Ahmed, S.M.; Avudaiappan, S.; Sheet, I.S.; Saavedra Flores, E.I.; Pina, J.C.; Yanez, S.J.; Guzmán, C.F. Prediction of longitudinal shear resistance of steel-concrete composite slabs. Eng. Struct. 2019, 193, 295–300. [Google Scholar] [CrossRef]
  7. Sheet, I.S.; Ahmed, S.M.; Avudaiappan, S.; Saavedra Flores, E.I.; Chandra, Y.; Astroza, R. Shear bond behaviour of elemental composite beams with different configurations. Eng. Struct. 2019, 201, 109742. [Google Scholar] [CrossRef]
  8. Grossi, L.G.F.; Santos, C.F.R.; Malite, M. Longitudinal shear strength prediction for steel-concrete composite slabs with additional reinforcement bars. J. Constr. Steel Res. 2020, 166, 105908. [Google Scholar] [CrossRef]
  9. Wang, Q.; Yang, J.; Zhang, Y.; Fang, Y.; Ren, Q. Analysis and design of long-term responses of simply-supported steel–concrete composite slabs. J. Build. Eng. 2022, 53, 104496. [Google Scholar] [CrossRef]
  10. Eissa, M.; Celikag, M. Composite behavior of reinforced concrete T-beam with composite slab. Arab. J. Sci. Eng. 2022, 47, 13073–13093. [Google Scholar] [CrossRef]
  11. Hanifehzadeh, M.; Mousavi, M.M.R. Predicting the Structural Performance of Sandwich Concrete Panels Subjected to Blast Load Considering Dynamic Increase Factor. J. Civ. Eng. Sci. Tech. 2019, 10, 45–58. [Google Scholar] [CrossRef]
  12. Al-Fasih, M.Y.; Kueh, A.B.H.; Ibrahim, M.H.W. Flexural behavior of sandwich beams with novel triaxially woven fabric composite skins. Steel Compos. Struct. 2020, 34, 299–308. [Google Scholar] [CrossRef]
  13. Al-Fasih, M.Y.; Kueh, A.B.H.; Ibrahim, M.H.W. Failure behavior of sandwich honeycomb composite beam containing crack at the skin. PLoS ONE 2020, 15, e0227895. [Google Scholar] [CrossRef] [PubMed]
  14. Kravanja, S.; Silih, S. Optimization based comparison between composite I beams and composite trusses. J. Constr. Steel Res. 2003, 59, 609–625. [Google Scholar] [CrossRef]
  15. Klansek, U.; Kravanja, S. Cost estimation, optimization and competitiveness of different composite floor systems—Part 2. J. Constr. Steel Res. 2006, 62, 449–462. [Google Scholar] [CrossRef]
  16. Senouci, A.B.; Al-Ansari, M.S. Cost optimization of composite beams using genetic algorithms. Adv. Eng. Softw. 2009, 40, 1112–1118. [Google Scholar] [CrossRef]
  17. Kaveh, A.; Shakouri Mahmud Abadi, A. Cost optimization of a composite floor system using an improved harmony search algorithm. J. Constr. Steel Res. 2010, 66, 664–669. [Google Scholar] [CrossRef]
  18. Kaveh, A.; Massoudi, M.S. Cost optimization of a composite floor system using ant colony system. Trans. Civ. Eng. 2012, 36, 139–148. [Google Scholar]
  19. Korouzhdeh, T.; Eskandari-Naddaf, H. Cost-safety optimization of steel-concrete composite beams using standardized formulation. Eng. Sci. Technol. Int. J. 2019, 22, 523–532. [Google Scholar] [CrossRef]
  20. Kravanja, S.; Klansek, U.; Zula, T. Mass, direct cost and energy life-cycle cost optimization of steel-concrete composite floor structures. Appl. Sci. 2021, 11, 10316. [Google Scholar] [CrossRef]
  21. Kaveh, A.; Nasrollahi, A. Performance-based seismic design of steel frames utilizing charged system search optimization. Appl. Soft Comput. 2014, 22, 213–221. [Google Scholar] [CrossRef]
  22. Kaveh, A.; Ardalani, S. Cost and CO2 emission optimization of reinforced concrete frames using ECBO algorithm. Asian J. Civ. Eng. 2016, 17, 831–858. [Google Scholar]
  23. Tres, F.L., Jr.; De Medeiros, G.F.; Kripka, M.; Yepes, V. Designing for safety and sustainability: Optimization of fire-exposed steel-concrete composite footbridges. Struct. Eng. Mech. 2025, 96, 337–350. [Google Scholar]
  24. Santoro, J.F.; Kripka, M. Minimizing environmental impact from optimized sizing of reinforced concrete elements. Comput. Concr. 2020, 25, 111–118. [Google Scholar] [CrossRef]
  25. Poitras, G.; Lefrançois, G.; Cormier, G. Optimization of steel floor systems using particle swarm optimization. J. Constr. Steel Res. 2011, 67, 1225–1231. [Google Scholar] [CrossRef]
  26. Kaveh, A.; Fakoor, A. Cost optimization of steel-concrete composite floor systems with castellated steel beams. Period. Polytech. Civ. Eng. 2021, 65, 353–375. [Google Scholar] [CrossRef]
  27. Arpini, P.A.T.; Loureiro, M.C.; Breda, B.D.; Calenzani, A.F.; Alves, E.C. Optimum design of a composite floor system considering environmental and economic impacts. Rev. IBRACON Estrut. Mater. 2022, 15, e15302. [Google Scholar] [CrossRef]
  28. Renedo, C.M.C.; Díaz, I.M.; García-Palacios, J.H.; Gallegos-Calderón, C. Structural optimization of lightweight composite floors with integrated constrained layer damping for vibration control. Actuators 2023, 12, 288. [Google Scholar] [CrossRef]
  29. Teixeira, M.O.; Alves, E.C.; Valle, J.P.S.O.; Calenzani, A.F.G. Design of simply supported composite slabs of steel and concrete via metaheuristic optimization algorithm. Asian J. Civ. Eng. 2023, 25, 237–252. [Google Scholar] [CrossRef]
  30. Silva, G.F.; Kripka, M.; Alves, E.C. CO2 emission optimization of composite floor systems with cellular beams via metaheuristics algorithms. Struct. Eng. Mech. 2024, 89, 453–466. [Google Scholar] [CrossRef]
  31. Silva, I.O.M.; Alves, E.C.; Calenzani, A.F.G. Multiobjective optimization of steel and concrete composite slabs via MOPSO algorithm. Structures 2025, 80, 109722. [Google Scholar] [CrossRef]
  32. Stolpe, M. Truss optimization with discrete design variables: A critical review. Struct. Multidiscip. Optim. 2016, 53, 349–374. [Google Scholar] [CrossRef]
  33. Carvalho, J.P.G.; Lemonge, A.C.C.; Carvalho, É.C.R.; Hallak, P.H.; Bernardino, H.S. Truss optimization with multiple frequency constraints and automatic member grouping. Struct. Multidiscip. Optim. 2018, 57, 547–577. [Google Scholar] [CrossRef]
  34. Stolpe, M. Fail-safe truss topology optimization. Struct. Multidiscip. Optim. 2019, 60, 1605–1618. [Google Scholar] [CrossRef]
  35. Degertekin, S.O.; Lamberti, L.; Ugur, I.B. Discrete sizing/layout/topology optimization of truss structures with an advanced Jaya algorithm. Appl. Soft Comput. 2019, 79, 363–390. [Google Scholar] [CrossRef]
  36. Shi, S.; Zhou, K. Topology optimization for truss-like material distribution field with B-spline expression. Struct. Multidiscip. Optim. 2021, 64, 2025–2043. [Google Scholar] [CrossRef]
  37. Ching, E.; Carstensen, J.V. Truss topology optimization of timber–steel structures for reduced embodied carbon design. Eng. Struct. 2022, 252, 113540. [Google Scholar] [CrossRef]
  38. Fairclough, H.E.; He, L.; Asfaha, T.B.; Rigby, S. Adaptive topology optimization of fail-safe truss structures. Struct. Multidiscip. Optim. 2023, 66, 3585. [Google Scholar] [CrossRef]
  39. Eberhart, R.; Kennedy, J. A new optimizer using particle swarm theory. In Proceedings of the Sixth International Symposium on Micro Machine and Human Science, Nagoya, Japan, 4–6 October 1995; pp. 39–43. [Google Scholar] [CrossRef]
  40. Barbosa, H.J.C.; Lemonge, A.C.C. An adaptive penalty scheme in genetic algorithms for constrained optimization problems. In Proceedings of the 4th Annual Conference on Genetic and Evolutionary Computation, New York, NY, USA, 9–13 July 2002; Volume 2, pp. 287–294. [Google Scholar]
  41. Barroso, E.S.; Parente, E.; Melo, A.M.C. A hybrid PSO-GA algorithm for optimization of laminated composites. Struct. Multidiscip. Optim. 2017, 55, 2111–2130. [Google Scholar] [CrossRef]
  42. Mokarram, V.; Banan, M.R. A new PSO-based algorithm for multi-objective optimization with continuous and discrete design variables. Struct. Multidiscip. Optim. 2018, 57, 509–533. [Google Scholar] [CrossRef]
  43. Biabani, F.; Shojaee, S.; Hamzehei-Javaran, S. A new insight into metaheuristic optimization method using a hybrid of PSO, GSA, and GWO. Structures 2022, 44, 1168–1189. [Google Scholar] [CrossRef]
  44. Mahapatra, A.K.; Panda, N.; Pattanayak, B.K. Hybrid PSO (SGPSO) with discretization operator for training RBF neural network and optimal feature selection. Arab. J. Sci. Eng. 2022, 48, 7059–7075. [Google Scholar] [CrossRef]
  45. Tong, F.; Yang, J.; Ma, C.; Cheng, L.; Li, G. Prediction of concrete dam displacement using Copula-PSO-ANFIS hybrid model. Arab. J. Sci. Eng. 2022, 47, 4335–4350. [Google Scholar] [CrossRef]
  46. Shao, J.; Fan, Z.; Huang, Y.; Zhan, Y.; Cai, Q. Multi-objective optimization of double-walled steel cofferdams based on RSM and PSO algorithm. Structures 2023, 49, 256–266. [Google Scholar] [CrossRef]
  47. Das, A.K.; Pratihar, D.K. Optimal preventive maintenance interval for a crankshaft balancing machine under reliability constraint using bonobo optimizer. Mech. Mach. Sci. 2019, 73, 1659–1668. [Google Scholar] [CrossRef]
  48. Das, A.K.; Nikum, A.K.; Krishnan, S.V.; Pratihar, D.K. Multi-objective bonobo optimizer (MOBO): An intelligent heuristic for multi-criteria optimization. Knowl. Inf. Syst. 2020, 62, 4407–4444. [Google Scholar] [CrossRef]
  49. Goodarzimehr, V.; Topal, U.; Das, A.K.; Vo-Duy, T. Bonobo optimizer algorithm for optimum design of truss structures with static constraints. Structures 2023, 50, 400–417. [Google Scholar] [CrossRef]
  50. Das, A.K.; Sahoo, S.; Pratihar, D.K. An improved design of knee orthosis using self-adaptive bonobo optimizer (SaBO). J. Intell. Robot. Syst. 2023, 107, 8. [Google Scholar] [CrossRef]
  51. Metform. Telha-Fôrma (Steel Deck); [Catálogo Técnico]; Metform: São Sebastião da Bela Vista, Brazil, 2019. [Google Scholar]
  52. World Steel Association. World Steel in Figures; World Steel Association: Brussels, Belgium, 2023. [Google Scholar]
  53. NBR 16239; Projeto de Estruturas de aço e de Estruturas de aço e Concreto de Edificações com Tubulares. Associação Brasileira de Normas Técnicas (ABNT): Rio de Janeiro, Brazil, 2013.
  54. NBR 8800; Projeto de Estruturas de aço e de Estruturas de aço e Concreto de Edifícios. Associação Brasileira de Normas Técnicas (ABNT): Rio de Janeiro, Brazil, 2008.
  55. MathWorks, Inc. MATLAB R2020a; MathWorks: Natick, MA, USA, 2020. [Google Scholar]
Figure 1. BO and PSO comparative flowchart.
Jcs 10 00350 g001
Figure 2. Design variables of the composite floor system with composite tubular truss beams.
Jcs 10 00350 g002
Figure 3. Optimization flowchart.
Jcs 10 00350 g003
Figure 4. Optimal geometry solution proposed by Arpini et al. [27] via GA.
Jcs 10 00350 g004
Figure 5. Optimization problem evolution of composite floor with tubular profiles.
Jcs 10 00350 g005
Figure 6. Comparative analysis of normalized solutions of total CO2 emissions [27].
Jcs 10 00350 g006
Figure 7. Final topologies—dimensions in meters.
Jcs 10 00350 g007
Figure 8. Ratio solutions for the steel CO2 emission.
Jcs 10 00350 g008aJcs 10 00350 g008b
Figure 9. Ratio solutions for steel CO2 emissions—BOCCFT/BOCHT.
Jcs 10 00350 g009
Figure 10. Ratio solutions for the total CO2 emission.
Jcs 10 00350 g010
Figure 11. Ratio solution for the total CO2 emission—BOCCFT/BOCHT.
Jcs 10 00350 g011
Figure 12. Isolines for the steel CO2 emission distribution in kgCO2.
Jcs 10 00350 g012
Figure 13. Isolines for the total CO2 emission distribution in kgCO2.
Jcs 10 00350 g013
Figure 14. CO2 emission composition of the CCFT composite floor.
Jcs 10 00350 g014
Table 1. Compiled articles from the research.
Author (Year)Structural OptmizationComposite StructuresExperimental Analysis Composite FloorCO2 EmissionCostStructural Optimization
of Composite Bems
TrussesComposite TrussesMetaheuristicBOStructural Optimization of Composite FloorComposite Floor Trusses
Lagaros [1]
Erlacher et al. [2]
Cifuentes and Medina [3]
Gholamhoseini et al. [4]
Yang et al. [5]
Ahmed et al. [6]
Sheet et al. [7]
Grossi et al. [8]
Wang et al. [9]
Eissa and Celikag [10]
Kravanja and Silih [14]
Klansek and Kravanja [15]
Senouci and Al-Ansari [16]
Kaveh and Abadi [17]
Kaveh and Massoudi [18]
Korouzhdeh and Eskandari-Naddaf [19]
Kravanja et al. [20]
Kaveh and Ardalani [22]
Poitras et al. [25]
Kaveh and Fakoor [26]
Santoro and Kripka [24]
Arpini et al. [27]
Renedo et al. [28]
Teixeira et al. [29]
Silva et al. [30]
Stolpe [32]
Carvalho et al. [33]
Stolpe [34]
Degertekin et al. [35]
Shi and Zhou [36]
Ching and Carstensen [37]
Fairclough et al. [38]
Eberhart and Kennedy [39]
Barbosa and Lemonge [40]
Barroso et al. [41]
Mokarram and Banan [42]
Mahapatra et al. [44]
Tong et al. [45]
Shao et al. [46]
Das and Pratihar [47]
Das et al. [48]
Goodarzmehr et al. [49]
Das et al. [50]
This paper
Table 2. Materials CO2 emission.
MATERIALSPECIFICATIONCO2
EMISSIONS (kgCO2/m3)
SOURCE
Concrete20 MPa140.05Santoro and
Kripka [24]
25 MPa149.26
30 MPa157.65
35 MPa171.64
40 MPa182.14
45 MPa194.70
50 MPa225.78
Tubular profileVMB3501.12 (kgCO2/kg)World Steel Association [52]
Steel Formwork
(280 MPa)
MF50/1.25 mm2.64
(kgCO2/kg)
Crack control mesh600 MPa1.92
(kgCO2/kg)
Shear connector(ø19 mm, 105 mm)1.116
(kgCO2/kg)
Table 3. Steel profiles comparative solutions.
Shape of ProfileAlg.Edge Truss Profile (mm)Internal Truss Profile (mm)Girder Profile (mm)Height (cm)Nº Panels
Arpini et al. [27]Full-web ProfileGAW310x21W310x21W450x51----
AuthorsCHTBOLC: TC38.1x3.6
UC: TC73.0x3.6
WM: TC33.4x3.2
LC: TC48.3x4.5
UC: TC48.3x3.6
WM: TC48.3x4.0
LC: TC48.3x3.6
UC: TC88.9x4.0
WM: TC33.4x3.6
902
PSOLC: TC38.1x4.0
UC: TC73.0x3.6
WM: TC33.4x3.2
LC: TC88.9x3.6
UC: TC88.9x5.0
WM: TC38.1x3.6
LC: TC60.3x3.6
UC: TC88.9x5.0
WM: TC33.4x3.6
607
CCFTBOLC: TC33.4x3.2
UC: TC33.4x3.2
WM: TC33.4x3.2
fck: 50 MPa
LC: TC48.3x4.5
UC: TC 48.3x3.6
WM: TC48.3x4.0
fck: 30 MPa
LC: TC42.2x4.0
UC: TC603x4.0
WM: TC38.1x3.6
fck: 25 MPa
903
PSOLC: TC33.4x3.2
UC: TC33.4x3.2
WM: TC33.4x3.2
fck: 25 MPa
LC: TC42.2x5.0
UC: TC48.3x3.6
WM: TC42.2x4.5
fck: 35 MPa
LC: TC38.1x4.0
UC: TC60.3x3.6
WM: TC33.4x3.6
fck: 40 MPa
902
Table 4. Comparative analyses of the solutions to the total CO2 emission.
UnitArpini et al. [27]Authors
CHT
Authors
CCFT
GABOPSOBOPSO
Total height of the slabcm1111111111
Thickness of the concrete layercm66666
fck of the slabMPa2525252525
Steel deck formwork--MF-50MF-50MF-50MF-50MF-50
Steel deck thicknessmm0.80.950.950.950.95
Maximum span steel deckm2.22.502.502.502.50
Reinforcing steel mesh--Q-75 (ø3.8-150 × 150)Q-75 (ø3.8-150 × 150)Q-75 (ø3.8-150 × 150)Q-75 (ø3.8-150 × 150)Q-75 (ø3.8-150 × 150)
Number of beamsun54444
Distance between beamsm1.8752.502.502.502.50
Total connectors of the edge truss beamun4816161616
Total connectors of the internal truss beamun3216161616
Total connectors of the truss girderun288888
Total CO2 EmissionkgCO23727.293120.823162.342940.612940.61
Mean CO2 EmissionkgCO2--3163.233224.042968.413015.71
Standard Deviation %--1.52.81.24.0
Table 5. Comparative analyses of metrics to BO and PSO-CHT Floors.
BOPSO
Floor (m2)Load (kN/m2)Best (kgCO2)Media (kgCO2)Standard Deviation (%)Floor (m2)Load (kN/m2)Best (kgCO2)Media (kgCO2)Standard Deviation (%)
12025830.606122.132.7%1202587763112.8%
35919.816215.802.6%3601266132.8%
46134.176440.884.3%4614665064.3%
56523.666849.845.9%5713872106.2%
66731.737068.327.6%6697277678.3%
15027333.107699.752.4%1502761188502.7%
37569.187947.632.2%3769384552.4%
48493.778918.456.0%4869896946.5%
510,020.5910,521.626.3%510,56412,6777.6%
610,142.4010,649.522.9%610,59512,3833.4%
225211,957.6112,555.497.8%225212,33013,7978.6%
312,630.8013,262.346.7%313,45514,4167.2%
414,297.8515,012.747.1%414,90016,3187.8%
517,052.6617,905.306.6%517,62519,6767.2%
617,416.2918,287.106.4%618,02620,0967.0%
300215,476.9916,250.832.2%300215,94917,8582.4%
316,763.8517,602.043.9%317,67720,4674.5%
417,613.4418,494.115.5%418,24620,3236.1%
519,230.5020,192.033.2%523,21820,8173.3%
619,945.2620,942.525.2%620,15321,3705.3%
Table 6. Comparative analyses of metrics to BO and PSO-CCFT floors.
BOPSO
Floor (m2)Load (kN/m2)Best (kgCO2)Media (kgCO2)Standard Deviation (%)Floor (m2)Load (kN/m2)Best (kgCO2)Media (kgCO2)Standard Deviation (%)
1202542956942.5%1202543256942.5%
3553357812.4%3555058992.5%
4570559904.0%4570759904.0%
5591262335.4%5590762335.4%
6617265037.0%6641976508.2%
1502673470842.2%1502671072942.2%
3687672322.0%3725179692.6%
4772381165.4%4793987246.1%
5911995755.7%5928910,2086.3%
6937197982.7%6945010,2722.8%
225210,93111,4257.1%225211,14812,2857.6%
311,43112,0696.1%311,98514,0337.0%
412,78713,3616.4%413,39315,5367.4%
515,53916,2946.0%515,83317,3346.4%
615,75616,4585.8%616,05317,5096.1%
300214,61315,2762.1%300215,47316,4012.6%
315,38016,1943.6%315,92317,1974.0%
416,19617,0155.1%416,24617,5465.1%
516,99917,7692.9%517,36919,4532.9%
617,62418,4294.6%619,35221,6755.1%
Table 7. Tubular composite floor final topologies—dimensions in meters.
Floor 12 m × 10 m
Load (kN/m2)CHTCCFT
2Jcs 10 00350 i001Jcs 10 00350 i002
3Jcs 10 00350 i003Jcs 10 00350 i004
4Jcs 10 00350 i005Jcs 10 00350 i006
5Jcs 10 00350 i007Jcs 10 00350 i008
6Jcs 10 00350 i009Jcs 10 00350 i010
Floor 15 m × 10 m
Load (kN/m2)CHTCCFT
2Jcs 10 00350 i011Jcs 10 00350 i012
3Jcs 10 00350 i013Jcs 10 00350 i014
4Jcs 10 00350 i015Jcs 10 00350 i016
5Jcs 10 00350 i017Jcs 10 00350 i018
6Jcs 10 00350 i019Jcs 10 00350 i020
Floor 15 m × 15 m
Load (kN/m2)CHTCCFT
2Jcs 10 00350 i021Jcs 10 00350 i022
3Jcs 10 00350 i023Jcs 10 00350 i024
4Jcs 10 00350 i025Jcs 10 00350 i026
5Jcs 10 00350 i027Jcs 10 00350 i028
6Jcs 10 00350 i029Jcs 10 00350 i030
Floor 20 m × 15 m
Load (kN/m2)CHTCCFT
2Jcs 10 00350 i031Jcs 10 00350 i032
3Jcs 10 00350 i033Jcs 10 00350 i034
4Jcs 10 00350 i035Jcs 10 00350 i036
5Jcs 10 00350 i037Jcs 10 00350 i038
6Jcs 10 00350 i039Jcs 10 00350 i040
Table 8. Floors’ final geometries.
Carga (kN/m2)CHTCCFT
12 m × 10 m15 m × 10 m15 m × 15 m20 m × 15 m12 m × 10 m15 m × 10 m15 m × 15 m20 m × 15 m
2MF50/0.8MF50/0.8 MF50/0.8MF50/0.8MF50/0.8MF50/0.8MF50/0.8MF50/0.8
22.52.52.522.52.52
1.021.221.651.651.221.221.81.85
2525252525252525
3MF50/0.8MF50/0.8MF50/0.8MF50/0.8MF50/0.8MF50/0.8MF50/0.8MF50/0.8
22.52.52.522.52.52
1.221.171.451.61.221.171.81.85
2525252525252525
4MF50/0.8MF50/0.95MF50/0.95MF50/0.8MF50/0.8MF50/0.95MF50/0.95MF50/0.8
22.52.5222.52.52
1.221.221.71.51.221.221.851.8
2525252525252525
5MF50/0.8MF50/1.25MF50/1.25MF50/0.8MF50/0.8MF50/1.25MF50/1.25MF50/0.8
22.52.5222.52.52
1.171.171.61.551.171.221.751.7
2525252525252525
6MF50/0.8MF50/1.25MF50/1.25MF50/0.8MF50/0.8MF50/1.25MF50/1.25MF50/0.8
22.52.5222.52.52
1.171.071.451.851.221.221.81.75
2525252525252525
Legend: MF50/0.8—Forma Steel Deck/Espessura; 2 m—Distance between trusses; 1.02 m—Total height of the truss; 25—Compressive strength of the concrete.
Table 9. Profiles of final geometries of CHT—floors 120 m2 and 150 m2.
Load
(kN/m2)
Legend12 m × 10 m15 m × 10 m
Secondary TrussEdge TrussMain TrussSecondary TrussEdge TrussMain Truss
2BI (mm)TC48.3x4.0TC33.4x3.2TC42.2x4.0TC42.2x5.0TC33.4x3.2TC42.2x5.0
BS (mm)TC73.0x3.6TC42.2x4.0TC60.3x5.6TC73.0x4.0TC48.3x3.6TC73.0x5.6
DM (mm)TC33.4x3.2TC33.4x3.2TC33.4x3.2TC33.4x3.2TC33.4x3.2TC33.4x3.2
Nº. Stubolt212113212117
3BI (mm)TC48.3x4.0TC33.4x3.2TC42.2x4.0TC48.3x5.6TC38.1x3.6TC48.3x5.6
BS (mm)TC88.9x3.6TC48.3x4.5TC60.3x5.6TC101.6x4.0TC73.0x3.6TC101.6x5.0
DM (mm)TC33.4x3.2TC33.4x3.2TC33.4x3.2TC38.1x3.6TC33.4x3.2TC38.1x3.6
Nº. Stubolt212113212117
4BI (mm)TC48.3x5.0TC33.4x3.2TC42.2x4.5TC48.3x6.4TC38.1x4.0TC48.3x6.4
BS (mm)TC88.9x4.5TC73.0x3.6TC73.0x5.0TC114.3x4.0TC73.0x4.0TC101.6x5.6
DM (mm)TC38.1x3.2TC33.4x3.2TC38.1x3.2TC42.2x3.6TC33.4x3.2TC38.1x4.0
Nº. Stubolt212113212117
5BI (mm)TC60.3x4.5TC38.1x4.0TC60.3x3.6TC73.0x5.0TC48.3x3.6TC88.9x4.0
BS (mm)TC101.6x4.5TC73.0x3.6TC88.9x5.0TC114.3x4.5TC88.9x3.6TC88.9x8.0
DM (mm)TC38.1x4.0TC33.4x3.2TC38.1x3.6TC48.3x3.6TC33.4x3.2TC48.3x3.6
Nº. Stubolt212113212117
6BI (mm)TC88.9x3.6TC42.2x4.0TC48.3x5.6TC101.6x4.0TC60.3x3.6TC60.3x8.0
BS (mm)TC114.3x4.0TC73.0x4.0TC88.9x5.6TC101.6x5.0TC73.0x4.0TC101.6x8.8
DM (mm)TC42.2x4.0TC33.4x3.2TC42.2x4.0TC48.3x4.0TC33.4x3.2TC48.3x4.0
Nº. Stubolt212113212117
Legend: BI—Lower Flange; BS—Upper Flange; DM—Diagonals.
Table 10. Profiles of final geometries of CHT—floors 225 m2 and 300 m2.
Legend15 m × 15 m20 m × 15 m
Secondary TrussEdge TrussMain TrussSecondary TrussEdge TrussMain Truss
BI (mm)TC73.0x4.5TC48.3x3.6TC48.3x5.0TC88.9x3.6TC48.3x3.6TC88.9x4.0
BS (mm)TC101.6x4.5TC73.0x3.6TC60.3x8.0TC88.9x5.0TC73.0x3.6TC114.3x8.0
DM (mm)TC42.2x3.6TC33.4x3.2TC42.2x4.0TC42.2x3.6TC33.4x3.2TC48.3x5.0
Nº. Stubolt323217323222
BI (mm)TC101.6x4.5TC48.3x5.0TC60.3x5.6TC101.6x4.0TC48.3x4.5TC60.3x8.0
BS (mm)TC114.3x5.0TC88.9x3.6TC88.9x7.1TC101.6x5.0TC73.0x4.0TC141.3x8.0
DM (mm)TC48.3x4.0TC33.4x3.2TC48.3x4.0TC42.2x4.5TC33.4x3.2TC48.3x6.4
Nº. Stubolt323217323222
BI (mm)TC73.0x6.4TC48.3x5.0TC60.3x5.6TC101.6x4.0TC48.3x4.5TC114.3x5.0
BS (mm)TC114.3x5.6TC88.9x4.0TC88.9x7.1TC88.9x6.4TC73.0x4.0TC114.3x12.5
DM (mm)TC60.3x3.6TC33.4x3.6TC60.3x3.6TC48.3x3.6TC33.4x3.2TC88.9x4.0
Nº. Stubolt323217323222
BI (mm)TC88.9x6.4TC48.3x6.4TC88.9x4.5TC101.6x4.5TC60.3x4.0TC101.6x6.4
BS (mm)TC141.3x5.6TC114.3x4.0TC101.6x8.0TC114.3x5.0TC88.9x3.6TC114.3x14.2
DM (mm)TC48.3x5.6TC38.1x3.6TC48.3x5.6TC42.2x5.0TC33.4x3.2TC60.3x7.1
Nº. Stubolt323217323222
BI (mm)TC141.3x5.0TC73.0x5.0TC114.3x4.0TC101.6x4.5TC88.9x3.6TC114.3x6.4
BS (mm)TC168.3x5.0TC101.6x5.0TC168.3x5.6TC168.3x5.0TC114.3x4.5TC141.3x12.5
DM (mm)TC60.3x5.0TC42.2x3.6TC48.3x6.4TC73.0x3.6TC38.1x4.0TC73.0x6.4
Nº. Stubolt323217323222
Legend: BI—Lower Flange; BS—Upper Flange; DM—Diagonals.
Table 11. Profiles of final geometries of CCFT—floors 120 m2 and 150 m2.
Load (kN/m2)Legend12 m × 10 m15 m × 10 m
Secondary TrussEdge TrussMain TrussSecondary TrussEdge TrussMain Truss
2LC (mm)TC38.1x4.0TC33.4x3.2TC38.1x3.6TC42.2x5.0TC33.4x3.2TC42.2x5.0
UC (mm)TC38.1x3.6TC33.4x3.2TC60.3x3.6TC42.2x4.0TC33.4x3.2TC73.0x4.5
WM (mm)TC33.4x3.2TC33.4x3.2TC33.4x3.2TC33.4x3.2TC33.4x3.2TC33.4x3.2
Nº. Stubolt212113212117
fck (MPa)452525402530
3LC (mm)TC48.3x4.0TC33.4x3.2TC42.2x4.0TC48.3x5.0TC38.1x3.2TC48.3x5.6
UC (mm)TC42.2x3.6TC33.4x3.2TC60.3x4.0TC60.3x3.6TC33.4x3.2TC88.9x3.6
WM (mm)TC38.1x3.6TC33.4x3.2TC33.4x3.2TC42.2x3.6TC33.4x3.2TC38.1x3.6
Nº. Stubolt212113212117
fck (MPa)302545202545
4LC (mm)TC48.3x4.5TC33.4x3.6TC42.2x4.5TC48.3x6.4TC38.1x4.0TC48.3x6.4
UC (mm)TC48.3x3.6TC33.4x3.2TC73.0x3.6TC48.3x4.5TC33.4x3.2TC101.6x4.0
WM (mm)TC48.3x4.0TC33.4x3.2TC38.1x3.6TC42.2x5.0TC33.4x3.2TC42.2x4.0
Nº. Stubolt212113212117
fck (MPa)502540402530
5LC (mm)TC48.3x5.6TC38.1x3.6TC60.3x3.6TC88.9x3.6TC42.2x4.0TC88.9x3.6
UC (mm)TC60.3x3.6TC33.4x3.2TC88.9x3.6TC60.3x4.0TC33.4x3.2TC101.6x4.0
WM (mm)TC42.2x4.0TC33.4x3.2TC38.1x4.0TC42.2x5.0TC33.4x3.2TC48.3x3.6
Nº. Stubolt212113212117
fck (MPa)302530502550
6LC (mm)TC48.3x6.4TC38.1x4.0TC60.3x4.0TC73.0x5.0TC48.3x3.6TC88.9x4.5
UC (mm)TC60.3x3.6TC33.4x3.2TC88.9x3.6TC73.0x3.6TC33.4x3.2TC114.3x4.0
WM (mm)TC42.2x4.0TC33.4x3.2TC42.2x4.0TC48.3x5.0TC33.4x3.6TC42.2x5.0
Nº. Stubolt212113212117
fck (MPa)452540403045
Legend: BI—Lower Flange; BS—Upper Flange; DM—Diagonals.
Table 12. Profiles of final geometries of CCFT—floors 225 m2 and 300 m2.
Load
(kN/m2)
Legend15 m × 15 m20 m × 15 m
Secondary TrussEdge TrussMain TrussSecondary TrussEdge TrussMain Truss
2LC (mm)TC48.3x6.4TC38.1x4.0TC48.3x4.5TC48.3x5.0TC38.1x3.2TC60.3x5.6
UC (mm)TC60.3x4.5TC33.4x3.2TC73.0x4.0TC48.3x4.0TC33.4x3.2TC114.3x4.0
WM (mm)TC42.2x4.5TC33.4x3.2TC42.2x4.0TC42.2x4.0TC33.4x3.2TC48.3x5.6
Nº. Stubolt323217323222
fck (MPa)202545252545
3LC (mm)TC88.9x4.0TC48.3x4.0TC48.3x5.6TC48.3x6.4TC38.1x4.0TC88.9x4.5
UC (mm)TC73.0x3.6TC33.4x3.2TC88.9x3.6TC60.3x3.6TC33.4x3.2TC114.3x5.6
WM (mm)TC48.3x5.6TC38.1x3.6TC42.2x5.0TC42.2x5.0TC33.4x3.2TC60.3x5.0
Nº. Stubolt323217323222
fck (MPa)202545202545
4LC (mm)TC101.6x4.0TC48.3x4.5TC48.3x6.4TC88.9x4.0TC42.2x4.5TC60.3x8.8
UC (mm)TC73.0x3.6TC33.4x3.2TC88.9x4.5TC60.3x4.0TC33.4x3.2TC141.3x5.0
WM (mm)TC73.0x4.0TC38.1x4.0TC48.3x5.0TC60.3x4.0TC38.1x3.2TC88.9x4.0
Nº. Stubolt323217323222
fck (MPa)402545452540
5LC (mm)TC88.9x5.6TC73.0x3.6TC73.0x5.0TC101.6x4.0TC48.3x4.5TC73.0x8.8
UC (mm)TC101.6x4.0TC33.4x3.2TC101.6x4.5TC73.0x3.6TC33.4x3.2TC168.3x5.0
WM (mm)TC60.3x5.6TC42.2x4.0TC73.0x3.6TC48.3x6.4TC38.1x4.0TC88.9x4.5
Nº. Stubolt323217323222
fck (MPa)203545402535
6LC (mm)TC88.9x6.4TC73.0x4.0TC73.0x5.6TC101.6x4.5TC48.3x5.0TC114.3x5.6
UC (mm)TC88.9x3.6TC33.4x3.2TC114.3x4.0TC73.0x4.0TC33.4x3.2TC168.3x5.0
WM (mm)TC73.0x5.6TC42.2x5.0TC48.3x6.4TC88.9x3.6TC42.2x4.0TC73.0x6.4
Nº. Stubolt323217323222
fck (MPa)402545452545
Legend: BI—Lower Flange; BS—Upper Flange; DM—Diagonals.
Disclaimer/Publisher’s Note: The statements, opinions and data contained in all publications are solely those of the individual author(s) and contributor(s) and not of MDPI and/or the editor(s). MDPI and/or the editor(s) disclaim responsibility for any injury to people or property resulting from any ideas, methods, instructions or products referred to in the content.