1. Introduction
Electronic products infiltrate every aspect of our life today, from energy generation and storage, communication technology, industrial automation to data processing in administration and science, and even medical applications. The social relevance of electronics can be quantified by the amount of electronic waste generated [
1]. The global annual per capita consumption of electronics was 7.8 kg in 2022, while the figures in Europe, Oceania, and the Americas are significantly above this average with values from 14.1 kg to 17.6 kg [
2]. Several printing processes are used in mass production of printed electronics. These include screen printing, dispensing, stencil printing, direct ink writing, jetting and other less common methods such as pattern transfer printing [
3,
4,
5]. What all these processes have in common is that the conductive material must be prepared as a paste suitable for the respective application process [
1,
3,
6,
7].
Depending on the application, two classes of printable pastes can be distinguished. On the one hand, there are pastes that sinter at high temperatures, such as those used in manufacturing of solar cells [
8,
9,
10]. On the other hand, temperature-sensitive applications such as heterojunction or perovskite tandem solar cells, or printed electronic products on temperature-sensitive, flexible polymeric substrates require pastes that cure at low temperatures well below 250 or even 150 °C [
11,
12]. These pastes contain a polymeric binder, which ensures cohesion of the printed structure and its adhesion to the substrate [
13]. Besides that difference, low temperature curing printing pastes typically contain conductive fillers, additives and solvents similar to high temperature pastes [
11].
The polymeric binders in low temperature curing pastes and electrically conductive adhesives (ECAs) for printed electronics can be divided into two groups: reactive thermosetting systems such as epoxy or acrylic resins, and thermoplastic systems such as polyols, polyamides, or polyurethanes [
14]. Depending on the application, either thermosetting systems with their higher strength, low shrinkage and temperature stability [
15] or thermoplastic systems which can be fluidized again, and offer a wide range of flexibility [
16] may be more suitable. Silver is often used as a conductive material due to its high electrical conductivity (κ ≈ 6.3 × 10
7 Sm
−1). Alternatives include copper, aluminum, or graphite [
17,
18]. Due to the intensive use of silver in all areas of printed electronics, particularly in photovoltaics, shortages are to be expected. Hallam et al. conclude that in a business-as-usual scenario, around 85 to 98 percent of global silver reserves would be committed to photovoltaics alone by 2050 [
19]. The rising silver prices on the stock markets in recent years reflect this trend towards a scarcity of the precious metal, which is manifested in a six-year deficit in the silver supply [
20].
To reduce silver usage and maintain a high conductivity, numerous strategies have been developed. It has been demonstrated that the morphology of conductive particles (flake-shaped or spherical, micro- or nanoscale) has a decisive influence on the conductivity of the corresponding printed as well as cured or dried structures. The critical concentration to achieve percolation can be reduced using filler particles, with higher surface area [
21]. A broad compared to a narrow particle size distribution also resulted in a lower percolation threshold [
22]. While large flake-shaped particles show high contact areas and thus improve conductivity [
23], nanoscale particles promote sintering even at low temperatures [
24]. On the other hand, organic surface layers introduced to disperse and stabilize the particles in the binder phase may prevent sintering and due to its insulating properties deteriorate electrical conductivity [
24]. This highlights the importance of particle stabilizer type and amount on the resulting conductivity of the finally printed feature [
25]. These stabilizers can be of polymeric nature such as, for example, polyvinylpyrrolidone (PVP) or small molecules like alkanethiols, alkylamines and carboxylic acids and it is important to use the agent with suitable decomposition temperatures to maximize the sintering effect [
26]. A completely different approach is to increase conductivity by adding inert fillers or gas bubbles, creating excluded volume thereby facilitating the formation of conductive pathways around these non-conductive regions and thus reducing the percolation threshold [
27,
28,
29,
30]. Inert fillers with a conductive coating layer are a special case of this concept [
31]. Furthermore, bi-continuous polymer structures can be used to significantly lower the percolation threshold and thereby influence electrical conductivity [
32].
Although these methods all bring significant improvements, they essentially follow the same basic approach, in which particles are dispersed in a carrier medium, often also termed vehicle. Further improvements can be achieved by adopting a fundamentally different approach that utilizes the principle of capillary suspensions instead of two-phase systems. Capillary suspensions are ternary particle–liquid–liquid systems [
33]. The addition of small amounts of a secondary liquid immiscible with the continuous phase induces the formation of a continuous particle network due to capillary forces. The strength of the particle network depends on the interfacial tension between both liquids, the contact angle of the secondary fluid on the particles, and the amount of secondary liquid relative to the particle volume fraction [
33]. It is not necessary that the secondary liquid preferentially wets the particles [
33], and the network that forms allows the flow properties and storage stability of a suspension to be adjusted without the need for additional additives. Beyond that, formulations based on capillary suspensions enable a shift in the percolation threshold for conductive, printable metal-polymer composites. For conductive elastomers, the capillary suspension concept was used to significantly shift the percolation threshold while simultaneously achieving improved mechanical properties, particularly a higher durability during cyclic loading [
34,
35]. Capillary suspensions have also been used to formulate electrically conductive adhesives (ECAs) [
31] with below 4 vol% silver content while still meeting the specifications for shingled solar cell interconnection in terms of volume and contact resistivity as well as mechanical strength in the cured and sufficient shelf-life and printing properties in the uncured state [
31]. On the other hand, no improvement in conductivity due to the capillary suspension effect has yet been demonstrated in polymer-metal composites with filler content clearly exceeding the percolation threshold [
35]. One reason is that, even without strong attractive forces among particles, there are plenty of particle contact points in the material simply due to geometrical constraints.
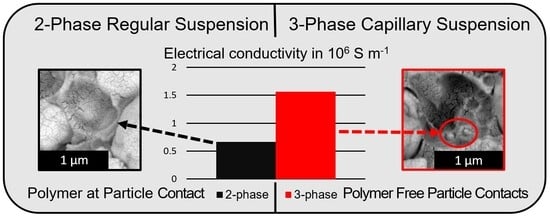
So far it has been demonstrated that the capillary suspension concept can be used to increase conductivity in composites of polymer and conductive fillers at low and intermediate particle loadings due to a shift in the percolation threshold. In the work presented here, we demonstrate that this concept can also be used to enhance the conductivity of concentrated systems well above the percolation threshold with an already large number of particle contacts due to geometrical constraints. To achieve this, the secondary liquid is chosen such that it remains in the particle contact region during solidification or curing of the polymer included in the primary phase [
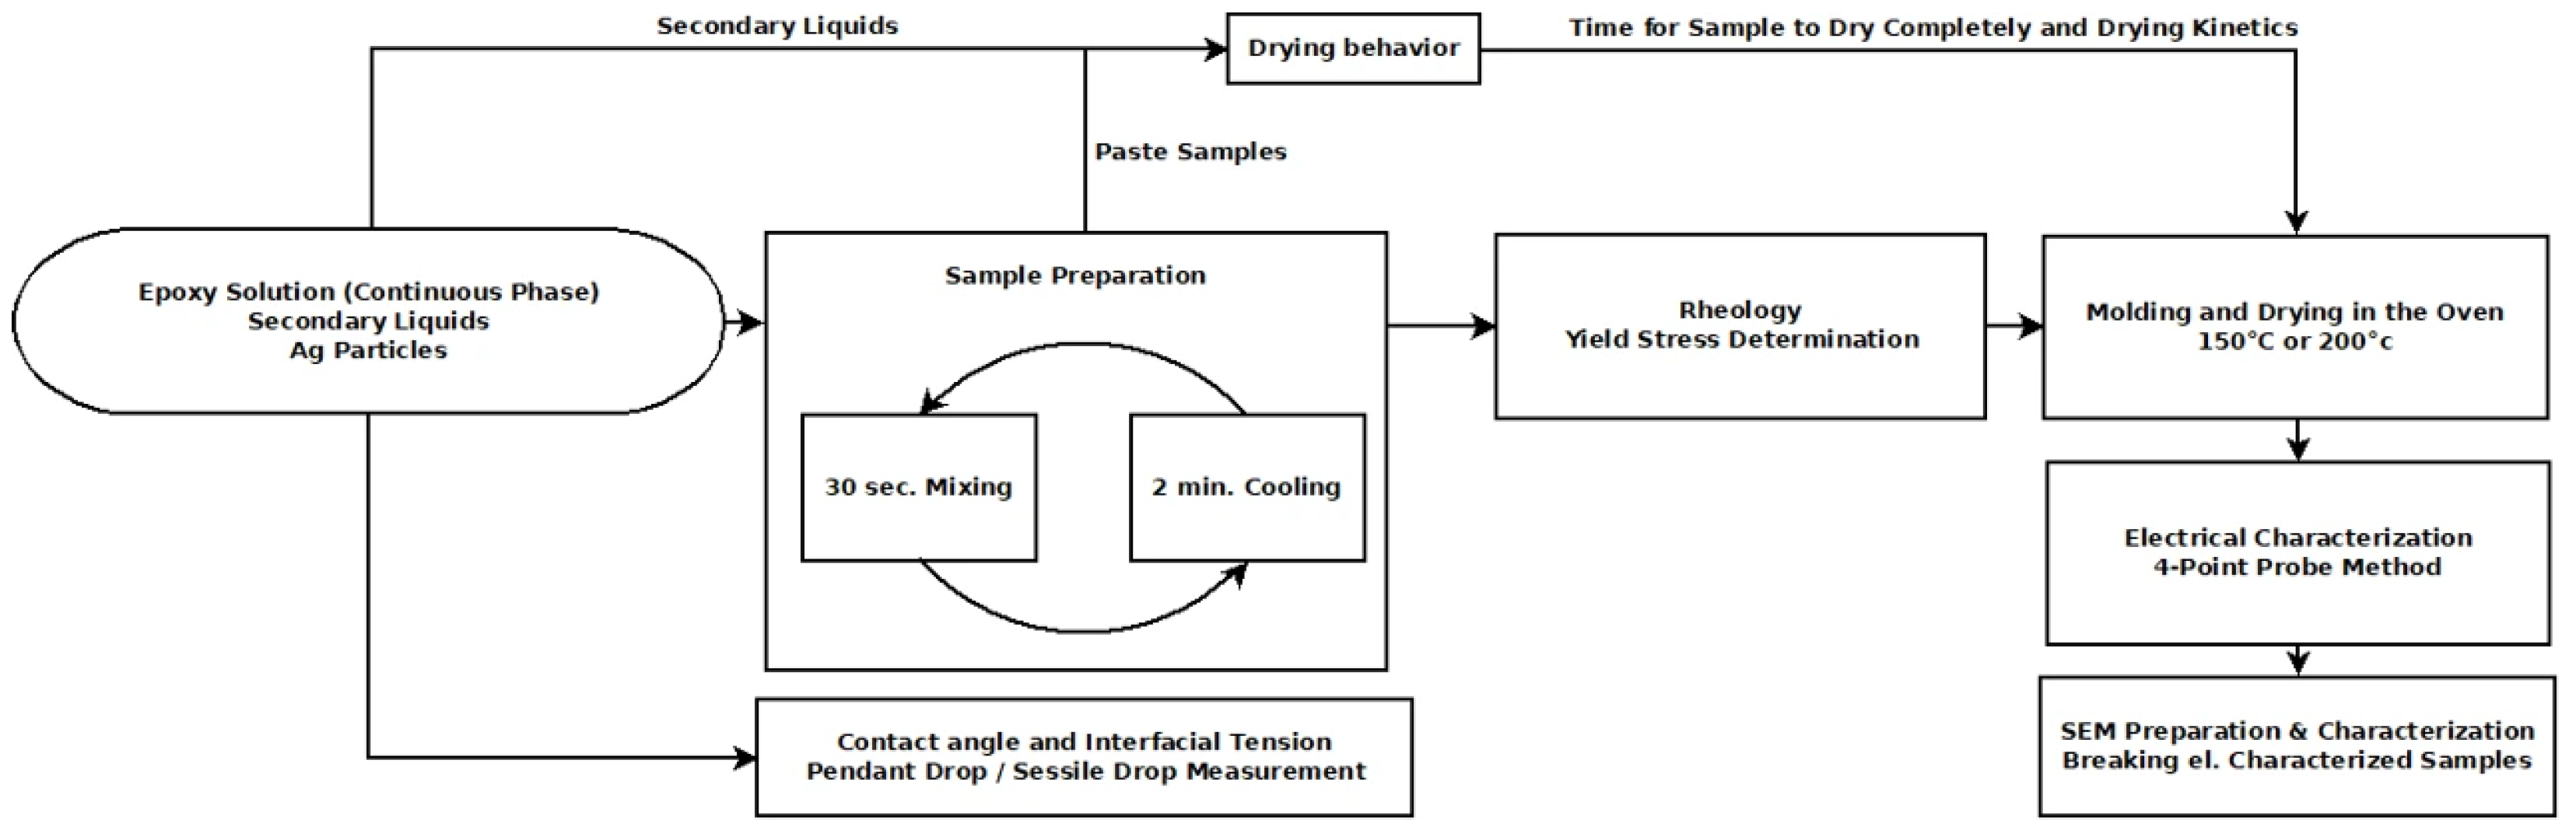
36]. The secondary liquid thus prevents the polymer from entering into the contact regions. After solidification, however, it should leave the sample so that it does not act as an insulating layer in the particle contact areas. Accordingly, the secondary liquid should have a higher boiling point and/or lower vapor pressure than the solvent in the primary fluid. The effectiveness of this novel approach is demonstrated in detail using a thermosetting system systematically modified using secondary liquids with boiling points below, equal, and above that of the primary phase. The study examines how this affects the conductivity of the solidified material and whether the increase in conductivity is indeed attributable to polymer-free contact points. The general applicability of the concept also to thermoplastic systems is then demonstrated using the most effective secondary liquid from the first part of the investigation. Commercially available, nearly monodisperse, spherical silver particles have been used for this proof of concept. A transfer to other particle shapes should be addressed in future research.
3. Results and Discussion
3.1. Macrostructure of Particle Network
In capillary suspensions, the yield stress typically rises upon addition of the secondary liquid compared to the corresponding binary suspension in a characteristic manner [
33]. This behavior is therefore often used as an indicator of the formation of the capillary particle network. Thus, in
Section 3.1.1, the yield stress is used to characterize the particle network in the paste, while in
Section 3.1.2, the preservation of the network in the dry and cured composite is evaluated using SEM images.
3.1.1. Characterization in Paste Composition
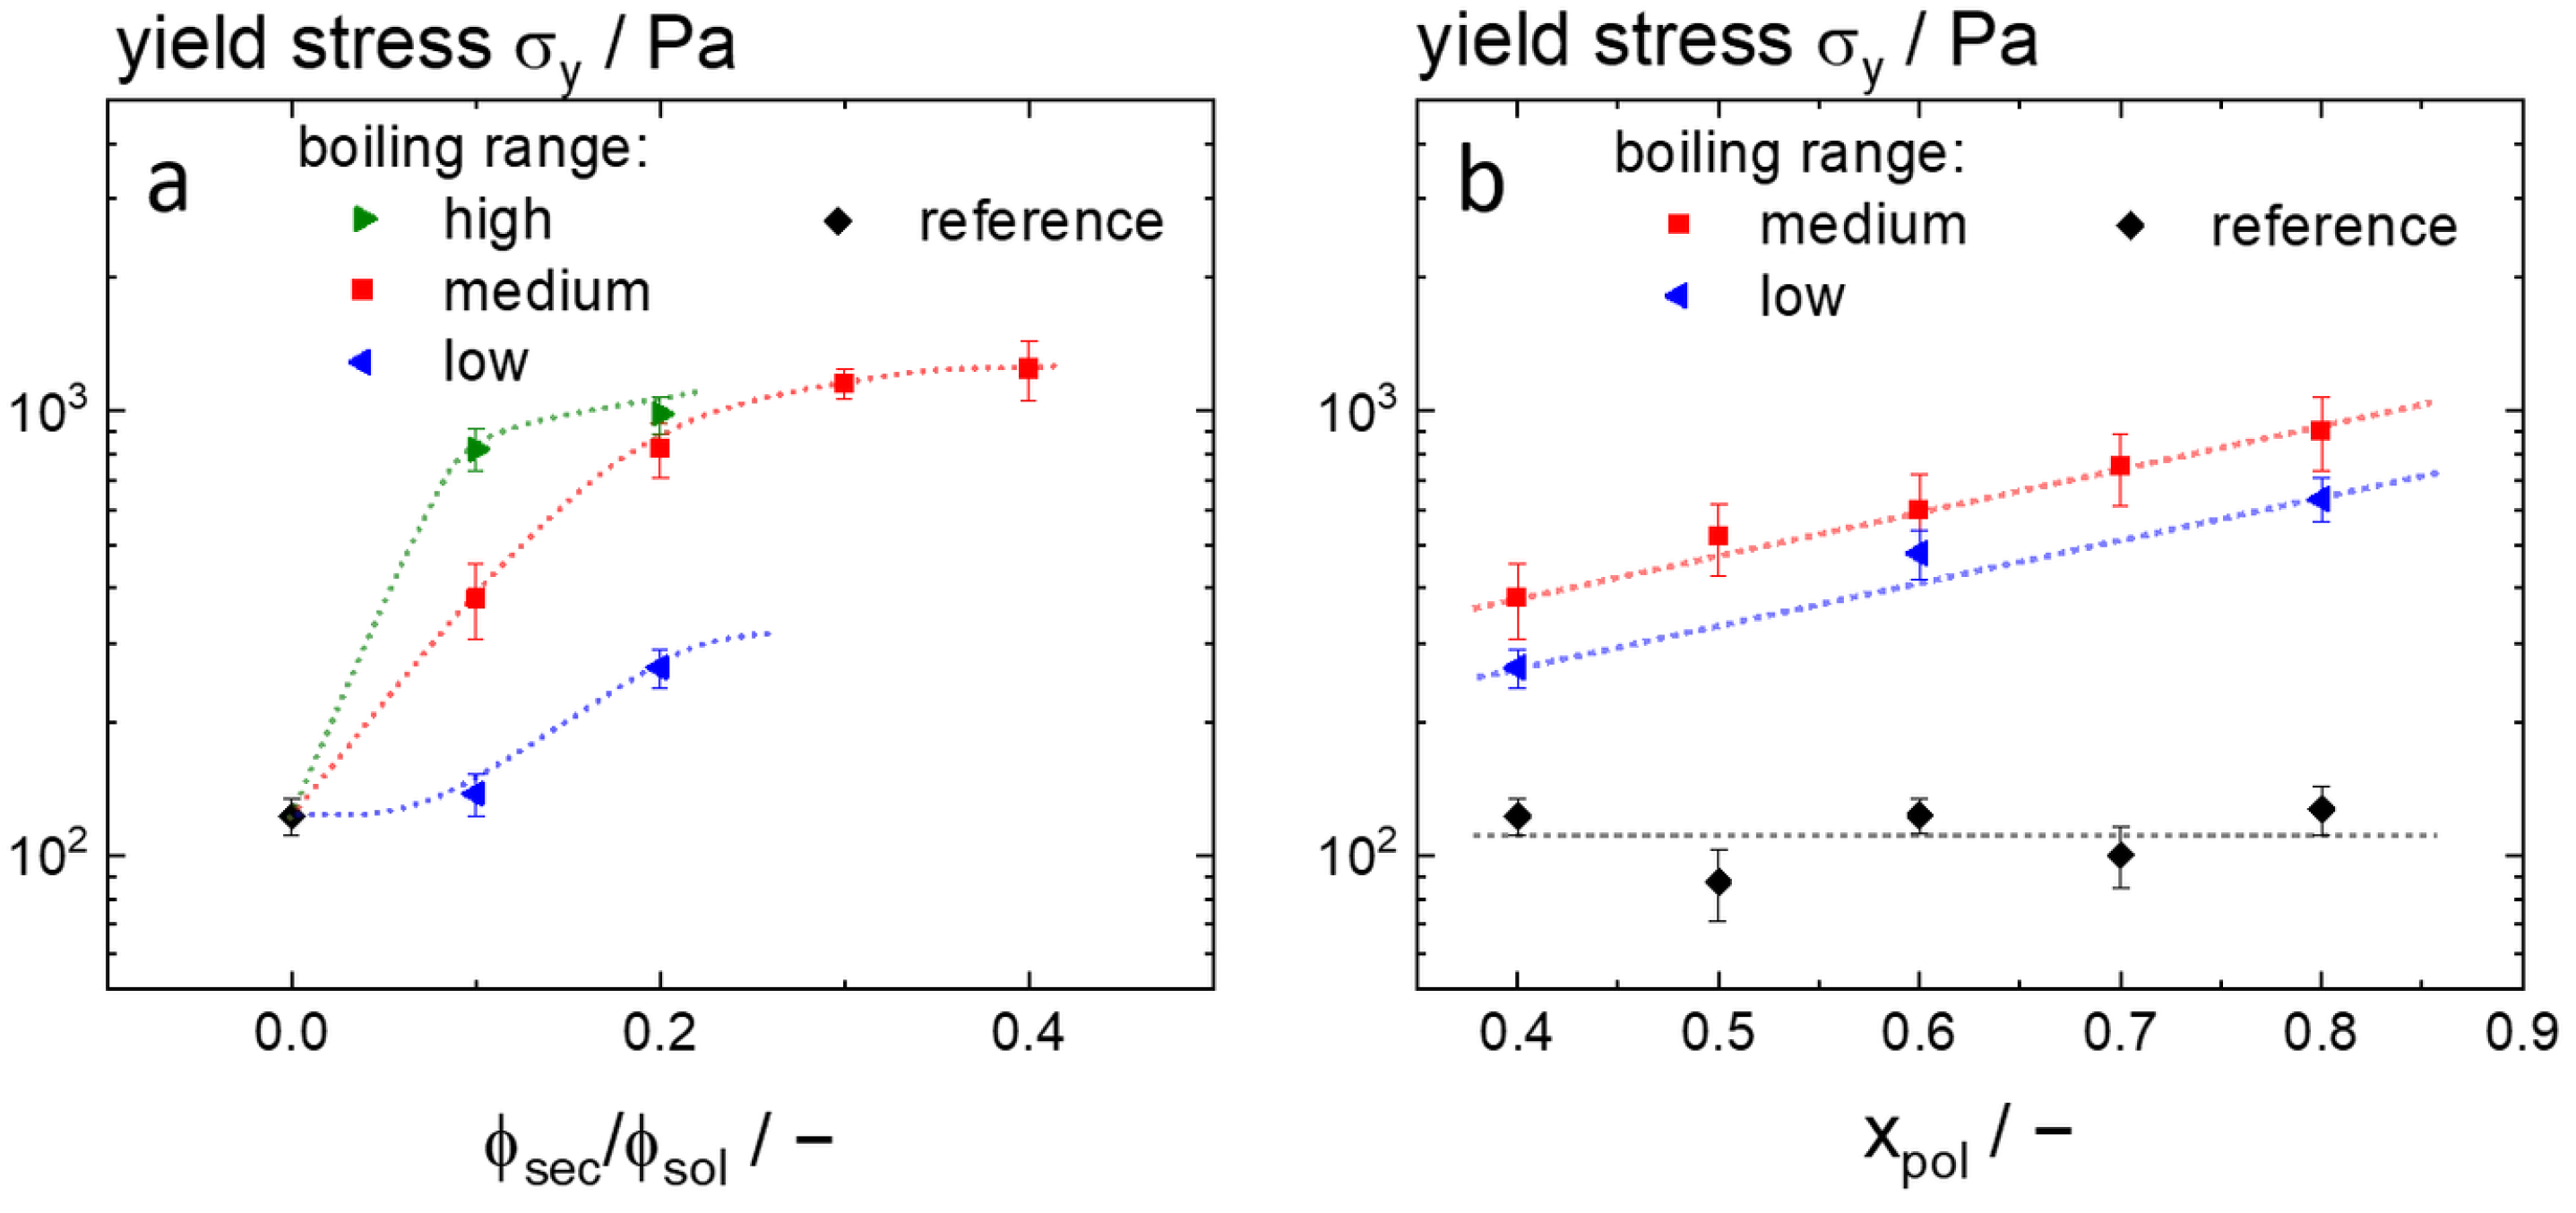
Figure 4a shows the yield stress as a function of the ratio of secondary liquid to particle volume fraction for a continuous phase consisting of a 40 wt.% epoxy solution and three secondary liquid types with different boiling ranges. To show the effect of capillary suspensions on creating polymer-free particle contact zones, all other parameters were kept constant and a typical particle loading of 40 vol% was selected.
Samples including the medium boiling secondary liquid (red) were characterized over a broad range of ϕ
sec/ϕ
sol and show the behavior expected for capillary suspensions [
33] mentioned above. As the proportion of secondary liquid increases, the yield stress σ
y rises sharply until it reaches a plateau. Qualitatively, a similar behavior is found for the other two secondary liquids, for the high boiling secondary liquid the plateau in σ
y seems to be reached at lower ϕ
sec/ϕ
sol and for the low boiling secondary fluid the increase in σ
y apparently sets in at higher ϕ
sec/ϕ
sol. As expected [
33], at a given ratio ϕ
sec/ϕ
sol, the increase in σ
y is more pronounced at a higher interfacial tension among both liquid phases; the corresponding data are listed in
Table 1.
In addition to interfacial tension, the wetting properties between both liquids and the particle surface have a significant influence on structure formation and flow characteristics of capillary suspensions [
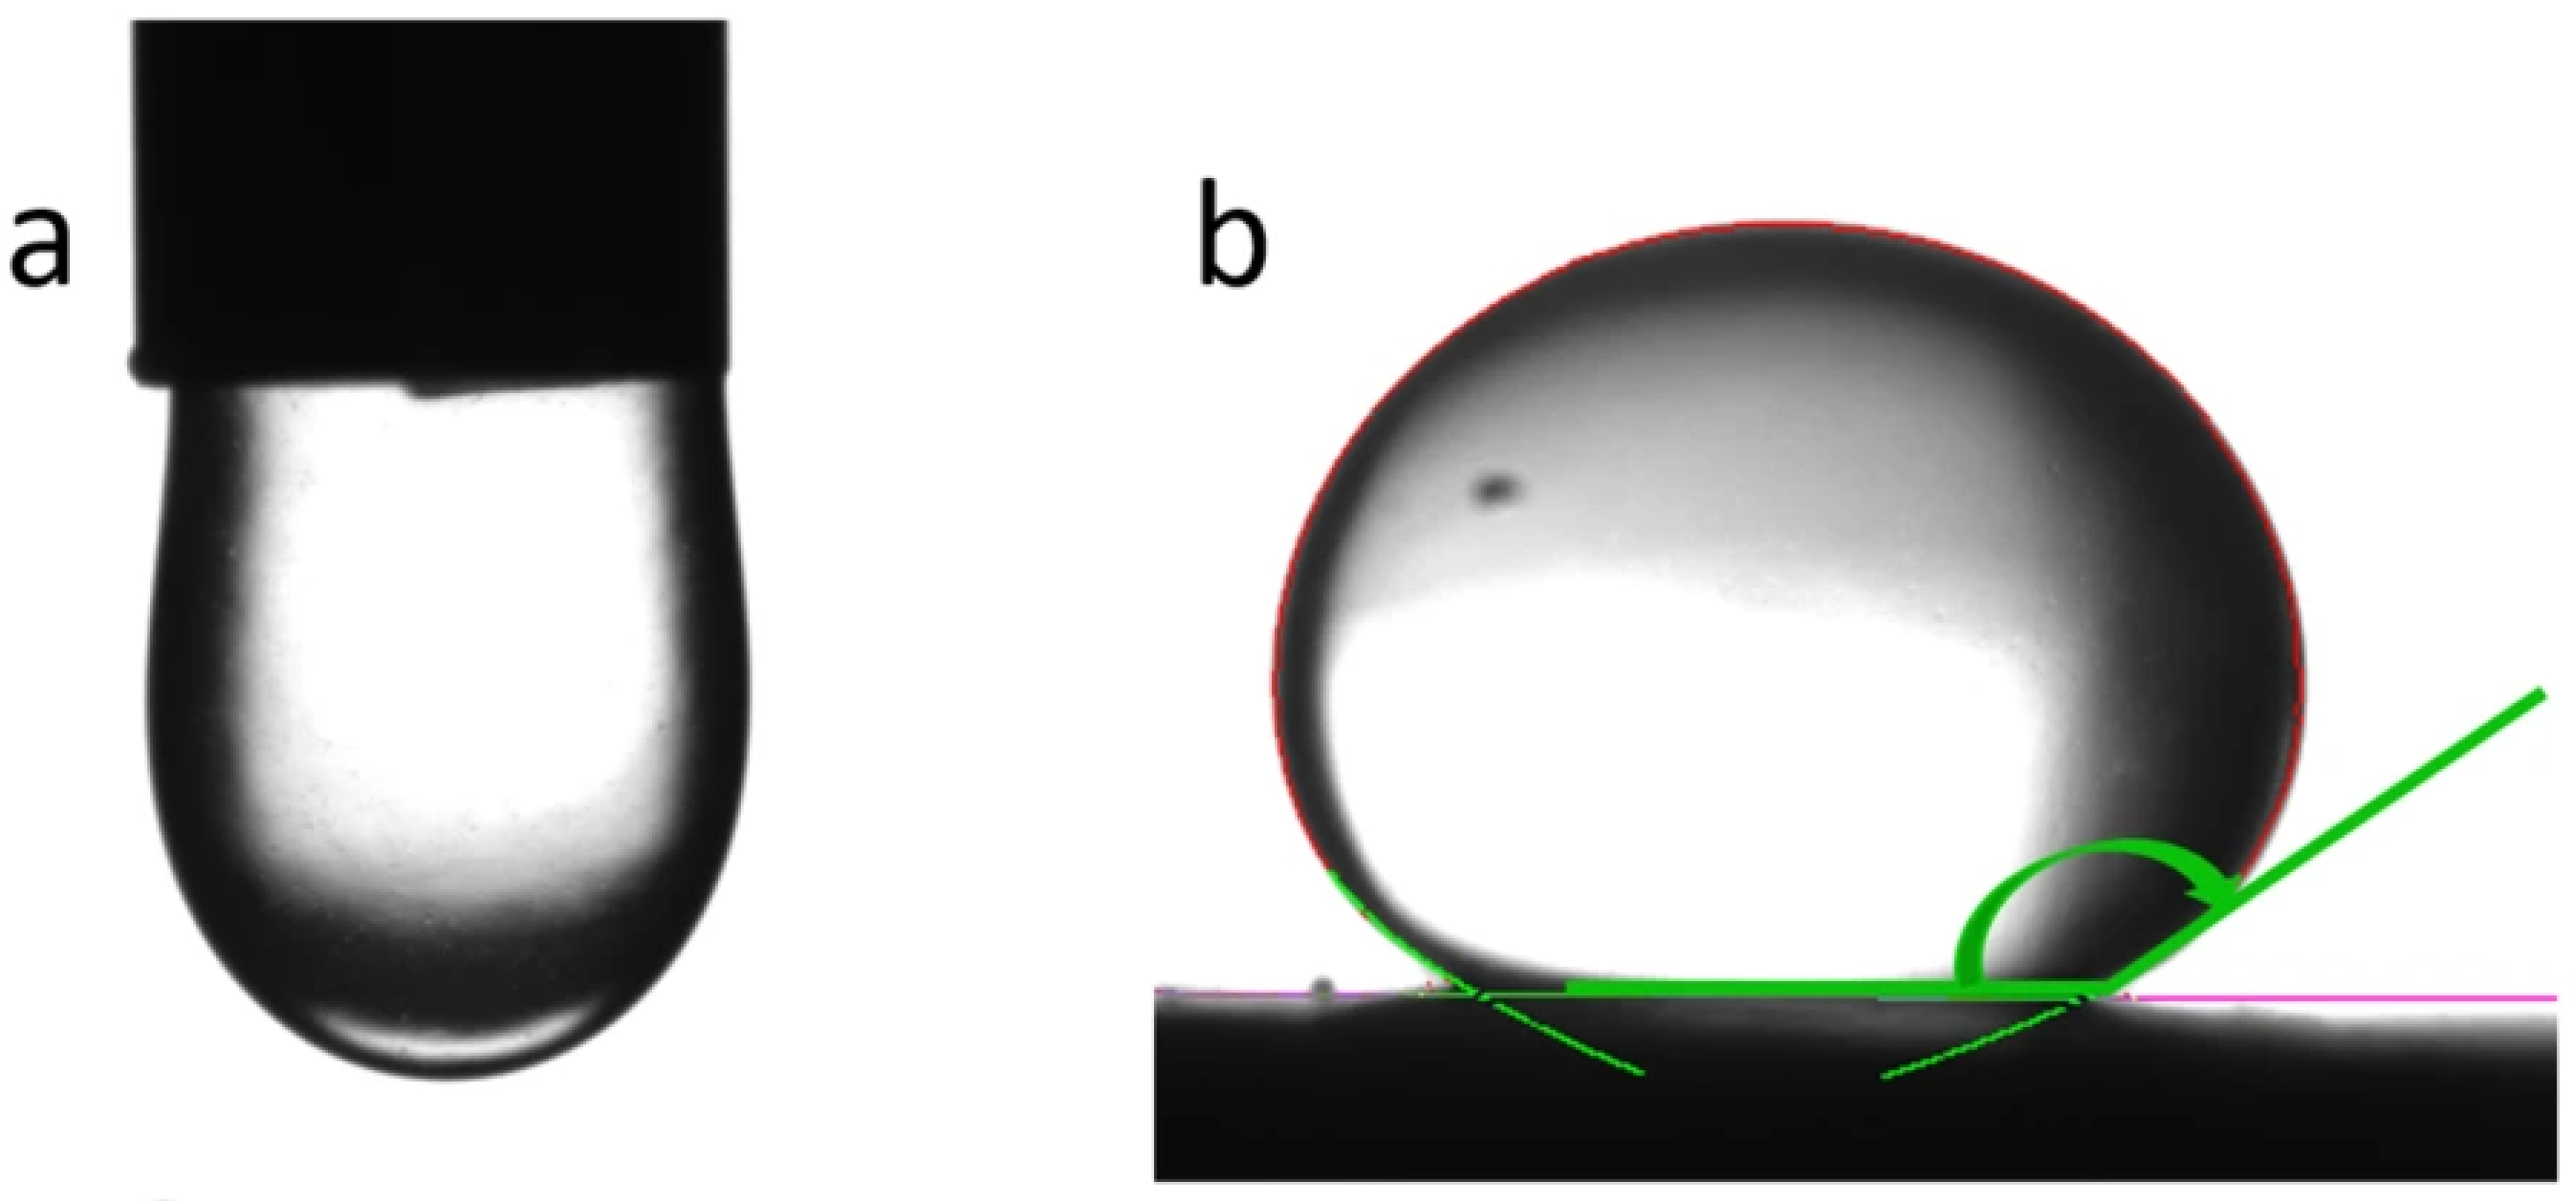
33]. Therefore, the wetting behavior in the three-phase system was examined. When attempting to measure the contact angle of secondary fluid droplets on the plate pressed from the silver particles, the secondary liquid was absorbed into the plate due to residual porosity. This behavior indicates that the secondary liquid wets the particles very well and that a pendular state capillary suspension forms. To further support this conclusion, the three-phase contact angle of a 40 wt.% epoxy solution was measured in the presence of the secondary liquids.
Table 1 shows that the epoxy solution exhibits a high contact angle irrespective of the secondary liquid surrounding it. Therefore, we conclude that the secondary fluid preferentially wets the particles compared to the primary fluid, i.e., a pendular state capillary suspension forms in the ternary system investigated here.
Figure 4b shows the yield stress as a function of polymer content in the continuous phase. Exemplarily, the two-phase system is compared to the three-phase system with the medium boiling secondary liquid at ϕ
sec/ϕ
sol = 0.1 and the low boiling secondary liquid at ϕ
sec/ϕ
sol = 0.2. In the absence of a secondary liquid, the polymer fraction has no significant influence on the yield stress. The values vary between 109 ± 20 Pa, which essentially corresponds to the experimental uncertainty. In contrast, when a secondary liquid is present, the yield stress increases significantly with increasing polymer content. For the low boiling secondary liquid, σ
y rises from 264 ± 26 Pa to 634 ± 71 Pa. This 2.4 ± 0.4 increase in yield stress corresponds to the increase in interfacial tension as can be seen from the normalized data shown in
Table 2. For the medium boiling secondary liquid, σ
y increases from 380 ± 73 Pa to 903 ± 170 Pa. As can be seen from the data in
Table 2, this represents a stronger increase than would be expected based solely on the weak rise in interfacial tension. This is an indication that other factors, such as a change in droplet breakup during mixing due to the increase in viscosity of the continuous phase, may also play a role here.
Overall, it is evident that a capillary network forms for all investigated secondary liquids and polymer contents. However, for the low boiling secondary liquid, ϕsec/ϕsol must exceed 0.1 to facilitate stable network formation, presumably due to partial miscibility of this low molecular weight hydrocarbon mixture and the need to saturate the continuous phase prior to network formation.
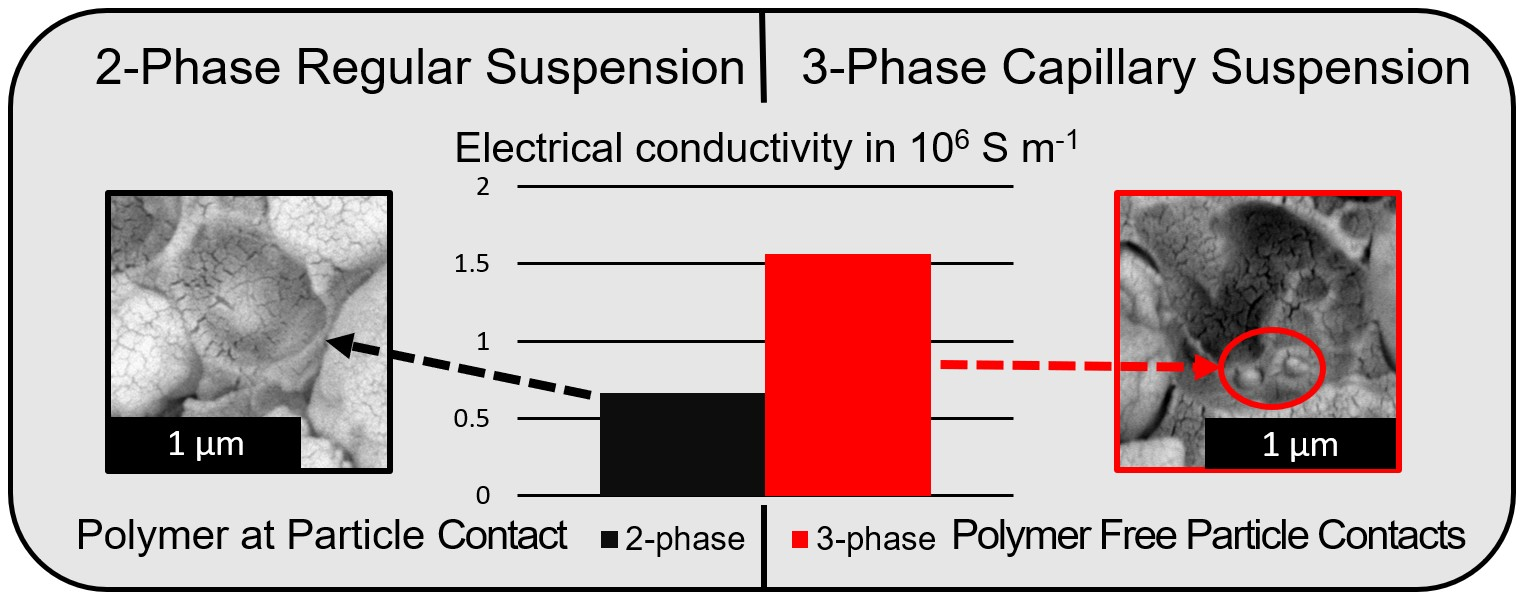
The drying behavior of the pastes was characterized and the time required for the films to dry completely was well below the total drying time employed to create films for conductivity measurements. It appeared to be roughly independent of paste composition (polymer content, presence and boiling temperature of secondary fluid). Differences occurred, however, in the initial drying rate; the corresponding data are summarized in
Table 3.
The initial drying rate of the capillary suspension type for ternary pastes is the same as for the binary reference paste, irrespective of the boiling range of the secondary liquid. In contrast, earlier work on polymer-free suspension showed that the particle network controlled by capillary forces preserved the open pores in the sample and accelerated sample drying [
41]. This suggests that the drying rate here is mainly controlled by the polymer films in the pores between the particles serving as diffusion barrier. This is further supported by the significant decrease in initial drying rate with increasing polymer content in the primary liquid. Furthermore, the pure solvent drying behavior was characterized at 150 °C for 10 min. The high boiling secondary liquid exhibits an evaporation rate of 0.24 mg/s, which is significantly lower than that of the medium boiling liquid (4.5 mg/s) and also lower than that of the vehicle solvent (0.55 mg/s). Since 150 °C is in the boiling range of the low boiling secondary liquid, its evaporation speed could not be determined.
To determine whether the curing kinetics of the epoxy resin are affected by the secondary liquid, DSC measurements were carried out. No shift in the exothermic curing peak was observed. Both the reference paste and the capillary suspensions with all three secondary liquids were cured in the temperature range of 130–155 °C, with a peak at 143.9 ± 0.5 °C. No changes in the mechanical strength of the composites were detected, as confirmed by Shore A hardness tests conducted according to ASTM D2240, which yielded values of 92 ± 2 for all samples. Next, the microstructure and electrical conductivity of the cured composites will be discussed.
3.1.2. Overall Structure of Cured Composites from Binary and Ternary Pastes as Characterized by SEM
Sample preparation methods for SEM imaging may deteriorate the microstructure of a polymer composite, particularly the contact regions between particles. Mechanical grinding and polishing, for example, may smear the polymer into the particle–particle contact points and thereby alter the native structure of the network. To minimize preparation-induced artifacts and to preserve both the particle network structure and the polymer distribution around the particles, fracture surfaces were chosen for characterization. Epoxy resin used here fractures in a brittle manner, such that the internal structure of the sample is hardly affected by the fracture process.
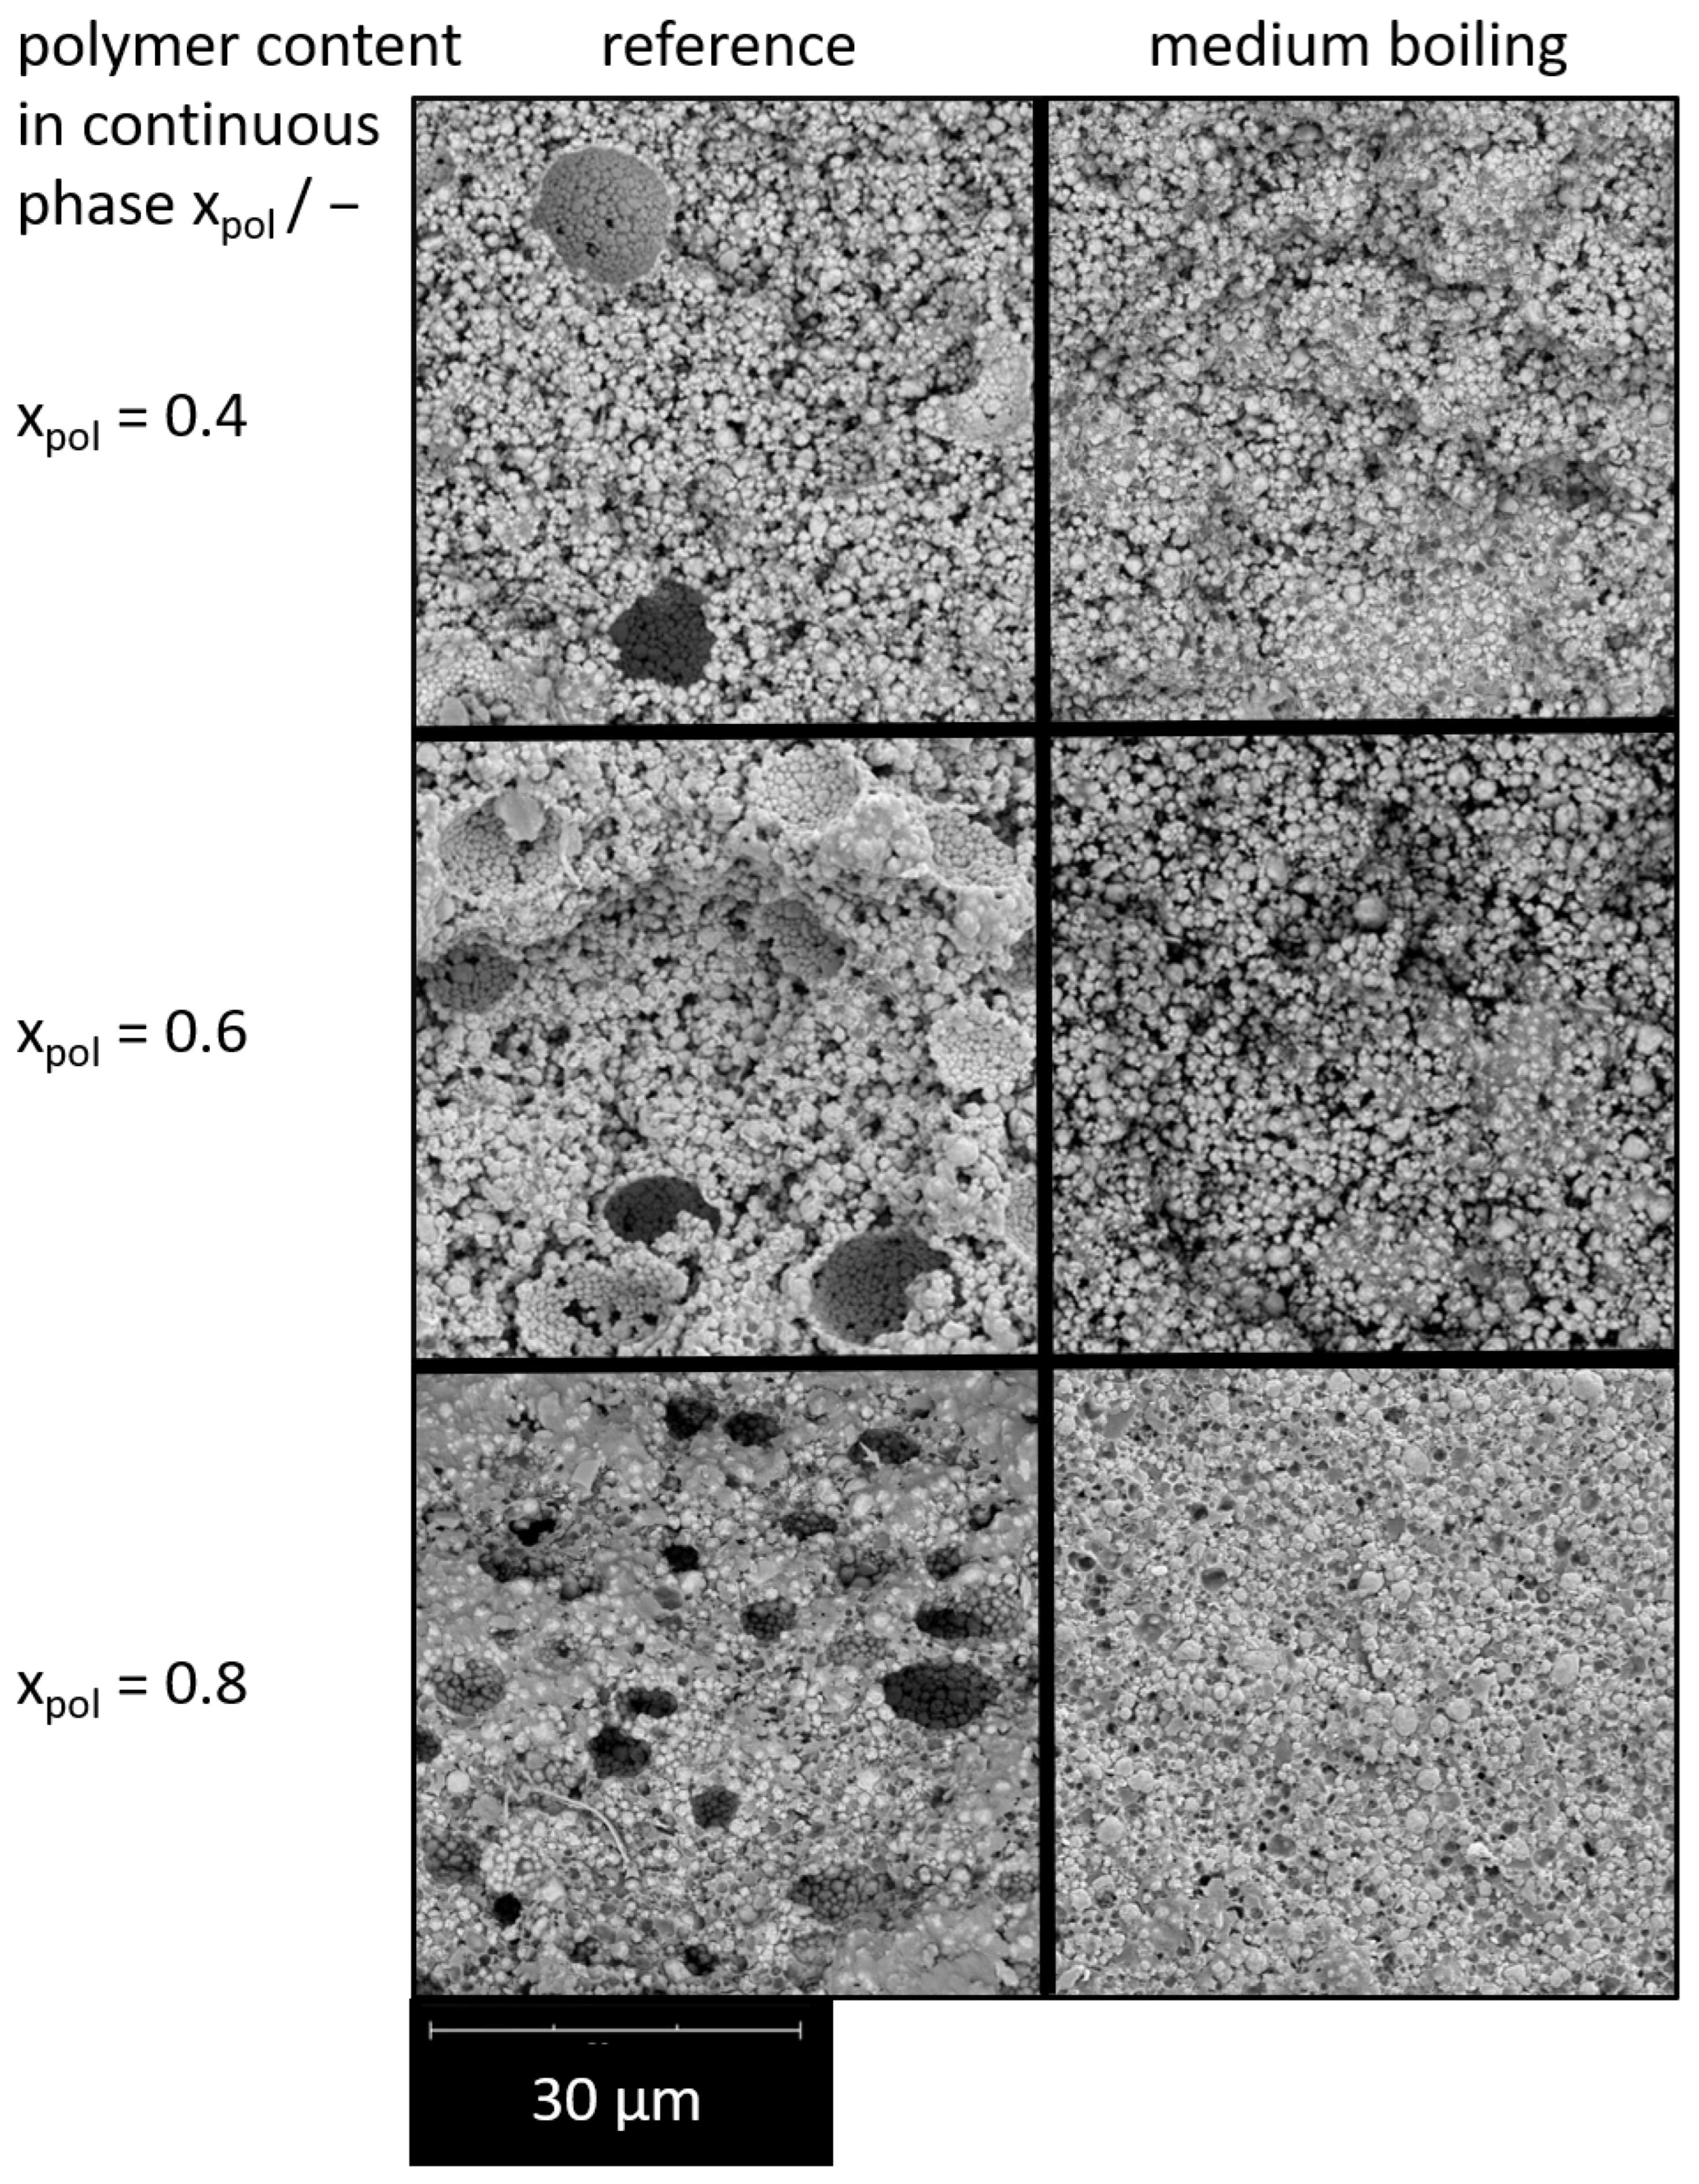
Figure 5 illustrates the resulting overall structure of the samples prepared according to this method. Both the films made from binary and ternary capillary suspension-type pastes exhibit an open porous structure (black regions in the SEM images).The particle/polymer mixture does not collapse to a dense film upon evaporation of the solvent. Particularly at the lowest concentration, the polymer does not fill the voids between the particles as can be seen in the first line of
Figure 5. The open porosity decreases as the polymer content increases and the area of the featureless regions representing the polymer increases. Moreover, the films made from binary pastes show numerous residuals of large gas bubbles. In these samples, collapse of the particle network during drying is more pronounced and the smaller capillaries between the particles are partly closed by polymer films locally preventing solvent evaporation and leading to the formation of large round voids. The extent of this void formation increases with increasing polymer content, indicating a stronger restriction of solvent transport at higher polymer fractions.
Such voids do not occur in the films made from ternary pastes. This suggests that the porous structure of the particle network controlled by capillary forces is preserved during drying as observed earlier [
42] and does not allow for the formation of closed polymer films, thus facilitating solvent escape.
3.2. Electrical Conductivity of Polymer Composites
Numerous strategies have been developed to enhance conductivity in highly filled polymer composites at a given silver content, including optimization of particle morphology and size distribution, control of stabilizers and their decomposition, as well as the use of inert fillers, gas bubbles, or bi-continuous structures to lower the percolation threshold. Building on this, we investigate whether capillary suspensions represent a viable additional approach to further improve conductivity by promoting the formation of polymer-free contact regions between particles.
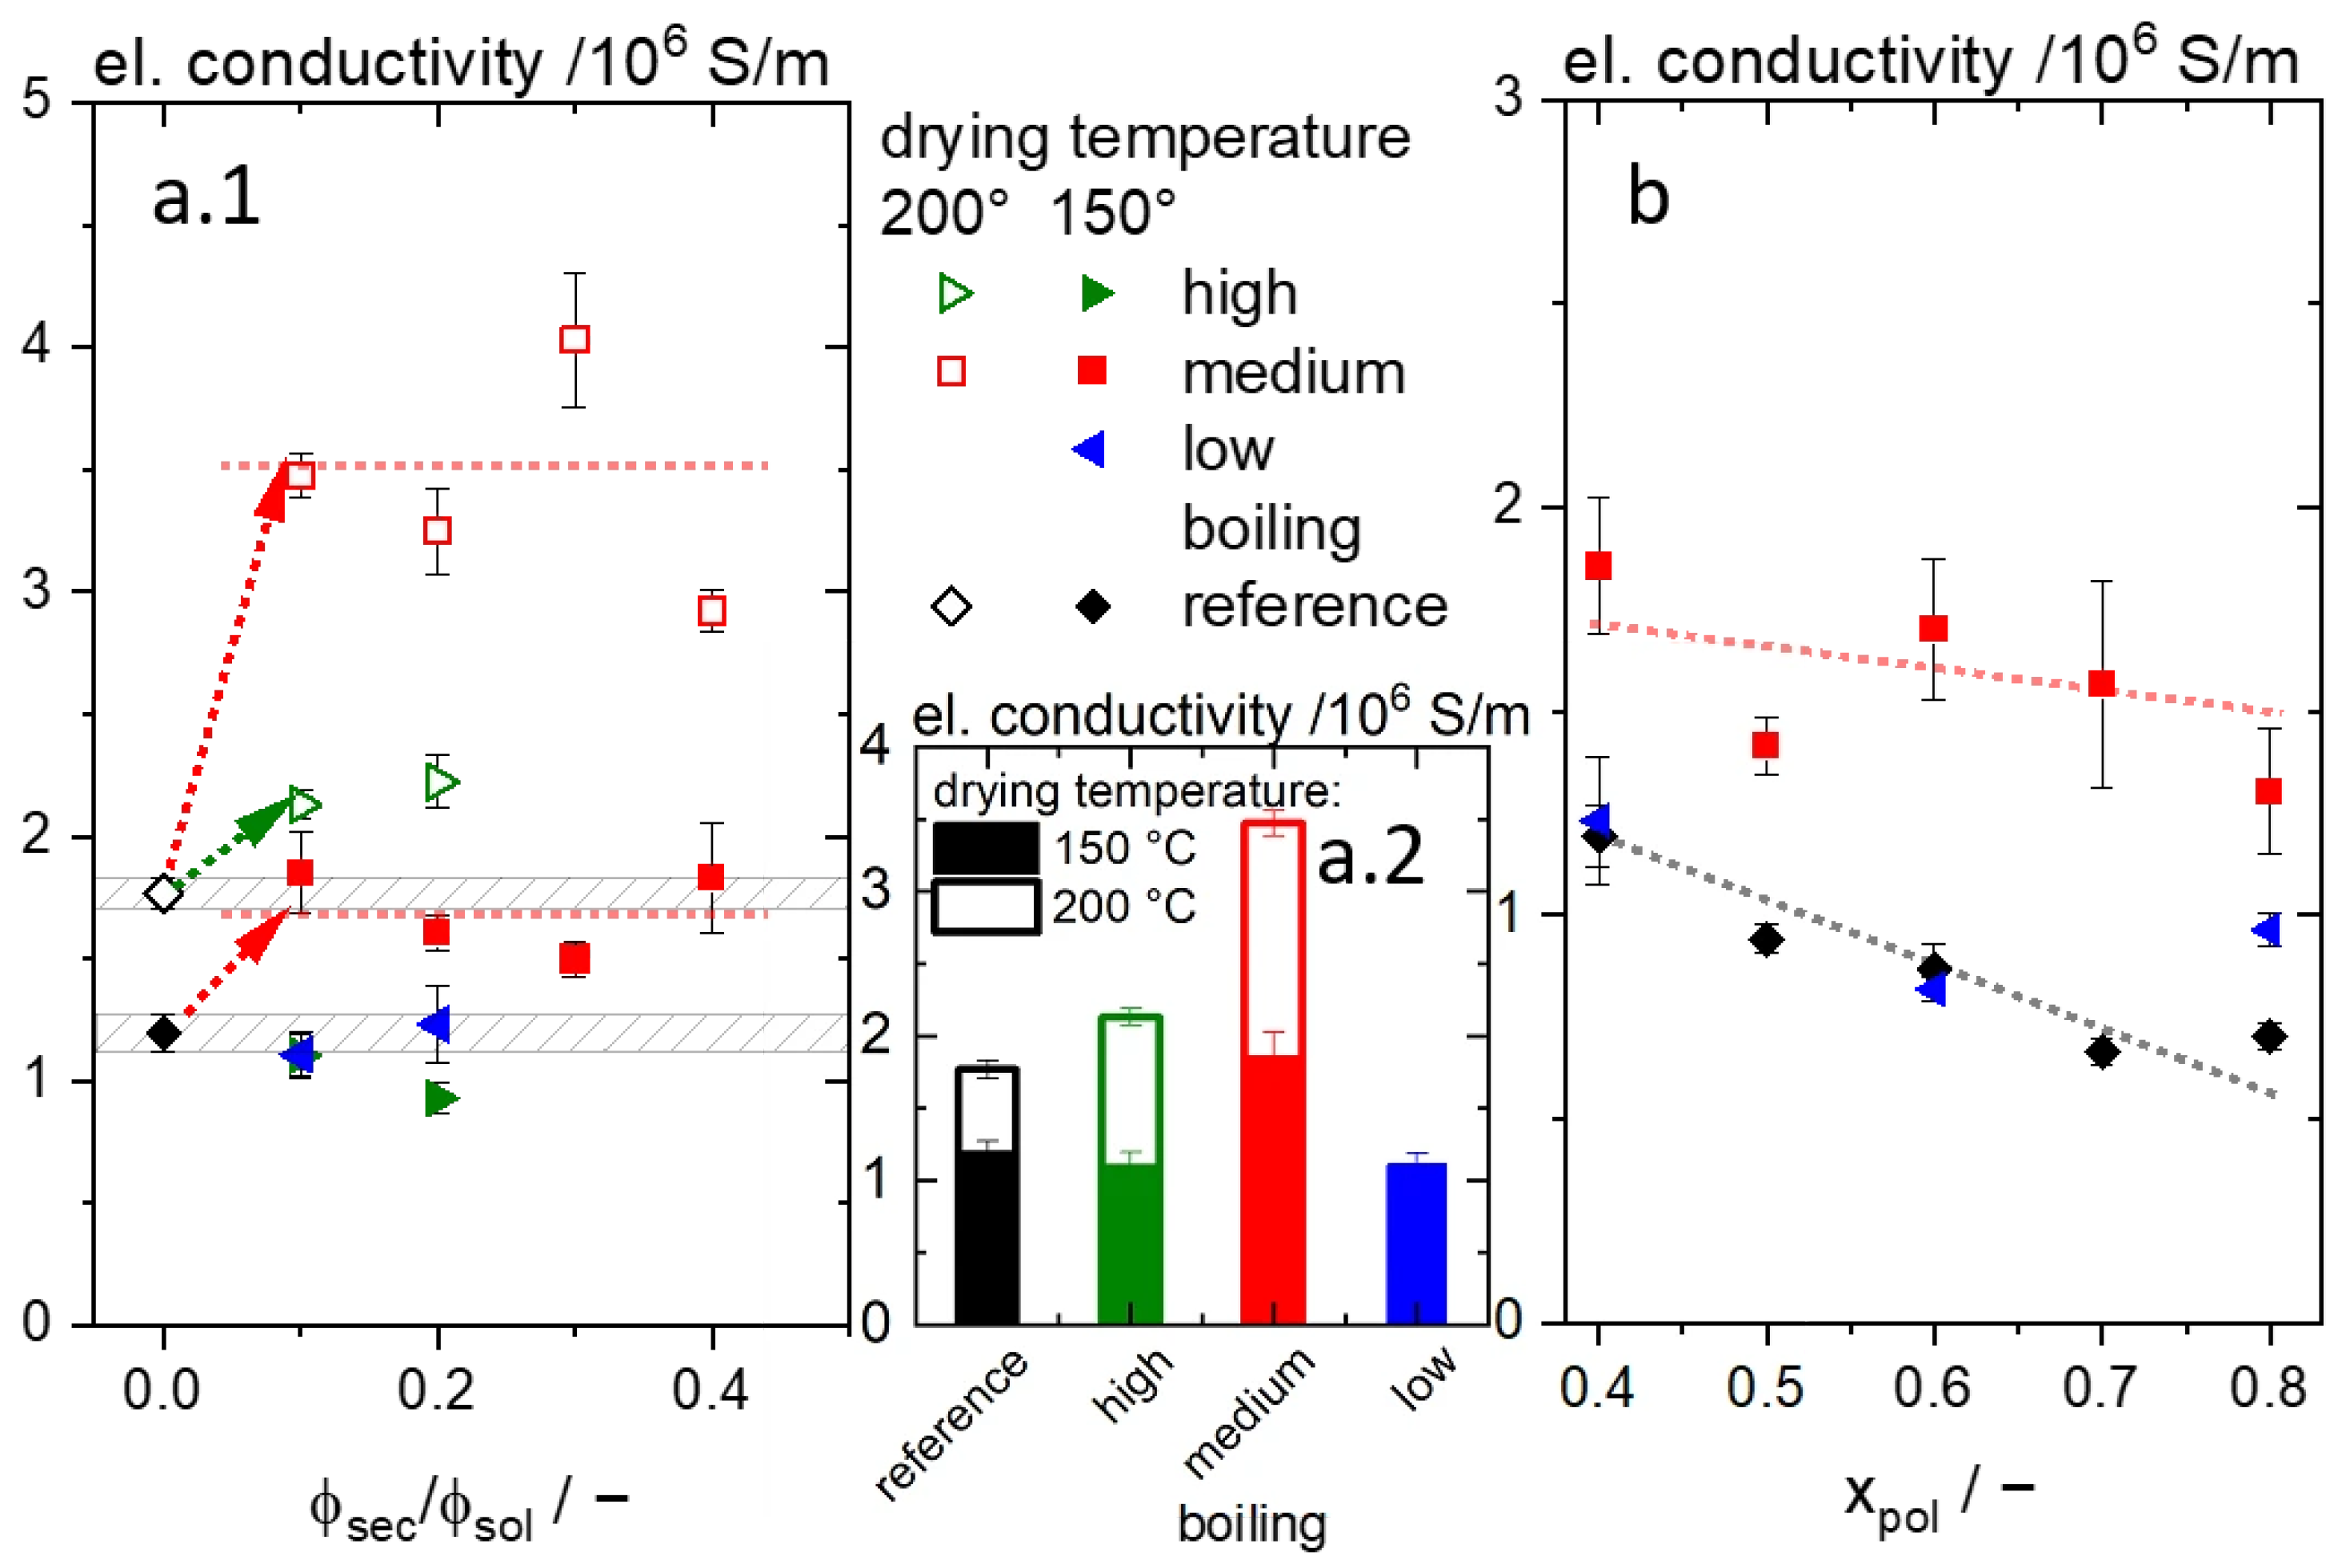
Figure 6(a.1,a.2) depicts the electrical conductivity as a function of the ratio of secondary liquid to particle volume fraction for the three secondary liquids with different boiling ranges. The boiling range of the medium boiling liquid starts at 179 °C and ends at 210 °C, i.e., in the range of the boiling point of 205 °C of the benzyl alcohol in the primary continuous phase, whereas the boiling range of the high boiling liquid mixture commences at approximately 50 °C above that value. Data were collected at two different drying temperatures: 150 °C and 200 °C, well below and close to the boiling point of the benzyl alcohol in the primary continuous phase.
All samples containing the medium boiling secondary liquid exhibit an increased electrical conductivity compared to the reference without secondary liquid. At 150 °C drying temperature, this increase is in the range of 25–55%, whereas at 200 °C drying temperature, the electrical conductivity roughly doubles compared to the reference. Overall, there is no distinct dependence of conductivity on ϕsec/ϕsol. We assume that the medium boiling secondary liquid remains in the particle–particle contact regions until the polymer is immobilized due to capillary forces although its boiling range starts below the boiling point of benzyl alcohol. Thus, these regions are kept free of polymer in the dry film, finally leading to a higher electrical conductivity. The absolute conductivity values achieved at 200 °C drying temperature are about twice as high as for the samples dried at 150 °C presumably due to faster solvent evaporation and more pronounced partial sintering of small silver particles.
In contrast, the high boiling secondary liquid does not lead to a remarkable increase in conductivity. At 150 °C drying temperature, the conductivity even seems to decrease at higher secondary liquid fractions, most likely due to incomplete removal of the secondary liquid acting as an electrically insulating phase. This hypothesis is further supported by the evaporation data presented in
Section 3.1 and in line with earlier investigations confirming that due to capillary the secondary liquid in capillary suspensions can be retained during drying, even if the temperature exceeds the boiling point [
42].
At 200 °C drying temperature, the secondary liquid seems to be removed completely and a 26 ± 5% increase in electrical conductivity is found for ϕsec/ϕsol = 0.2. This increase is much less than observed for the medium boiling secondary liquid presumably because the slower removal of the high boiling liquid curtails the partial sintering of silver particles.
For the films made from pastes including the low boiling secondary fluid, no significant difference in electrical conductivity of the dry film was found even for the sample with ϕsec/ϕsol = 0.2, thereby clearly forming a capillary suspension in the wet state. We attribute this to the fast removal of the secondary liquid during drying, allowing the polymer to penetrate the particle–particle contact regions.
Figure 6b shows the electrical conductivity as a function of polymer content in the continuous phase of the wet paste for samples made from pastes including the medium boiling secondary liquid (ϕ
sec/ϕ
sol = 0.1) and from reference pastes without secondary liquid. Obviously, the conductivity decreases with increasing polymer content as expected, since more and more particle contacts are covered by the polymer. The decrease, however, is much weaker for the films made from the capillary suspensions than for those made from the binary reference pastes. This demonstrates that the benefit of adding a secondary liquid to the wet paste with respect to the electrical conductivity is more pronounced at a higher polymer fraction in the dry film. For the system investigated here, an increase in electrical conductivity of 135 ± 8% could be achieved for films including 70 wt.% resin in the continuous phase of the wet paste.
These findings further support the hypothesis that the higher conductivity in films made from capillary suspensions is achieved when the secondary liquid keeps the particle contact points free from the polymer and that this is particularly helpful at higher polymer content in the film. The data obtained for the low boiling secondary fluid demonstrate that the formation of the capillary suspension network structure in the wet paste itself is not sufficient to achieve an enhanced conductivity at high particle loadings well above the percolation threshold. This hypothesis will be further discussed in the following section based on SEM imaging.
3.3. SEM Imaging of Particle–Particle Contact Area
To understand the changes observed in electrical conductivity, the particle contact areas were investigated with high magnification SEM imaging.
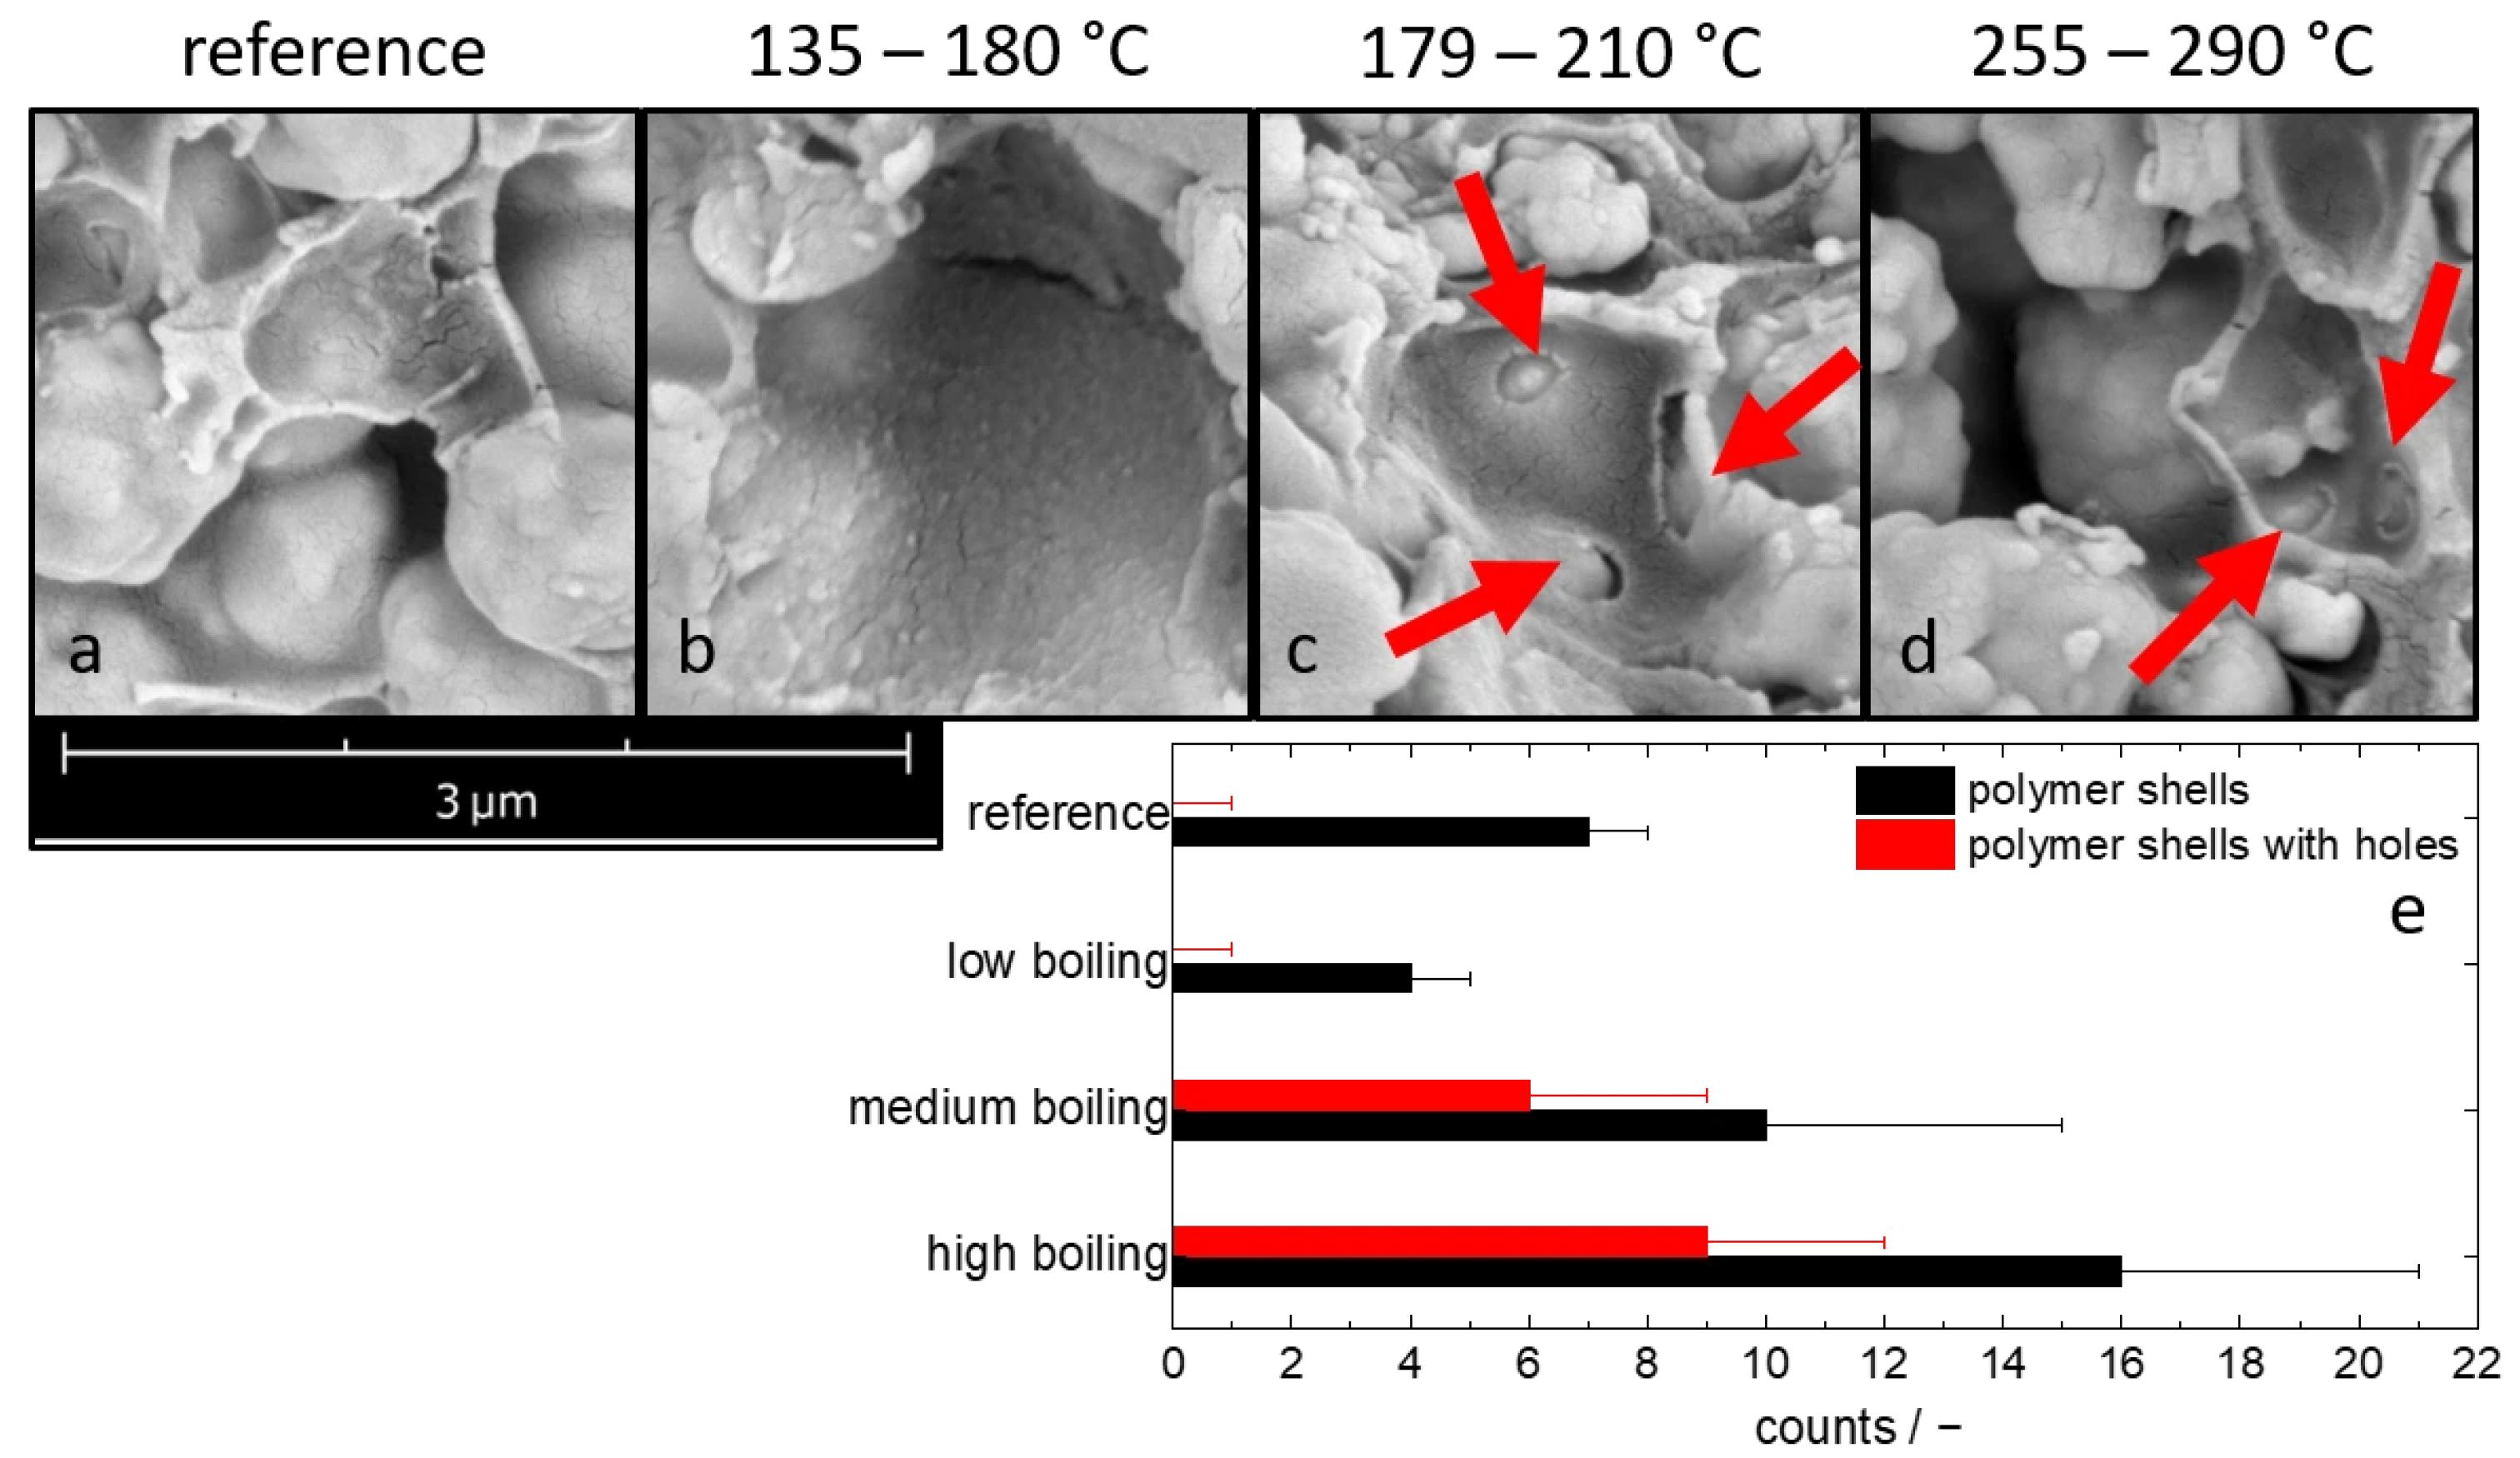
Figure 7 depicts polymer shells observed in the sputtered broken samples, which can be assumed to originate from particles that were pulled out during the preparation process. These shells show only minimal changes due to the release of particles during fracture, and therefore provide insight into how the particles were embedded in the polymer matrix prior to preparation. All depicted samples exhibit the same polymer content of 40 wt.% in the continuous phase, but were prepared from pastes including secondary liquids with different boiling ranges.
In the reference sample without secondary liquid (
Figure 7a), particle imprints surrounded by polymer shells can be observed, through which the underlying particle appears faintly bright. Despite this transparency, the polymer shells remain fully intact, indicating that the polymer fully wets and covers the particle–particle contact regions. The same behavior can be observed with the low boiling secondary liquid (
Figure 7b); as it leaves the sample before the solvent evaporates and the epoxy resin cures, it allows the resin sufficient time to flow back into the particle–particle contact regions. Accordingly, the electrical conductivity is the same as for the binary reference system. In contrast, samples containing medium boiling and high boiling secondary liquids frequently exhibit almost circular holes in the residual particle shells through which the underlying particles are clearly visible (see
Figure 7c,d, highlighted by red arrows). These holes are presumably created due to the presence of the secondary liquid in the contact regions during drying and curing of the epoxy solution. To quantify this phenomenon, the total number of visible polymer shells left behind by particles during breaking as well as those exhibiting a characteristic hole was counted for each SEM image (see
Figure 7e). While no holes, or at most one random hole, were observed in the reference sample and the sample resulting from the paste including the low boiling secondary fluid, a significantly higher number of polymer shells with holes was found in the samples prepared from pastes including medium boiling and high boiling secondary fluids, corresponding to approximately 60% of the polymer shells exhibiting a characteristic hole. A more comprehensive statistical analysis, including hole size distributions and the systematic evaluation and comparison of different sample regions, will be pursued in future work. These polymer-depleted particle–particle contact regions provide a plausible explanation for the observed substantial increase in electrical conductivity when the medium boiling secondary liquid is present. For the films made from pastes including the high boiling secondary liquid, however, the electrical conductivity is substantially lower than for those made from pastes including the medium boiling secondary liquid, and at lower drying temperature the conductivity is even lower than that of the reference without secondary liquid. We attribute these effects to remnants of the high boiling secondary liquid in the contact zones, acting as an insulator.
To gain deeper insights, images were taken at higher polymer concentrations, where the increase in conductivity due to the presence of the medium boiling secondary liquid was even more pronounced.
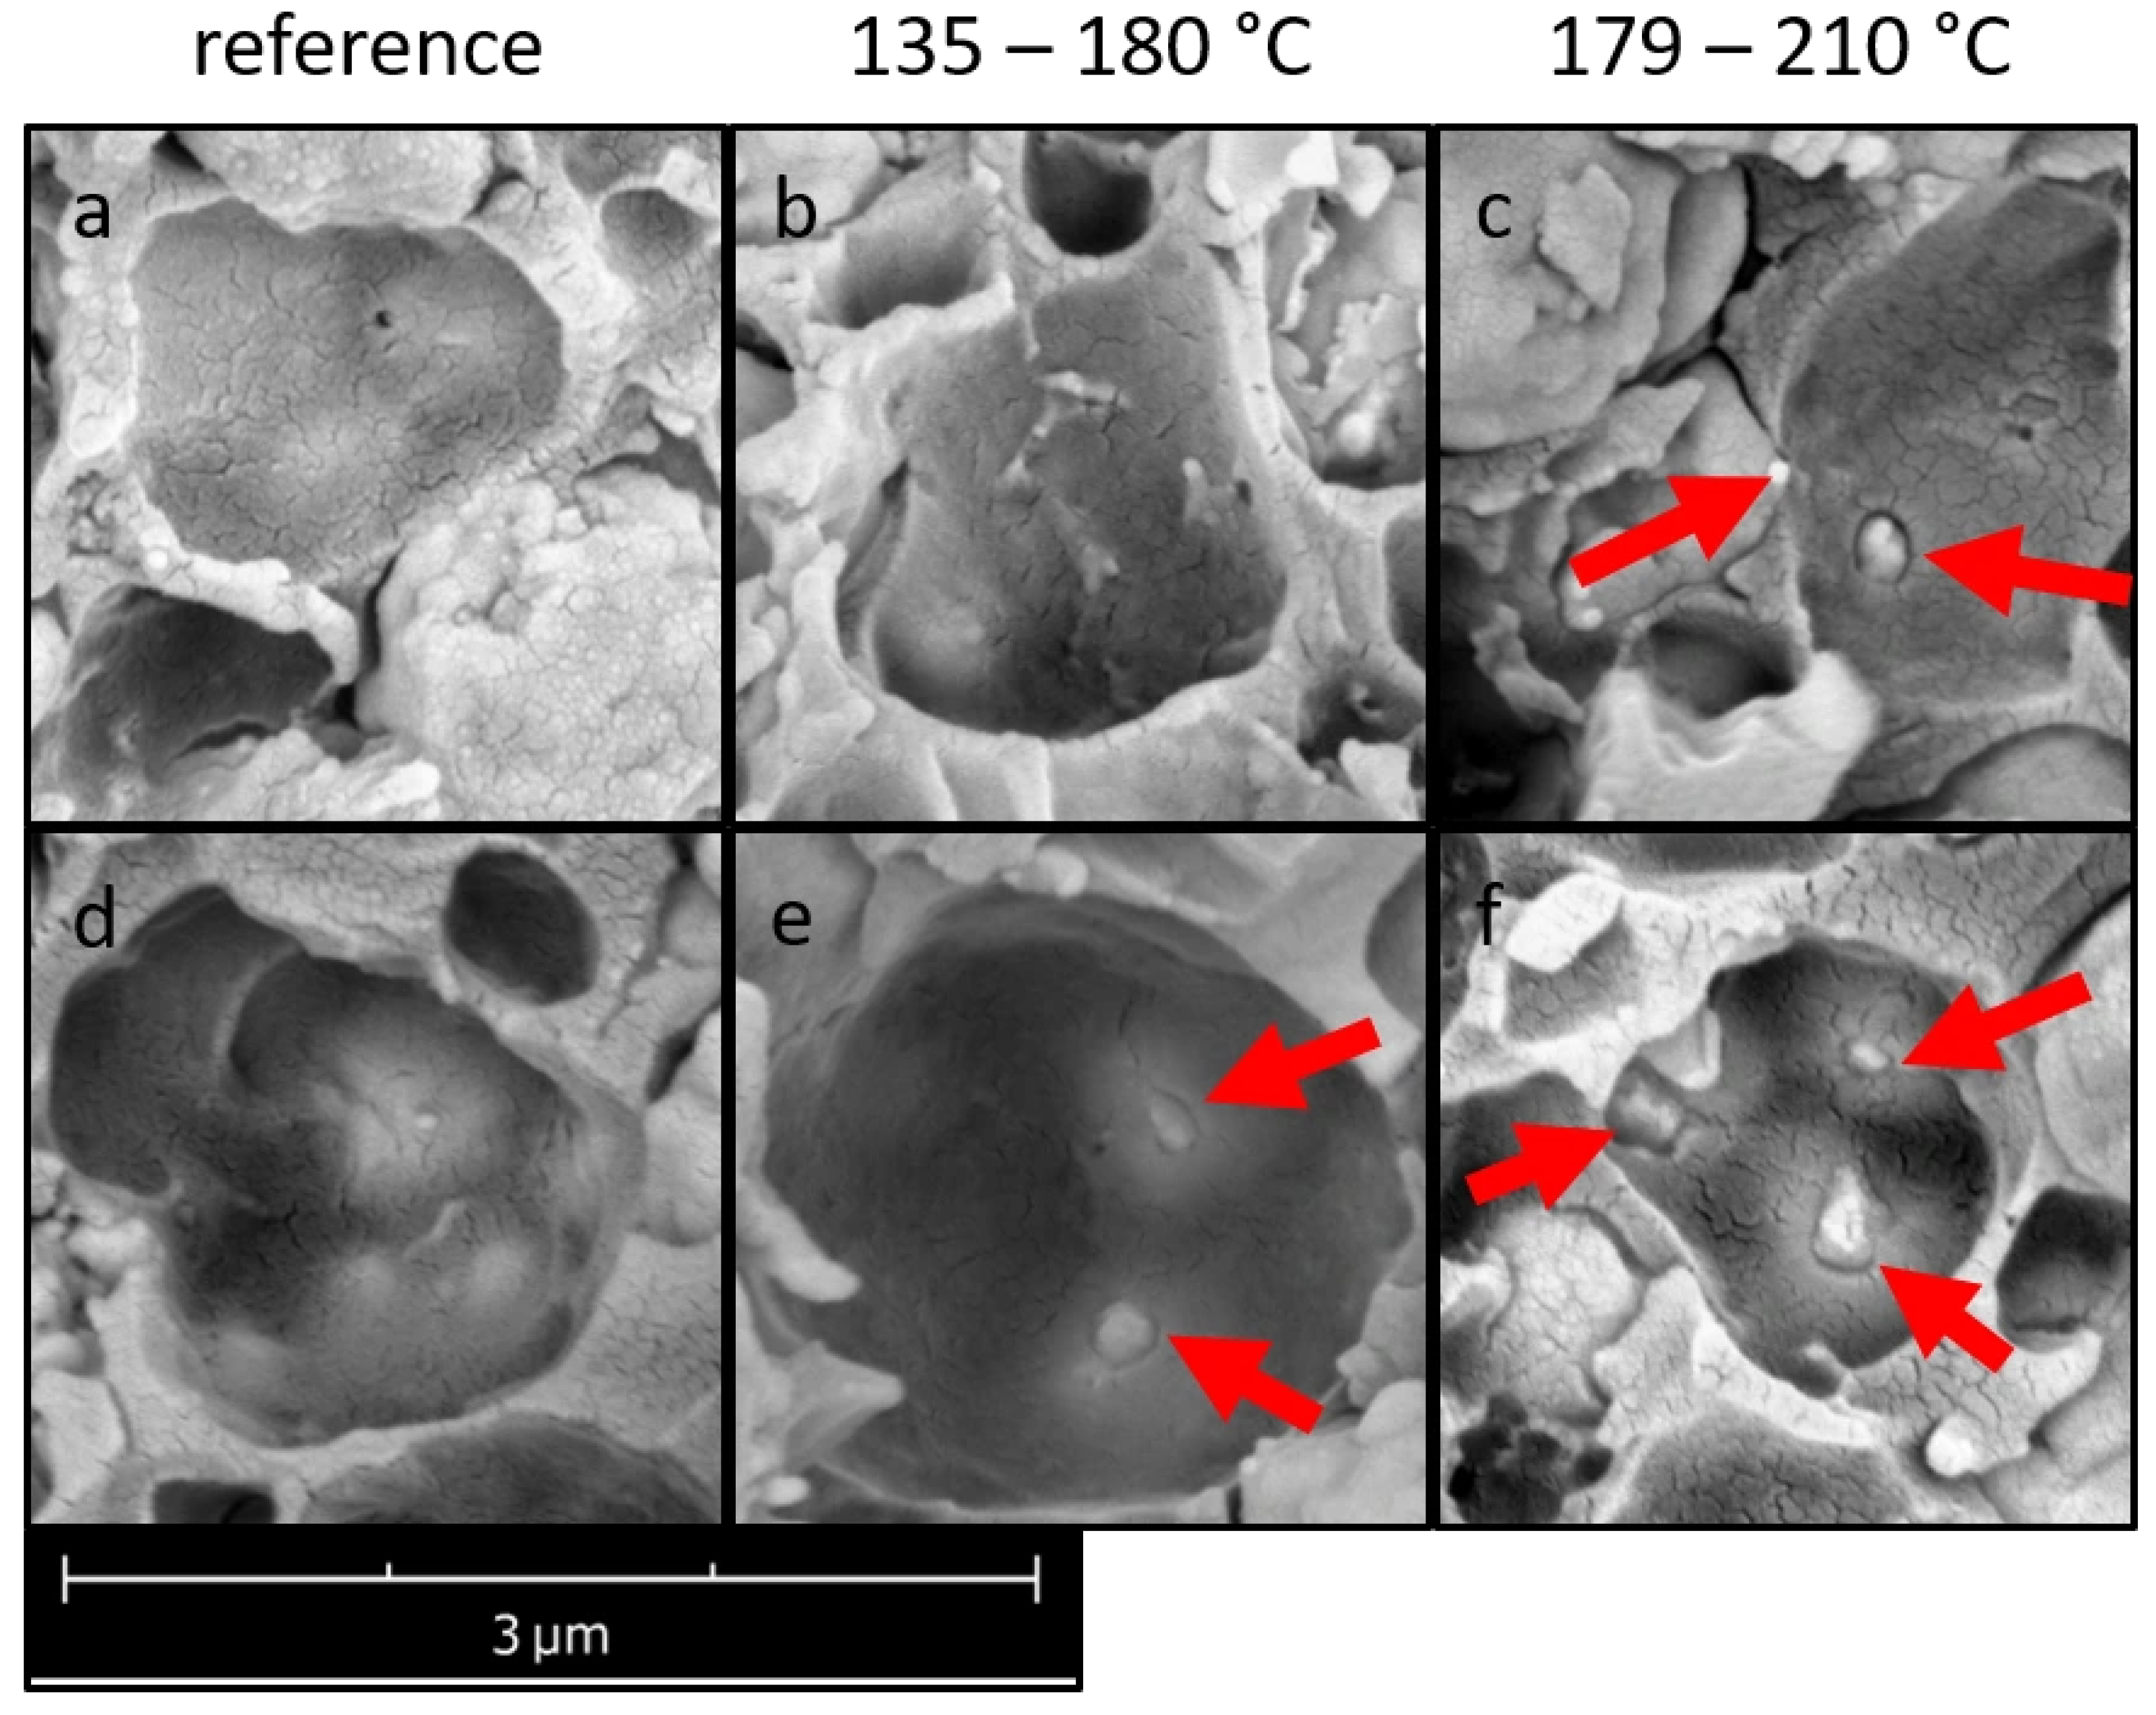
Figure 8 shows SEM images of samples with higher polymer content made from pastes including low boiling and medium boiling secondary liquids. In the reference without a secondary liquid, intact polymer shells are consistently observed across all characterized samples, independent of polymer content (see
Figure 7a and
Figure 8a,d). In the same way, for samples made from pastes including the medium boiling secondary liquid, circular holes in the polymer shells are always found irrespective of polymer concentration (see
Figure 7c and
Figure 8c,f). In samples with the low boiling secondary liquid, a change in the polymer content can be observed. For films made from the pastes with 40 wt.% (
Figure 7b) and 60 wt.% (
Figure 7b) epoxy resin in the continuous phase, no circular holes in the polymer shells could be observed, and accordingly the conductivity is similar as for the samples made from the binary paste (see
Figure 6b). At a polymer content of 80 wt.%, however, holes in the polymer shells occur frequently (see
Figure 8e). This is in line with the observed 37 ± 4% increase in conductivity compared to the corresponding sample made from the binary paste. On the other hand, the conductivity is still about four times lower than that of the film made from the paste including the medium boiling secondary liquid. These results suggest that part of the low boiling secondary liquid evaporates fast enough to allow for a penetration of polymer into the contact regions, thus fewer polymer-free particle–particle contacts are available than in the system including the medium boiling secondary liquid.
3.4. Transfer of the Concept to a Thermoplastic System
Thermoplastic polymers are also widely used as matrix material for conductive composites. To verify whether the concept of keeping a secondary liquid in the contact zone during solidification of a polymer composite film is applicable to other systems, it was transferred to a model system utilizing the thermoplastic polymer polyvinyl acetate (PVAc), while the same solvent and particles as described above were used. For demonstration purposes, only the effect of the medium boiling secondary liquid was investigated. As mentioned previously, the formation of a capillary suspension was first assessed using the increase in the yield stress as an indicator.
At a silver fraction of 40 vol.% and a ratio of secondary liquid to particle volume fraction of 0.1, a yield stress of about 150 Pa is observed, which is about twice as high as that of the corresponding binary system, thus clearly indicating the formation of a capillary suspension. A similar increase in yield stress was found for other samples including different amounts of polymer, thus clearly indicating the formation of a capillary suspension.
In
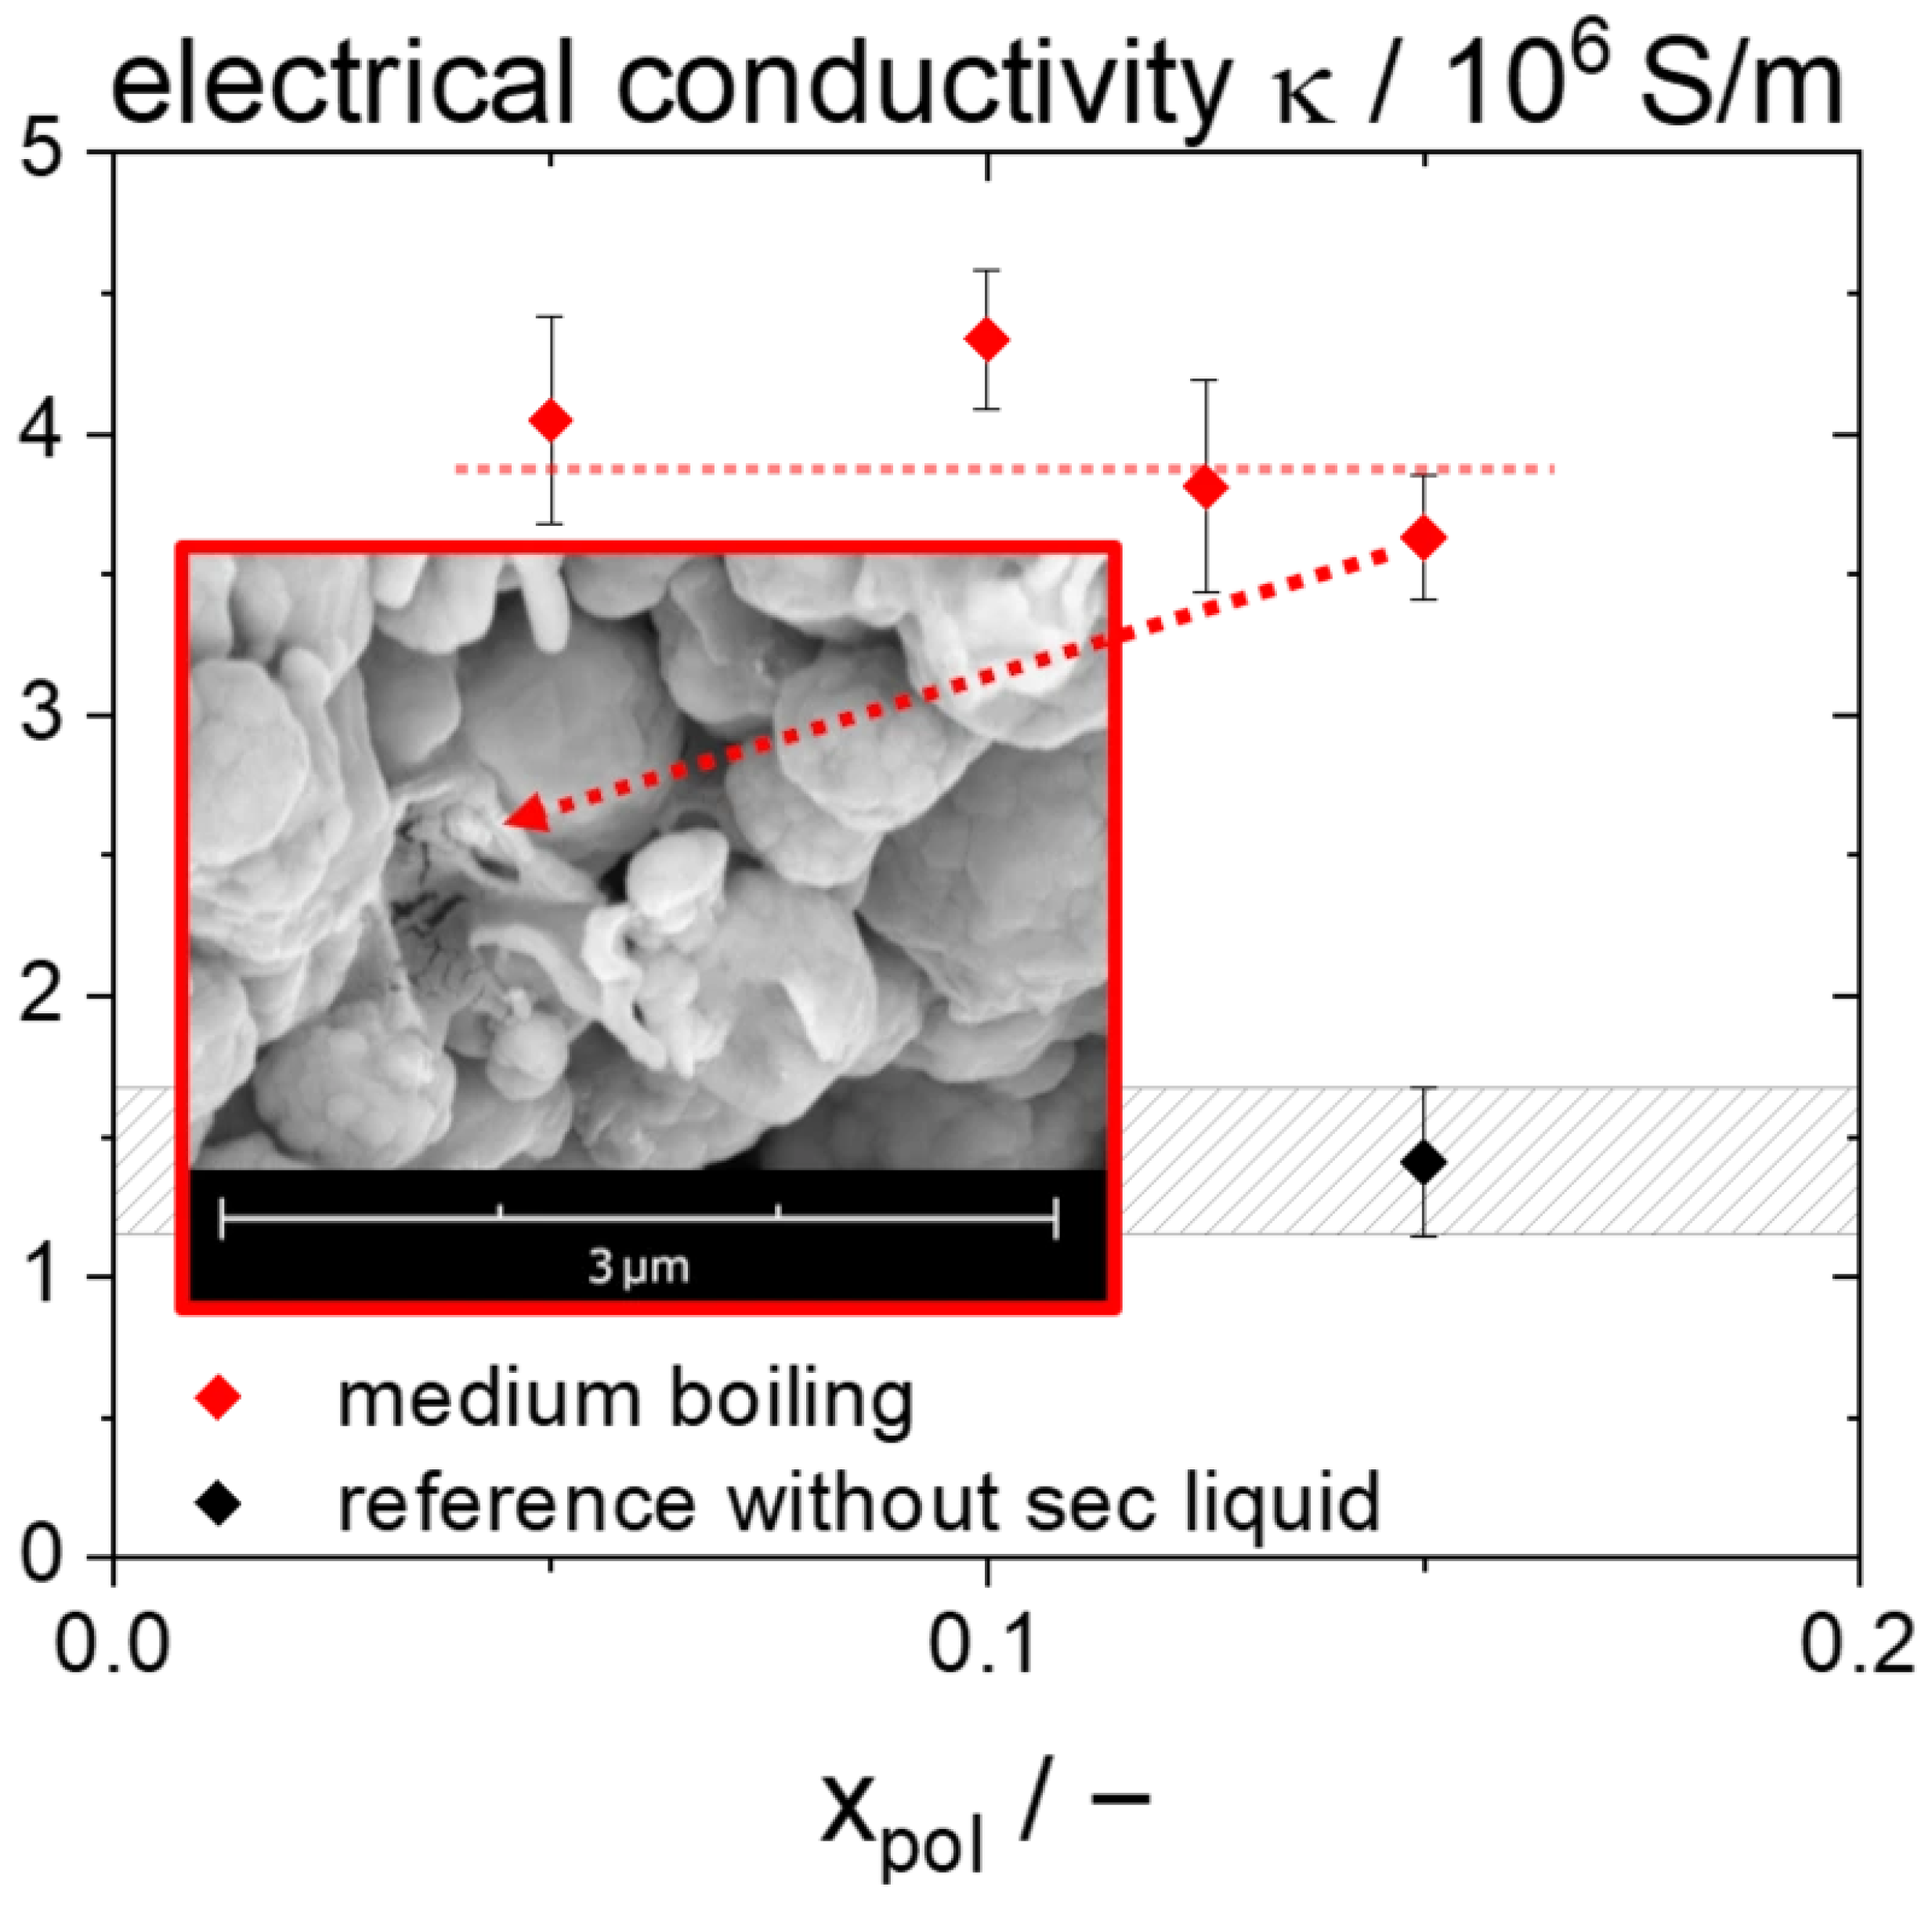
Figure 9, the electrical conductivity of films made from the pastes described above is plotted as a function of the polymer content in the primary liquid. For the highest polymer content, a two-phase reference sample without secondary fluid was also prepared and measured for comparison.
All samples made from ternary pastes exhibit an electrical conductivity κ in the range of 4 × 10
6 S/m, irrespective of polymer content. This is more than twice as high as the conductivity of the film made from the binary paste. Since the presence of capillary bridges between the particles depends only on the ratio of secondary liquid to particles, and not on the polymer content in the paste, the corresponding holes in the particle contact regions remain unchanged. Variations in polymer content affect the areas outside these regions and thus have no effect on conductivity. Corresponding SEM images of the fracture surfaces of films made from pastes including a medium boiling secondary liquid again show holes in the polymer shells around pulled out particles, as exemplarily shown as an insert in
Figure 9 for the film made from the wet paste including 15 wt.% polymer in the continuous phase. The presence of these holes indicates the possibility of facilitated electron transport, which may explain the increased conductivity observed in samples with polymer-free contact regions. By transferring the method of creating polymer-free contacts via capillary suspensions to another matrix system, these results further support the hypothesis that this concept can be generically used to deposit a volatile component at the particle contact regions to keep these areas free of polymer during drying and solidification of the polymer phase, thus significantly enhancing the electrical conductivity of polymer composites including conductive fillers.
4. Conclusions
The presented work introduces the capillary suspension concept as an alternative to conventional two-phase filler/polymer systems for the formulation of highly conductive polymer composites. Previously, there was little or no conductivity improvement in highly filled composites well above the percolation threshold. In such systems, many particle contacts already exist due to geometrical constraints, and the presence of a secondary liquid per se does not improve that significantly.
Here, we have demonstrated that this limitation can be overcome. We have extended the capillary suspension concept through a targeted selection of the secondary liquid. Delaying the evaporation of the secondary liquid until the polymer in the continuous phase is immobilized provides polymer-free particle–particle contact regions, and thus leads to a substantially enhanced electrical conductivity in highly filled systems.
The effectiveness of this strategy is first demonstrated using a thermosetting system with secondary liquids of varying boiling ranges. First, it was shown that a particle network stabilized by capillary forces could be created with these secondary liquids using the increase in yield stress due to secondary liquid addition as an indicator. The resulting stabilized particle network can be transferred to the dried, cured polymer composite, as demonstrated by SEM images of fractured sample surfaces.
Adding the medium boiling secondary liquid yielded an about two-fold increase in electrical conductivity in films dried at 200 °C corresponding to the boiling temperature range of this solvent mixture, and SEM images clearly revealed frequently occurring polymer-free particle–particle contact regions.
No conductivity enhancement is found for the low boiling secondary liquid in films made from pastes including 40 wt.% and 60 wt.% polymer in the primary phase of the wet paste. In these cases, this additive evaporates too fast to keep the particle–particle contact zones free of polymer as confirmed by SEM images.
The high boiling secondary liquid does not yield an enhanced electrical conductivity in films dried at 150 °C, despite the polymer-free contact regions observed in SEM images. In these samples, the secondary liquid seems to remain in the contact regions acting as an insulating layer between the particles instead of the polymer. At 200 °C drying temperature, an increase in electrical conductivity is observed compared to the binary system, but this increase is less pronounced than for the medium boiling additive, again suggesting that remnants of the high boiling secondary liquid in the contact zones act as an insulator.
Finally, the concept was successfully transferred to a system including a thermoplastic instead of a thermoset polymer and a more than two-fold increase in electrical conductivity was achieved in this case.
The concept of capillary suspensions thus is demonstrated to be a generic strategy to enhance the electrical conductivity of highly concentrated composite materials consisting of polymers and conductive fillers. Further studies should address the influence of particle shape and surface treatment on the resulting electrical conductivity. In addition, long-term stability and durability should be evaluated through standardized testing protocols, including thermocycling and damp heat exposure, complemented by a comprehensive mechanical characterization, particularly with respect to applications in PV technology. Particular attention should be given to a detailed statistical analysis of hole formation, including a thorough assessment of hole size distributions and their spatial variability within the samples. In addition, future work will systematically investigate the extent to which the observed phenomena can be applied to a broader range of application scenarios. The here characterized outstanding materials may find application in various fields of printed electronics, in particular as low-temperature metallization pastes for thermosensitive solar cells, such as heterojunction silicon or perovskite tandem cells.