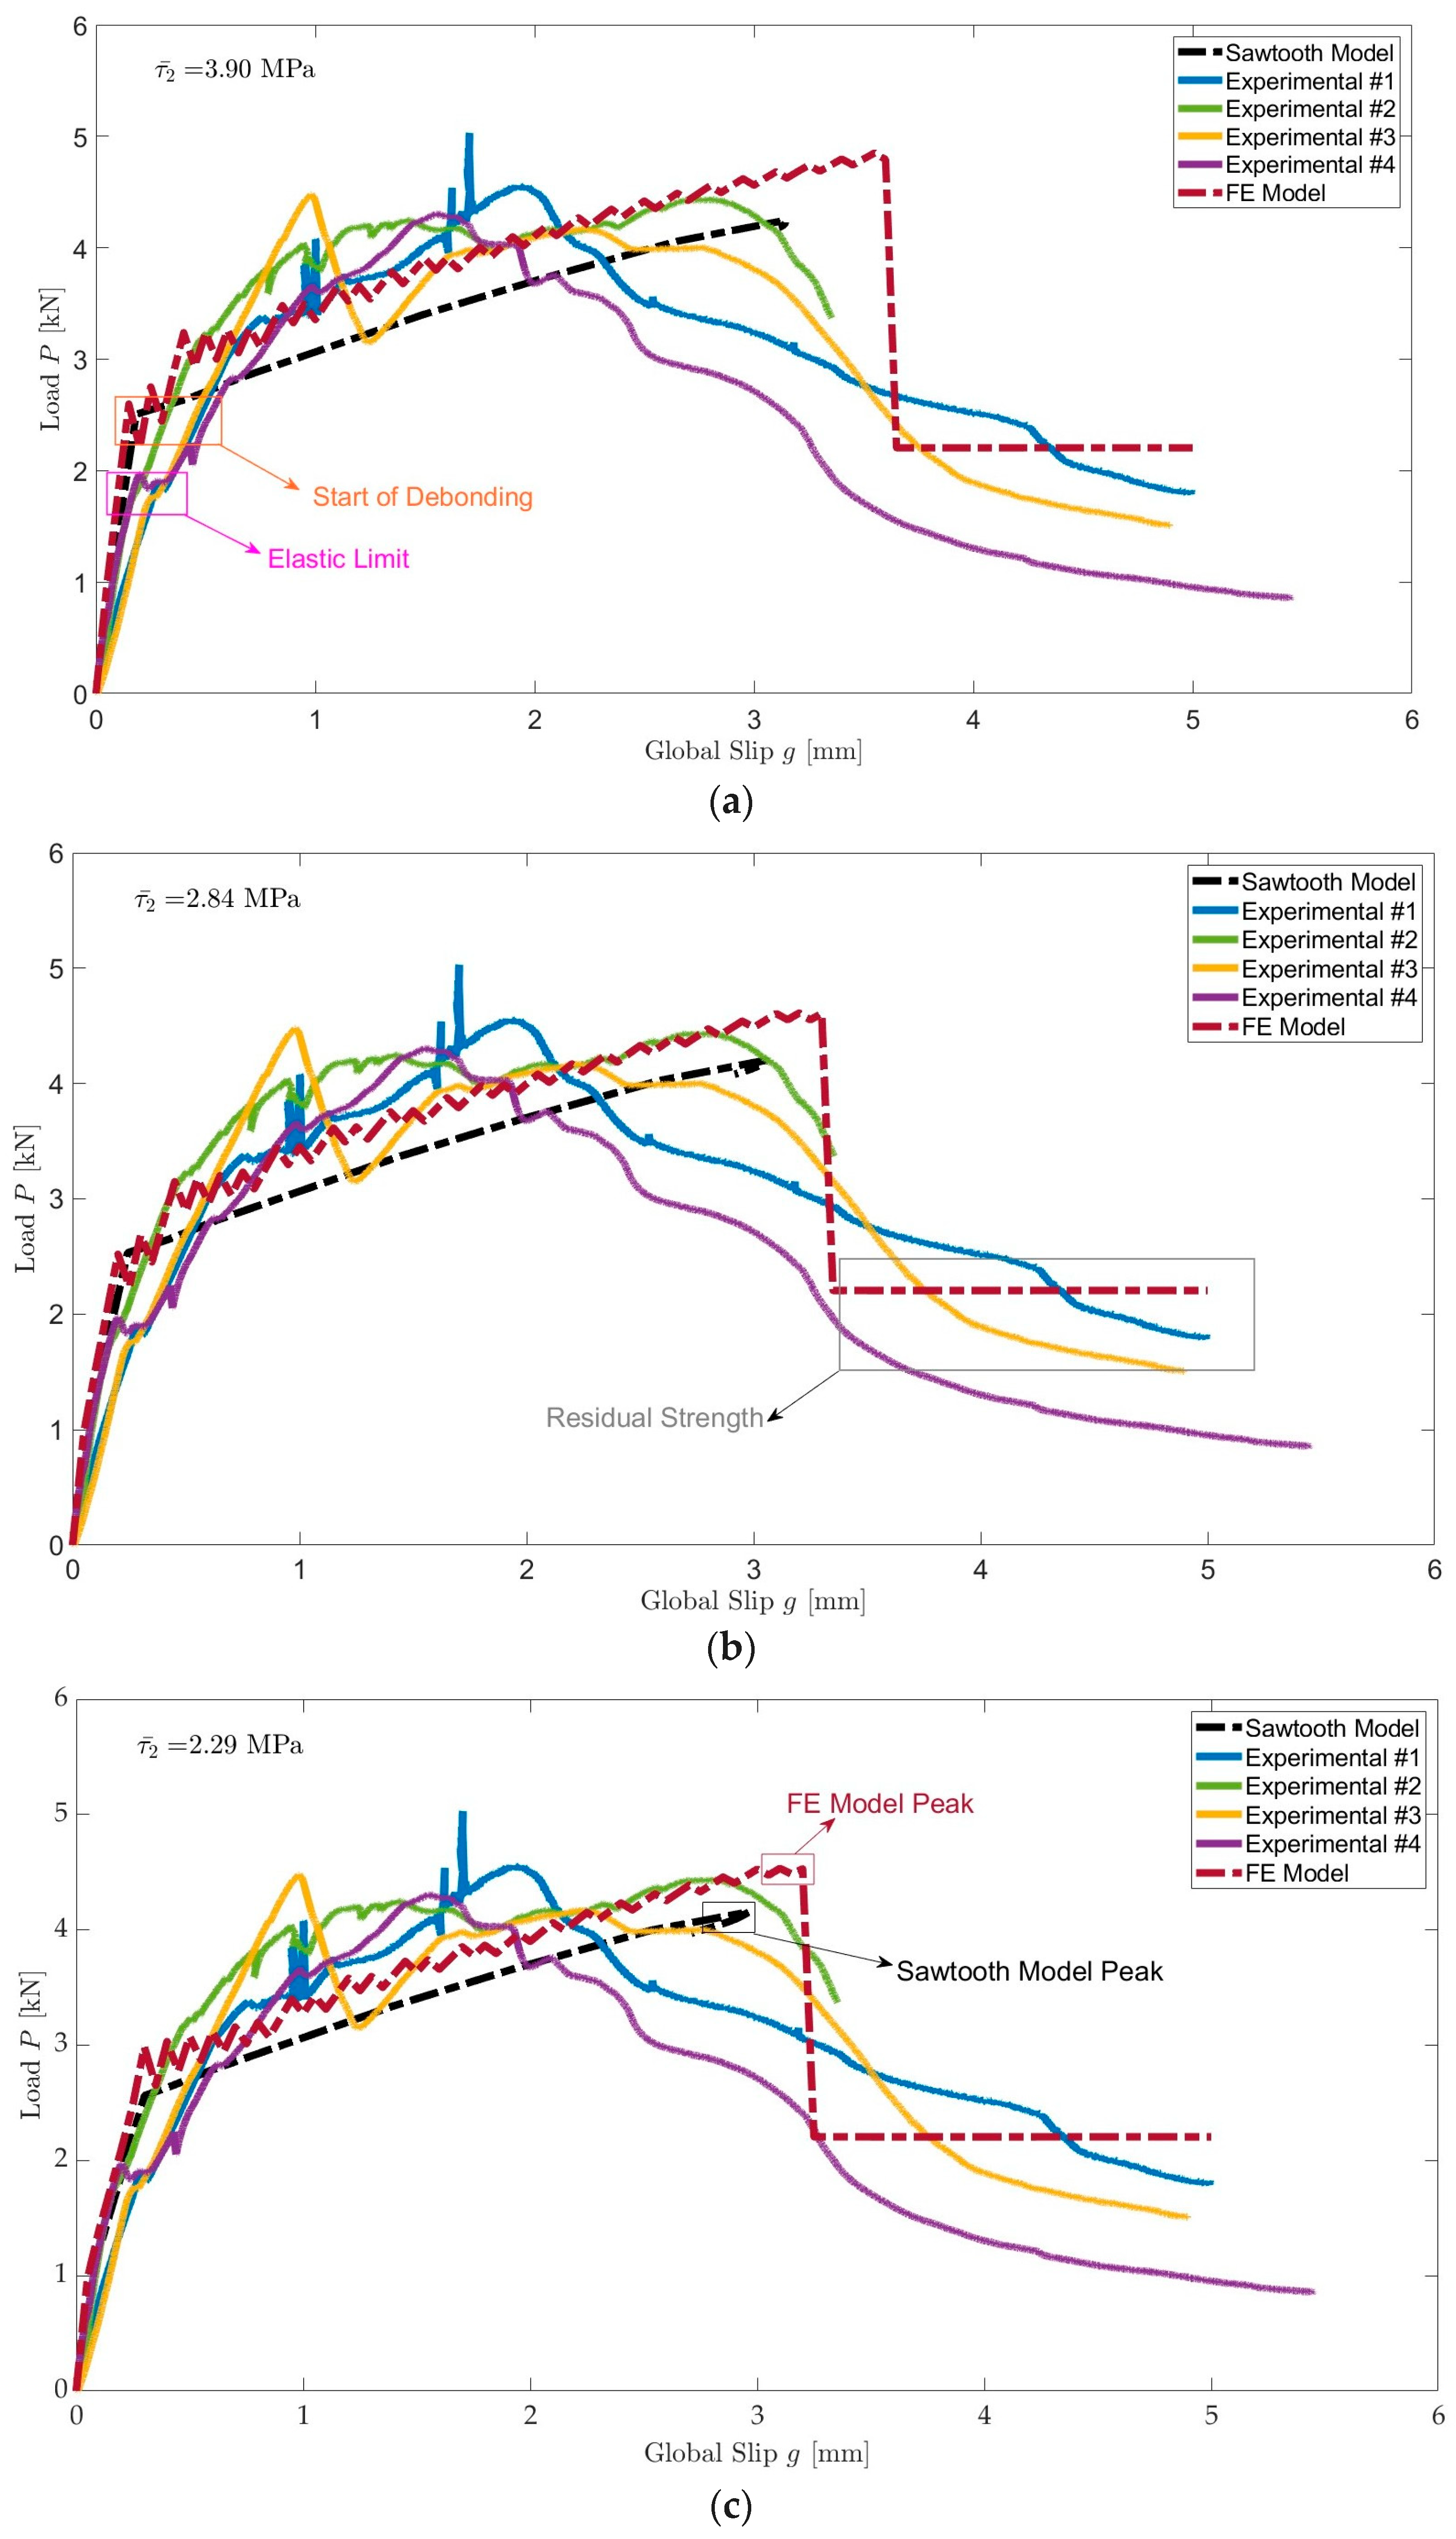
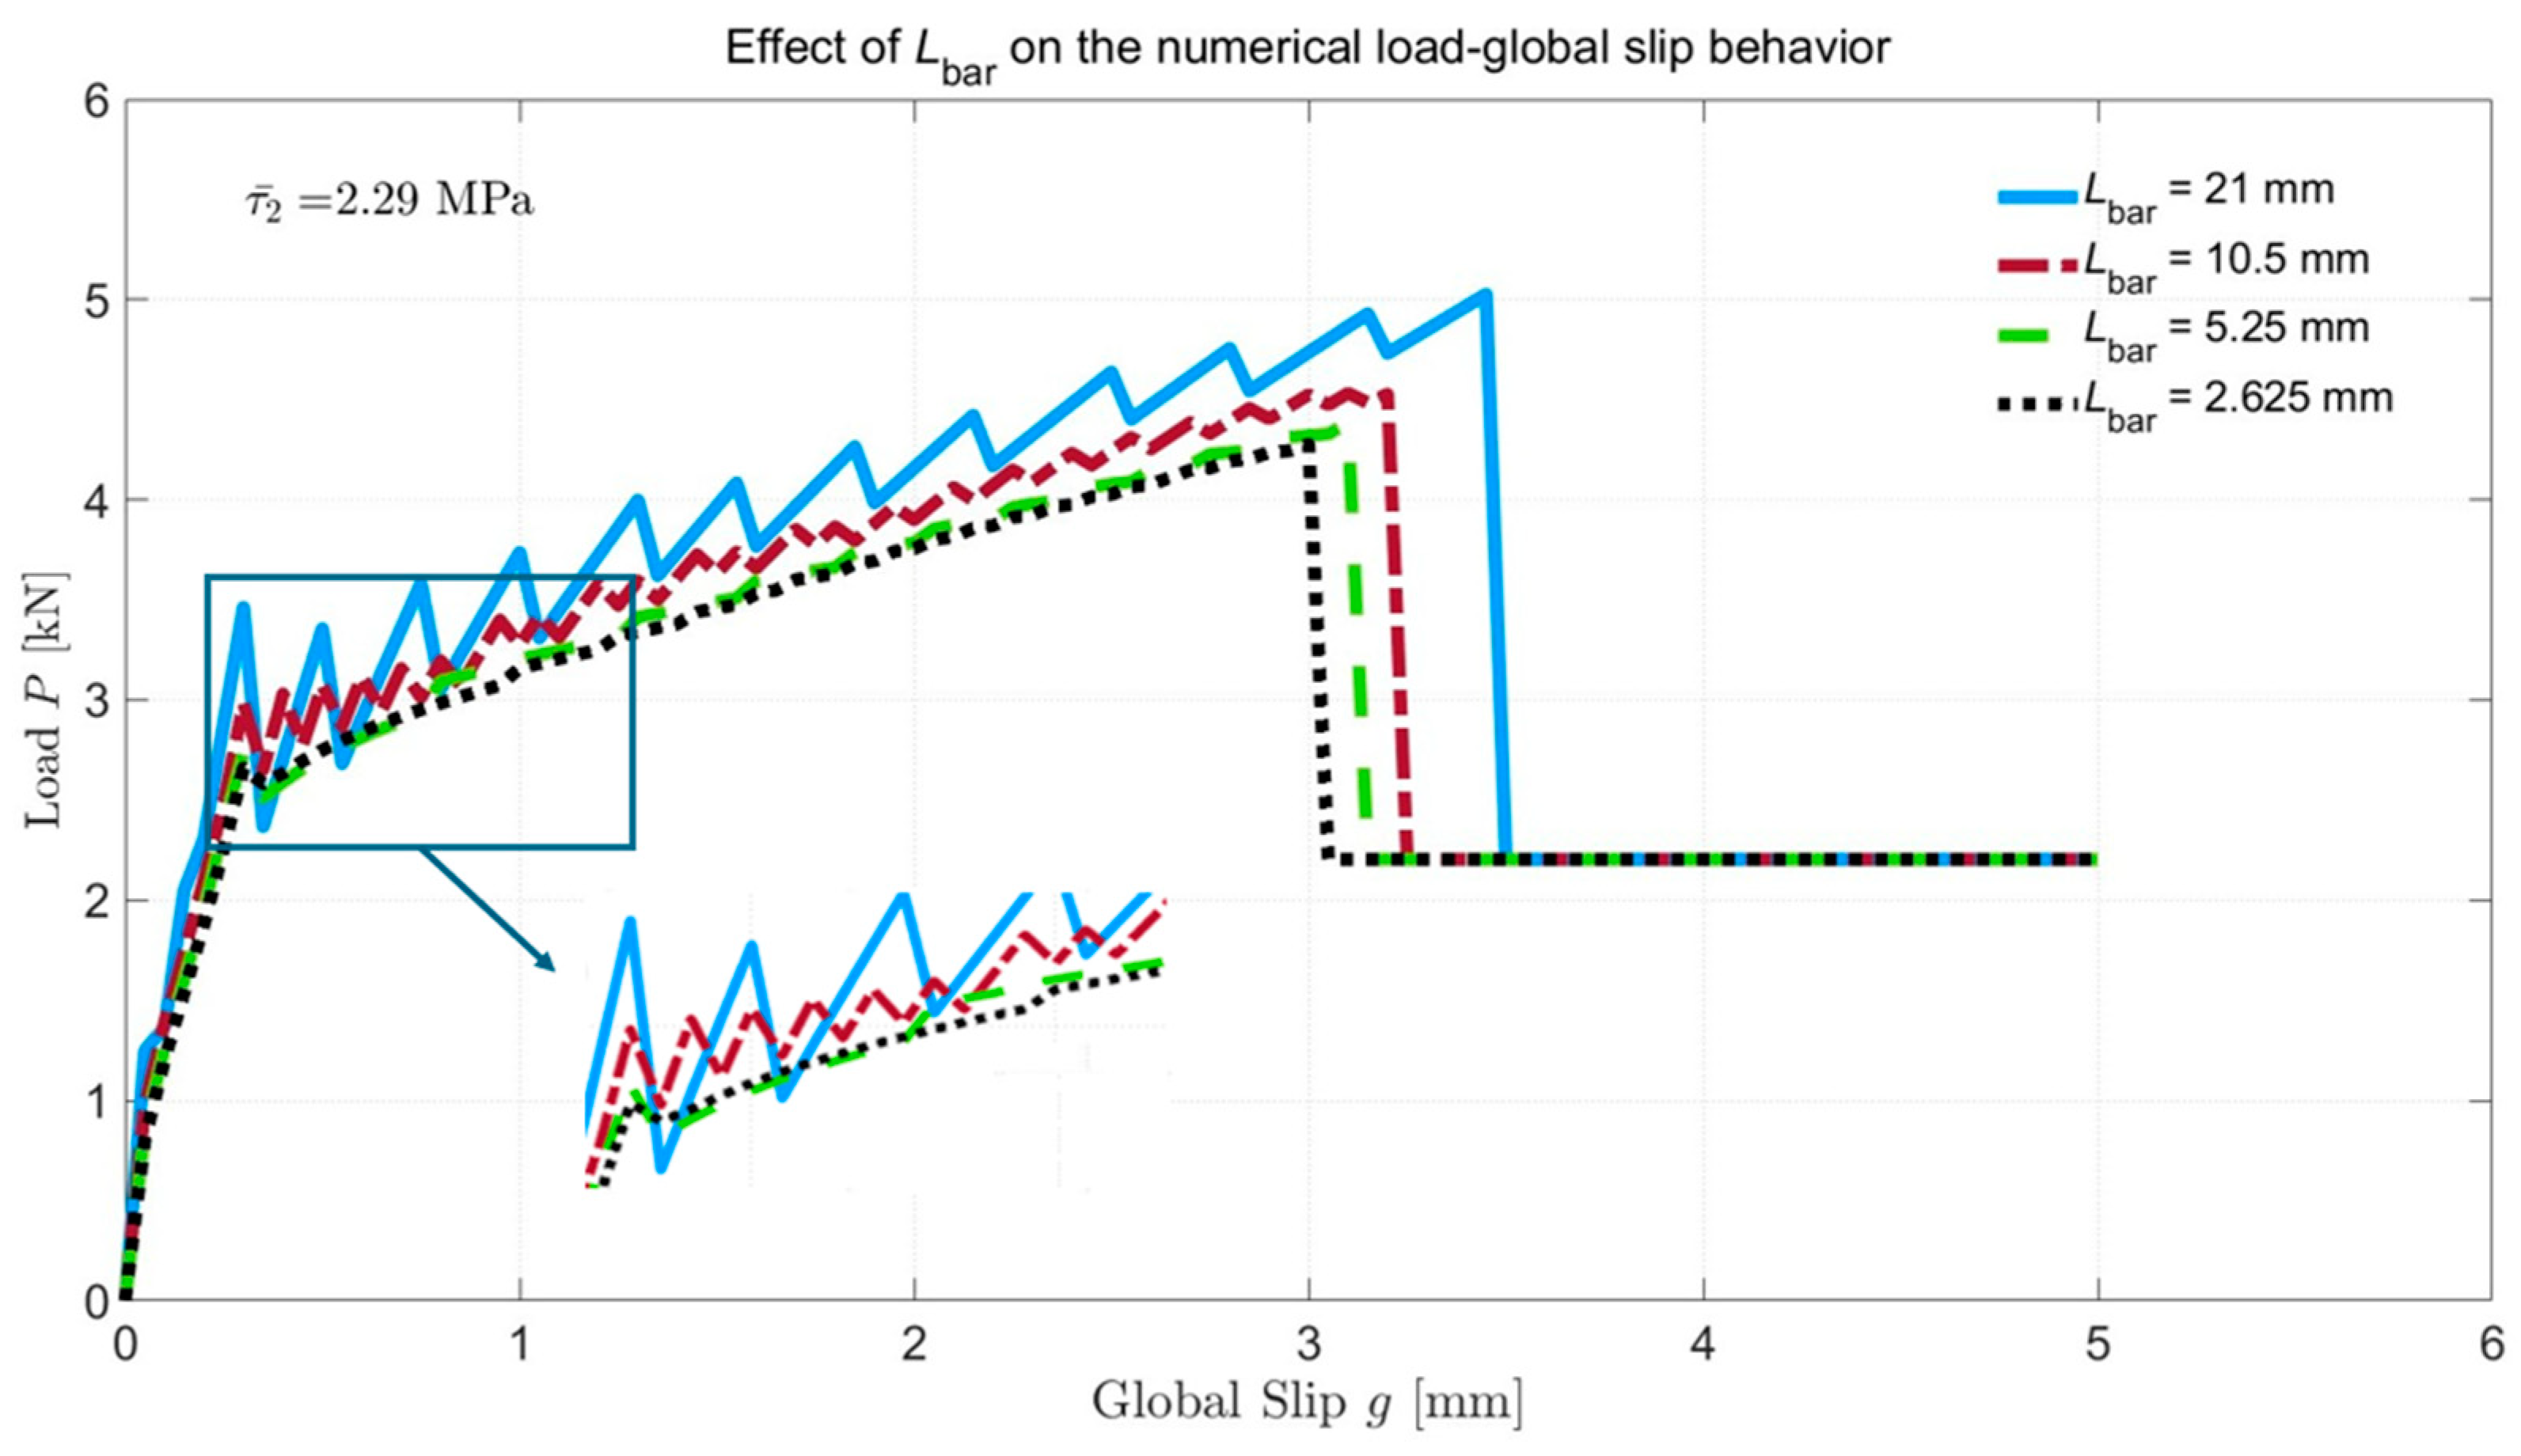
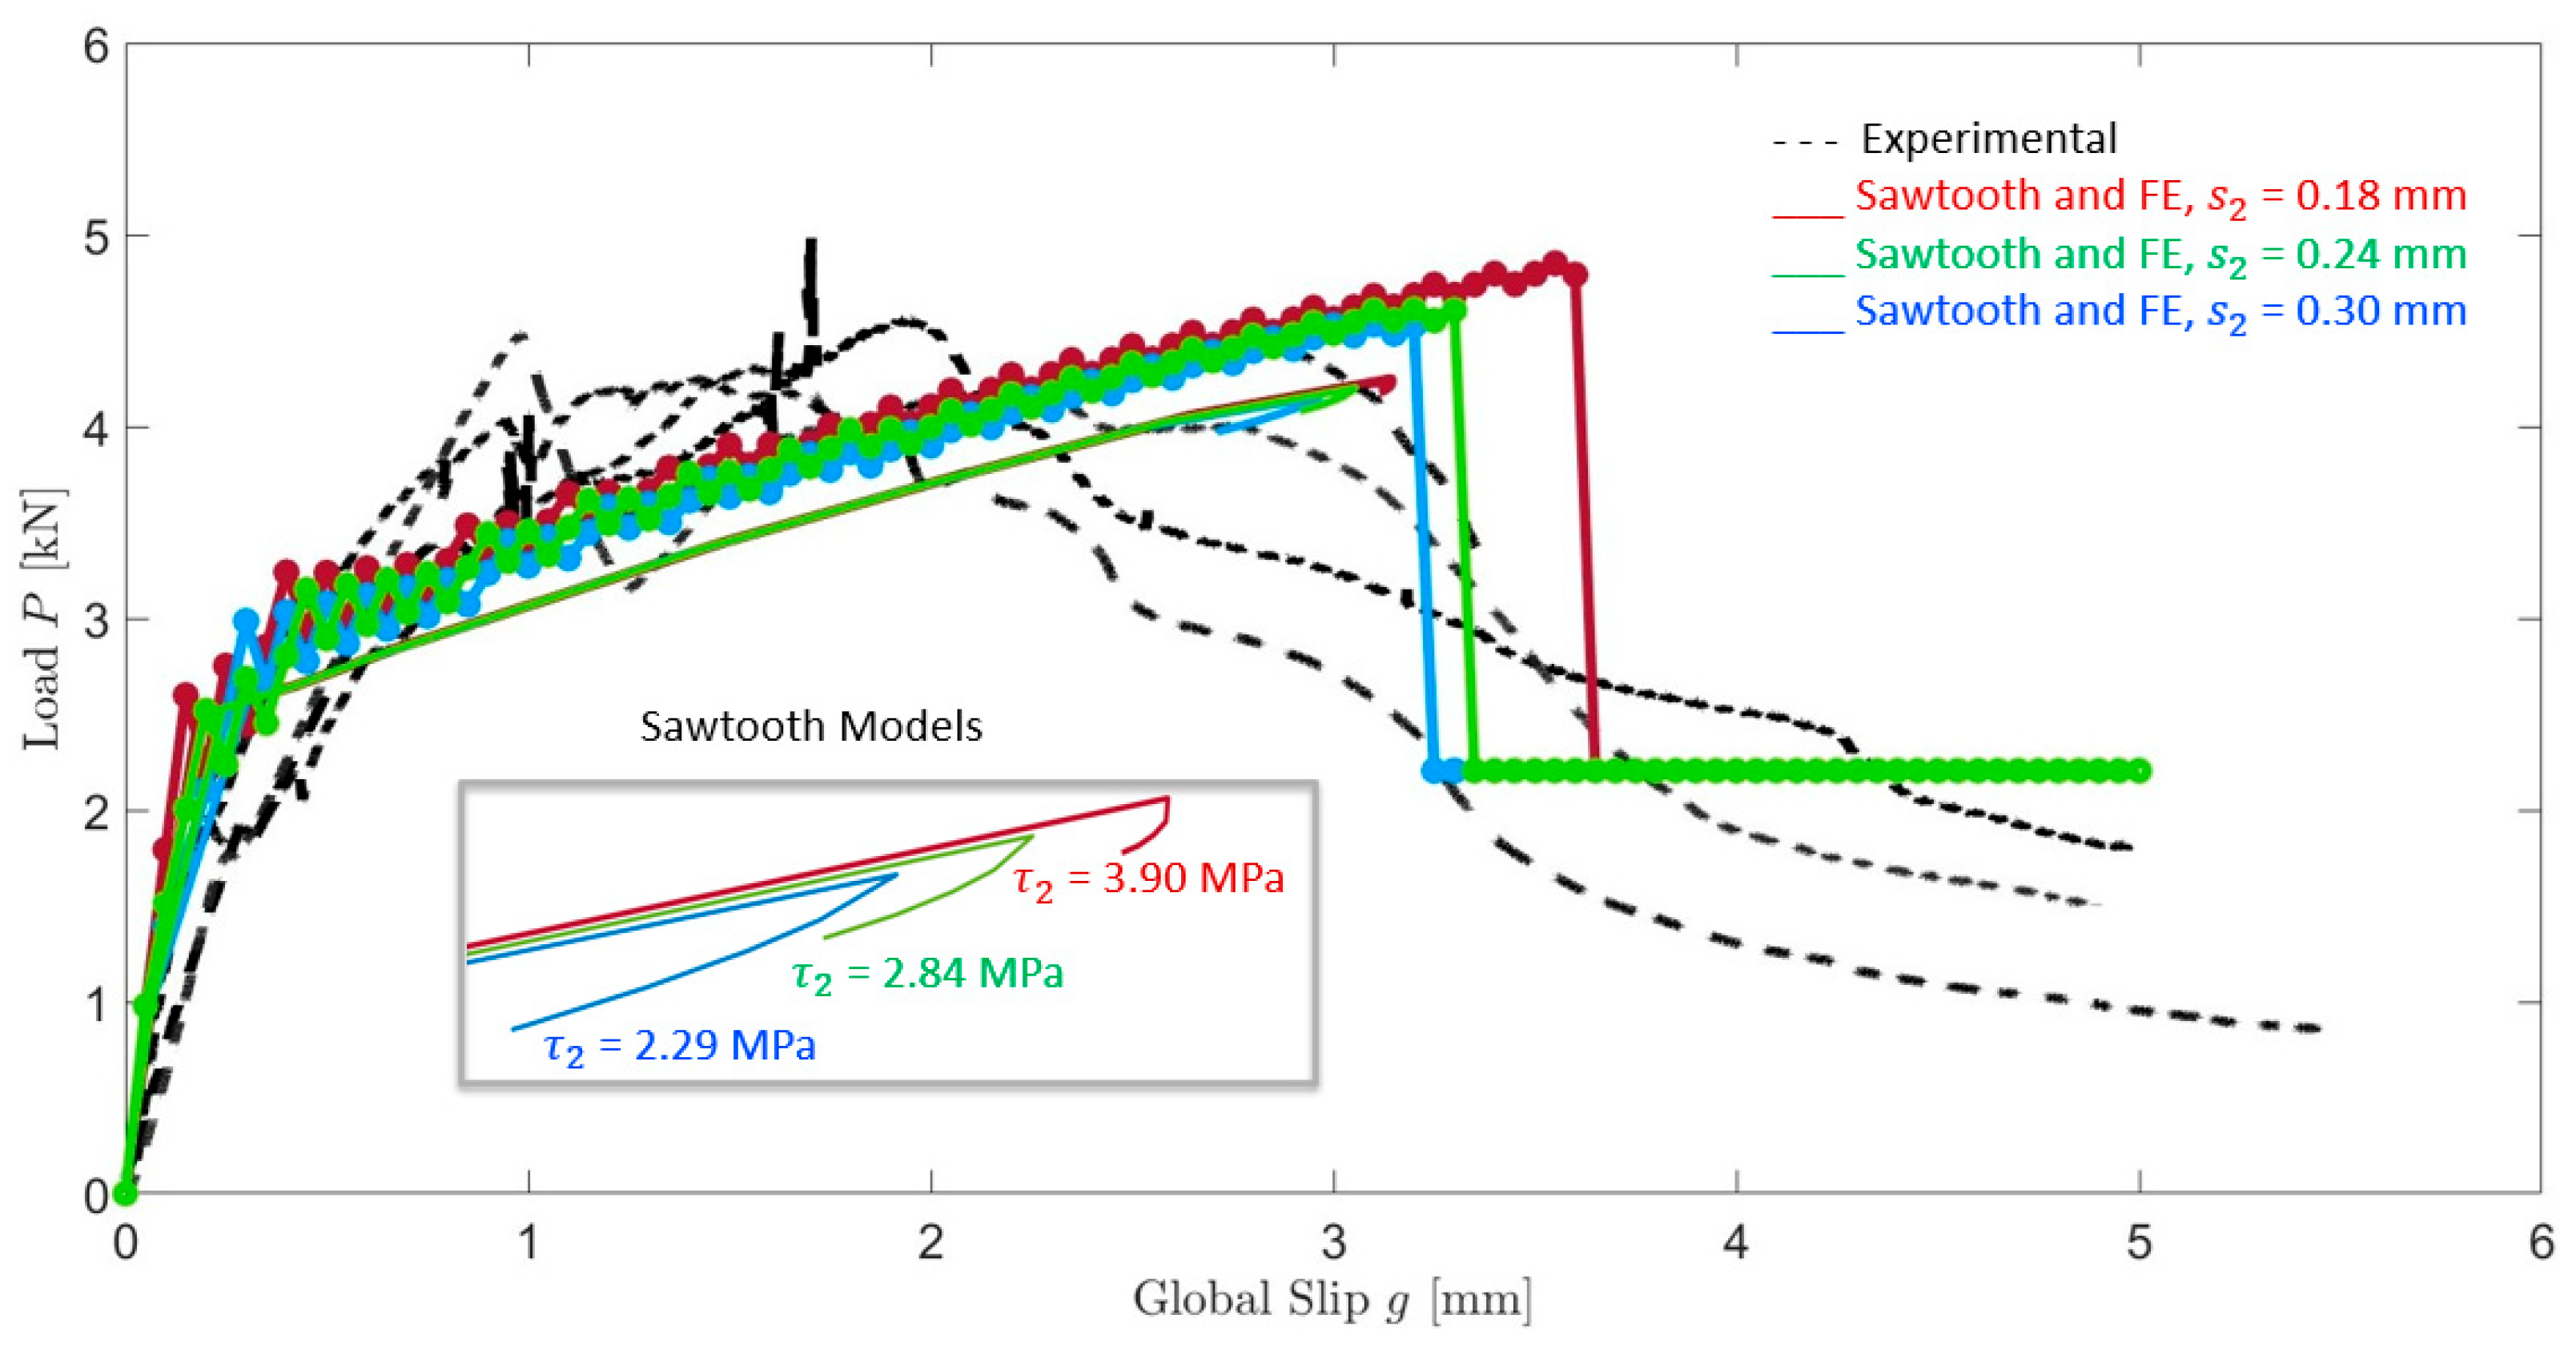
This section presents the development of an analytical model for FRCM-strengthened flat masonry. The sawtooth approach, originally proposed in [
3] for SRG-strengthened concrete under direct shear, is adopted and tailored for PBO-FRCM systems bonded to masonry. The model is calibrated against the widely used trilinear law to accurately capture the interface bond–slip behavior. First, the trilinear model is described, followed by the sawtooth approach.
2.2.1. Trilinear Model
The trilinear model is a widely adopted approach to describe the bond–slip behavior at the interface between the fiber and the surrounding mortar in FRCM systems [
48]. In this model, all non-linearities are concentrated at the fiber–matrix interface, while the reinforcing layer (fiber embedded in mortar) is assumed to remain linearly elastic and the substrate rigid. The experimentally observed failure is governed by the interface debonding mechanism, with negligible damage to the masonry substrate. Therefore, modeling the substrate as rigid does not significantly influence the predicted global response, while local nonlinear phenomena such as mortar cracking and fiber–matrix slip are implicitly captured through the nonlinear bond–slip law assigned to the interface. The interfacial law is expressed as the relationship between the shear stress (
), which is transferred across the fiber–matrix surface, and the relative slip (
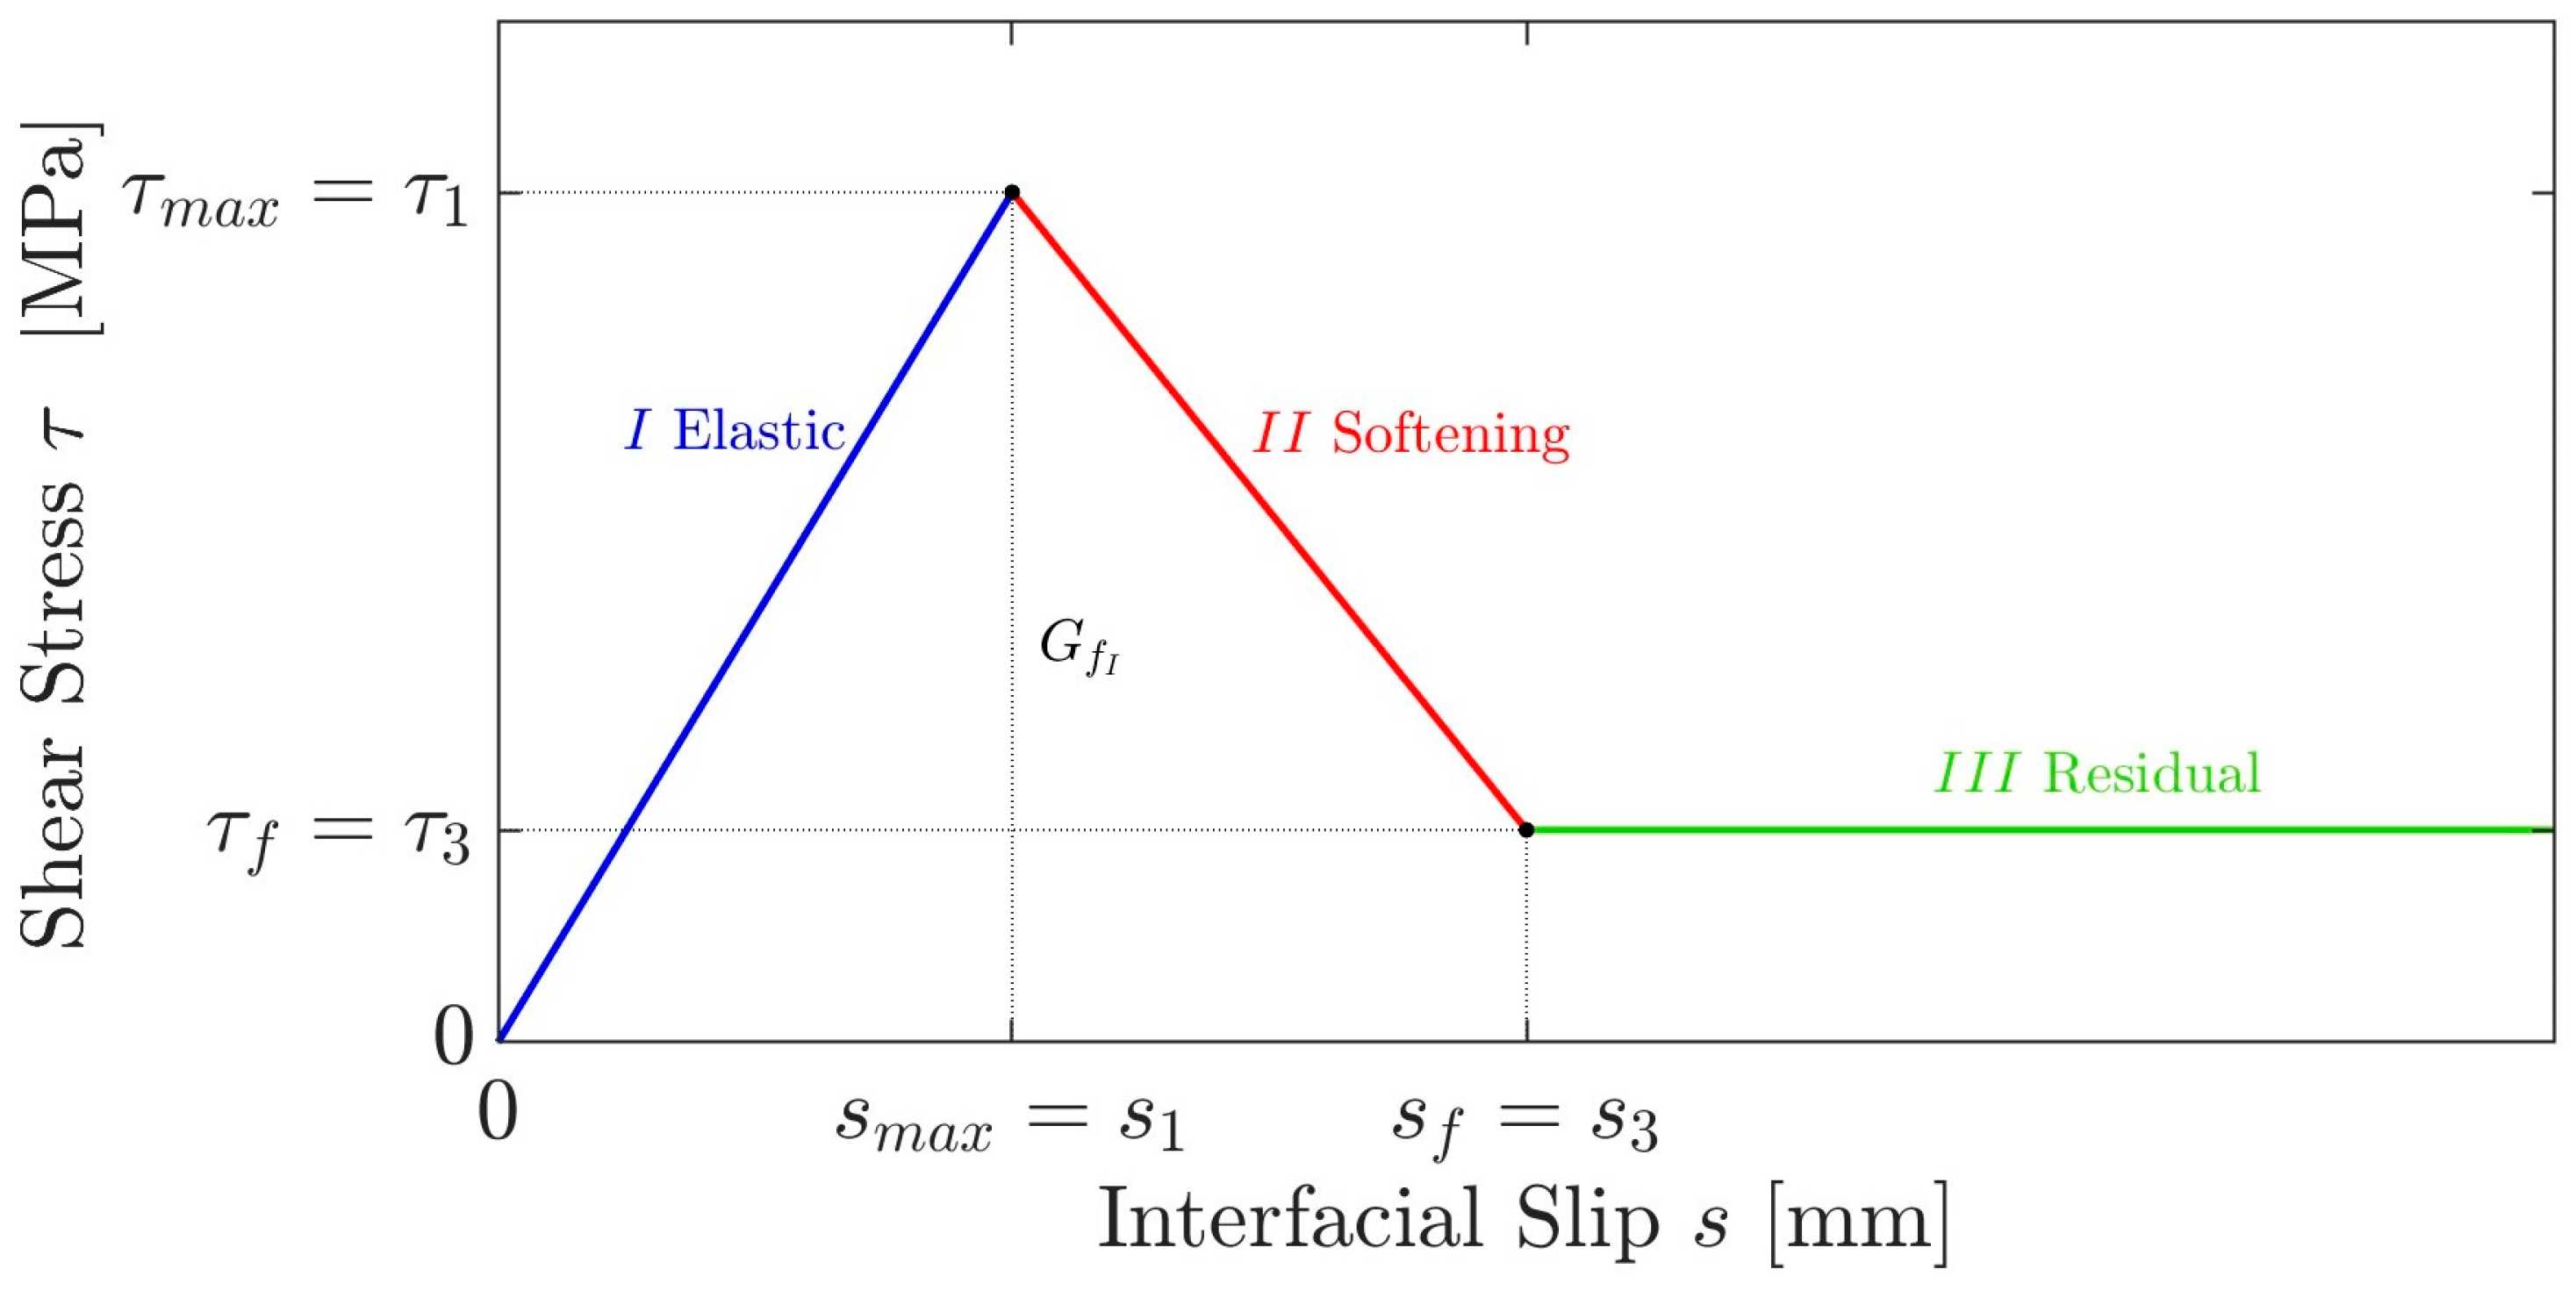
s), which represents the displacement difference between the fiber and the matrix mortar. The trilinear law typically consists of three branches (
Figure 4):
Elastic phase: The initial linear region, where the tangential stress (τ) increases proportionally with the slip (s) according to the interface stiffness, up to the peak shear stress at slip . No damage occurs at this stage.
Softening phase: After reaching the peak shear stress, the interface enters a descending branch where the stiffness progressively decreases. This stage models the degradation of the bond due to micro-cracking and partial debonding.
Residual plateau: The bond behavior is characterized by a residual plateau, where the shear stress reaches a constant level representing the residual adhesion between the FRCM system and the substrate. This stage is primarily governed by the frictional shear stress (), which remains approximately constant until a critical slip value () is attained, beyond which the load transfer capacity does not significantly increase.
The area under the curve corresponds to the interface fracture energy
, which can be calibrated from direct shear test data. This model provides a quite accurate description of the interface response and allows for closed-form analytical solutions under simplified assumptions. However, its practical application is not straightforward since such a law is not directly available in standard commercial FE software [
3]. Implementing it typically requires custom subroutines and specialized programming, making it less feasible for routine engineering practice. Therefore, the trilinear model is mainly used as a benchmark for validating simpler and more practical approaches, such as the sawtooth model developed in [
3].
2.2.2. Sawtooth Model
To overcome the limitations of the trilinear model in FE analysis, the sawtooth interface model was proposed in [
3]. In this approach, all nonlinear phenomena are concentrated at the interface between the reinforcement and the surrounding matrix. The reinforcement is modeled as a linear elastic layer, while the substrate is considered rigid enough to avoid any damage. Within this framework, failure occurs through the progressive slip of the reinforcement relative to the matrix. The purpose of the model is not to reproduce the detailed failure mechanism but to accurately capture the global response of the strengthened system [
3].
The mechanical representation can thus be described as an elastic fiber layer bonded to a rigid support through a nonlinear interface, which governs the transfer of stresses. The reinforcement is subjected to uniaxial stress along its length, and the only kinematic parameter of interest is the longitudinal displacement of the fiber layer. At any position along the bond, this displacement corresponds to the slip between fiber and substrate, which induces a shear stress transmitted through the interface. Consequently, the bond is modeled as a pure shear transfer mechanism (Mode II) [
3].
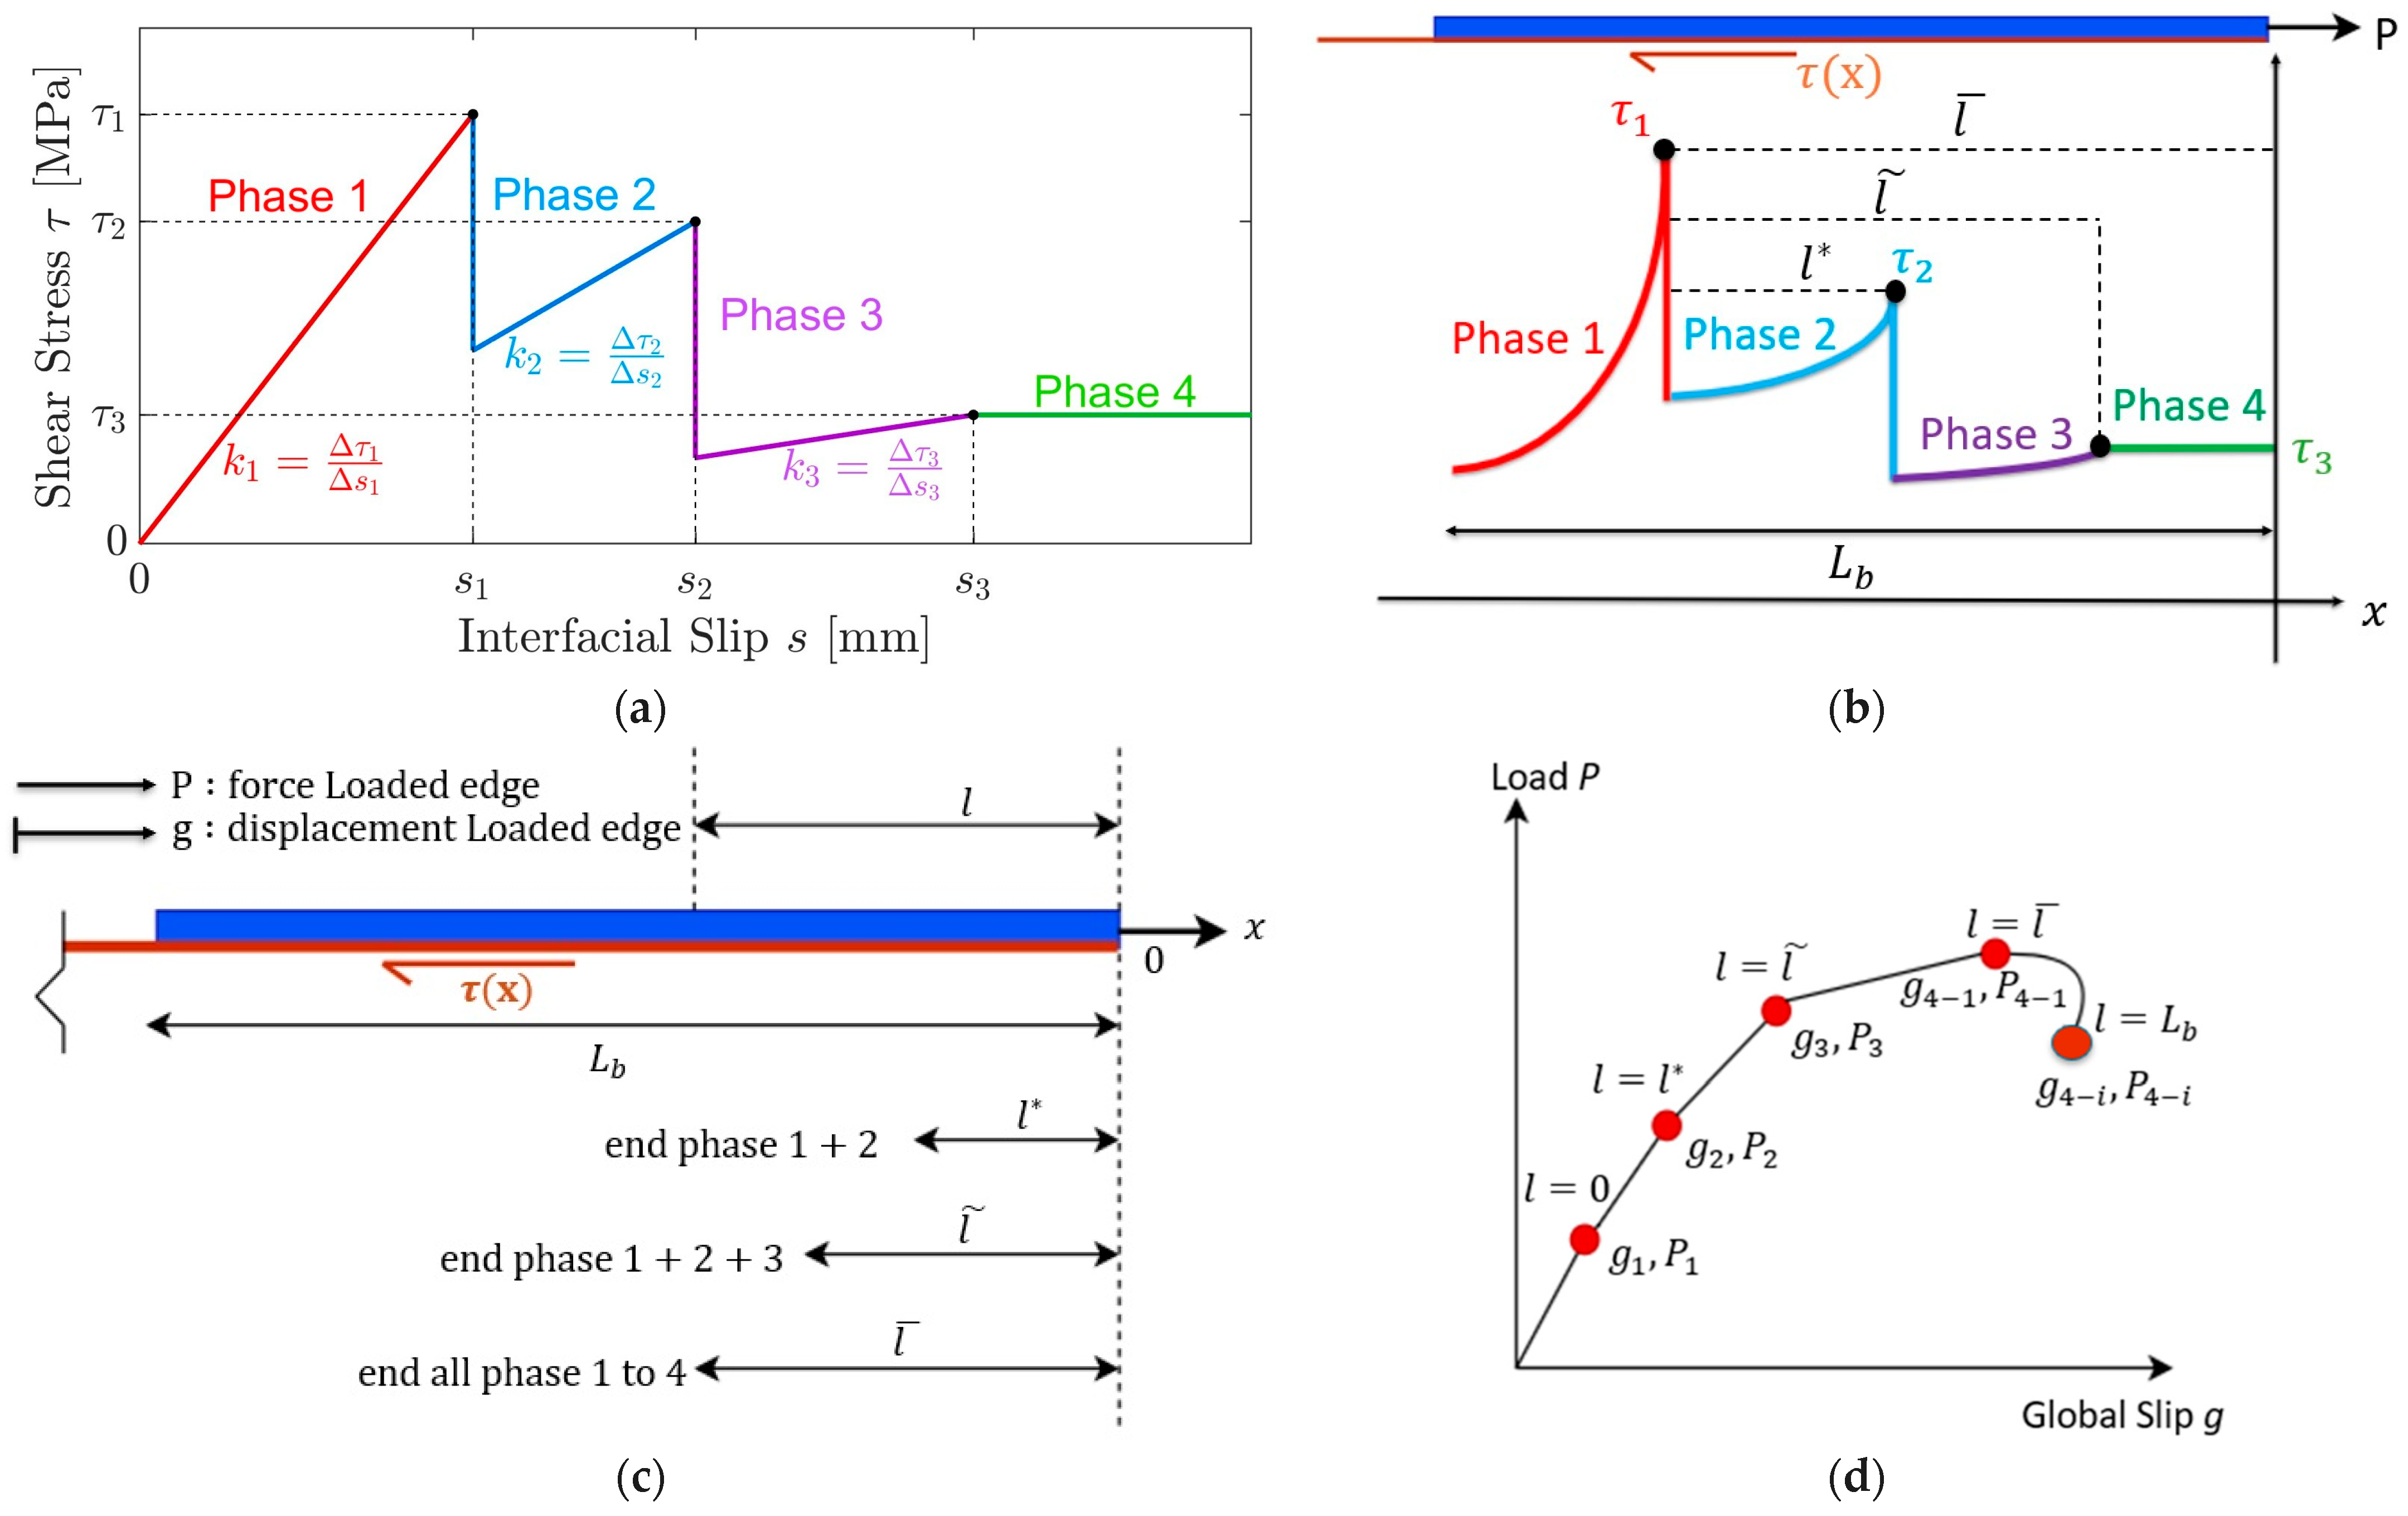
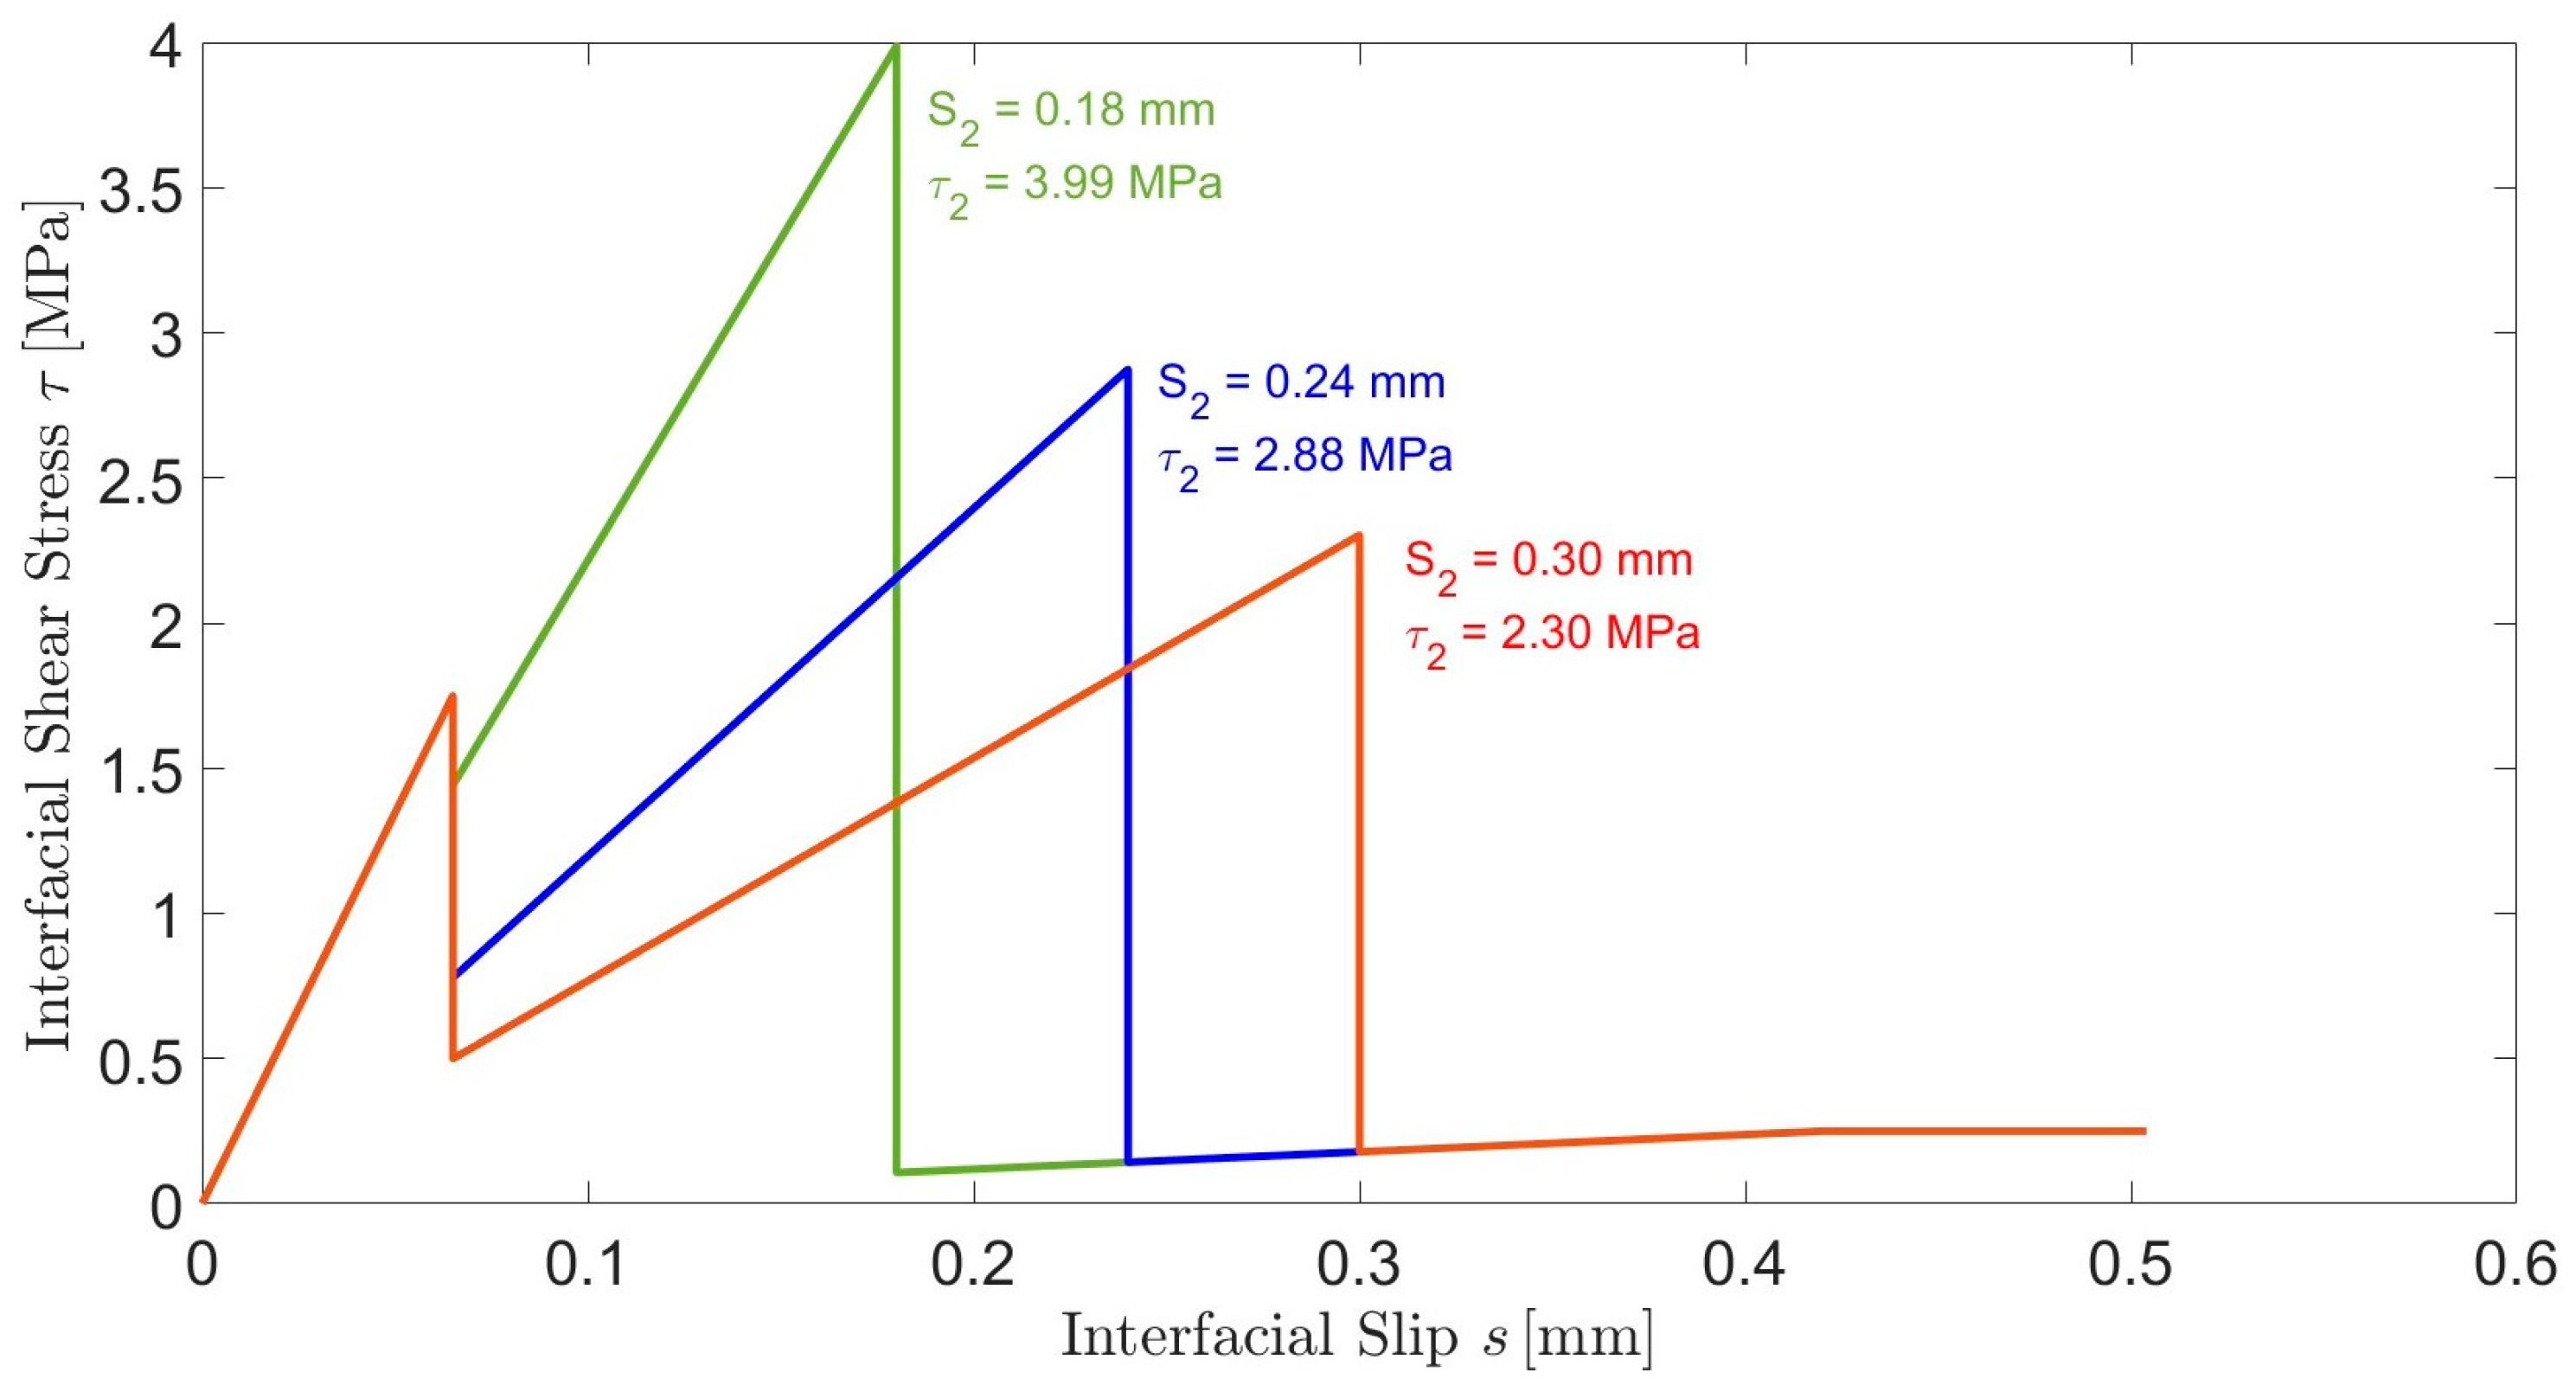
This approach approximates the classic trilinear law while offering significant computational advantages. The model divides the interface behavior into four phases, as in
Figure 5a, each characterized by a distinct stiffness, thus providing a piecewise-linear representation of the softening response [
3]:
Phase 1—Initial Elastic Stage: Similar to the first branch of the trilinear model, where the interface behaves elastically with stiffness , transferring shear stress to the substrate without damage.
Phases 2 and 3—Progressive Softening: These two phases approximate the descending branch of the trilinear law by introducing two additional elastic phases with progressively reduced stiffness ( and ). This ensures that global behavior mimics the gradual loss of bond capacity.
Phase 4—Residual Stage: The last phase corresponds to a horizontal plateau with zero stiffness (), representing the residual stress after complete degradation of the bond.
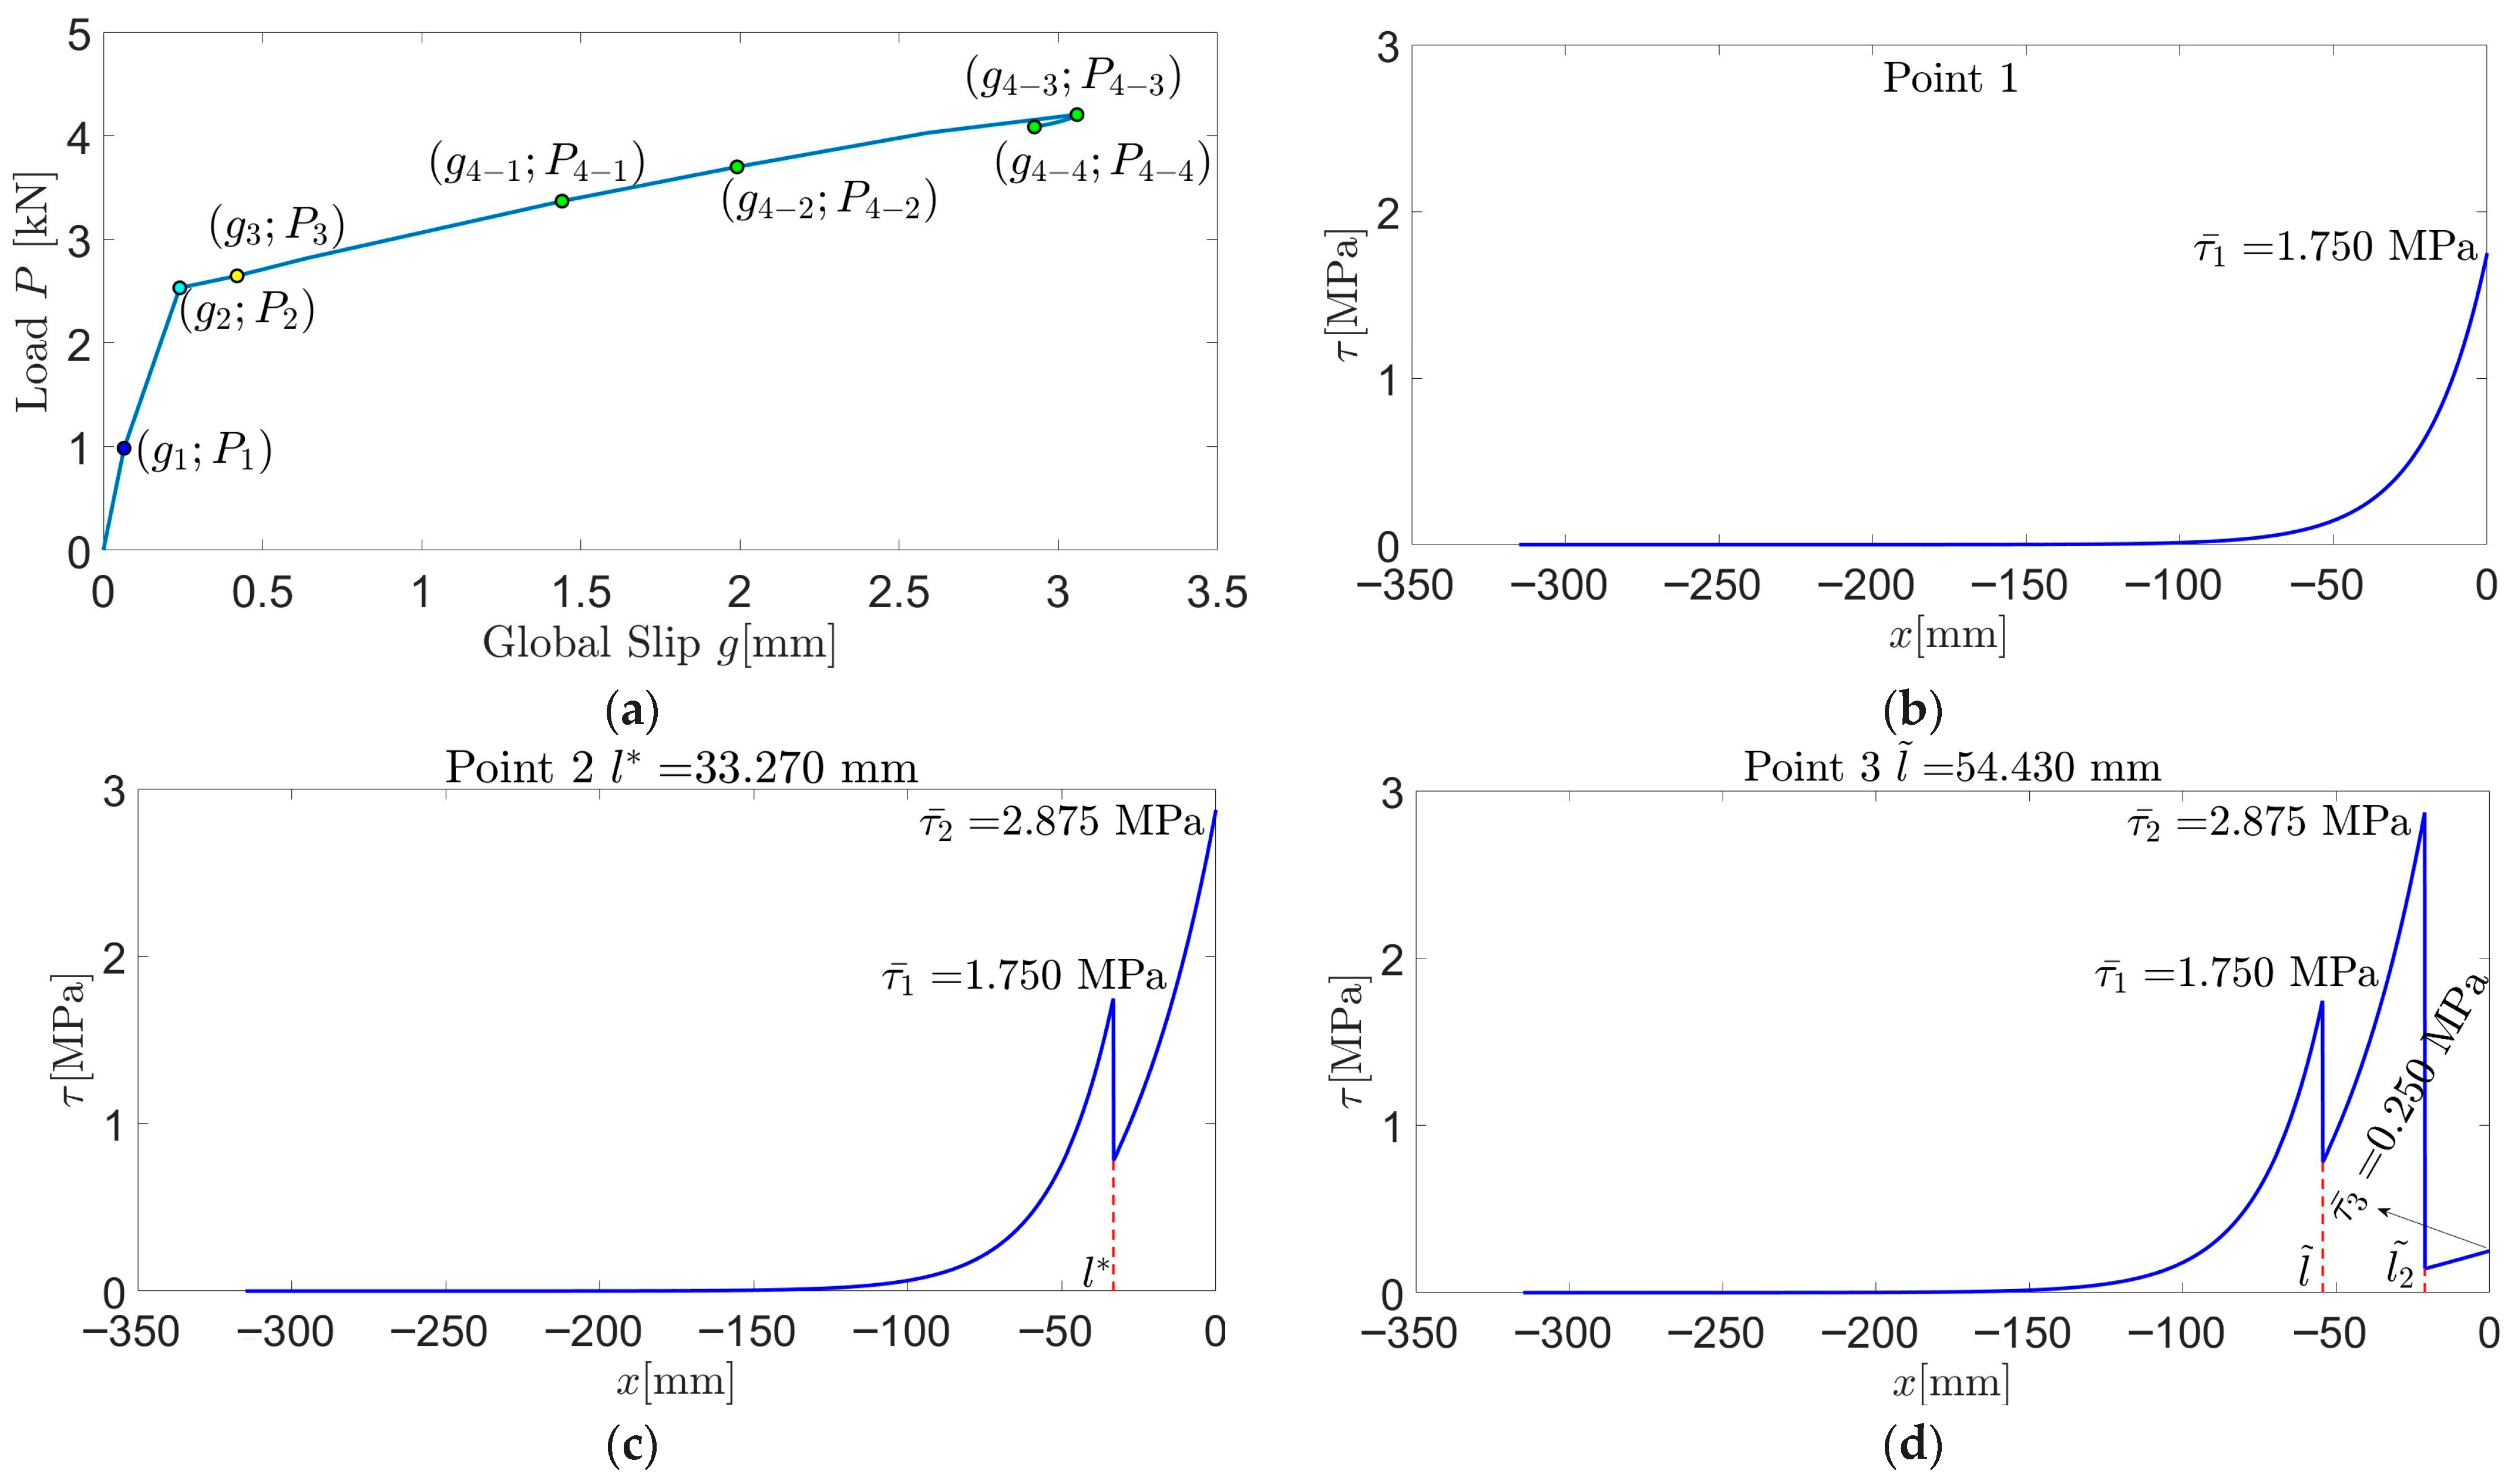
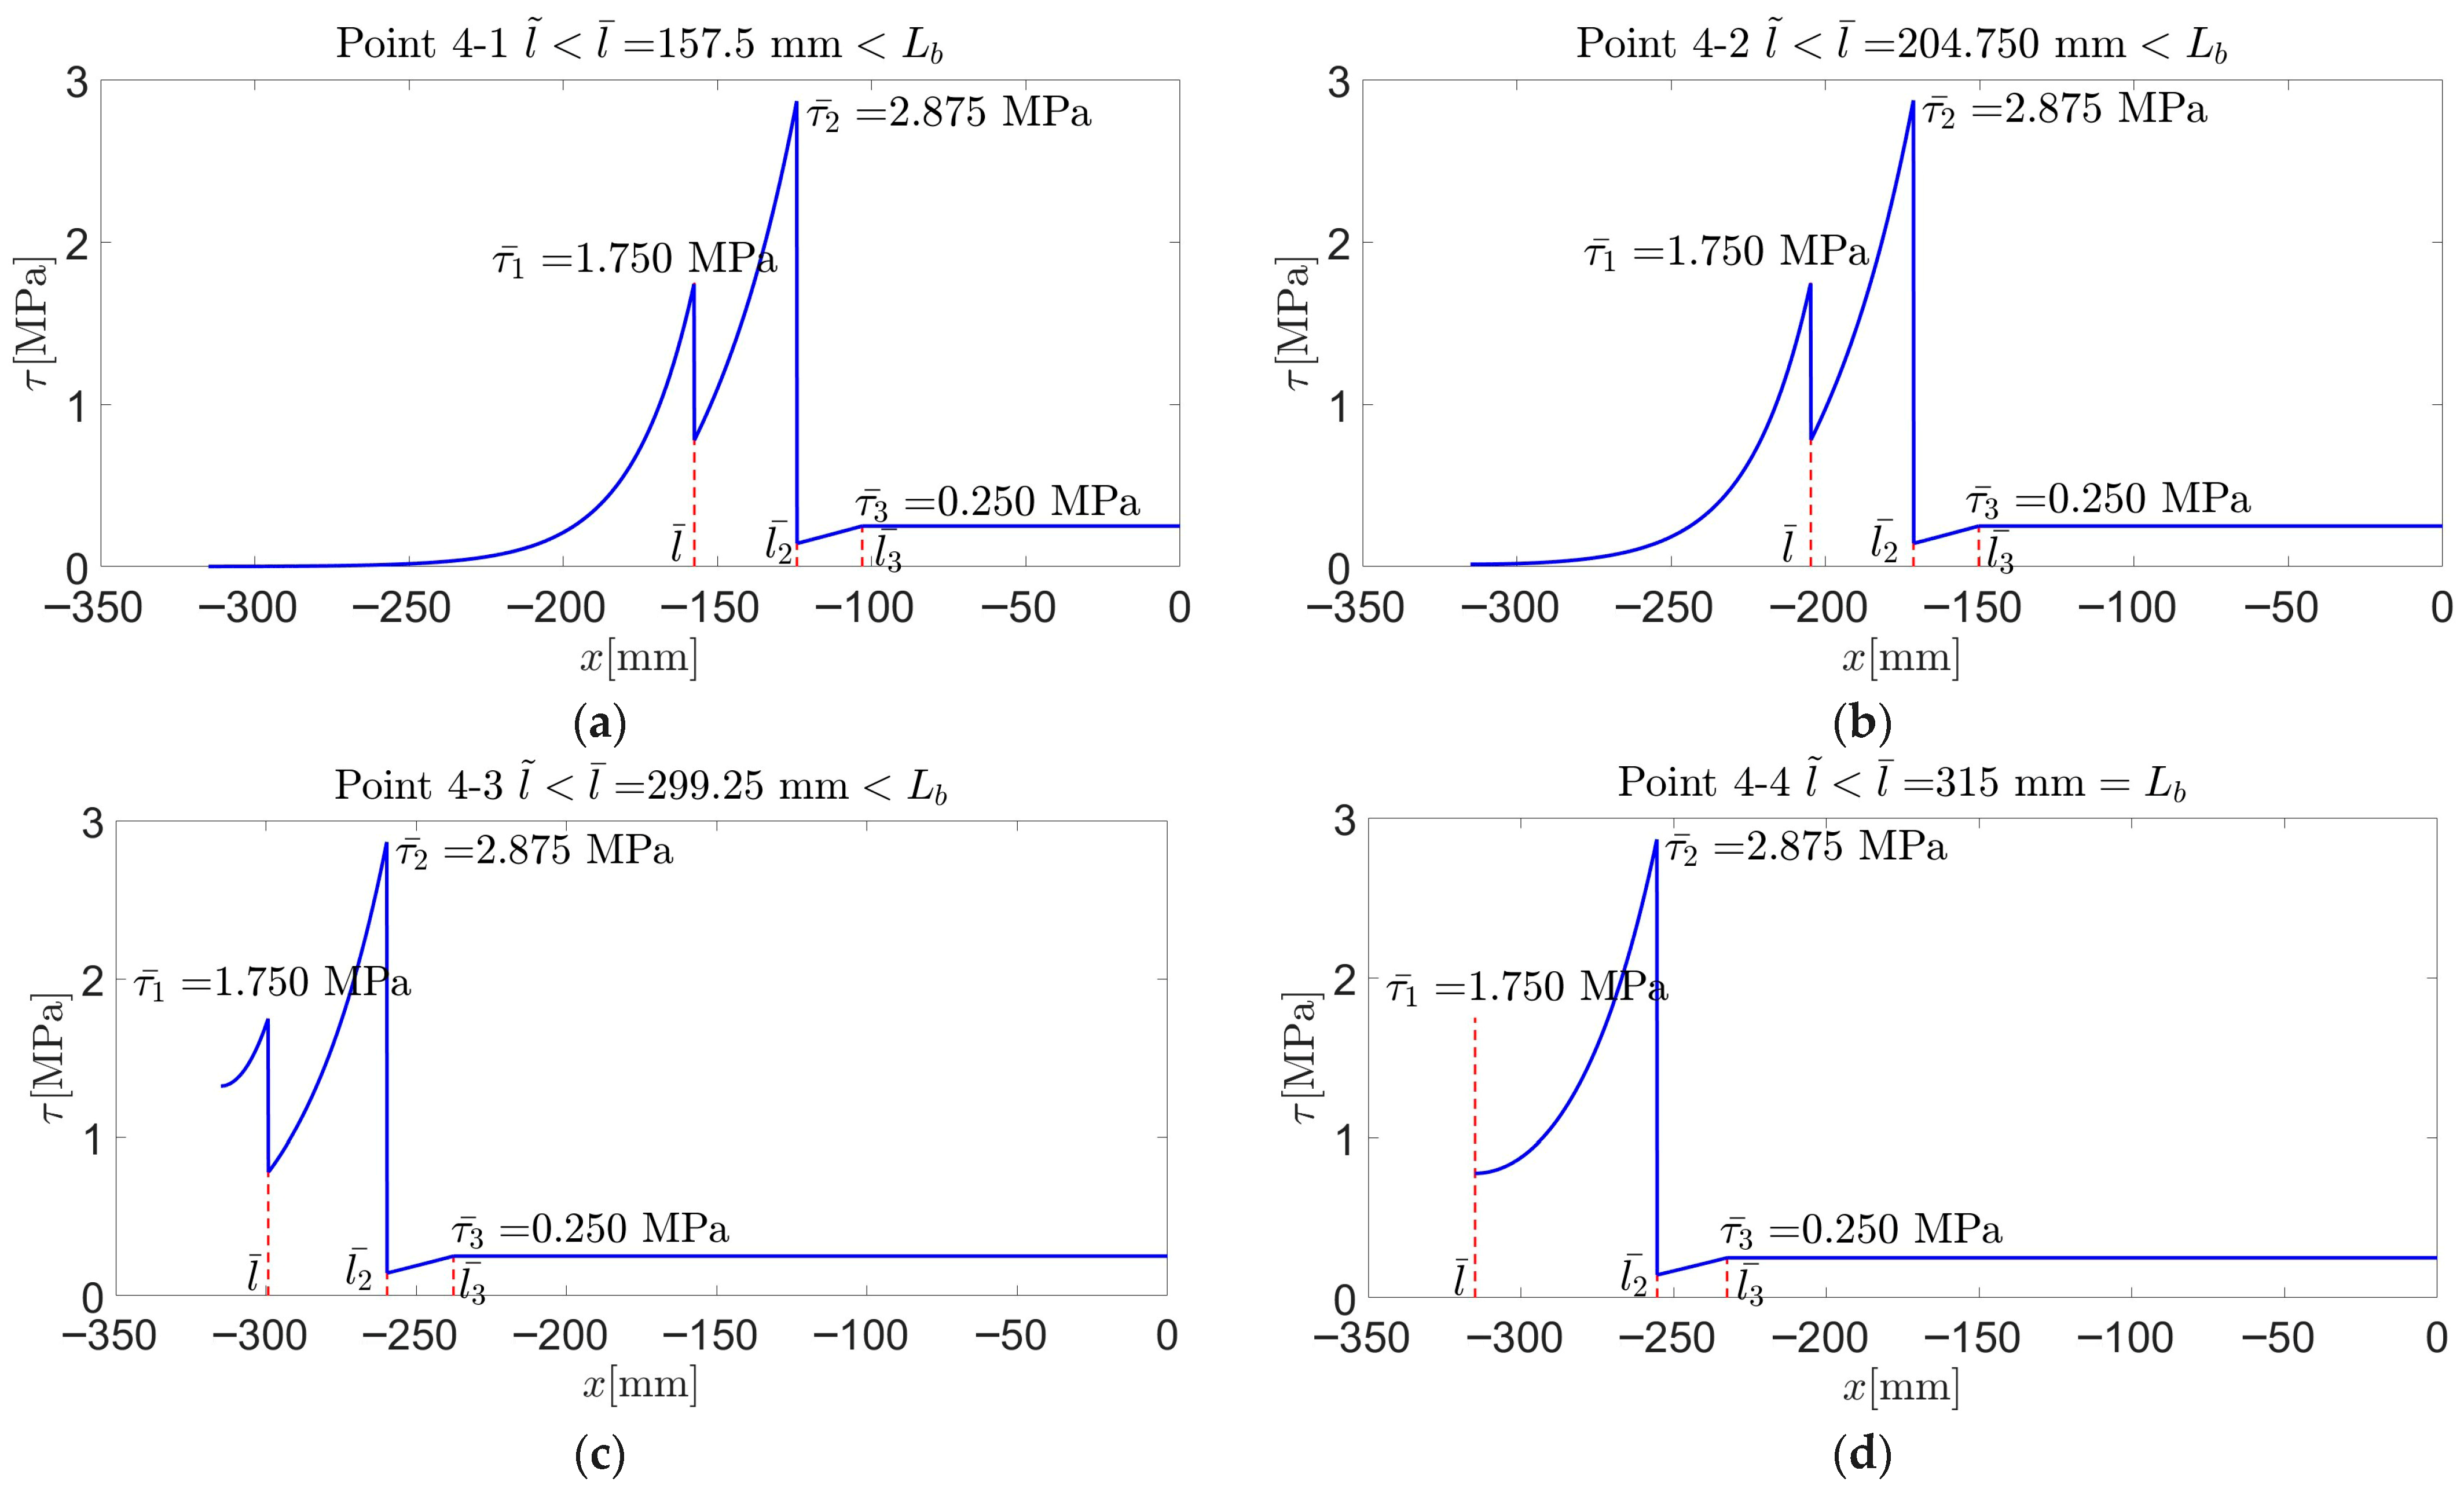
Figure 5b illustrates the four phases of the sawtooth analytical interface model and the corresponding shear stress distribution
along the bonded length of the FRCM–substrate system. The first phase represents the initial elastic response of the interface with maximum stiffness
and peak stress
. As loading increases, softening begins near the loaded end
, leading to the activation of the second phase with reduced stiffness
and stress
. Further loading causes the onset of the third phase
, representing additional degradation of the interface stiffness and the propagation of the debonding front toward the free end. The final fourth phase corresponds to the residual plateau, where the interface maintains a constant shear strength
due to frictional effects. The characteristic lengths (
) identify the positions along the bonded length where the transitions between phases occur—specifically,
marks the activation of Phase 3,
the initiation of Phase 4, and
a representative average position of stress redistribution during the progressive debonding process. Overall,
Figure 5b summarises the gradual evolution of the interface response, from the elastic regime to complete debonding, under increasing applied load P. This piecewise formulation allows the continuous trilinear cohesive law to be replaced by a sequence of elastic segments, simplifying the problem while accurately reproducing the experimental response. Consequently, closed-form analytical solutions can be derived to describe the evolution of the shear stress distribution τ(x) and the overall load–slip behavior of the FRCM–substrate system. A detailed description of the computation of (
), as well as further analytical details, is provided in [
3].
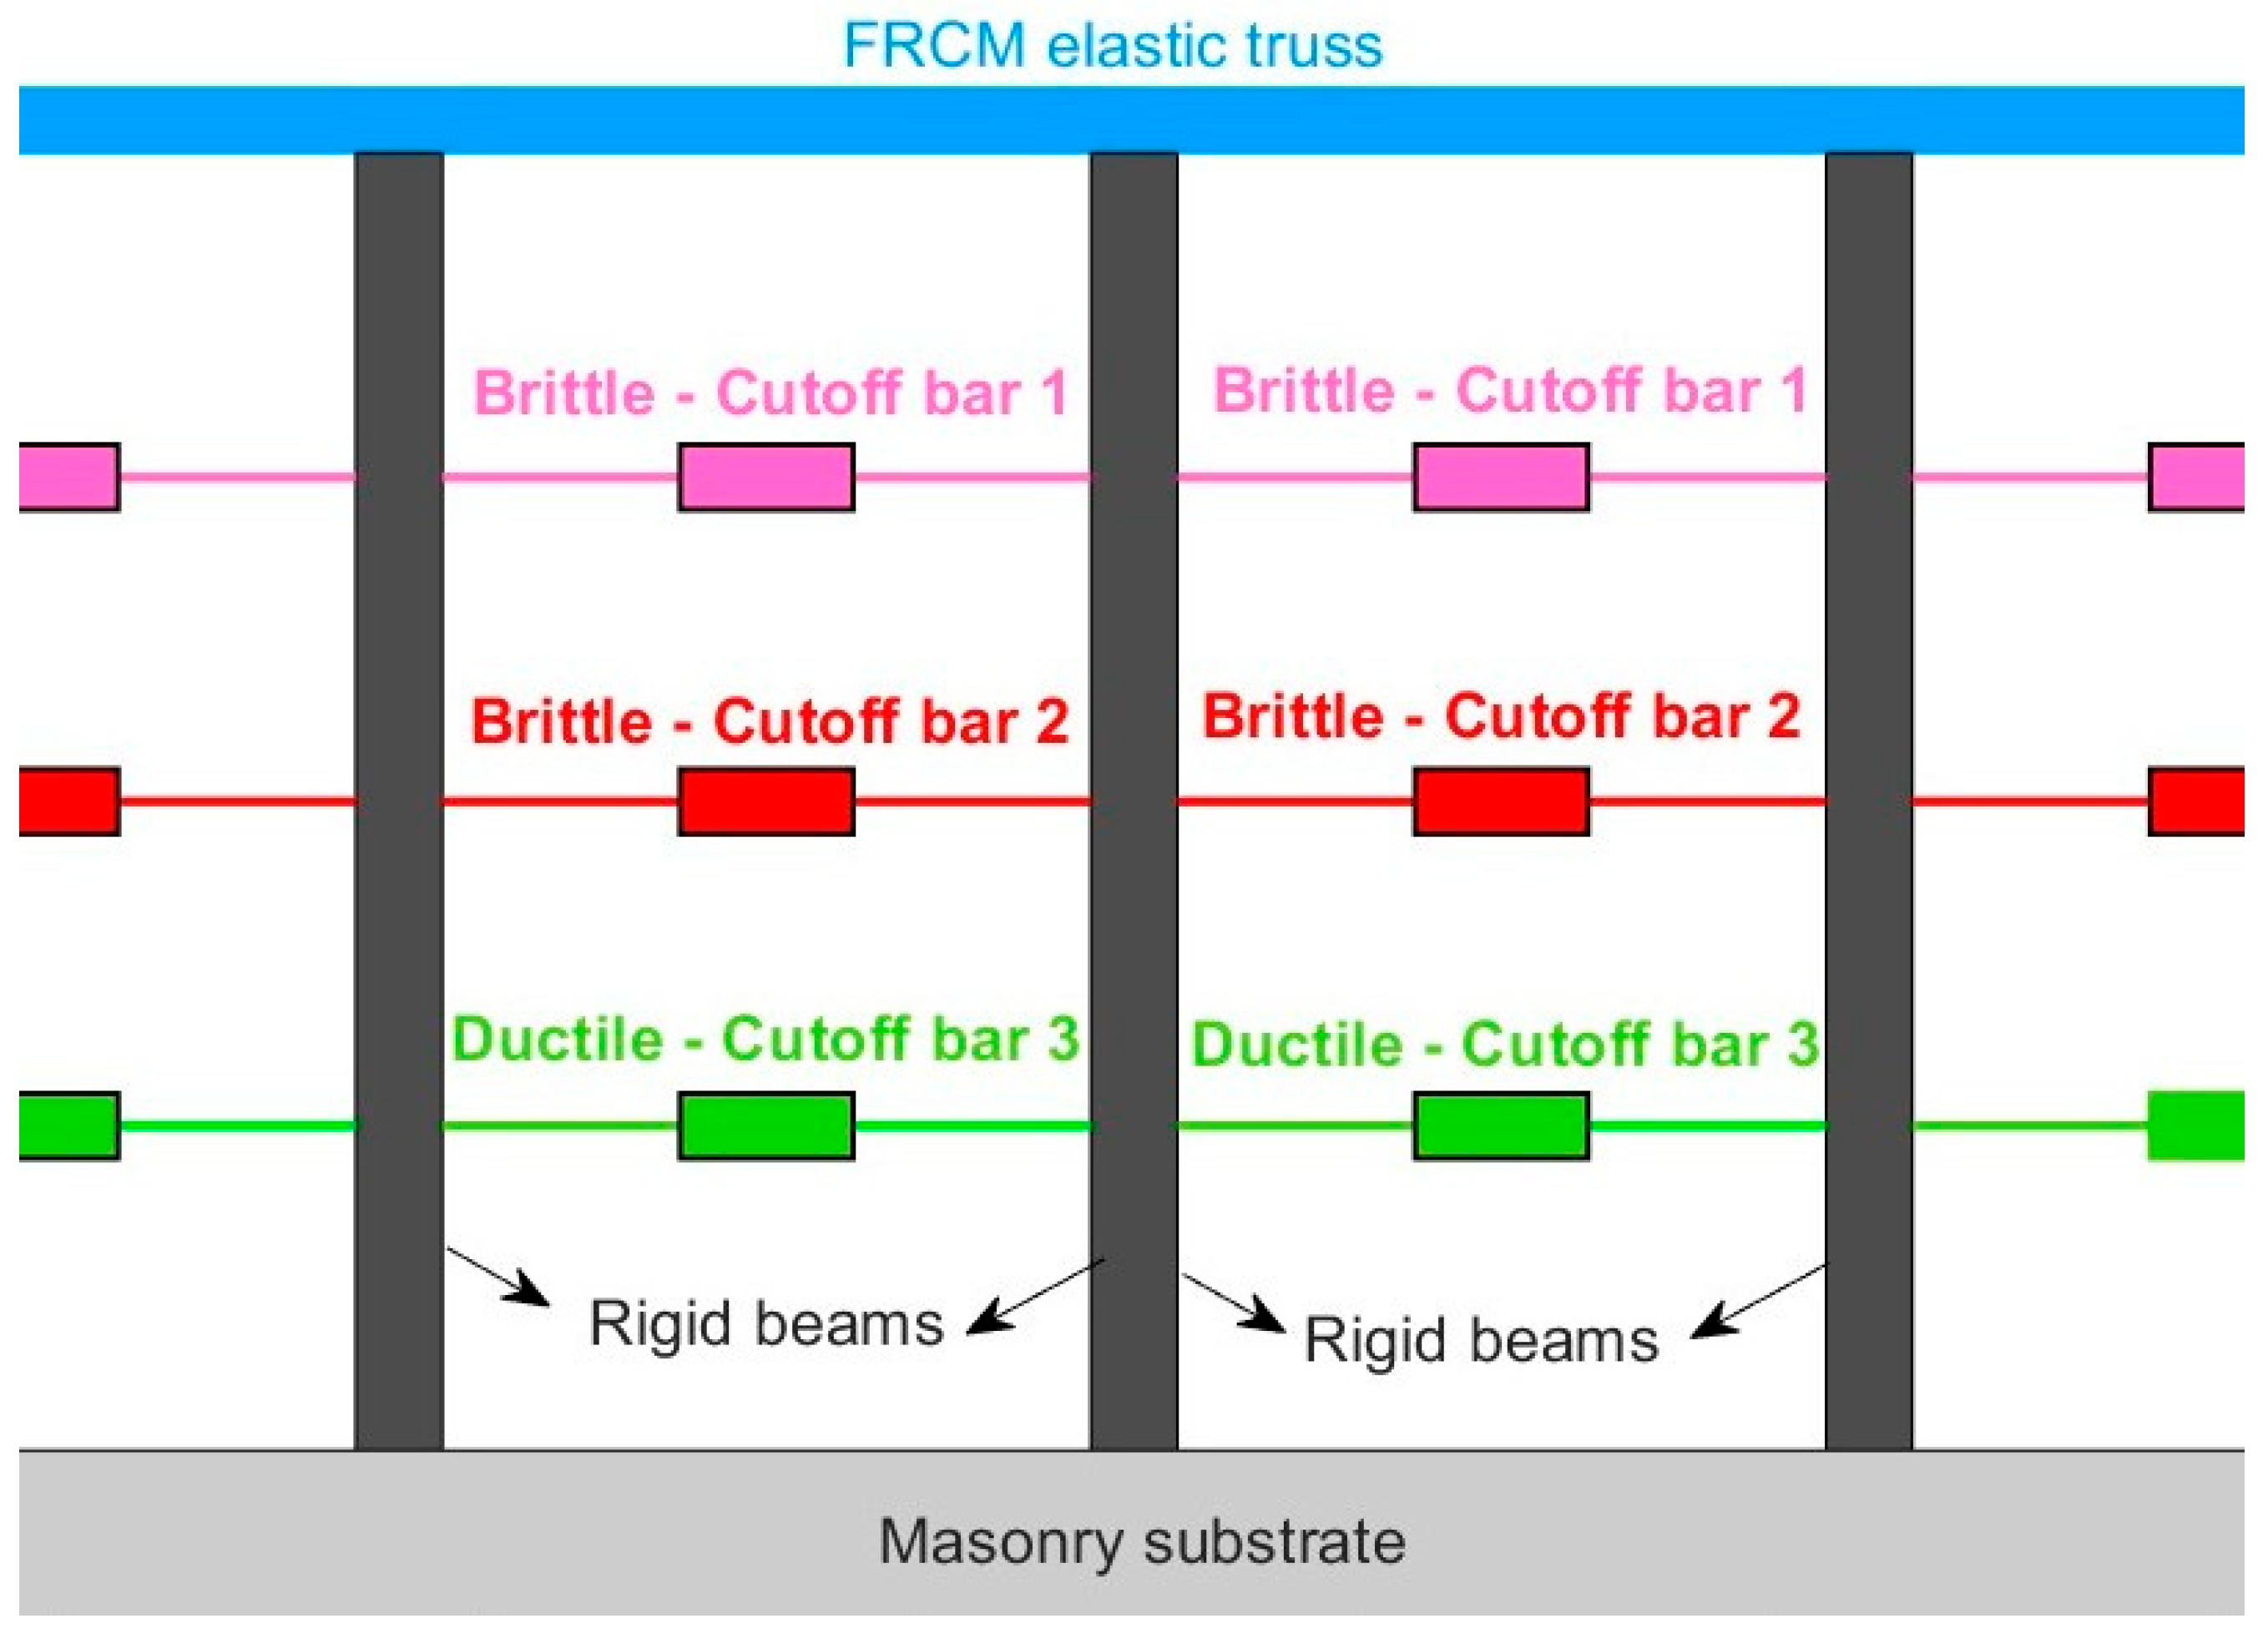
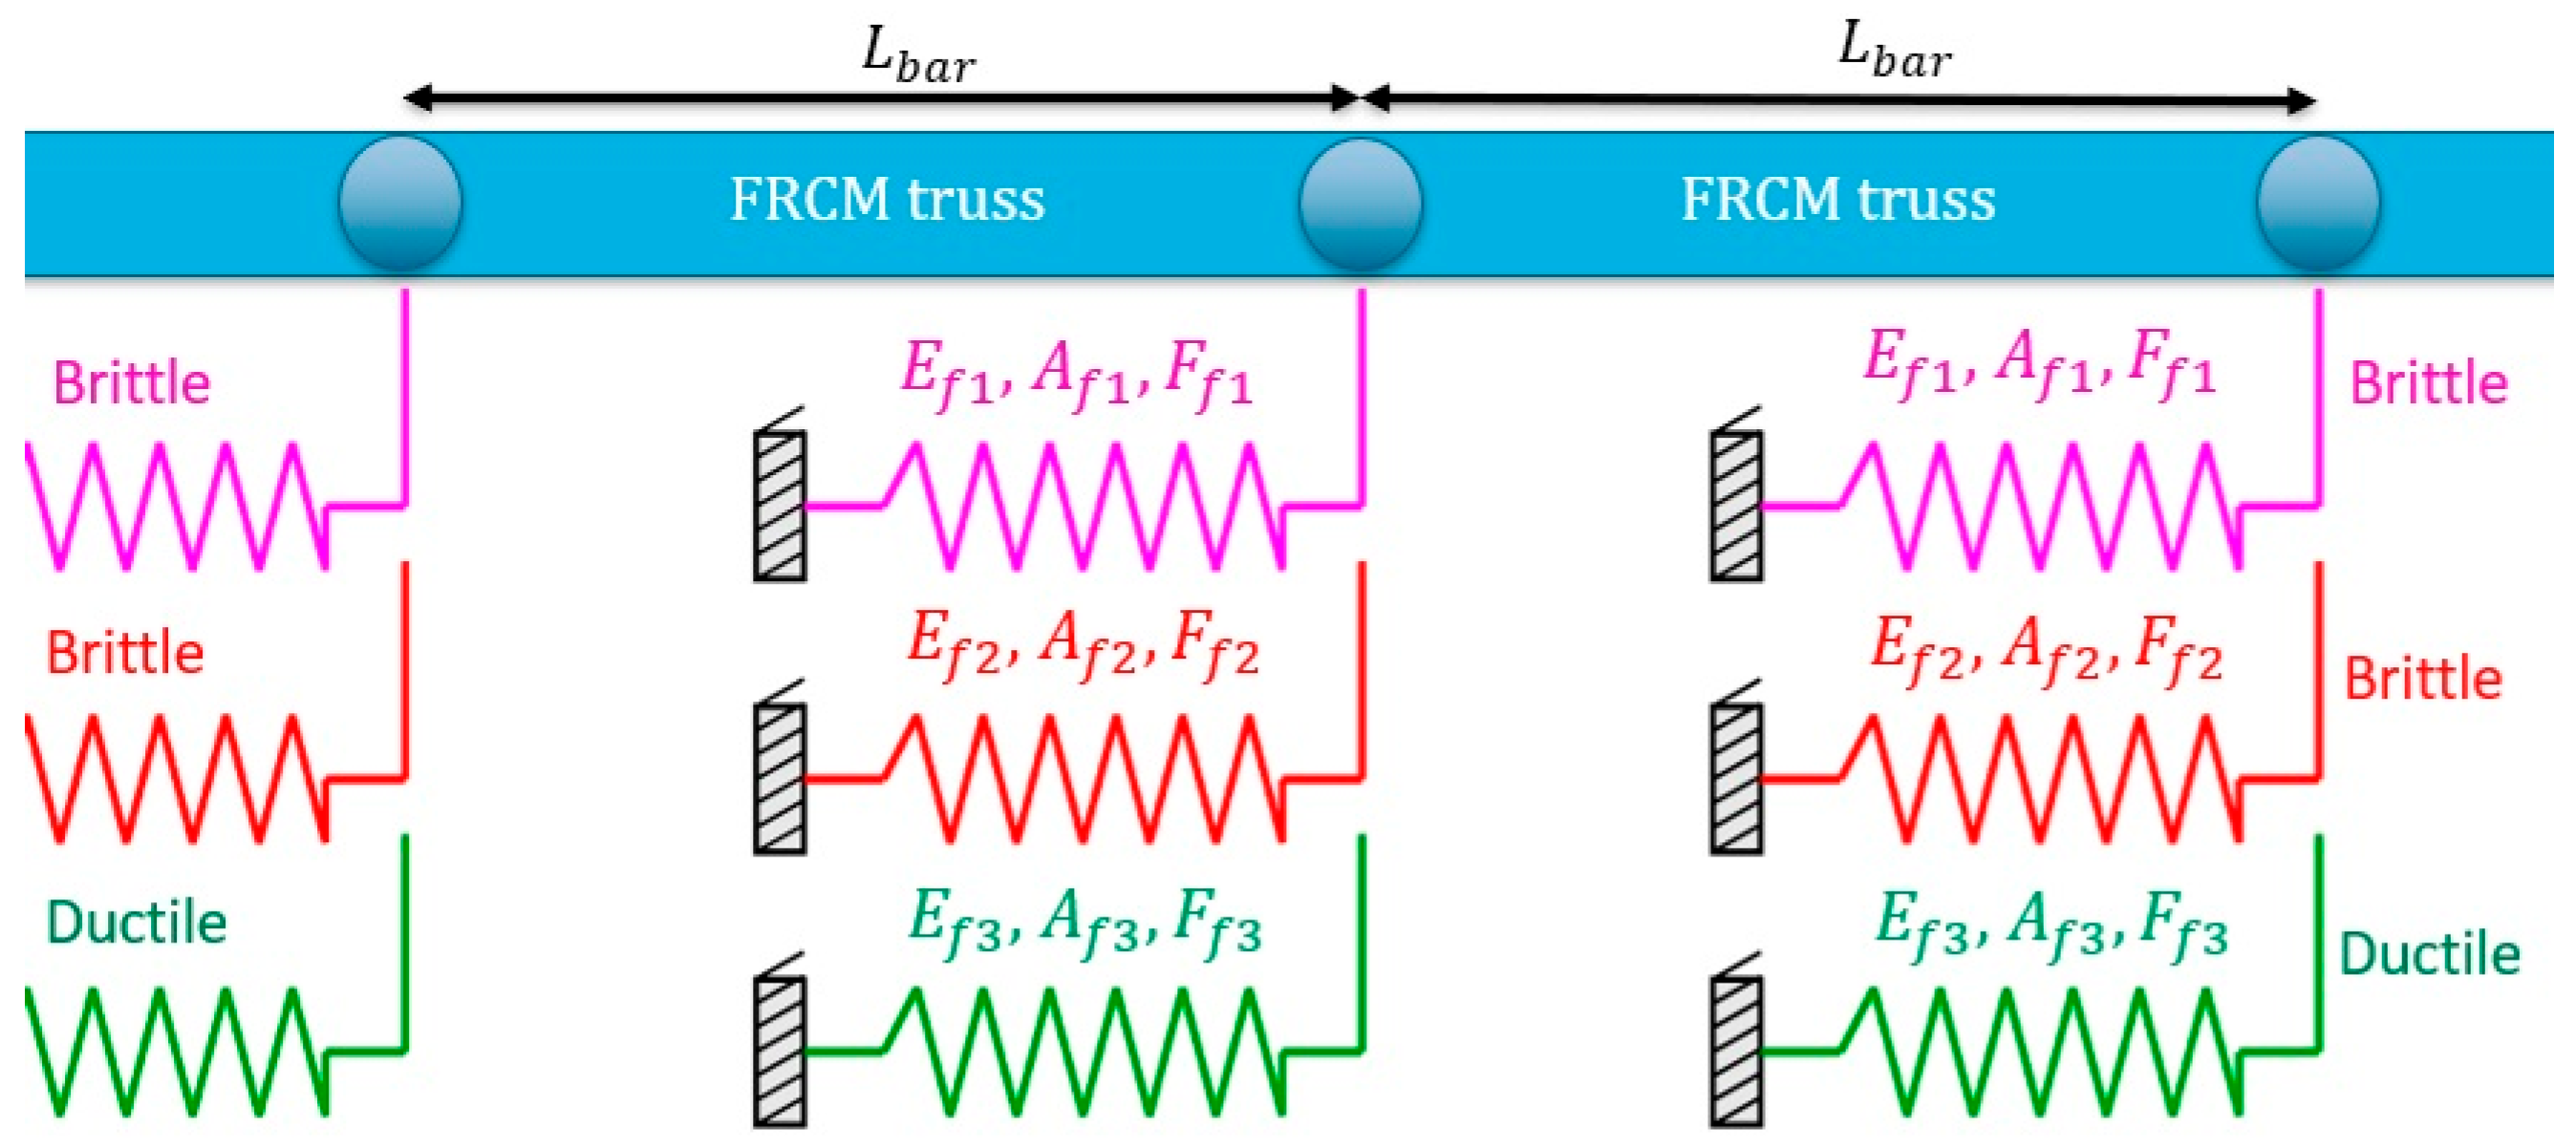
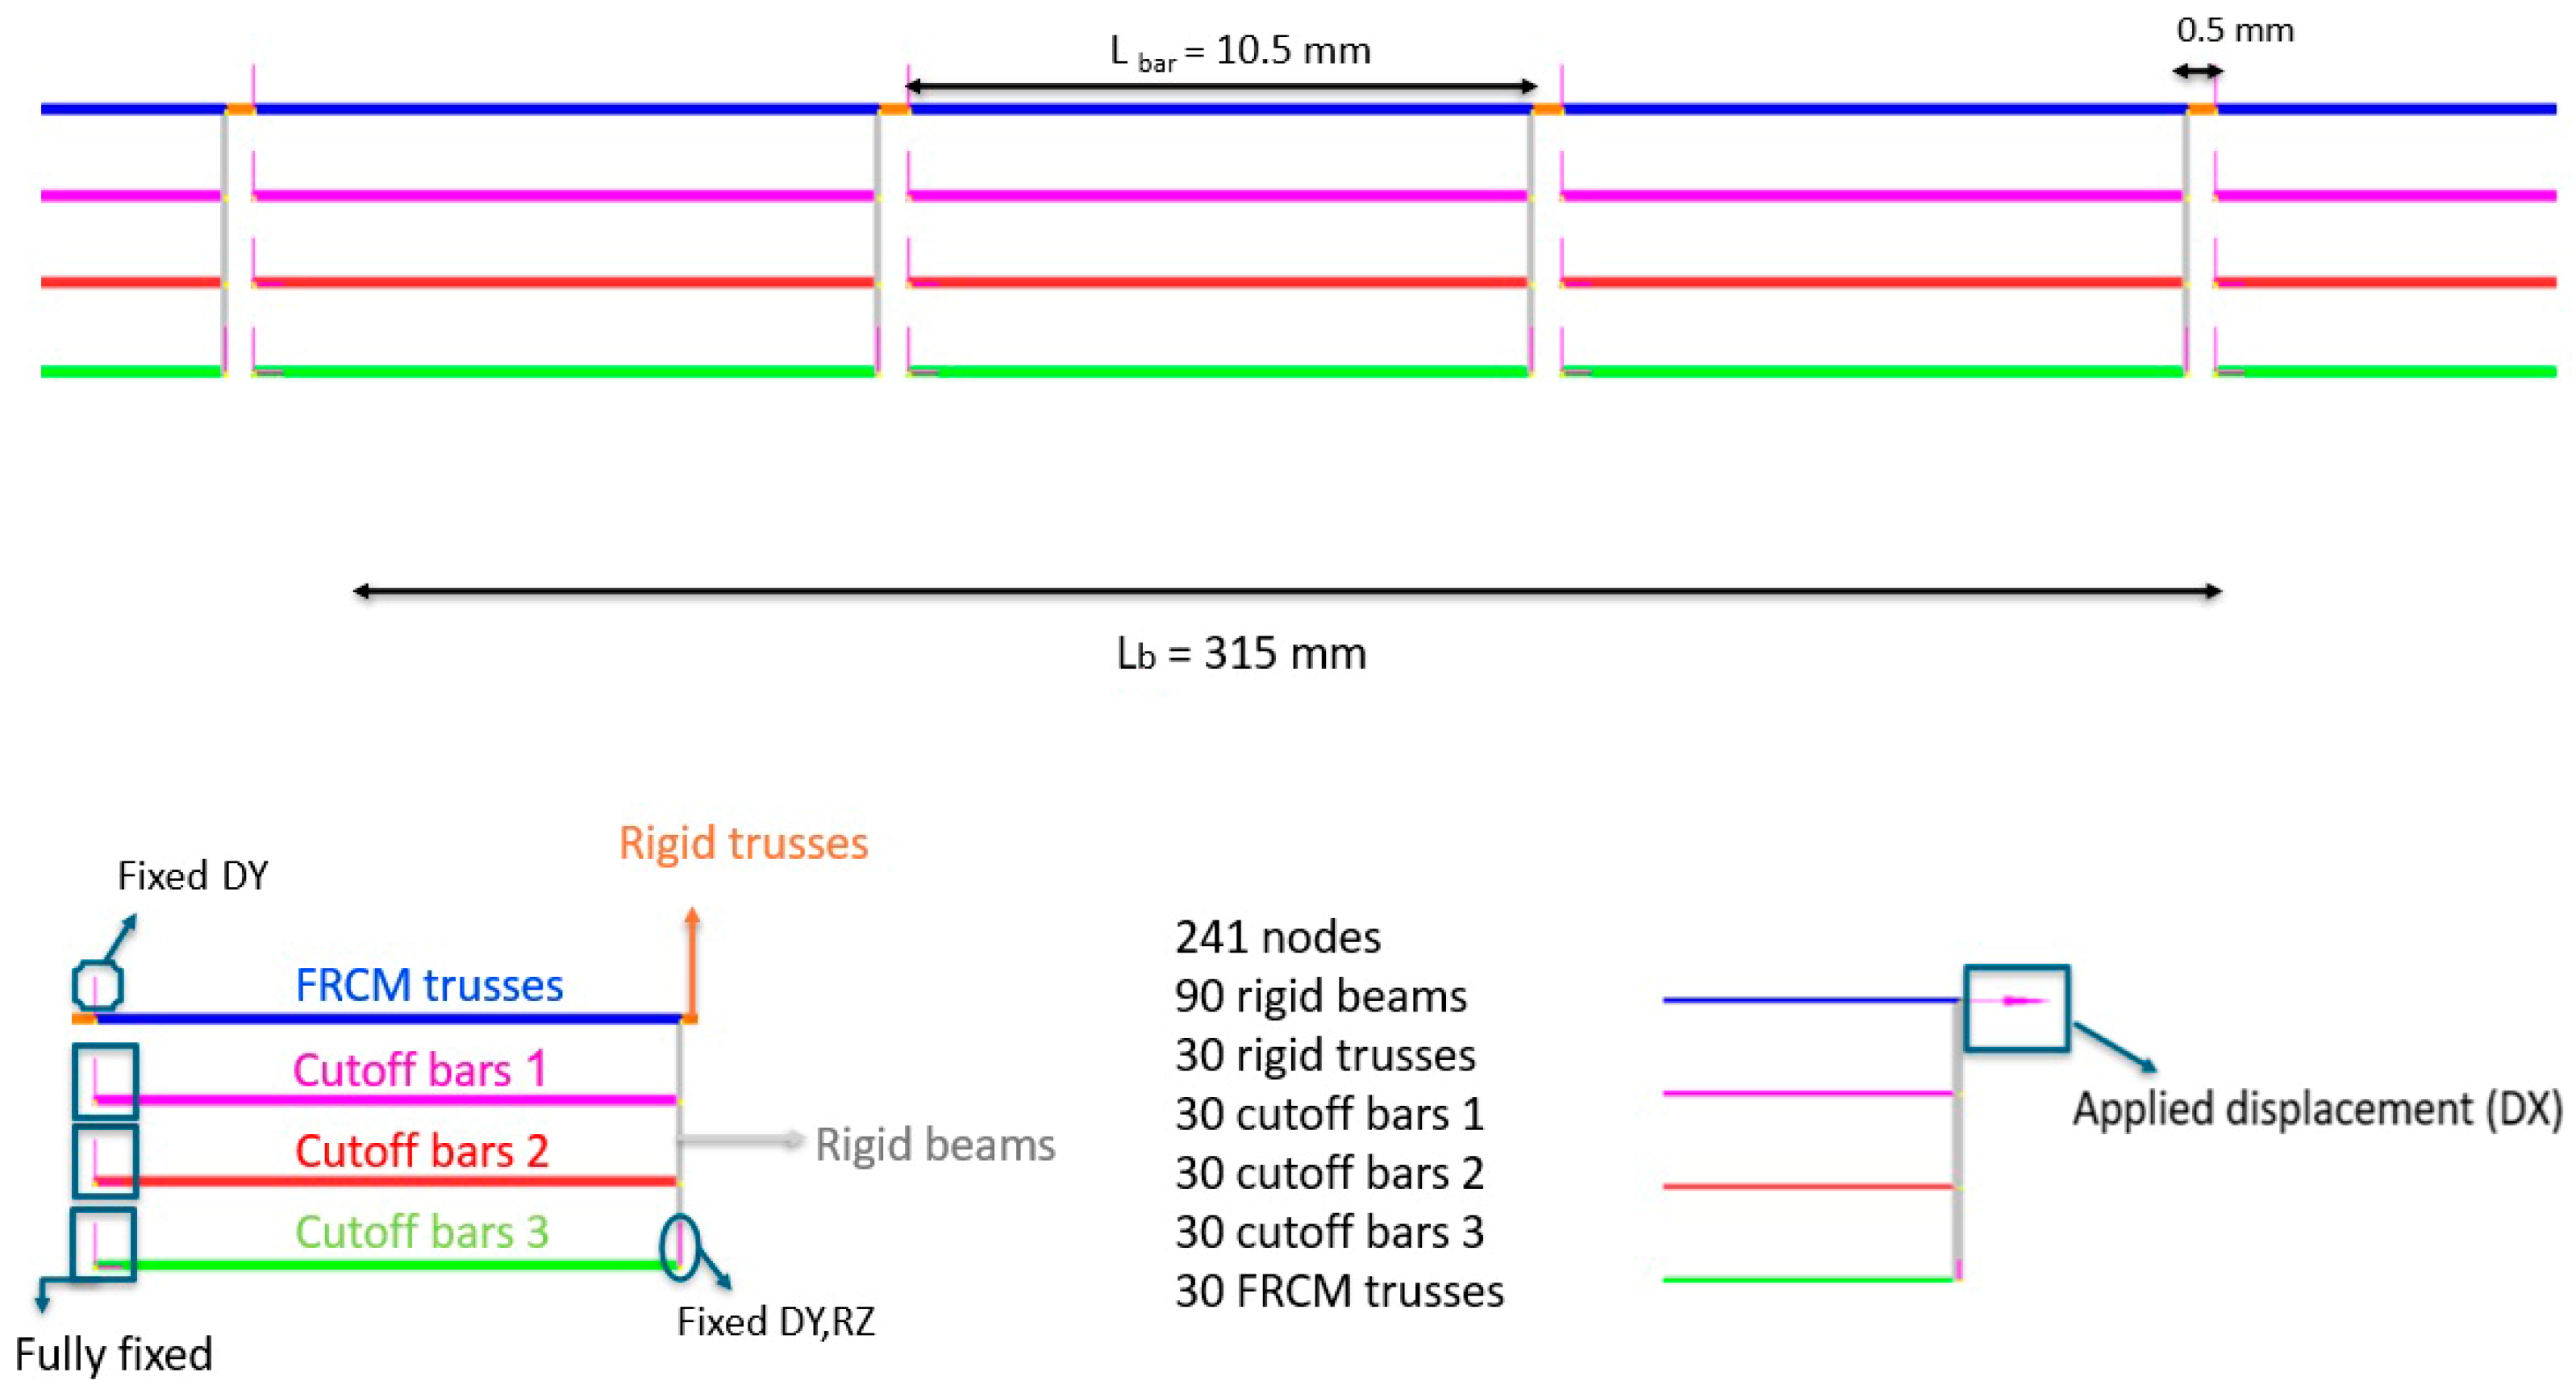
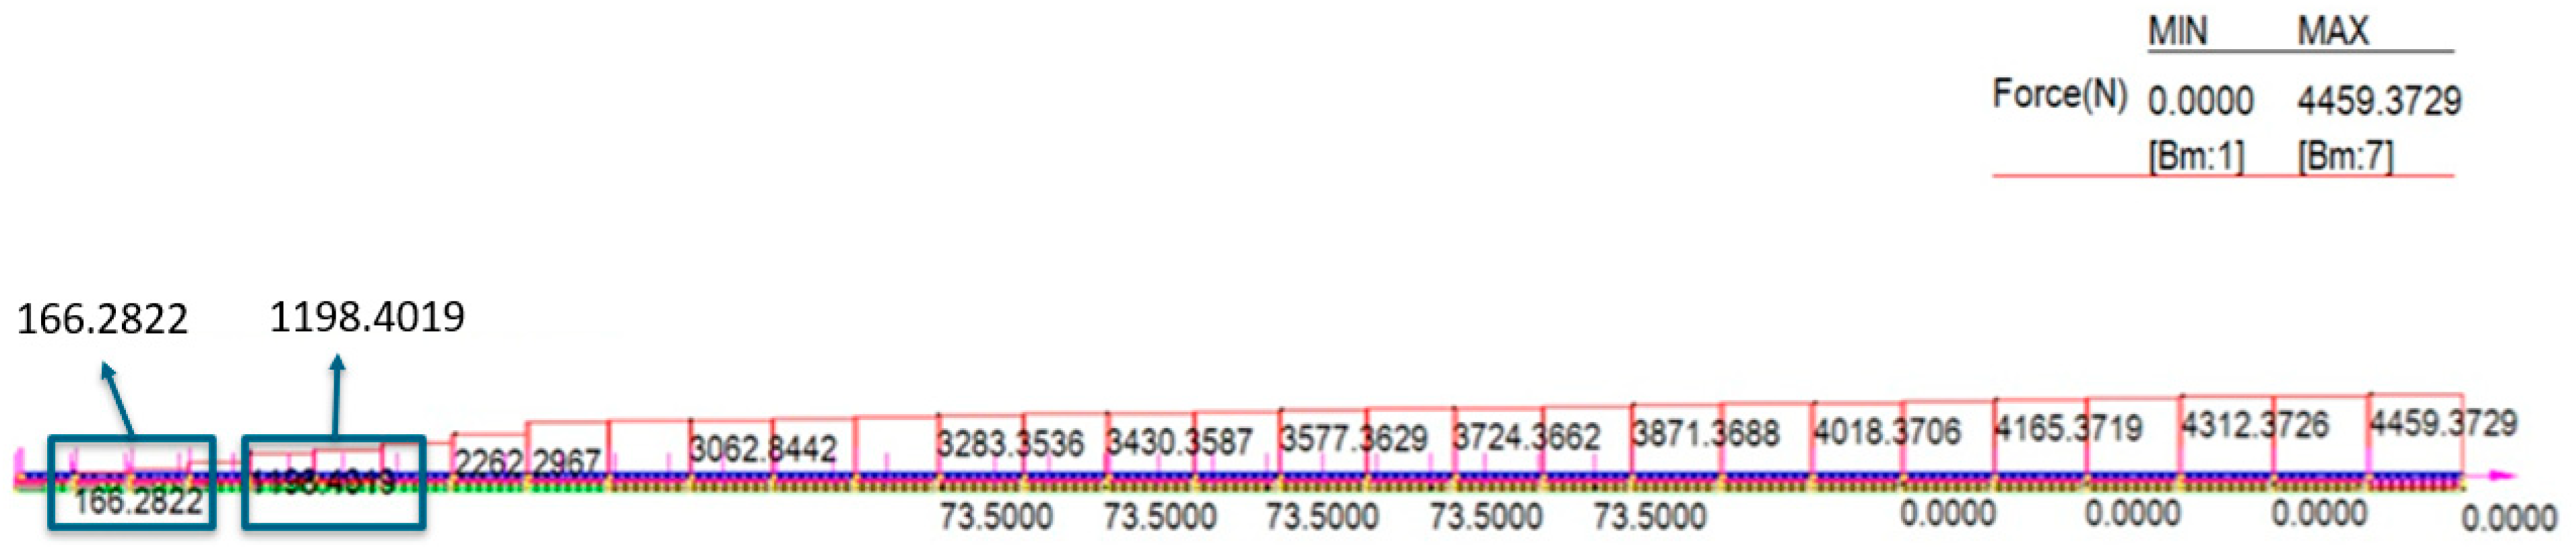
The main advantage of the sawtooth model is that it maintains linear elasticity within each phase, allowing for analytical solutions of the governing differential equation without the need for numerical solvers such as Runge–Kutta or finite difference methods. Furthermore, the model is easily implemented in standard FE software using cutoff bars (CoBs)—truss elements with limited tensile strength—combined with rigid links to simulate the interaction between the FRCM layer and the substrate. This direct implementation eliminates the need for user-defined subroutines [
3].
The model is defined by six key parameters
(see
Figure 5a), where
is the interface shear stresses and
is the corresponding slip at the phase transition points. Notably, four of these parameters (
) are common with the trilinear law, meaning only two additional parameters (
) need to be calibrated to reproduce the same macroscopic response. To ensure consistency in the total fracture energy between the trilinear and sawtooth interface models, the fracture energy of the sawtooth model is equated to that of the trilinear model. Since (elastic) phase 1 and phase 4 in
Figure 5a are identical in both the trilinear and sawtooth models, such energetic equivalence can only be referred to the portion of the diagrams between
and
. These values can be derived by referring to the trilinear model (
) and the sawtooth model (
) as follows:
By equating
and
,
can be calculated as a function of
as follows:
Finally, the slope of each linear ascending branch in
Figure 5a can be easily obtained as:
This procedure allows generating multiple sawtooth interface laws that preserve the same overall fracture energy of the trilinear model while varying
according to the chosen
. Because each phase is elastic (except the residual plateau), the slip, normal stress in the fibers, and interfacial shear stress can be expressed in exponential form along the bonded length, similar to the trilinear model. This makes the sawtooth approach both accurate and practical, suitable for large-scale FE simulations of FRCM-strengthened members without requiring complex programming.
Figure 5c,d illustrate how the sawtooth model derives the global force–slip response of the joint. The left schematic shows the progressive activation of phases along the bonded length, while the right graph presents the corresponding global P-g curve, with key points marking each phase transition.
Figure 6 illustrates the flowchart of the main steps of the sawtooth method. For further details, see the reference paper [
3].