Article

Heat Treatment and Fracture Behavior of Aluminum/Steel FSW Joints: A Comprehensive Analysis of a Curved Interface

by
Tiago Oliveira Gonçalves Teixeira
1,
Reza Beygi
2,*,
Masih Bolhasani Hesari
2,
Ricardo João Camilo Carbas
1,
Eduardo Andre Sousa Marques
1,
Mohammad Mehdi Kasaei
3 and
Lucas Filipe Martins da Silva
1
1
Department of Mechanical Engineering, Faculty of Engineering of the University of Porto, Rua Dr. Roberto Frias, 4200-465 Porto, Portugal
2
Department of Materials Engineering and Metallurgy, Faculty of Engineering, Arak University, Arak 38156-8-8349, Iran
3
Institute of Science and Innovation in Mechanical and Industrial Engineering (INEGI), Rua Dr. Roberto Frias, 4200-465 Porto, Portugal
*
Author to whom correspondence should be addressed.
J. Manuf. Mater. Process. 2025, 9(11), 381; https://doi.org/10.3390/jmmp9110381
Submission received: 22 October 2025 / Revised: 12 November 2025 / Accepted: 15 November 2025 / Published: 20 November 2025
(This article belongs to the Special Issue Innovative Approaches in Metal Forming and Joining Technologies)

Abstract

Joining dissimilar metals, such as aluminum and steel, presents an attractive option for creating lightweight yet durable structures. However, challenges arise from the formation of brittle intermetallic compounds (IMCs) at the interface of dissimilar joints, which significantly impact joint strength under load and often lead to brittle failure. This research elaborates on how an S-shaped Al/Steel interface made by a modified friction stir welding (FSW) process mitigates the detrimental effect of IMC thickening on joint strength. This study aims to explore the effects of various post-weld heat treatments on steel and aluminum joints produced through FSW (100–400 °C for 30–90 min). Al/steel FSW joints were characterized by SEM/EDS for interface microstructure and composition, microhardness mapping, tensile testing, and fractography. Any post-weld heat treatment above the temperature of 100 °C caused a drop in joint strength from 2400 N to 1800 N due to the elimination of protrusions in the IMC layer. Further post-weld heat treatment had a negligible effect on the joint strength due to an S-shaped interface. A finite element simulation using a cohesive model for the joint interface is used to study the fracture mechanism of the joint. Both experimental observations and simulation results suggest that the portion of the S-shaped interface perpendicular to the loading direction acts as an initiation site of fracture and fails in a brittle manner. The top and bottom of the interface, which are inclined to the loading direction, fail in a ductile manner with noticeable plastic deformation in the steel adjacent to the interface. The proposed method for FSW of aluminum to steel significantly improves joint durability at elevated temperatures, particularly up to 400 °C.

1. Introduction

In recent times, the automotive sector has dedicated significant time and resources to the search for lightweight substitutes for its structural elements [1]. These include the substitution of high-strength-to-weight alloys like aluminum (Al) for the commonly used steel (St) [2], and the adoption of greener and more energy-efficient technologies [3,4]. The friction stir welding (FSW) joining process makes it possible to create a solid-state weld (SSW) between two different metals using a non-consumable rotating tool [5]. The tool creates the heat required for the substrates to become plastic by causing friction, which enables the two to mix and stir until a weld is formed [6]. Conventional fusion-based methods are often unable to join different metals together [7], and the FSW approach has the added benefits of not being energy-intensive and being ecologically benign. It does not require the use of flux or cover gas during the welding process [8].
The production of hard and brittle Al-Fe intermetallic compounds (IMCs) at the interface poses a significant barrier to dissimilar metal welding [9], particularly for Al/St [10,11]. This phenomenon leads to inferior mechanical characteristics of the joint, ultimately diminishing its structural dependability [12]. The high friction temperatures attained during the FSW process and the stirring of the two metals facilitate the diffusion of Al and Fe elements across the joint interface and the ensuing solid-state reaction of the atoms [13], which in turn leads to the nucleation and additional growth of IMCs along the bonded interface [14]. Furthermore, annealing the joint after manufacturing promotes the formation of IMCs, enabling the study of the IMC layer growth kinetics [15].
Several studies have investigated the influence of post-weld heat treatment on Al/Steel FSW joints, showing that moderate annealing temperatures can relieve residual stresses and slightly enhance ductility, while excessive heating leads to excessive IMC growth and severe strength degradation. Bolhasani Hesari et al. [16] reported that annealing up to 400 °C promotes initial strengthening due to stress relaxation but further exposure accelerates Fe–Al intermetallic thickening, causing brittle fracture. Likewise, Insua et al. [17] demonstrated that optimizing PWHT parameters is crucial for maintaining the mechanical stability of dissimilar aluminum joints. Post-weld heat treatment also affects the temper of the Al alloy, which can also influence the overall strength of the structure. Despite softening in Al, it is the IMCs that determine the joint strength after post-weld heat treatment due to high brittleness [18]. In fact, there is a critical temperature and time beyond which the joint strength declines drastically, reported to be 400 °C and 90 min for Al/St joints in lap design [19]. Below this temperature, the decline is very smooth or even some improvements may be seen in the joint strength, as a thin IMC layer below 2.6 microns guarantees the existence of a metallurgical bond [19]. This holds not only for FSW joints, but also for other solid-state joining mechanisms such as rotary friction welding [20] and explosive welding [21], where critical temperatures of 350 °C and 500 °C were reported, respectively. A thorough analysis of the fracture surfaces showed that the fracture is not a simple brittle one, but a complex mixture of brittle and micro-plastic deformation passing through the interface of the IMC layer and steel [22]. Although the IMC layer is brittle, its toughness can be enhanced by making a complex path by introducing various kinds of IMCs between the layers [23].
The studies on the fracture behavior of IMCs and the effect of post-weld heat treatment on joint strength have not addressed how the fracture is influenced by the shape of the interface. In a butt configuration, the interface is perpendicular to the loading direction, while in a lap configuration, the interface is parallel to the loading, resulting in pure shear loading. Curved interfaces are in a more intricate direction with respect to loading.
A less-explored aspect of Al/St butt joints is their response to high-temperature exposure. This is very important as the IMC layer is prone to growth at high temperatures due to accelerated diffusion. The behavior of IMCs at high temperatures in joints like FSW [18] or roll welding [24] is known. Thickening of the IMC layer results in decreased joint strength. However, it is not yet clear how post-weld heat treatment affects joint strength when the shape of the joint interface is taken into account.
Recent studies have demonstrated that finite element (FE) modeling is an effective approach for analyzing fracture behavior in Al/Steel FSW joints, especially where crack initiation and propagation are strongly influenced by IMC characteristics and interface morphology. For instance, Beygi et al. [15] successfully employed FEM to correlate interfacial microstructure with fracture behavior in dissimilar-thickness Al/Steel FSW joints. Similarly, Wang et al. [25] utilized a cohesive zone modeling framework to predict the failure path at the intermetallic interface in good agreement with experimental results. More advanced developments, such as the phase-field and intrinsic cohesive formulations reported by Najafi Koopas et al. [26], further confirm that FEM tools can reliably capture mixed-mode separation and localized plasticity near complex interface geometries.
In this study, a novel FSW approach was used to join AA1050 to St37 steel, which resulted in the formation of a curved, S-shaped interface. This interface geometry was obtained by deliberately employing a thickness-mismatched joint design, aimed at enhancing material flow and intermixing during welding. The significance of this unique interface has been discussed in our previous work [27] describing the mechanism through which the ductility and strength of the joint are enhanced. This study delves into the durability of this joint at high temperatures, as IMC growth degrades the mechanical properties, predisposing the joint to brittle fracture. This is further explored in the following sections. Unlike conventional butt or lap configurations, the S-shaped interface in this study is designed to enhance mechanical interlocking and modify the loading mode across the weld interface. This geometry introduces a combination of normal and shear stress conditions along the joint, potentially reducing the detrimental effect of brittle IMC formation and improving joint toughness. The rationale behind selecting this configuration is further discussed in the Results Section, supported by both mechanical testing and numerical modeling. For the evaluation of the thermal durability of S-shaped joints, they were heat-treated at 100–400 °C for 30–90 min. In order to investigate the fracture behavior of the joints, tensile tests were applied to the fabricated specimens, and energy-dispersive spectroscopy (EDS) and scanning electron microscopy (SEM) were used to analyze the fracture surfaces and the IMC interface of the welded samples. A finite element (FE) simulation was used to study the fracture behavior of the joint by using a cohesive model for the IMC layer at the interface. The mechanism of failure of the heat-treated joints during tensile testing and the contribution of the S-shaped interface to this mechanism are elaborated in this study.

2. Experimental Procedure

2.1. Materials and FSW Process

Although the S-shaped interface configuration was initially introduced in our earlier work [27], the present study provides a new perspective by combining fracture mechanics quantification, finite element modeling with numerical validation, and a detailed assessment of thermal durability. To the best of our knowledge, this is the first attempt to comprehensively evaluate the fracture behavior of curved aluminum/steel FSW interfaces under combined mechanical and thermal loading conditions.
As is clear from Figure 1a, to achieve the S-shaped interface, an asymmetric butt-joint configuration was designed in which AA1050 with 5 mm thickness was placed on the retreating side (RS), while the thinner St37, 2 mm, was positioned on the advancing side (AS). This thickness mismatch and side selection were chosen to enhance material flow differences and control the interfacial morphology. The FSW tool was designed to plunge deeper into the aluminum side while maintaining contact with the steel surface, promoting a smooth material transition and resulting in the observed curved (S-shaped) interface. The novelty of this arrangement lies in the deliberate asymmetry and positioning, which differs from traditional flat-thickness butt joints used in previous Al/St FSW studies. Tensile specimens of 5 mm width were prepared, as shown in Figure 1; 3 specimens were used for tensile testing of each post-weld heat treatment condition. The curved S-shaped interface is shown in Figure 1c.
The properties of the materials selected to be joined by FSW are presented in Table 1. A H13 tool-steel FSW tool selected to weld the dissimilar joints had an 18 mm shoulder diameter, 4.7 mm pin length, and 5 mm pin diameter. The tool pin had a 1.3 mm offset to the steel and a tool tilt angle ( θ ) of 2.5 º. Moreover, the tool rotation speed ( ω ) used was 950 rpm, counterclockwise (CCW), and the tool traverse speed ( V x ) was between 10 and 20 mm/s. The details of the FSW process and parameters are provided in Section 2.1 of this investigation [27].

2.2. Post-Weld Heat Treatment

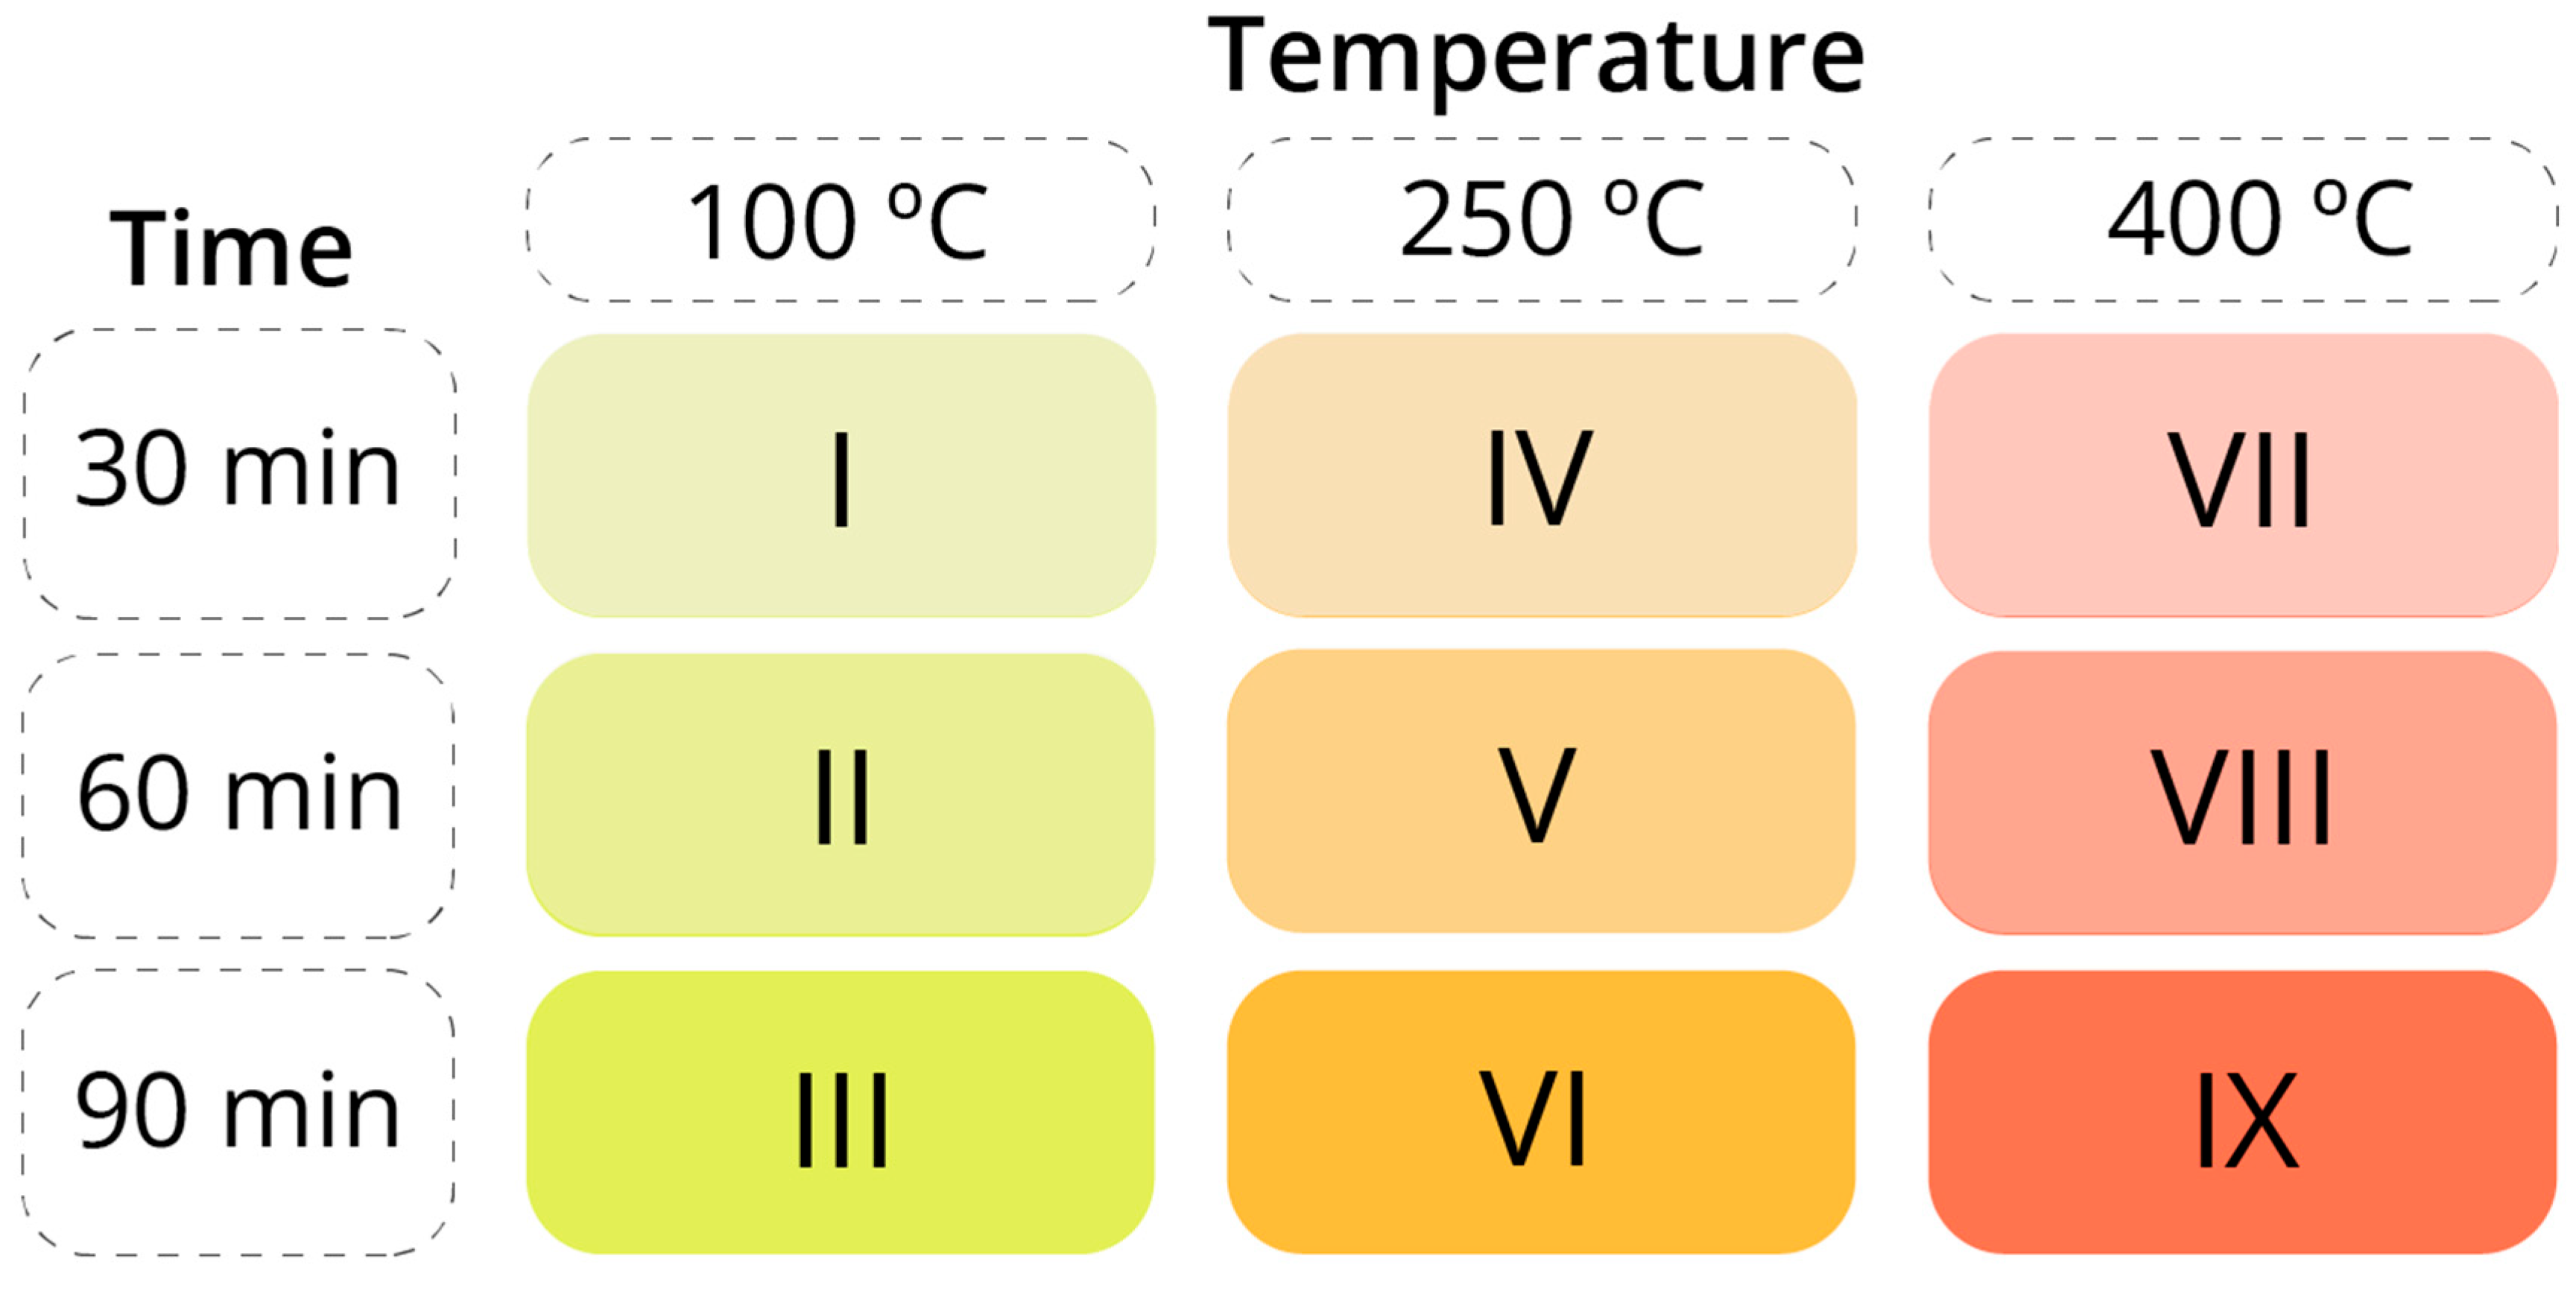
With the objective of assessing the influence of temperature on the degradation of Al/St joint properties through FSW, a sequence of thermal treatments was conducted on the manufactured joints, promoting the growth of an IMC layer at the joint’s interface. To monitor the kinetics of IMC layer growth, a total of 9 combinations of temperature and duration were chosen, spanning from 100 °C to 400 °C and from 30 min to 90 min. For each temperature/duration pair, three specimens were designated for tensile testing, while one additional sample was set aside for SEM/EDS analysis. The distribution of samples across each temperature/duration combination was carefully arranged to ensure uniformity and minimize potential biases inherent in the manufacturing process, which could otherwise introduce erroneous conclusions and correlations. The designation of each post-weld heat treatment pair is represented in Figure 2.
For each combination of treatment temperature and duration, the post-weld heat treatment protocol proceeded as follows: Initially, the tensile test specimens and the SEM/EDS sample were positioned with a precise placement of a thermocouple at the joint interface to ensure accurate temperature monitoring throughout the post-weld heat treatment process. Subsequently, the joints in air atmosphere were protected with aluminum foil to mitigate the impact of the oxidizing atmosphere within the oven. A steel plate was then layered atop the aluminum foil to ensure continuous contact between the thermocouple tip and the joint throughout the duration of the post-weld heat treatment. This preparatory procedure served to maintain ideal conditions during post-weld heat treatment. Upon reaching the target temperature, as indicated by the oven’s thermometer, the prepared specimens were introduced into the oven. Following the completion of the designated post-weld heat treatment period, the joints were allowed to cool naturally to room temperature. The joint temperature was regularly compared to the temperature displayed in the oven controller and the nominal temperature during post-weld heat treatments. Figure 3 shows the procedure for post-weld heat treatment of the joints.

2.3. SEM/EDS Analysis

The study of the microstructure of joints’ interfaces using SEM/EDS aims to observe the friction-stir welded zone, measure IMC layer thickness at the Al/St interface, and study the chemical composition of the joints through EDS line scans, obtaining atomic percentages across the interface, and to establish cause–effect relationships between IMC layer growth kinetics, joint degradation, and tensile strength.
The SEM/EDS examination was carried out using a high-resolution environmental scanning electron microscope (Schottky) with X-ray microanalysis and analysis of backscattered electron diffraction patterns: FEI Quanta 400FEG (FEI Company, Hillsboro, OR, USA) ESEM/EDAX Genesis X4M (Mahwah, NJ, USA). The samples were coated with Au/Pd thin films by sputtering using an SPI Module Sputter Coater (West Chester, USA). Furthermore, the fractography analysis follows the aforementioned procedure.
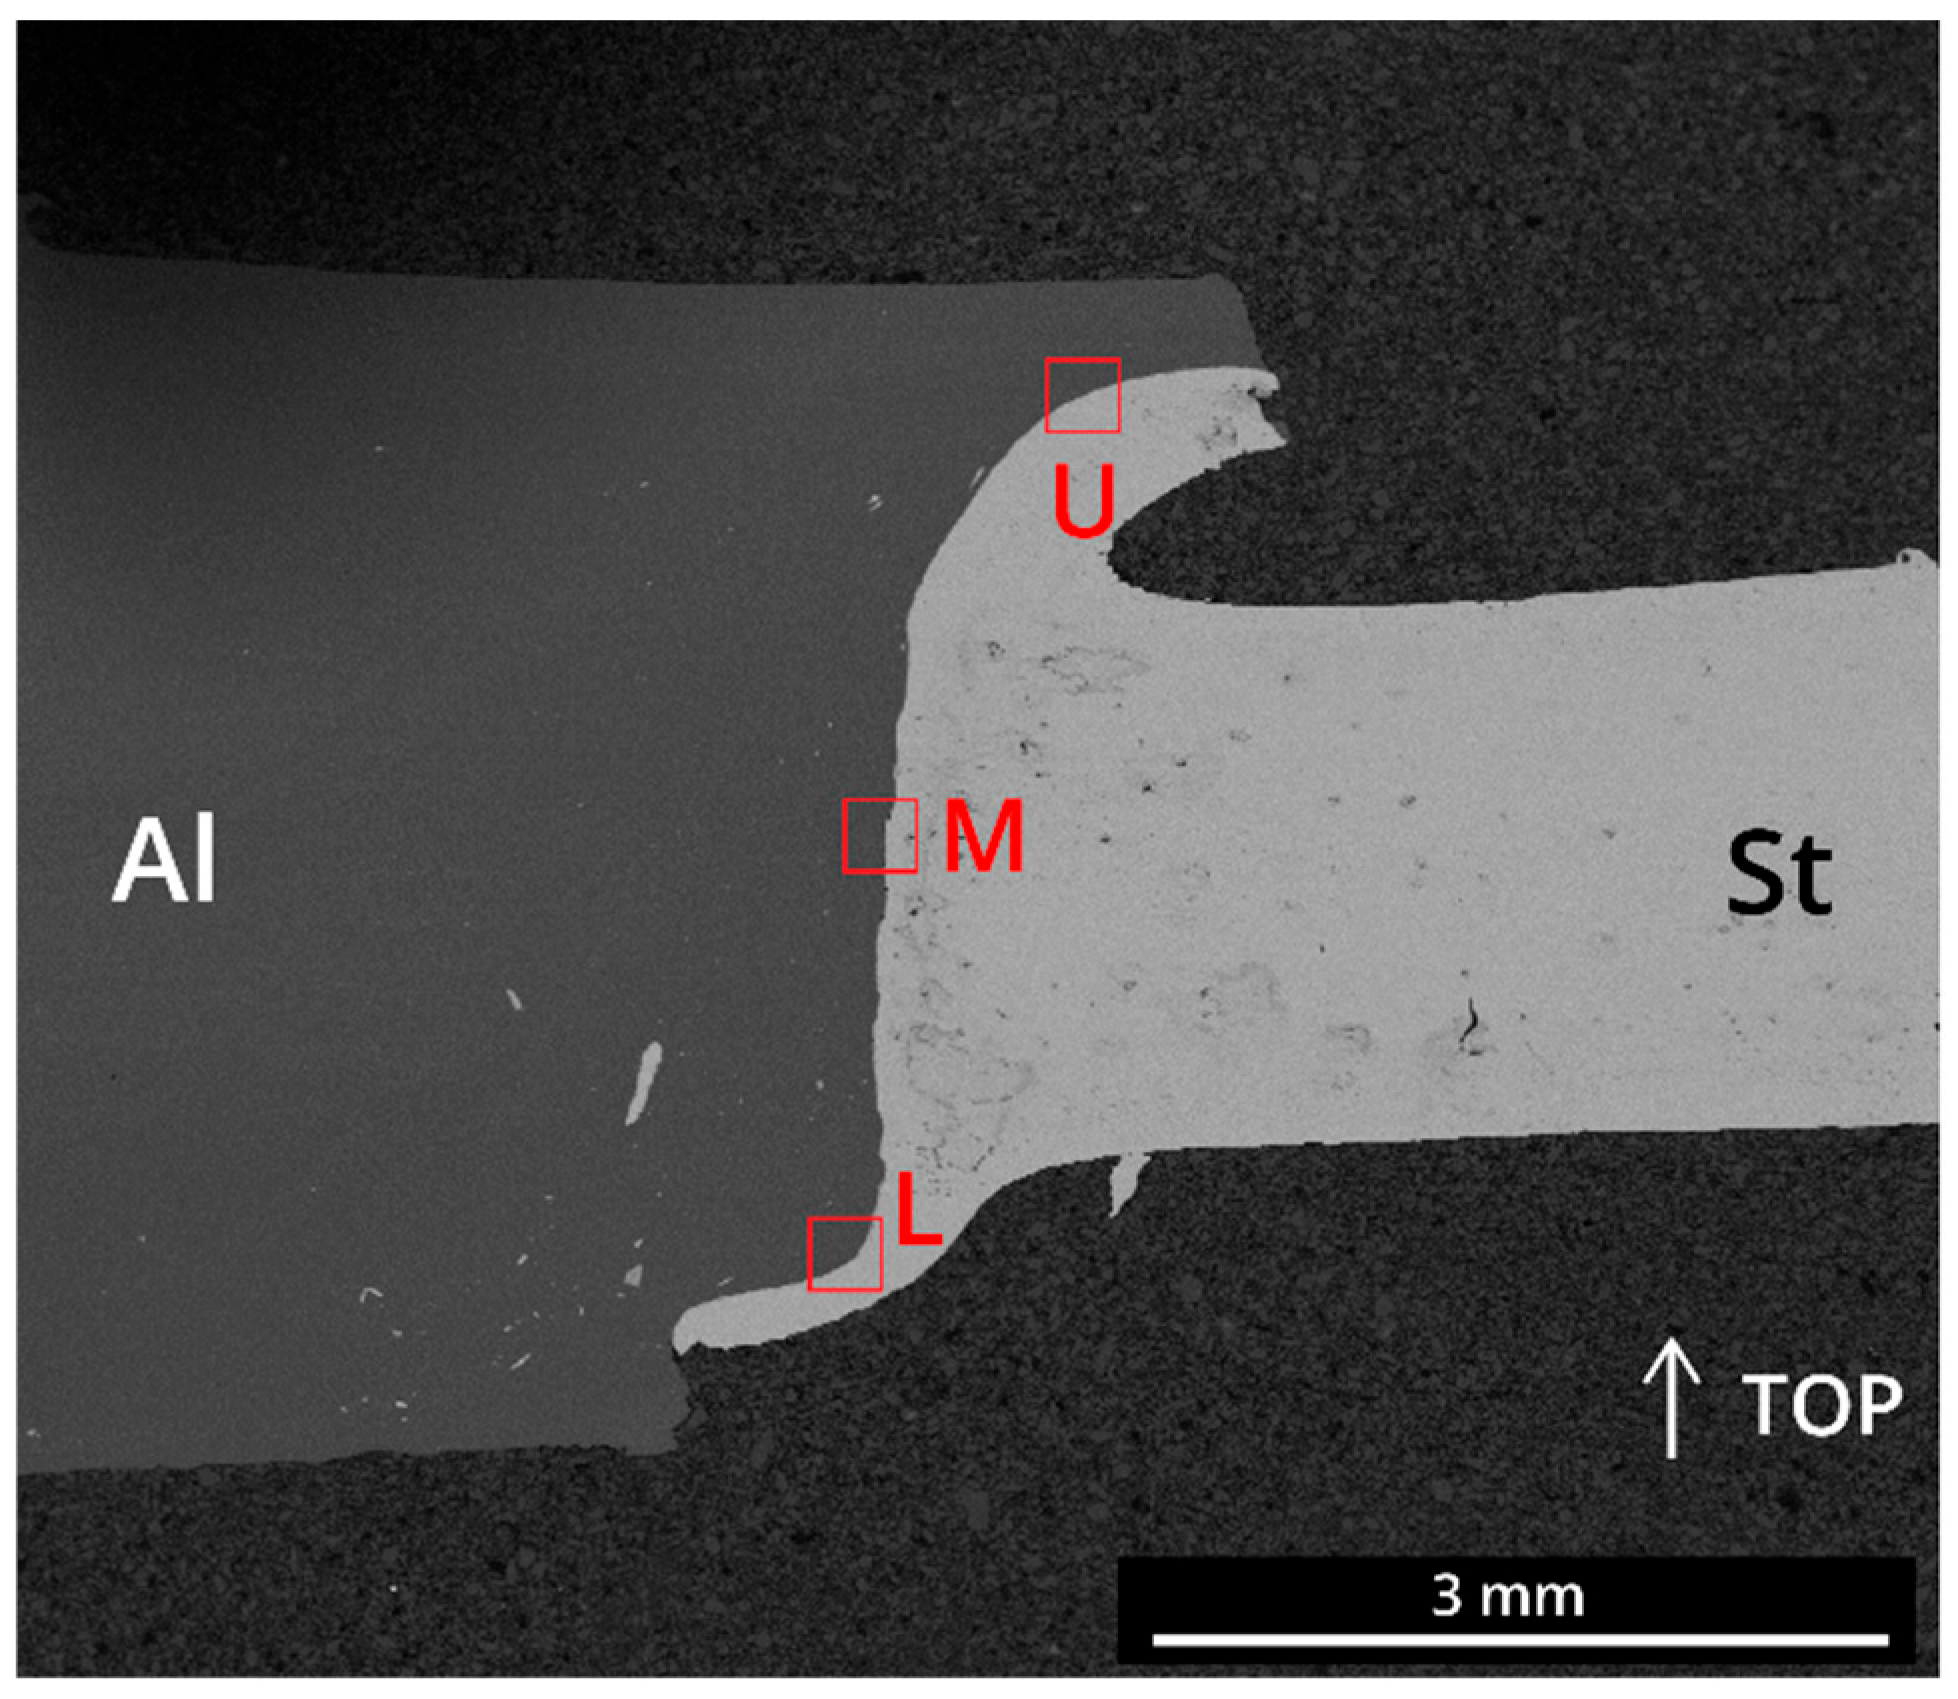
During this session, three distinct zones were examined and identified, as illustrated in Figure 4: the upper portion of the interface is labeled as U, the middle section as M, and the lower tip as L. These zones were subjected to detailed scrutiny and analysis to discern potential variations and characteristics within each region.
This study used ImageJ 1.54g software for post-processing the images and extracting measurements, collecting 15–20 thickness measurements for each zone and averaging them to determine the IMC layer thickness of U, M, and L for each sample. Line scans were performed at zone M for samples III to IX and all zones in the as-welded sample, collecting atomic percentages of Aluminum and Iron present across the joint interface. Data was plotted along the line scan length and overlaid to predict IMC layer phases, comparing the at.% in the joints with an Al-Fe phase diagram.

2.4. Mechanical Tests

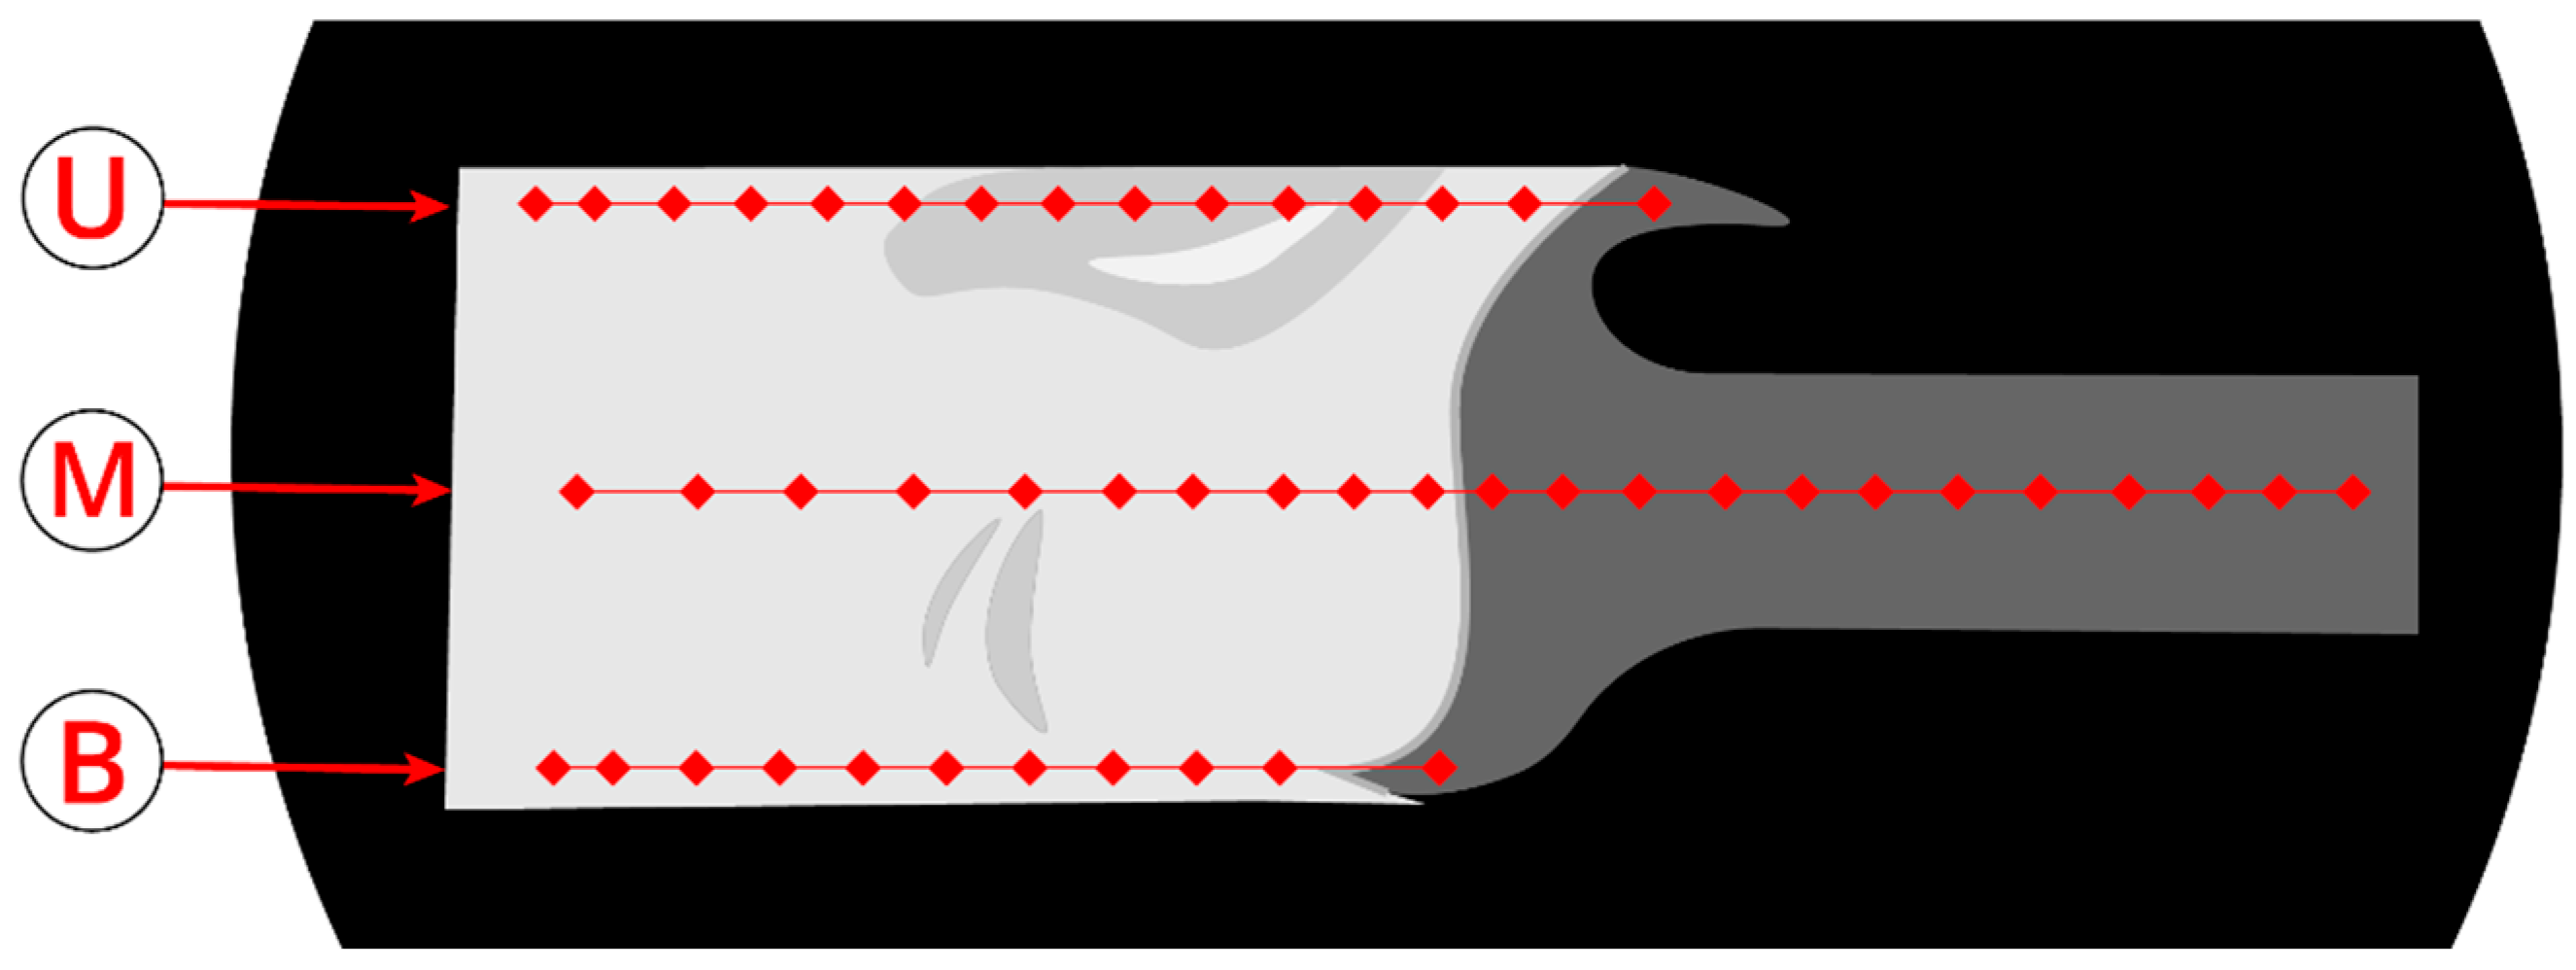
Quasi-static tensile tests were conducted to characterize the tensile strength of manufactured joints. The tests were performed using a universal test machine INSTRON® (Norwood, MA, USA), model 3367, at a constant displacement rate of 1 mm/min at room temperature, in accordance with ASTM E8/E8M [29] standard for tensile testing of metallic materials. This displacement rate was selected to ensure quasi-static loading conditions and accurate observation of fracture behavior. The tests were recorded using a high-resolution video camera in macro mode at the joint interface to observe failure behavior. The load–extension curves and videos were time-matched until the failure of the two failed halves. The Vickers hardness (HV) was measured on three heat-treated samples at different temperatures using a load of 200 gr (1.96 N), in accordance with the ASTM E384 standard [30]. Each sample had three measurement lines: upper and bottom zones (U and B) starting at the steel side of the joint, and a middle zone (M) across all joints. Due to the small area of these zones, multiple measurements were not possible. The distance between indentations was measured in conjunction with the Vickers hardness value. The results were plotted in an HV microhardness vs. length graph, with the origin representing the first indentation of the steel substrate. Figure 5 illustrates the lines intended for microhardness measurements.

2.5. Simulation of the Fracture

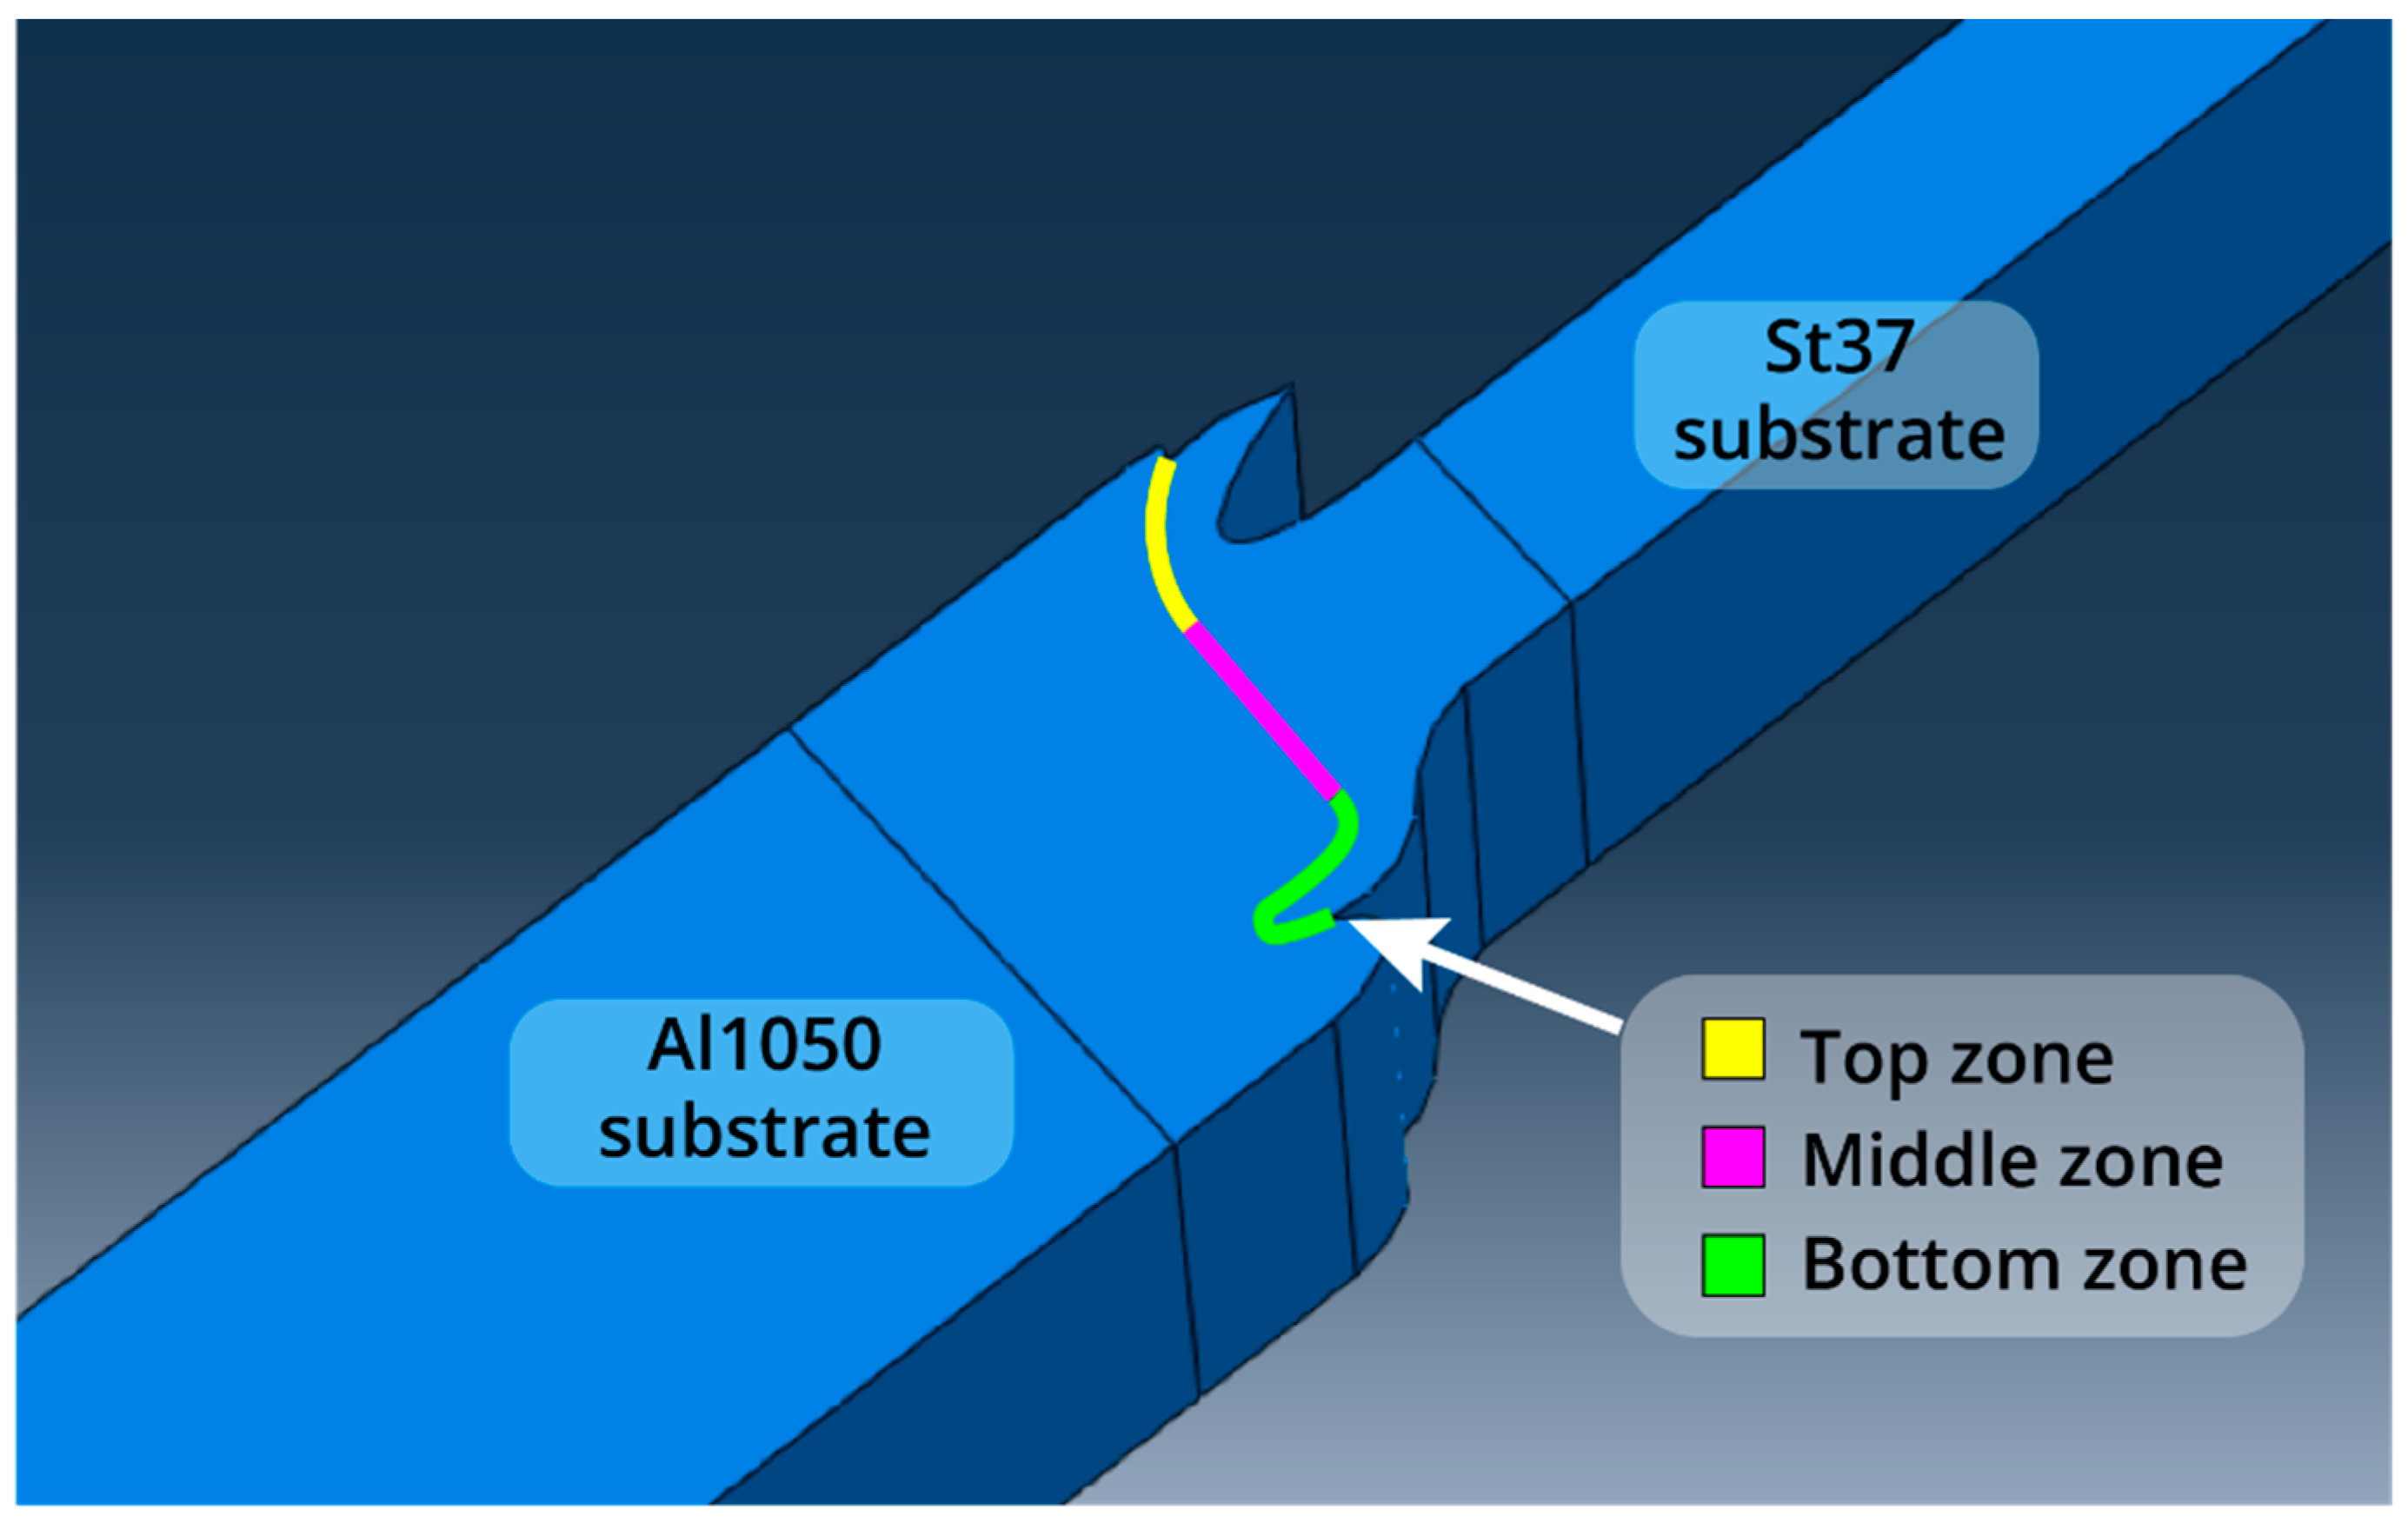
A numerical model was devised with the primary aim of simulating the fracture behavior of joints within the context of tensile testing. Accurate determination of the fracture parameters of the IMC layer, although performed in this study, was not the primary goal. The fracture initiation site and its propagation path as well as the plastic strain distribution in both layers were of utmost importance in analyzing fracture behavior. The simulation result was used as an auxiliary tool to explain what occurred in practice. The development of this numerical model was particularly focused on the S-shaped interface geometry and the consequential influence of the diminishing thickness of the IMC layer along the interface of the two constituent base metals. In pursuit of this objective, certain simplifications were instituted, notably, the segmentation of the interface into three distinct zones (top, middle, and bottom), each endowed with individualized contact properties. Moreover, the properties ascribed to the IMC layer were approximated based on the pertinent literature, while being carefully compared against the specific case under examination.
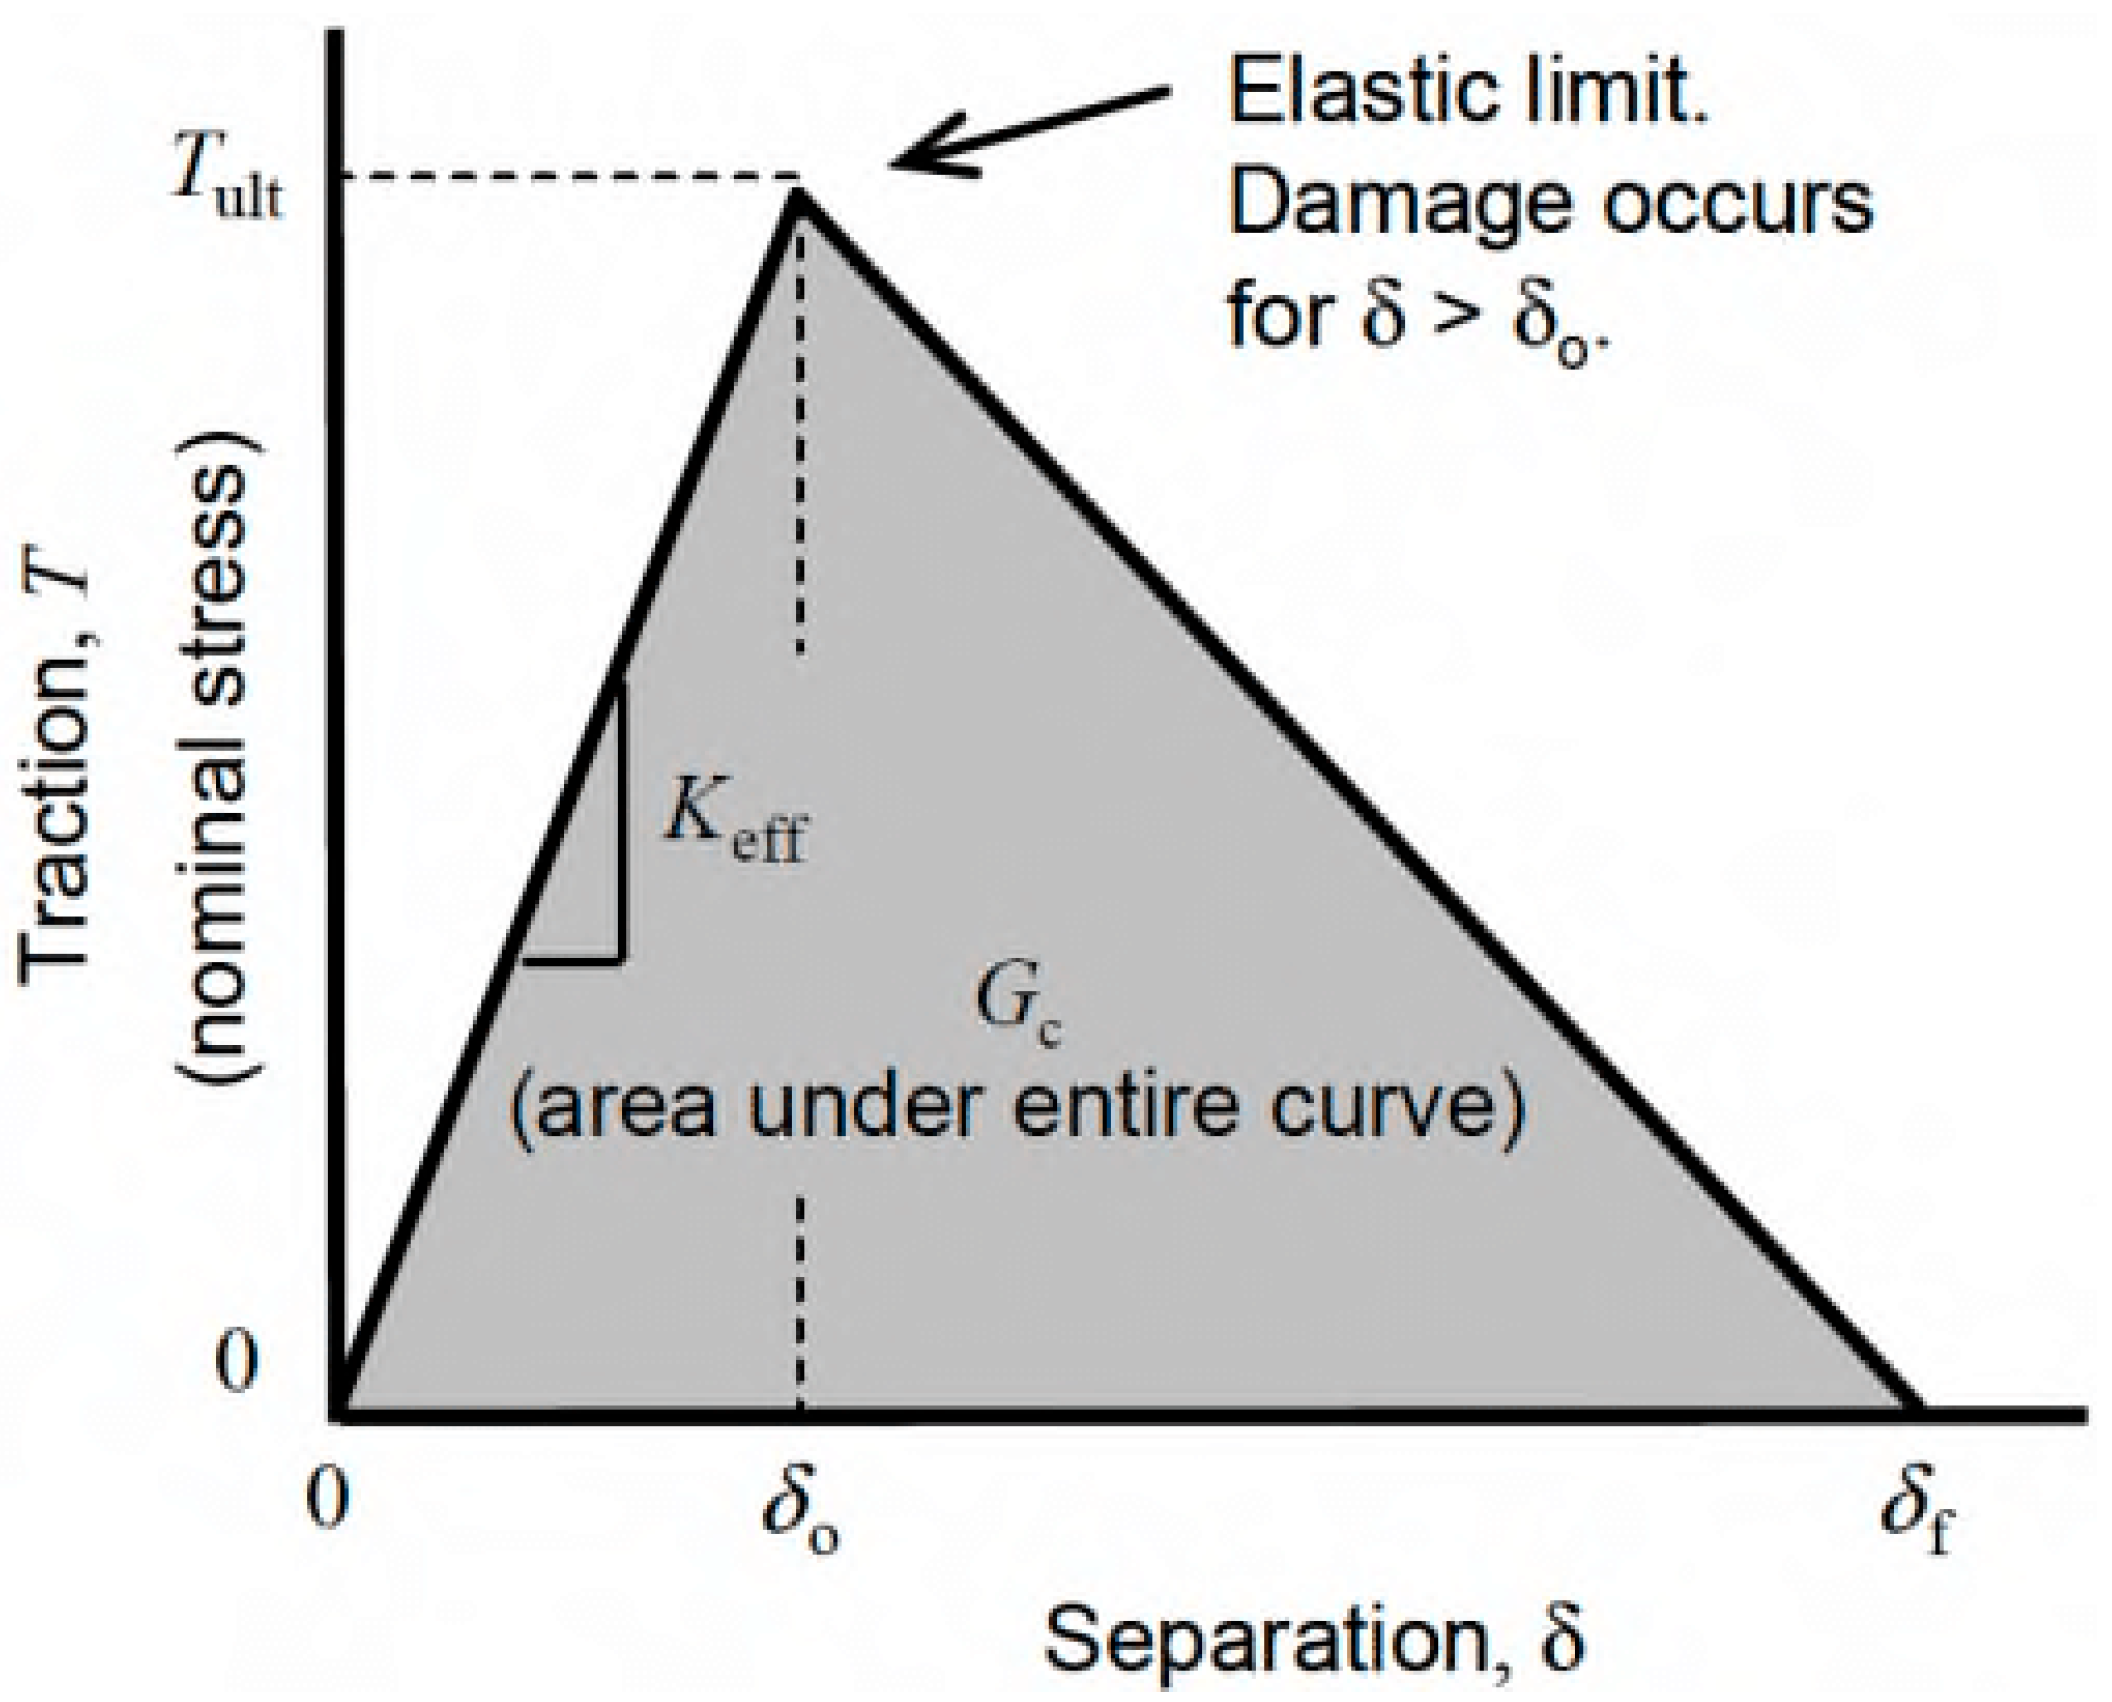
Furthermore, the interface-bonding properties characteristic of FSW joints between Al1050 and St37, facilitated by the IMC layer at the joint interface, were modeled as cohesive contact between the substrates. This modeling approach adheres to a bilinear traction–separation law, owing to the observed similarities in the behavior of the IMC layer under both normal and shear loading conditions.
Initially, the tensile test simulation was conducted using Abaqus CAE 2020/Explicit software, employing a 3D dynamic explicit analysis framework with a step time period of 1 × 10⁻⁵ and a time scaling factor of 1. This modeling approach accounted for nonlinear effects arising from large deformations and displacements. The assembly 3D model of the specimens was based upon the average S-shaped interface geometry observed through the SEM examinations, with particular emphasis on the penetration of the S-shaped steel tip into the aluminum substrate, as illustrated in Figure 6.
The density and elastic properties for the Al1050 and St37 substrates were assigned based on the specifications outlined in Table 2; moreover, the Al1050 substrate was characterized by isotropic plastic behavior to replicate the observed yielding of the base metal in the experimental investigations.
The cohesive contact properties of the IMC layer at the three aforementioned zones followed a bilinear traction–separation law, represented in Figure 7, with an IMC layer cohesive strength of Tult of 600 MPa, according to R. Mitra [31], and an estimated fracture energy Gc of 0.123 N/mm based on the tested specimens. The initial stiffness Keff for the three zones was obtained from Equation (1).
k e f f = E I M C e
The value of the IMC stiffness is EIMC 261 GPa [31], and the IMC layer thickness e varies for the three zones according to sample IX, with 5.3 μm at the top, 3.5 μm at the middle, and 2.5 μm at the bottom zone of the interface, resulting in 49.2 E6 N/mm3, 74.6 E6 N/mm3, and 104.4 E6 N/mm3, respectively. The parameters of the cohesive zone model were selected in such a way as to reach a fracture load similar to the experiments. A general contact interaction was given between the Al1050 and St37 surfaces, assigning the cohesive properties for the three respective zones.
Two boundary conditions were created at the initial step and propagated to the first step, one being fixed at the aluminum side base, and the other a 4 mm total displacement throughout the step.
For each substrate, three mesh partitions were created, a negligible approximated element size of 2 mm at the fixed boundary, an element size of 1 mm across the substrates, both C3D8R elements, and a free C3D4 tetrahedron with approximate 0.1 mm elements close to the interface. Quantitative examination of the numerical findings was avoided since real experimental parameters, such as the stiffness and cohesive strength of the IMCs, were not available, and values from the literature were used in their place. The main focus of the Discussion Section is the behavior of the joint in comparison to its experimental fracture behavior. For further study, the previous work on fracture simulation [15] provides more detail. The fracture load was chosen as a criterion to validate the model. For the current simulation, the fracture load of sample I in the experiment was 1700 N, and in the simulation, 1800 N was obtained. This indicates that the model worked fine and, therefore, the fracture analysis of the model is reliable.

3. Results and Discussion

3.1. Interface Microstructure and IMC Layer Thickness

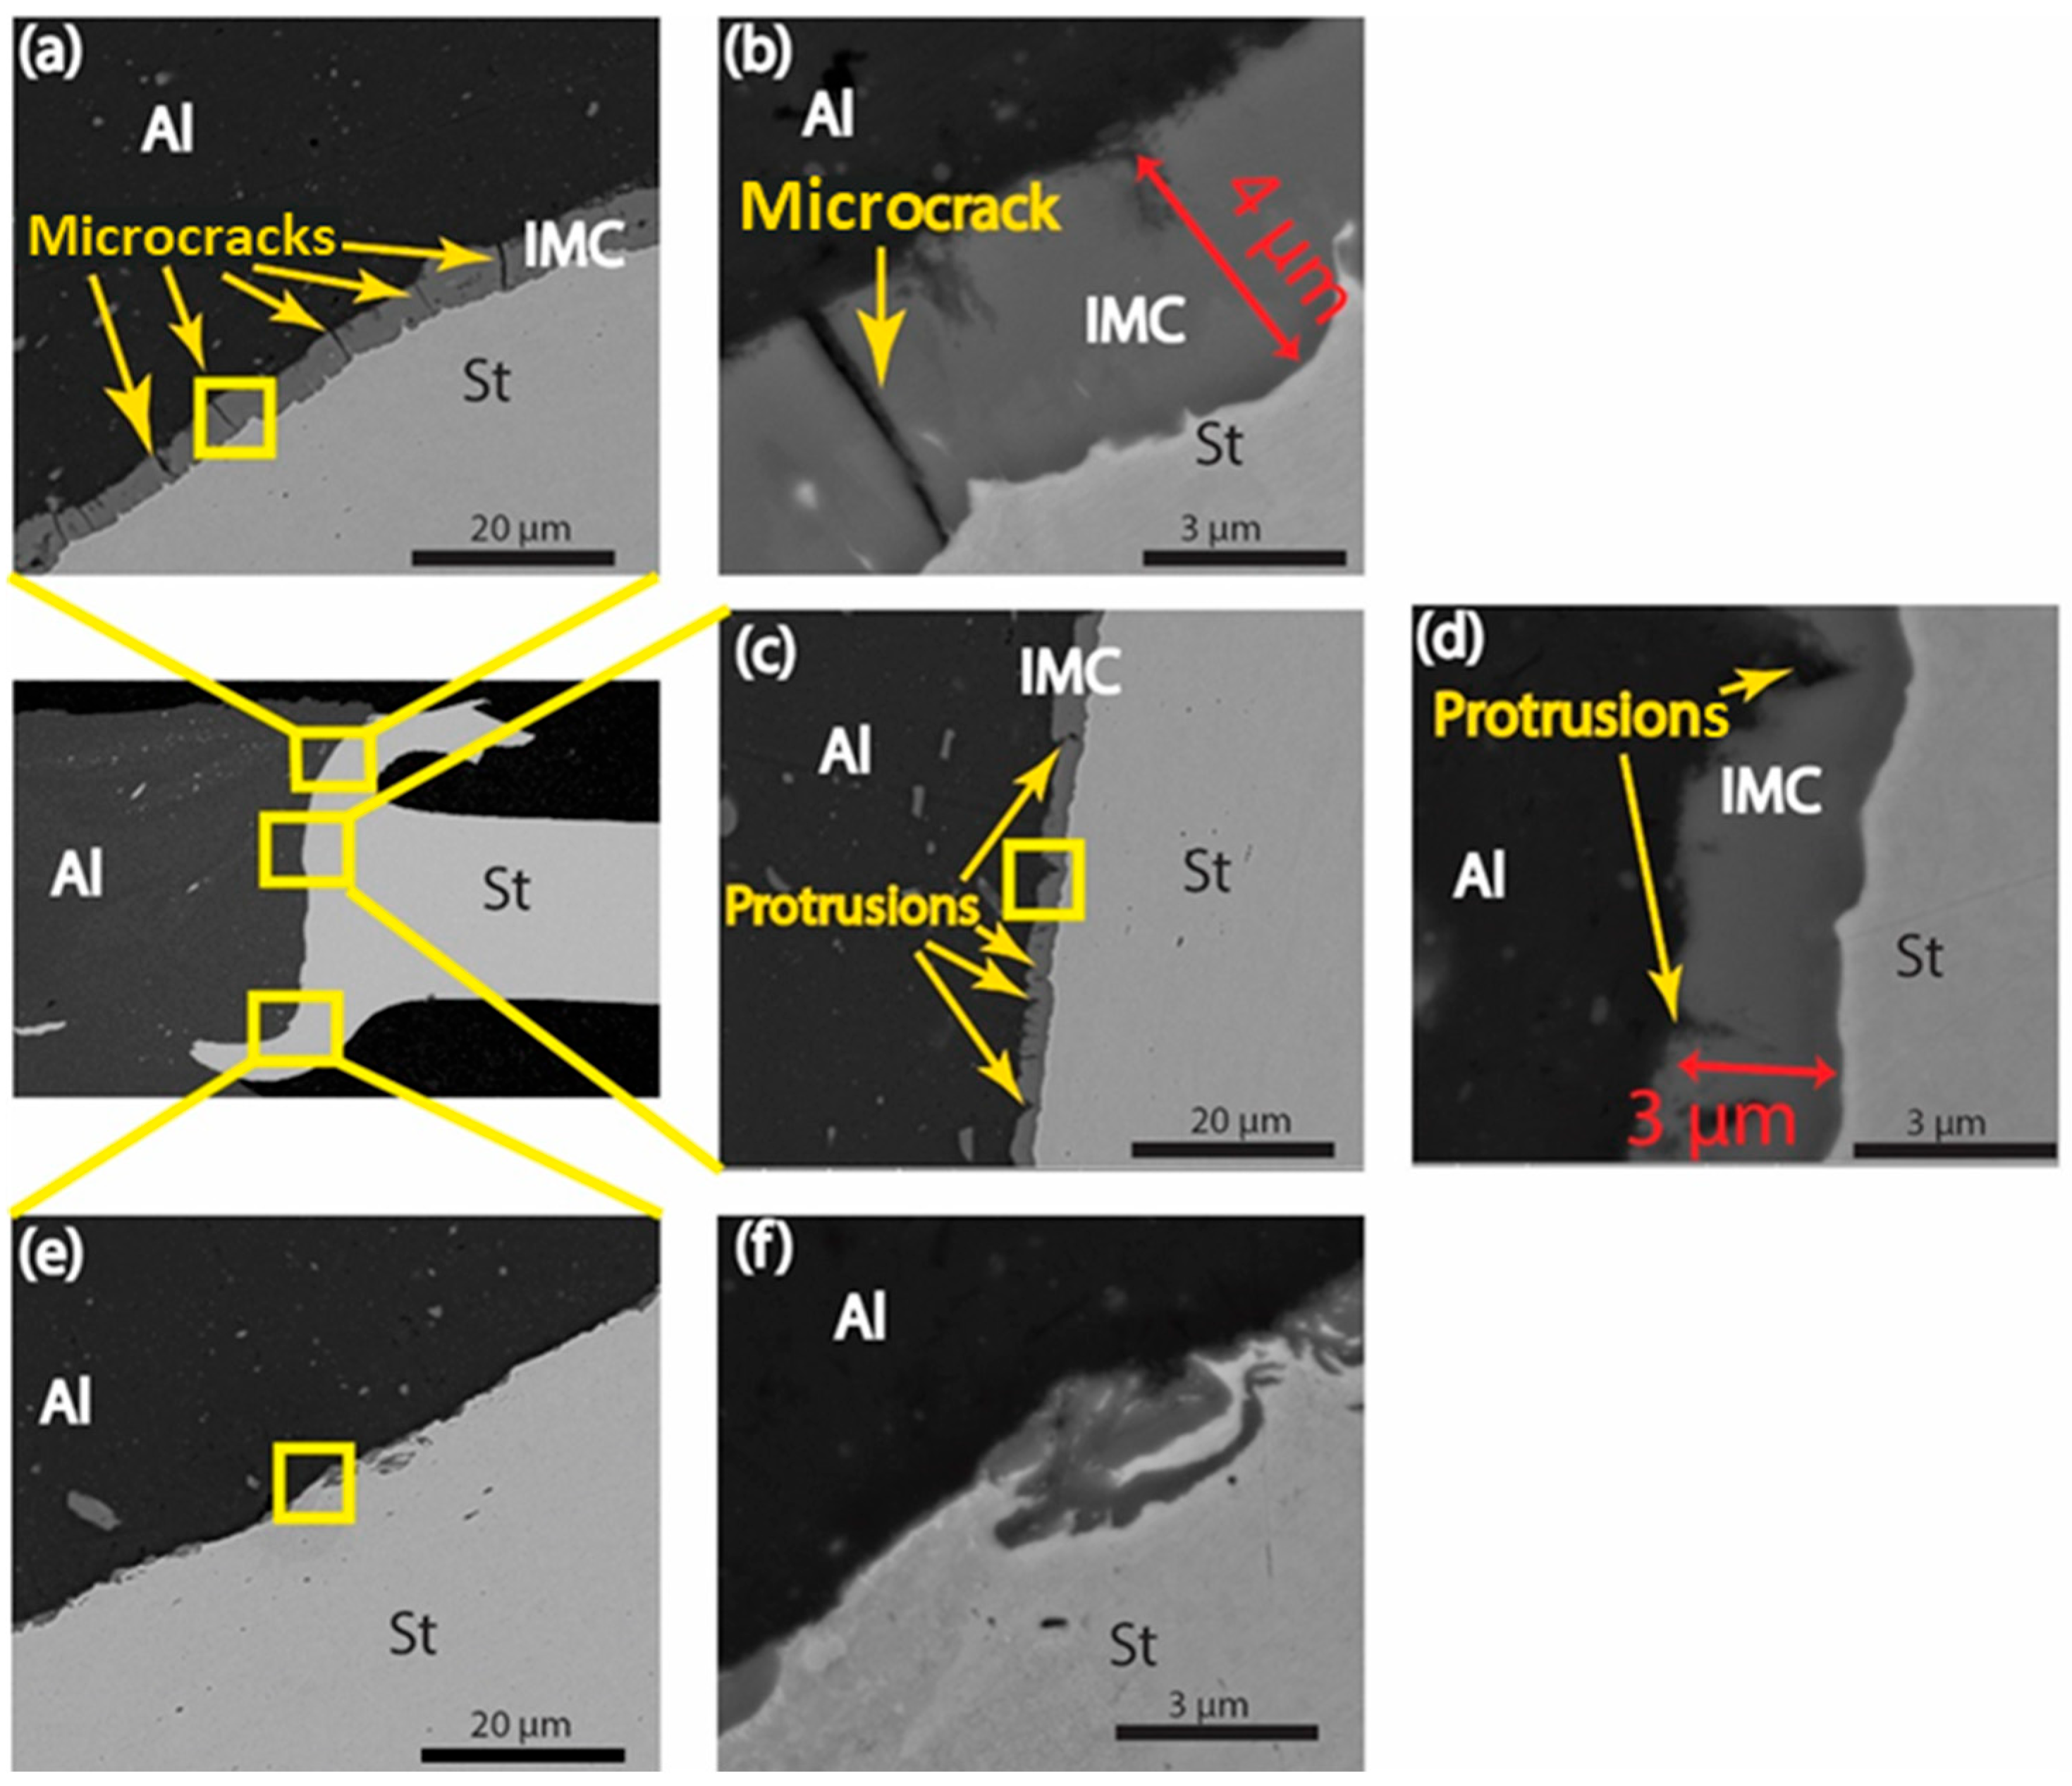
As a benchmark, the SEM images of the as-welded joint are provided in Figure 8. The upper part of the interface is shown in Figure 8a,b, the middle part is shown in Figure 8b,c, and the lower part is shown in Figure 8e,f. The distinguishing characteristics of these parts pertain to the features in the IMC layer and the IMC thickness. In the upper part, some cracks are observed in the IMC layer, and the thickness of the IMC layer is larger than 4 µm. The main characteristic of these cracks is that they extend from one side to the other side of the IMC layer. In the middle part, the cracks are absent but protrusions of Al into the IMC layer are apparent. In contrast to the upper part, these protrusions are not extended across the thickness of the IMC layer. In the lower part, the thickness of the IMCs is much lower than 0.1 µm and is not detectable at this resolution of SEM. In some regions, thicker islands of IMCs are detected at the interface.
Regarding the SEM images of the heat-treated joints, only one sample from each temperature has been provided to avoid unnecessary elongation of this article.
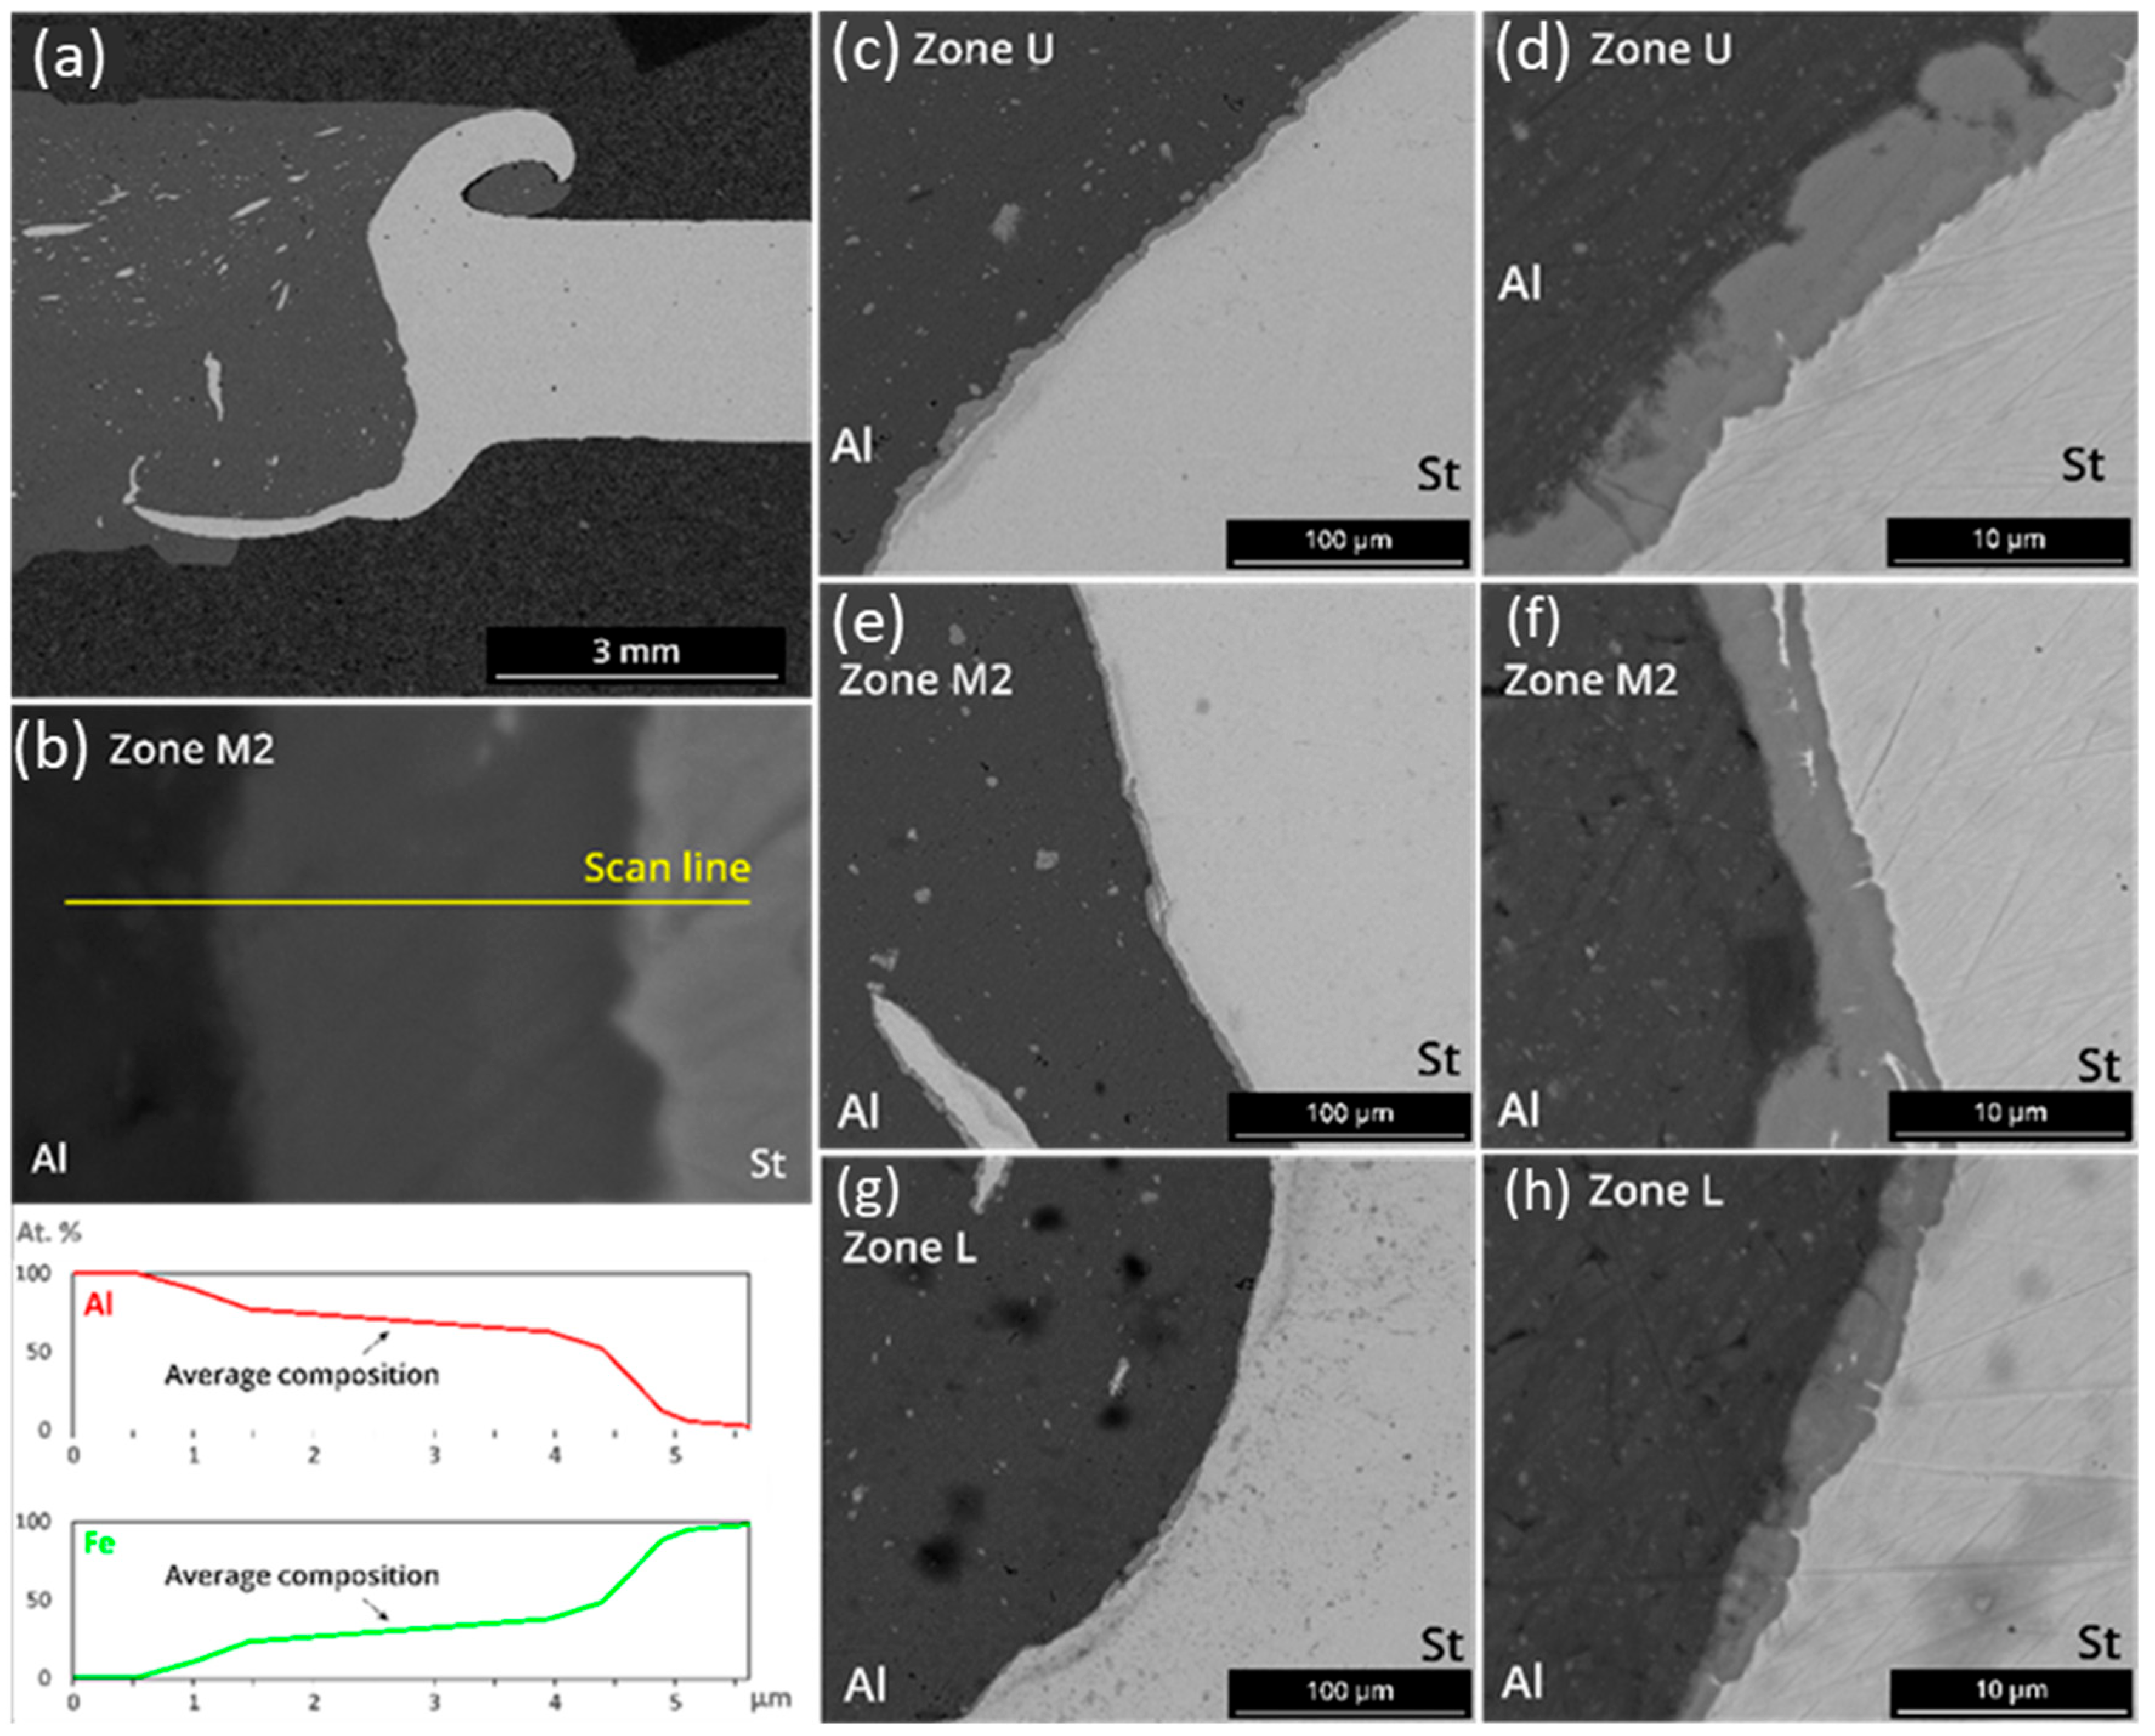
Compared to the previous sample shown in Figure 8, the configuration in Figure 9a, sample III (100 °C/90 min), exhibits a slightly different interfacial morphology. The lower tip (lower zone) of the steel substrate appears narrower, and the extent of its penetration into the aluminum side seems reduced. This may be attributed to local variations in heat input, material flow, or slight differences in tool–substrate interaction. The middle zone of the interface appears in the joint at an angle, emphasizing the S-shaped morphology of the joint. The top steel tip encloses a substantial fragment of aluminum, a result of the FSW process, promoting the penetration of the St37 into the aluminum base metal due to the forging forces applied by the shoulder of the tool. Moreover, a high occurrence of steel fragment inclusions into the aluminum substrate, as large as 0.5 mm in length, is visible. Figure 9b shows the line-scan EDS analysis across the interface in the middle part. A flat region in this Figure is indicative of a full transition to the IMC layer, the composition of which is close to Fe2Al5. At the upper zone U, an IMC layer with some degree of thickness variance and presenting some discontinuities is observed, as shown in Figure 9c,d. Cracks are observed here, like in the as-welded one shown in Figure 9b. The middle zone M2 presents a homogeneous IMC layer thickness, indicating that the protrusions have been eliminated by post-weld heat treatment. This phenomenon has also been reported in reference [15], where it was demonstrated that the curvature effect at the tip of IMC protrusions can locally enhance atomic diffusion, even at relatively low temperatures. The curvature introduces a gradient in chemical potential and surface energy, which in turn increases the driving force for diffusion at regions of high curvature (such as protrusion tips). Consequently, this enhanced local diffusion promotes the smoothing or elimination of protrusions within the IMC layer, leading to a more uniform interface morphology during subsequent thermal exposure.
Some steel fragments are present, surrounded by the IMC layer in the matrix of Al, as seen in Figure 9e,f. Figure 9g,h show the interface in the lower part. In contrast to the as-welded joint shown in Figure 8e,f, the IMC layer is detectable by SEM, showing a high degree of thickness variance and presenting some discontinuities and underdeveloped sections. In this sample, a reduction in thickness from the top to the bottom zones is visible, similar to what was observed for the as-welded sample.
Sample VI (250 °C/90 min) presents a less pronounced S-shape with low penetration of the steel tip into the aluminum substrate at the lower zone of the interface and short upper zone tips, as well as a middle zone perpendicular to the joint, as shown in Figure 10a. The line-scan EDS analysis across the interface in Figure 10b shows a broader IMC layer with a composition close to Fe2Al5. Observing the upper zone U, Figure 10b,c, a homogeneous IMC layer with some microcracks along the section is visible. In this zone, there are no steel fragment inclusions in the IMC layer, although some small IMC fragments are still visible in the Al substrate.
The middle zone M2 presents an IMC layer with no discontinuities but with regular thickness along the interface. In the aluminum substrate, some IMC particles are seen detached from the IMC layer, as seen in Figure 10e,f. At the lower zone L, the IMC layer appears more regular than the previous samples at the same zone; however, discontinuities exist in some sections of this zone, as seen in the top left side of Figure 10g,h.
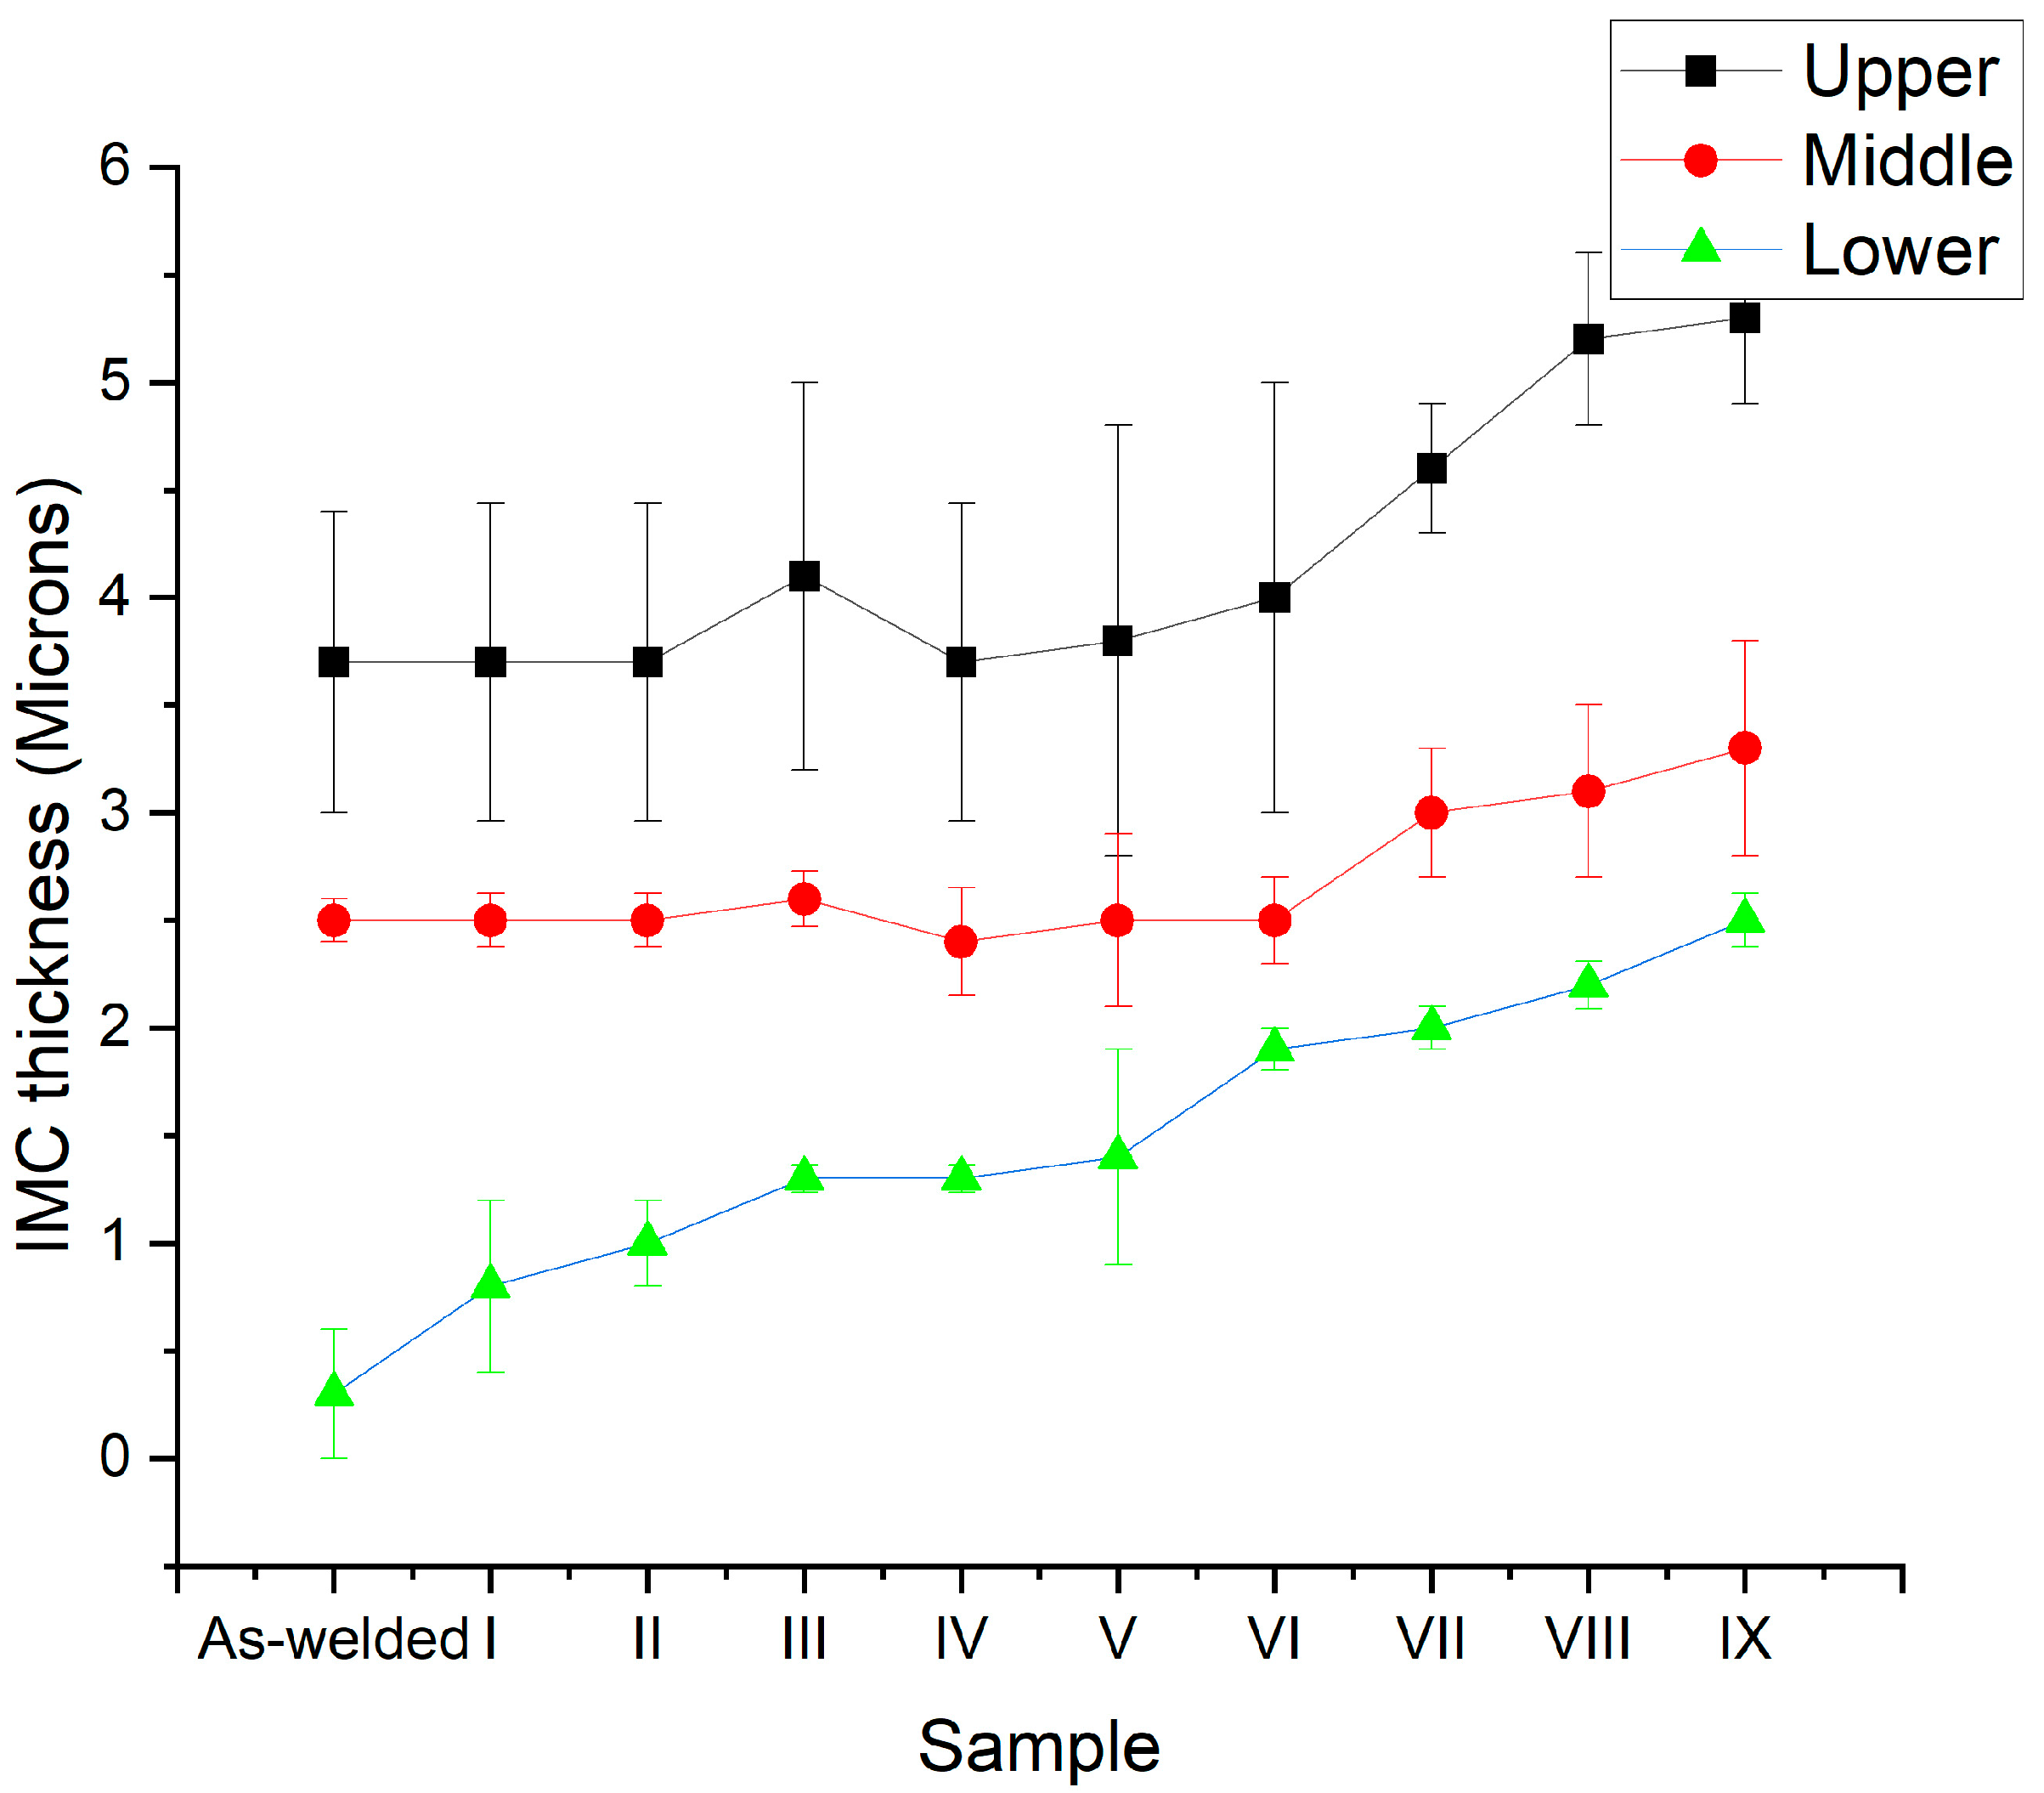
Figure 11 shows the SEM images of sample VIII. The microcracks in the upper part are still visible (Figure 11c). The IMC layer is more uniform in the middle part (Figure 11e,f). A growth in the IMCs in the lower part is noticeable (Figure 11g,h). The IMC layer exhibits an average Al at.% of 70%, denoting the presence of the Fe2Al5 phase. The IMC layer thicknesses measured in the three zones were plotted as a function of the post-weld heat treatment variables. Figure 12 shows these plotted measurements. In the upper zone and the middle zone, no obvious growth in the IMC layer was seen with post-weld heat treatment at 100 °C and 250 °C. On the contrary, in the lower zone, continuous growth is observed with post-weld heat treatment at any temperature. A slight increase in the IMC thickness is observed with post-weld heat treatment at 400 °C in the upper and middle zones.
Although the same nominal FSW parameters were applied for all joints shown in Figure 8, Figure 9, Figure 10 and Figure 11, some variations in the S-shaped interface geometry were observed. These variations can be attributed to localized fluctuations in heat input, tool–substrate contact conditions, and material flow, which are known to influence interface morphology even under constant external settings. Minor changes in clamping, surface oxidation, or tool tilt during processing can also affect the final interfacial shape. Nonetheless, the general formation of a curved, interlocked interface was reproducible across all samples.
The temperature has an influence on the growth of IMCs, increasing the diffusion rate of Al and Fe atoms and, consequently, forming thicker layers of IMCs [32]. The shoulder of the FSW tool provides, among other functions, the necessary friction and consequent heat source for the substrates to reach high temperatures, achieving a plastic regime and forming a welded joint. These temperatures are much higher at the top part of the joint compared to the bottom part, correlating well with the distance from the heating source and resulting in a gradient of temperatures along the FSW process. This phenomenon explains the gradient of the thickness of the IMCs from the top region to the lower region, seen in the as-welded joints present in this work. Fick’s diffusion rules govern the diffusion rates, which are highly temperature-dependent. For higher temperatures, the diffusion coefficient rises correspondingly, increasing atomic mobility and allowing for the rapid diffusion of aluminum and iron atoms into each other’s crystalline structures, thus increasing the total diffusion process and facilitating the kinetics of the reaction between Al and Fe atoms, leading to a higher growth of IMCs at the interface of the base metals [21].
Since the peak temperatures reached during the welding process are higher at the top side of the joint, the IMC layer thickness is also higher in these zones, following the same correlation for the decreasing peak temperatures reached along the interface.
The various IMC layer thicknesses (x) in Al-Fe systems are expressed by the following [33]:
x 2 = 2 k t
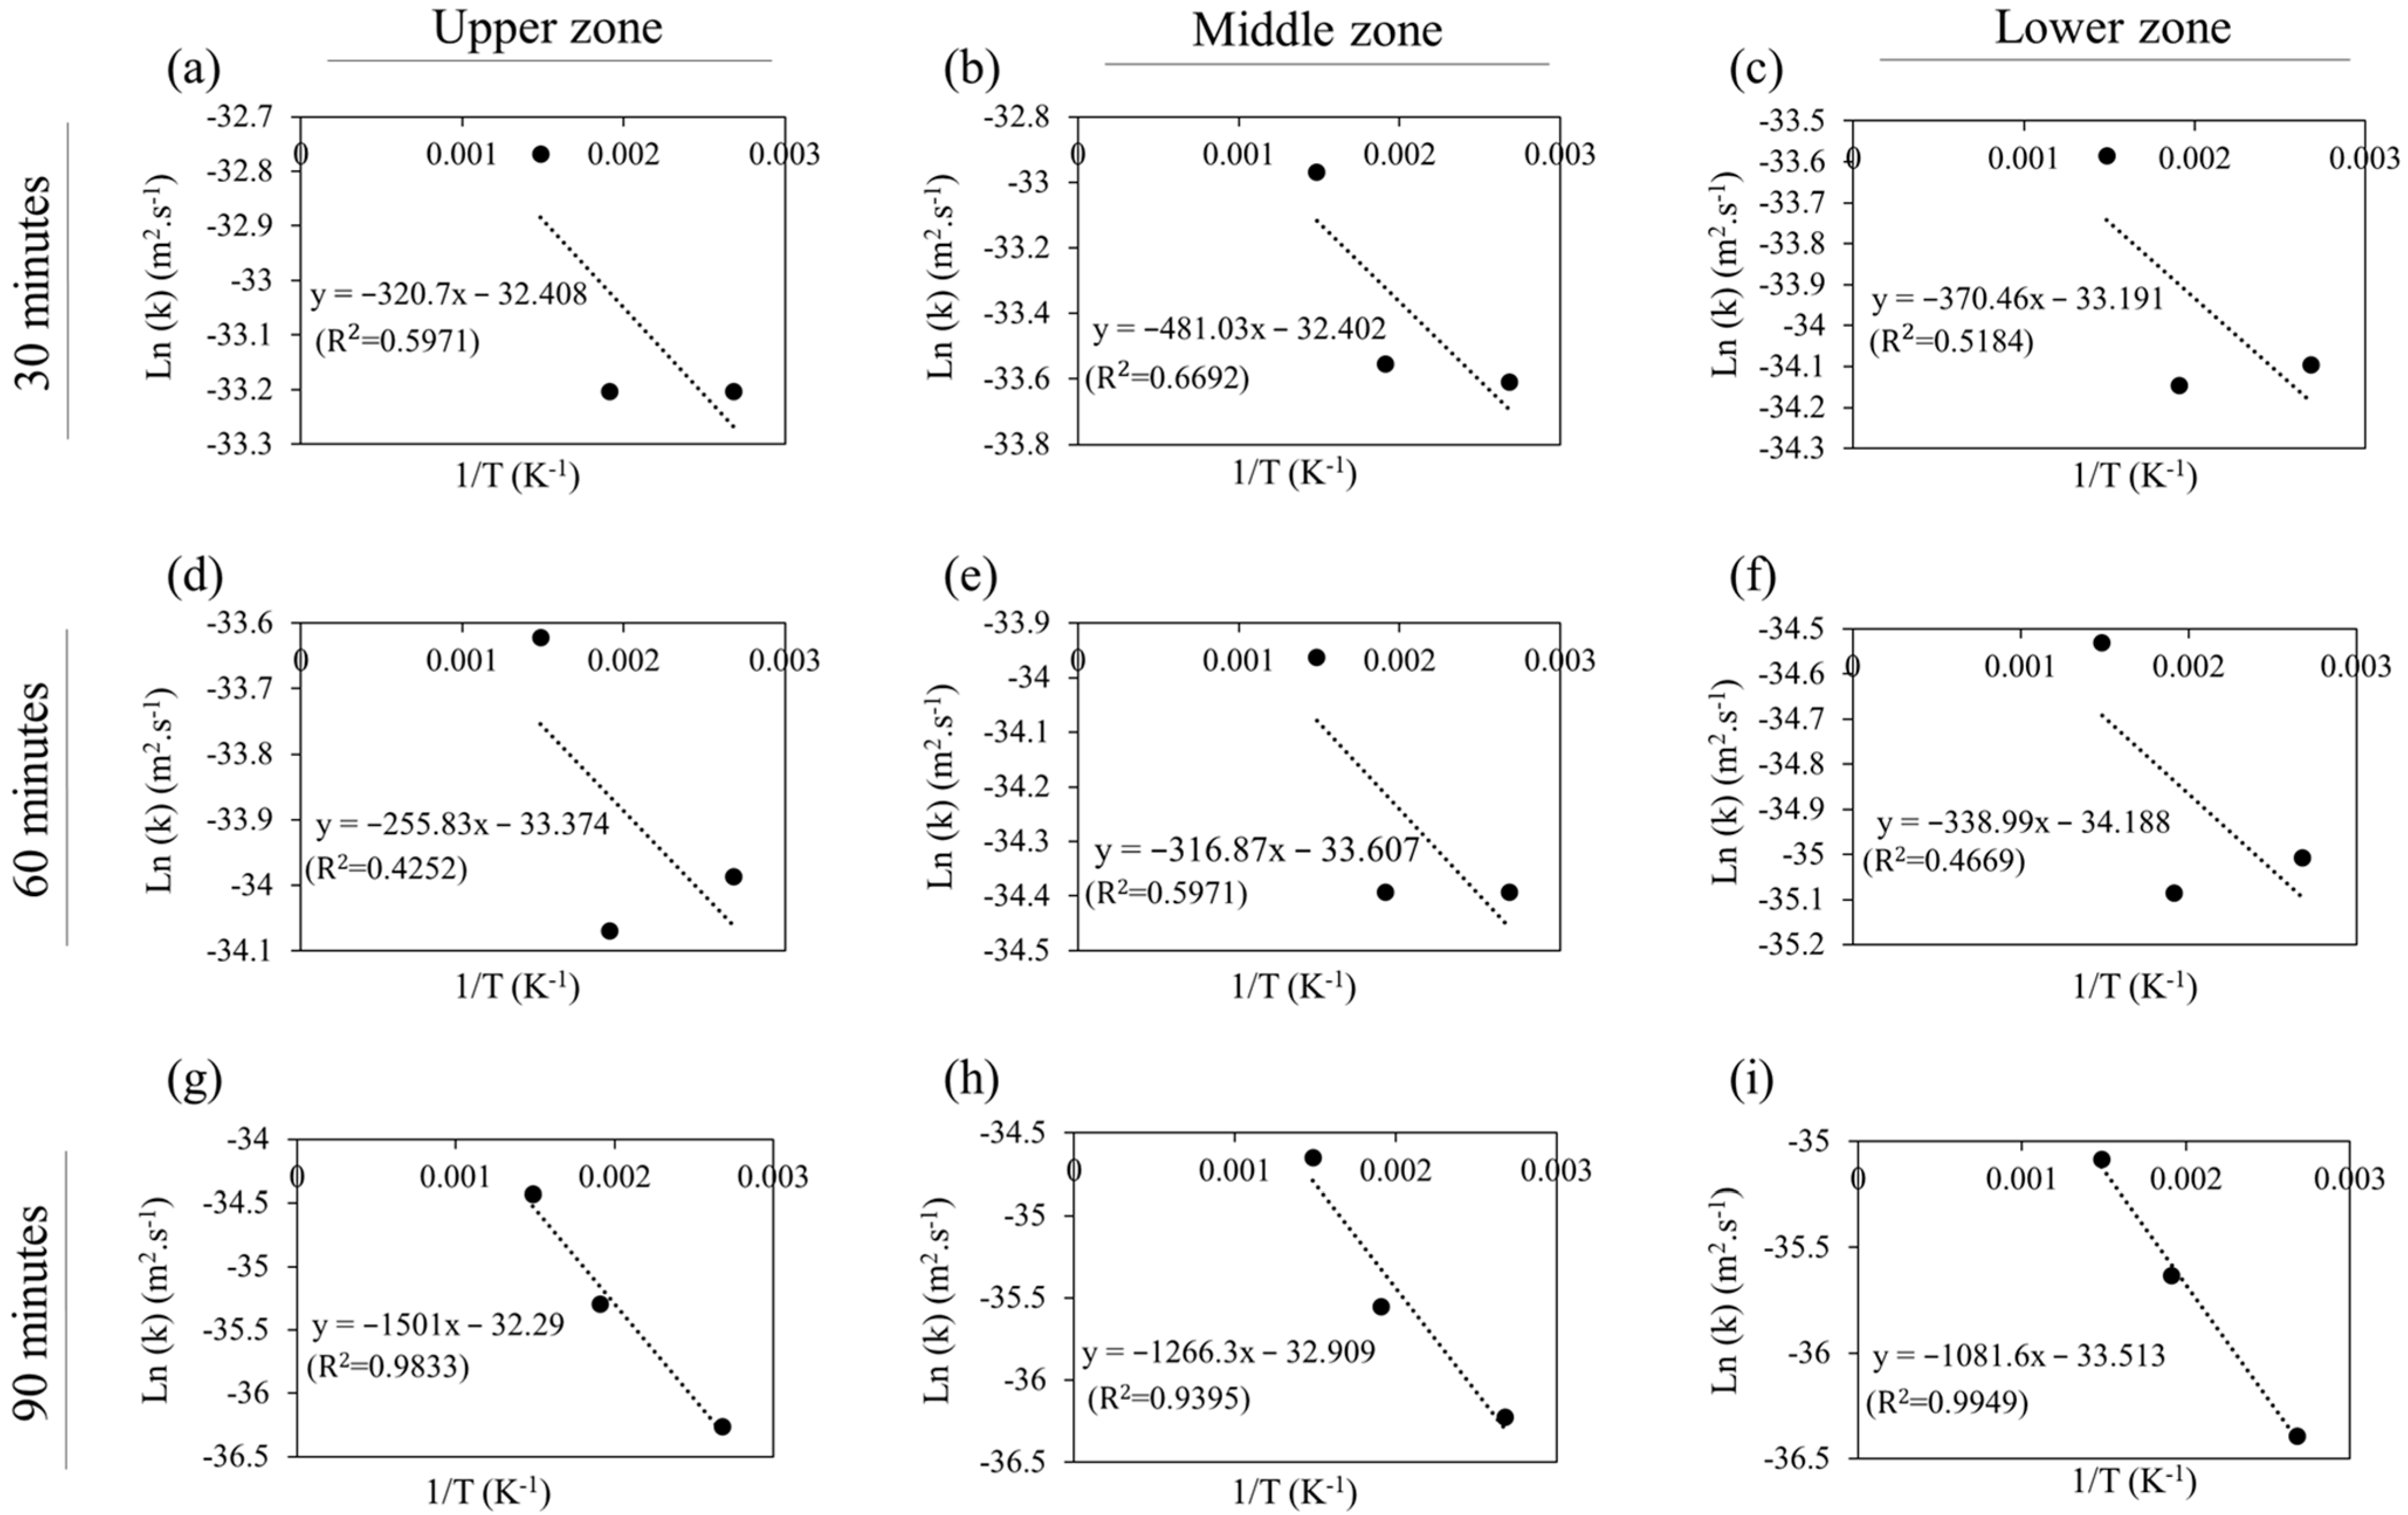
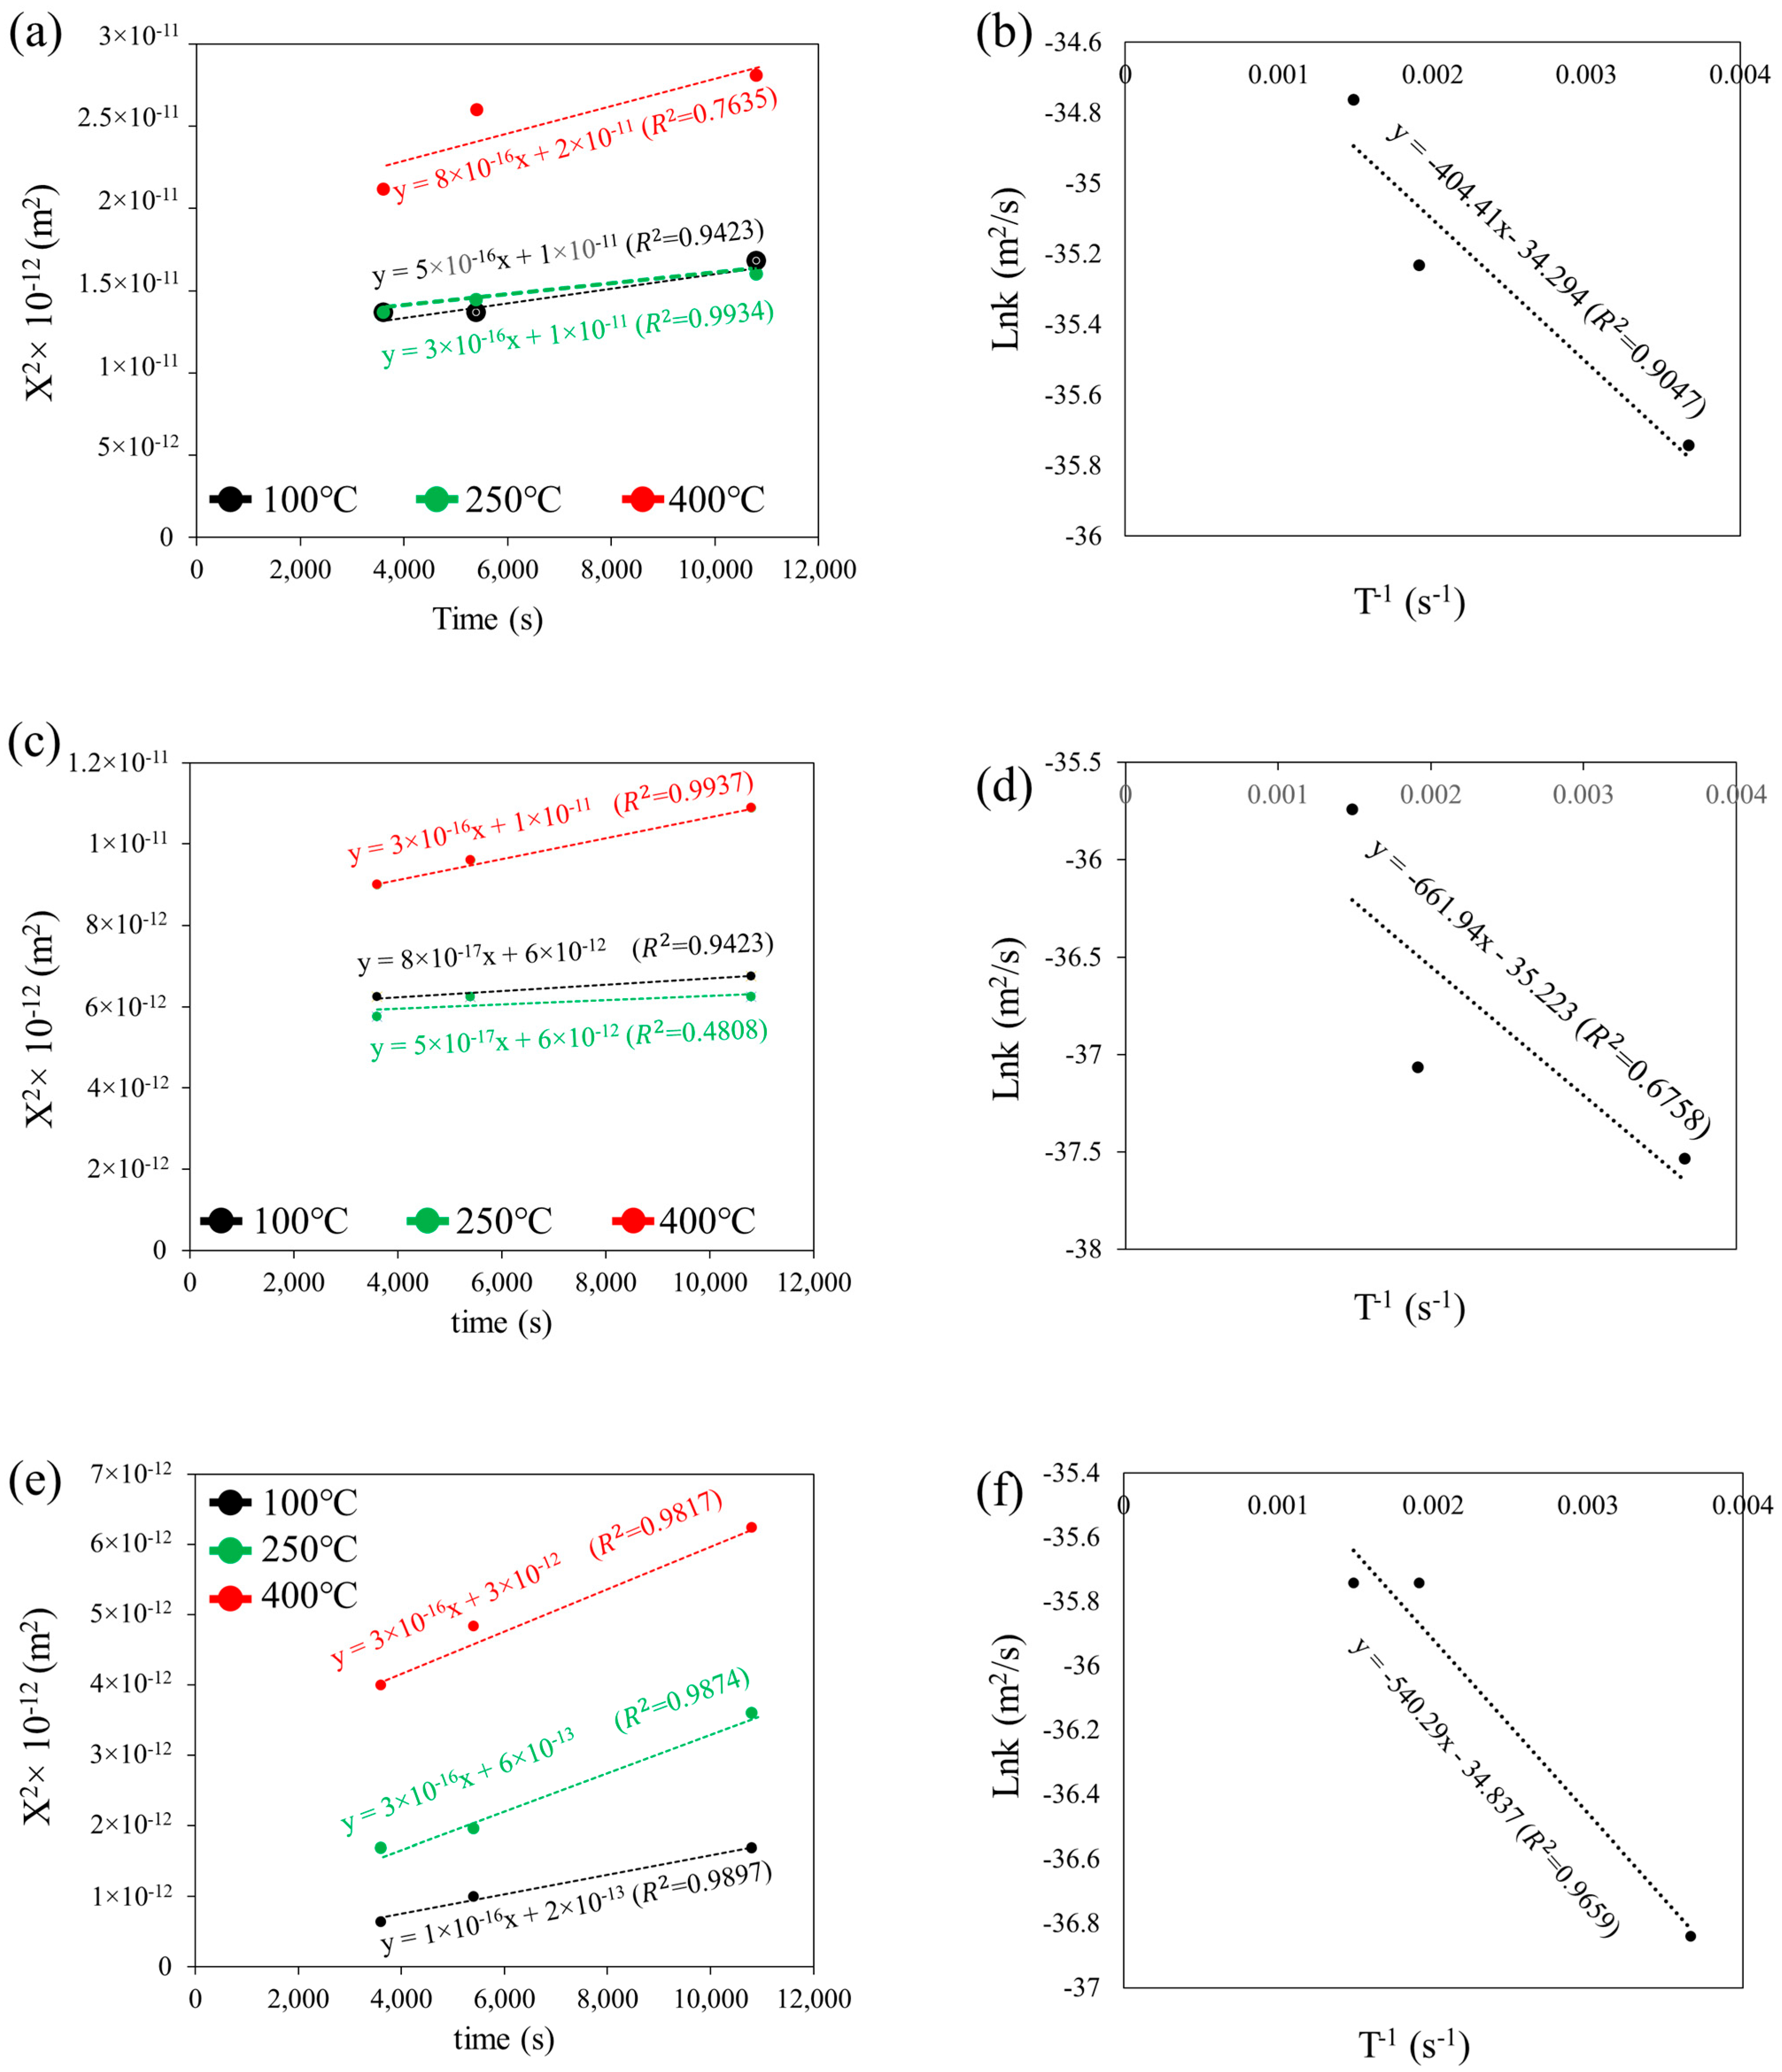
where k (m2/s) is the parabolic rate constant, and t (s) is time. As can be seen from Figure 13, the parabolic rate constant (k) in 100 °C, 250 °C, and 400 °C from the upper, middle, and lower zones has been calculated according to Equation (2).
The middle zone has the highest amount of activation energy in this area. As a consequence, the IMC layer’s thickness cannot grow sharply with the increasing temperatures from 100 °C to 400 °C.
Additionally, k is dependent on temperature and is obtained from the Arrhenius equation as follows:
k = k 0 e x p ( Q R T )
where k0 is the pre-exponential factor; Q (J/mol) is the activation energy; R (8.314 J/mol.k) is universal gas constant; and T (k) is temperature. To identify Q and k0 for the upper, middle, and lower zones in 30, 60, and 90 min annealing post-weld heat treatment, the logarithms of k are plotted against the reciprocal of the annealing temperature (T), which is shown in Figure 13. However, for basic investigation, the parabolic rate constant in the IMC thickness versus time graph was obtained by fitting the trend line at times of 30, 60, and 90 min for each temperature. As a result, the K values in each region for different temperatures were obtained, which according to Equation (3), K0 and activation energy will be obtained.
As is clear from Figure 14b,d,f, Q and k0 from each zone can be calculated at 373–723 K from each equation, obtained from the trend line and matched to Equation (4):
Ln ( k ) = Ln ( k 0 )     Q R 1 T
Table 3 shows the activation energy and k0. According to Table 3, the activation energy in the lower zone is higher than in the middle and upper zones. Activation energy is the minimum amount of energy required to overcome interactions between atoms in the case of diffusion. When the required activation energy to break the bonds between other atoms in a crystalline structure is low, atoms can diffuse more easily into the structural vacancies. In the lower regions of the S-shaped interface, the Q needed to mobilize atoms is significantly higher than in its upper zone. On the other hand, the activation energy for an atom’s mobility in the middle zone displays the highest value at the interface. Consequently, the diffusion coefficient of aluminum in iron, and vice versa, is lower in the lower zone compared to the upper zones. As a result, the IMC layer thickness is thinner in the lower zone compared to the upper regions.

3.2. Microhardness Results

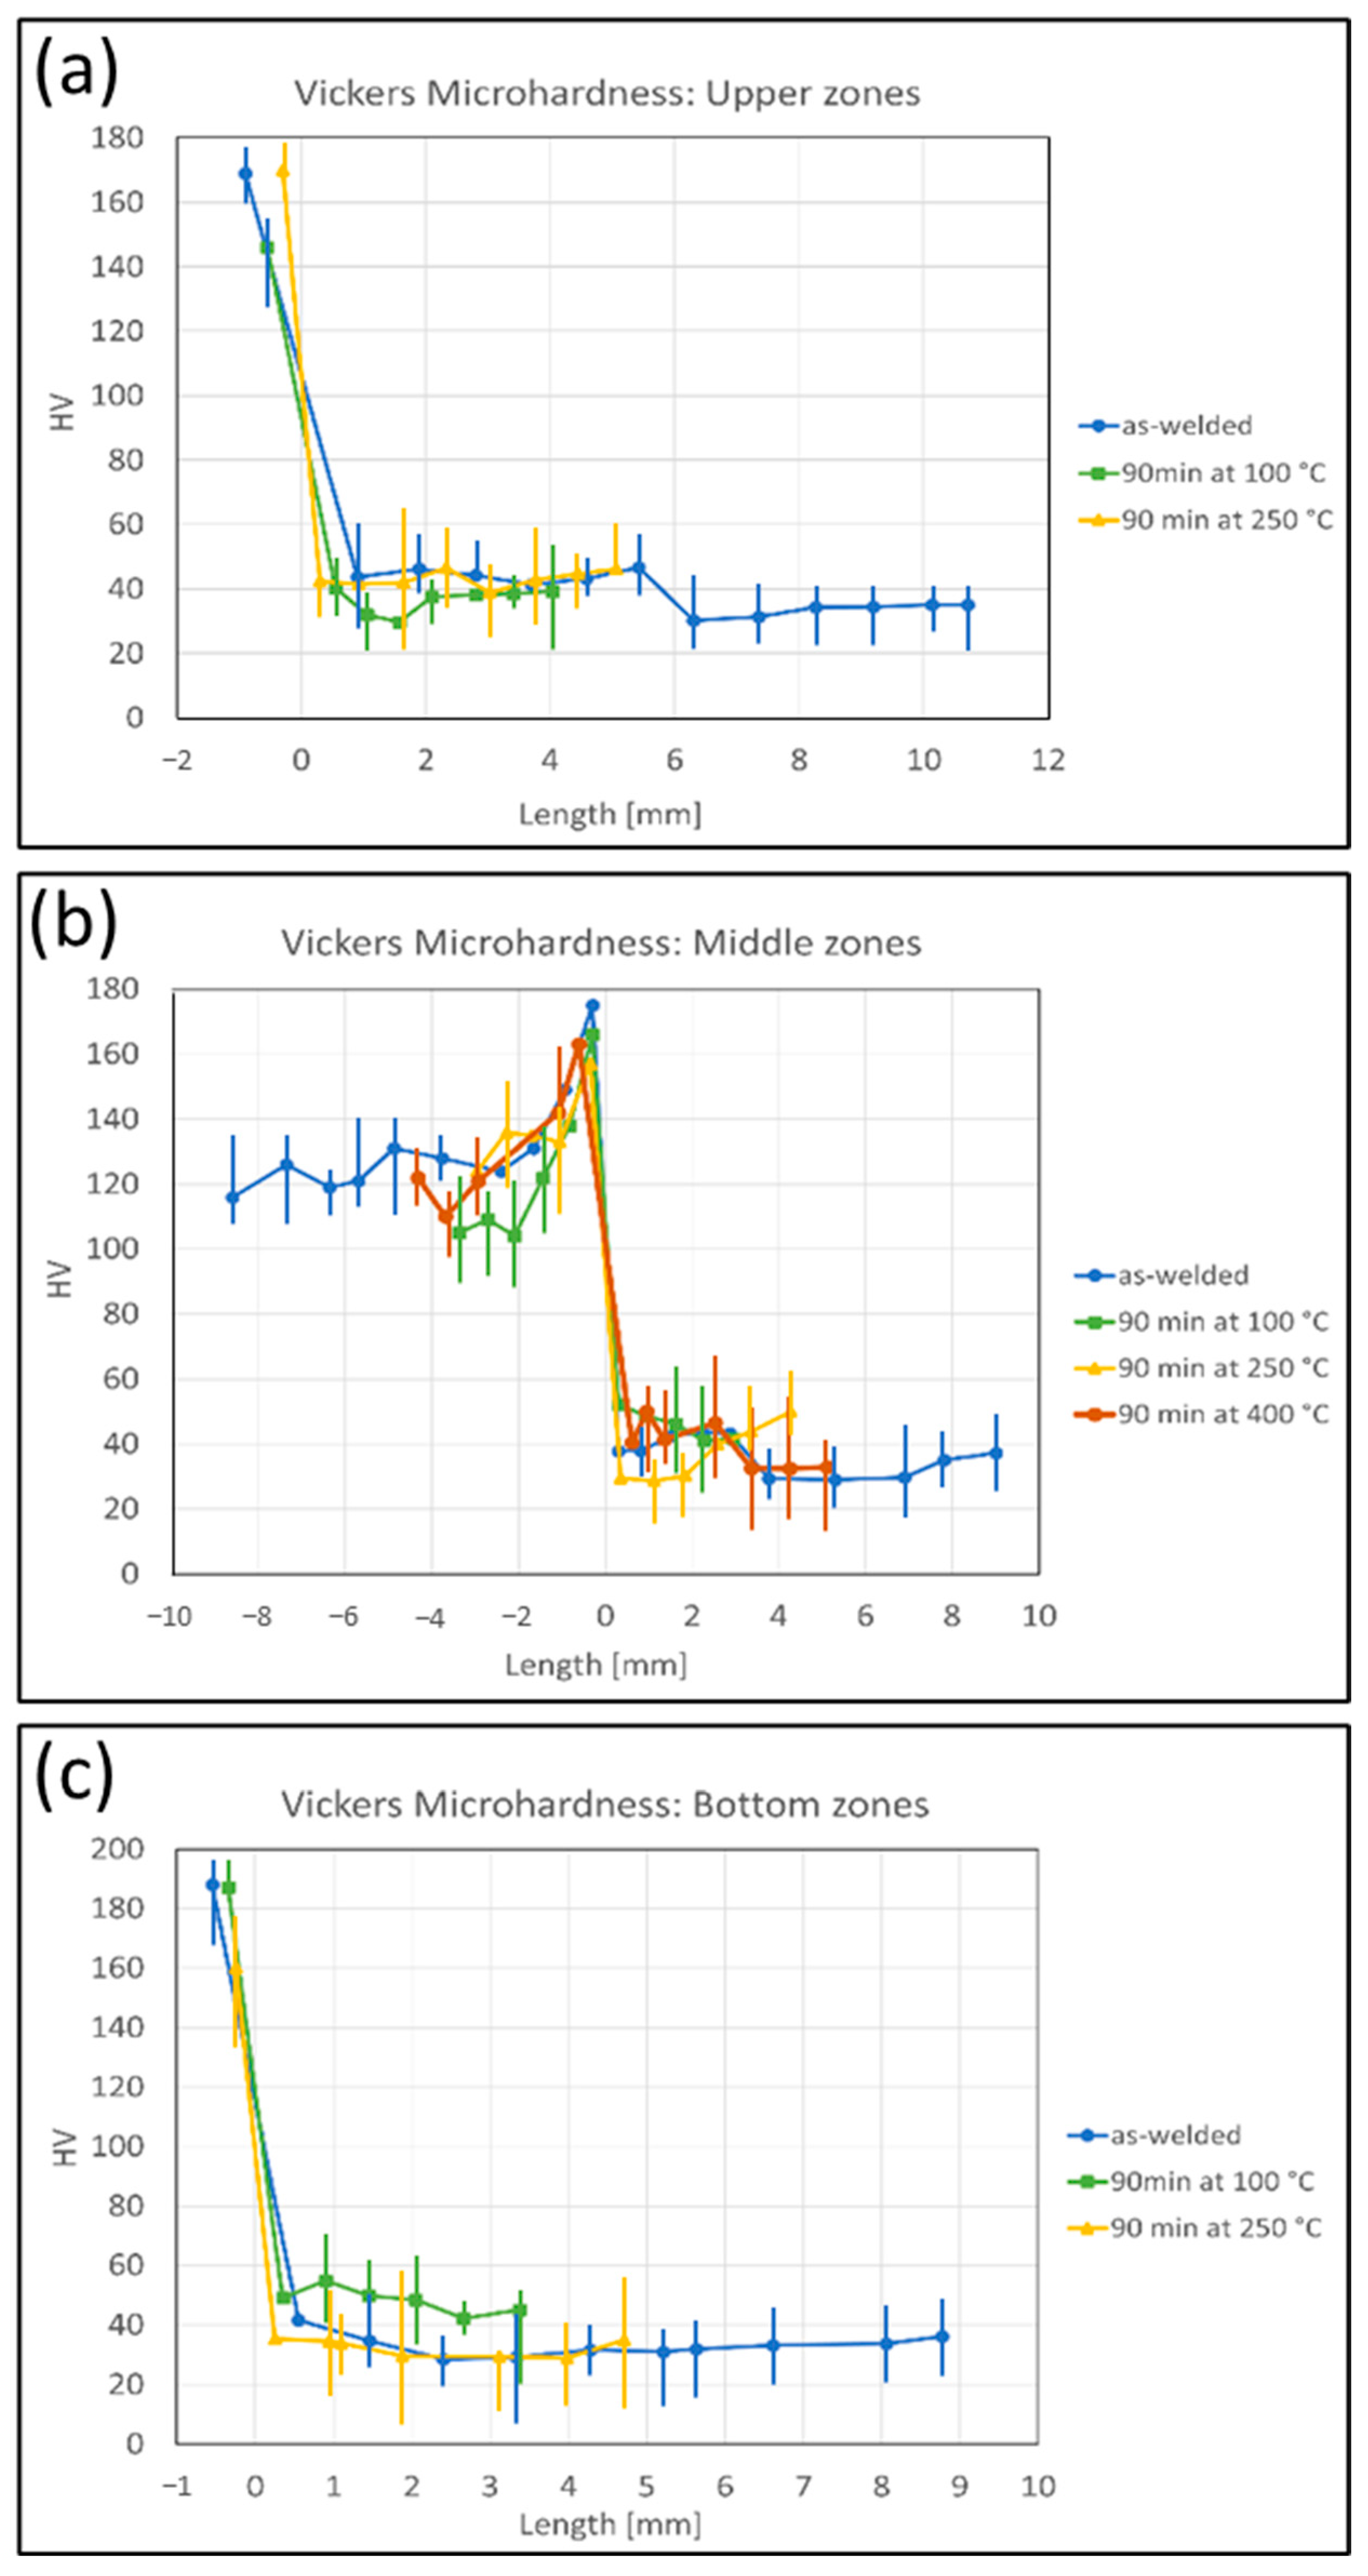
Figure 15 shows the microhardness results along the three lines outlined in Figure 5. In the upper zone on the steel side, both the as-welded and VI (250 °C/90 min) samples exhibited hardness values of 169 HV and 170 HV, respectively. Conversely, on the aluminum side, hardness values of 44 HV, 40 HV, and 43 HV were recorded for the upper, middle, and bottom zones closest to the interface. Notably, sample III (100 °C/90 min) demonstrated an opposite trend in hardness evolution away from the interface on the aluminum side compared to other samples: while sample III exhibited a decrease in hardness in the initial millimeters after the interface, the as-welded and VI samples experienced an increase.
Regarding the middle zones, a consistent trend of increasing hardness towards the interface was observed for the steel substrate, with hardness values of 175 HV for the as-welded sample, 166 HV for sample III (100 °C/90 min), and 157 HV for sample VI (250 °C/90 min); however, no clear trend was discernible for the aluminum side across the middle zones for the three samples.
In the bottom zone on the aluminum side, sample III (100 °C/90 min) exhibited the highest hardness values, followed by the as-welded and VI (250 °C/90 min) samples. On the steel side, sample VI (250 °C/90 min) displayed the lowest hardness at 160 HV, while the as-welded and sample III (100 °C/90 min) recorded hardness values of 188 HV and 187 HV, respectively. As is clear from Figure 8, Figure 9 and Figure 10—which relate to the SEM images of the as-welded, III (100 °C/90 min), and VI (250 °C/90 min) samples, respectively—IMC composition is Fe2Al5 in all of the mentioned samples. Therefore, as is clear from Figure 15, the hardness values of the as-welded, III, and VI samples are nearly the same in the joint interface. In summary, the hardness of St is raised close to the joint interface, as this region is influenced by plastic deformation of the rotating tool. As the temperature was kept below the melting point of Al, no recrystallization occurred in St, which describes the increase in its hardness.

3.3. Tensile Tests

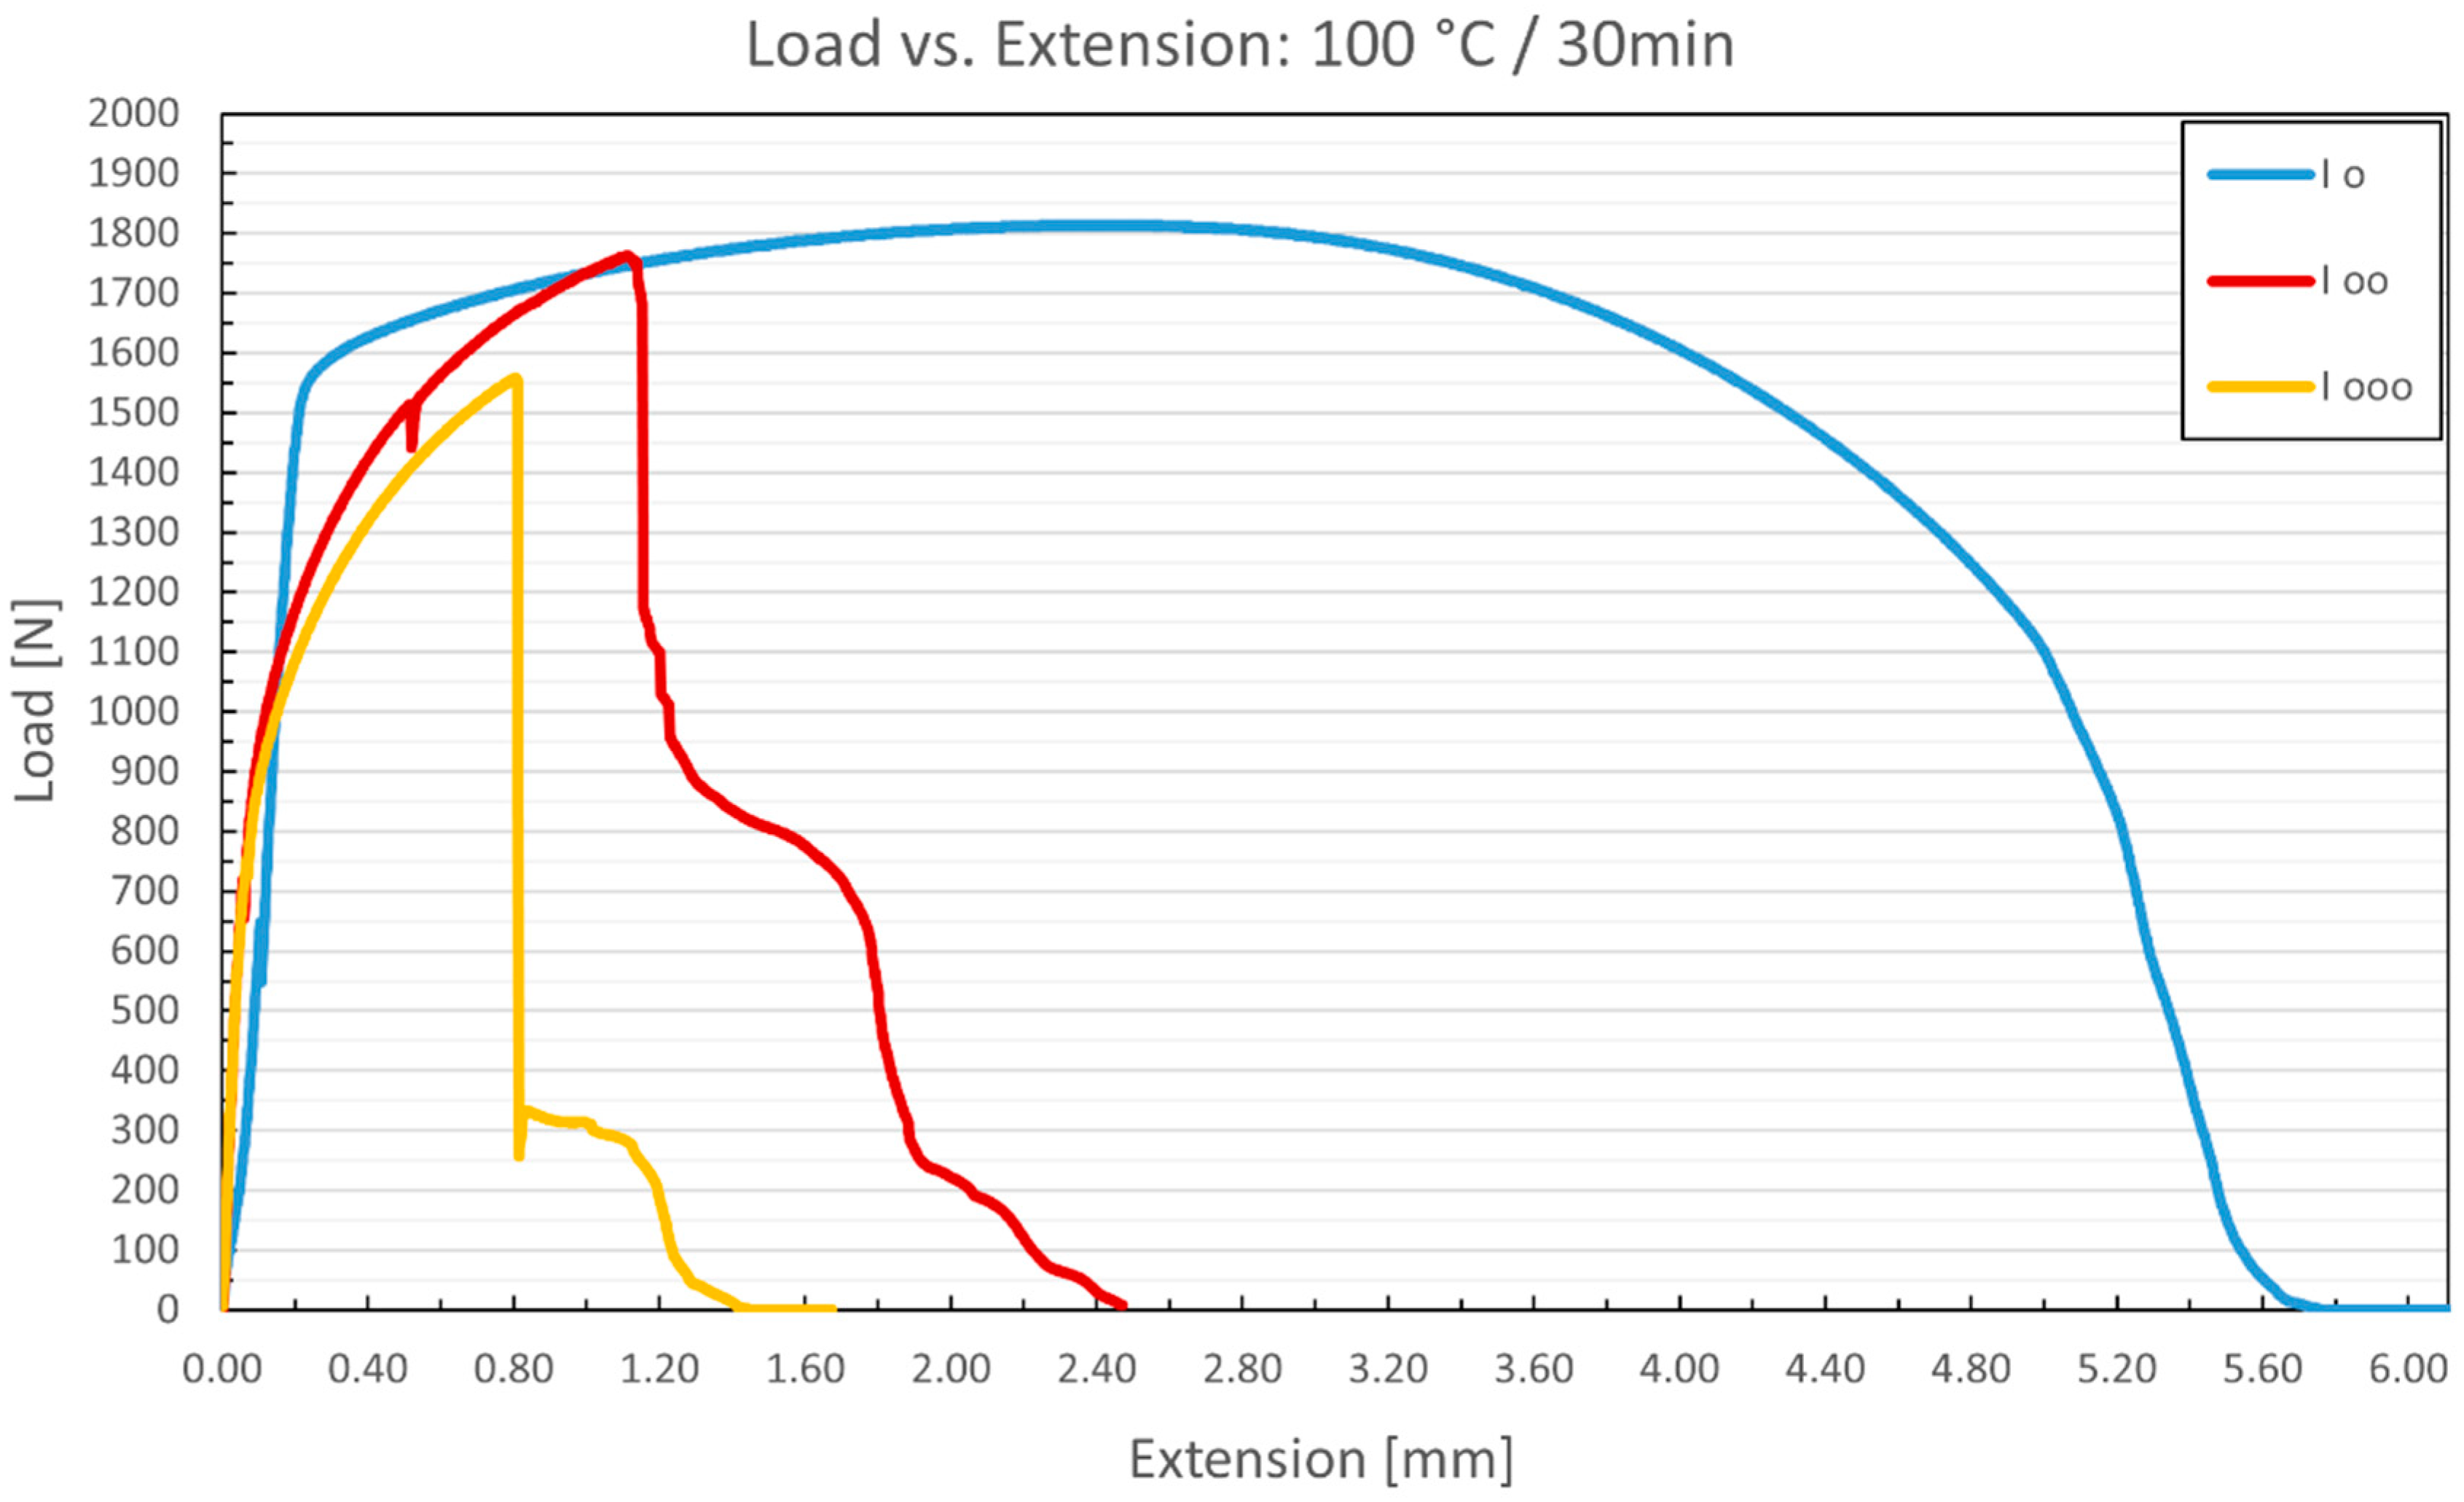
Three specimens from each joint have been tested. As an example, the data for sample I is provided in Figure 16. A scatter in both the UTS and elongation is obvious. This scatter will be explained by a detailed analysis of the fracture behavior in the next section.
Figure 17 plots the fracture load of the joint as well as the IMC thickness for the joints. The selection of the middle zone for analysis was motivated by its significant impact on joint failure. A notable drop in UTS is observed in sample I with respect to the as-welded one. No change was observed in UTS in samples II to VI. A slight decrease in UTS is seen in samples heat-treated at 400 °C (samples VII to IX). Notably, an increase in IMC layer thickness correlates with a decrease in joint strength, and vice versa; consequently, the thickness of the IMC layer exerts a proportional influence on the degradation of joint properties, aligning with the existing literature [27]. However, this cannot explain the drop in UTS in sample I with respect to the as-welded one, as the IMC thicknesses in both samples are similar. This drop in UTS is explained by the elimination of protrusions in the IMC layer by post-weld heat treatment (compare Figure 8d and Figure 9f). These protrusions in the IMC layer act as a barrier for crack propagation, causing a higher toughness in the as-welded joint.
The main outcome obtained in this study was the low percentage of decrease in fracture load by post-weld heat treatment. Table 4 compares the percentage of decrease in failure load after post-weld heat treatment of an Al/St joint at 400 °C for 90 min in this study and another study in reference [16]. The lower value of 23% in this study compared to 41% is attributed to the S-shaped interface, which reduces the effect of IMC thickness on the fracture behavior. In the next section, the corresponding mechanism is elaborated upon.

3.4. Fracture Behavior

The fracture behavior of the joints is closely related to the local microhardness variations and the growth of the intermetallic compound (IMC) layer at the interface. Regions with thicker IMC layers exhibited higher hardness values due to the brittle Fe2Al5 phase formation, which correlates with the observed brittle fracture modes in these zones. Conversely, areas with lower hardness corresponded to regions where ductile failure occurred, typically within the aluminum substrate or regions with less IMC growth. This variation in hardness across the interface influences the stress distribution and crack propagation paths, explaining the scatter in tensile properties and the multiple failure zones observed in the specimens. Tensile tests on the dissimilar FSW joints revealed noticeable scatter in both ultimate tensile strength (UTS) and elongation among the tested specimens, despite being fabricated under identical nominal conditions. This scatter is attributed to variations in fracture location and mode, which are influenced by local microstructural features, interface morphology, and the presence of IMCs.
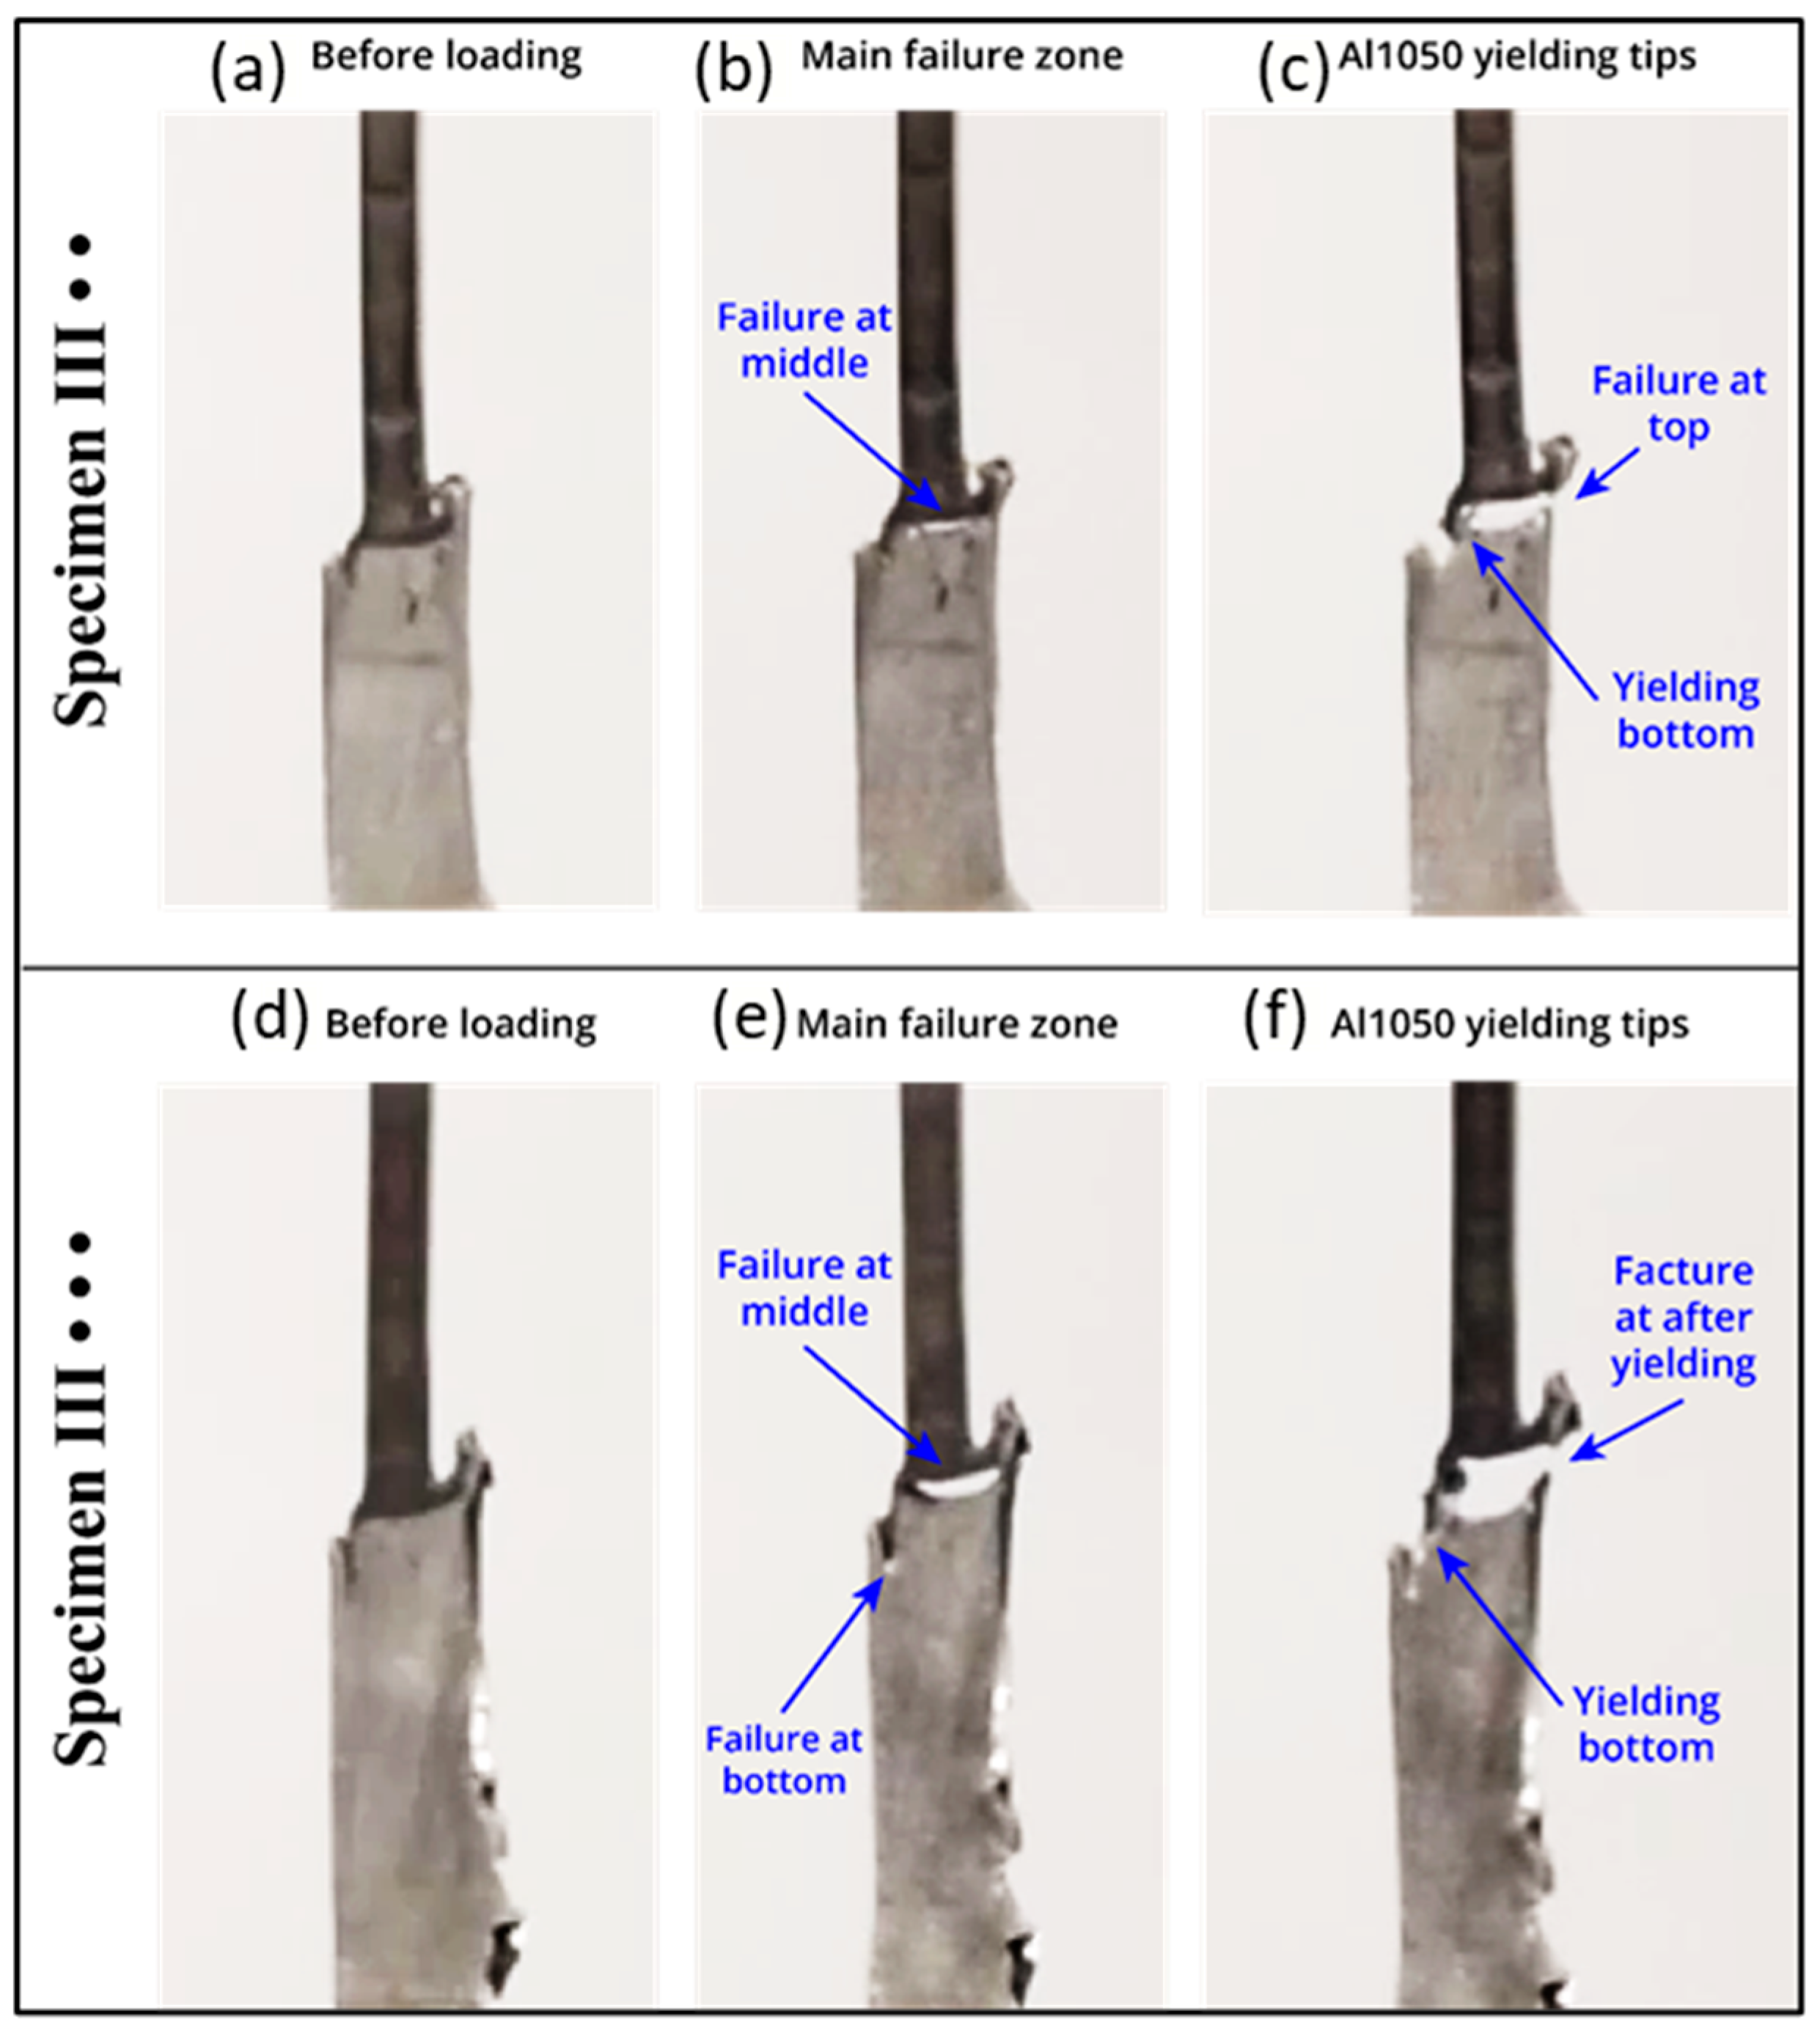
As shown in Figure 18, high-speed video analysis of multiple specimens (e.g., sample III) showed that the fractures did not consistently initiate from a single location, nor did they propagate through the same path in all samples. In general, three distinct fracture zones can be identified along the Al/St interface:
Middle Zone: In most samples, fractures initiated in the central part of the interface. This zone is characterized by a brittle failure mode associated with the presence of thick and brittle IMC layers. When a fracture occurs in this region, it leads to a sudden load drop in the tensile curve due to rapid crack propagation through the IMCs (see Figure 16, samples oo and ooo).
Lower and Upper Zones: In the lower and upper zones of the interface, the aluminum side of the joint underwent significant plastic deformation before final failure. These regions are primarily subjected to shear loading, as opposed to the normal tensile loading in the central region. In specimens where the initial failure occurred in the base Al material or in these shear-loaded regions, the load–extension curve displayed a gradual decrease with no abrupt drop (e.g., sample o).
This difference in fracture behavior across zones explains the variations in UTS and elongation. For instance, when brittle failure initiates early in the IMC region, the joint fails prematurely, resulting in lower UTS and elongation values. Conversely, when fracture initiates in the ductile Al region, more energy is absorbed prior to failure, leading to higher tensile strength and elongation.
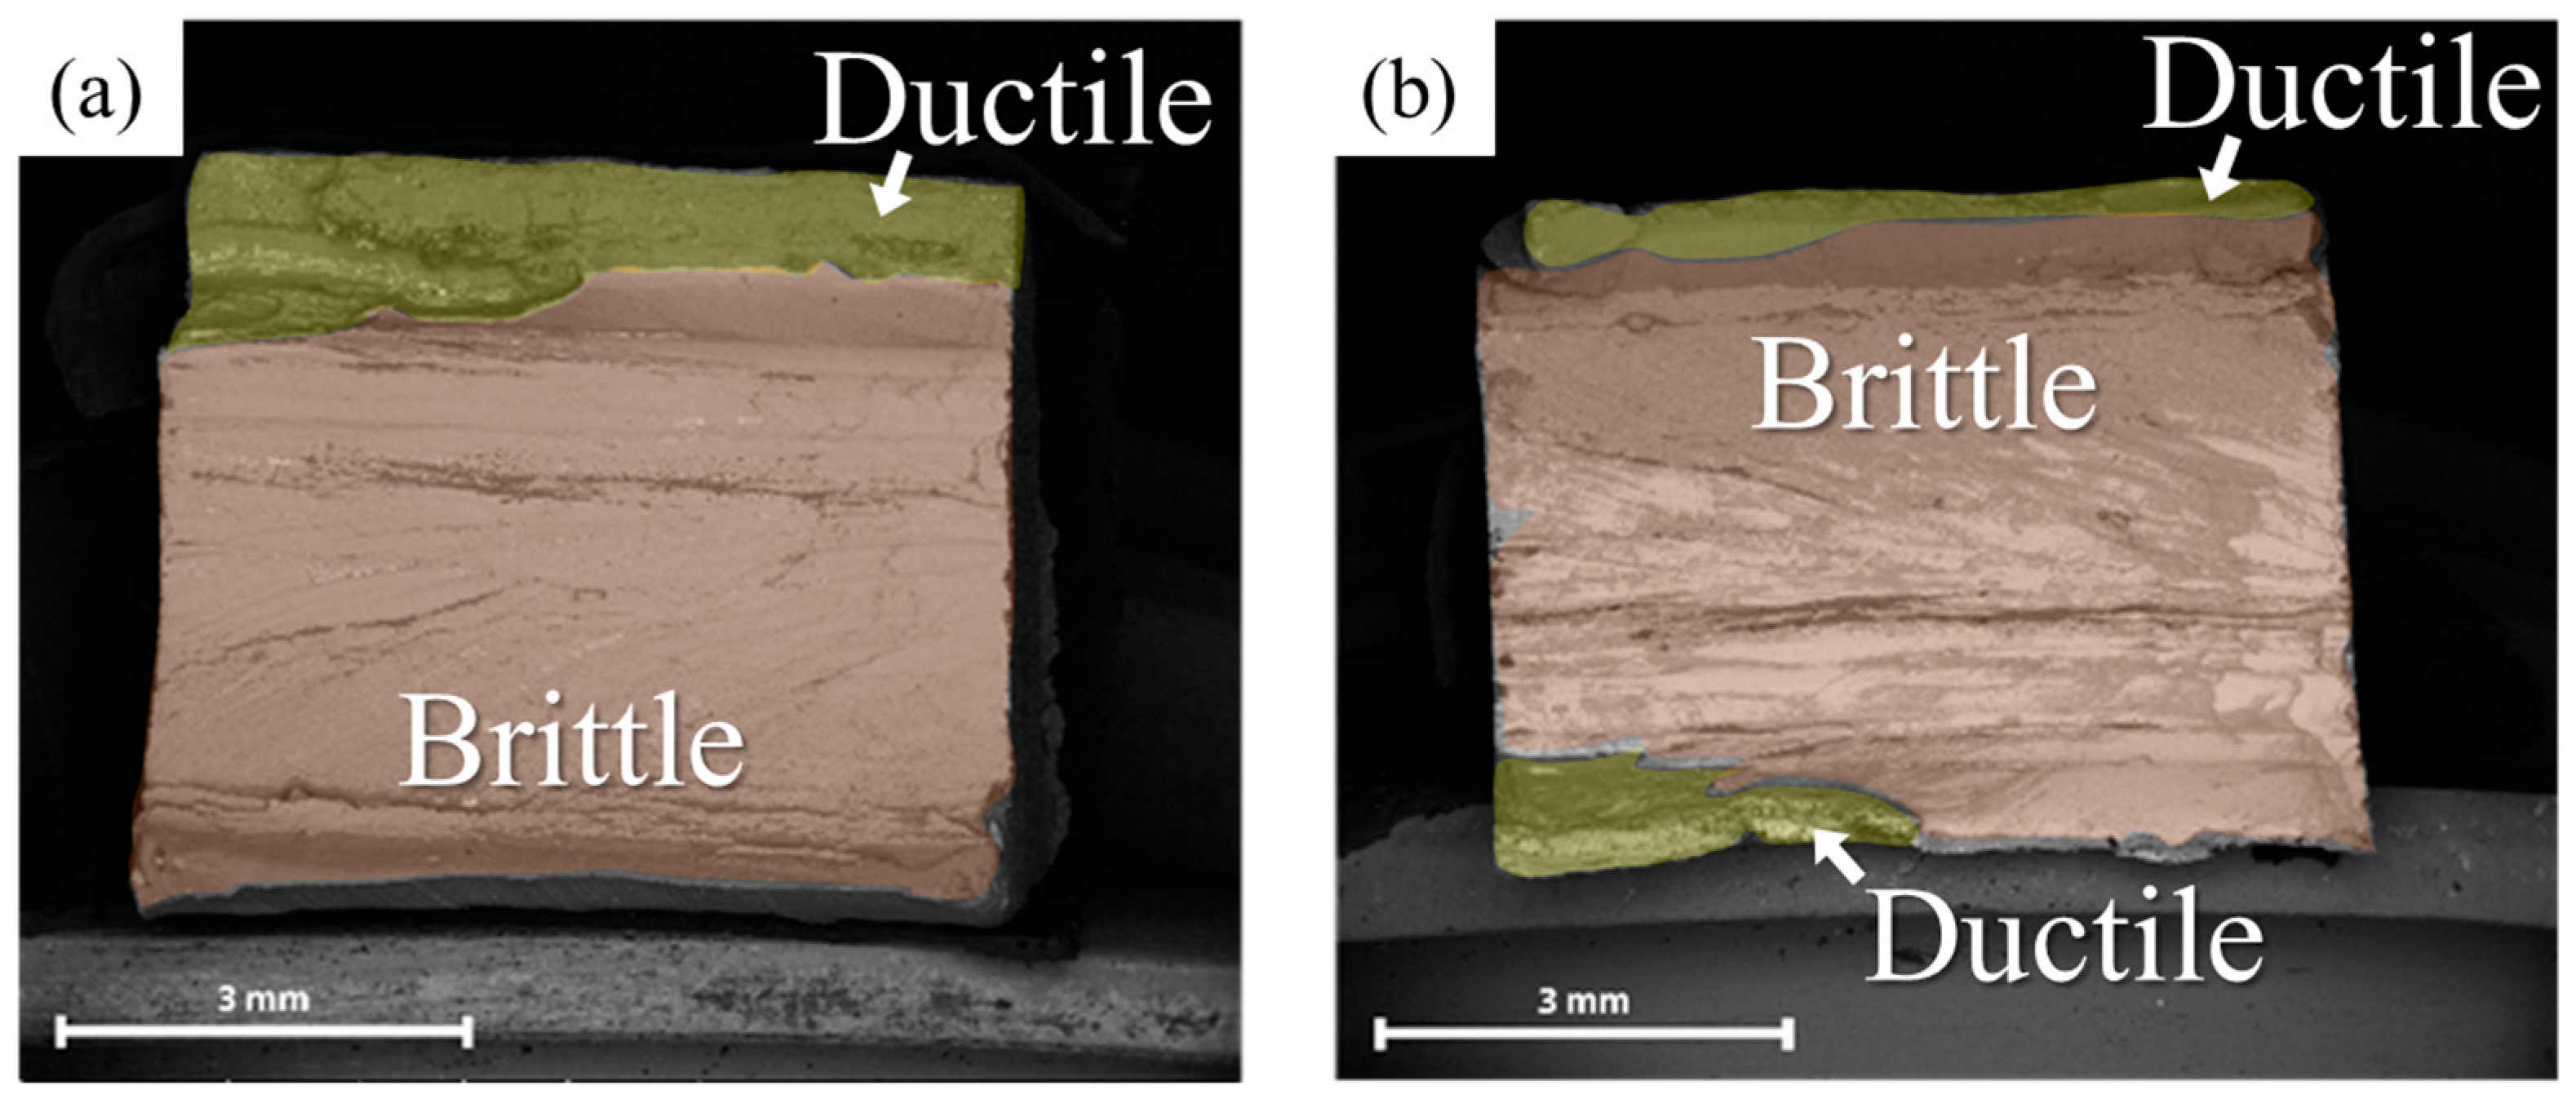
SEM fractography analysis provided further insight into the fracture mechanisms. Representative BSE images of fracture surface analysis from sample VI (Figure 19) clearly show distinct distributions of brittle and ductile regions. When examined from the steel side (Figure 19a), the central and lower regions of the sample exhibited predominantly brittle fracture, with an area of approximately 25 mm2, whereas the upper region showed limited ductile fracture, which measured about 5 mm2. In contrast, analysis from the aluminum side (Figure 19b) indicated a similar brittle fracture area in the central region (25 mm2), while ductile fracture was observed at both the upper and lower regions, totaling approximately 3 mm2. These measurements were obtained through SEM imaging and quantitative analysis using ImageJ, allowing for the precise delineation of fracture modes. The results highlight the asymmetric fracture behavior across the Al/St interface, reflecting the influence of material properties and local stress distribution during FSW.
Additionally, crater-like features were observed at the lower Al interface, likely caused by the mechanical interaction and local softening due to steel-tip penetration, which contributed to further material displacement and affected failure paths.
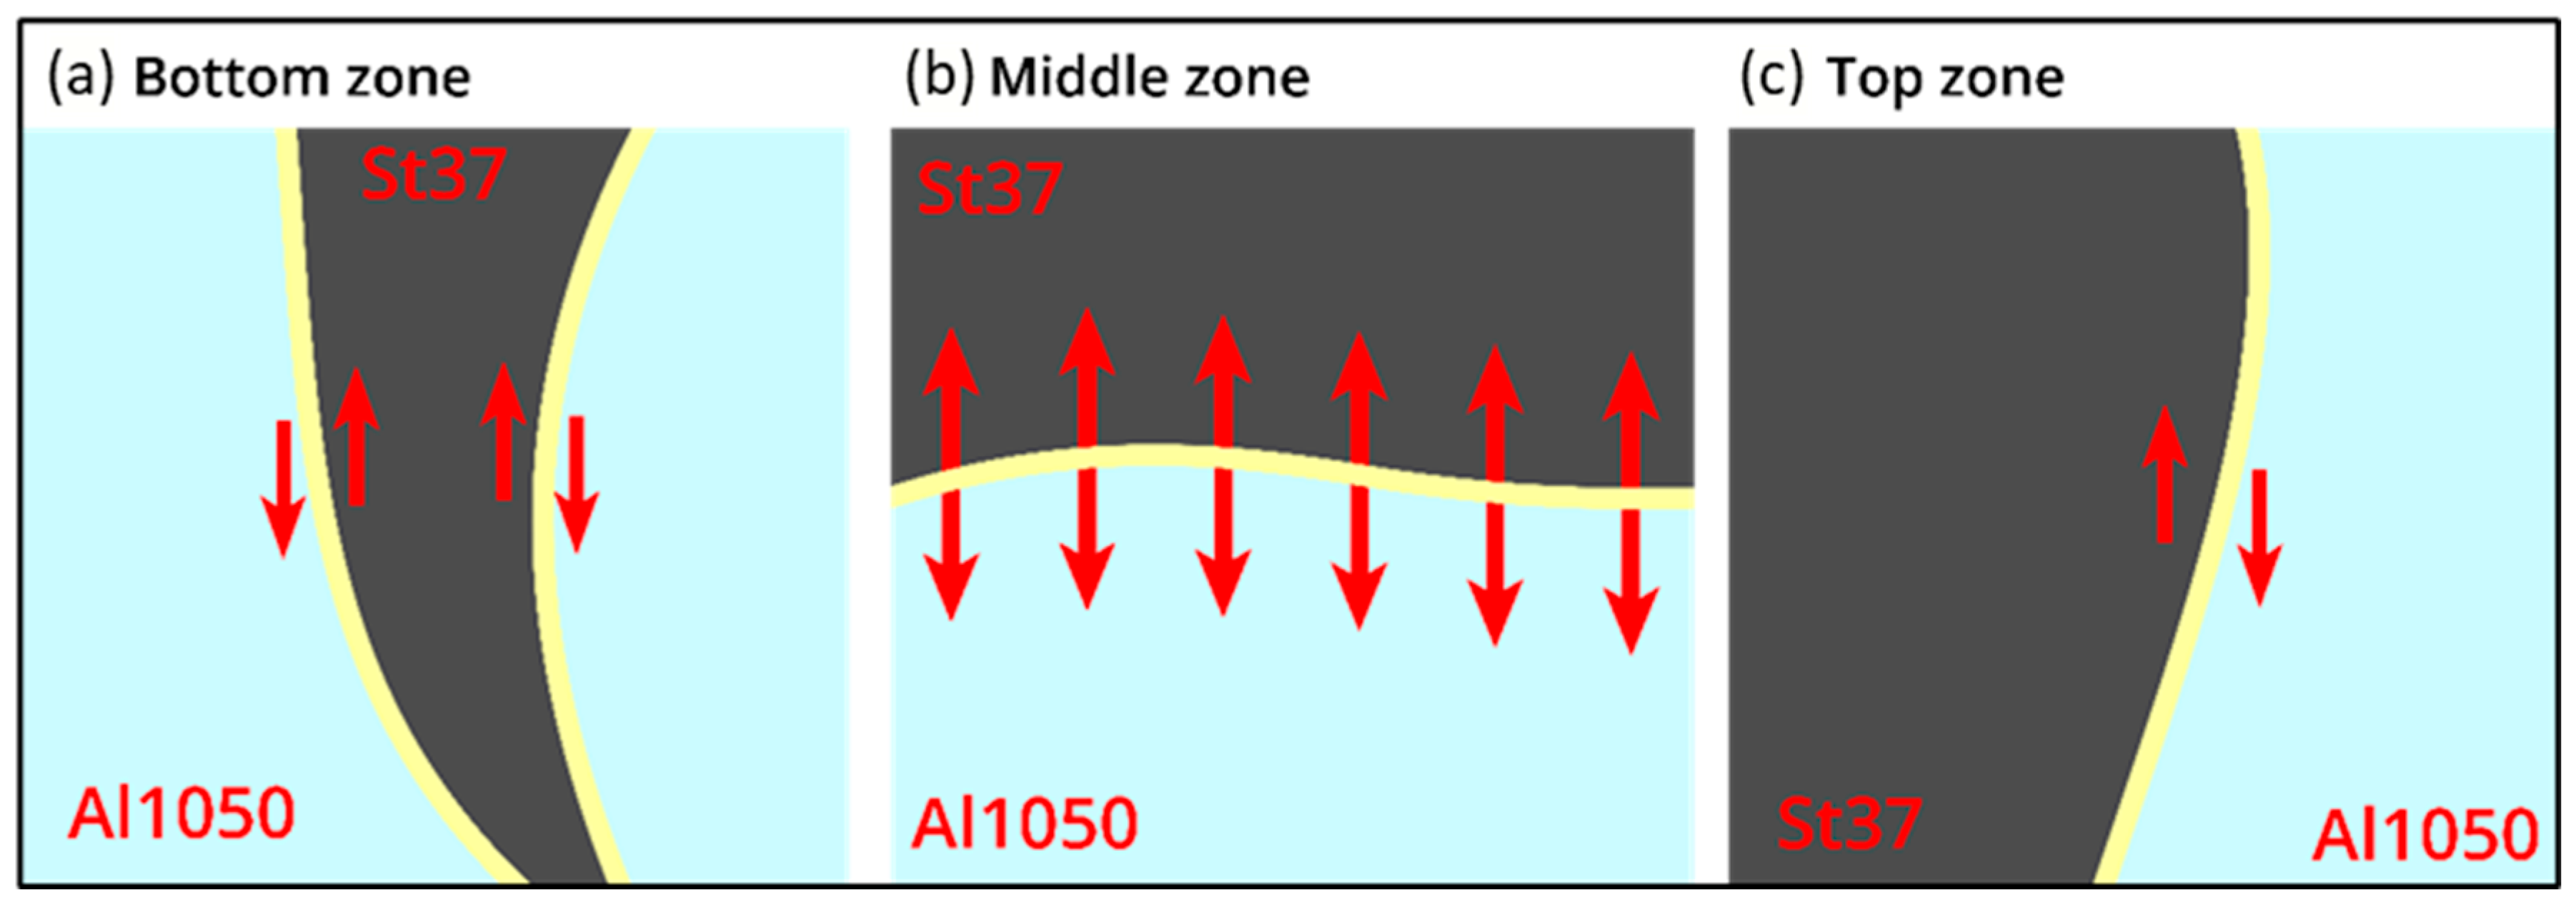
The geometry of the joint interface, especially the non-uniform S-shape and the presence of sharp changes in thickness or morphology, resulted in a complex stress distribution during tensile loading. This is schematically illustrated in Figure 20, where normal tensile forces act at the center and shear forces dominate the top and bottom interface zones. Post-weld heat treatment also influenced the fracture path, particularly in the upper region of the interface. Depending on the post-weld heat treatment parameters, the thickness, morphology, and brittleness of the IMC layer varied, which in turn altered the fracture initiation site and the failure mode. This variation explains part of the scatter observed in the tensile results among different conditions. In summary, the observed scatter in mechanical performance is not a result of inconsistent processing but rather due to complex multi-zone fracture behavior. These mechanisms are dependent on local interface conditions, stress distribution during loading, and the post-weld heat treatment. More detailed images, fracture surface analyses, and tensile test video frames are provided in the Supplementary Information to support these findings.

3.5. Numerical Model of Fracture

The main aim of simulating the fracture was to identify the fracture initiation and propagation path with respect to the interface. In addition, the ductility of the joint, obtained by identifying the zones with high plastic strain, is determined through simulation. An analysis of the cohesive surface’s (CSMAXSCRT) damage initiation in the Al1050 substrate indicates a slow degradation of the joint. Figure 21 illustrates the observed damage initiation, which starts from the middle zone of the interface and propagates to the top zone. The middle zone notably undergoes total damage initiation, as observed in Figure 21d.
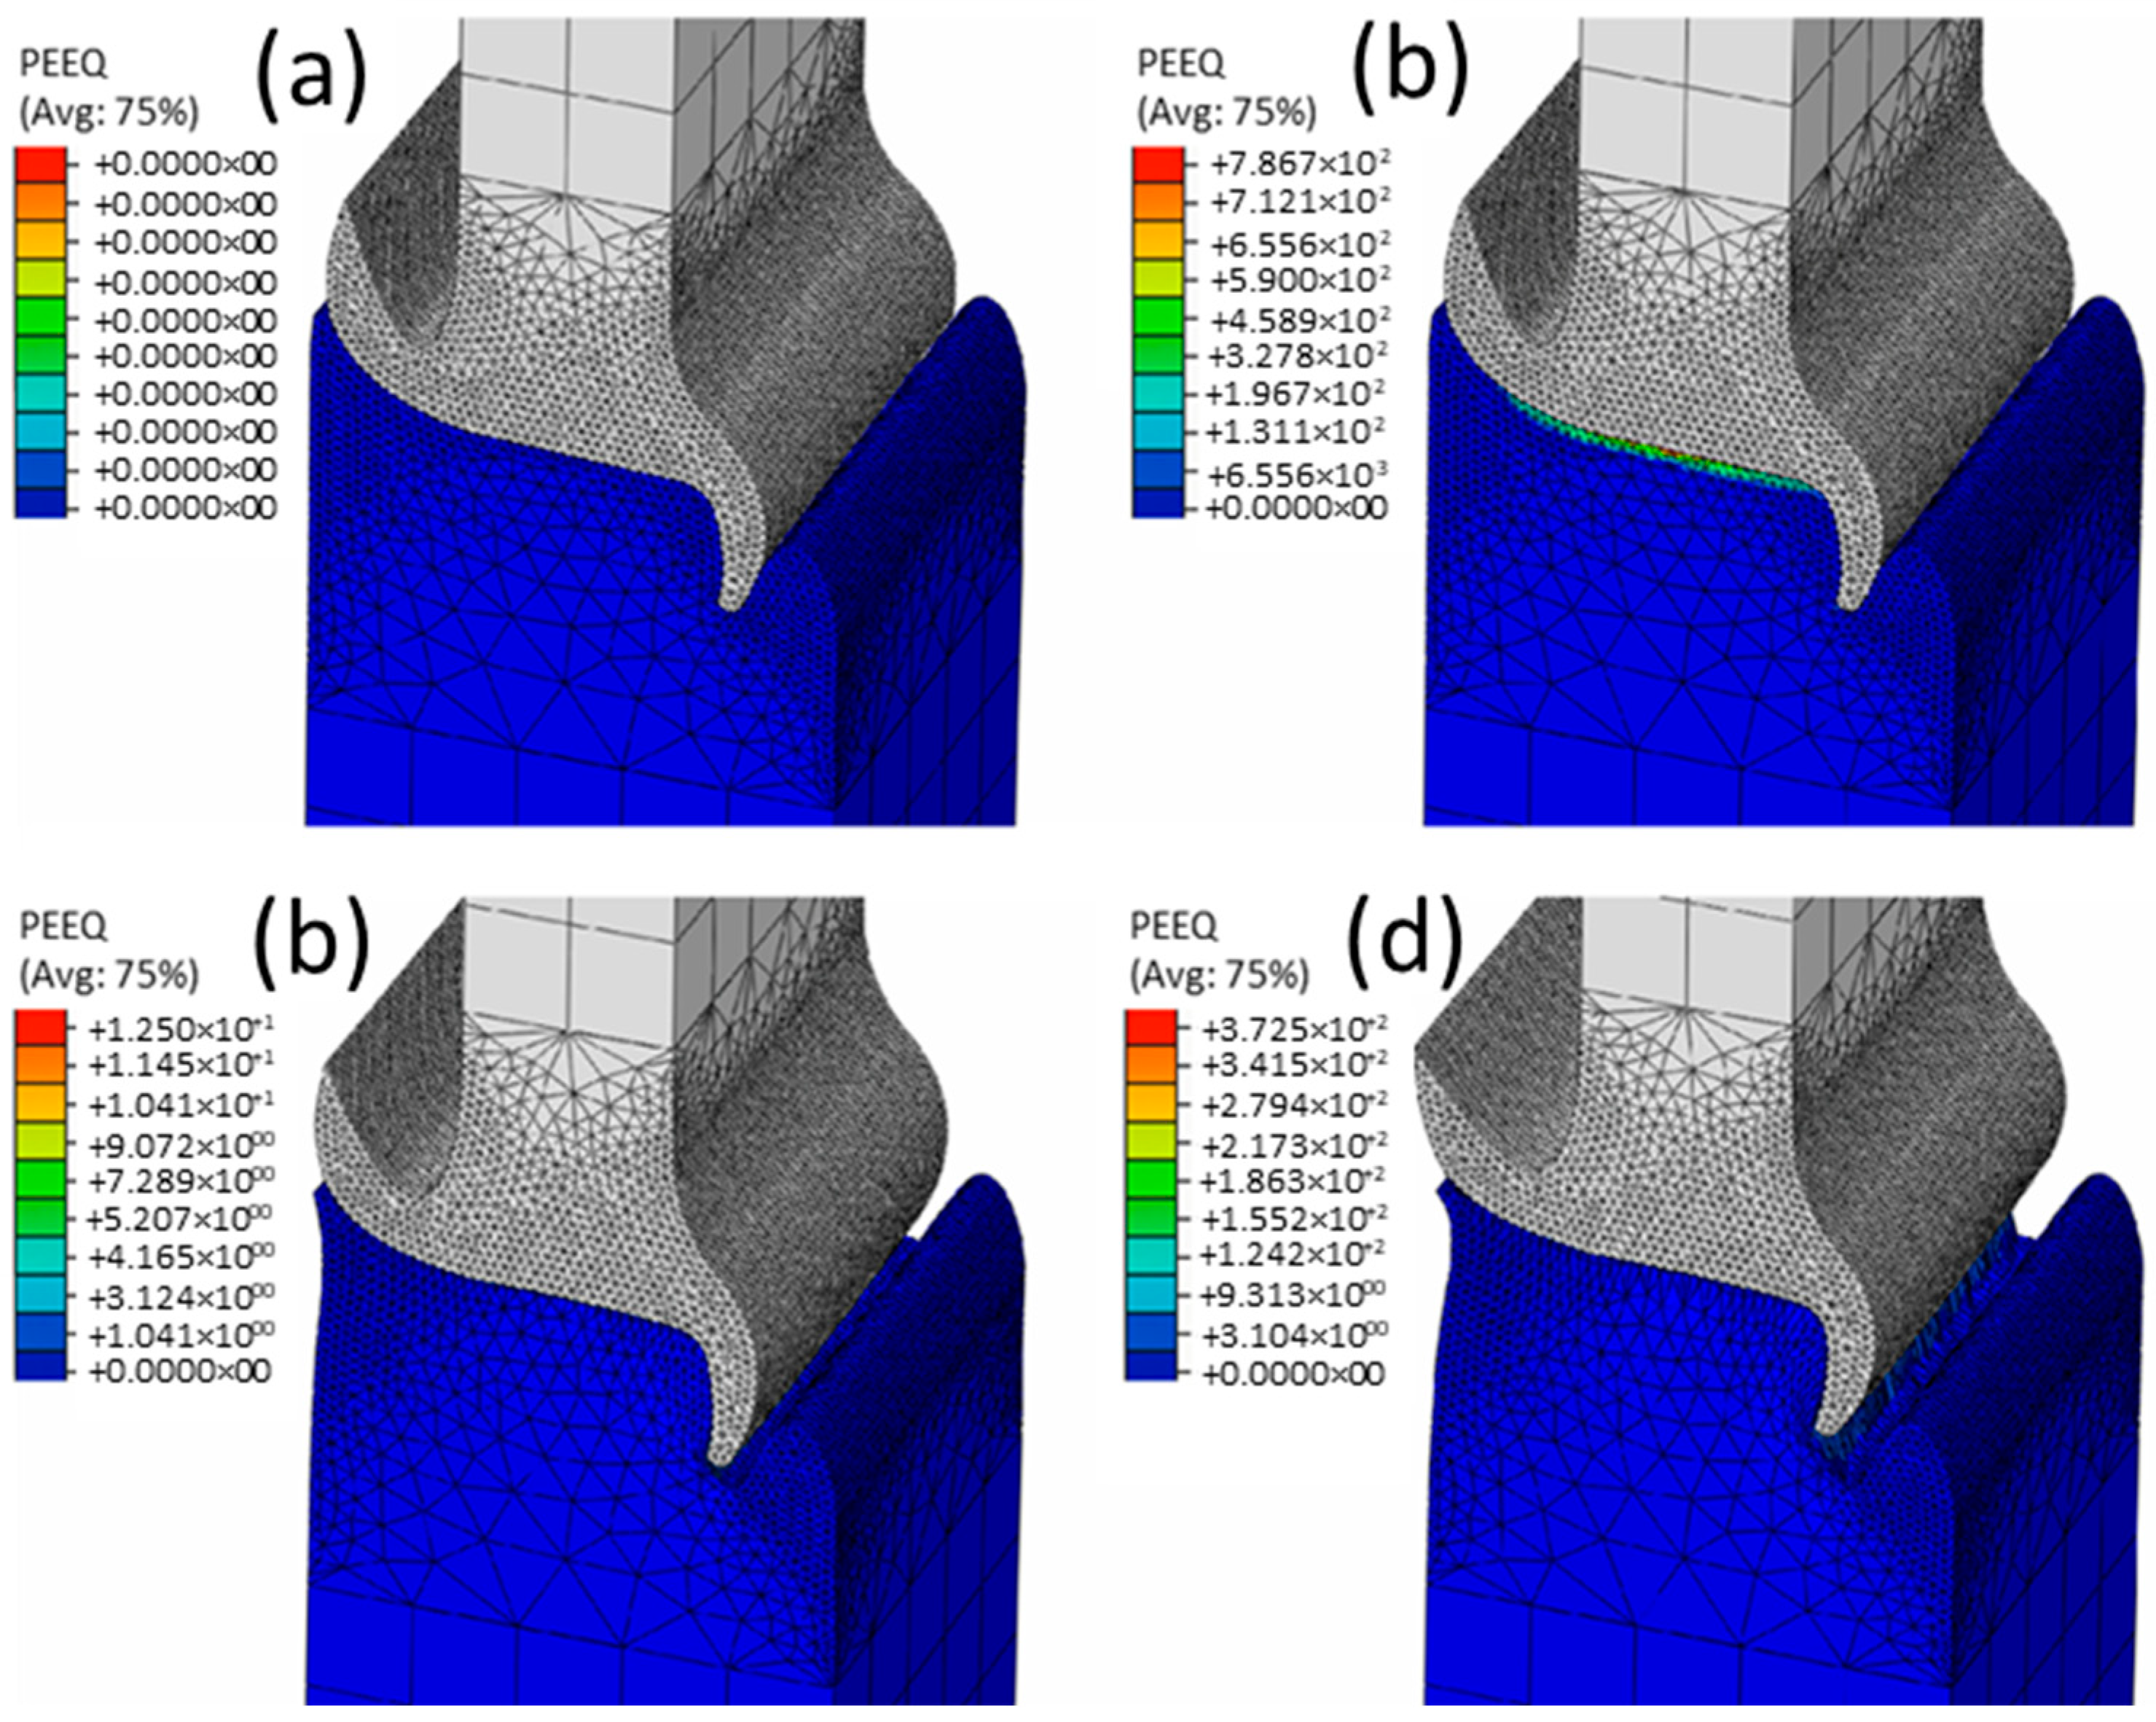
Upon observing the plastic deformation depicted in Figure 22, noticeable yielding of the Al1050 substrate and subsequent necking close to the joint interface are evident. The yielding of the aluminum is predominantly at the bottom and top S-shaped tips. Notably, the bottom aluminum tip undergoes partial detachment from the ST37 substrate, as illustrated in Figure 22c,d.
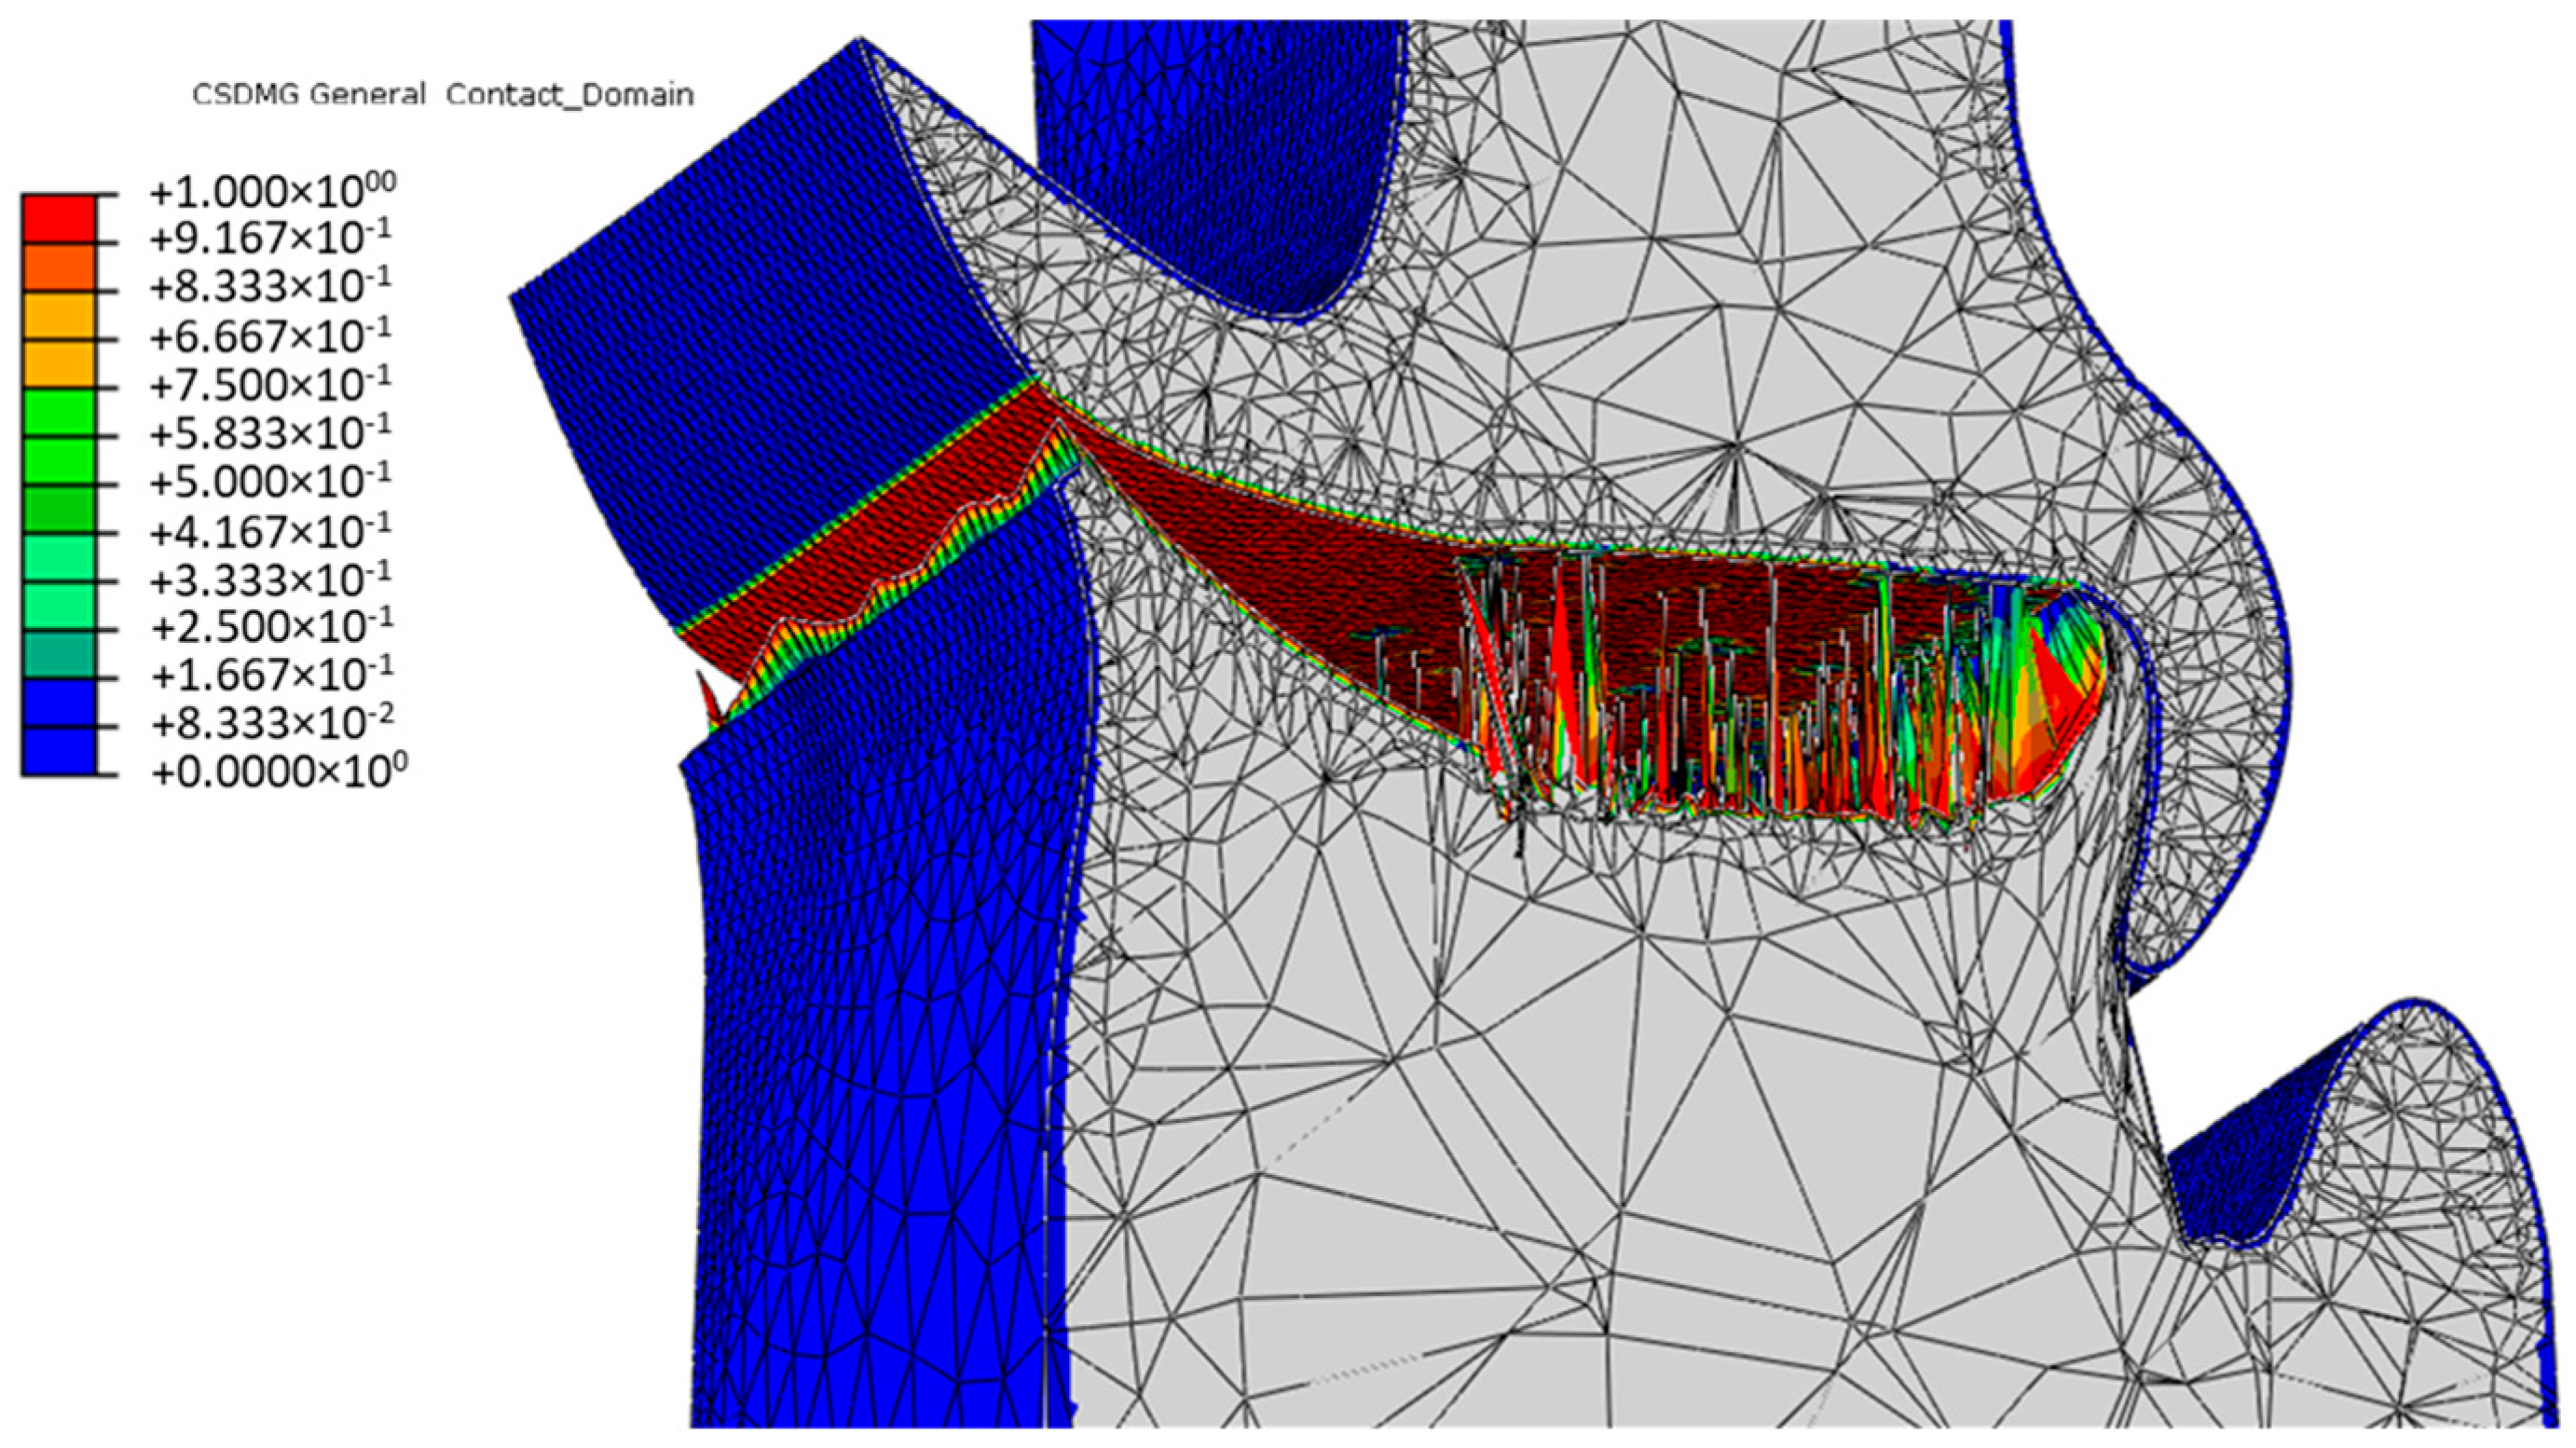
As seen in the last frame of the tensile test simulation (Figure 23), total damage of the cohesive surface—which represents the IMC layer behavior—is present at the middle and top zones of the interface. High plastic deformation occurs at the bottom zone of the aluminum side in a similar manner to the failure behavior of the experimental joints.

4. Conclusions

This study provides new insights into the effects of temperature on the degradation mechanisms of dissimilar friction-stir welded (FSW) joints between aluminum and steel, with a particular focus on the growth and influence of the intermetallic compound (IMC) layer. The main conclusions are as follows:
  • Successful fabrication of high-quality FSW joints between St37 steel (2 mm thickness) and Al1050 aluminum (5 mm thickness) was achieved, featuring a distinctive S-shaped interface geometry. This configuration promotes mechanical interlocking and facilitates an effective distribution of normal and shear stresses, contributing to joint integrity.
  • The IMC layer thickness varied between 0.1 μm and 4.0 μm, influenced by the unique joint geometry and material flow during welding. The dominant IMC phase at the interface was identified as Fe2Al5, with aluminum content ranging between 68% and 72% atomic percent.
  • Post-weld heat treatment at elevated temperatures showed an increase in IMC thickness only at 400 °C, while negligible growth occurred at 100 °C and 250 °C, indicating temperature-dependent IMC kinetics.
  • Tensile testing revealed a reduction in ultimate failure loads following post-weld heat treatment, even at 100 °C, where IMC growth was minimal; this reduction is explained by the smoothing of IMC protrusions that otherwise act as crack arrestors, thus compromising joint toughness.
  • The numerical fracture model effectively captured the experimental failure behavior, highlighting damage initiation in the middle zone of the joint and progression toward the top zone. The bottom zone exhibited considerable plastic deformation, consistent with observed experimental fracture patterns.
  • The S-shaped interface geometry mitigates the detrimental impact of the IMC layer on joint strength by altering the stress distribution, as the interface is not aligned perpendicular to the applied loading.
  • Variation in activation energies for IMC growth across different interface regions reflects non-uniform thermo-mechanical histories during FSW, underscoring the complex nature of the process.
Overall, the combination of experimental characterization and numerical modeling offers a comprehensive understanding of the thermal and mechanical factors governing the performance and degradation of Al/St FSW joints, paving the way for improved design and processing strategies in dissimilar metal welding.
To further expand the understanding and applicability of this study, future research may explore the following:
  • The influence of an S-shaped joint interface in different aluminum and steel grades;
  • The effect of welding parameters on the formation of the curved (S-shaped) interface;
  • The corrosion behavior of the curved interface in dissimilar Al/St FSW joints;
  • The creep and fatigue properties of S-shaped dissimilar joints.

Supplementary Materials

The following supporting information can be downloaded at: https://www.mdpi.com/article/10.3390/jmmp9110381/s1.

Author Contributions

Conceptualization, R.B., E.A.S.M. and L.F.M.d.S.; methodology, R.J.C.C., M.M.K. and M.B.H.; validation, R.J.C.C. and M.M.K.; formal analysis, T.O.G.T.; investigation, R.J.C.C. and T.O.G.T.; resources, R.B.;—original draft preparation, T.O.G.T.; writing—review and editing, M.B.H., R.B., R.J.C.C., M.M.K., E.A.S.M. and L.F.M.d.S.; supervision, L.F.M.d.S., E.A.S.M. and R.B.; All authors have read and agreed to the published version of the manuscript.

Funding

This research received no external funding.

Data Availability Statement

Data is contained within the article.

Acknowledgments

The authors thank Arak University for supporting this project. The authors also gratefully acknowledge the Portuguese Foundation for Science and Technology (FCT) for supporting the work presented here, through the individual grants CEECIND/02752/2018, CEECIND/03276/2018, and the funding under the reference “UIDP/50022/2020—LAETA—Laboratorio Associado de Energia, Transportes e Aeronautica”.

Conflicts of Interest

The authors declare no conflict of interest.

References

  1. Nonnenmann, T.; Beygi, R.; Carbas, R.; da Silva, L.; Öchsner, A. Feasibility study on hybrid weld-bonding between dissimilar material for automotive industry. Int. J. Adhes. Adhes. 2023, 121, 103316. [Google Scholar] [CrossRef]
  2. Abhilash; Nunthavarawong, P.; Ratanathavorn, W.; Kowitwarangkul, P. Advances in friction stir welding of dissimilar aluminum and steel: A review on challenges, assisted techniques, and future prospects. Mater. Manuf. Process. 2024, 39, 1639–1672. [Google Scholar] [CrossRef]
  3. Gohoungodji, P.; N’Dri, A.B.; Latulippe, J.M.; Matos, A.L.B. What is stopping the automotive industry from going green? A systematic review of barriers to green innovation in the automotive industry. J. Clean. Prod. 2020, 277, 123524. [Google Scholar]
  4. Winkler, M.; Rößler, C.; Harriehausen, N.; Jüttner, S.; Schmicker, D.; Trommer, F. An energetic approach to the statistical analysis and optimization of friction welding processes applied to an aluminum-steel-joint. J. Adv. Join. Process. 2024, 10, 100251. [Google Scholar] [CrossRef]
  5. Zhang, Y.N.; Cao, X.; Larose, S.; Wanjara, P. Review of tools for friction stir welding and processing. Can. Met. Q. 2012, 51, 250–261. [Google Scholar] [CrossRef]
  6. Mishra, R.S.; Ma, Z. Friction stir welding and processing. Mater. Sci. Eng. R Rep. 2005, 50, 1–78. [Google Scholar] [CrossRef]
  7. Chaudhari, R.; Parekh, R.; Ingle, A. Reliability of dissimilar metal joints using fusion welding: A Review. In Proceedings of the International Conference on Machine Learning, Electrical and Mechanical Engineering (ICMLEME: 2014)—2014, Dubai, United Arab Emirates, 8 January 2014. [Google Scholar]
  8. Munoz, A.C.; Rückert, G.; Huneau, B.; Sauvage, X.; Marya, S. Comparison of TIG welded and friction stir welded Al–4.5 Mg–0.26 Sc alloy. J. Mater. Process. Technol. 2008, 197, 337–343. [Google Scholar] [CrossRef]
  9. Xue, P.; Xiao, B.L.; Ma, Z.Y. Effect of interfacial microstructure evolution on mechanical properties and fracture behavior of friction stir-welded Al-Cu joints. Met. Mater. Trans. A 2015, 46, 3091–3103. [Google Scholar] [CrossRef]
  10. Hussein, S.A.; Tahir, A.S.M.; Hadzley, A. Characteristics of aluminum-to-steel joint made by friction stir welding: A review. Mater. Today Commun. 2015, 5, 32–49. [Google Scholar] [CrossRef]
  11. Singh, J.; Arora, K.S.; Shukla, D.K.; Kumar, H. Mechanical and microstructural characterization of cold metal transfer (CMT) spot aluminium-steel weld-brazed joints. Proc. Inst. Mech. Eng. Part L J. Mater. Des. Appl. 2022, 236, 2506–2515. [Google Scholar] [CrossRef]
  12. Zhang, C.; Li, H.; Liu, Q.; Huang, C.; Zhou, K. Ultrasonic Welding of Aluminum to Steel: A Review. Metals 2022, 13, 29. [Google Scholar] [CrossRef]
  13. Penner, S.; Armbrüster, M. Formation of intermetallic compounds by reactive metal–support interaction: A frequently encountered phenomenon in catalysis. ChemCatChem 2015, 7, 374–392. [Google Scholar] [CrossRef]
  14. Wang, X.; Lados, D.A. Optimization of aluminum-to-steel friction stir lap welding for the fabrication of high-integrity structural components. J. Adv. Join. Process. 2022, 5, 100114. [Google Scholar] [CrossRef]
  15. Beygi, R.; Mehrizi, M.Z.; Akhavan-Safar, A.; Safaei, S.; Loureiro, A.; da Silva, L.F.M. Design of friction stir welding for butt joining of aluminum to steel of dissimilar thickness: Heat treatment and fracture behavior. Int. J. Adv. Manuf. Technol. 2021, 112, 1951–1964. [Google Scholar] [CrossRef]
  16. Hesari, M.B.; Beygi, R.; Teixeira, T.O.G.; Marques, E.A.S.; Carbas, R.J.C.; da Silva, L.F.M. Enhancing High-Temperature Durability of Aluminum/Steel Joints: The Role of Ni and Cr in Substitutional Diffusion Within Intermetallic Compounds. Metals 2025, 15, 465. [Google Scholar] [CrossRef]
  17. Insua, P.; Nakkiew, W.; Wisittipanich, W. Post Weld Heat Treatment Optimization of Dissimilar Friction Stir Welded AA2024-T3 and AA7075-T651 Using Machine Learning and Metaheuristics. Materials 2023, 16, 2081. [Google Scholar] [CrossRef]
  18. Naumov, A.; Mertin, C.; Korte, F.; Hirt, G.; Reisgen, U. On the growth of intermetallic phases by heat treatment of friction stir welded aluminum steel joints. Prod. Eng. 2017, 11, 175–182. [Google Scholar] [CrossRef]
  19. Movahedi, M.; Kokabi, A.; Reihani, S.S.; Cheng, W.; Wang, C. Effect of annealing treatment on joint strength of aluminum/steel friction stir lap weld. Mater. Des. 2013, 44, 487–492. [Google Scholar] [CrossRef]
  20. Dong, H.; Yang, J.; Li, Y.; Xia, Y.; Hao, X.; Li, P.; Sun, D.; Hu, J.; Zhou, W.; Lei, M. Evolution of interface and tensile properties in 5052 aluminum alloy/304 stainless steel rotary friction welded joint after post-weld heat treatment. J. Manuf. Process. 2020, 51, 142–150. [Google Scholar] [CrossRef]
  21. Cao, F.; Zhang, P.; Zou, J.; Wang, T. The formation and growth of intermetallic compounds during interdiffusion of Al/Cu bimetals. Mater. Res. Express 2022, 9, 056503. [Google Scholar] [CrossRef]
  22. Beygi, R.; Carbas, R.; Barbosa, A.; Marques, E.; da Silva, L. A comprehensive analysis of a pseudo-brittle fracture at the interface of intermetallic of η and steel in aluminum/steel joints made by FSW: Microstructure and fracture behavior. Mater. Sci. Eng. A 2021, 824, 141812. [Google Scholar] [CrossRef]
  23. Beygi, R.; Carbas, R.; Marques, E.; Barbosa, A.; Kasaei, M.; da Silva, L. Mechanism of toughness enhancement of brittle fracture by intermittent η-intermetallic in Al/Cu joint made by FSW. Mater. Sci. Eng. A 2024, 890, 145907. [Google Scholar] [CrossRef]
  24. Hwang, W.-S.; Wu, T.-I.; Sung, W.-C. Effects of heat treatment on mechanical property and microstructure of aluminum/stainless steel bimetal plate. J. Eng. Mater. Technol. 2012, 134, 014501. [Google Scholar] [CrossRef]
  25. Wang, C.; Deng, J.; Dong, C.; Zhao, Y. Numerical Simulation and Experimental Studies on Stationary Shoulder Friction Stir Welding of Aluminum Alloy T-Joint. Front. Mater. 2022, 9, 898929. [Google Scholar] [CrossRef]
  26. Koopas, R.N.; Rezaei, S.; Rauter, N.; Ostwald, R.; Lammering, R. Comparative Analysis of Phase-Field and Intrinsic Cohesive Zone Models for Fracture Simulations in Multiphase Materials with Interfaces: Investigation of the Influence of the Microstructure on the Fracture Properties. Appl. Sci. 2025, 15, 160. [Google Scholar] [CrossRef]
  27. Teixeira, T.O.G.; Beygi, R.; Carbas, R.J.C.; Marques, E.A.S.; Hesari, M.B.; Kasaei, M.M.; da Silva, L.F.M. Aluminium/Steel Joints with Dissimilar Thicknesses: Enhancement of UTS and Ductility Through Making an S-Shaped Interface and a Mixed-Mode Fracture. J. Manuf. Mater. Process. 2025, 9, 120. [Google Scholar] [CrossRef]
  28. Berković, M.; Stevan, M.; Sedmak, A. Analysis of Welded Joints by Applying the Finite Element Method. ResearchGate.net. Available online: https://www.researchgate.net/profile/A-Sedmak/publication/277153060_Analysis_of_welded_joints_by_applying_the_finite_element_method/links/563ef6be08ae34e98c4dbd9e/Analysis-of-welded-joints-by-applying-the-finite-element-method.pdf (accessed on 4 November 2025).
  29. ASTM E8/E8M-13a; Standard Test Methods for Tension Testing of Metallic Materials. ASTM International: West Conshohocken, PA, USA, 2013.
  30. ASTM E384-17; Standard Test Method for Microindentation Hardness of Materials. ASTM International: West Conshohocken, PA, USA, 2017.
  31. Mitra, R. Structural Intermetallics and Intermetallic Matrix Composites; CRC Press: Boca Raton, FL, USA, 2015. [Google Scholar]
  32. Wang, T.; Sidhar, H.; Mishra, R.S.; Hovanski, Y.; Upadhyay, P.; Carlson, B. Evaluation of intermetallic compound layer at aluminum/steel interface joined by friction stir scribe technology. Mater. Des. 2019, 174, 107795. [Google Scholar] [CrossRef]
  33. Jindal, V.; Srivastava, V.; Das, A.; Ghosh, R. Reactive diffusion in the roll bonded iron–aluminum system. Mater. Lett. 2006, 60, 1758–1761. [Google Scholar] [CrossRef]
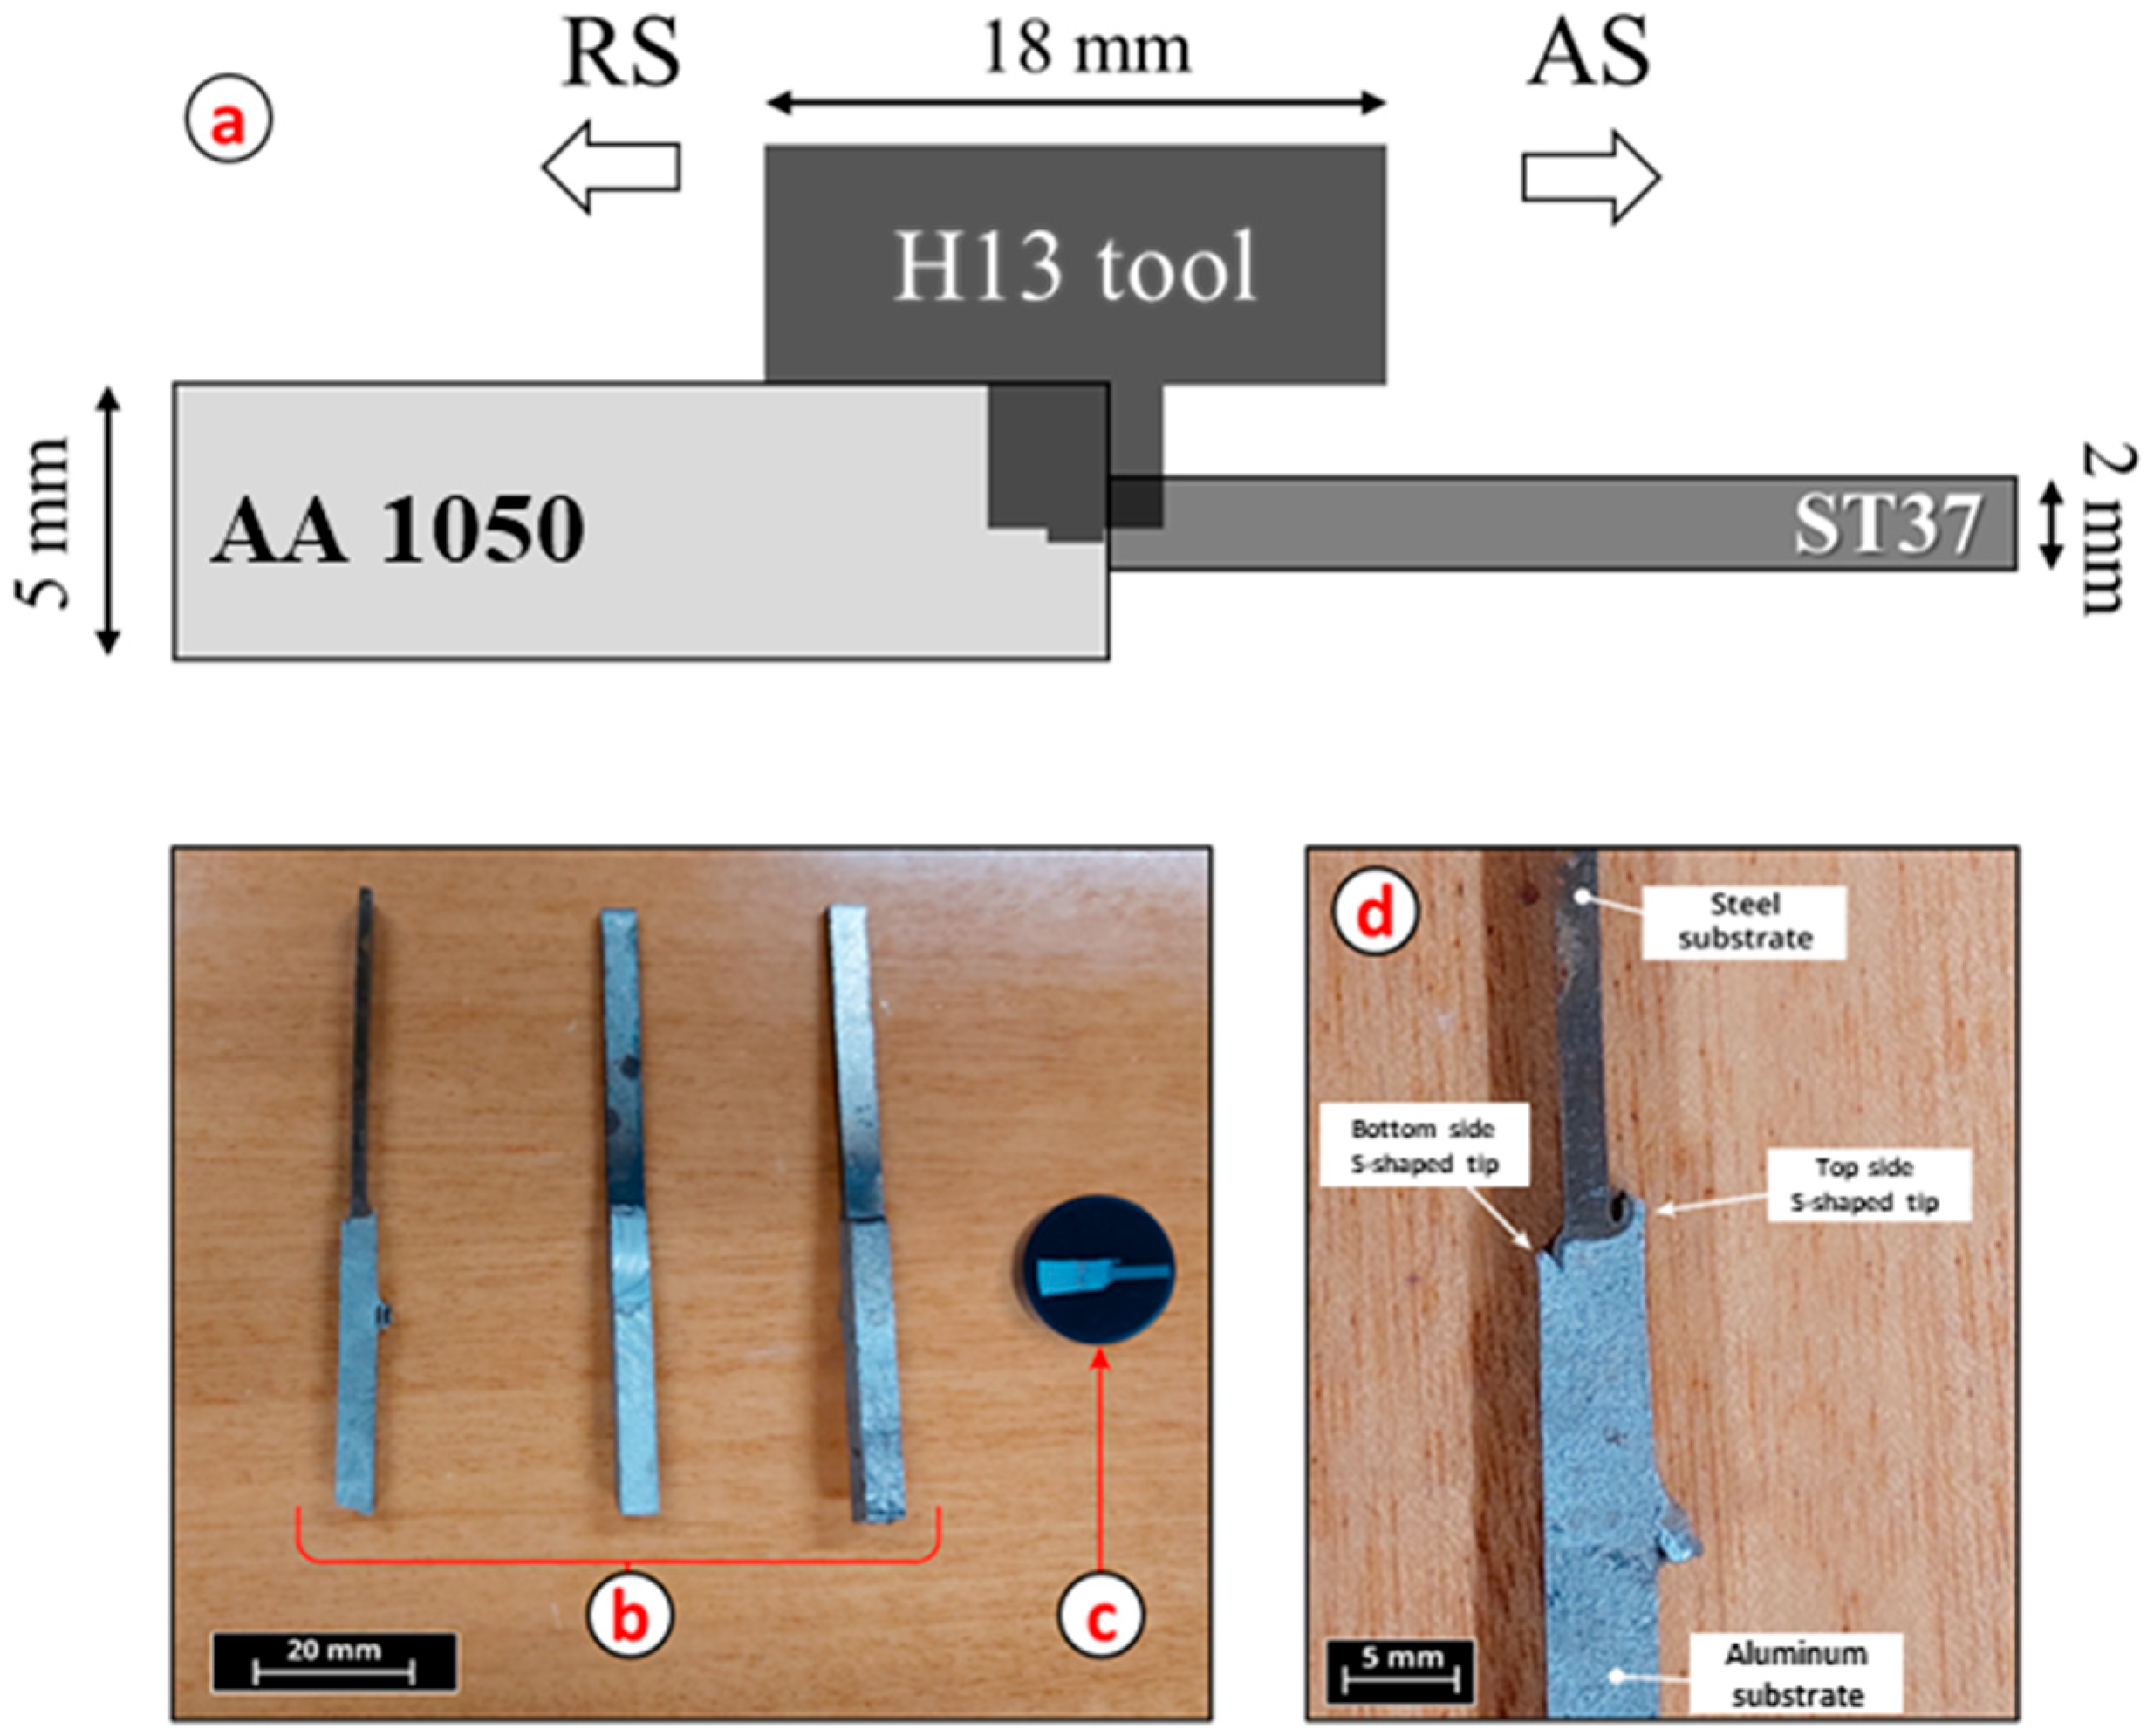
Figure 1. (a) Schematic of Al/St configuration during FSW; (b) example of the specimens used for tensile testing and fractography; (c) sample for microstructure analysis and hardness measurements; and (d) front view of the Al/St S-shaped interface.
Jmmp 09 00381 g001
Figure 2. Schematic of the post-weld heat treatment pairs.
Jmmp 09 00381 g002
Figure 3. (a) Specimens and sample configuration; (b) a thermocouple attached to one of the specimens at the interface of the joint; (c) close-up of the thermocouple tip located at the joint; (d) preparation for post-weld heat treatment, with (e) aluminum foil wrap, (f) steel plate, and (g) thermometer used in the preparation.
Jmmp 09 00381 g003
Figure 4. Joint interface with the represented examination zones U, M, and L (SEM image in BSE mode of the joint, at 35× magnification).
Jmmp 09 00381 g004
Figure 5. Schematic representation of the microhardness lines measurements U, M, and B.
Jmmp 09 00381 g005
Figure 6. Joint geometry used in the numerical model, in Abaqus CAE/Explicit.
Jmmp 09 00381 g006
Figure 7. Bilinear traction–separation law diagram.
Jmmp 09 00381 g007
Figure 8. SEM images of the interface of the as-welded joint taken from (a,b) upper part (zone U), (c,d) middle part (zone M), and (e,f) lower part (zone L).
Jmmp 09 00381 g008
Figure 9. Sample III (100 °C/90 min) SEM images in BSE mode taken from the joint interfaces, (a) in macro scale, (b) Line-scan EDS analysis taken across the IMC layer of zone M. (c,d) zone U, (e,f) zone M, and (g,h) zone L.
Jmmp 09 00381 g009
Figure 10. Sample VI (250 °C/90 min) SEM images in BSE mode taken from the joint interfaces, (a) in macro scale, (b) Line-scan EDS analysis taken across the IMC layer of zone M. (c,d) zone U, (e,f) zone M, and (g,h) zone L.
Jmmp 09 00381 g010
Figure 11. Sample VIII (400 °C/60 min) SEM images in BSE mode taken from the joint interfaces, (a) in macro scale, (b) Line-scan EDS analysis taken across the IMC layer of zone M. (c,d) zone U, (e,f) zone M, and (g,h) zone L.
Jmmp 09 00381 g011
Figure 12. Average IMC thickness of three zones of as-welded and heat-treated samples.
Jmmp 09 00381 g012
Figure 13. Q and K0 at 373–723 K for upper, middle and lower zone (ac) at 30 min, (df) at 60 min and (gi) at 90 min.
Jmmp 09 00381 g013
Figure 14. Parabolic rate constant, activation energy, and k0 from (a,b) upper zone, (c,d) middle zone, and (e,f) lower zone.
Jmmp 09 00381 g014
Figure 15. Vickers microhardness along the interface length of the three zones of as-welded, 100 °C, 250 °C, and 400 °C for (a) upper zone, (b) middle zone and (c) lower zone.
Jmmp 09 00381 g015
Figure 16. Load–extension curve obtained during tensile testing of sample I.
Jmmp 09 00381 g016
Figure 17. Plotted average main failure loads and IMC layer thickness at the middle zone, with respective trend lines.
Jmmp 09 00381 g017
Figure 18. Specimens III • • and III • • • tensile test video frames before loading (a,d), at main failure zone and (b,e), at the yielding of the Al1050 tips of the joint interface (c,f), respectively.
Jmmp 09 00381 g018
Figure 19. SEM imaging, in backscattering mode at 35× magnification of specimen VI (250 °C/90 min) from (a) steel side, and (b) aluminum side.
Jmmp 09 00381 g019
Figure 20. Schematic representation of the applied forces in the bottom (a), middle (b), and top (c) zones of the joint interface. The IMC layer is represented in yellow.
Jmmp 09 00381 g020
Figure 21. Cohesive surface damage initiation (CSMAXSCRT) results of the Al1050 substrate interface from the tensile test simulation. (ad) correspond to different stages of fracture from beginning to final failure.
Jmmp 09 00381 g021
Figure 22. Plastic strain equivalent (PEEQ) results of the tensile test simulation. (ad) correspond to different stages of fracture from beginning to final failure.
Jmmp 09 00381 g022
Figure 23. Cohesive damage (CSDMG) results for the joint interface. Cut view of the last simulation.
Jmmp 09 00381 g023
Table 1. Mechanical properties and chemical composition of St37 carbon steel and 1050 Aluminum [28].
St37 Carbon Steel1050 Aluminum
Tensile strength—370 MPaTensile strength—100–135 MPa
Yielding strength—300 MPaYielding strength—85 MPa
Vickers hardness—120 HVVickers hardness—41 HV
Chemical compositionChemical composition
Fe: 99.43–99.75%
C: 0.08%
Mn: 0.25–0.4%
S: 0.05%
P: 0.04%
Al: 99.5 %
Si: 0.25 %
Fe: 0.40 %
Cu: 0.05 %
Mn: 0.05 %
Mg: 0.05 %
Zn: 0.07 %
Ti: 0.05 %
Others: 0.03 %
Table 2. Material properties input into the numerical model for the substrates [28].
MaterialYoung’s Modulus [GPa]Poisson’s Ratio Mass Density [gr/cm3]
Al1050710.332.71
St372070.287.80
Table 3. Activation energy (Q) and K0 for each zone in AA1050/St37 FSW joint.
ZoneEquationQ (J/k.mol)K0 (m2/s)Arrhenius Equation
Upper Y = −404.41x − 34.2943362.261.27 × 10−15k = 1.27 × 10 15 e x p   ( 3362.26 R T )
MiddleY = −661.94x − 35.2235503.365.04 × 10−16k = 5.04 × 10 16 e x p   ( 5503.36 R T )
LowerY = −540.29x − 34.8374491.977.42 × 10−16k = 7.42 × 10 16 e x p   ( 4491.97 R T )
Table 4. Percentage of decrease in strength by post-weld heat treatment at 400 °C for 90 min with respect to the as-welded sample.
Percentage Reduction in UTSReference
41% [16]
23% Present study
Disclaimer/Publisher’s Note: The statements, opinions and data contained in all publications are solely those of the individual author(s) and contributor(s) and not of MDPI and/or the editor(s). MDPI and/or the editor(s) disclaim responsibility for any injury to people or property resulting from any ideas, methods, instructions or products referred to in the content.