Article

Hindering Effect of Solid-Solutioning on Intermetallic Growth in Aluminum–Matrix Composite Reinforced with Mechanically Alloyed Ni-Cu Particles

by
Masih Bolhasani Hesari
1,
Reza Beygi
1,*,
Ali Bayrami
1,
Mohammad Mehdi Kasaei
2,*,
Majid Zarezade Mehrizi
1,
Eduardo A. S. Marques
3 and
Lucas F. M. da Silva
3
1
Department of Materials Engineering and Metallurgy, Faculty of Engineering, Arak University, Arak 3815688349, Iran
2
Institute of Science and Innovation in Mechanical and Industrial Engineering (INEGI), Rua Dr. Roberto Frias, 4200-465 Porto, Portugal
3
Department of Mechanical Engineering, Faculty of Engineering, University of Porto, Rua Dr. Roberto Frias, 4200-465 Porto, Portugal
*
Authors to whom correspondence should be addressed.
J. Manuf. Mater. Process. 2025, 9(11), 364; https://doi.org/10.3390/jmmp9110364
Submission received: 26 September 2025 / Revised: 23 October 2025 / Accepted: 27 October 2025 / Published: 4 November 2025
(This article belongs to the Special Issue Innovative Approaches in Metal Forming and Joining Technologies)

Abstract

In the present study, aluminum matrix composites (AMCs) were fabricated by friction stir processing (FSP) using Ni-Cu particles. Ni-Cu particles were added to the Al matrix in two ways. First, without any treatment and in the form of a mixture of as-received powders. Second, treated through mechanical alloying to form Monel solid-solution particles. The particles were added to a groove to be processed by the FSP tool to produce a local AMC. To investigate the kinetics of intermetallic compounds (IMCs) growth in reinforcement particles, the produced AMCs were annealed at 500 °C for 2 h. To characterize the reinforcing particles, several analyses were performed on the samples. Field-emission scanning electron microscopy (FE-SEM) was used to study the size, morphology, and IMC thickness. TEM was performed to characterize the IMCs through high-resolution chemical analyses. Tensile testing was used to understand the mechanical properties and fracture behavior of AMCs. Tensile testing revealed a noticeable improvement in strength for the as-mixed sample, with a UTS of 90.3 MPa, approximately 22% higher than that of the base aluminum. In contrast, the mechanical alloying sample with annealing heat treatment exhibited a severe drop in ductility, with elongation decreasing from 17.98% in the as-mixed sample to 1.52%. The results showed that heat treatment thickened the IMC layer around the reinforcing particles formed during the FSP process with as-mixed particles. In the AMC reinforced with mechanically alloyed Ni-Cu powders, IMC formation during FSP was significantly suppressed compared to that of as-mixed particles, despite the finer size resulting from milling. Additionally, the heat treatment resulted in only a slight increase in IMC thickness. The IMC layer thickness after heat treatment in both the mechanically alloyed sample and the as-mixed sample was approximately 2 µm and 20–40 µm, respectively. The reason behind this difference and its effect on the fracture behavior of the composite were elaborated in this study, giving insights into metal-matrix production with controlled reaction.

1. Introduction

Aluminum and its alloys are widely used in the transportation and aerospace industries due to their low density, good ductility, and corrosion resistance. However, the increasing demand for higher strength-to-weight ratios motivates the development of reinforced aluminum matrix composites (AMCs) [1]. Reinforcing aluminum with high-strength, stiff ceramic particles, a metal matrix composite (MMC) approach, is widely used to improve mechanical properties [2,3]. These composites combine the ductility and toughness of aluminum with the high strength and stiffness of ceramic nanoparticle reinforcements such as SiC, Al2O3, CNTs, TiC, B4C, and WC [4,5,6,7,8,9], and find applications in automotive, aerospace, and rail industries. Various fabrication methods exist, including solid-, liquid-, and gas-state techniques [10,11]. The fabrication method for AMCs depends on particle type, size, and desired distribution [12]. In 2017, Josyula et al. investigated Al/TiCP by stir casting with an inert atmosphere [13]. Al/C-Al2O3 was investigated by Myalski et al. with the Liquid process [14]. A356/SiC fabricated by the squeeze casting method was studied in 2014 [15]. Methods such as Powder Metallurgy [16], Mechanical Alloying [17], Spark Plasma Sintering [18], Dissimilar Cast Bonding [19], and Serpentine Tube Pouring [20], which are related to Al/10Ce-TZP/Al2O3, Al/SiC/Graphite, Al-Si/MWCNTf, A356/SiC, and Al7075/TiB2, respectively, are other fabrication methods for AMCs. Nanoparticle reinforcements must remain chemically inert, making solid-state processes advantageous for uniform dispersion and minimal interfacial defects [21,22,23].
Friction stir processing (FSP), derived from friction stir welding, has gained attention for fabricating AMCs due to heat generation and plastic flow induced by a rotating shoulder-pin tool; tool design and process parameters critically affect material flow and particle distribution [24,25,26,27,28,29]. FSP is used with two general approaches: Fabrication of MMCs using reinforcements and surface modification [24]. Before FSP, some grooves or holes are created in the substrate to maintain reinforcements and prevent particles from scattering. Holes and grooves can be created in different ways in the workpiece. Hardness (HV) increased with the addition of ceramic reinforcement particles. It also improves mechanical properties such as ultimate tensile strength in all of the composites. When the interfacial bond (IB) and the wettability between AA6063-T6 matrix and TiC ceramic reinforcement particles are poor, the ultimate tensile strength (UTS) of the composite is lower than UTS of the base material [30]. It is clear that FSP parameters affect the quality of AMCs.
Several studies have investigated the effects of multiple passes and process parameters on aluminum matrix composites fabricated by the friction stir process. Jain et al. [30] demonstrated that, in AA1050/TiO2 composites, reinforcement particles tended to agglomerate on the advancing side (AS) during the first pass, resulting in insufficient material flow; however, changing the AS and retreating side (RS) in the second pass led to a more homogeneous particle distribution. Similarly, Eftekhari et al. [31] reported that multiple passes on Al1050/Fe3O4 composites promoted the formation of in situ intermetallic phases (Al3Fe and Al5Fe2) in the stir zone, reducing the friction coefficient from 70% in the substrate to 37% and improving the composite’s impact energy after six passes.
Panaskar et al. [32] examined the fatigue life of AA1200 with pre-drilled holes reinforced by alumina nanoparticles (<50 nm), highlighting the influence of the FSP process on structural integrity. Madhu et al. [33] further demonstrated that TiO2 particles in commercially pure aluminum were fractured into nanoscale sizes and distributed uniformly, forming Al3Ti and Al2O3 intermetallic compounds at the interface. Khorrami et al. [34] showed that tool design significantly affects particle distribution in pure aluminum; cylindrical pins tended to cause clustering on the RS at fewer passes, whereas threaded pins achieved uniform distribution with only two passes.
The influence of pin geometry has also been emphasized by Mahmoud et al. [35,36], who compared circular, threaded, triangular, and square pins in AA1050-H24 reinforced with SiC. They found that square pins produced a more homogeneous particle distribution and finer grains. Liu et al. [37] fabricated Al1016/MWCNTf composites with circular pins and multiple passes, observing strong interfacial bonding and uniform particle distribution. Thangarasu et al. [38] reported that FSP on Al1050/TiCp with controlled groove dimensions and tool parameters led to grain refinement and improved microhardness.
Other studies, such as by Yadav et al. [23], demonstrated that proper FSP conditions can eliminate undesirable intermetallic formation in Al1050/NiP composites. Similarly, Dixit et al. [39] observed that Al1100/NiTi composites fabricated by FSP avoided harmful interfacial phases. Ahmadifard et al. [40] reported that FSP on A356/TiO2 changed the dendritic substrate structure to globular, enhancing hardness from 48 HV to 73 HV. Shojaeefard et al. [41] found that good bonding between A356 and various ceramic reinforcements increased microhardness, while Gol Mohammadi et al. [42] demonstrated that increasing the number of FSP passes improved wear resistance in A413/NiP composites.
Collectively, these studies highlight the critical role of process parameters, tool design, and pass number in controlling particle distribution, interfacial bonding, and mechanical properties in friction stir-processed aluminum matrix composites. The findings provide a solid foundation for optimizing FSP conditions to achieve uniform reinforcement dispersion, desirable microstructures, and enhanced mechanical performance.
Eskandari et al. [43] fabricated AA8026 composite with TiB2, Al2O3 and TiB2/Al2O3 particles. The traverse speed and rotational speed were 40–80 mm/min and 800–1600 rpm, respectively. Reinforcement particles could be distributed into the substrate at a higher rotational speed (1600 rpm) and a lower traverse speed (40 mm/min) with multiple passes. Dinaharan et al. [44] investigated the microstructure and tensile strength of AA6082 substrate with SiC, Al2O3, TiC, B4C, and WC ceramic reinforcement particles and demonstrated that all of the reinforcement particles were distributed homogeneously in the substrate, and a good bond was established between the substrate and the ceramic particles. Kumar et al. [21] explored the effects of ball milling and particle size on microstructure and properties of AA5083/Nipowder composites by FSP. Hollow configuration was a groove (1 mm × 2 mm × 50 mm), and the average size of particles was 70 μm. In order to obtain finer Ni particles, the as-received powder was ball-milled for 20 h with a planetary mill and tungsten carbide balls, and after ball-milling, the average size was reduced to 10 μm. As a result, it was observed that the particles whose average size was reduced to 10 μm by the ball milling process were uniformly distributed in the AA5083 matrix. Ostovan et al. [45] fabricated AA5083/Al2O3 nanocomposite by FSP and ball milling process. FSP parameters were the rotational speed of 800 rpm and welding speed of 36 mm/min, and the ball-milling process was performed by a planetary milling machine for 10 h at a constant rotational speed of 300 rpm. Finally, they showed that Al2O3 nanoparticles were homogeneously dispersed within the Al5083 matrix during milling and further FSP. Narimani et al. [46] studied the microstructure and mechanical properties of AA6063/TiB2 composite by FSP. Nano composite powders were fabricated by the mechanical alloying process using a planetary ball mill with a ball/powder weight ratio of 10 at a milling speed of 350 rpm for 20 h. A groove of 4.5 mm depth and 1 mm width was drilled on the AA6063 with a thickness of 10 mm. They found that uniform distribution of TiB2 particles was achieved after 4 passes of the friction stir process, and tensile strength improved up to 70 percent by composite fabrication.
So far, the investigations on AMC production by FSP have been mainly focused on reinforcements of ceramic particles or in situ formation of intermetallic compounds (IMCs) through the addition of single-component metallic powders. It is not well addressed what in situ reactions occur when two or more single-component powders are used as reinforcement during FSP. Moreover, it is very insightful to know the difference between a mixture of single-component particles and multi-component powders. In the present study, pure Al was reinforced by FSP with a mixture of Cu and Ni powders, as well as with Cu-Ni solid-solution powders prepared by mechanical alloying. The kinetics of IMCs formation and their contribution to the mechanical properties of these 2 composites were investigated. The interfacial reaction between matrix and reinforcement and its critical role on the mechanical properties were deeply analyzed for both AMCs prepared with two powders. Also, the effect of post-FSP heat treatment on these was investigated.

2. Materials

According to Figure 1a, two AA1050 pieces were used in this research with dimensions of 100 mm × 50 mm × 4 mm. Before FSP, the AA1050 pieces were cleaned with acetone to remove surface contaminants such as grease and dust. As shown in Figure 1a, grooves with a width of 1 mm and a depth of 3 mm were created on the AA1050 sheets to preserve the reinforcement powders. A mixture of powders with 33% wt Cu and 67% wt Ni was chosen as reinforcement. Table 1 shows the chemical composition and mechanical properties of AA1050. The powders were used in two ways for the FSP process. First, the as-mixed powders. Second, the mechanically alloyed powders. To do so, the mixed powders were ball-milled by a planetary ball milling machine with stainless steel balls at a rotation speed of 360 rpm for 40 h. Additionally, the ball-to-powder ratio (BPR) was 20:1. FSP parameters, including traverse speed, rotation speed, number of passes, and tilt angle, were 37.5 mm/min, 950 rpm, 2 passes, and 2.5°, respectively. The FSP was performed in position-controlled mode, which inherently regulates tool penetration and material stirring. The plunge depth was set to 0.2 mm, and the dwell time was approximately 30 s. Although axial force was not directly measured, position control ensures consistent tool engagement and stable material flow.
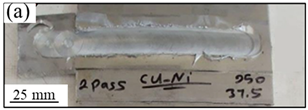
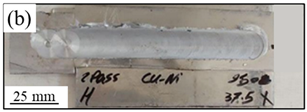
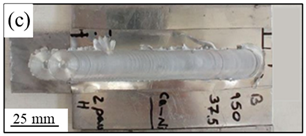
The tool probe diameter, its height, and tool shoulder diameter were 5 mm, 4.7 mm, and 18 mm, respectively. The tool was made of H13 tool steel. The FSP process was performed in two passes, with the second pass having a counter-rotational direction with respect to the first pass. Following the FSP process, some samples were heat-treated at 500 °C for 2 h to investigate the kinetics of IMCs growth. Table 2 shows the nomenclatures used for each sample. Samples B were fabricated by FSP with as-mixed powders, and samples A were fabricated with mechanically alloyed Ni-Cu powders, which were transformed into Monel powder during mechanical alloying.
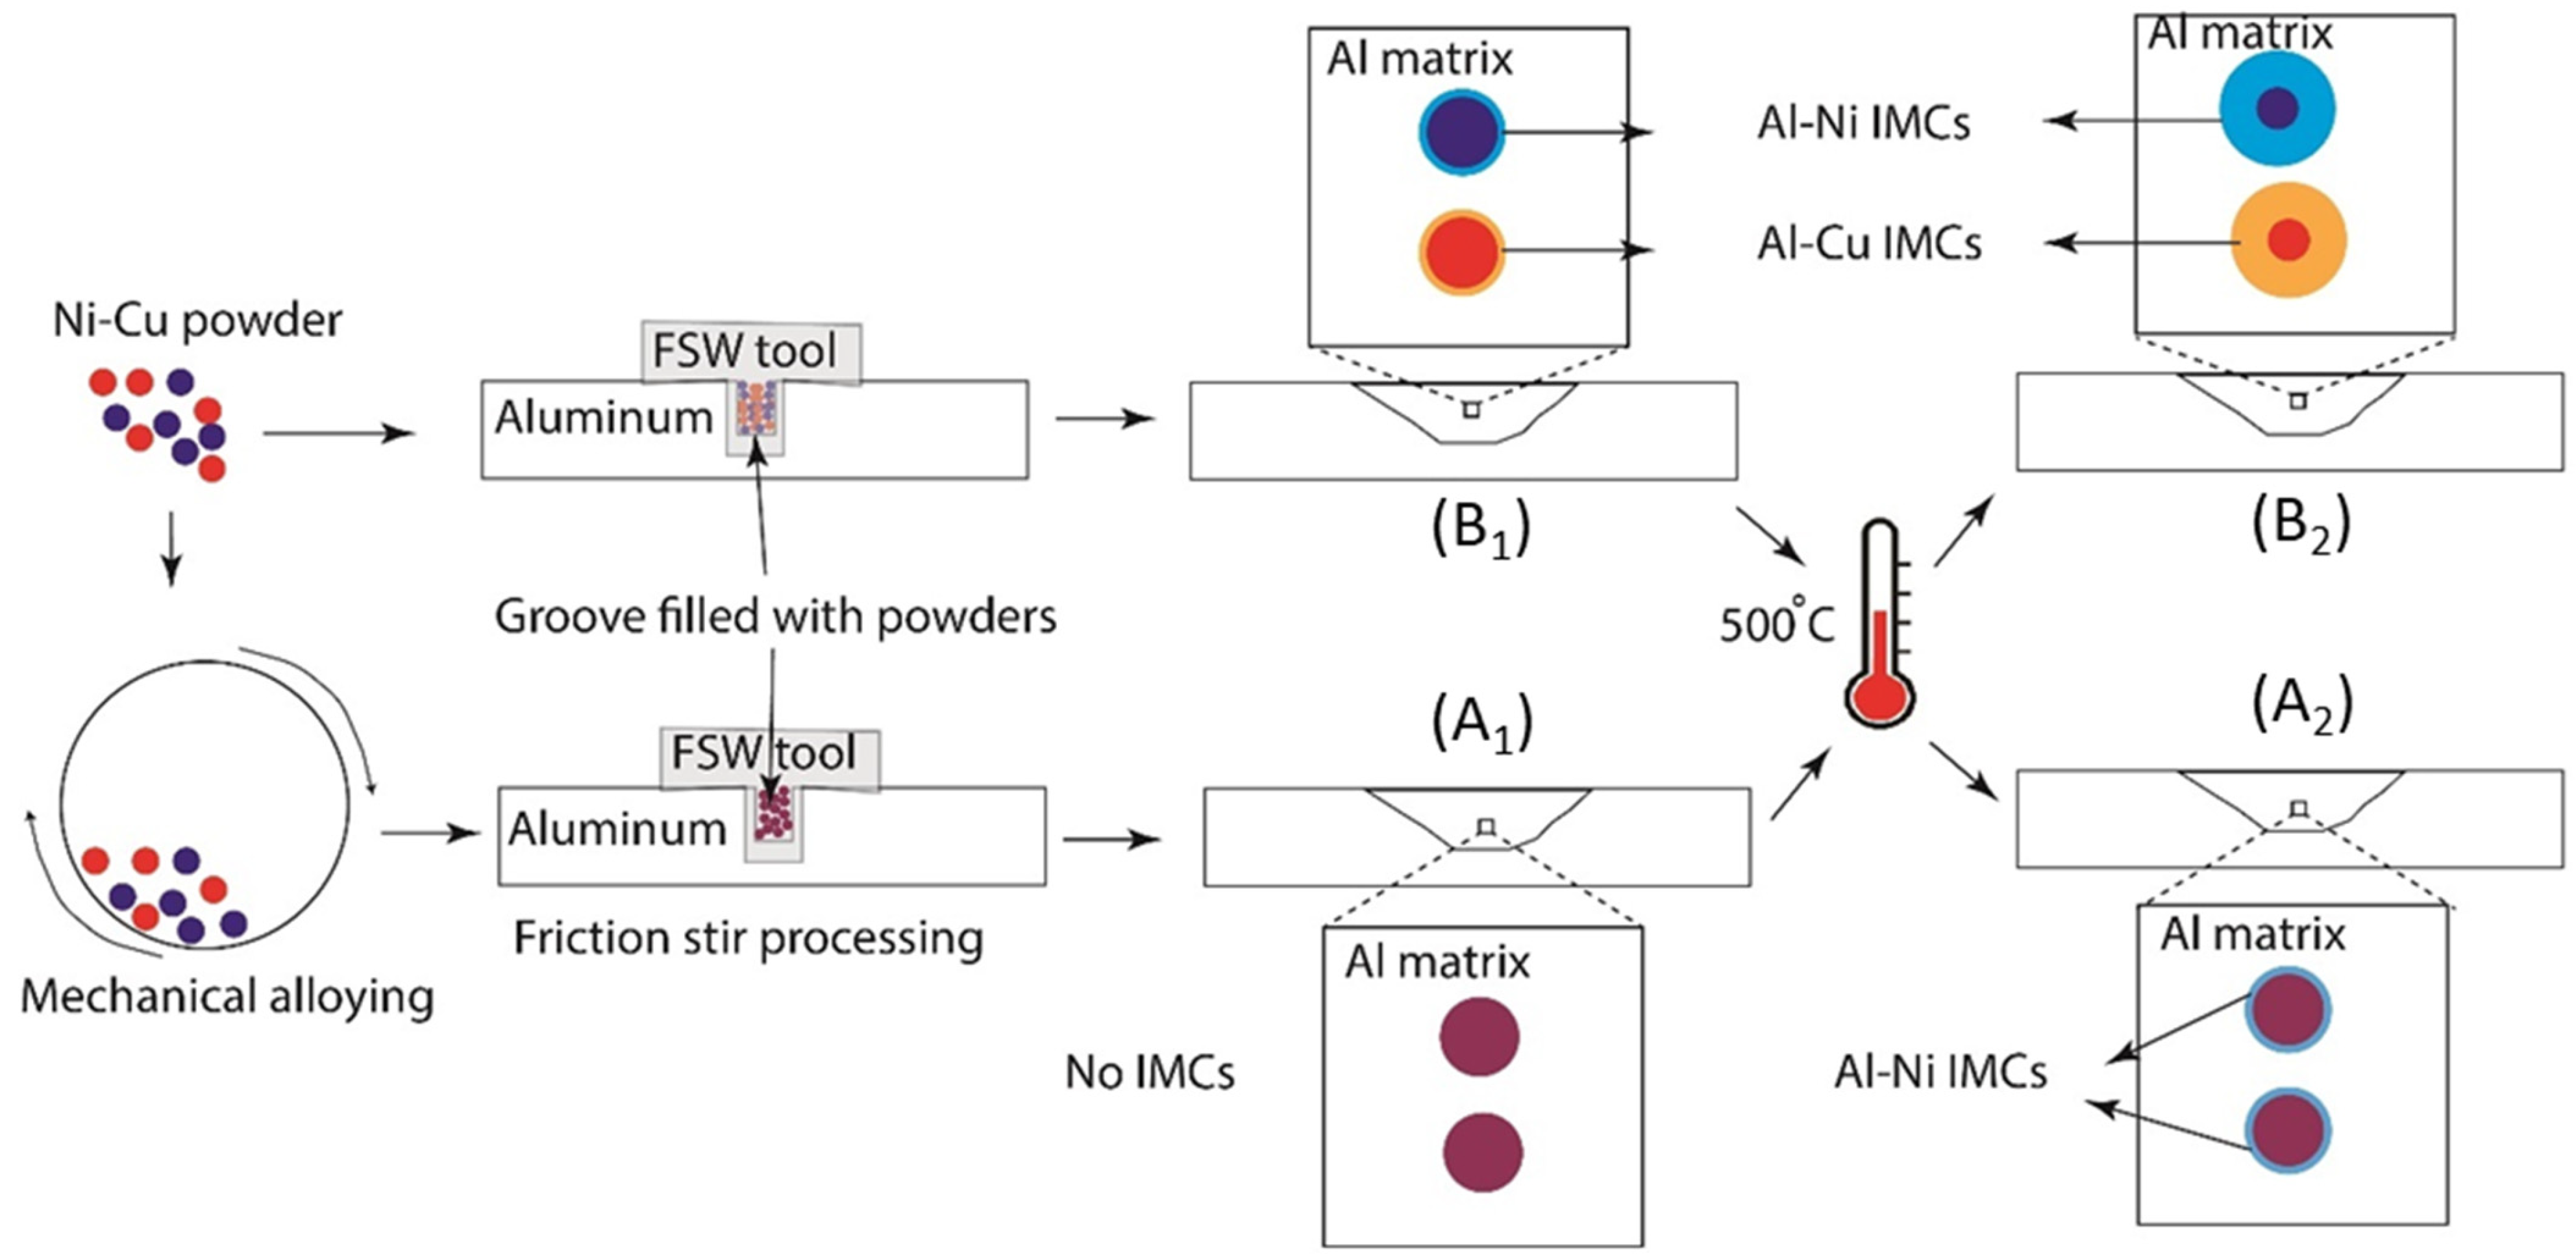
To investigate the microstructure of the samples, the final pieces were cross-cut by wire cutting, and then the surfaces of the samples were polished with 60 to 5000-grit sandpaper. Distilled water, nitric acid, hydrochloric acid, and hydrofluoric acid were used to etch the surface of the samples for 2 min. To investigate the phases and structure of the powder, X-ray diffraction analysis was used for the product obtained from the alloying process. The applied voltage was 40 kV, the current was 30 mA, the scanning rate was 1 degree/min, and the step size was 0.05 degrees/second. The analysis in this research was performed with a single beam using CuKα radiation with a wavelength of 1.54056 Ångström. FESEM was used to determine the type of intermetallic compounds (IMCs), their thickness, and the distribution of particles. The device used for these purposes was the FEI Quanta 200 FESEM. A transmission electron microscope (TEM, model Tecani G2 F20-200Kv) was used to identify the type of IMCs. To prepare the samples for TEM, the thickness of the samples was reduced to the desired size by mechanical methods. It should also be noted that in all these steps, an ultrasonic device was used to clean the samples from contamination. Furthermore, for the tensile testing, conducted in accordance with ASTM E8, a strain rate of 1 × 10⁻³ s−1 was applied to evaluate the mechanical behavior. One sample was prepared and tested for samples A1, A2, B1 and B2 to assess the influence of processing conditions on tensile properties. For the Vickers hardness testing, performed following ASTM E384, a load of 200 g was applied for each indentation to ensure accurate measurement of hardness across the processed samples. In addition, after sample failure in the tensile test, the fracture surface is investigated by a secondary electron microscope (SEM) in secondary mode to evaluate ductile or brittle fracture. The Vickers micro-hardness test was also performed on all areas, including base metal, stir zone, thermo-mechanical affected zone, and heat-affected zone, by applying a force of 200 g with a pyramid-shaped indenter and a dwell time of 25 s. Figure 2 shows a schematic of different stages of manufacturing with as-mixed and ball-milled powders and subsequent heat treatment of the Al-matrix composites.

3. Results

3.1. Investigation of Monel Powder

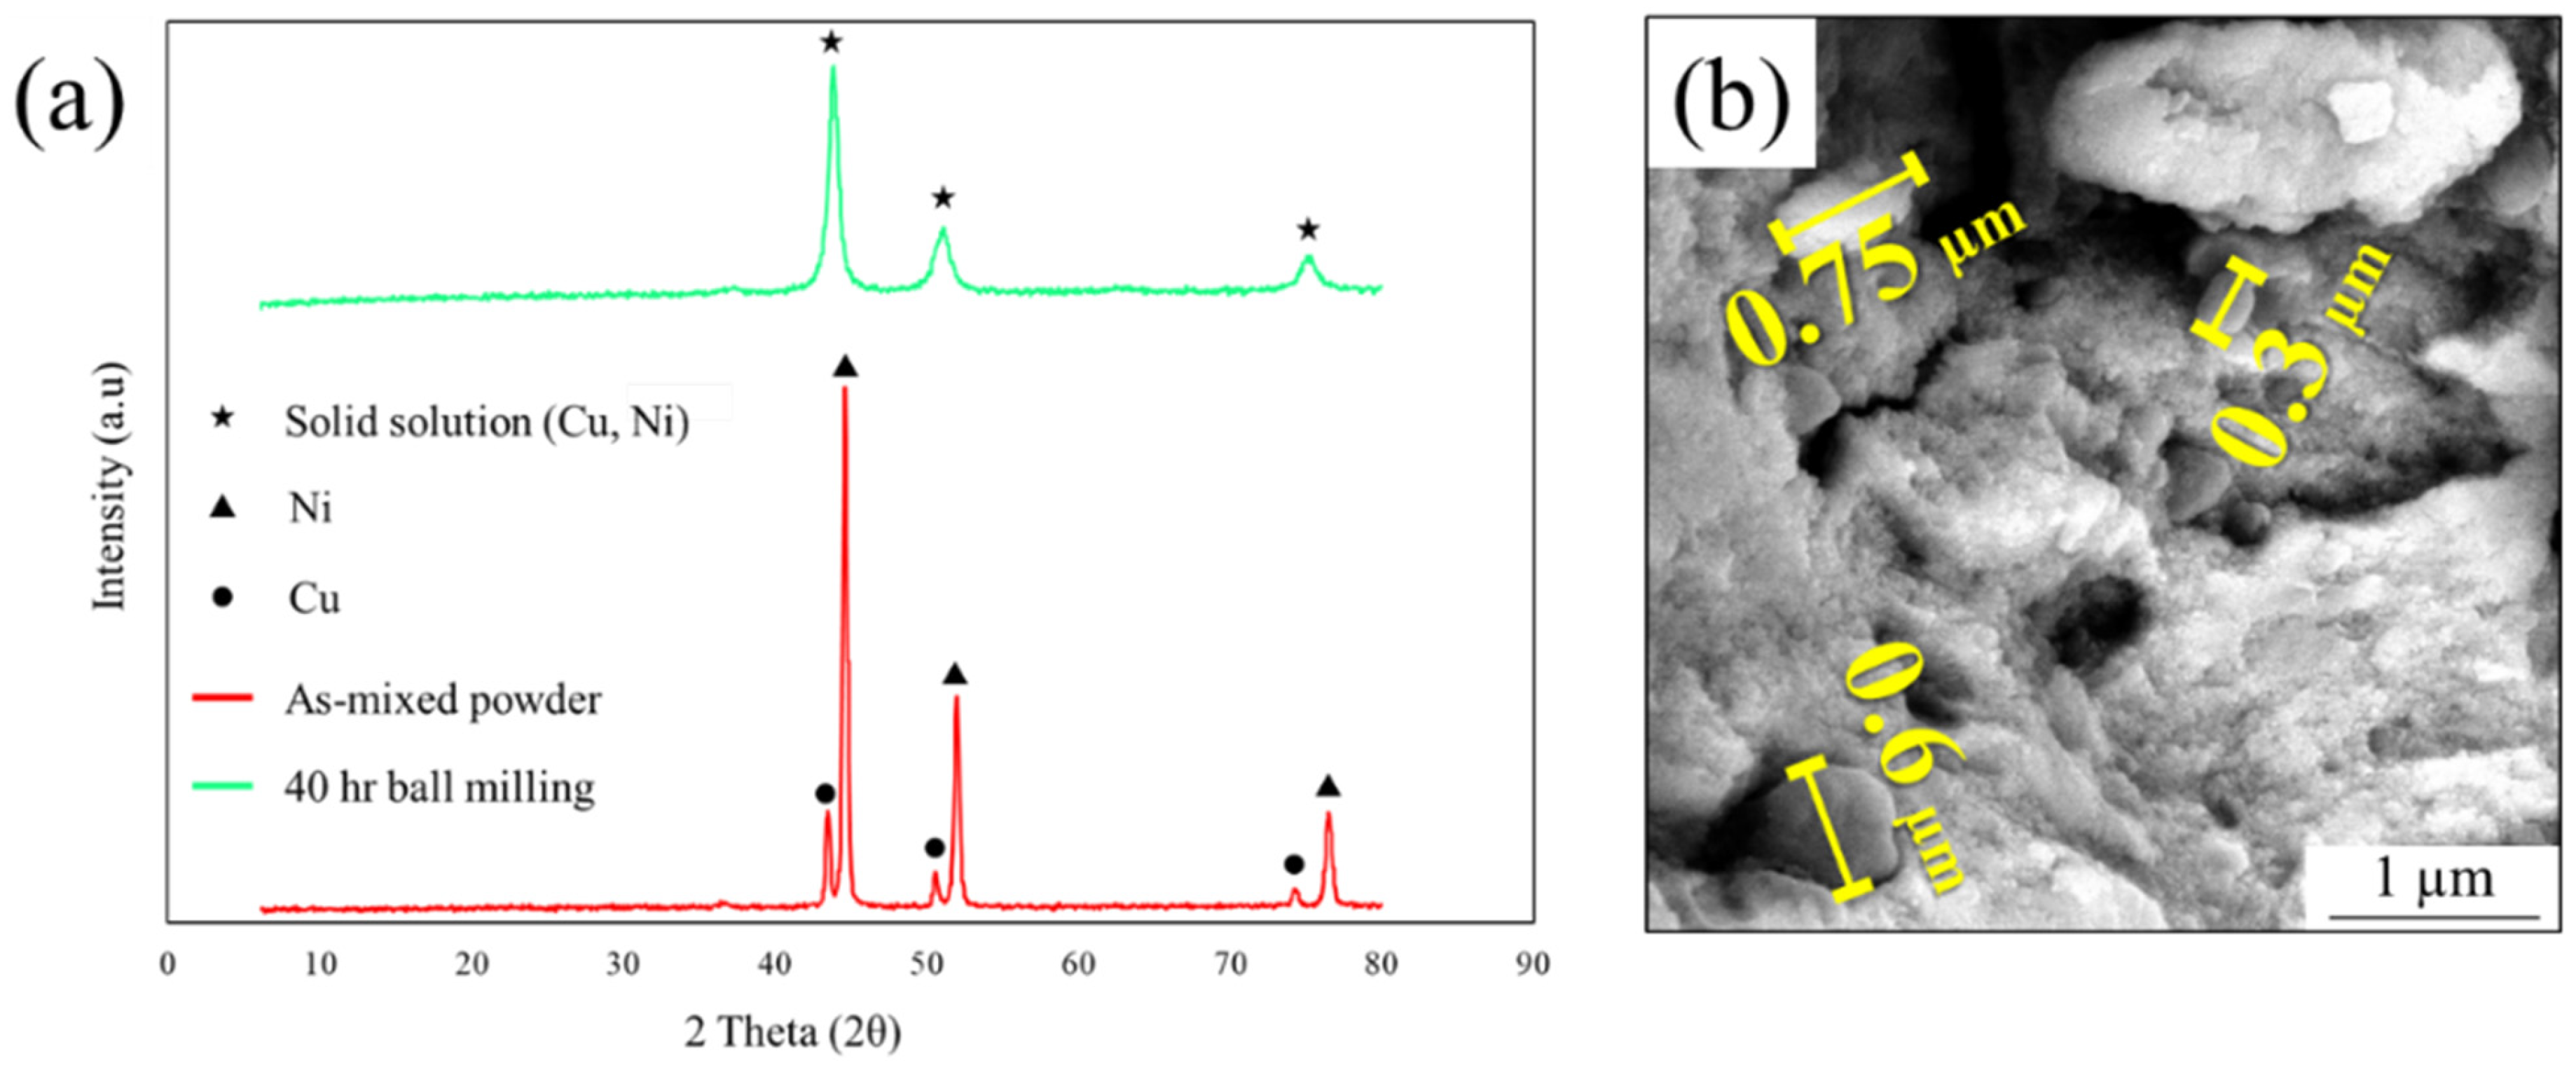
XRD analysis is prepared from (67%Ni–33% Cu) powder before and after the mechanical alloying process. As it is clear from Figure 3a, in the as-mixed powder (red line), the peaks of Cu and Ni are clearly visible, while in the powder mechanically alloyed by the ball milling machine (green line), the peaks of Cu and Ni are merged, indicating that a solid solution of Cu and Ni is formed. The shift in peak position is attributed to changes in the lattice parameter. In other words, after 40 h of ball milling, Cu and Ni powders can diffuse into each other mechanically. As-mixed Monel powder peaks are long and thin, while after 40 h of ball milling, the peaks become shorter and wider. By examining peaks in two different states, as it is clear from Figure 3a, ball-milled powder peaks shift, and this relates to internal stresses or planar faults, such as stacking faults or twinning [47]. As the peak becomes wider, the microstructure will be fine-grained. Therefore, it can be stated that, in the Monel powder mechanically alloyed by a ball milling machine for 40 h, the grain size has become smaller. In Figure 3b, SEM images in BSE mode are shown for Monel powder. As shown in Figure 3b, after 40 h of mechanical alloying, Monel particles exhibited both severe cold welding and repeated fracture. As a result, the final microstructure consisted predominantly of approximately spherical, micrometer-sized particles, while some agglomerates remained due to cold welding. This dual mechanism led to the observed particle morphology.
The identification of Miller indices (h k l) for diffraction peaks of ball-milled powder (green line) in Figure 3a is performed based on the sin2θ method according to Bragg’s law. According to Table 3, the X-ray diffraction pattern of ball-milled powder (green line) in Figure 3a indicates a face-centered cubic (FCC) structure.
The lattice parameter (ɑ) is calculated using Bragg’s law:
nλ = 2dsinθ
where λ = 1.5406 (Cu Kα), and the interplanar spacing d is determined by:
d   =   λ 2 s i n θ
For a cubic system:
ɑ   =   d h 2 × k 2 × l 2
The calculated values for each peak are summarized in Table 4:
The crystallite size of the synthesized FCC Cu-Ni alloy is estimated using the Debye–Scherrer equation:
D   =   k λ β c o s θ
where D is the average crystallite size (nm), K is the Scherrer constant (0.9), λ is the X-ray wavelength (1.5406 Cu Kα), β (rad) is the full width at half maximum (FWHM) of the diffraction peak in radians, and θ is the Bragg angle. The FWHM values are extracted from the three main peaks corresponding to the (111), (200) and (220) planes of the FCC phase. The results of the calculation are summarized in Table 5.
Average crystallite size is determined as:
D avg   =   26.3 + 22.8 + 19.8 3 = 23   n m

3.2. SEM Images

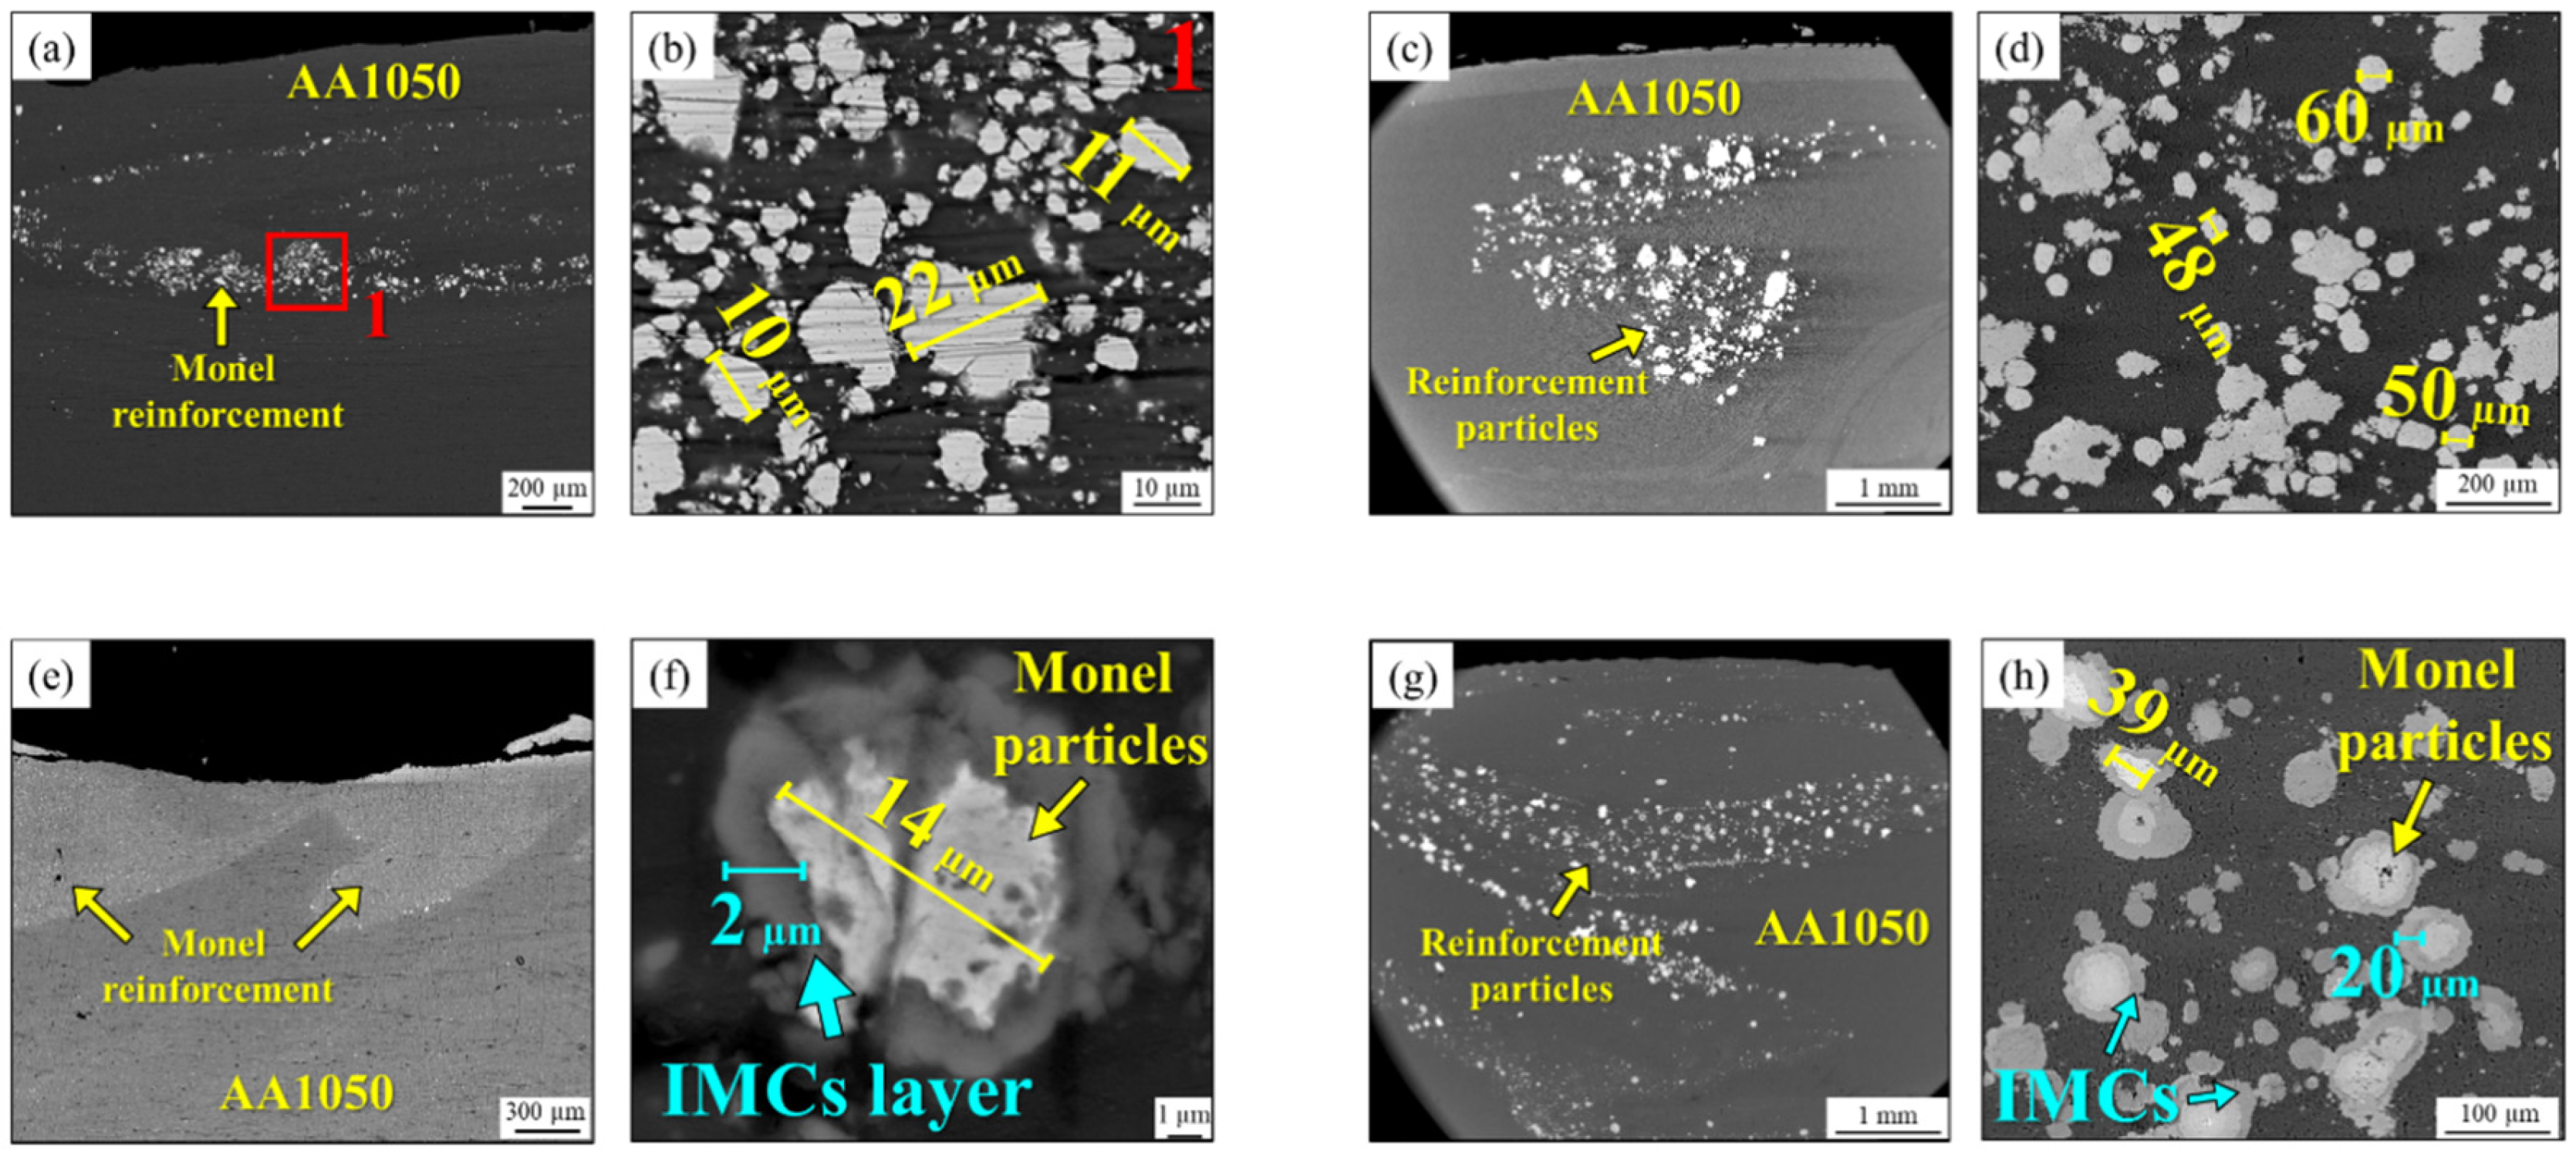
From now on, the ball-milled powders are referred to as Monel. Figure 4 shows the SEM images in BSE mode of samples A1, A2, B1, and B2. As illustrated in Figure 4a,b, Monel reinforcement particles are not uniformly distributed on a macroscopic scale in the AA1050 matrix in sample A1. However, in regions where they exist, they are dispersed uniformly on a microscopic scale. Monel reinforcement particles size varies from approximately 5–30 μm. In addition, the IMC layer has not been formed at the interface of particles/matrix in sample A1. According to Figure 4c,d, in sample B1 produced with as-mixed powders, Cu and Ni particles were not distributed uniformly and homogeneously in the AA1050 matrix on the macro scale. Particles in sample B1 were more agglomerated, and their size increased to 35–80 μm. Furthermore, the IMC layer is not visible between the particles and the matrix. To characterize the phases present in each sample, EDS analysis has been performed on different parts of the pieces.
In Figure 5, EDS analysis of sample A1 is shown. The main point to consider from Figure 5a is that the IMC layer is not formed at the interface between the reinforcement particles and the Al1050 substrate. Elemental mapping (Figure 5c,d) indicates that Ni and Cu particles formed a Ni–Cu solid solution during mechanical alloying. As shown from spot 1 of Figure 5a taken from the gray area in particles, there are 39.88% at Al, 29.97% at Cu, and 46.19% at Ni. In point 2, which is specific to reinforcement particles, 8.89% at Al, 44.92% at Ni, and 46.19% at Cu are seen. The presence of Al close to the interface of the particles is indicative of Al diffusion to the particles during FSP, which exists as a solid solution in both Cu and Ni particles. Finally, EDS analysis of point 3 is taken from the AA1050 matrix, which consists of 98.86% at Al. Figure 5b–d shows elemental mapping of Al, Ni, and Cu with purple, yellow, and green spots, respectively. Figure 5c,d indicates that an areola is observed around each Ni and Cu particle. This is indicative of the diffusion of Ni and Cu atoms into the Al matrix during FSP.
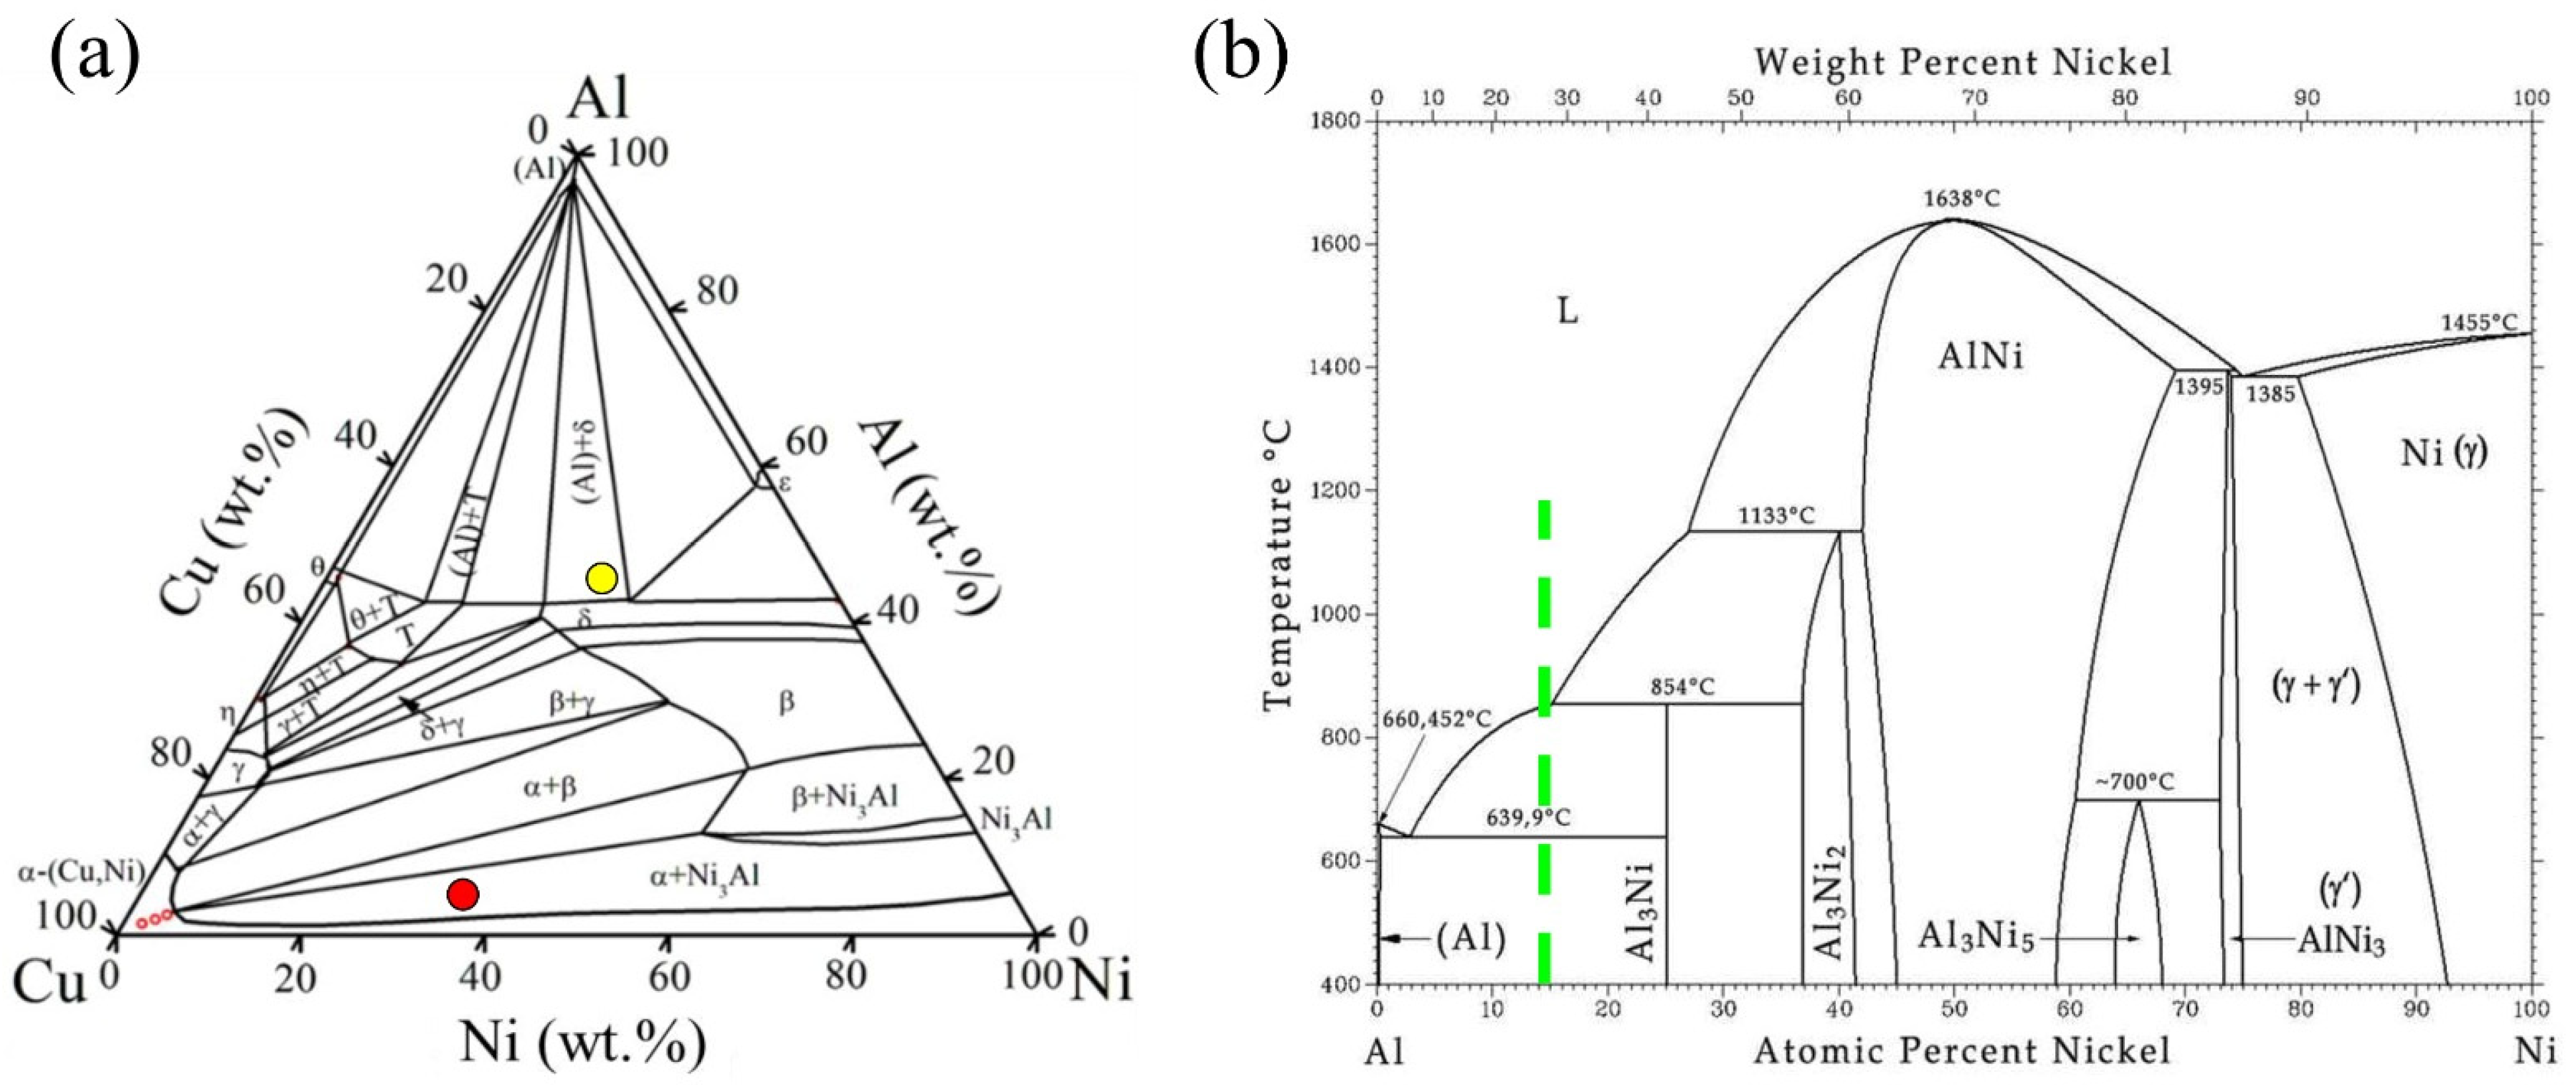
EDS analysis of sample A2 is shown in Figure 6. As shown in Figure 6a from point 1, the IMCs layer has 75.68% at Al, 17.53% at Ni, and 6.79% at Cu. The chemical composition of the IMC layer will be predicted to be AlxNiyCuz. The IMC layer with a thickness of 2 µm is formed around the particles. As it is clear from elemental mapping images shown in Figure 6b–d, Cu is present in the core of the particle, while Ni presence is extended to the surface. This implies a higher diffusion rate of Ni than Cu in Ni-Cu particles. In contrast to sample A1, an IMC layer is observed at the interface of the particles due to enhanced diffusion by annealing at 500 °C. Point 2 is located in the center of the particle and has 8.45% at Al, 32.95% at Ni, and 58.59% at Cu. As it is clear from the Al-Cu-Ni ternary phase diagram of Figure 6a, (Cu, Ni) +Ni3Al has been formed in this area (red point). The IMC layer is hence composed of Al and Ni, containing some Cu as a solid solution within it. The presence of Ni and Cu atoms in point 2 indicates that the mechanical alloying process can create Monel reinforcement. Point 3 has 85.24% at Al, 14.02% at Ni, and 0.74% at Cu. The amount of Cu in this area is low, and thus it can be considered as an interstitial solid solution in a nickel–aluminum binary alloy. Additionally, in Figure 6d, there are no effects of Cu atoms (green spot) in point 3. To determine the chemical composition of the IMC layer in point 3, the Al-Ni binary phase diagram in Figure 7b has been presented. As illustrated in Figure 7b, it can be stated that the IMCs formed in point 3 can be Al3Ni (green line).
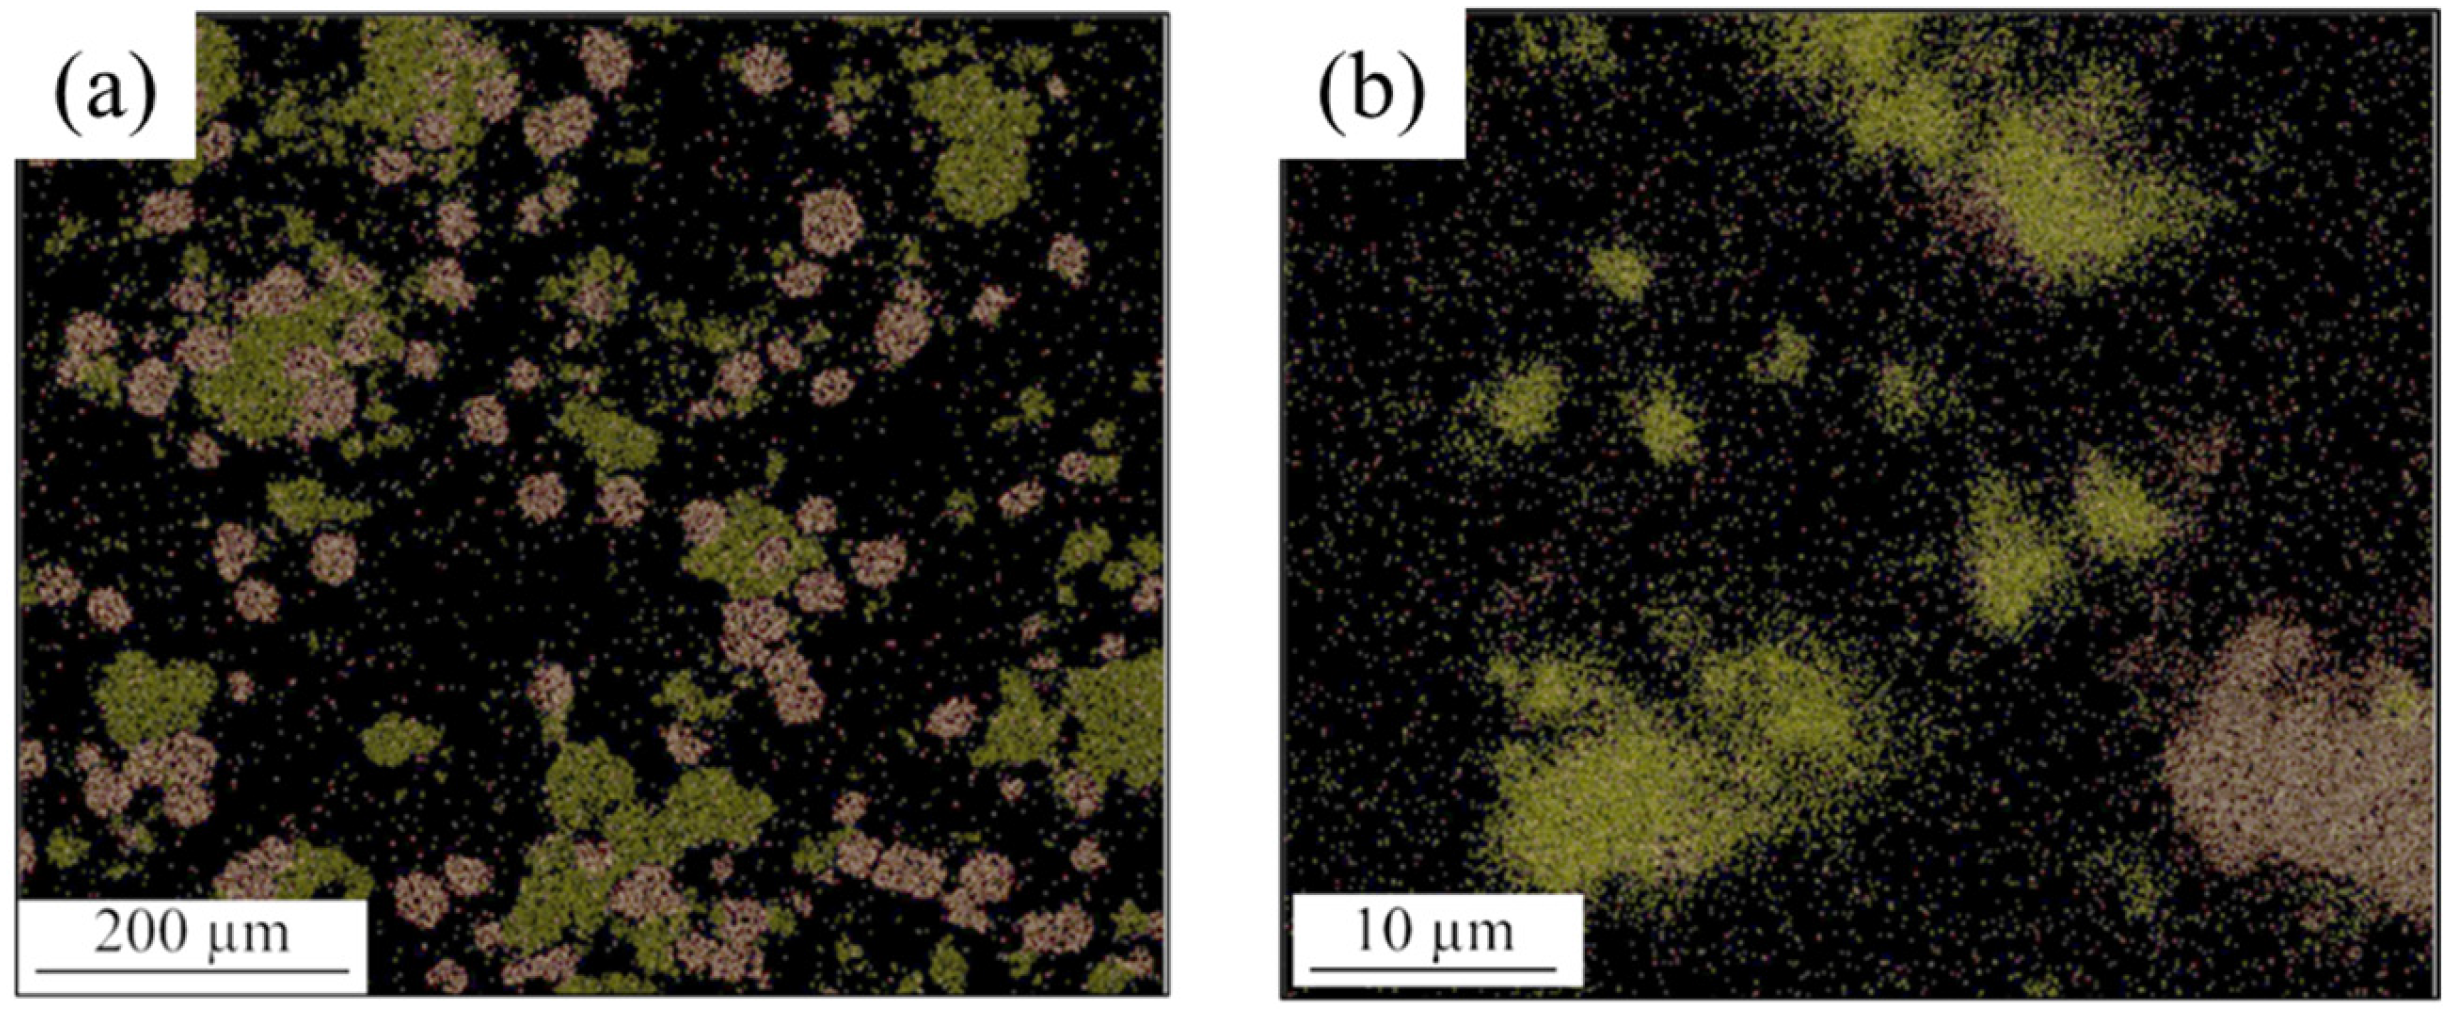
Figure 8 shows the SEM image, line scan, and elemental mapping of sample B1. Line scan analysis is shown in Figure 8a. As it is clear at the starting point, dark areas correspond to the Al matrix. Additionally, between the distances of around 5–12 μm, Cu content increases sharply, and there is no trace of the Ni peak. So, this corresponds to just a Cu particle. Finally, two small particles between the distances of 20–25 μm and 32–35 μm correspond to Ni particles. These observations show a critical difference to sample A1, wherein the particles were solid solutions of Ni-Cu. This implies that the friction stir process cannot dissolve Cu and Ni to form a Ni-Cu solution. So, it can be stated that Monel reinforcement particles have not been formed in sample B1. Considering that the temperature of the friction stir process is around 300–500 °C, there was not enough heat input and time to form the IMCs layer around the Cu and Ni particles inside the AA1050 matrix. Elemental map images in Figure 8 clearly show that Cu and Ni particles are present as separate islands. To better prove this, elemental mapping of Cu and Ni was overlapped with each other in Figure 9.
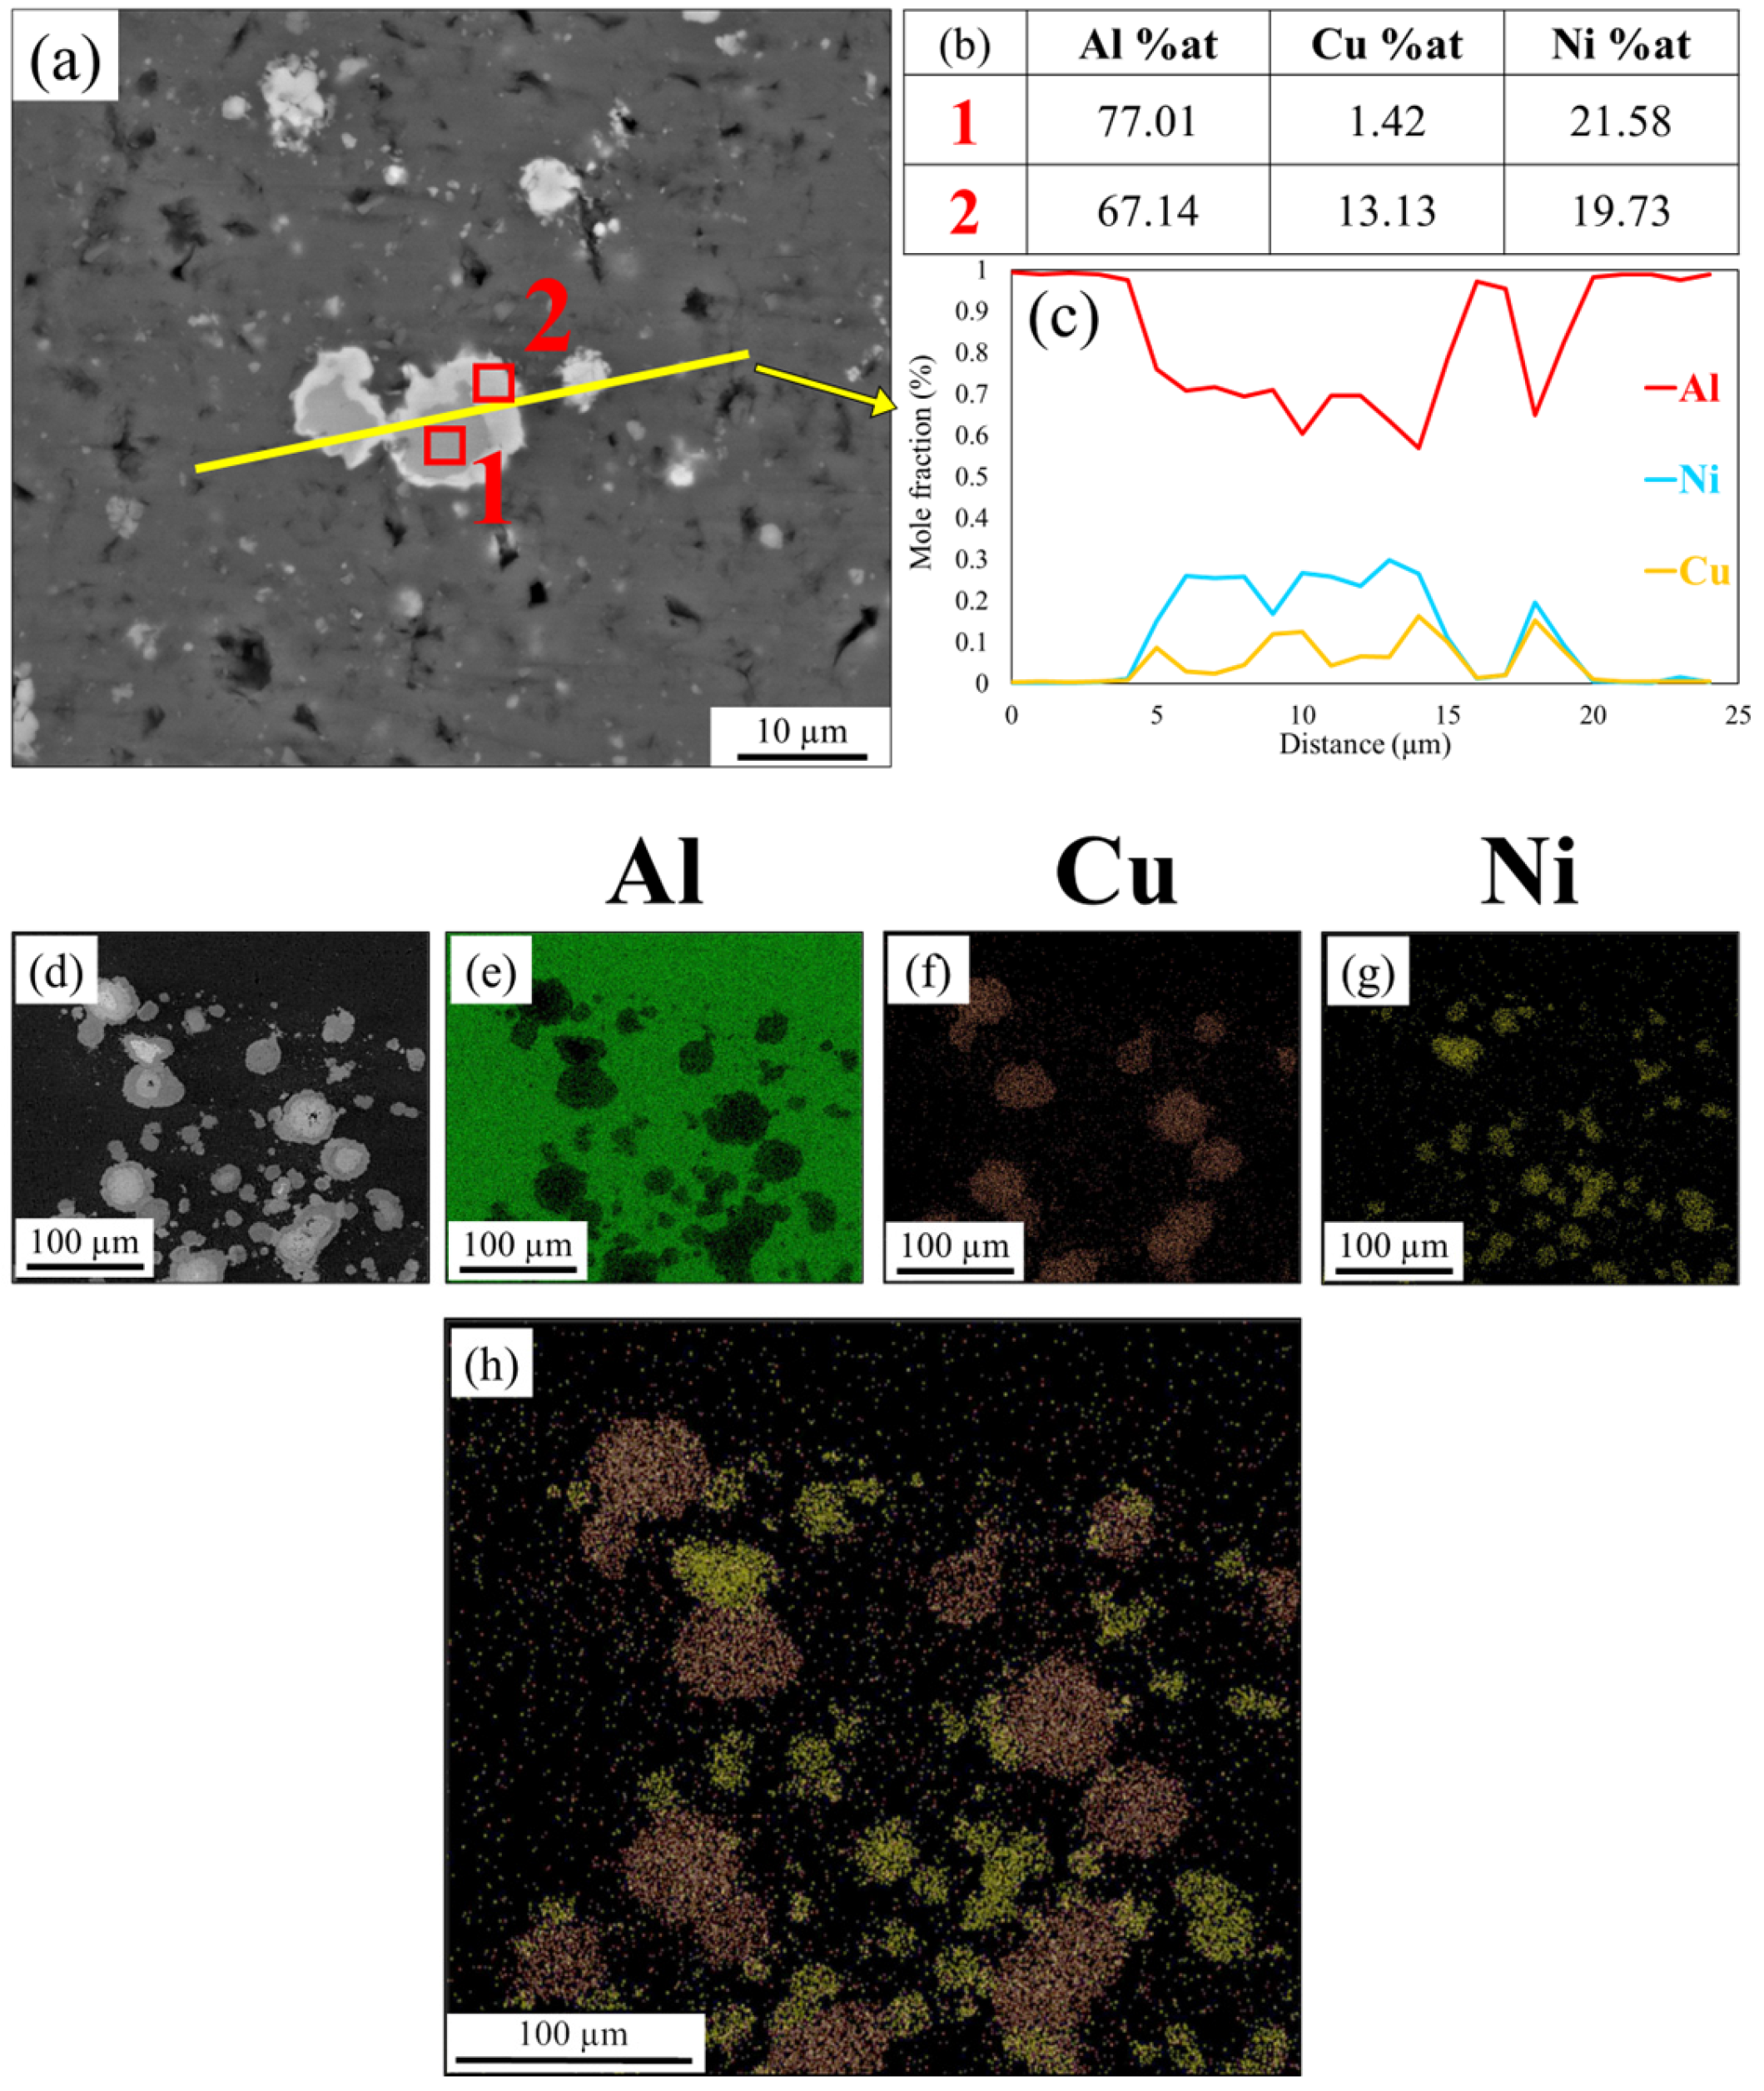
Figure 10 shows the SEM images and EDS analysis of sample B2 post-processed and annealed at 500 °C for 2 h. Firstly, the IMC layer has been formed between particles and the AA1050 matrix. Figure 10a shows the EDS analysis of Al, Cu, and Ni for point 1 (core) and point 2 (IMCs layer). The main point to consider is that a temperature of 500 °C leads to increased Cu and Ni diffusion. Therefore, as is clear from the elemental mapping of Figure 10f,g, a low amount of Cu and Ni can be present in each particle atomically. Point 2, which relates to the IMC layer between the matrix and Ni cores, consists of 67.14% at Al, 19.73% at Ni, and 13.13% at Cu. So, it can be predicted that, according to Figure 10a (yellow point), the chemical composition of the IMCs layer is Al + δ. The significant point is that IMC layers are complex of Al-Ni and Al-Cu because the IMC layers are formed between Nip/AA1050 and Cup/AA1050. To determine the effect of annealing heat treatment at 500 °C on diffusion, the elemental mapping of Cu and Ni is overlapped in Figure 10h.
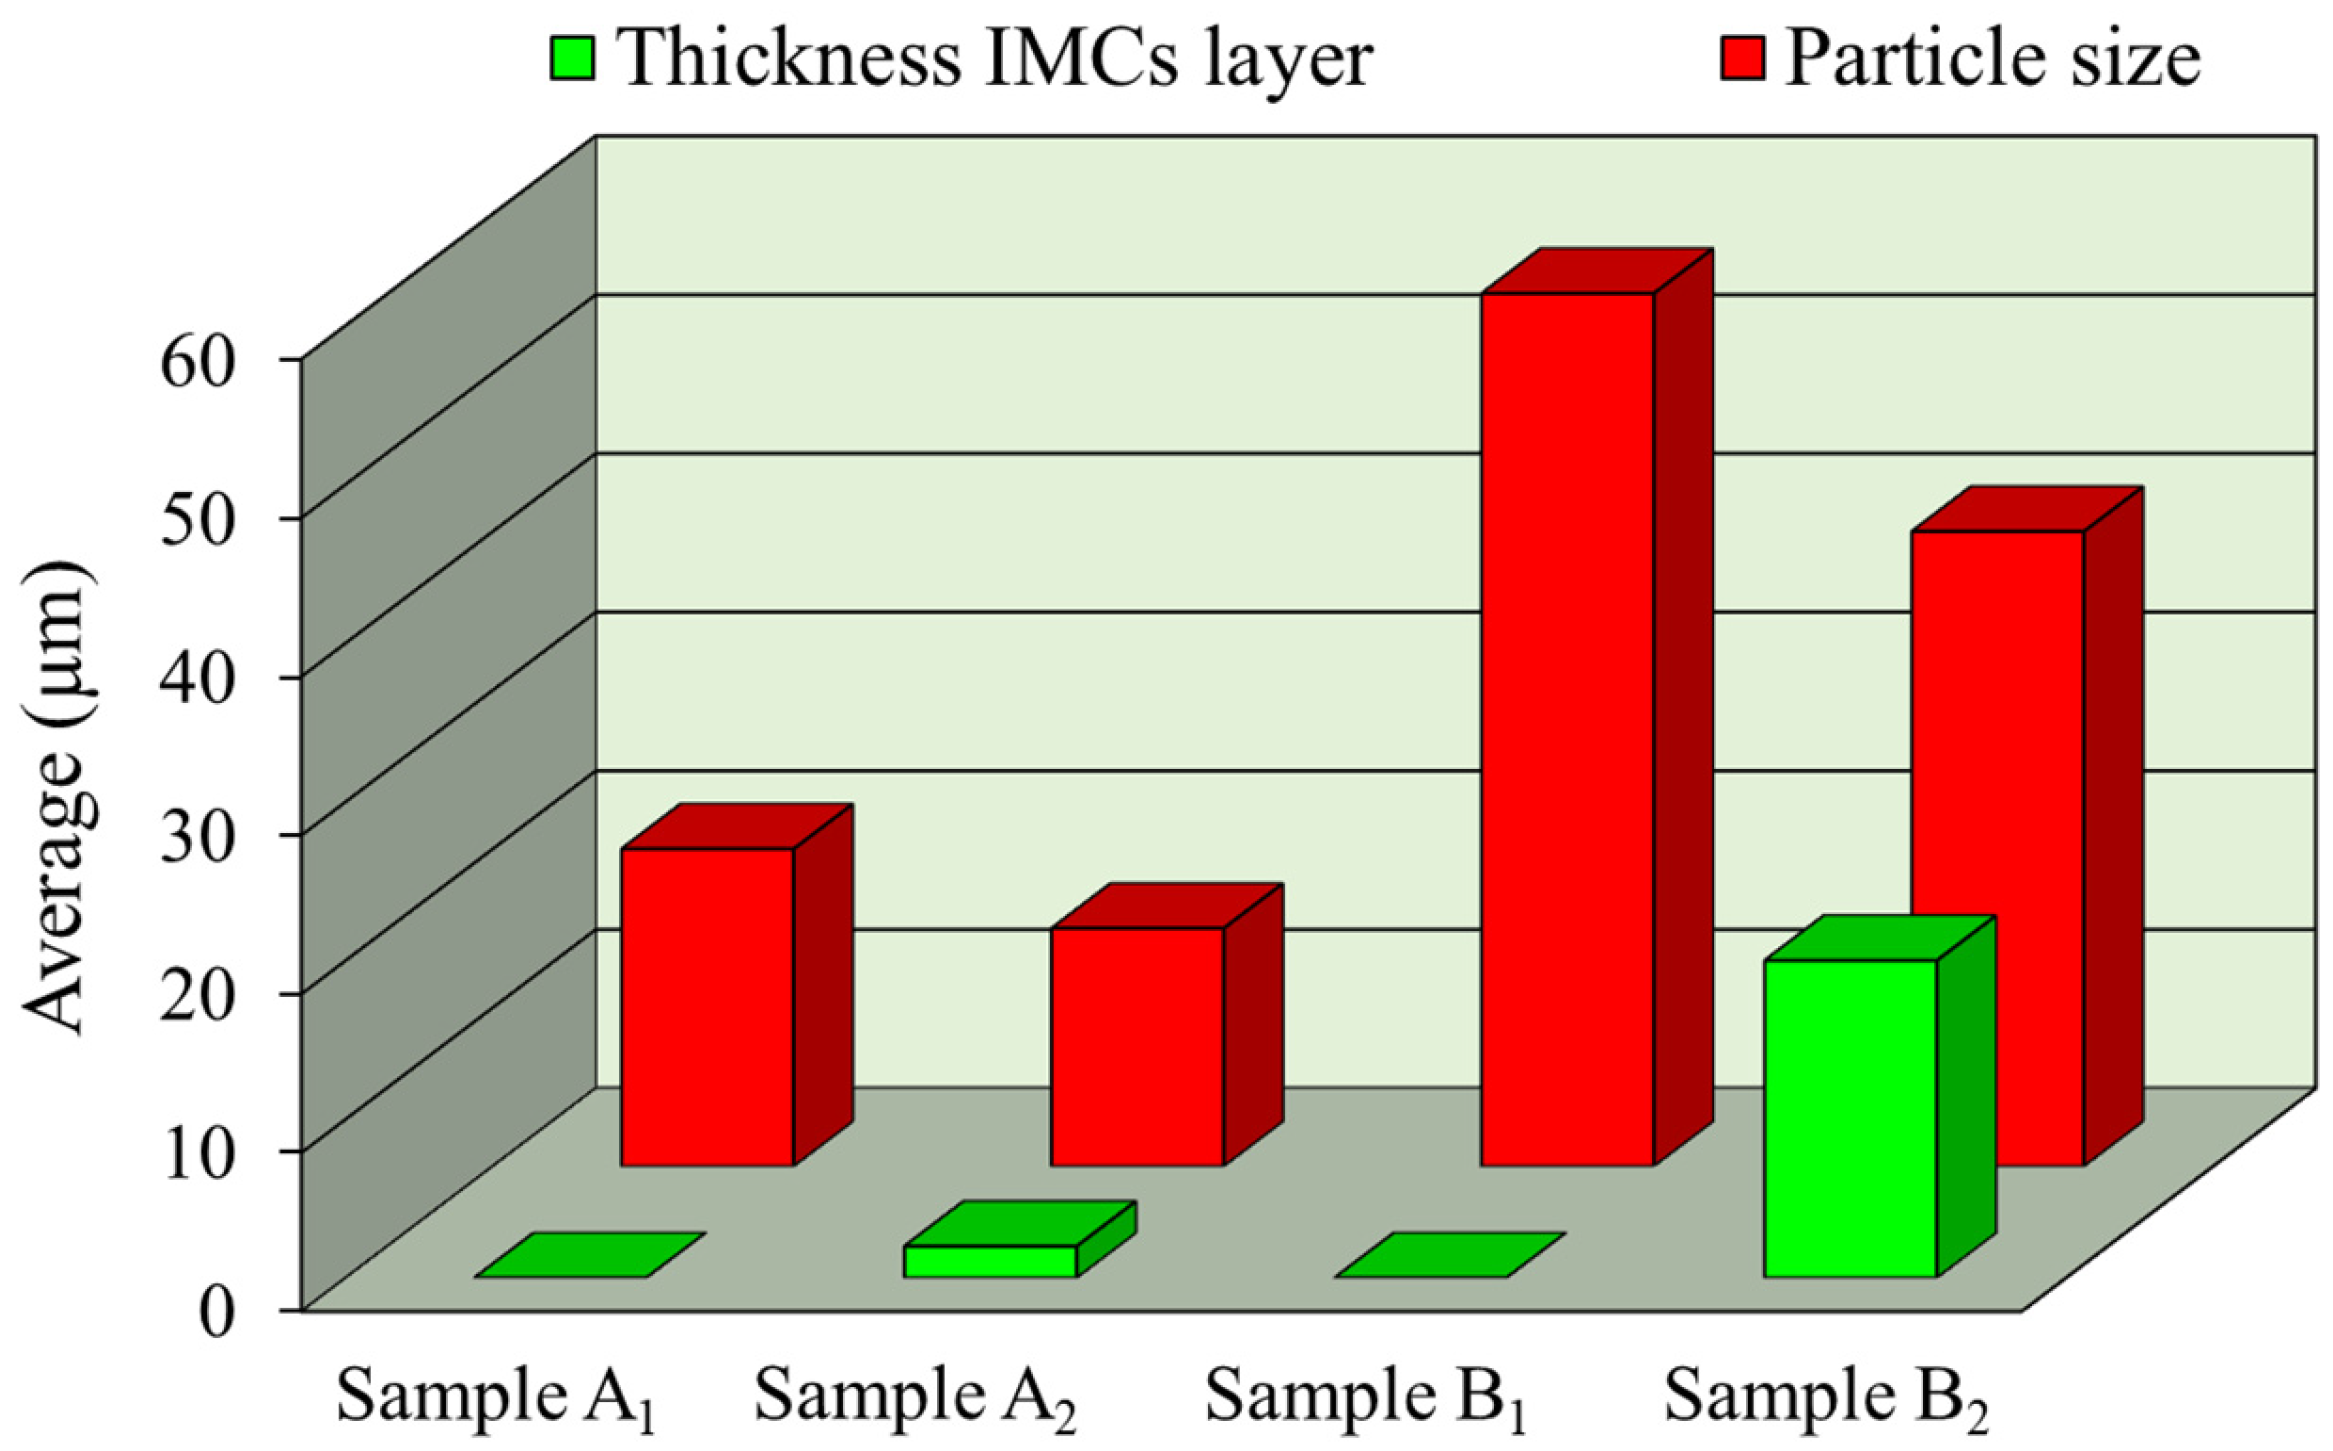
Figure 11 shows the average size of the IMC layer thickness and particle size in different conditions. As it is clear from Figure 11, in either sample A2 or sample B2, annealing heat treatment at 500 °C, an IMCs layer can be formed between particles and matrix. Sample B2 has created an IMCs layer with approximately 20 µm thickness rather than the 2 µm thickness of the IMCs layer in sample A2. The reason for this phenomenon will be explained with activity and diffusion coefficient as follows.

3.3. Diffusion Calculations

The diffusion coefficient (D) of Cu and Ni when they are present in the (Cu, Ni) solid solution as substitutional atoms differs from when they are present as single phases of Cu and Ni. This explains why the IMC layer thickness of samples A2 and B2 are different despite having the same process parameters. Diffusion coefficients of Cu and Ni (DCu and DNi) are calculated using Arrhenius-type Equation (6), considering that the Cu activity (aCu) and Ni activity (aNi) are equal to unity in pure material [49].
D i = D 0 exp ( H i R T )
where D0 (m2·s−1) is the pre-exponential factor and ∆H or Q (Kj·mol−1) is the activation enthalpy, R (8.314 J·k−1mol−1) is the universal gas constant, and T (K) is the temperature. So, according to Table 6, it can be stated that DCu and DNi at 500 °C (773 K) are obtained by Equations (7) and (8), respectively:
D Cu =   D 0 exp ( H R T ) = 3.1   ×   10 5 exp 200.3 × 10 3 8.314 × 773 = 9.464   ×   10 19   m 2   s −1
D Ni = D 0 exp ( H R T ) = 1.9   ×   10 4 exp 279.7 × 10 3 8.314 × 773 = 2.385   ×   10 23   m 2   s −1
Diffusion coefficient for Cu and Ni in Monel component as follows:
D C u M o n e l =   D * Cu   1 + d ln γ C u d ln x C u =   M Cu RT L n a C u L n N C u
D N i M o n e l = D * Ni   1 + d ln γ N i d ln x N i = M Ni RT L n a N i L n N N i
The atom’s mobility, Mi, is obtained by experiments. Reference [52] suggested that it can be expressed as:
M i   =   exp ( R T L n   M i 0 R T ) exp ( Q i R T ) 1 R T mg
where M i 0 is a frequency factor, Qi is an activation enthalpy, and mg Ω is a factor taking into account a ferromagnetic contribution to the diffusion. According to reference [53,54], the values of the tracer diffusion coefficient ( D C u * ) and thermodynamic factor (Φ) in previous studies are inconsistent with the current study in terms of the selected temperature and composition of the Monel alloy, then the analysis of sample A2 will be performed qualitatively.
According to Raoult’s law, in an ideal solid solution alloy, γCu = 1 and aCu = NCu, and hence Φ = 1. However, in non-ideal solutions, Φ deviates from unity, which is called Henry’s law. It holds that γCu > 1 for phases with negative deviations and γCu < 1 in the opposite case. This condition applies to Ni. In cases of negative deviation, the atoms in the solution arrange themselves in an ordered manner within the crystal lattice, resulting in a system with a specific atomic order.
In conclusion, it can be stated that:
D C u M o n e l < D C u C u   p a r t i c l e s
D N i M o n e l < D N i N i   p a r t i c l e s
The reason for the thicker IMC layer formation between particles and matrix in sample B2 rather than sample A2 is the differences in the diffusion coefficient. As it is clear from Equations (12) and (13), the diffusion coefficient of Cu when it is present in particles alone is higher than when Cu is dissolved in a solid solution. This is also true for Ni. The diffusion coefficients of pure Cu and Ni at 773 K were calculated using the Arrhenius relationship in Equations (7) and (8), respectively, based on the reported activation energies and pre-exponential factors. Previous studies have reported diffusion coefficients for Ni and Cu at similar temperatures in the range of 10 19   10 23   m 2 · s , which is consistent with the present calculation [55]. Although obtaining the diffusion coefficient for the exact Monel composition at this temperature was not possible due to the lack of reliable data, these values fall within the expected order of magnitude for substitutional diffusion in Ni–Cu systems. Therefore, the use of the calculated values for Cu and Ni was only intended to theoretically relate diffusion behavior to thermodynamic activity.

3.4. TEM Images

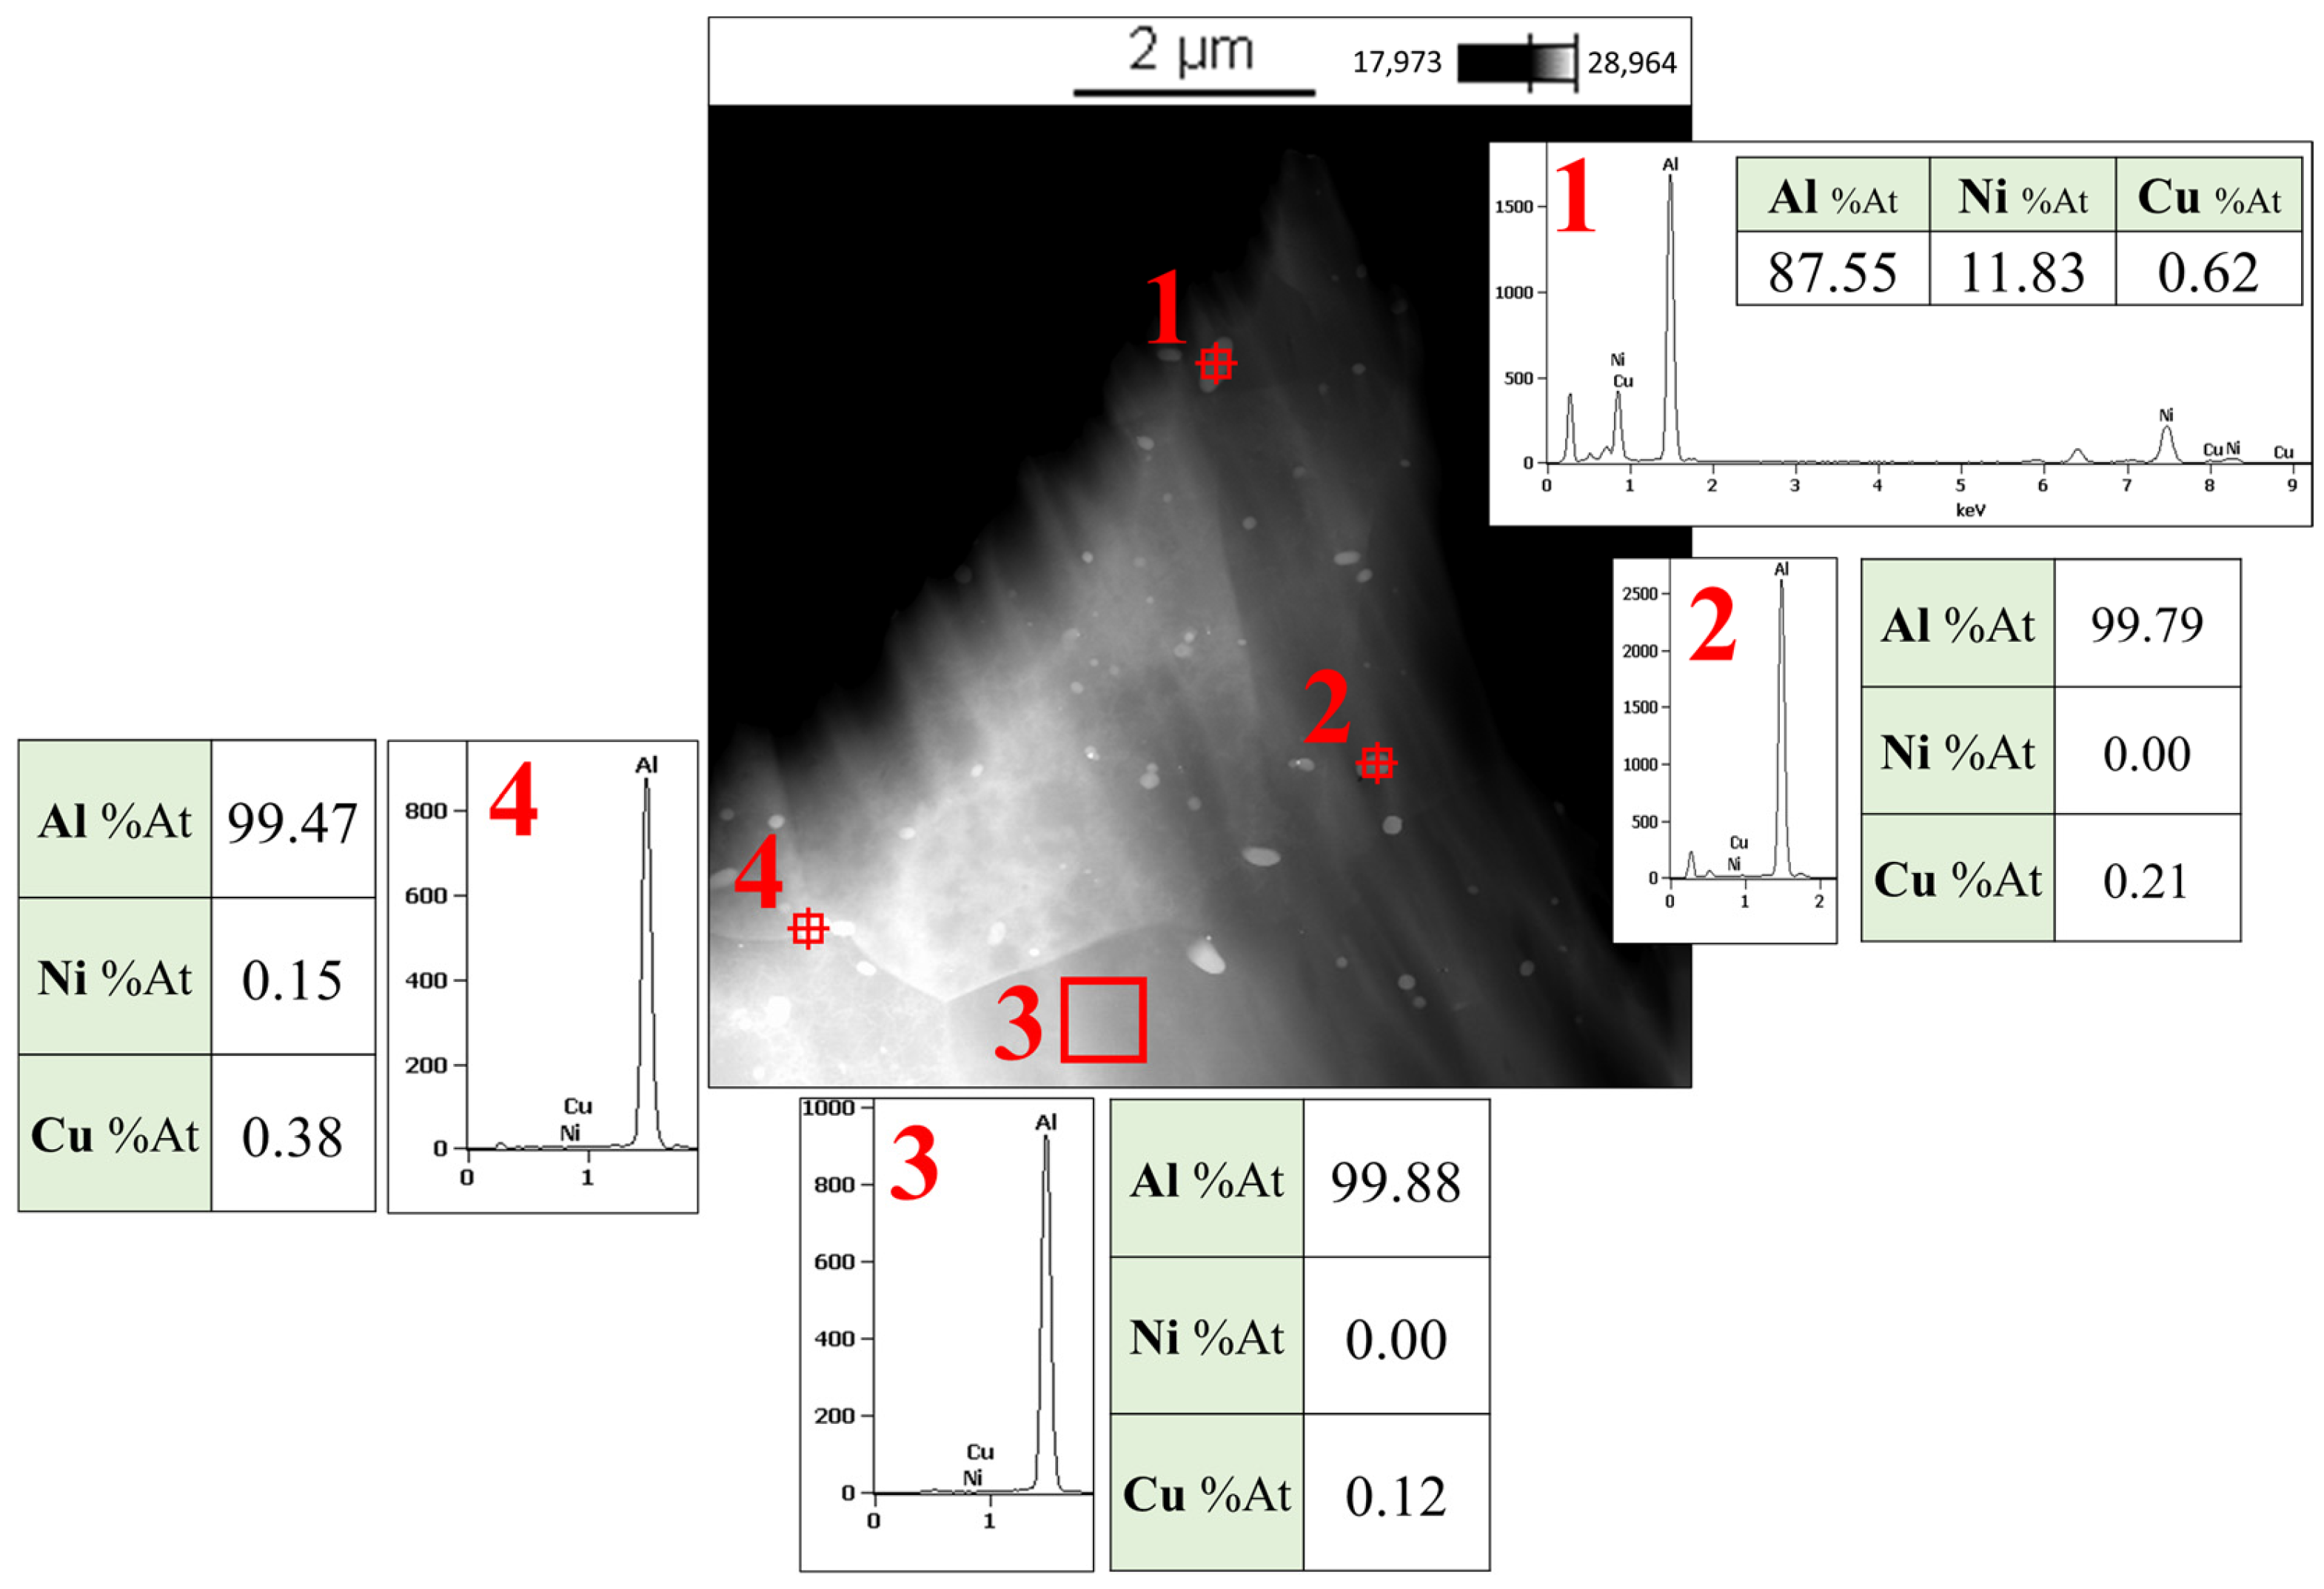
In Figure 12, the TEM images of B1 are shown (without mechanical alloying and without annealing heat treatment) along with atomic percentages of Al, Ni, and Cu taken from several points. As it is clear from Figure 12 for point 1, particles consist of 87.55% at Al, 11.83% at Ni, and 0.62% at Cu. According to Figure 6b, this chemical composition corresponds to Al + Al3Ni. The hardness range of Al + Al3Ni is 35–160 HV [56]. Other points (2, 3, and 4) correspond to the aluminum matrix. Some Cu is present as a solid solution. These results confirm that Cu and Ni have not been dissolved during the FSP process to form IMCs.
In Figure 13, the TEM image of sample A1 and the atomic percentages of Al, Cu, and Ni, taken from different spots, are shown with dots. Figure 13 shows TEM images of sample B2 (without mechanical alloying and with annealing heat treatment at 500 °C for 2 h). As shown in Figure 13, the reinforcement particles were not distributed uniformly. Point 1 from Figure 13a indicates that Al + Al3Ni is formed, and other elements are diffused atomically into it as a solid solution due to the high temperature of annealing. Points 2, 3, and 8 correspond to the Al matrix. Other points are IMC of either Al-Cu or Al-Ni. A comparison of TEM images of samples B1 and A1 clearly reveals differences in grain size, highlighting the impact of the mechanical alloying process on the final microstructure. Although new elements are introduced into the microstructure through mechanical alloying, the most noticeable changes are the refinement of grain size, improved dispersion of powder particles, and a more uniform distribution in the mechanically alloyed powder sample A1.
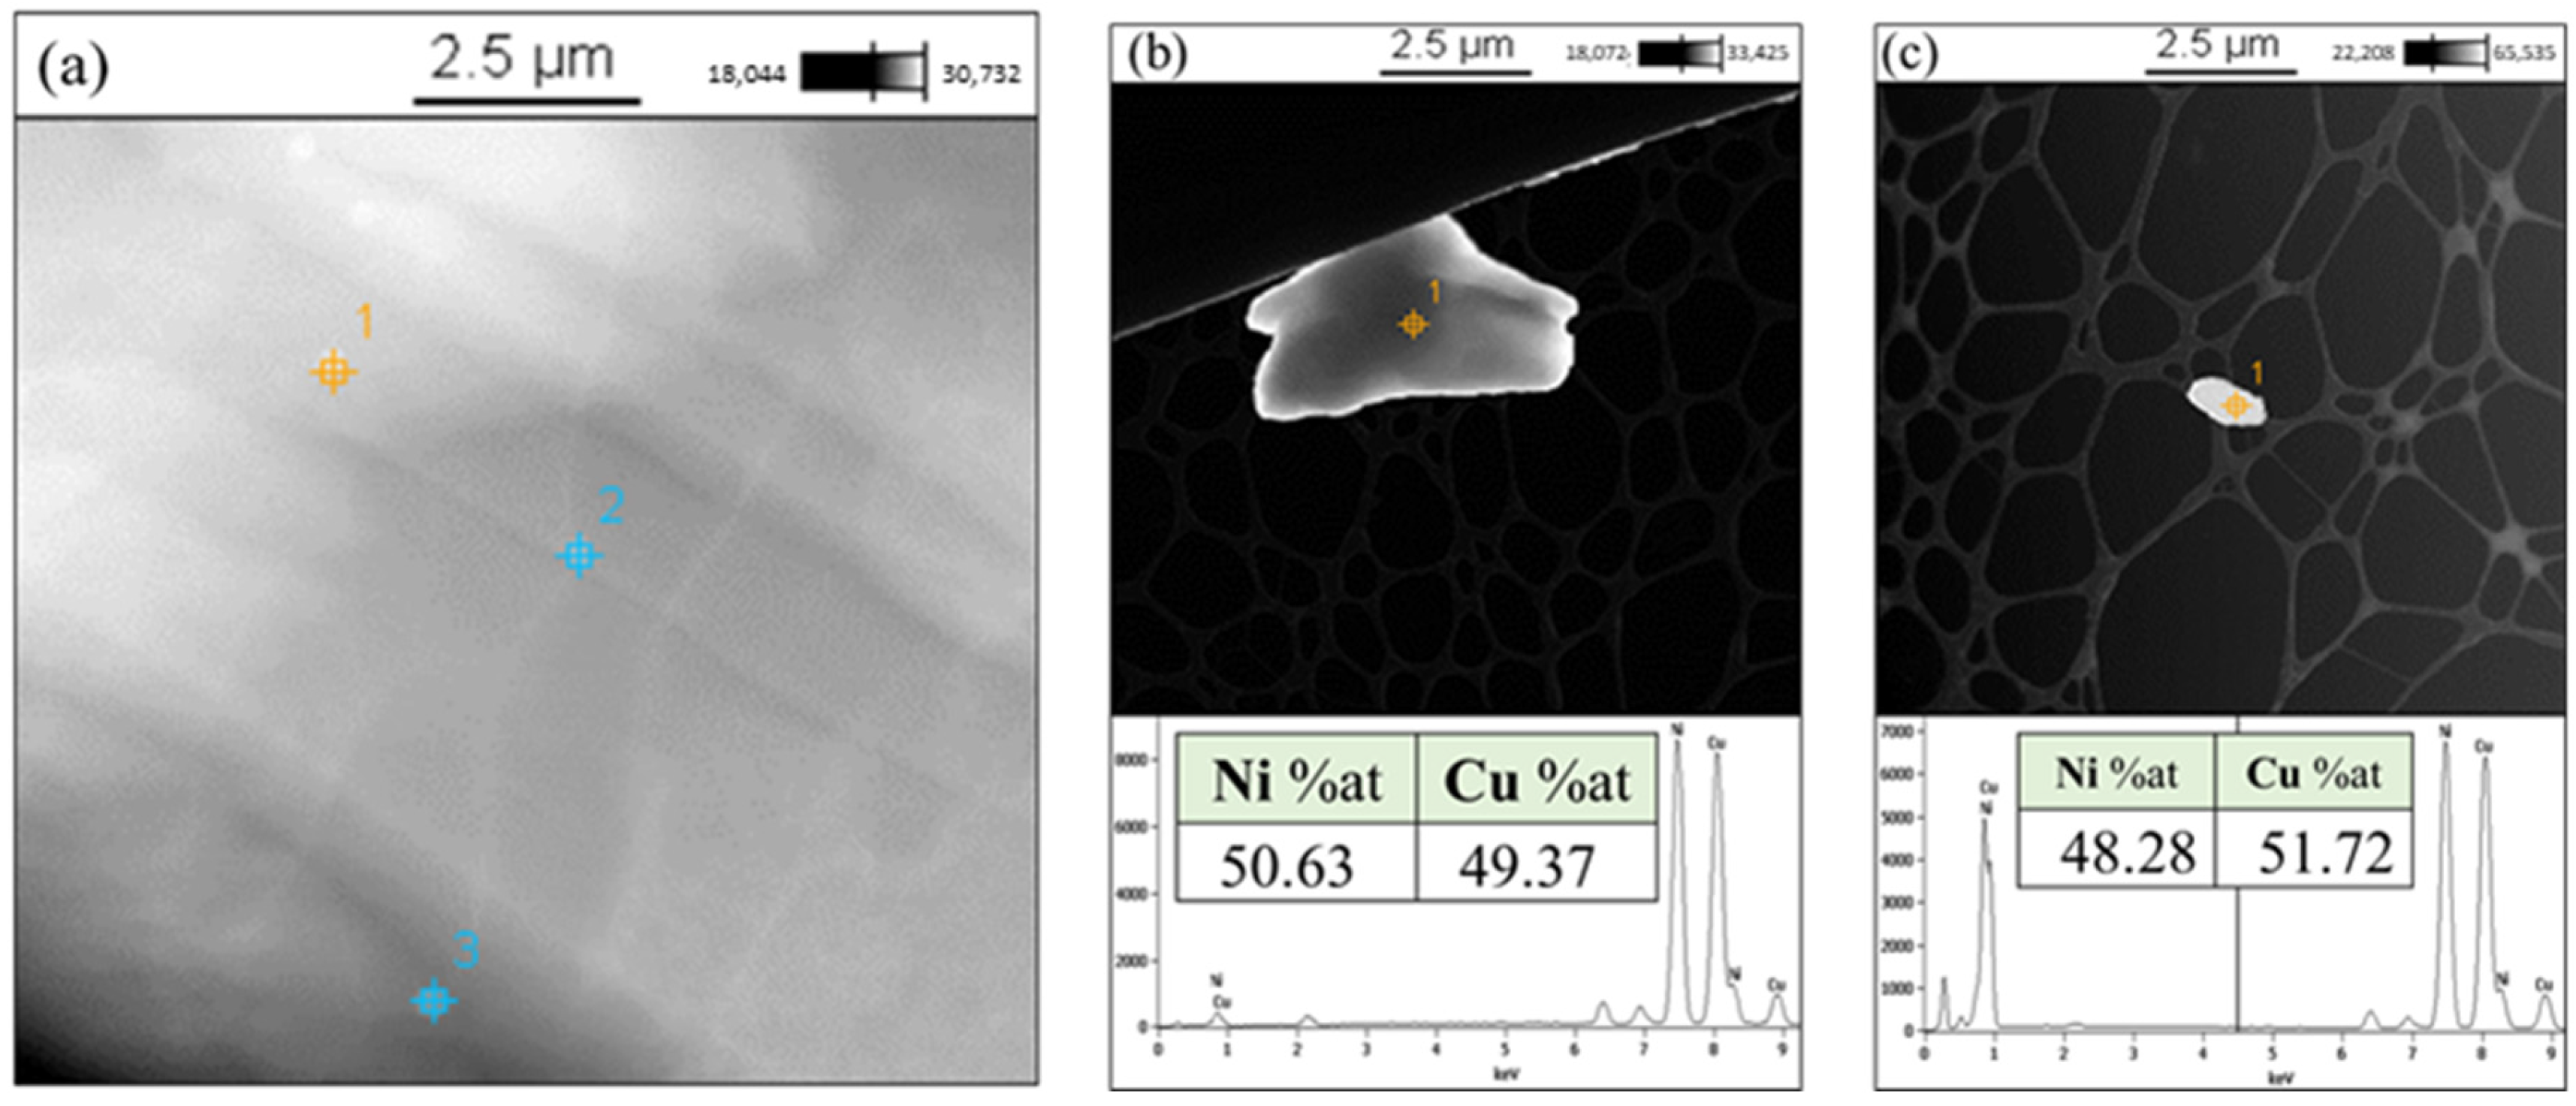
Figure 14a shows a TEM image of sample A2 a sample with mechanically alloyed powder after annealing heat treatment). In sample A2, almost no powder particles can be seen in the regions affected by the friction stir processing in the images. Figure 14b,c shows TEM images of the newly formed grains after annealing heat treatment in samples B2 and A2, respectively. As it is clear from Figure 14b,c, Monel particles consist of 50.63% at Ni and 49.37% at Cu in sample B2 and 48.28% at Ni and 51.72% at Cu in sample A2. According to the Cu-Ni binary diagram, Cu and Ni form a solid solution with each other in various ratios. As observed in Figure 14b,c, the newly formed grains are not spherical in shape. In contrast, in samples A1 and B1, the grains appear spherical in both cases.

3.5. Tensile Strength and Microhardness

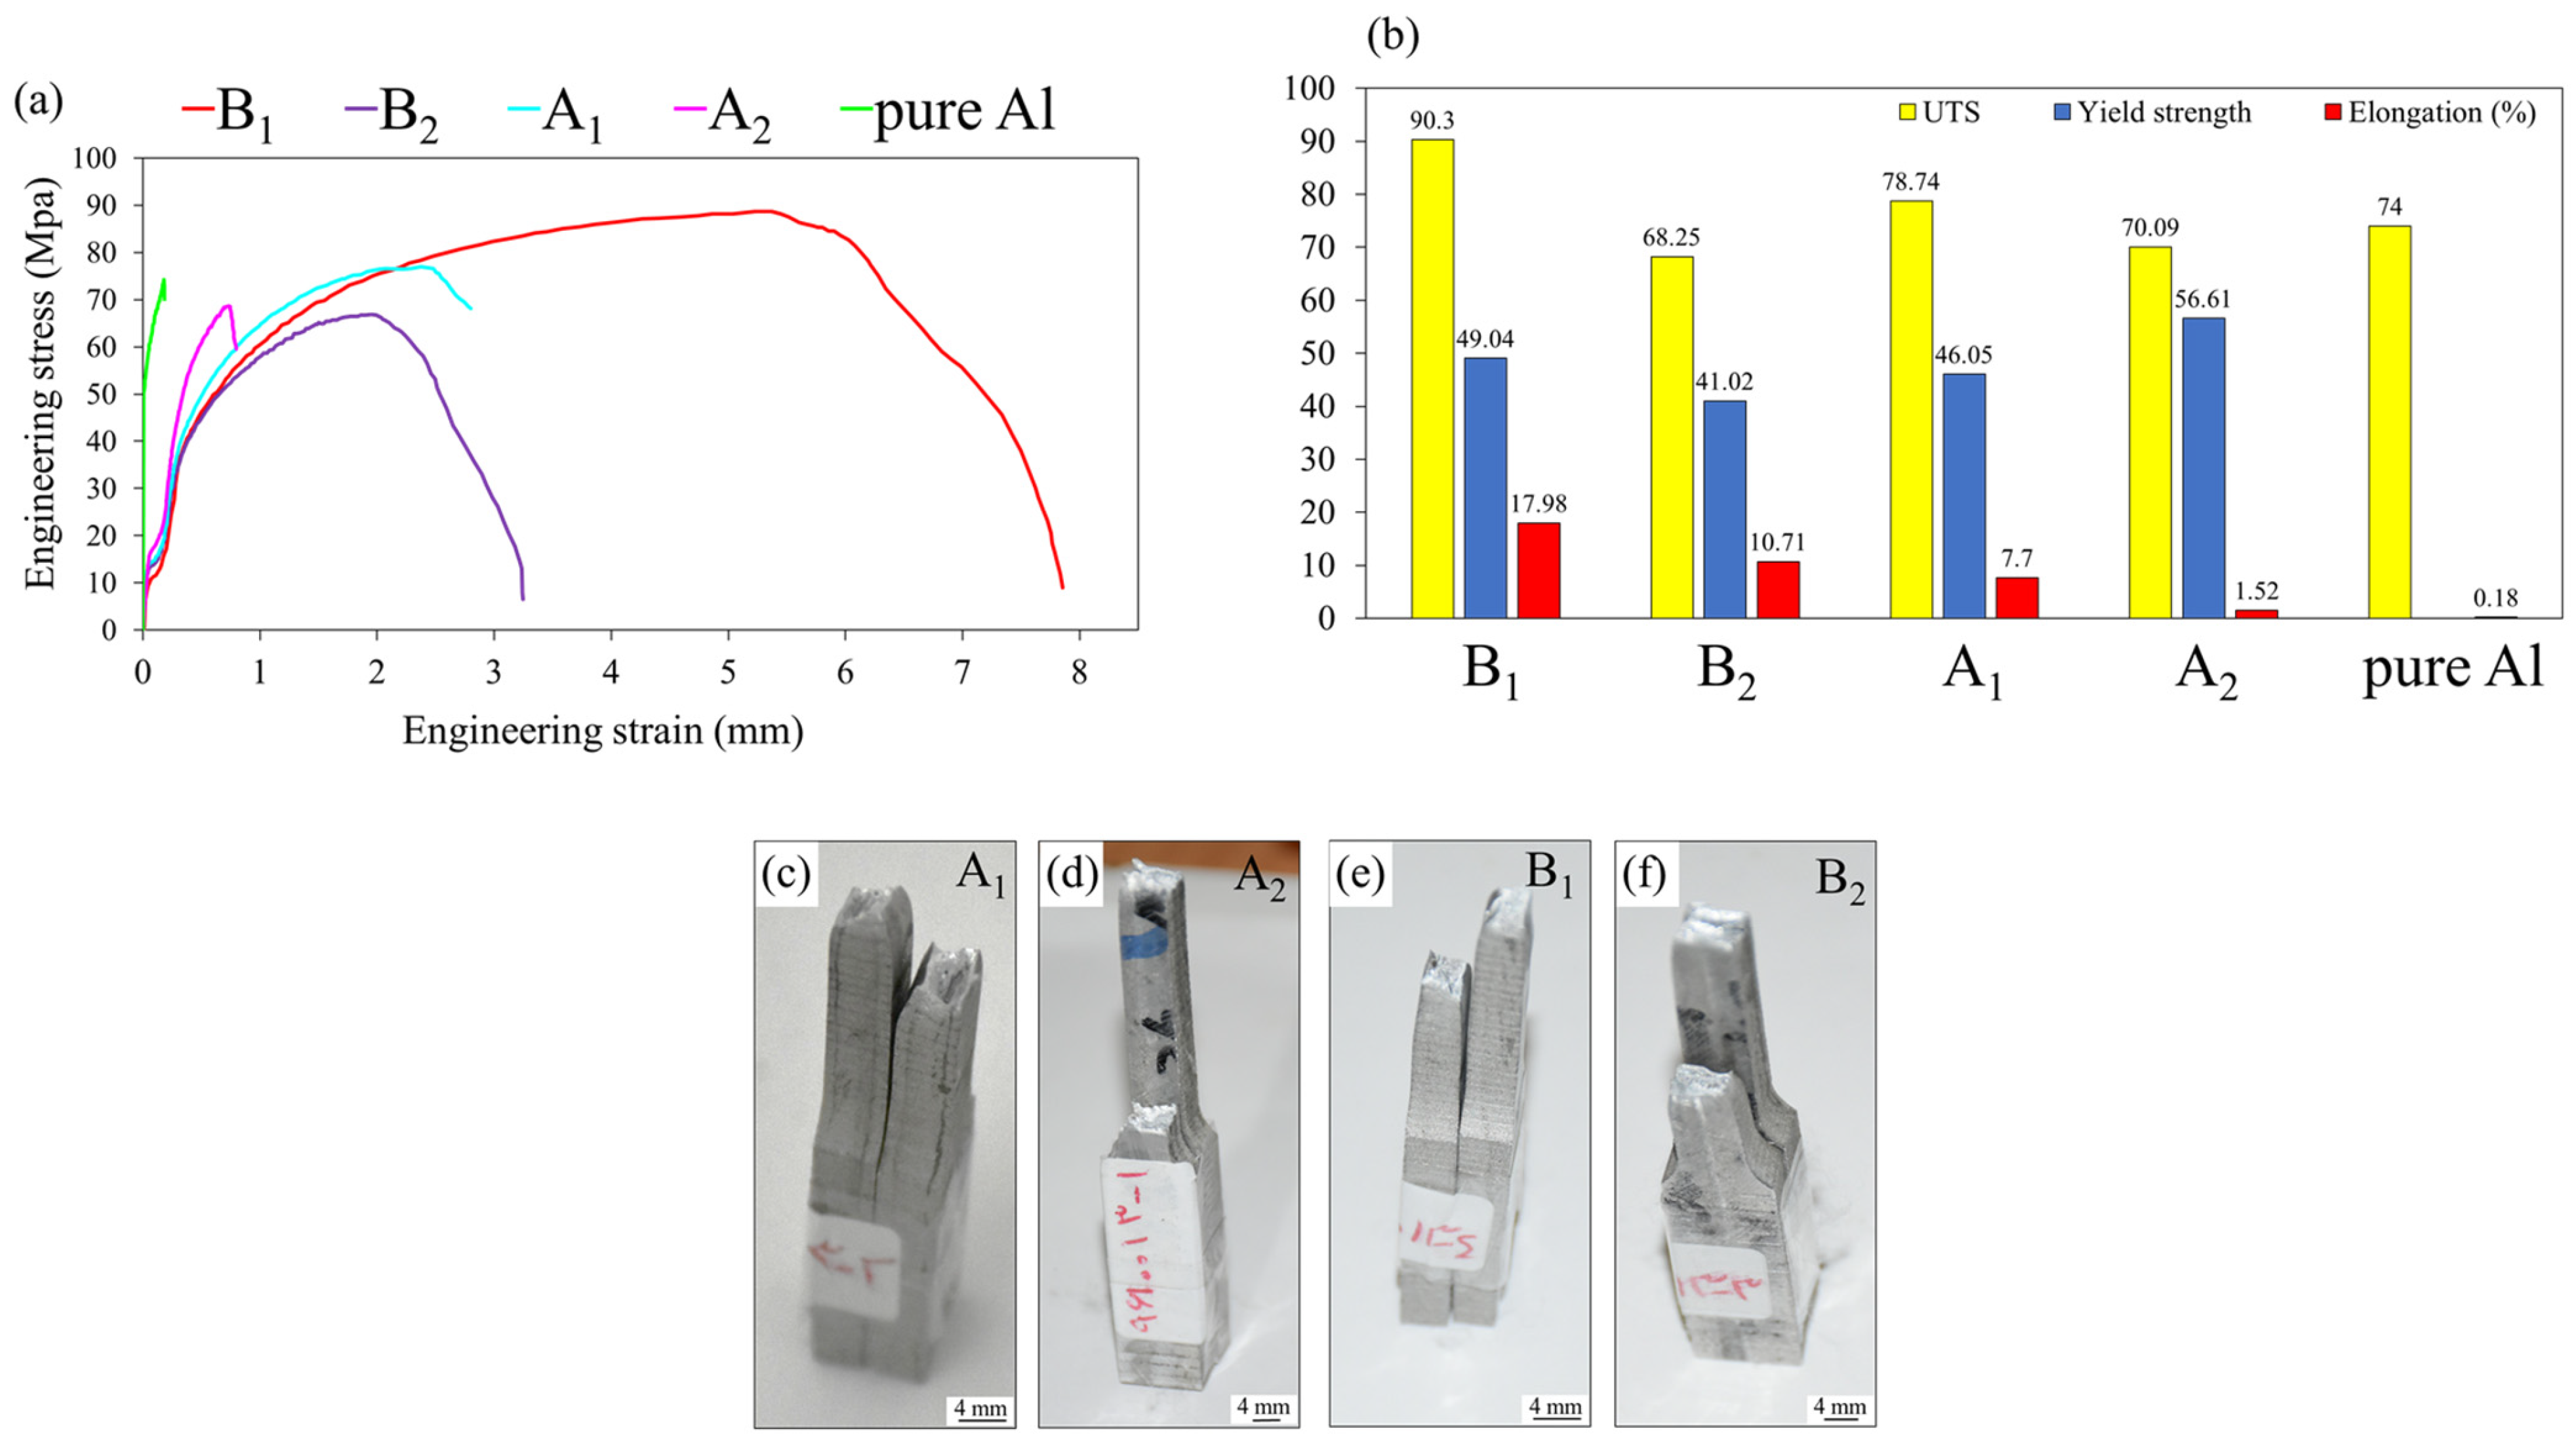
Figure 15a,b shows the engineering stress-engineering strain curve and the bar chart that includes UTS, yield strength, and elongation of samples A1, A2, B1, B2, and pure Al, respectively. Sample B1 has the highest UTS and elongation among all the samples, including the unprocessed base material. As previously shown in Figure 8, IMCs form around the particles, resulting in good bonding between them and the matrix. Sample A1 exhibits lower UTS and elongation compared to sample B1. The reason for this issue is that Monel particles cannot create a bond between the AA1050 matrix in sample A1, in contrast to Cu and Ni particles that can form IMCs around them, and hence, a bond with the substrate is created. Interestingly, SEM and EDS analysis indicate that these particles in B1 are larger (35–80 μm) and agglomerated, and no continuous or thick IMC layer is formed around them. This allows the surrounding Al1050 matrix to deform plastically, accommodating higher elongation. In contrast, in A1, the finer and more uniformly distributed Monel particles (Ni–Cu solid solution) can act as local stress concentrators, slightly limiting ductility. Therefore, the mechanical response reflects a balance between particle size, distribution, and the absence of a brittle IMC layer.
While a decline in both UTS and elongation is observed after heat treatment in sample B (B2 with respect to B1), no meaningful change was observed in sample A after heat treatment (compare A1 and A2). As can be seen from Figure 15b, for pure Al, the yield strength was not distinctly identifiable due to its low yield point under the applied test conditions, which is consistent with the ductile behavior of pure Al. According to Figure 15c–f, the main point to consider is that all the samples fracture in a ductile mode after necking.
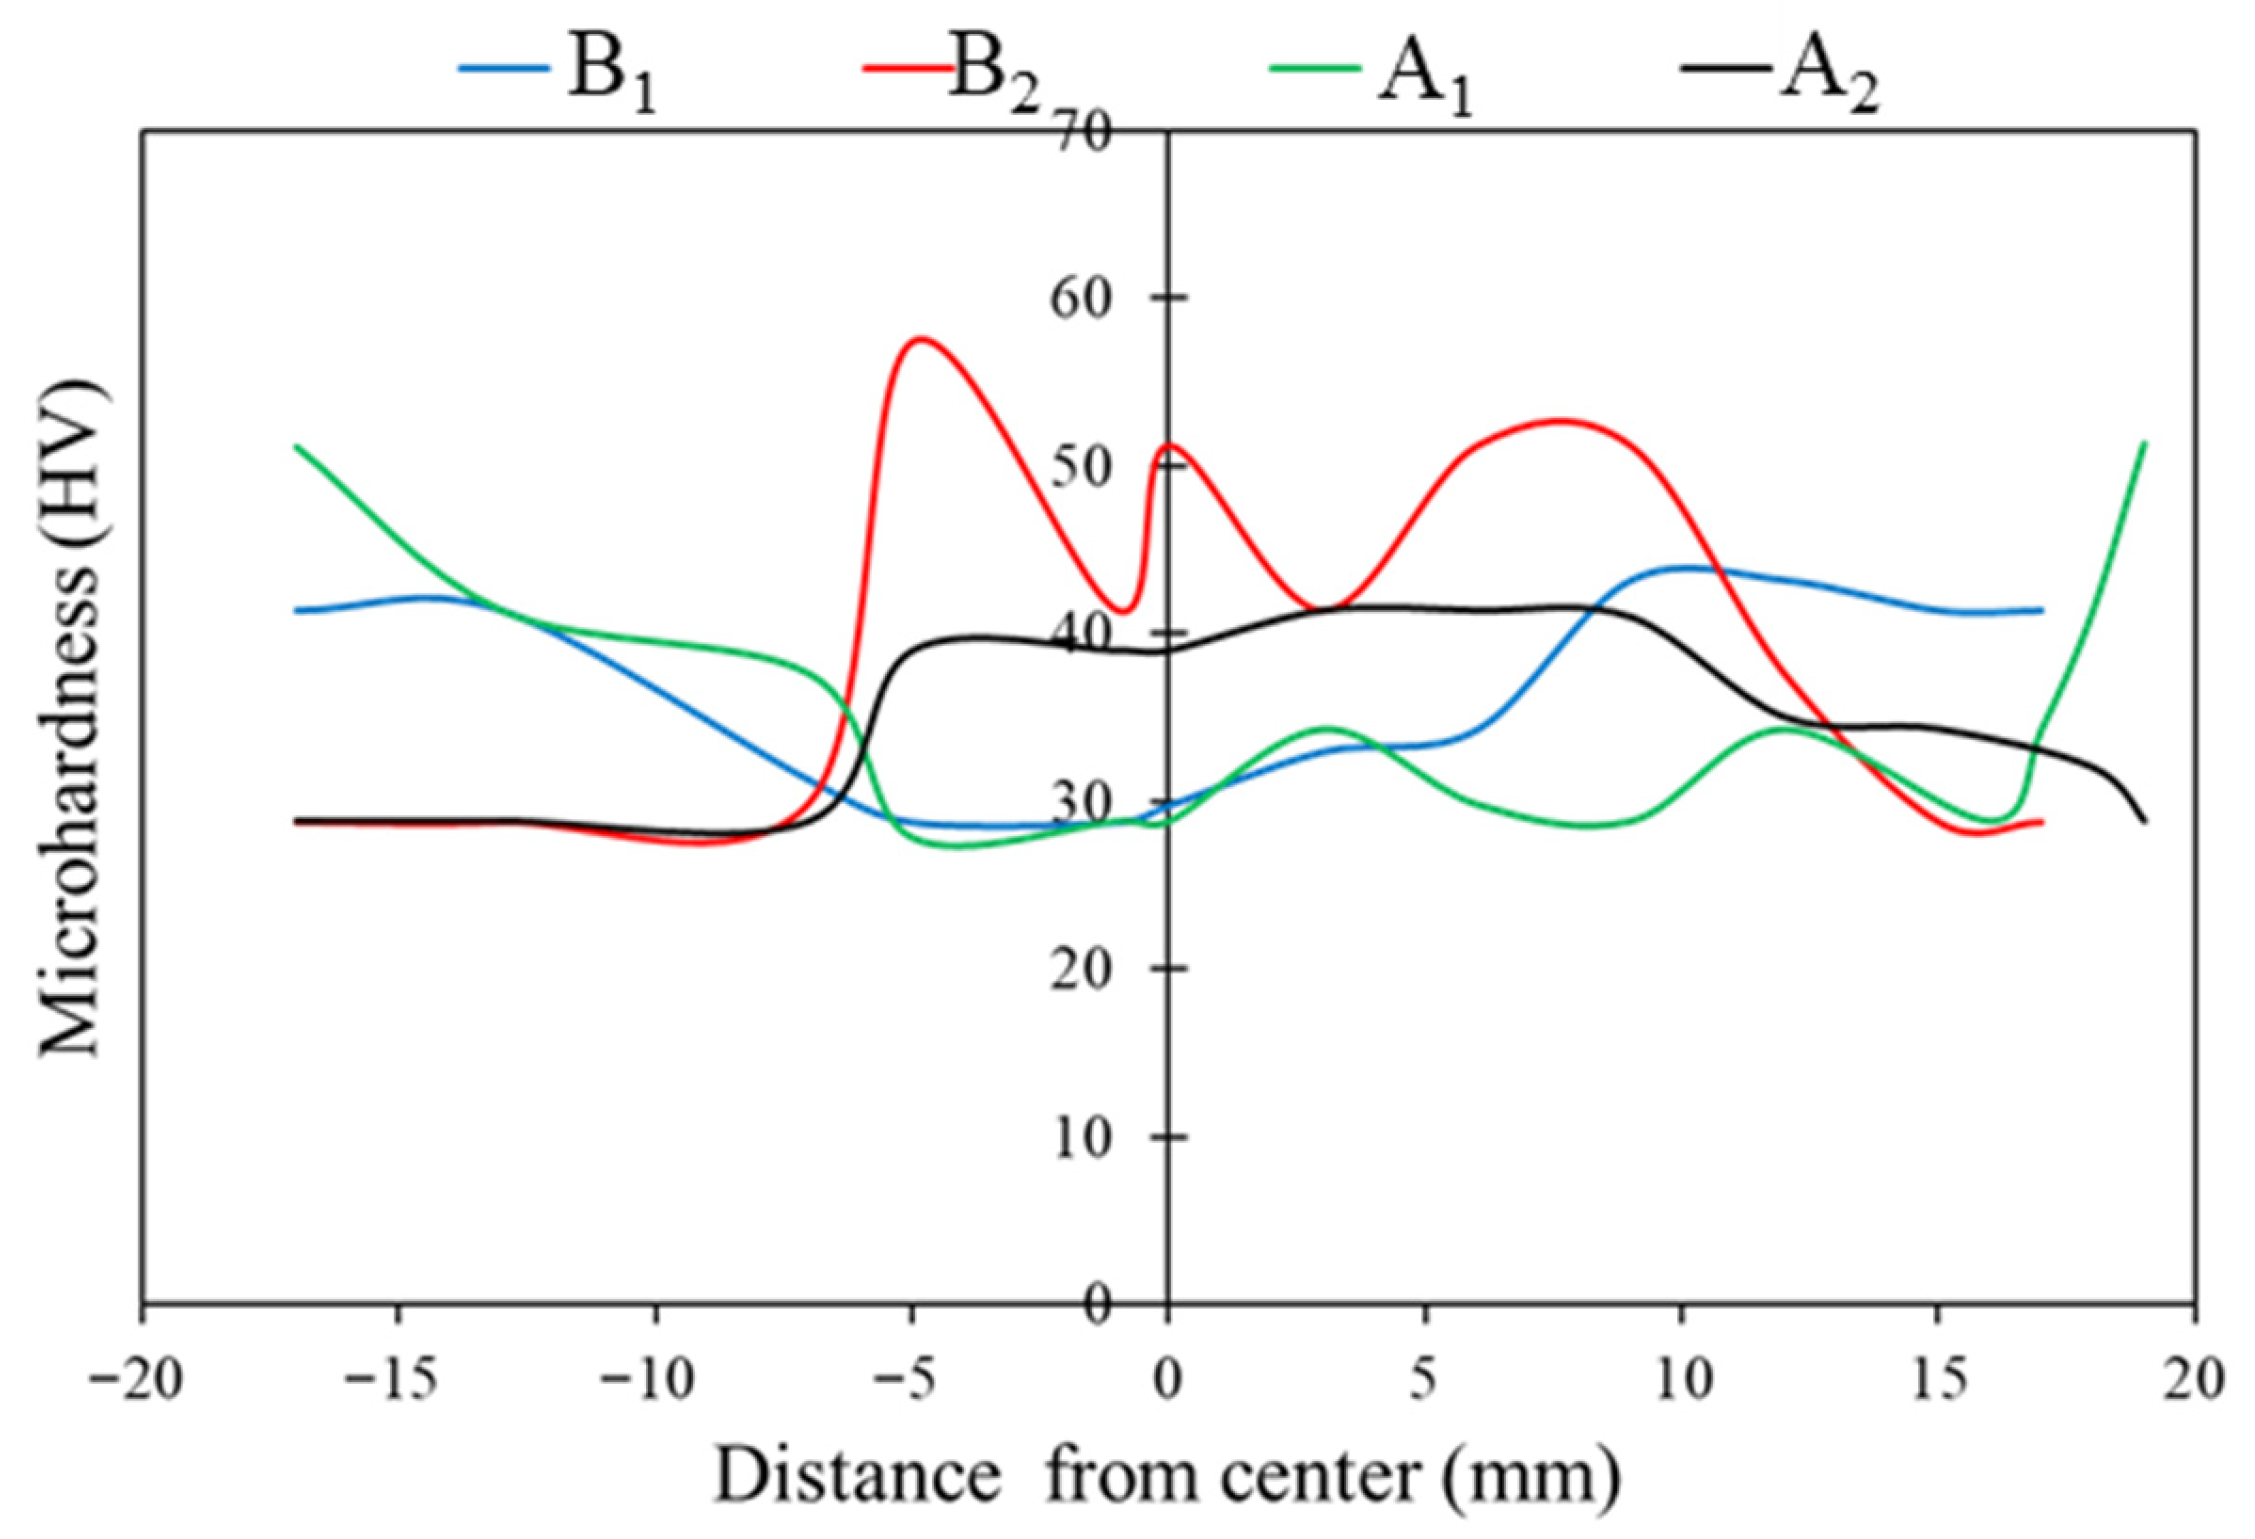
In Figure 16, the micro-hardness of the samples is shown. By performing heat treatment, the hardness in the stir zone increases due to IMC formation in both samples. sample B2 has the highest micro-hardness in the stir zone among the others. As it is clear from SEM image of sample B2 in Figure 10h, thick IMCs layer between particles and AA1050 matrix is responsible for this. Micro-hardness in sample A2 is lower than that in sample B2, around 10 HV, because the IMCs layer thickness is lower in sample A2.

3.6. Fractography

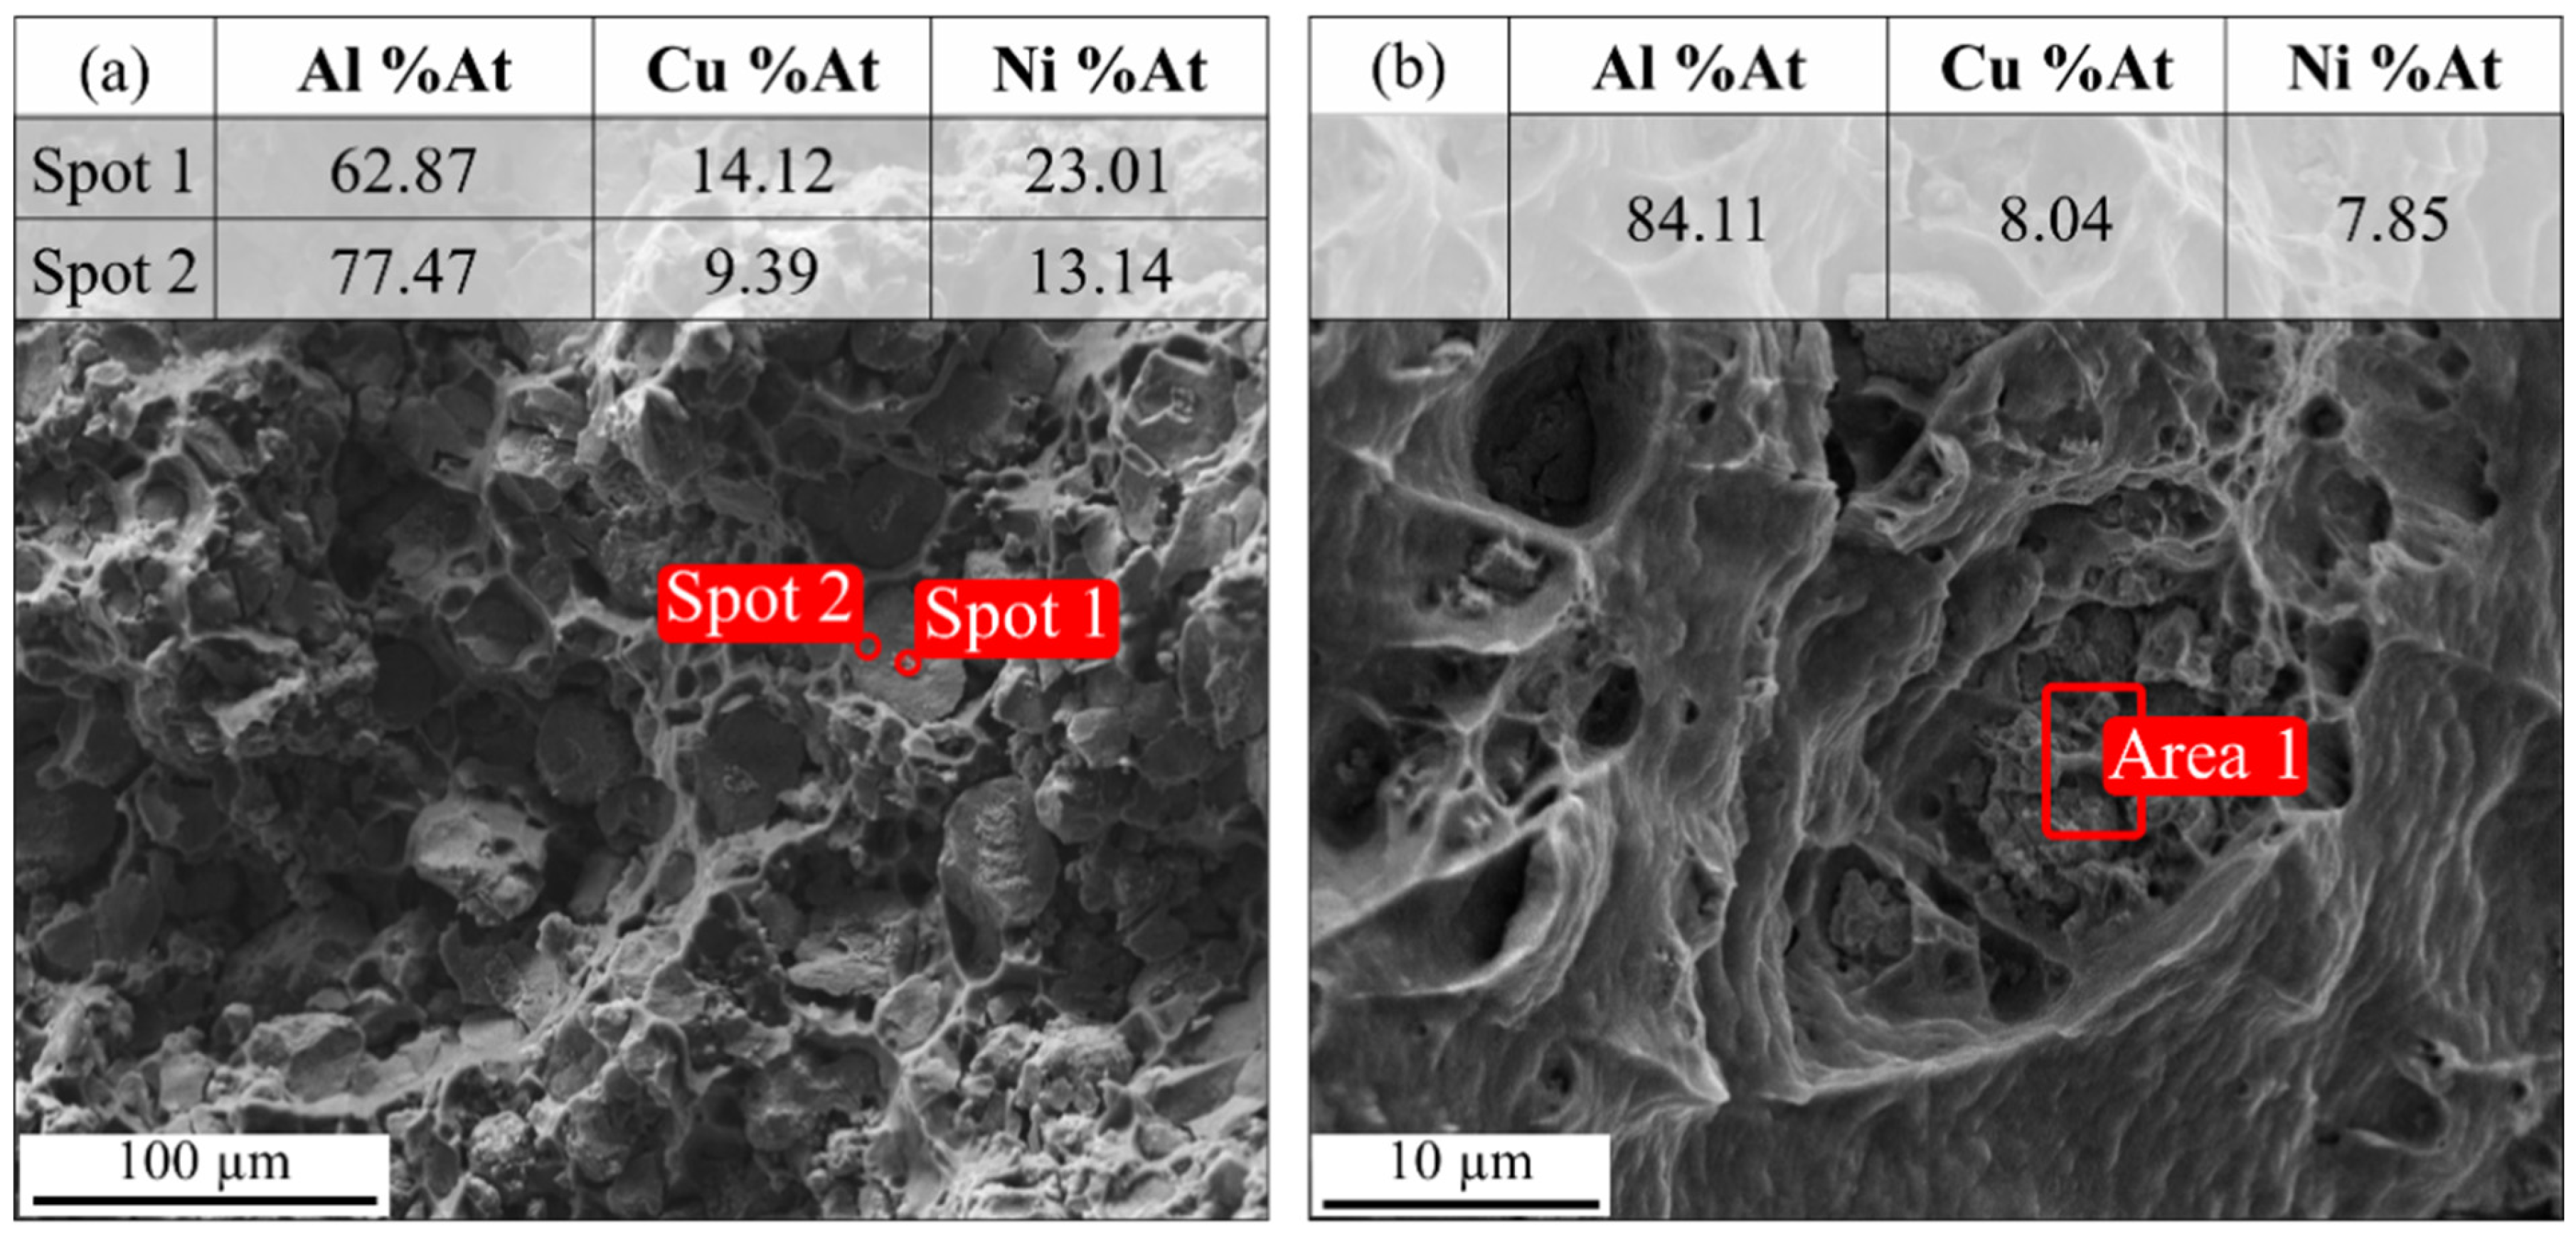
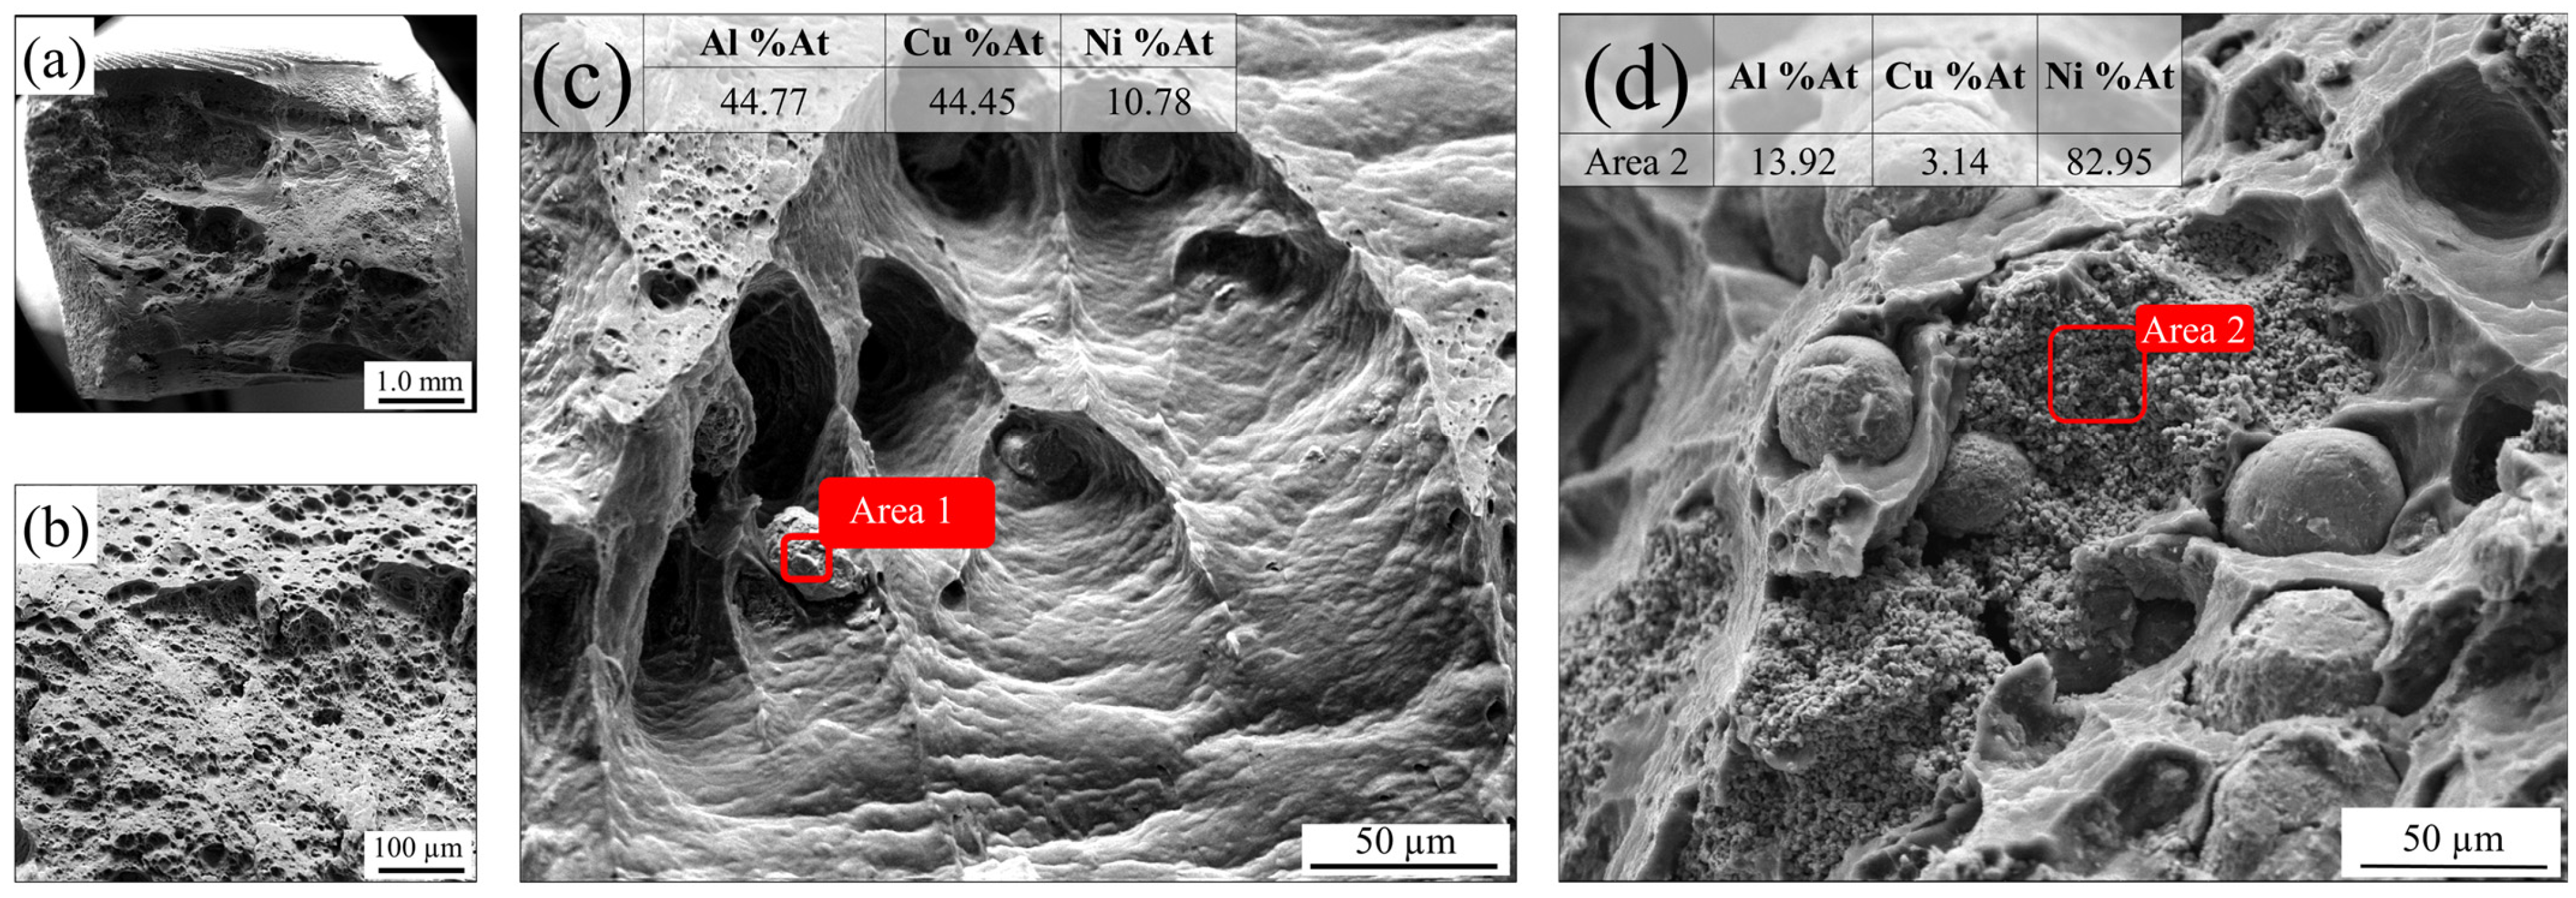
SEM images taken from the fracture surfaces of tensile specimens are shown in Figure 17, Figure 18, Figure 19 and Figure 20. In Figure 17, fracture SEM images of sample A1 are shown. Dimples are clearly visible. As shown from EDS analysis in Figure 17a, spot 1, which is taken from the core of particles, consists of 62.87% at Al, 23.01% at Ni, and 14.12% at Cu. Spot 2 consists of 77.47% at Al, 13.14% at Ni, and 9.39% at Cu. Figure 17b shows EDS analysis of area 1 taken from the matrix.
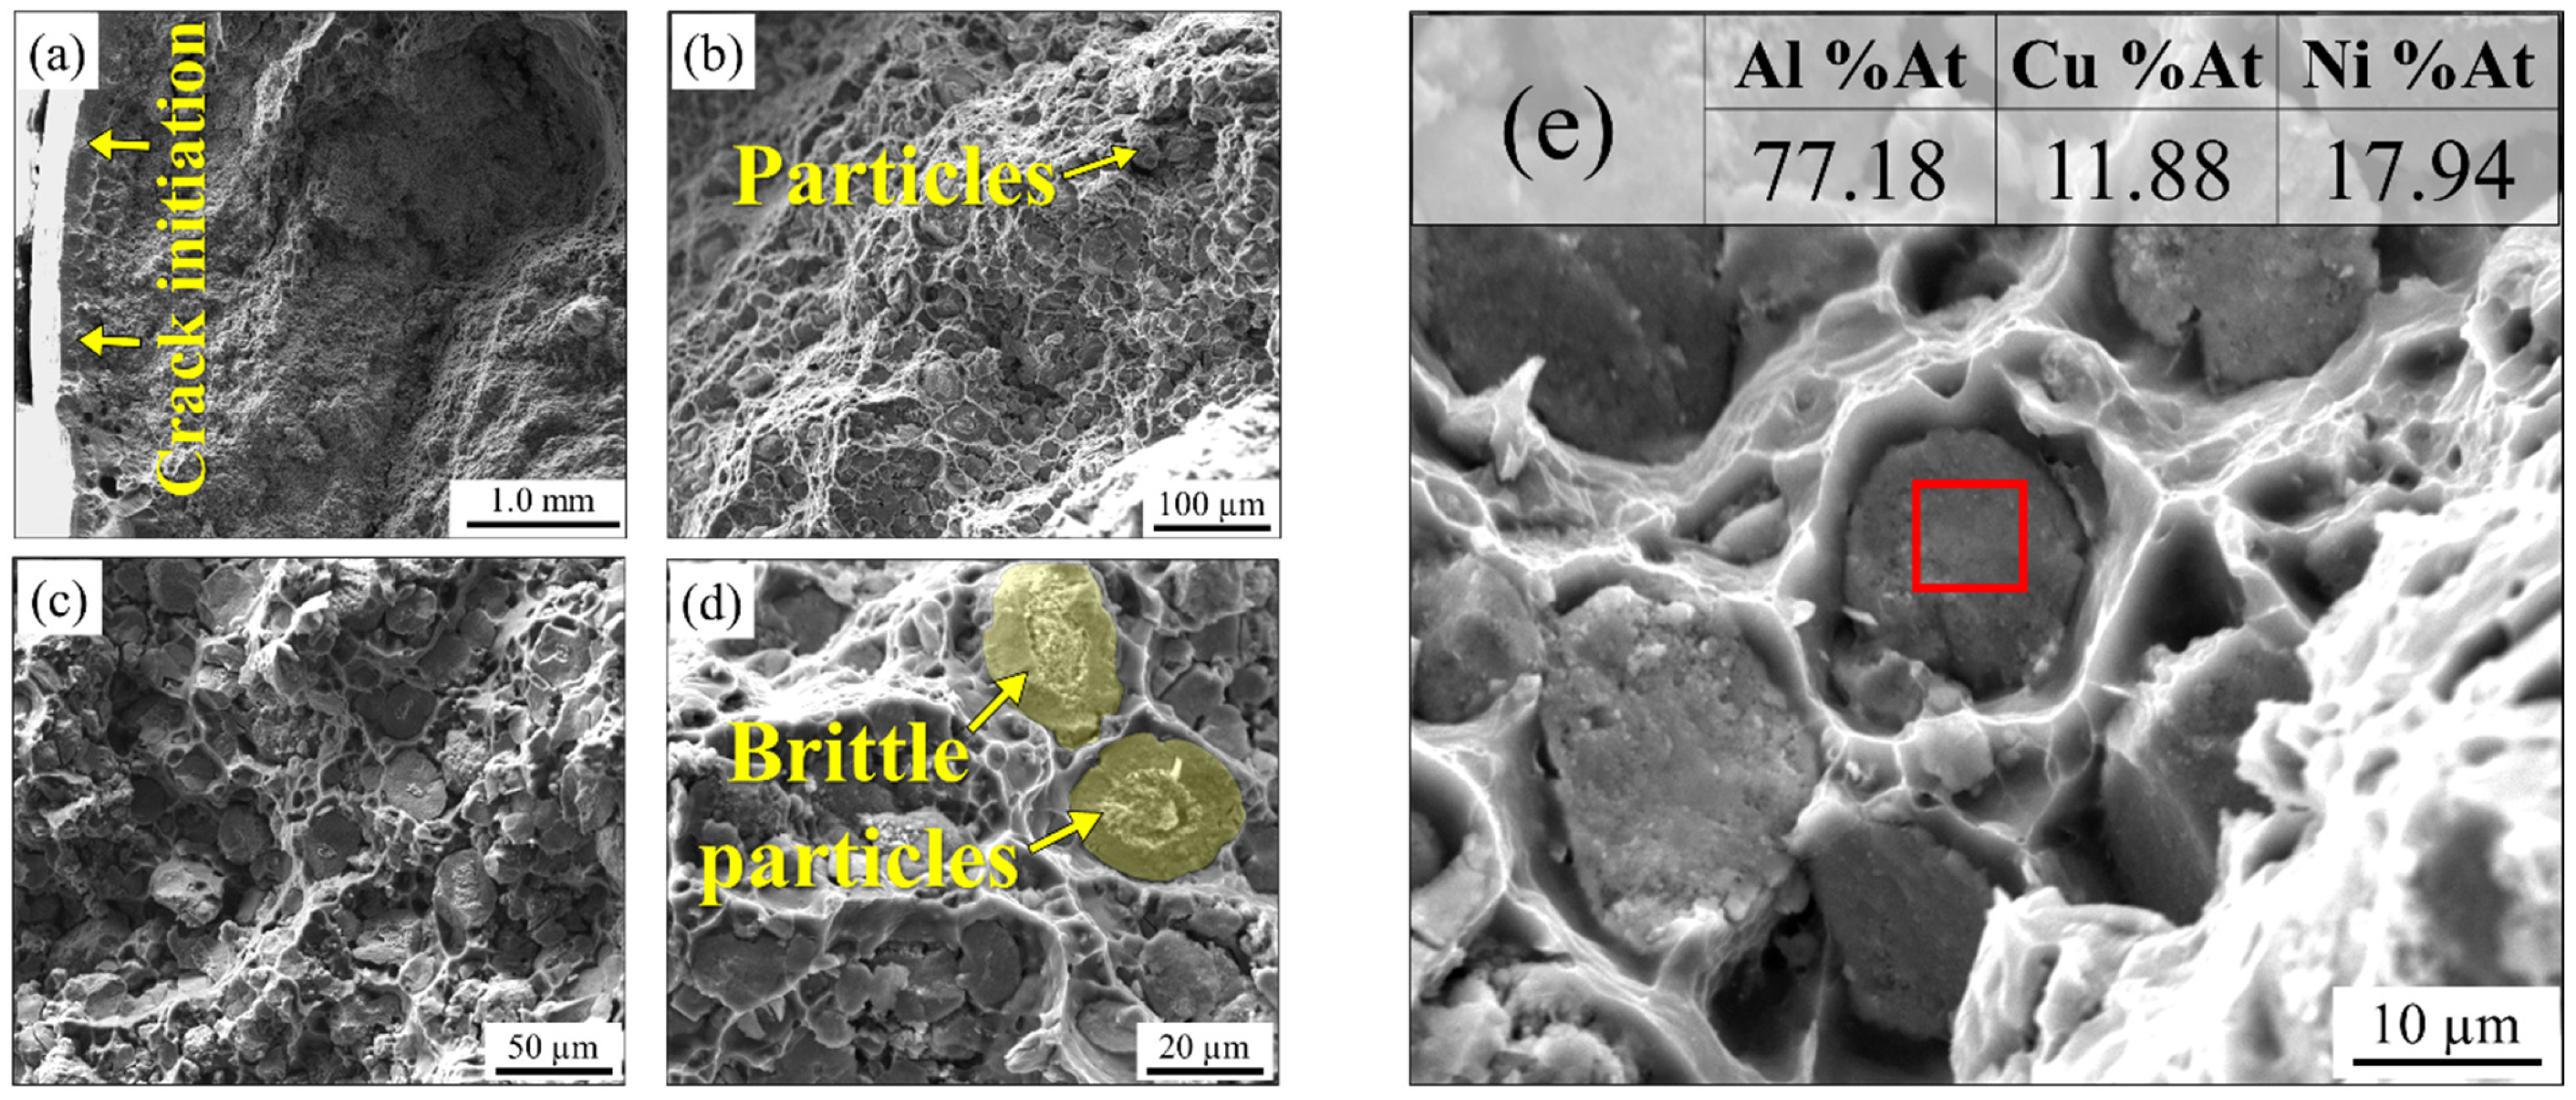
Fracture SEM images of sample A2 are shown in Figure 18. Dimples from the fracture surface of sample A2 indicate a ductile fracture mode. In Figure 18e, the chemical composition of elements is shown by EDS analysis. As it is clear, in this area, 70.18% at Al, 17.94% at Ni, and 11.88% at Cu are present. The particles fracture in a brittle mode, showing cleavage characteristics. According to Figure 18d, the dimples formed around these broken particles.
Figure 19 shows SEM images taken from the fracture surface of sample B1. As it is clear from Figure 19, the fracture is ductile. The detachment of the matrix and particles is obvious in this figure. In addition, EDS analysis of area 2 indicated that this area is composed of 13.92% at Al, 82.95% at Ni, and 3.14% at Cu. In fact, this area relates to the Ni-rich particle to which the Al and Cu atoms diffuse.
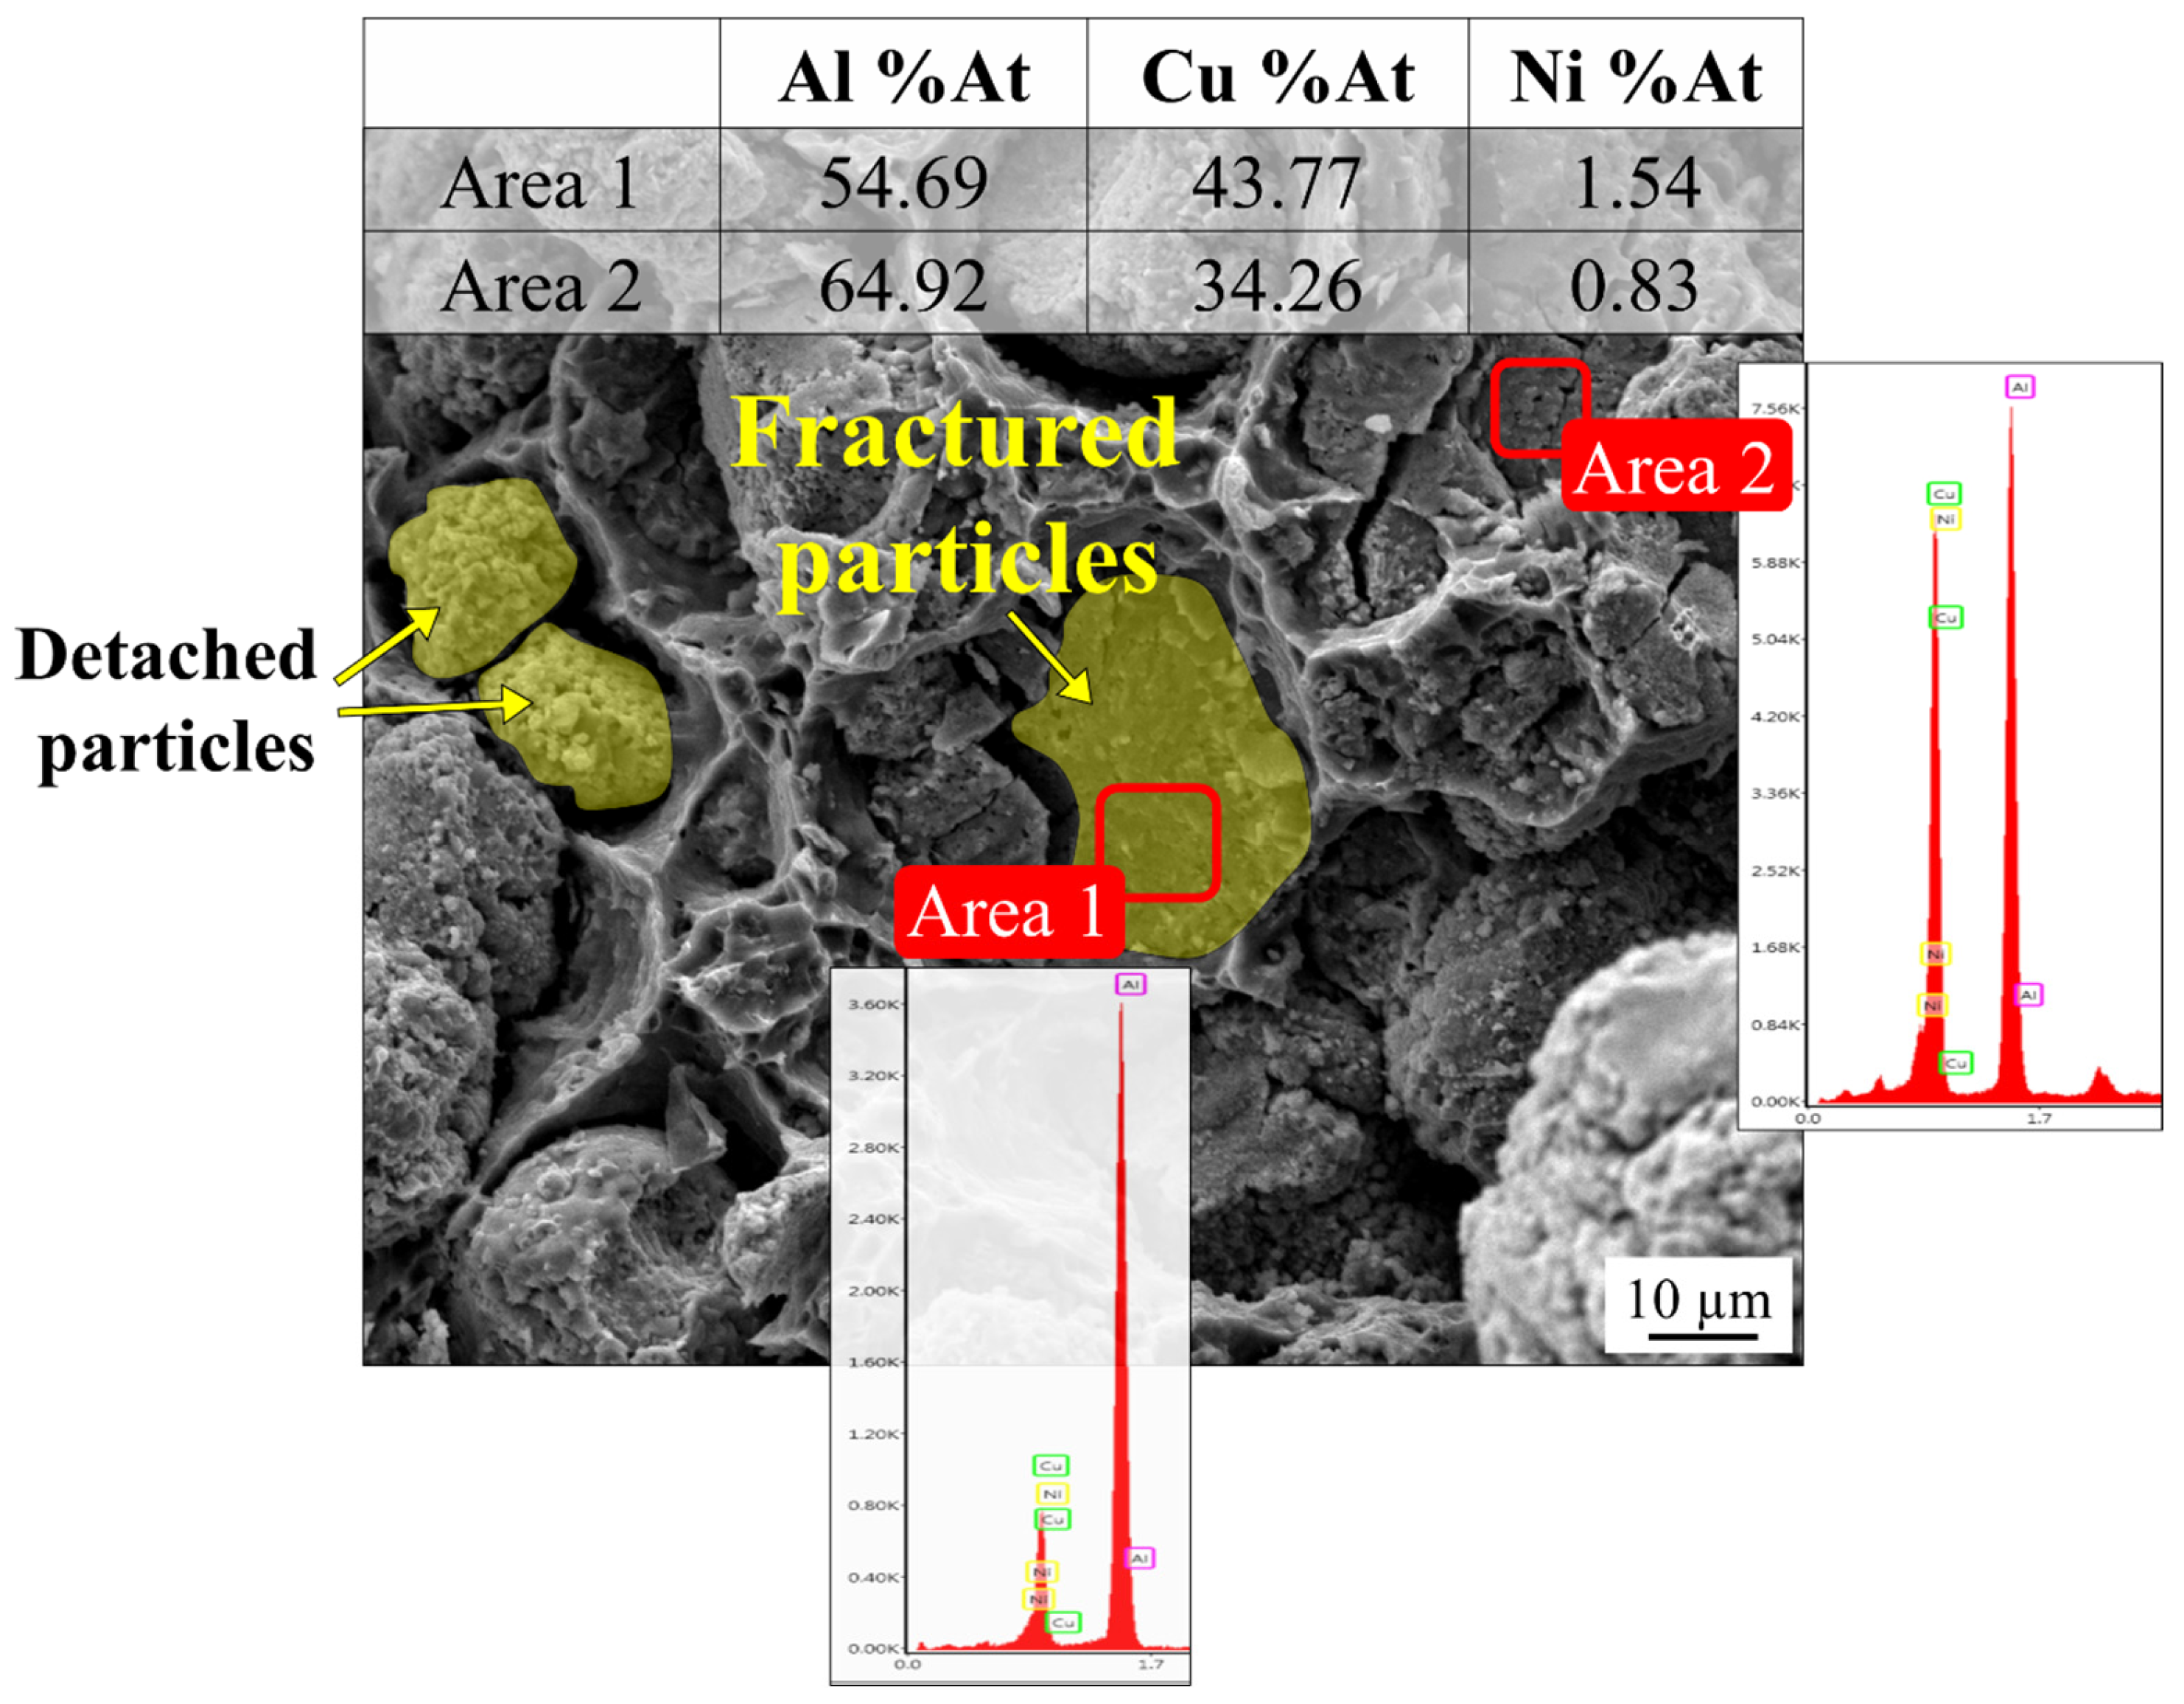
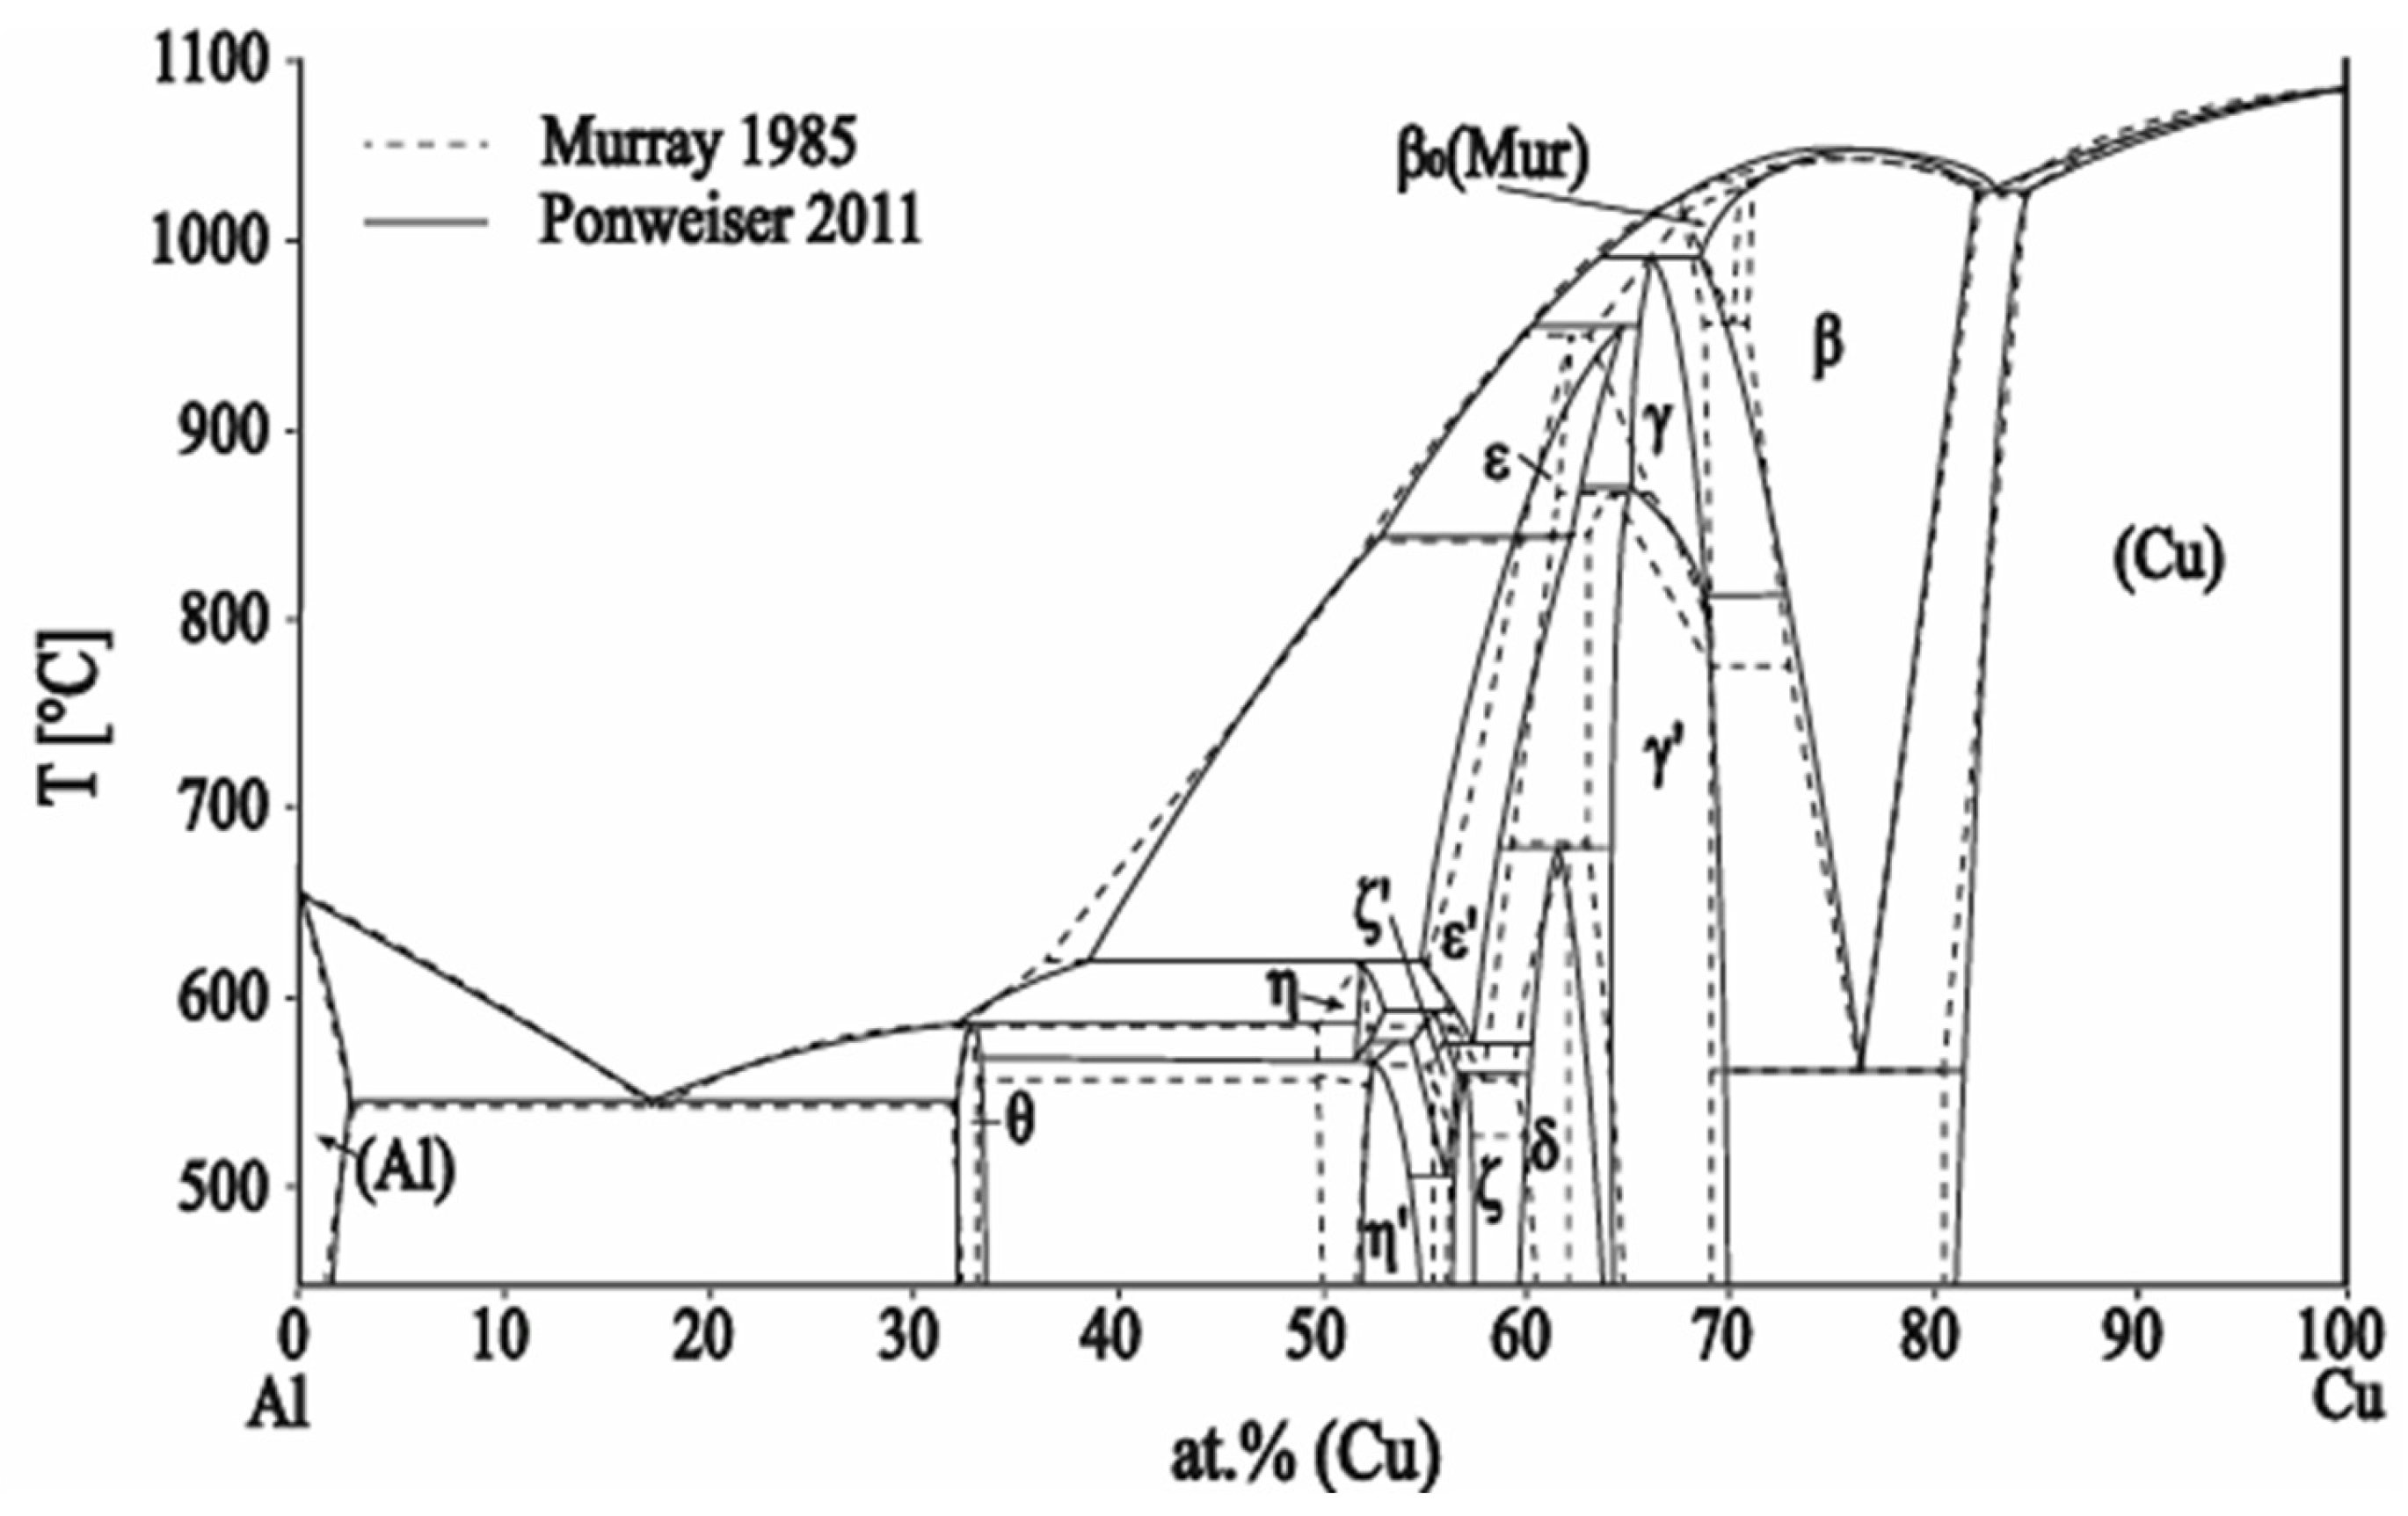
In Figure 20, fracture SEM images of the fracture surfaces of sample B2 are shown. As it is clear from Figure 20, the fracture mode of this sample is also ductile. As it is clear, area 1 consists of 54.69% at Al, 1.54% at Ni, and 43.77% at Cu. The same holds for area 2, in which Ni is present as a solid solution. According to the Al-Cu binary diagram of Figure 21, the chemical compositions of particles in area 1 and area 2 are close to θ + η (CuAl2 + CuAl). In this specimen, the reinforcements are either fractured or detached from the matrix.
A schematic summary of the present work is presented in Figure 22. While no IMC layer was formed in sample A1, a thin IMC layer was formed in sample B1. A higher kinetic of IMC growth during subsequent heat treatment is obvious in sample B2 with respect to sample A2.
The fracture pattern is highly influenced by the reactions and phase transformations that occur during both FSP and post-heat-treatment. In the samples that were heat-treated, a cleavage fracture was observed in the reinforcing particles due to IMCs formation (Figure 18 and Figure 20). For the same reason, a reduction in elongation is also obvious after heat treatment, as was observed in Figure 15b. In the FSP samples without heat treatment, debonding between the particles and the matrix is prevalent due to a lack of perfect bonding between the particles and the matrix.
More accurate estimation of the mechanical properties of the composites needs several tensile specimens. Besides that, a uniform distribution of the particles is necessary to ensure reliability and repeatability of the results. Therefore, the results of the present work should be regarded as an IMC growth mechanism and its effect on the fracture trend rather than quantifying the strength of the obtained composites.

4. Conclusions

The effect of mechanical alloying of Ni-Cu particles used as reinforcements in an Al-matrix composite produced by friction stir processing, as well as the effect of post-heat treatment on the produced composite, was investigated. IMC formation and its effect on fracture behavior were analyzed. The following results have been obtained:
  • Ni-Cu solid solution (Monel particles) with an average crystallite size of 23 nm was obtained after mechanical alloying of Ni and Cu particles.
  • In the Al-matrix composite obtained by FSP using an initial mixture of Ni and Cu particles, IMCs of Al-Cu and Al-Ni were formed around Cu and Ni particles, respectively. The thickness of the IMCs was approximately between 2 and 25 microns. No mixing of Cu and Ni particles occurred during FSP.
  • In the Al-matrix composite obtained by FSP using mechanically alloyed Ni-Cu particles present as Monel, no IMCs were formed around the particles. This was attributed to the hindering effect of the solid solution on the diffusion of Ni and Cu elements.
  • The fracture of the composites occurred in ductile mode, exhibiting dimples on the fracture surface. The particles inside the dimples debond from the matrix when the interface was weak (In samples without heat treatment). The particles failed in a brittle manner in the samples that were heat-treated due to the formation of brittle IMCs at their interface with the matrix.
  • Solid solutioning is an effective way to control IMC growth in metal-matrix composites with metallic reinforcements. This results from the lowering of the activity of the metallic elements through solid solution.

Author Contributions

Conceptualization, R.B., E.A.S.M. and L.F.M.d.S.; methodology, A.B., M.Z.M. and M.B.H.; validation, R.B., M.Z.M. and M.M.K.; formal analysis, M.M.K.; investigation, A.B. and M.B.H.; resources, R.B.;—original draft preparation, M.B.H.; writing—review and editing, M.B.H., R.B., M.Z.M., M.M.K., E.A.S.M., L.F.M.d.S. and A.B.; supervision, R.B.; All authors have read and agreed to the published version of the manuscript.

Funding

This research received no external funding.

Data Availability Statement

Data is contained within the article.

Acknowledgments

The authors thank Arak University for supporting this project.

Conflicts of Interest

The authors declare no conflict of interest.

References

  1. Khodabakhshi, F.; Simchi, A.; Kokabi, A. Surface modifications of an aluminum-magnesium alloy through reactive stir friction processing with titanium oxide nanoparticles for enhanced sliding wear resistance. Surf. Coat. Technol. 2017, 309, 114–123. [Google Scholar] [CrossRef]
  2. Clyne, T.W.; Withers, P.J. An Introduction to Metal Matrix Composites; Cambridge University Press: Cambridge, UK, 1993. [Google Scholar]
  3. Rohatgi, P.K.; Asthana, R.; Das, S. Solidification, structures, and properties of cast metal-ceramic particle composites. Int. Met. Rev. 1986, 31, 115–139. [Google Scholar] [CrossRef]
  4. Geng, R.; Qiu, F.; Jiang, Q. Reinforcement in Al matrix composites: A review of strengthening behavior of nano-sized particles. Adv. Eng. Mater. 2018, 20, 1701089. [Google Scholar] [CrossRef]
  5. Casati, R.; Vedani, M. Metal matrix composites reinforced by nano-particles—A review. Metals 2014, 4, 65–83. [Google Scholar] [CrossRef]
  6. Ostovan, F.; Matori, K.A.; Toozandehjani, M.; Oskoueian, A.; Yusoff, H.M.; Yunus, R.; Ariff, A.H.M. Microstructural evaluation of ball-milled nano Al2O3 particulate-reinforced aluminum matrix composite powders. Int. J. Mater. Res. 2015, 106, 636–640. [Google Scholar] [CrossRef]
  7. Toozandehjani, M.; Matori, K.A.; Ostovan, F.; Aziz, S.A.; Mamat, S. Effect of milling time on the microstructure, physical and mechanical properties of Al-Al2O3 nanocomposite synthesized by ball milling and powder metallurgy. Materials 2017, 10, 1232. [Google Scholar] [CrossRef] [PubMed]
  8. Ostovan, F.; Matori, K.A.; Toozandehjani, M.; Oskoueian, A.; Yusoff, H.M.; Yunus, R.; Ariff, A.H.M.; Quah, H.J.; Lim, W.F. Effects of CNTs content and milling time on mechanical behavior of MWCNT-reinforced aluminum nanocomposites. Mater. Chem. Phys. 2015, 166, 160–166. [Google Scholar] [CrossRef]
  9. Adiga, K.; Herbert, M.A.; Rao, S.S.; Shettigar, A. Applications of reinforcement particles in the fabrication of aluminium metal matrix composites by friction stir processing—A review. Manuf. Rev. 2022, 9, 26. [Google Scholar] [CrossRef]
  10. Tong, X.C. Advanced Materials for Thermal Management of Electronic Packaging; Springer Science & Business Media: New York, NY, USA, 2011; Volume 30. [Google Scholar]
  11. Tong, X.C. High thermal conductivity metal matrix composites. In Advanced Materials for Thermal Management of Electronic Packaging; Springer: New York, NY, USA, 2011; pp. 233–276. [Google Scholar]
  12. Efzan, M.N.E.; Syazwani, N.S.; Abdullah, M.M.A.B. Fabrication method of aluminum matrix composite (AMCs): A review. Key Eng. Mater. 2016, 700, 102–110. [Google Scholar] [CrossRef]
  13. Josyula, S.K.; Narala, S.K.R. Machinability enhancement of stir cast Al-TiCp composites under cryogenic condition. Mater. Manuf. Process. 2017, 32, 1764–1774. [Google Scholar] [CrossRef]
  14. Myalski, J.; Posmyk, A. Processing of sliding hybrid composites with aluminum alloy matrix containing solid lubricants. Mater. Manuf. Process. 2016, 31, 1324–1332. [Google Scholar] [CrossRef]
  15. Gurusamy, P.; Prabu, S.B.; Paskaramoorthy, R. Influence of processing temperatures on mechanical properties and microstructure of squeeze cast aluminum alloy composites. Mater. Manuf. Process. 2015, 30, 367–373. [Google Scholar] [CrossRef]
  16. Soltani, N.; Sadrnezhaad, S.K.; Bahrami, A. Manufacturing wear-resistant 10Ce-TZP/Al2O3 nanoparticle aluminum composite by powder metallurgy processing. Mater. Manuf. Process. 2014, 29, 1237–1244. [Google Scholar] [CrossRef]
  17. Zeren, A. Effect of the graphite content on the tribological properties of hybrid Al/SiC/Gr composites processed by powder metallurgy. Ind. Lubr. Tribol. 2015, 67, 262–268. [Google Scholar] [CrossRef]
  18. Singh, L.K.; Maiti, A.; Maurya, R.S.; Laha, T. Al alloy nanocomposite reinforced with physically functionalized carbon nanotubes synthesized via spark plasma sintering. Mater. Manuf. Process. 2016, 31, 733–738. [Google Scholar] [CrossRef]
  19. Goo, B.-C. Al/SiCp brake discs produced by dissimilar cast-bonding. Mater. Manuf. Process. 2016, 31, 1318–1323. [Google Scholar] [CrossRef]
  20. Gao, Q.; Yang, B.; Mei, H.; Wu, H. Microstructure and wear resistance of semisolid TiB2/7050 composites produced by serpentine tube pouring technique. Mater. Manuf. Process. 2016, 31, 1029–1036. [Google Scholar] [CrossRef]
  21. Kumar, C.S.; Yadav, D.; Bauri, R.; Ram, G.J. Effects of ball milling and particle size on microstructure and properties 5083 Al–Ni composites fabricated by friction stir processing. Mater. Sci. Eng. A 2015, 645, 205–212. [Google Scholar] [CrossRef]
  22. Shorowordi, K.; Laoui, T.; Haseeb, A.; Celis, J.; Froyen, L. Microstructure and interface characteristics of B4C, SiC and Al2O3 reinforced Al matrix composites: A comparative study. J. Mater. Process. Technol. 2003, 142, 738–743. [Google Scholar] [CrossRef]
  23. Yadav, D.; Bauri, R. Nickel particle embedded aluminium matrix composite with high ductility. Mater. Lett. 2010, 64, 664–667. [Google Scholar] [CrossRef]
  24. Mishra, R.S.; Ma, Z.Y. Friction stir welding and processing. Mater. Sci. Eng. R Rep. 2005, 50, 1–78. [Google Scholar] [CrossRef]
  25. Charandabi, F.K.; Jafarian, H.R.; Mahdavi, S.; Javaheri, V.; Heidarzadeh, A. Modification of microstructure, hardness, and wear characteristics of an automotive-grade Al-Si alloy after friction stir processing. J. Adhes. Sci. Technol. 2021, 35, 2696–2709. [Google Scholar] [CrossRef]
  26. Zhang, Y.N.; Cao, X.; Larose, S.; Wanjara, P. Review of tools for friction stir welding and processing. Can. Met. Q. 2012, 51, 250–261. [Google Scholar] [CrossRef]
  27. Wang, G.-Q.; Zhao, Y.-H.; Tang, Y.-Y. Research progress of bobbin tool friction stir welding of aluminum alloys: A review. Acta Met. Sin. Engl. Lett. 2020, 33, 13–29. [Google Scholar] [CrossRef]
  28. Wei, Y.; Li, J.; Xiong, J.; Huang, F.; Zhang, F.; Raza, S.H. Joining aluminum to titanium alloy by friction stir lap welding with cutting pin. Mater. Charact. 2012, 71, 1–5. [Google Scholar] [CrossRef]
  29. Krishnan, M.M.; Maniraj, J.; Deepak, R.; Anganan, K. Prediction of optimum welding parameters for FSW of aluminium alloys AA6063 and A319 using RSM and ANN. Mater. Today Proc. 2018, 5, 716–723. [Google Scholar] [CrossRef]
  30. Jain, V.K.S.; Varghese, J.; Muthukumaran, S. Effect of first and second passes on microstructure and wear properties of titanium dioxide-reinforced aluminum surface composite via friction stir processing. Arab. J. Sci. Eng. 2019, 44, 949–957. [Google Scholar] [CrossRef]
  31. Eftekhari, M.; Movahedi, M.; Kokabi, A.H. Microstructure, strength, and wear behavior relationship in Al-Fe3O4 nanocomposite produced by multi-pass friction stir processing. J. Mater. Eng. Perform. 2017, 26, 3516–3530. [Google Scholar] [CrossRef]
  32. Panaskar, N.J.; Sharma, A. Surface modification and nanocomposite layering of fastener-hole through friction-stir processing. Mater. Manuf. Process. 2014, 29, 726–732. [Google Scholar] [CrossRef]
  33. Madhu, H.C.; Kumar, P.A.; Perugu, C.S.; Kailas, S.V. Microstructure and mechanical properties of friction stir process derived Al-TiO2 nanocomposite. J. Mater. Eng. Perform. 2018, 27, 1318–1326. [Google Scholar] [CrossRef]
  34. Khorrami, M.S.; Kazeminezhad, M.; Miyashita, Y.; Kokabi, A.H. Improvement in the mechanical properties of Al/SiC nanocomposites fabricated by severe plastic deformation and friction stir processing. Int. J. Miner. Met. Mater. 2017, 24, 297–308. [Google Scholar] [CrossRef]
  35. Mahmoud, E.R.I.; Ikeuchi, K.; Takahashi, M. Fabrication of SiC particle reinforced composite on aluminium surface by friction stir processing. Sci. Technol. Weld. Join. 2008, 13, 607–618. [Google Scholar] [CrossRef]
  36. Mahmoud, E.R.I.; Takahashi, M.; Shibayanagi, T.; Ikeuchi, K. Effect of friction stir processing tool probe on fabrication of SiC particle reinforced composite on aluminium surface. Sci. Technol. Weld. Join. 2009, 14, 413–425. [Google Scholar] [CrossRef]
  37. Liu, Q.; Ke, L.; Liu, F.; Huang, C.; Xing, L. Microstructure and mechanical property of multi-walled carbon nanotubes reinforced aluminum matrix composites fabricated by friction stir processing. Mater. Des. 2013, 45, 343–348. [Google Scholar] [CrossRef]
  38. Thangarasu, A.; Murugan, N.; Dinaharan, I.; Vijay, S.J. Microstructure and microhardness of AA1050/TiC surface composite fabricated using friction stir processing. Sadhana 2012, 37, 579–586. [Google Scholar] [CrossRef]
  39. Dixit, M.; Newkirk, J.W.; Mishra, R.S. Properties of friction stir-processed Al 1100–NiTi composite. Scr. Mater. 2007, 56, 541–544. [Google Scholar] [CrossRef]
  40. Ahmadifard, S.; Kazemi, S.; Momeni, A. A356/TiO2 nanocomposite fabricated by friction stir processing: Microstructure, mechanical properties and tribologic behavior. JOM 2018, 70, 2626–2635. [Google Scholar] [CrossRef]
  41. Shojaeefard, M.H.; Akbari, M.; Asadi, P.; Khalkhali, A. The effect of reinforcement type on the microstructure, mechanical properties, and wear resistance of A356 matrix composites produced by FSP. Int. J. Adv. Manuf. Technol. 2017, 91, 1391–1407. [Google Scholar] [CrossRef]
  42. Golmohammadi, M.; Atapour, M.; Ashrafi, A. Fabrication and wear characterization of an A413/Ni surface metal matrix composite fabricated via friction stir processing. Mater. Des. 2015, 83, 471–482. [Google Scholar] [CrossRef]
  43. Eskandari, H.; Taheri, R.; Khodabakhshi, F. Friction-stir processing of an AA8026-TiB2-Al2O3 hybrid nanocomposite: Microstructural developments and mechanical properties. Mater. Sci. Eng. A 2016, 660, 84–96. [Google Scholar] [CrossRef]
  44. Dinaharan, I. Influence of ceramic particulate type on microstructure and tensile strength of aluminum matrix composites produced using friction stir processing. J. Asian Ceram. Soc. 2016, 4, 209–218. [Google Scholar] [CrossRef]
  45. Ostovan, F.; Hasanzadeh, E.; Toozandehjani, M.; Shafiei, E.; Jamaludin, K.R.; Amrin, A.B. A combined friction stir processing and ball milling route for fabrication Al5083-Al2O3 nanocomposite. Mater. Res. Express 2019, 6, 065012. [Google Scholar] [CrossRef]
  46. Narimani, M.; Lotfi, B.; Sadeghian, Z. Investigating the microstructure and mechanical properties of Al-TiB2 composite fabricated by Friction Stir Processing (FSP). Mater. Sci. Eng. A 2016, 673, 436–442. [Google Scholar] [CrossRef]
  47. Ungár, T. The Meaning of Size Obtained from Broadened X-ray Diffraction Peaks. Adv. Eng. Mater. 2003, 5, 323–329. [Google Scholar] [CrossRef]
  48. Zhou, Y.; Zheng, C.; Chen, J.; Chen, A.; Jia, L.; Xie, H.; Lu, Z. Characterizations on Precipitations in the Cu-Rich Corner of Cu-Ni-Al Ternary Phase Diagram. Crystals 2023, 13, 274. [Google Scholar] [CrossRef]
  49. Porter, D.A.; Easterling, K.E. Phase Transformations in Metals and Alloys (Revised Reprint); CRC Press: Boca Raton, FL, USA, 2009. [Google Scholar]
  50. Brown, A.; Ashby, M. Correlations for diffusion constants. Acta Metall. 1980, 28, 1085–1101. [Google Scholar] [CrossRef]
  51. Wazzan, A.R. Lattice and grain boundary self-diffusion in nickel. J. Appl. Phys. 1965, 36, 3596–3599. [Google Scholar] [CrossRef]
  52. Jönsson, B. Ferromagnetic ordering and diffusion of carbon and nitrogen in bcc Cr-Fe-Ni alloys. Int. J. Mater. Res. 1994, 85, 498–501. [Google Scholar] [CrossRef]
  53. Belova, I.; Sohn, Y.; Murch, G. Measurement of tracer diffusion coefficients in an interdiffusion context for multicomponent alloys. Philos. Mag. Lett. 2015, 95, 416–424. [Google Scholar] [CrossRef]
  54. Schulz, E.A.; Mehta, A.; Belova, I.V.; Murch, G.E.; Sohn, Y. Simultaneous measurement of isotope-free tracer diffusion coefficients and interdiffusion coefficients in the Cu-Ni system. J. Phase Equilibria Diffus. 2018, 39, 862–869. [Google Scholar] [CrossRef]
  55. BWierzba, B.; Skibiński, W. The interdiffusion in copper-nickel alloys. J. Alloys Compd. 2016, 687, 104–108. [Google Scholar] [CrossRef]
  56. Karakulak, E.; Koç, F.G.; Yamanoglu, R.; Zeren, M. Mechanical properties of hypoeutectic Al-Ni alloys with Al3Ni intermetallics. Mater. Test. 2016, 58, 117–121. [Google Scholar] [CrossRef]
  57. Zobac, O.; Kroupa, A.; Zemanova, A.; Richter, K.W. Experimental Description of the Al-Cu Binary Phase Diagram. Met. Mater. Trans. A 2019, 50, 3805–3815. [Google Scholar] [CrossRef]
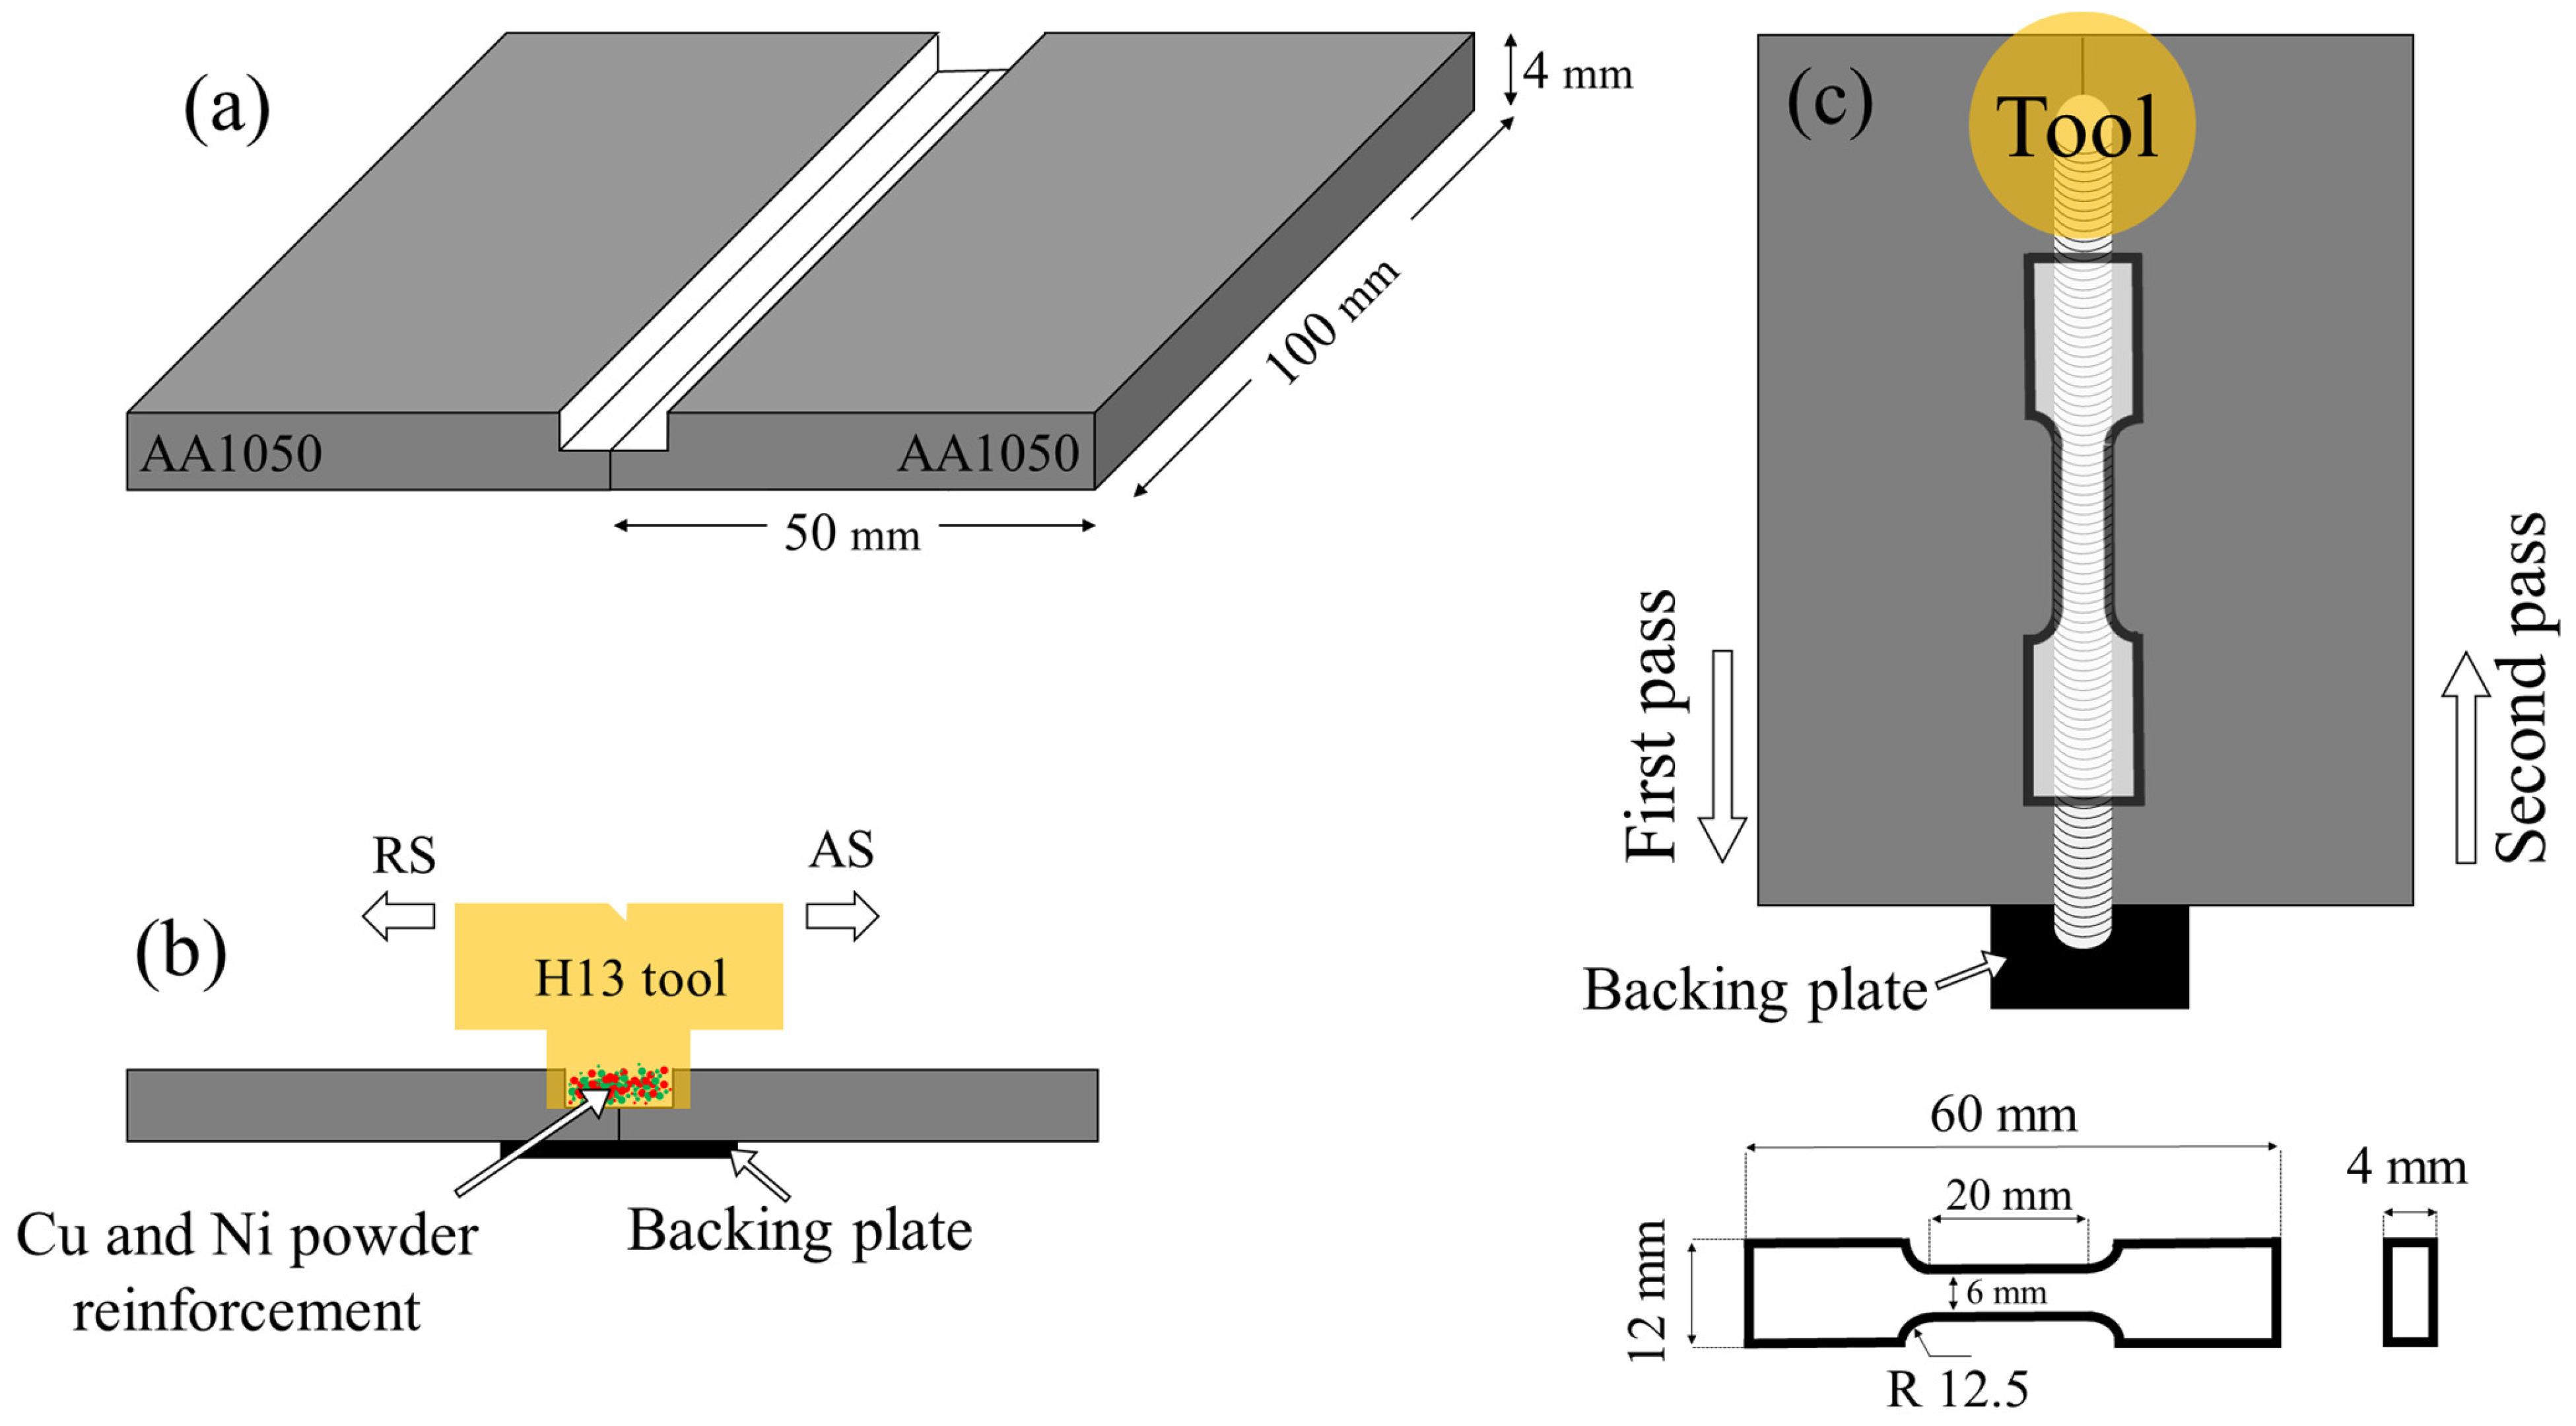
Figure 1. (a) Schematic of groove and dimensions of AA1050 pieces, (b) front view of FSP with Cu and Ni powders reinforcement, and (c) welding direction and dimension of tensile sample from upper view.
Jmmp 09 00364 g001
Figure 2. Schematic of the step-by-step fabrication processes for A1, A2, B1, and B2 components.
Jmmp 09 00364 g002
Figure 3. (a) XRD analysis for as-mixed Monel powder and powder after 40 h ball milling, and (b) SEM images in BSE mode of ball-milled Monel powder.
Jmmp 09 00364 g003
Figure 4. SEM images of (a,b) sample A1, (c,d) sample B1, (e,f) sample A2, and (g,h) sample B2.
Jmmp 09 00364 g004
Figure 5. (a) SEM image of sample A1 and EDS analysis taken from 3 spots. (bd) Elemental mapping of Al, Ni, and Cu.
Jmmp 09 00364 g005
Figure 6. (a) SEM image of sample A2 along with EDS analyses taken from different points. (bd) Elemental mapping of Al, Ni, and Cu.
Jmmp 09 00364 g006
Figure 7. (a) Al-Ni-Cu ternary phase diagram at 500 °C and (b) Al-Ni binary phase diagram [48].
Jmmp 09 00364 g007
Figure 8. (a) SEM images of sample B1 in which line scan has been given for Al, Ni, and Cu from particles in the Al-matrix, (b,f) SEM image in back scatter from reinforcing particles. (ce,gi) Elemental mapping for Al, Ni, and Cu.
Jmmp 09 00364 g008
Figure 9. (a,b) Overlapped elemental mapping of Ni and Cu particles in sample B1.
Jmmp 09 00364 g009
Figure 10. (a) SEM images of sample B2, (b,c) EDS analysis from 2 points and Line scan of Al, Ni, and Cu, (dg) elemental mapping for Al, Ni, and Cu, and (h) overlapped elemental mapping of Ni and Cu particles.
Jmmp 09 00364 g010
Figure 11. Average size of IMCs layer thickness and particle size in samples A1, A2, B1, and B2 during FSP.
Jmmp 09 00364 g011
Figure 12. TEM images of sample B1 from Monel particles and EDS analysis from different points and areas.
Jmmp 09 00364 g012
Figure 13. (a,b) TEM image of sample A1 and atomic percentage of Al, Cu, Ni, and other elements from different areas.
Jmmp 09 00364 g013
Figure 14. (a) TEM image of sample A2 and (b,c) TEM images of the newly formed grain after annealing heat treatment in samples B2 and A2 with EDS analysis.
Jmmp 09 00364 g014
Figure 15. (a) engineering stress-engineering strain curve for samples A1, A2, B1, B2, and pure Al, (b) Differences in UTS, yield strength, and elongation for samples A1, A2, B1, B2, and pure Al, and (cf) samples A1, A2, B1, and B2 after necking and fracture.
Jmmp 09 00364 g015
Figure 16. Micro-hardness samples A1, A2, B1, and B2.
Jmmp 09 00364 g016
Figure 17. (a,b) Fracture SEM images of sample A1 and EDS analysis from reinforcement particles and different areas.
Jmmp 09 00364 g017
Figure 18. (ae) Fracture SEM images of sample A2 and EDS analysis from reinforcement particles.
Jmmp 09 00364 g018
Figure 19. (ad) Fracture SEM images of sample B1 and EDS analysis from different areas.
Jmmp 09 00364 g019
Figure 20. Fracture SEM images of sample B2 and EDS analysis from different areas.
Jmmp 09 00364 g020
Figure 21. Al-Cu binary diagram [57].
Jmmp 09 00364 g021
Figure 22. Schematic of the process showing FSP with as-mixed and ball-milled powders and subsequent heat treatment of the Al-matrix composites. The thicknesses of IMCs in each case are illustrated for samples A1, A2, B1, and B2.
Jmmp 09 00364 g022
Table 1. Chemical composition and mechanical properties of AA1050.
Elements (%at)
TiZnMgCuSiMnAlFe
AA10500.0280.0290.0560.0210.2410.02599.4060.194
Hardness (Brinell)Yield strength (Mpa)Tensile strength (Mpa)
AA1050-O212876
AA1050-H143410311
Table 2. The specifications, features, pieces, and completed images.
Pieces NameRemark/Heat Treatment ConditionImages
A1Mechanical Alloyed reinforcement/As-weldJmmp 09 00364 i001
A2Mechanical Alloyed reinforcement/500 °C for 2 hJmmp 09 00364 i002
B1Without Mechanical Alloying/As-weldJmmp 09 00364 i003
B2Without Mechanical Alloying/500 °C for 2 hJmmp 09 00364 i004
Table 3. Miller indices of ball-milled powder after 40 h of mechanical alloying.
Peak2θ (°)θ (°) S i n 2 θ S i n 2 θ / S i n 2 θ  First peak(h k l)
14321.50.1341(1 1 1)
250250.1791.34(2 0 0)
374370.3612.69(2 2 0)
Table 4. Lattice parameter for ball-milled powder after 40 h of mechanical alloying.
Peak(h k l) h 2 × k 2 × l 2 d (A°)ɑ (A°)
1(1 1 1)32.103.64
2(2 0 0)41.823.64
3(2 2 0)81.283.62
Table 5. Crystallite size of ball milled powder after 40 h mechanical alloying.
Peak2θ (°)θ (°)FWHM (°)β (rad)cosθD (nm)
14321.50.30.005240.93326.3
250250.350.006110.90622.8
374370.40.006980.79819.8
Table 6. Substitutional self-diffusion data for Cu and Ni.
∆H (KJ·mol−1)D0 (m2·s−1)∆H/RTmReference
Cu200.3 3.1 × 10−517.78 [50]
Ni279.7 1.9 × 10−419.5 [51]
Disclaimer/Publisher’s Note: The statements, opinions and data contained in all publications are solely those of the individual author(s) and contributor(s) and not of MDPI and/or the editor(s). MDPI and/or the editor(s) disclaim responsibility for any injury to people or property resulting from any ideas, methods, instructions or products referred to in the content.