Article

Features of Structural–Phase Changes and Tribological Behavior of Tool Steel After Vacuum and Plasma Electrolytic Nitriding

by
Marina A. Volosova
1,
Sergei A. Kusmanov
1,2,*,
Tatiana L. Mukhacheva
1,2,
Ivan V. Tambovskiy
1,2,
Artem O. Komarov
1,
Andrey E. Smirnov
3,
Svetlana F. Katerzhina
2,
Igor V. Suminov
1 and
Sergey N. Grigoriev
1
1
Department of High-Efficiency Machining Technologies, Moscow State University of Technology “STANKIN”, 127994 Moscow, Russia
2
Department of Mathematical and Natural Sciences, Kostroma State University, 156005 Kostroma, Russia
3
Department of Materials Science, Bauman Moscow State Technical University, 105005 Moscow, Russia
*
Author to whom correspondence should be addressed.
J. Manuf. Mater. Process. 2025, 9(11), 380; https://doi.org/10.3390/jmmp9110380
Submission received: 4 October 2025 / Revised: 15 November 2025 / Accepted: 16 November 2025 / Published: 19 November 2025

Abstract

Nitriding is one of the technologies used to improve the performance properties of tool steels. In addition to traditional gas nitriding, technologies aimed at increasing the productivity and/or efficiency of processing have found application in industry. This paper presents the results of using vacuum and plasma electrolytic nitriding to improve the wear resistance of M2 high-speed steel, as well as prospects for further development of these technologies. XRD and SEM methods were used to study the structural and phase changes in the surface layers, showing the formation of layers of connections hardened to 1200–1300 HV. Tribological tests were carried out under dry friction conditions according to the shaft-shoe scheme with varying sliding speed. The mechanism of contact interaction during the friction of nitrided steel was established. It is shown that plastic deformations are the prevailing type of deformation. The mechanism of destruction of the surface layer is fatigue wear during dry friction without lubrication. This provides an increase in wear resistance by 6–29 times.

1. Introduction

Short-term nitriding of cutting and rolling tools (drills, taps, knurling tools, etc.) made of high-speed steel increases their wear resistance by 1.5–2 times. Strength, especially impact strength after nitriding, decreases with increasing depth of the diffusion layer. The best combination of mechanical properties, wear resistance, and heat resistance for high-speed steel tools is achieved with a nitrided layer thickness of 0.01–0.025 mm. For these purposes, it is recommended to nitride high-speed steel tools at 510–520 °C. To increase impact strength and more uniformly release carbides throughout the grain volume, it is recommended to temper three times at 550 °C for one hour at each stage after chemical–thermal treatment. After the specified nitriding modes, a nitrided layer with a high hardness of 1340–1460 HV and heat resistance (hardness of 700 HV is maintained up to 700 °C) is formed. The hardness of the nitrided layer increases as the α solid solution is alloyed [1]. In nitrided products, favorable compressive residual stresses arise, which are maintained throughout the entire depth of the diffusion layer and increase the resistance of the material to alternating loads [2].
Good results are obtained by the nitrohardening method in combination with surface induction heating or glow discharge heating [3,4]. The process of nitriding followed by induction hardening also contributes to an increase in corrosion resistance since, with a short austenitization time, nitrogen and carbon do not have time to be removed from the layer, and the anticorrosive carbonitride ε-phase is preserved on the surface of the steel being processed.
The method of strengthening crankshafts is based on the combination of induction hardening and nitriding processes. After nitriding at 510–565 °C, induction hardening of the main and connecting rod journals is carried out, and then induction hardening of the fillets. During the hardening process, the white layer of iron nitrides disappears. The surface hardness reaches 700 HV. The prospects for using nitriding on carburized products have been noted [5].
In some cases, such as for dies and molds that are subject to high loads but not subject to grinding, nitriding is used before hardening [6]. A significant effect has been noted when combining nitriding with hardening on high-carbon steels [7]. This process, called the “marstressing process”, ensures high hardness, increased fatigue limit, and wear resistance, as well as high corrosion resistance of high-carbon steels. It is noted that the nitrided layer has high wear resistance and impact strength, which leads to an increase in the service life of cutting dies by three to four times compared to dies that have undergone conventional heat treatment [8].
Thus, nitriding allows for improving the performance characteristics of tool steels significantly.
Progressive technologies of chemical–thermal treatment include vacuum nitriding (VN) and plasma electrolytic treatment. VN combines the advantages of vacuum heat treatment and gas nitriding. It is characterized by a stronger connection between the nitrided layer and the substrate than gas nitriding. VN for 12 h at a temperature of 520 °C significantly increases the hardness and wear resistance of steel with a high manganese content due to the appearance of iron nitrides Fe3N and Fe4N in the structure, as well as the ε-phase. The resulting nitride layer exhibits high adhesion to the substrate. A positive effect of nitriding on corrosion resistance has been noted [9]. VN of punches made of high-speed tool steel for 1 h after quenching in oil from a temperature of 1220 °C and triple tempering at 560 °C leads to the formation of nitrides of alloying elements V, W, Mo, and Cr in the diffusion layer, which ensures an increase in the service life of punches up to 8 times [10]. VN allows for obtaining precision nitrided parts with a controlled thickness of the ε-phase on the surface, depending on the operating conditions of a specific part [11].
Plasma electrolytic treatment is a high-speed surface treatment method. High heating rates in electrolytic plasma, reaching 100 °C/s, promote an increase in the diffusion susceptibility of blocks inside austenite grains. This leads to a reduction in the formation time of diffusion layers and the total duration of treatment to 5–10 min with anodic polarity of the workpiece [12]. This method can be used for carburizing [13], nitriding [14,15,16], carbonitriding [17,18], nitrocarburizing [19], and boriding [20]. This technology has found application in improving the performance characteristics of products made of various materials, such as titanium alloys [21,22], carbon steels [23,24], and alloy steels, including 42CrMo [25], 40Cr [26], 30CrMnSiA [27], AISI H13 [28], T8 [29], 38CrMoAl [30], 20CrMnTi [31], 30CrMnSi [32], and others.
Under cathodic plasma electrolytic nitriding (PEN) conditions, a similar high-speed tool steel was previously treated at a temperature of 550–750 °C for 5 min with the formation of a fine-grained martensitic structure with dispersed inclusions of insoluble carbides and nitrides [14]. The same results were obtained with PEN of P9 and P18 steels [15]. According to the available results of elemental analysis, the highest concentration of nitrogen is observed in martensite grains (5.87%), and carbonitride grains contain 1.37% nitrogen [16]. Light grains of carbides are enriched with tungsten and molybdenum, and dark grains are enriched with vanadium.
Thus, VN and cathodic PEN enable the formation of structures with altered phase composition in the surface layers of high-alloy steels. This paper presents the results of studying the possibility of nitriding M2 tool high-speed steel using plasma electrolytic treatment methods with anodic polarity of the processed products (anodic PEN) and VN. The use of anodic polarity opens up prospects for combining diffusion saturation and polishing, which, in the future, will improve the manufacturability of production [33]. The results of structural and phase changes in nitrided samples, as well as tribological tests, are presented. In addition to considering each technology separately, a combination of VN with subsequent hardening under plasma electrolytic heating conditions is proposed. This combination is proposed to solve the problem of nitrogen diffusion from the surface layers into the volume of the part during traditional hardening of nitrided tool steels, when the parts are slowly heated in a furnace to a hardening temperature of 1230 °C. As a result, the nitrided surface layer is completely destroyed. At the heating rates for hardening in the plasma electrolytic treatment (about 100 °C per second), the diffusion of nitrogen from the saturated surface does not have time to occur, and the modified nitrided layer is preserved. VN ensures a greater depth of the nitrided layer than PEN and the absence of surface oxidation in a vacuum. The combination of high-speed plasma hardening performed after VN, in addition to preserving the nitrided layer, prevents grain coarsening due to rapid heating and the associated deterioration in the volume properties of tool steel. All this determines the scientific novelty and originality of this study.

2. Materials and Methods

2.1. Materials

Cylindrical samples of M2 high-speed tool steel with a height of 15 mm and a diameter of 10 mm were subjected to nitriding (Table 1). Before and after treatment, the samples were washed in an ultrasonic bath with acetone and then dried.

2.2. Processing

2.2.1. Plasma Electrolytic Nitriding

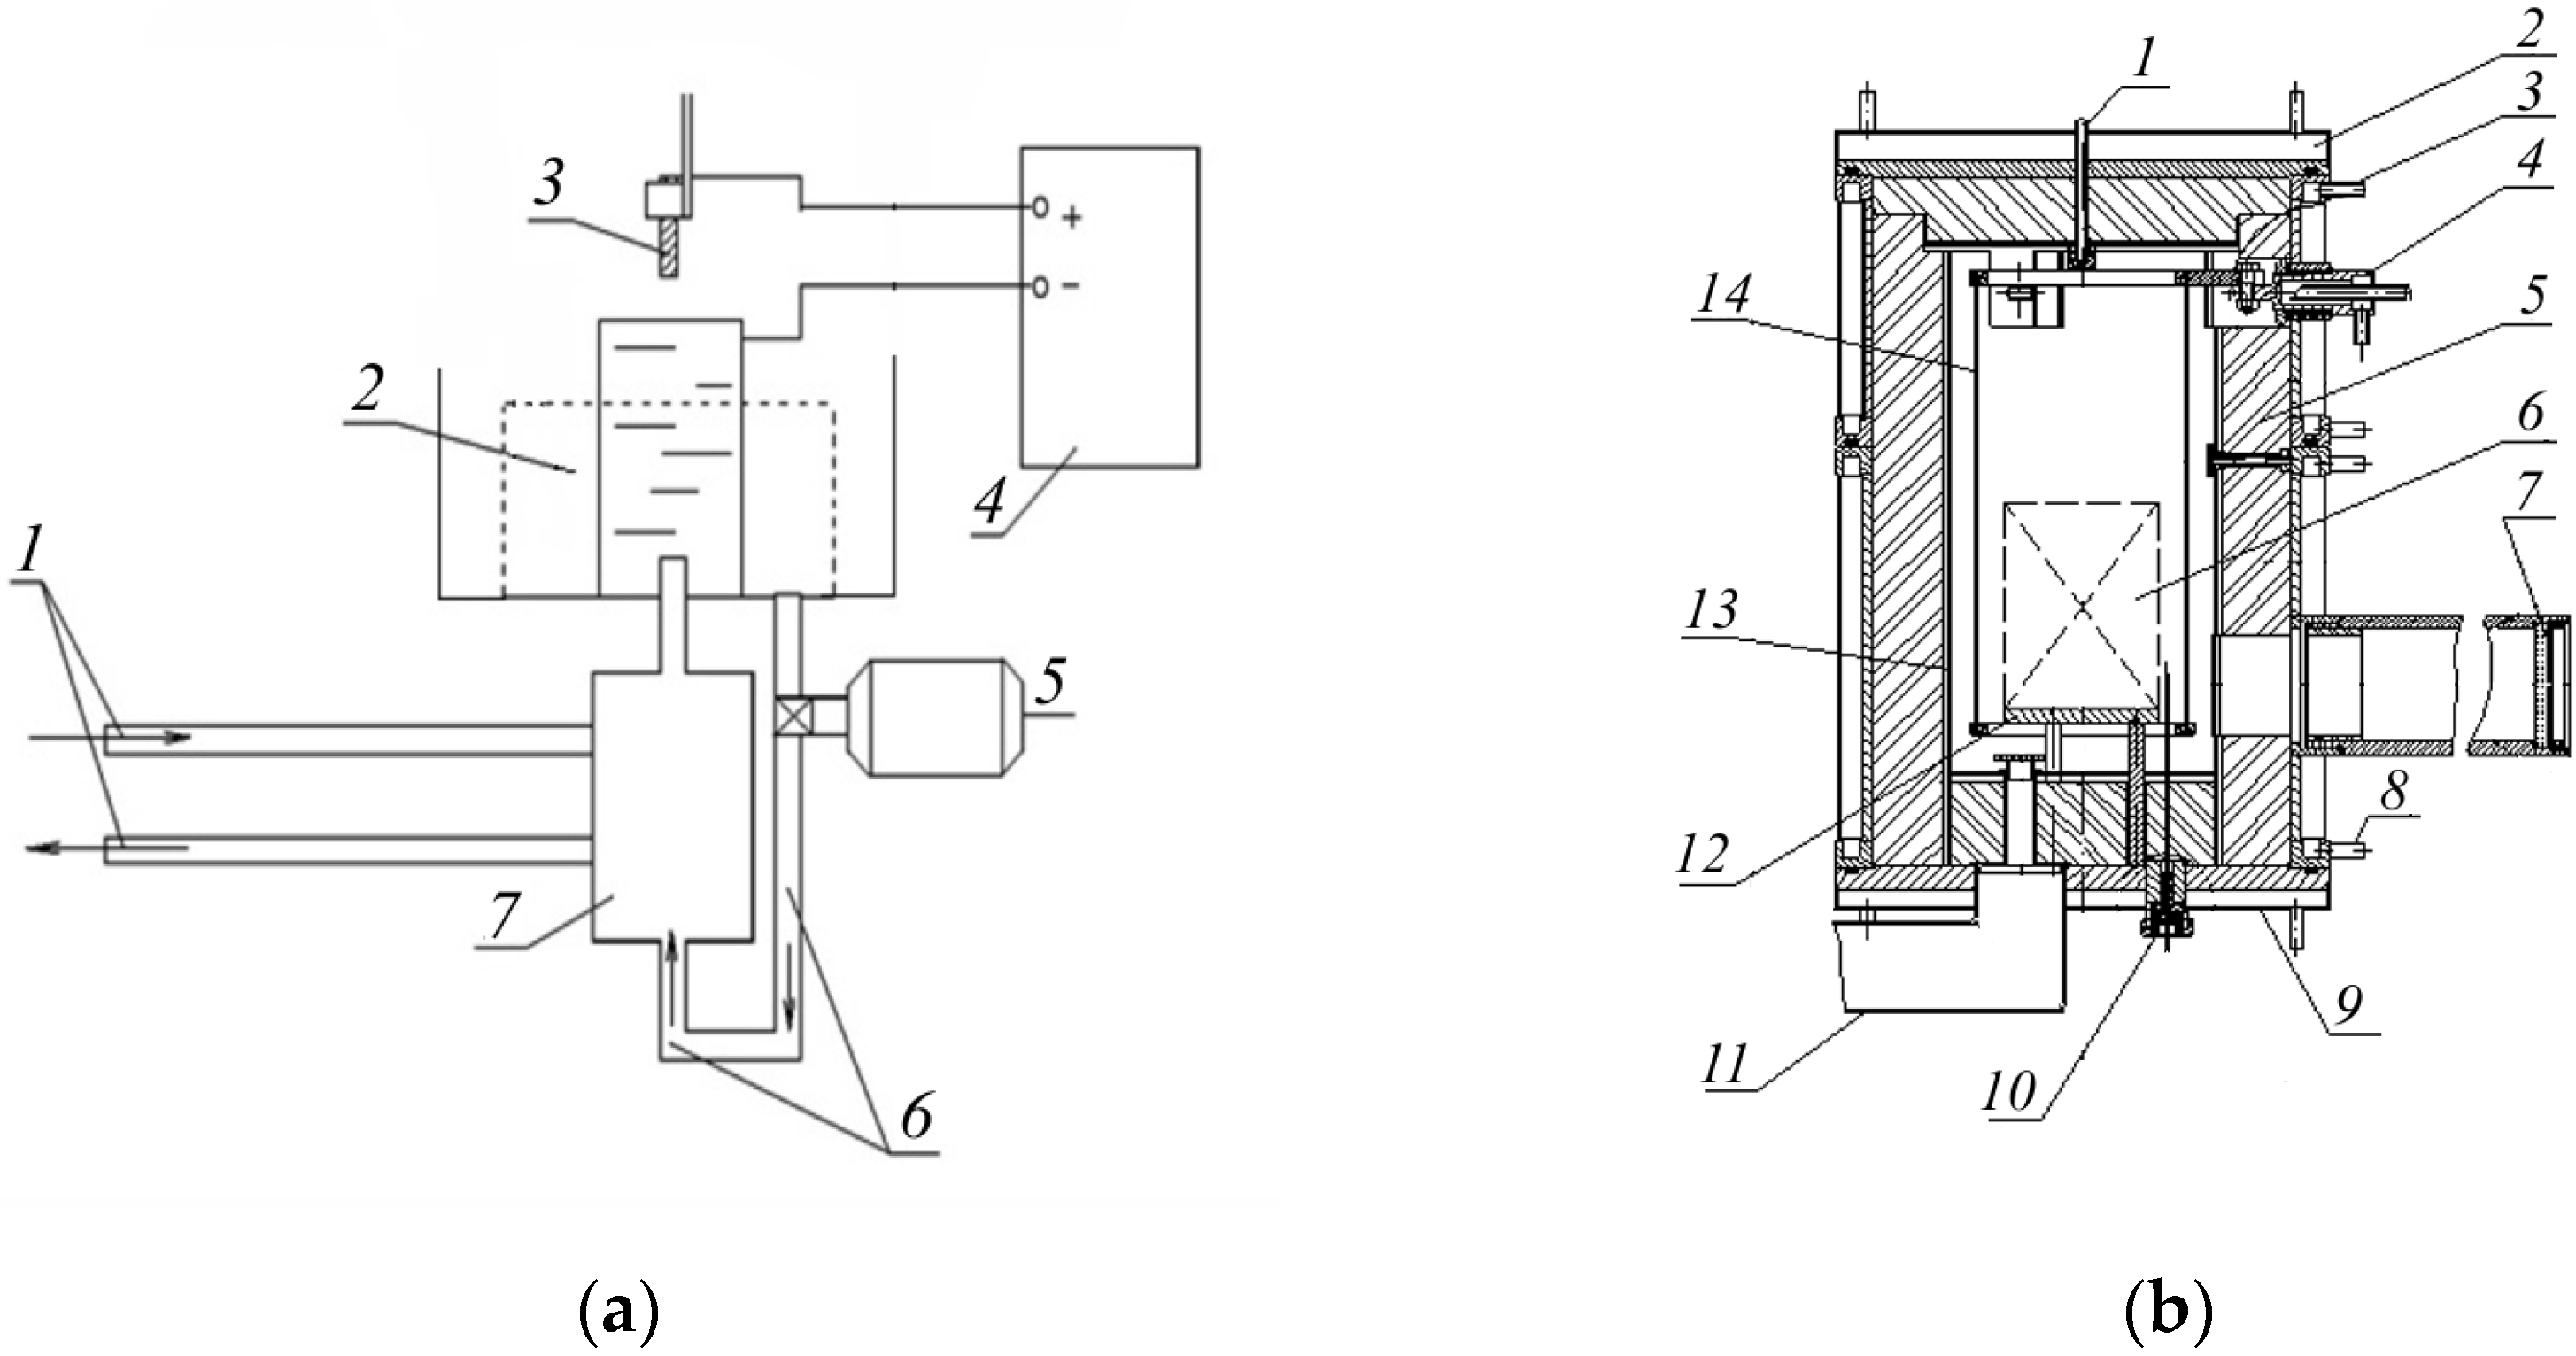
PEN was carried out on a pilot setup with a vertical flow of electrolyte around the workpiece (Figure 1a). This design allowed for uniform heating of the workpiece along the vertical coordinate and obtaining uniform properties. During processing, the sample was connected to a DC source. An electrolyzer was connected to the opposite pole of the current source. The electrolyte was fed into the electrolyzer using a pump at a constant rate of 2.5 L/min through a heat exchanger, which ensured a constant electrolyte temperature of 22 ± 2 °C. The heating temperature was controlled by regulating the voltage.
PEN was carried out in an aqueous solution of ammonia (5%) and ammonium chloride (10%) at a temperature of 550 °C with a holding time of 10 min (voltage is 120 V, current is 12 A). To maintain a stable temperature during low-temperature nitriding, diffusion saturation was carried out with the anodic polarity of the processed samples. After diffusion saturation, hardening was carried out in the same setup by changing the electrophysical parameters of the processing. To avoid cracking due to the low thermal conductivity of steel, the samples were slowly heated to a temperature of 850 °C (voltage of 180 V; current of 8 A) with a subsequent holding time of 1.5 min. Then, the polarity was switched on the current source, and heating was carried out to a temperature of 1230 °C (voltage of 105 V; current of 15 A) with cathodic polarity of the sample. The change in polarity from anodic to cathodic was due to the impossibility of reaching a temperature above 1100 °C with anodic polarity. The selected quenching temperature ensured the production of high-alloy martensite due to the transition of the maximum amount of special carbides into solution. After holding for 1.5 min at this temperature, the sample was removed from the electrolyte and quenched in air.
In order to transform the residual austenite remaining in the structure after quenching (Q) into martensite, three tempering (T) cycles were performed at a temperature of 555 °C with a 60 min hold and air cooling between heating cycles. In this process, dispersed carbides are released from martensite and residual austenite. Austenite loses carbon and alloying elements, becomes less stable, and undergoes martensitic transformation. A single tempering creates additional stresses. The second and third tempering cycles allow these stresses to be relieved and higher mechanical properties to be obtained compared to a single tempering cycle. Removal of internal stresses is especially important for complex-shaped tools.

2.2.2. Vacuum Nitriding

Vacuum nitriding was carried out on a pilot setup. The setup consists of a reaction chamber, vacuum–gas and electrical systems, and systems for regulating the main process parameters. The reaction chamber of the setup is a sealed water-cooled vessel (Figure 1b). The cage is located on a special table installed at the bottom of the chamber. In one cycle, the cage can accommodate up to 15 samples of 15 mm in height and 10 mm in diameter.
The power supply system of the setup provides a method of heating the parts by radiation from resistance heaters installed in the chamber. Carbon–graphite fabric placed on specially designed current leads is used as the heating element. Thermal insulation made of carbon–graphite felt is installed between the heaters and the chamber walls to reduce heat loss.
The gas preparation system ensures a metered supply of the working environment into the chamber. It consists of a cylinder station, a pipeline system with reducers, and automatic regulators of the gas environment component flow rate.
The gas mixture of the required concentration, prepared with the help of regulators, is fed from the mixer into the chamber’s gas manifold, which ensures a uniform flow of gas atmosphere throughout its volume.
The vacuum system, including a forevacuum pump, provides preliminary vacuum, pumping of the gas medium, and pressure regulation.
Two sensors are used to control and regulate the temperature. One of them controls the temperature of the internal space of the working chamber, and the other controls the temperature of the reference sample.
The sensors are a thermocouple cable, hermetically inserted into the working space of the chamber and protected from soot emission by a ceramic cap.
The setup is fully automated. It provides for the regulation of the saturation process temperature, gas medium pressure, and its composition, as well as measurement and recording of all technological and auxiliary process parameters.
Ammonia was used as a saturating gas.
VN was carried out according to the following scheme. After placing the samples on the table, the chamber was evacuated and then heated to the nitriding temperature of 540 °C in an ammonia atmosphere (ammonia flow rate of 5 dm3/h; pressure of 1.1 kPa). Upon reaching the specified temperature, the holding time was counted down (8 h). Cooling of the samples to the delivery temperature was carried out in ammonia.
In order to improve performance properties after VN, some of the samples were subjected to plasma electrolytic quenching, as described in Section 2.2.1. The formation of nitrogenous austenite in the diffusion layer when nitriding is combined with quenching leads to a decrease in the temperatures of the beginning and end of the martensitic transformation in steel and causes a delay in the martensitic transformation in the surface volumes. The formation of martensite on the surface occurs under stress conditions caused by the martensitic transformation in deeper layers of the sample. Such a sequence of γ → α transition leads to an increase in compressive stresses in the surface zone and, as a consequence, to an improvement in the performance of parts under alternating loads.
After VN and quenching, some of the samples were subjected to three-fold tempering, as described in Section 2.2.1.

2.3. Sample Testing

Samples for electron microscopic studies and microhardness measurements were subjected to preliminary grinding, polishing, and etching in a 4% solution of nitric acid in ethyl alcohol (Kurpatov reagent) for 5–7 s. After etching, the samples were washed in an ultrasonic bath.
To determine the phase composition of the treated surface, a PANalytical Empyrean X-ray diffractometer (Malvern Panalytical, Malvern, UK) with PANalytical High Score Plus software (v.2.0.0) [34] and ICCD PDF-2 and COD databases [35] was used. A cobalt X-ray tube was used for the analysis. An iron filter was used to transmit only Kα radiation and absorb Kβ radiation. The wavelength of cobalt Kα radiation was 0.1791 nm. The Soller slits were set to 0.08° to reduce the X-ray beam divergence and minimize the geometric broadening of the diffraction peak. The automatic slit had a spot size of 5 by 5 mm. A tracking anti-scatter slit with the same angle on the diffracted beam was used. A 128-channel Pixel detector with a scanning step of 0.026° was used.
The cross-sectional structure of the treated samples and their elemental composition were analyzed using a Tescan Vega 3 scanning electron microscope (SEM) (Tescan, Brno, Czech Republic) and X-Act energy dispersive analysis (EDX) detector (Oxford Instruments, Abingdon, UK).
The distribution of microhardness in the surface layer of the treated samples was determined using a Vickers microhardness tester (Falcon 503, Innovatest Europe BV, Maastricht, The Netherlands) under a 10 g load.
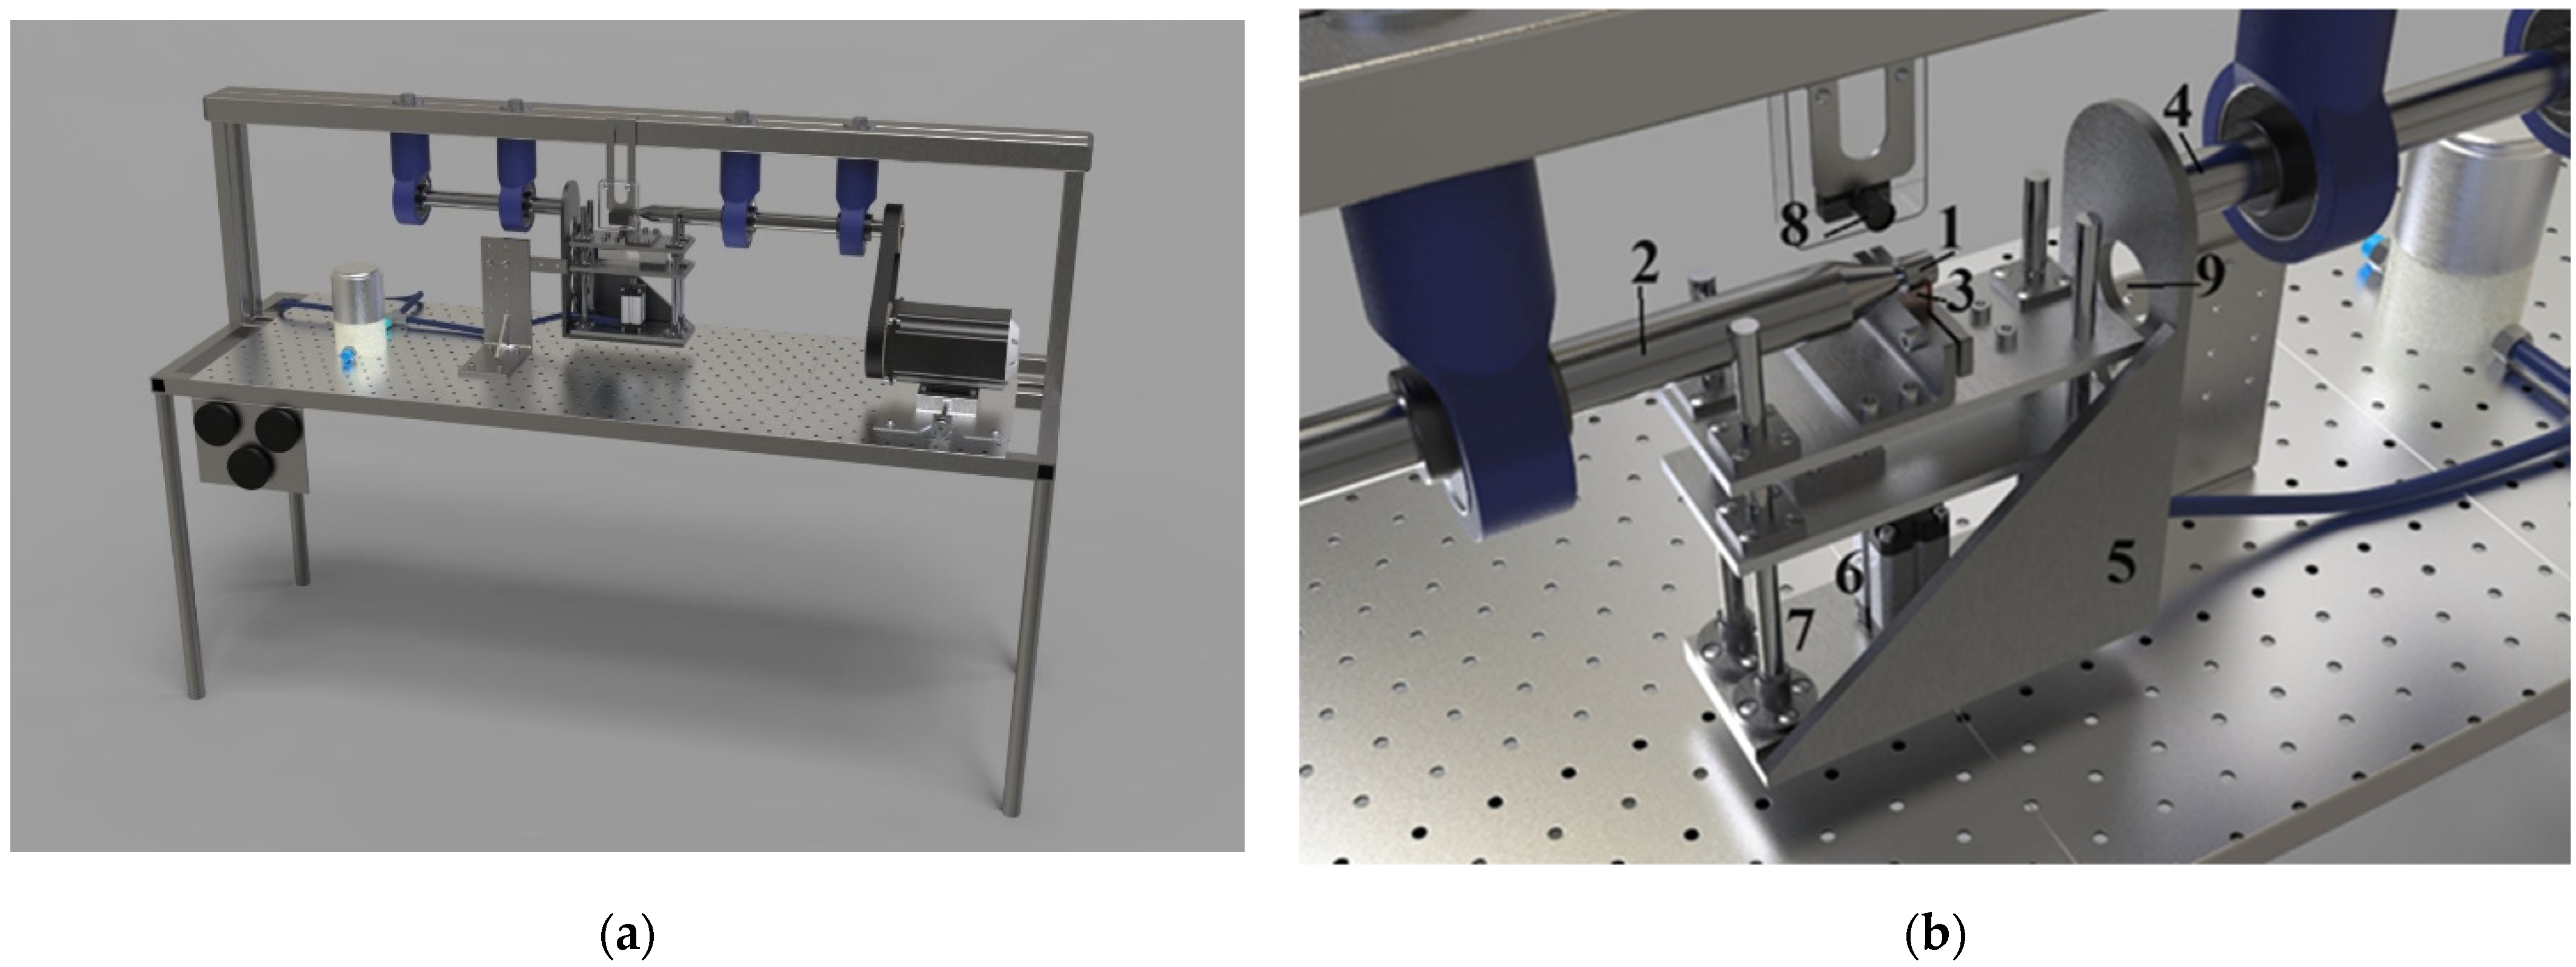
Tribological tests were carried out under dry friction of the lateral surface of the samples using the shaft-bushing scheme with an overlap coefficient of 0.5 on a pilot setup (Figure 2). The tests were carried out under a normal load of 10 N and sliding speed variation from 0.46 to 3.25 m/s. The friction distance was 1000 m. Tool alloy steel (wt.%: 0.9–1.2 Cr, 1.2–1.6 W, 0.8–1.1 Mn, and 0.9–1.05 C) was used as a counter body.
This friction pattern allows for layer-by-layer wear of multilayer thin coatings, unlike the commonly used ball-on-disc patterns. The ball-on-disc friction unit is designed such that as the friction pair wears, a depression forms in the test surface. As the duration of tribological testing increases, this depression increases in volume. If the counter body surface contains several functional layers with different structures, friction will occur across all layers simultaneously, and the actual contact area of the ball with each layer will vary. Thus, this design of tribological coupling fundamentally does not allow one to determine the influence of each of the successively abraded layers on the wear resistance of the entire coating. The friction machine used in this research was specially designed for studying the tribological parameters of thin multilayer coatings.

2.4. Methodology for Calculating Contact Deformations During Friction

In assessing the results of tribological tests, the roughness of the surfaces of both the nitrided samples and the counter body was taken into account [36]. The distribution of the material in the rough layer is described by the curve of the support surface, which is approximated by the Demkin power function [37,38,39,40]:
η = b ε ν = b y R max ν = A r A = N P r ,
where the approximating coefficients b and ν are determined by the height parameters of the microgeometry of rough surfaces, taken directly from the profilometer; y is the level of the profile section, measured from the line of protrusions; Rmax is the maximum height of the irregularities; ε = y/Rmax is the relative height of the profile; Ar is the actual contact area; A is the nominal contact area; Pr is the average actual pressure on the friction contact; and N is the load in the friction unit.
The parameters b and ν are related to the roughness parameters by the following relationships [41,42,43,44]:
b = t m 1 R max 1 R p 1 ν 1 t m 2 R max 2 R p 2 ν 2 R max 1 + R max 2 ν 1 + ν 2 R max 1 ν 1 R max 2 ν 2 × × 1 ν 2 ν 1 ν 2 + 1 + ν 2 ν 1 ν 1 1 2 ν 2 + 2 ν 2 ν 1 ν 1 1 ν 1 2 6 ν 2 + 3 + ν 2 ν 1 ν 1 1 ν 1 2 ν 1 3 24 ν 2 + 4
ν = ν 1 + ν 2 = 2 l m 1 R p 1 R a 1 1 + 2 l m 2 R p 2 R a 2 1 ,
where index 1 refers to the surface parameters of the sample and index 2 to the counter body; Rp is the smoothing height or the distance from the protrusion line to the center line within the base length; Ra is the arithmetic mean deviation of the profile; and tm is the relative support length of the profile at the level of the center line [36,45,46,47]:
t m = 1 n Δ l i l ,
where l is the base length and Δli are the lengths of the segments cut off by the center line in the profile. The relative support length of the rough surface profile tm was measured directly on the profilometer. At least thirty measurements were taken on each friction track, which were averaged to find the average experimental value of tm. The measurements were taken in the friction pair, i.e., both on the friction tracks on the sample and on the counter body.
Each unevenness on the mating rough surfaces was replaced by a body of double curvature with the radius of curvature of its vertex [38,42,48]:
r = 9 S m 2 R a 2 128 5.5 R a R p 3 ,
where Sm is the average pitch of profile irregularities.
To assess the nature of the deformations of irregularities, the plasticity criterion was used [38,42,48]:
K p = R p r 1 2 π D D D 2 d 2 0.102 2 N 1 μ 1 2 E 1 + 1 μ 2 2 E 2 ,
where Ei and μi are the elastic moduli and Poisson’s ratios of the modified sample and the counter body; d is the diameter of the imprint; and D is the diameter of the indenter. In the case of elastic deformations, the actual pressure was determined by solving the classical Hertz problem, and in the case of plastic flow, it was taken to be numerically equal to the hardness HV.
Substituting into Equation (1) the value of absolute penetration of the sample into the surface of the counter body h instead of the section level y allowed us to obtain an expression for the absolute penetration of surfaces in friction tests [38,42,48]:
h = R max P c b P r 1 ν = R max N b P r 1 ν
The ratio of the absolute penetration (7) to the average radius of curvature of the protrusion (5) h/r was used to analyze the results of tribological tests. In the case of dry friction of iron- and titanium-based alloys, h/r < 0.01 is necessary for the destruction of frictional bonds because of elastic displacement. In this case, the surface layer will be destroyed mainly due to fatigue, and a large number of repeated test cycles will be required to destroy the material. If traces of residual deformation are visible on the friction tracks after the tests and h/r < 0.1, then the frictional bonds are destroyed because of plastic displacement of the softer material by roughness microprotrusions of the more rigid body. In the case of h/r > 0.1, the surfaces in the tribological contact are destroyed because of microcutting, and microchips are formed.
The calculation results of parameters (5)–(7) are presented in Table 2.

3. Results

3.1. X-Ray Analysis

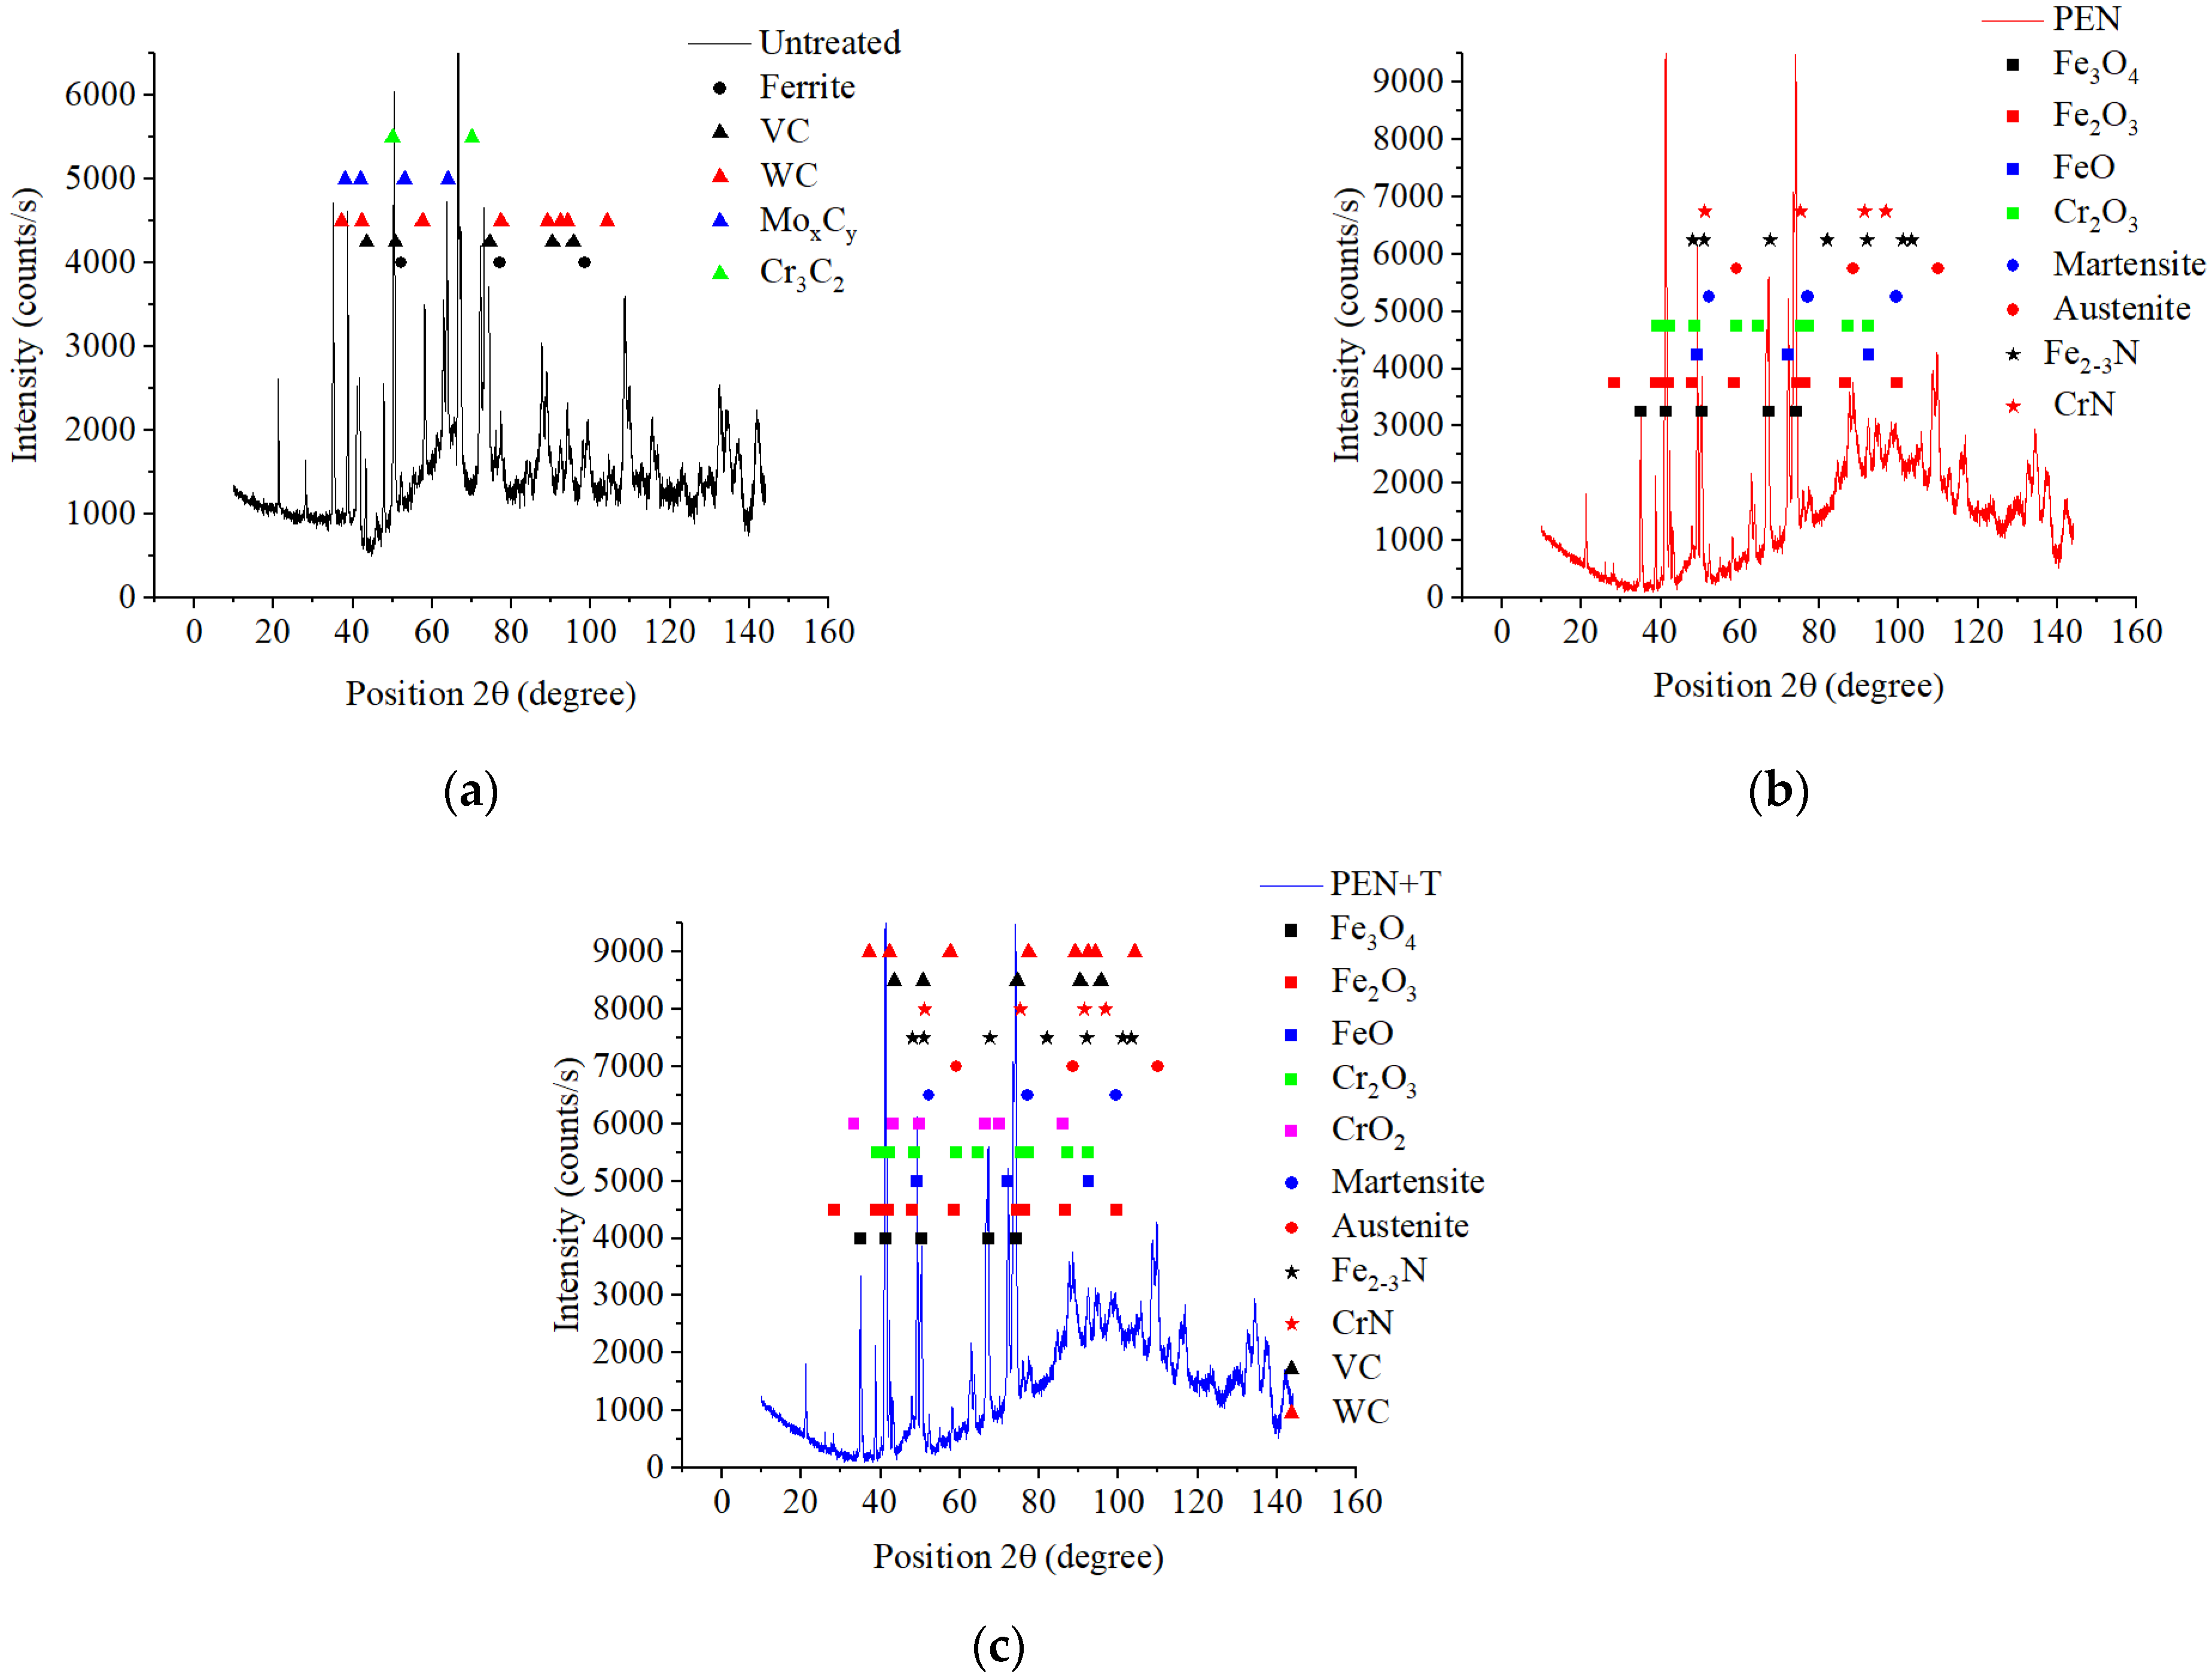
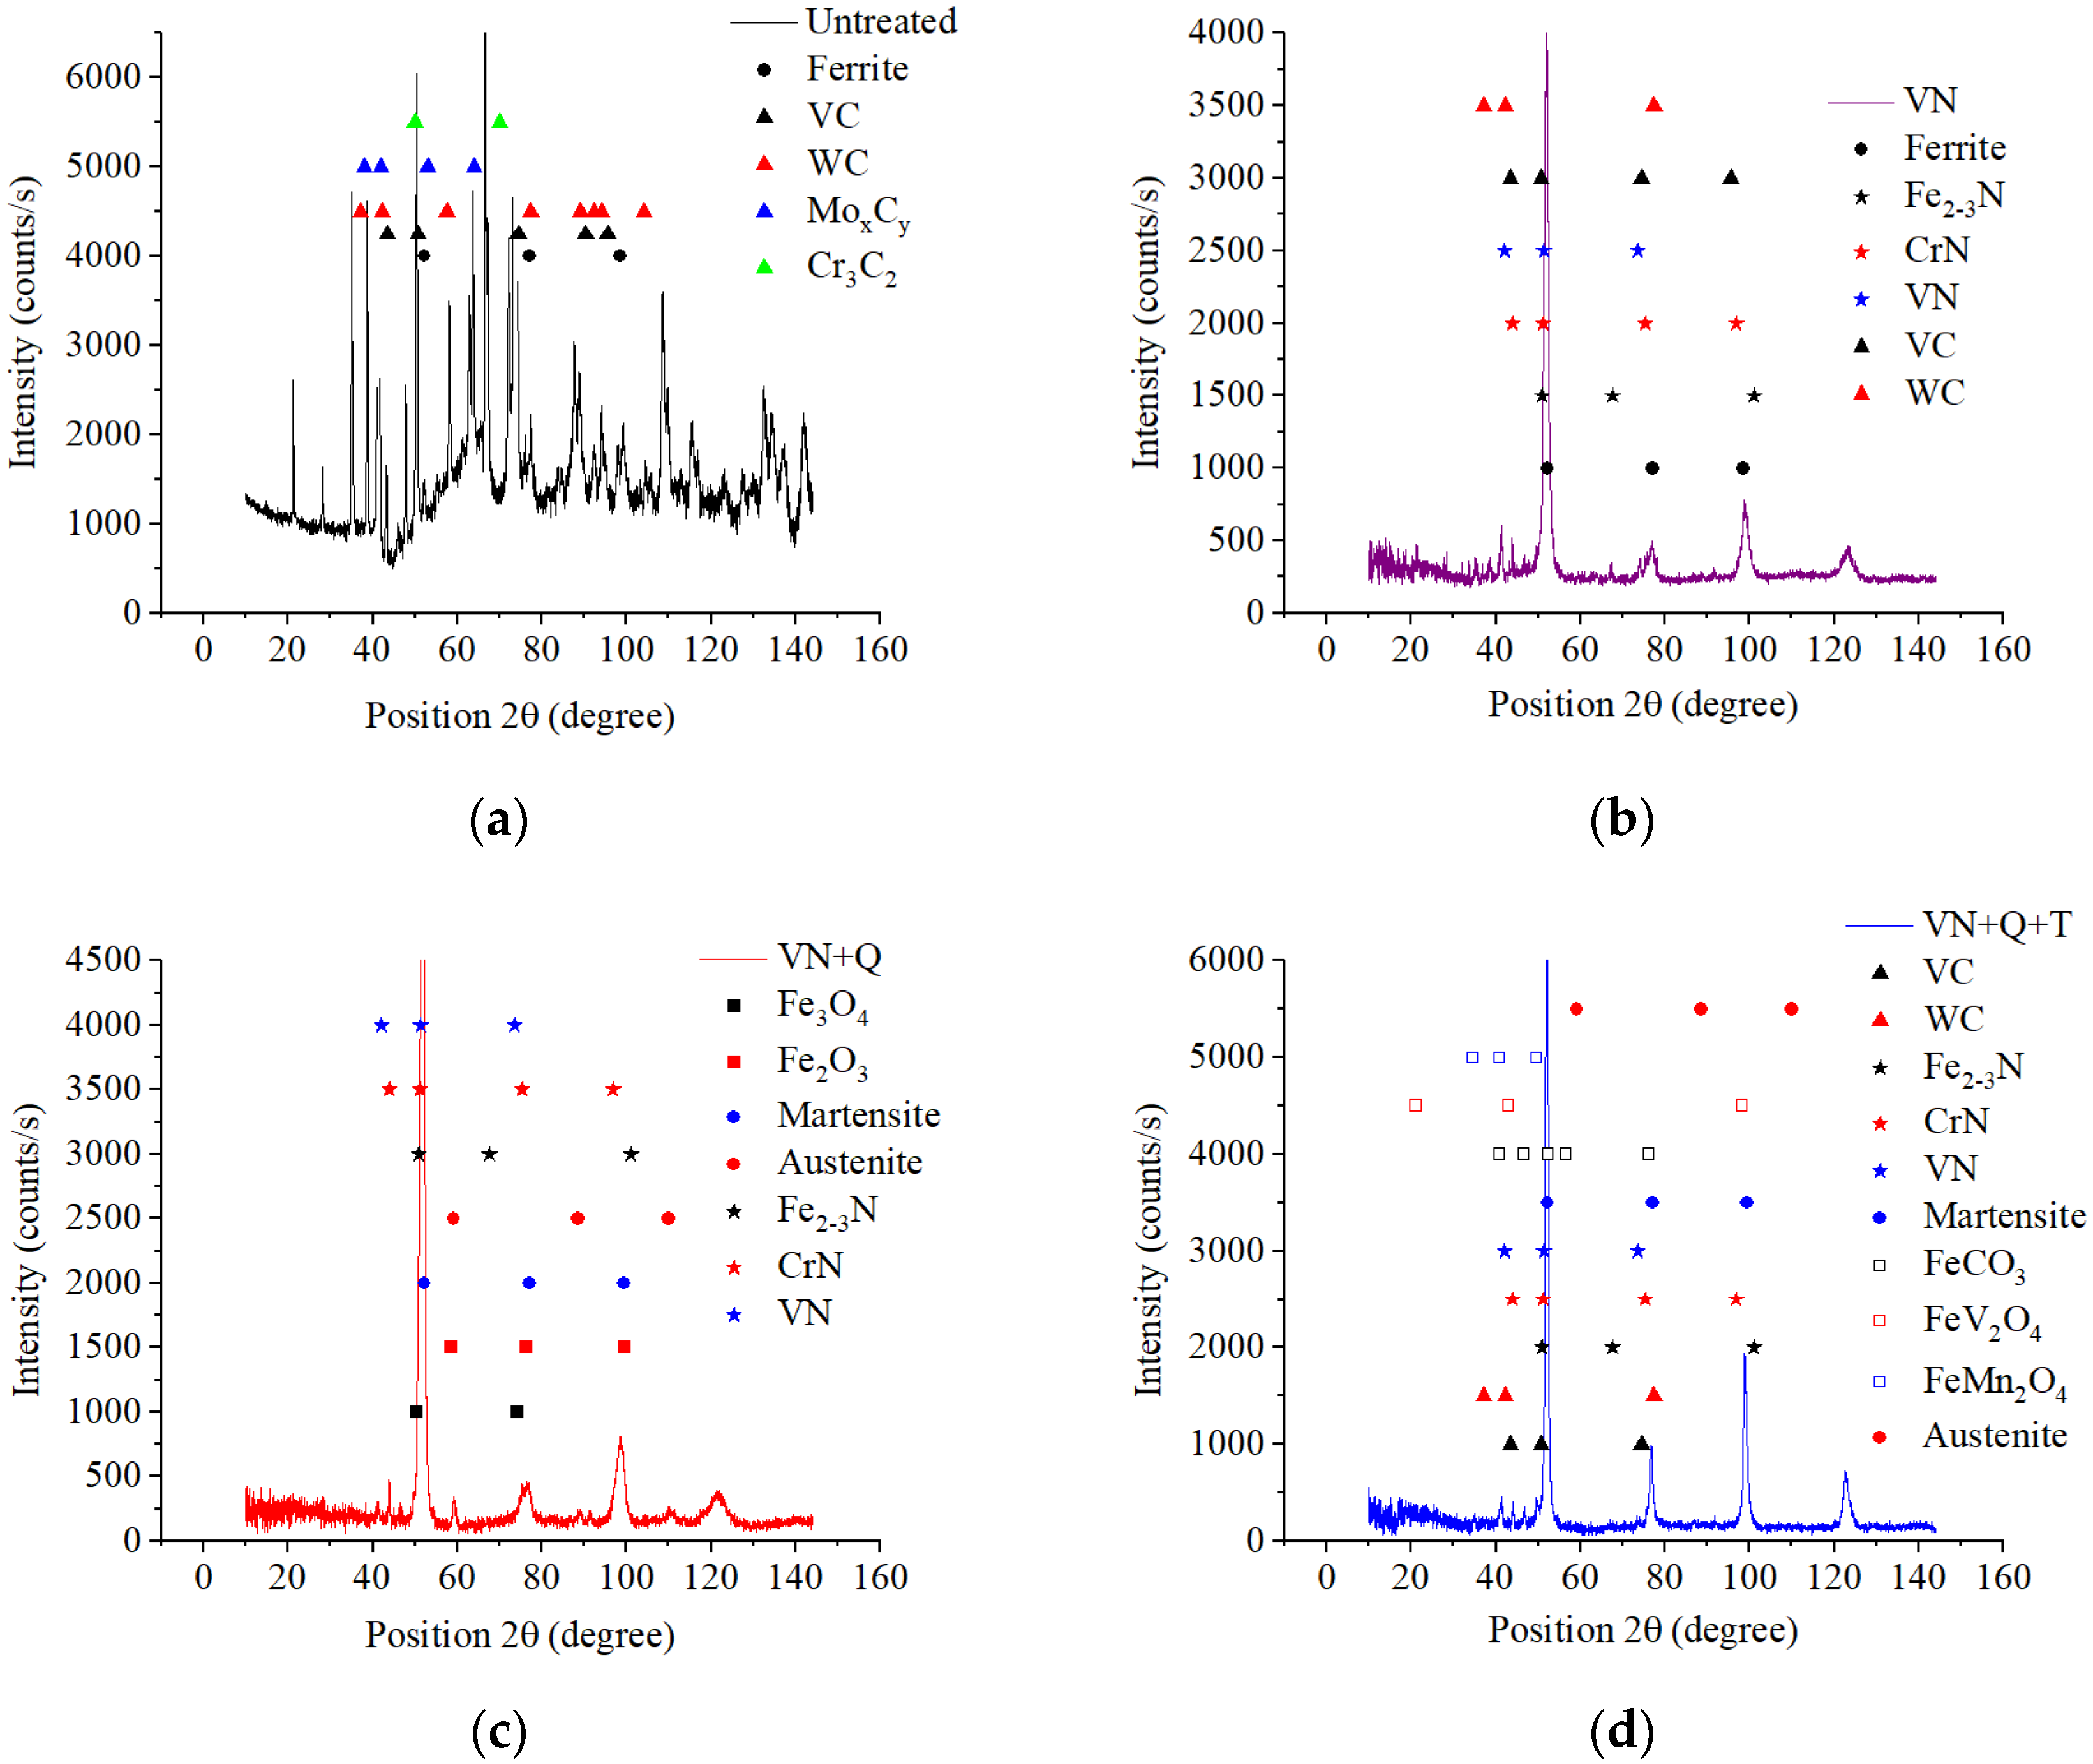
The results of the X-ray analysis showed a change in the phase composition of the surface layers of M2 steel samples. The initial composition of the steel includes carbides of alloying components VC, WC, MoxCy, and Cr3C2 in a ferrite matrix (Figure 3 and Figure 4).
After PEN, iron and chromium oxides and nitrides are detected on the surface because of high-temperature surface oxidation and nitrogen diffusion (Figure 3b). Carbides are not detected on the surface, which is due to their dissolution in the formed austenite at a high heating temperature of 1230 °C during quenching. Quenching of the carbon-saturated austenite structure determined the formation of martensite with the preservation of the proportion of residual austenite. Subsequent three-fold tempering leads to the precipitation of tungsten and vanadium carbides (Figure 3c).
After low-temperature VN, the X-ray analysis showed the formation of iron, chromium, and vanadium nitrides while preserving vanadium and tungsten carbides in the initial ferritic matrix of the steel (Figure 4b). Subsequent plasma electrolytic hardening from a temperature of 1230 °C, as well as with PEN, leads to the dissolution of carbides and the formation of martensite with residual austenite (Figure 4c). In addition, iron oxides are found on the surface, which could have formed during high-temperature oxidation in electrolyte vapors during heating for hardening or during hardening of a sample heated to 1230 °C in air. After three-fold tempering, the precipitation of tungsten and vanadium carbides and martensitic transformation of residual austenite occur (Figure 4d). In addition, compounds containing iron, oxygen, and alloying additives are found on the surface, which could be associated with precipitation hardening in the oxygen-containing surface zone.
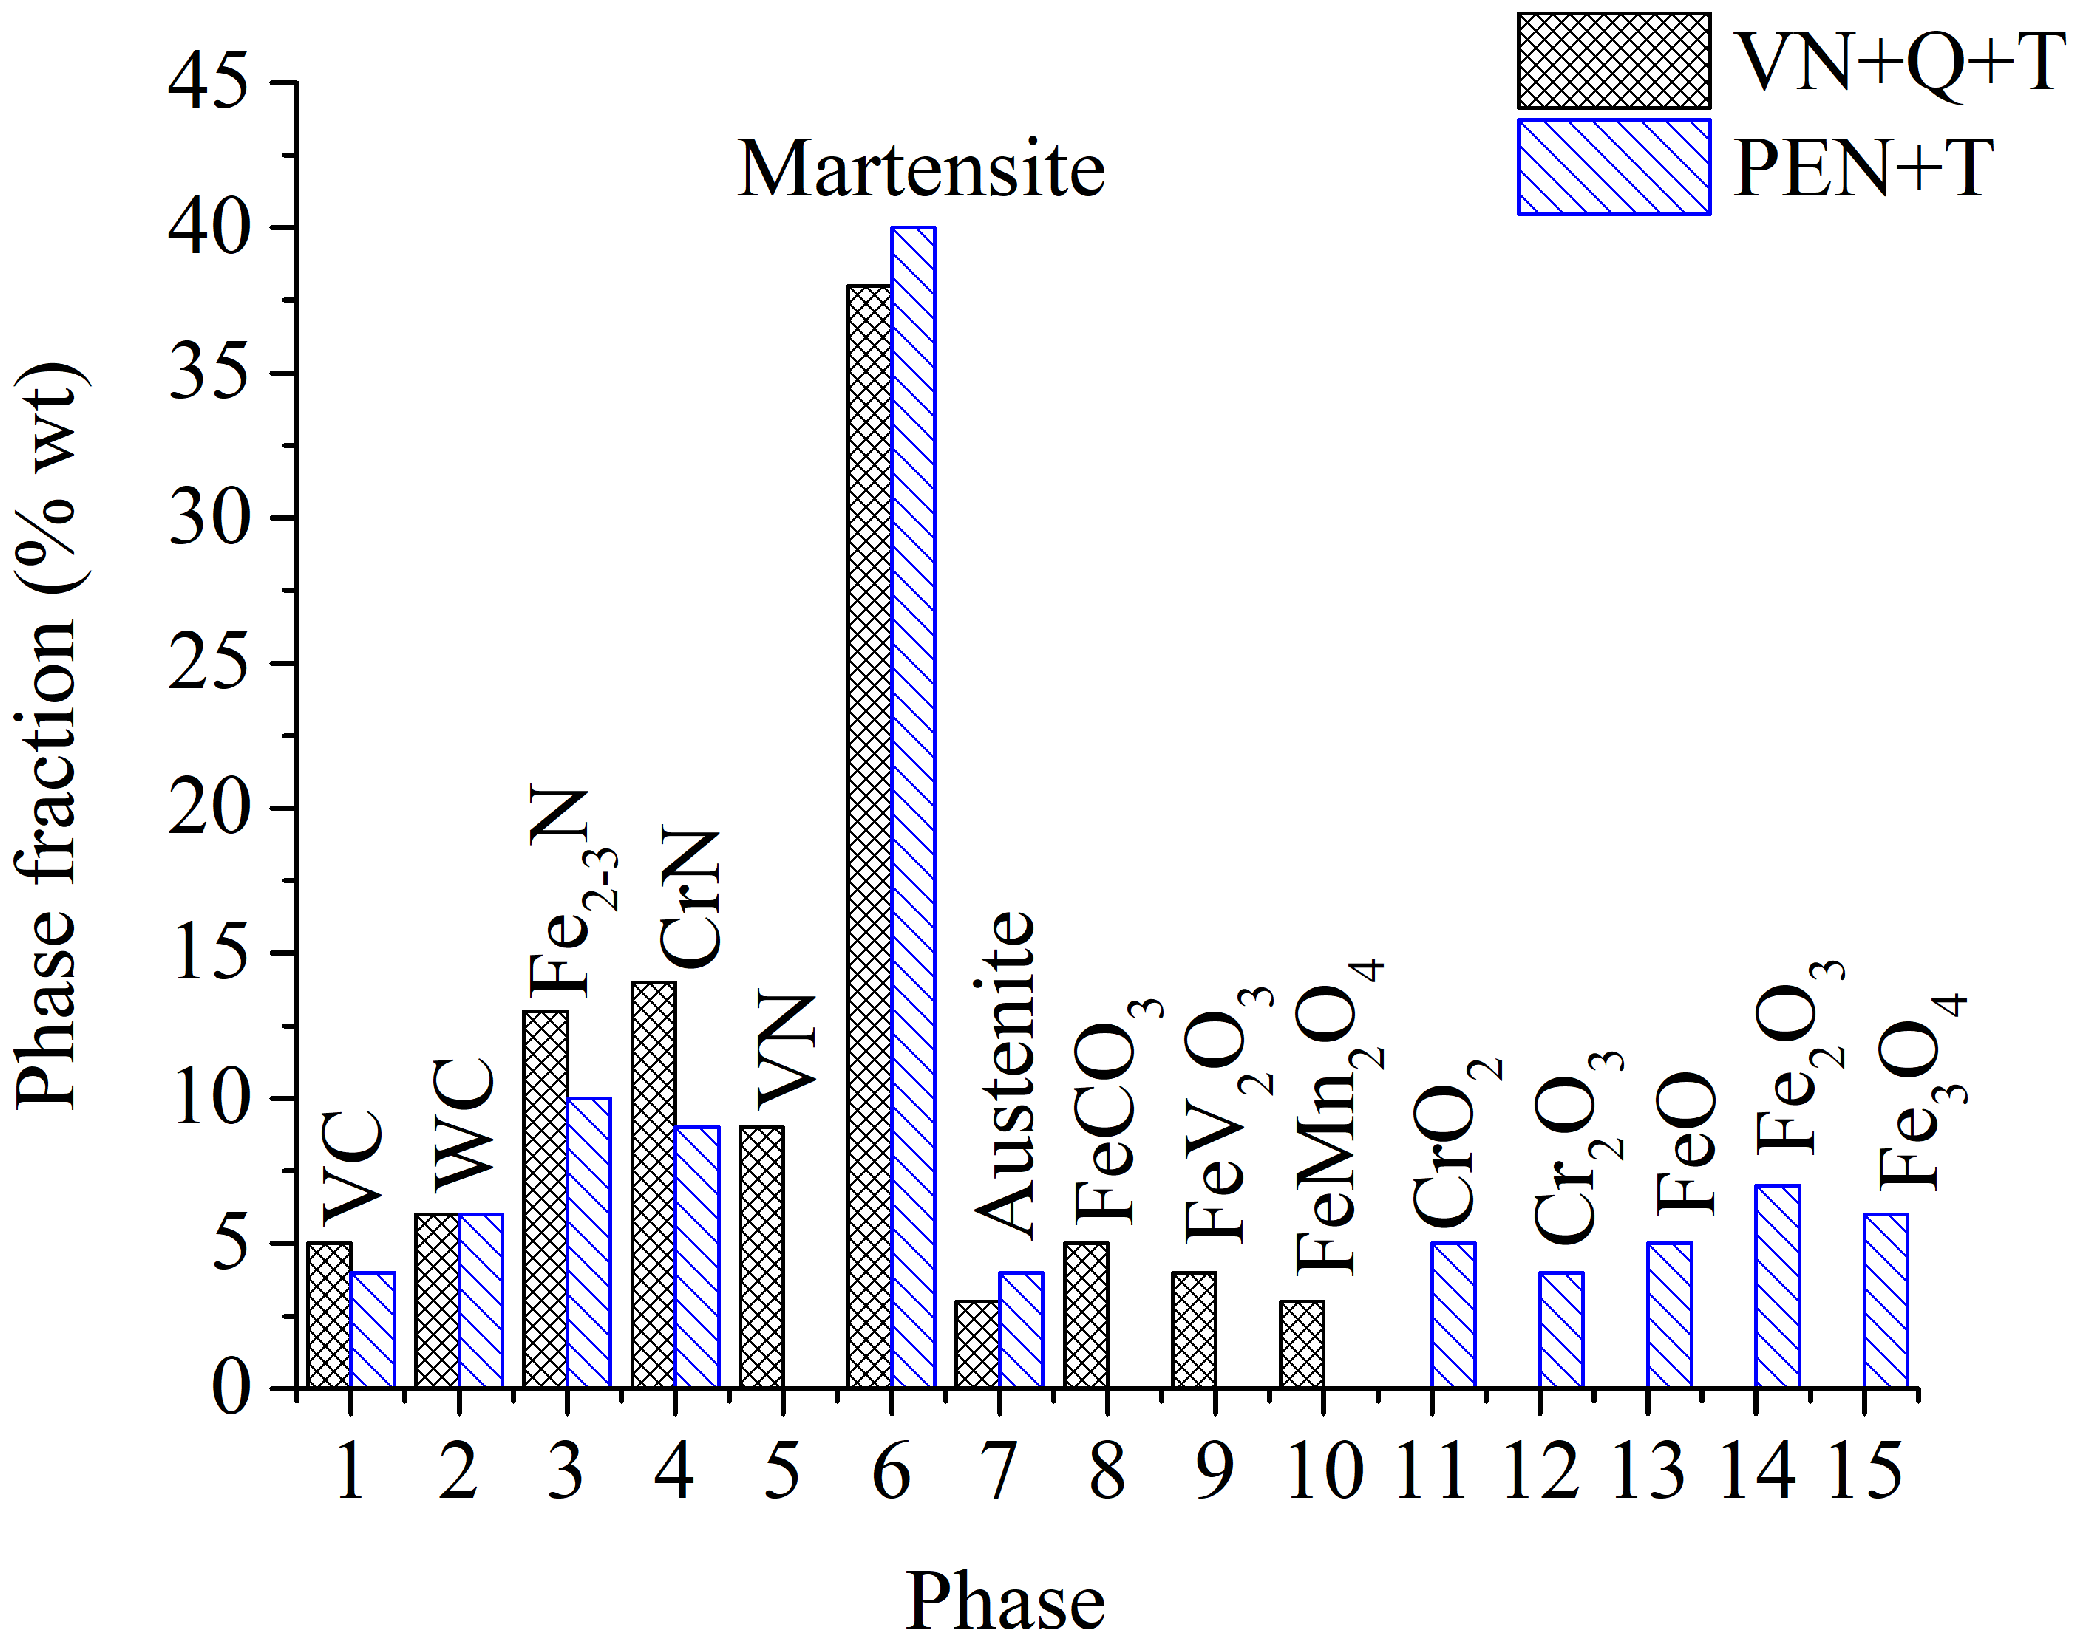
Figure 5 shows the percentage of phases in the surface layer of M2 steel after VN + Q + T and PEN + T. The total percentage of nitrides in the surface layer of the M2 steel after VN is 36%, and after PEN, it is 19%. The contents of Fe2-3N and CrN are higher in the samples after VN + Q + T compared to PEN + T. Vanadium nitride is observed only after vacuum treatment.
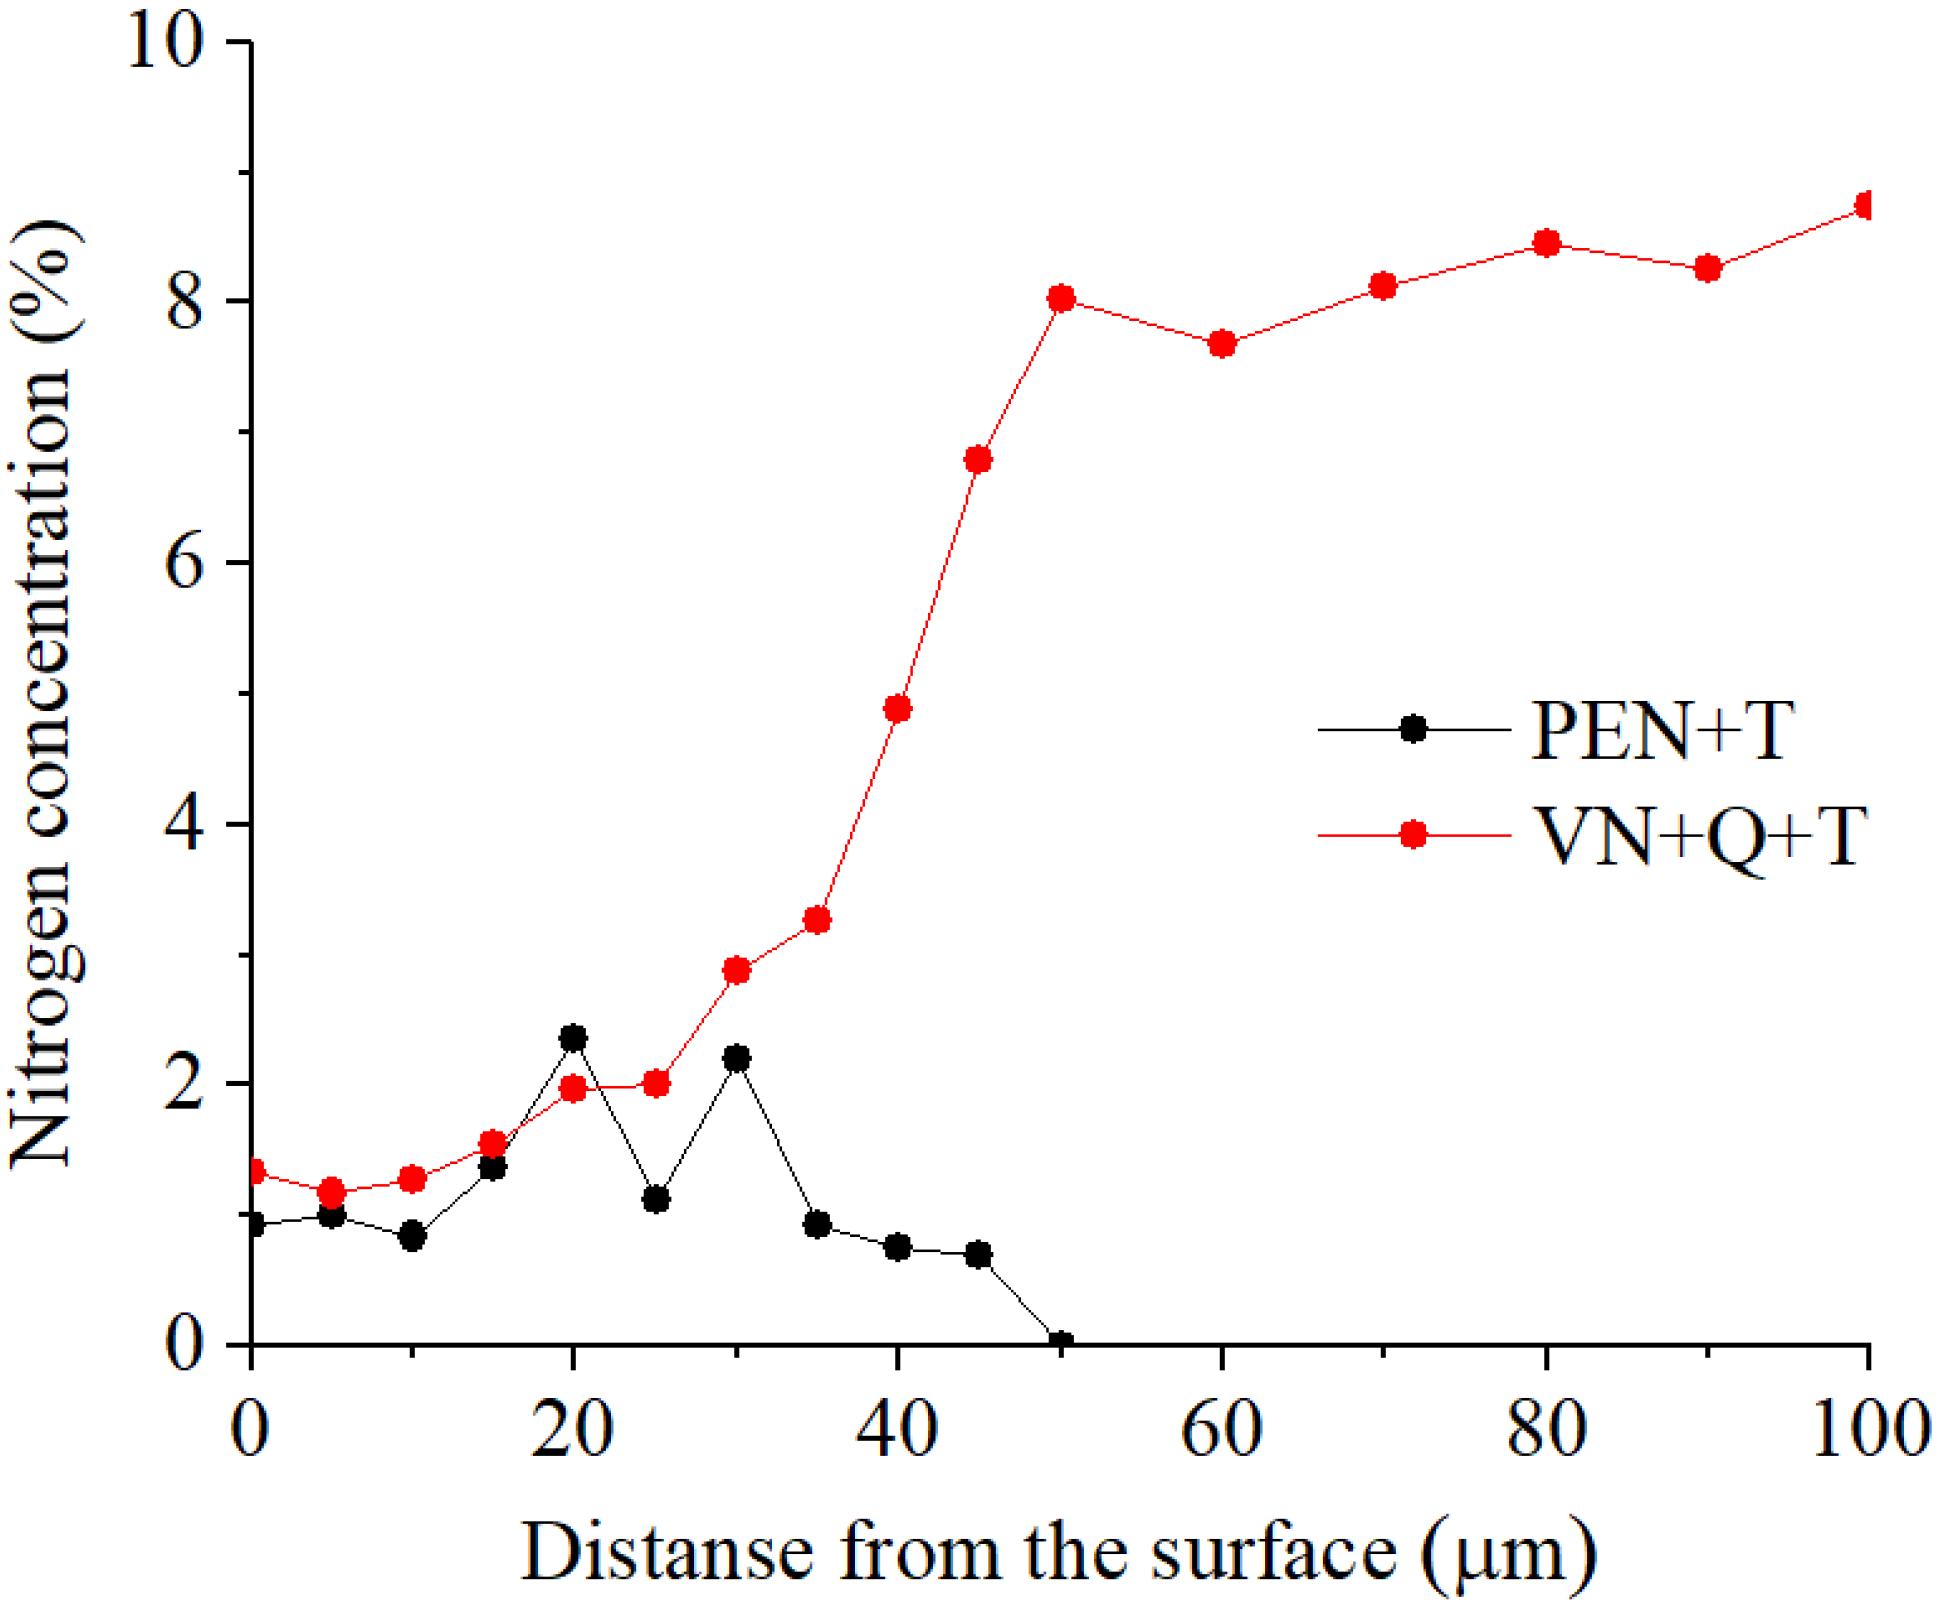
Figure 6 shows the percentage of nitrogen in the surface layer of M2 steel after VN + Q + T and PEN + T, obtained by EDX analysis.
Vacuum treatment provides a higher percentage of nitrogen in the surface layer, as well as diffusion of nitrogen to a greater depth than plasma electrolytic diffusion saturation.

3.2. SEM Analysis

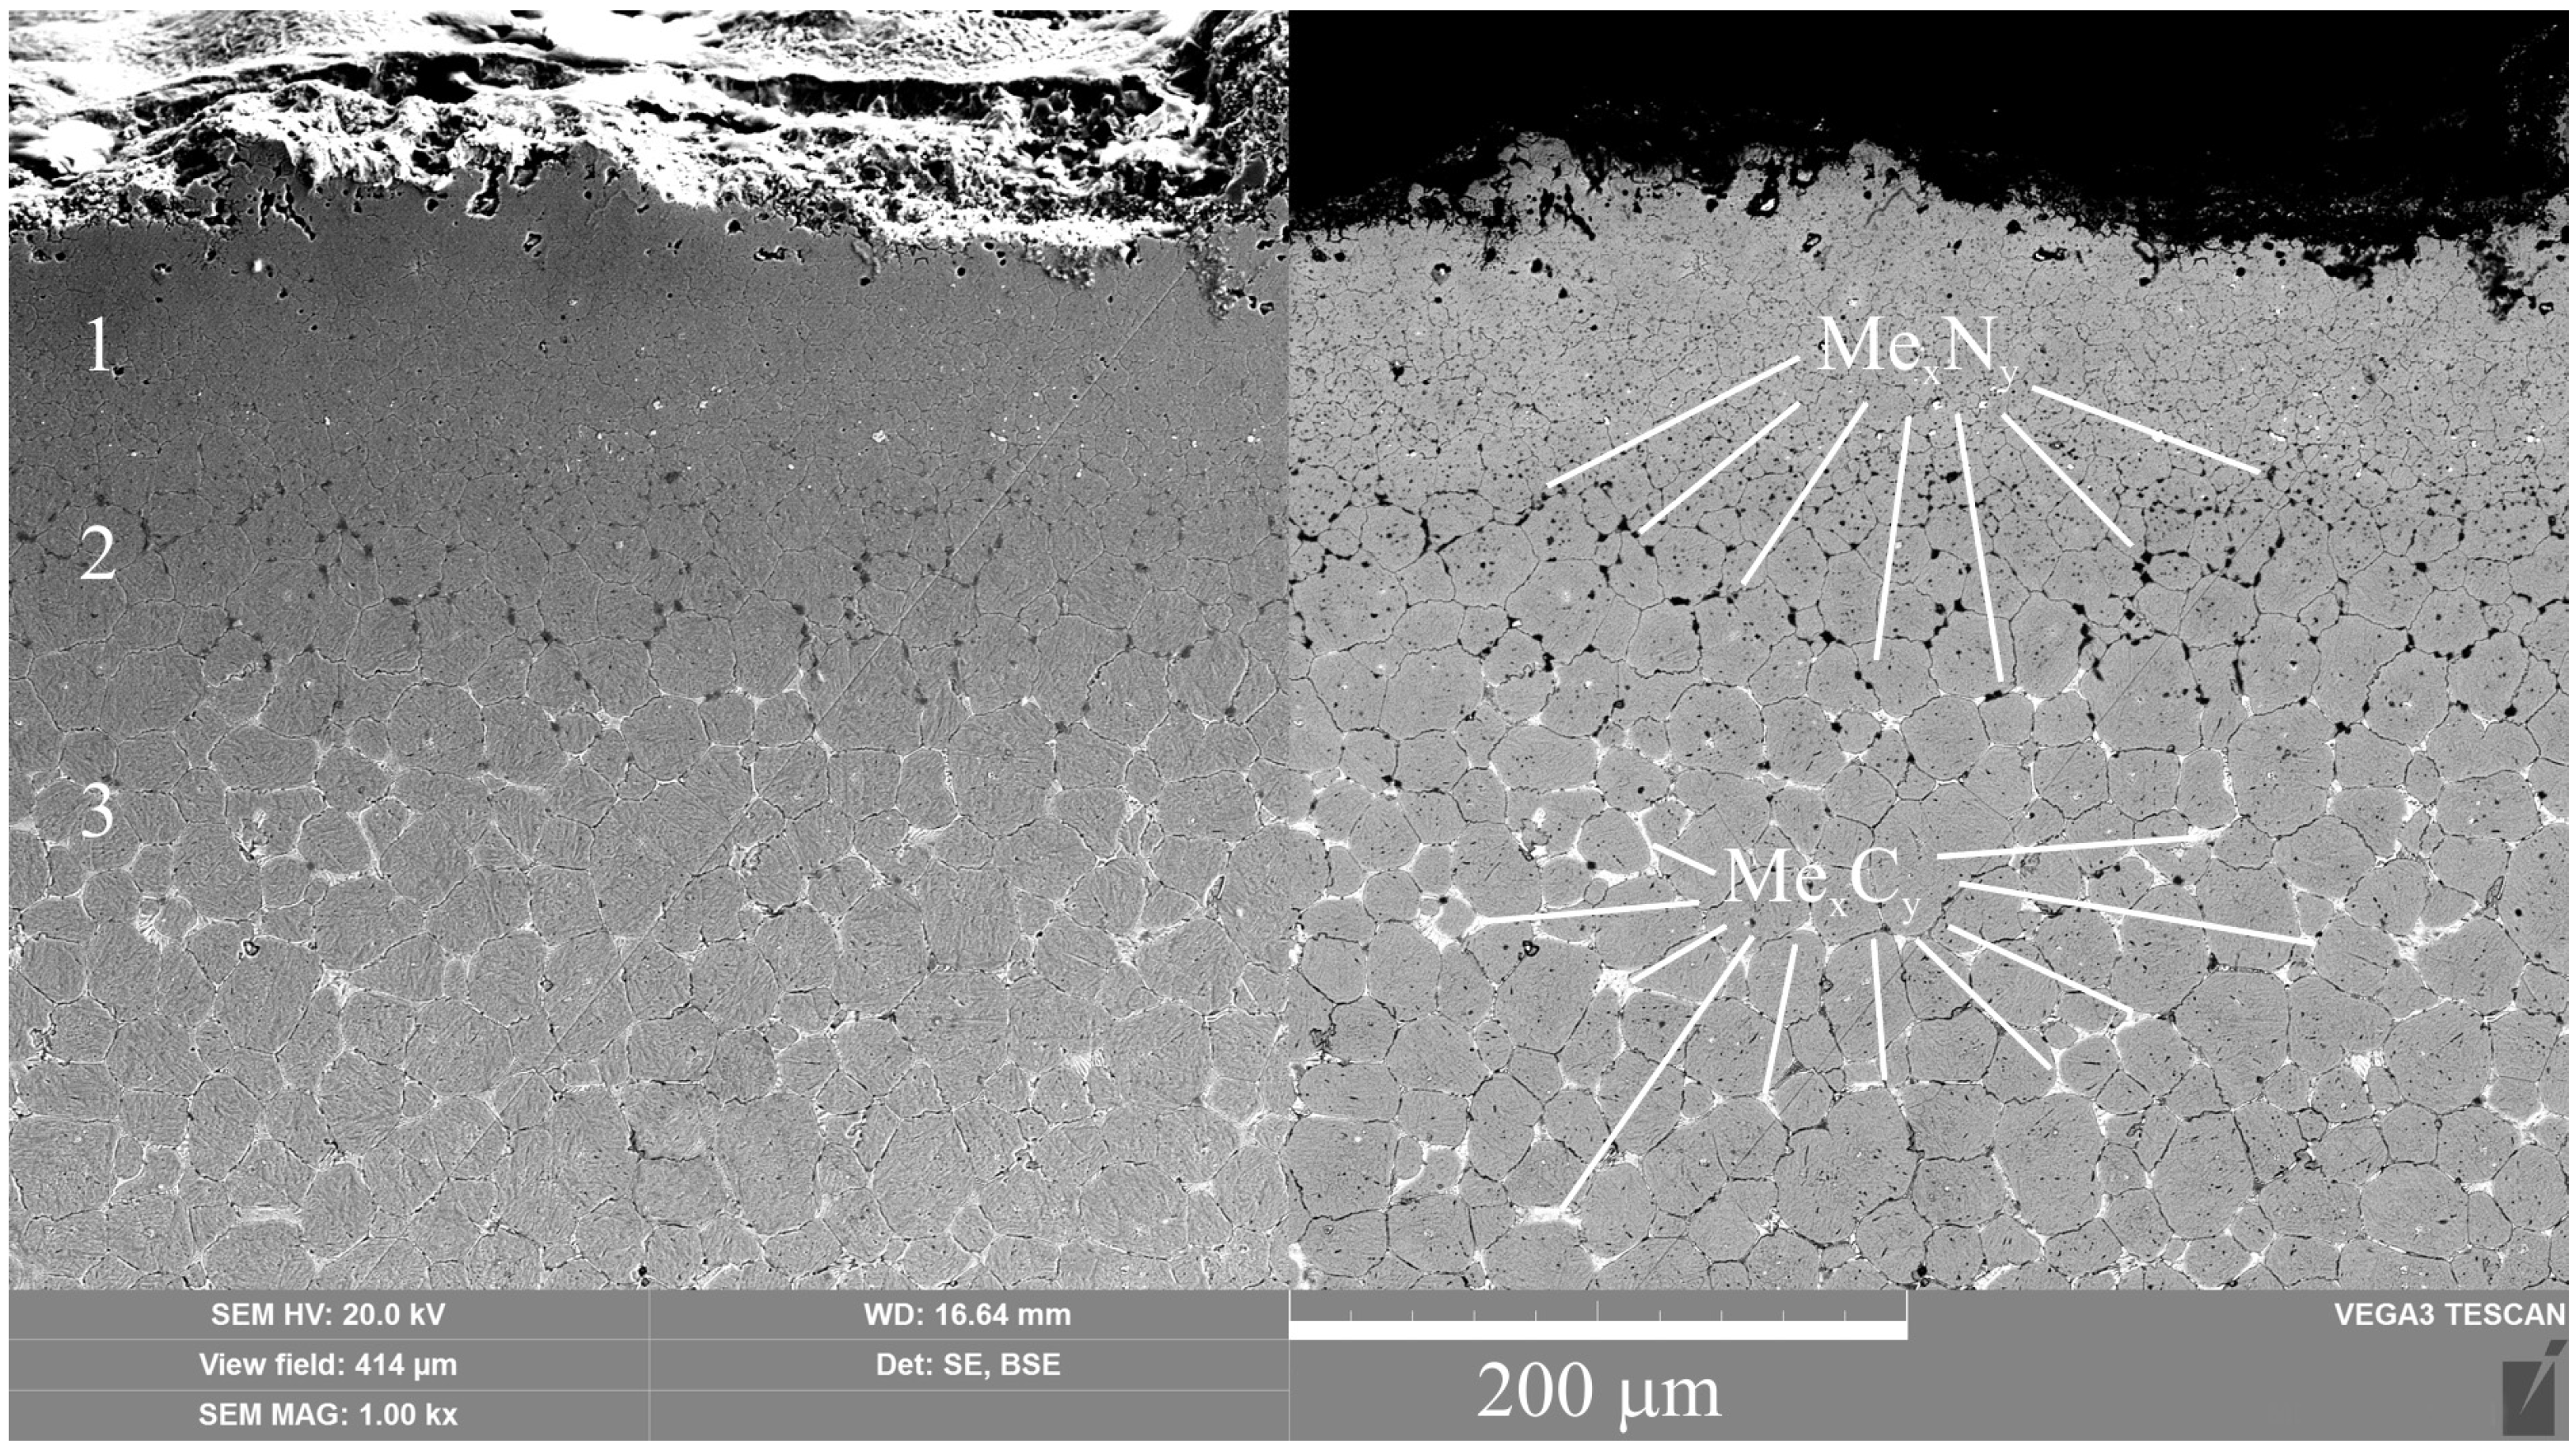
The results of SEM analysis showed the formation of a modified surface structure after PEN, which consists of a continuous layer of nitrogen martensite (Figure 7). Under the martensite layer, a sublayer is formed in which coarsely dispersed nitrides are revealed along the grain boundaries. Then, a granular structure with inclusions of carbides, close to the initial structure, is revealed.
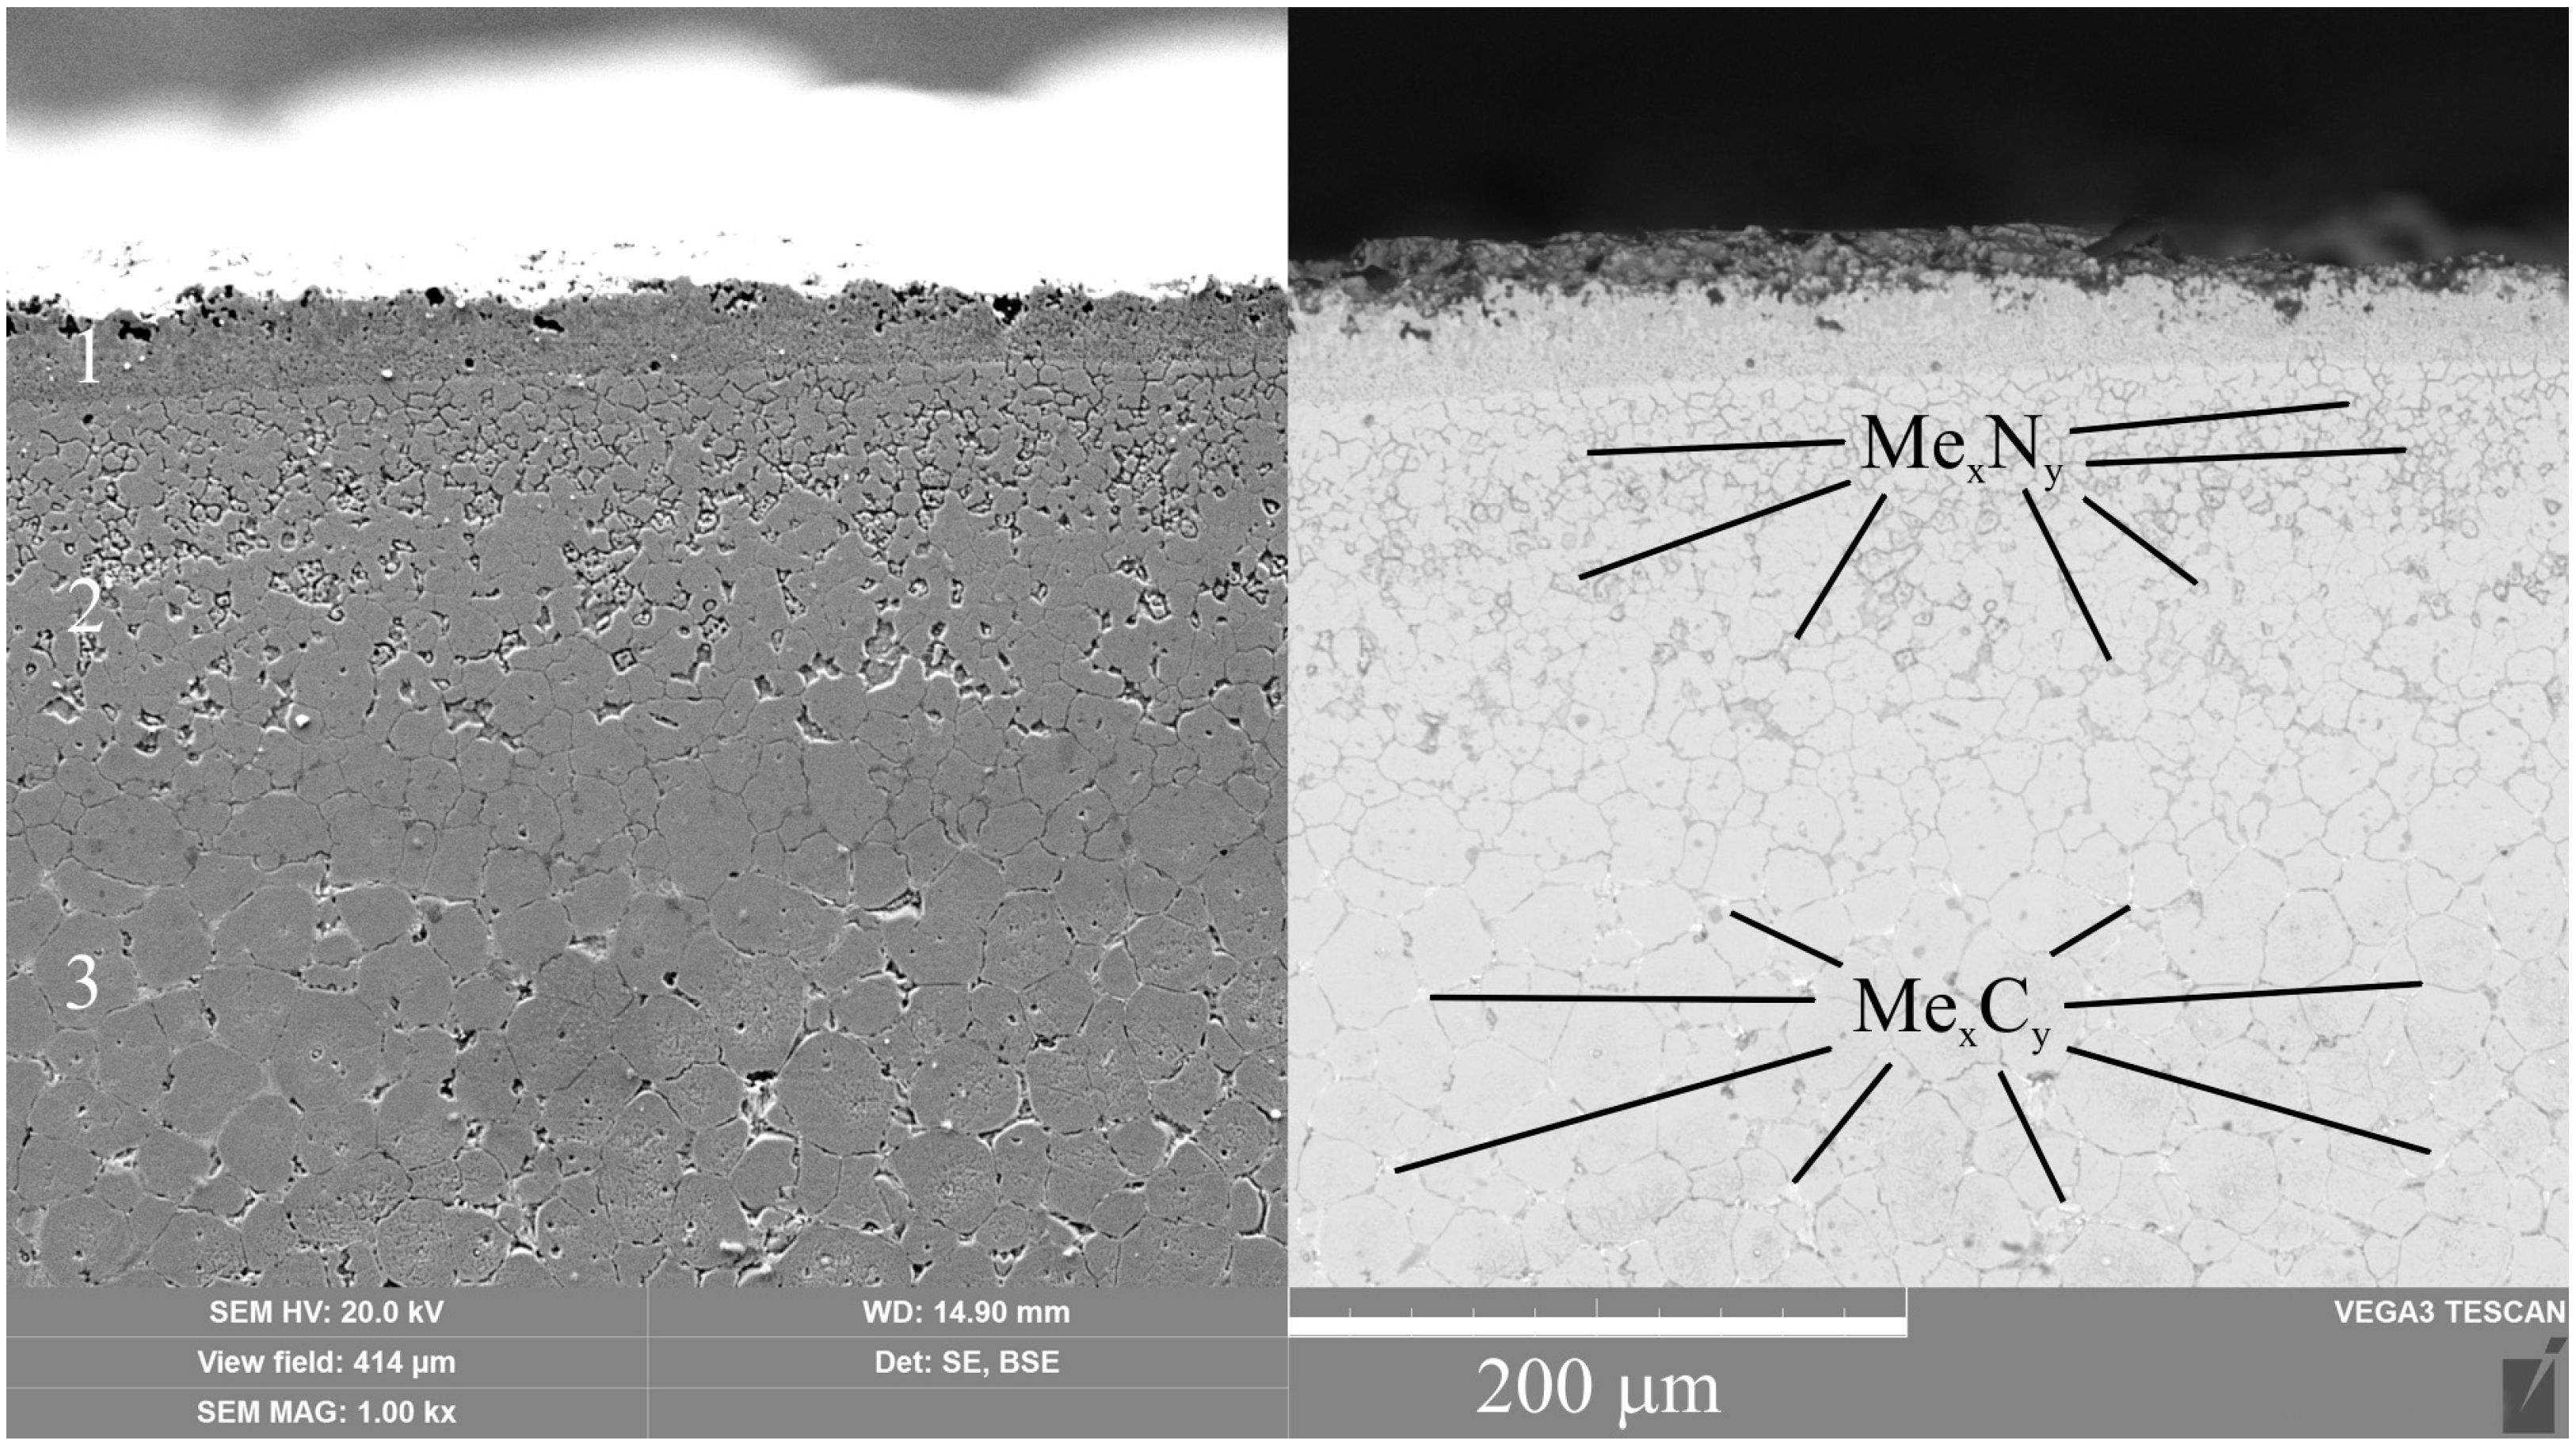
The surface structure of the steel after VN with quenching also consists of a continuous layer of nitrogen martensite, as after PEN, but is significantly thinner (Figure 8). Under the nitrogen martensite layer, a nitride-saturated sublayer is revealed. These nitrides have a dispersion distribution from small sizes and high concentration at the surface (transition from the nitrogen martensite zone) to larger ones with a lower concentration deep into the sample. The smaller thickness of the nitrogen martensite layer after VN is associated with a higher nitrogen concentration in the surface layer than after PEN. This leads to the release of nitrides with a decrease in the concentration of martensite deep into the sample. Below the sublayer saturated with nitrides, as after PEN, a structure with carbide inclusions along the grain boundaries is revealed.
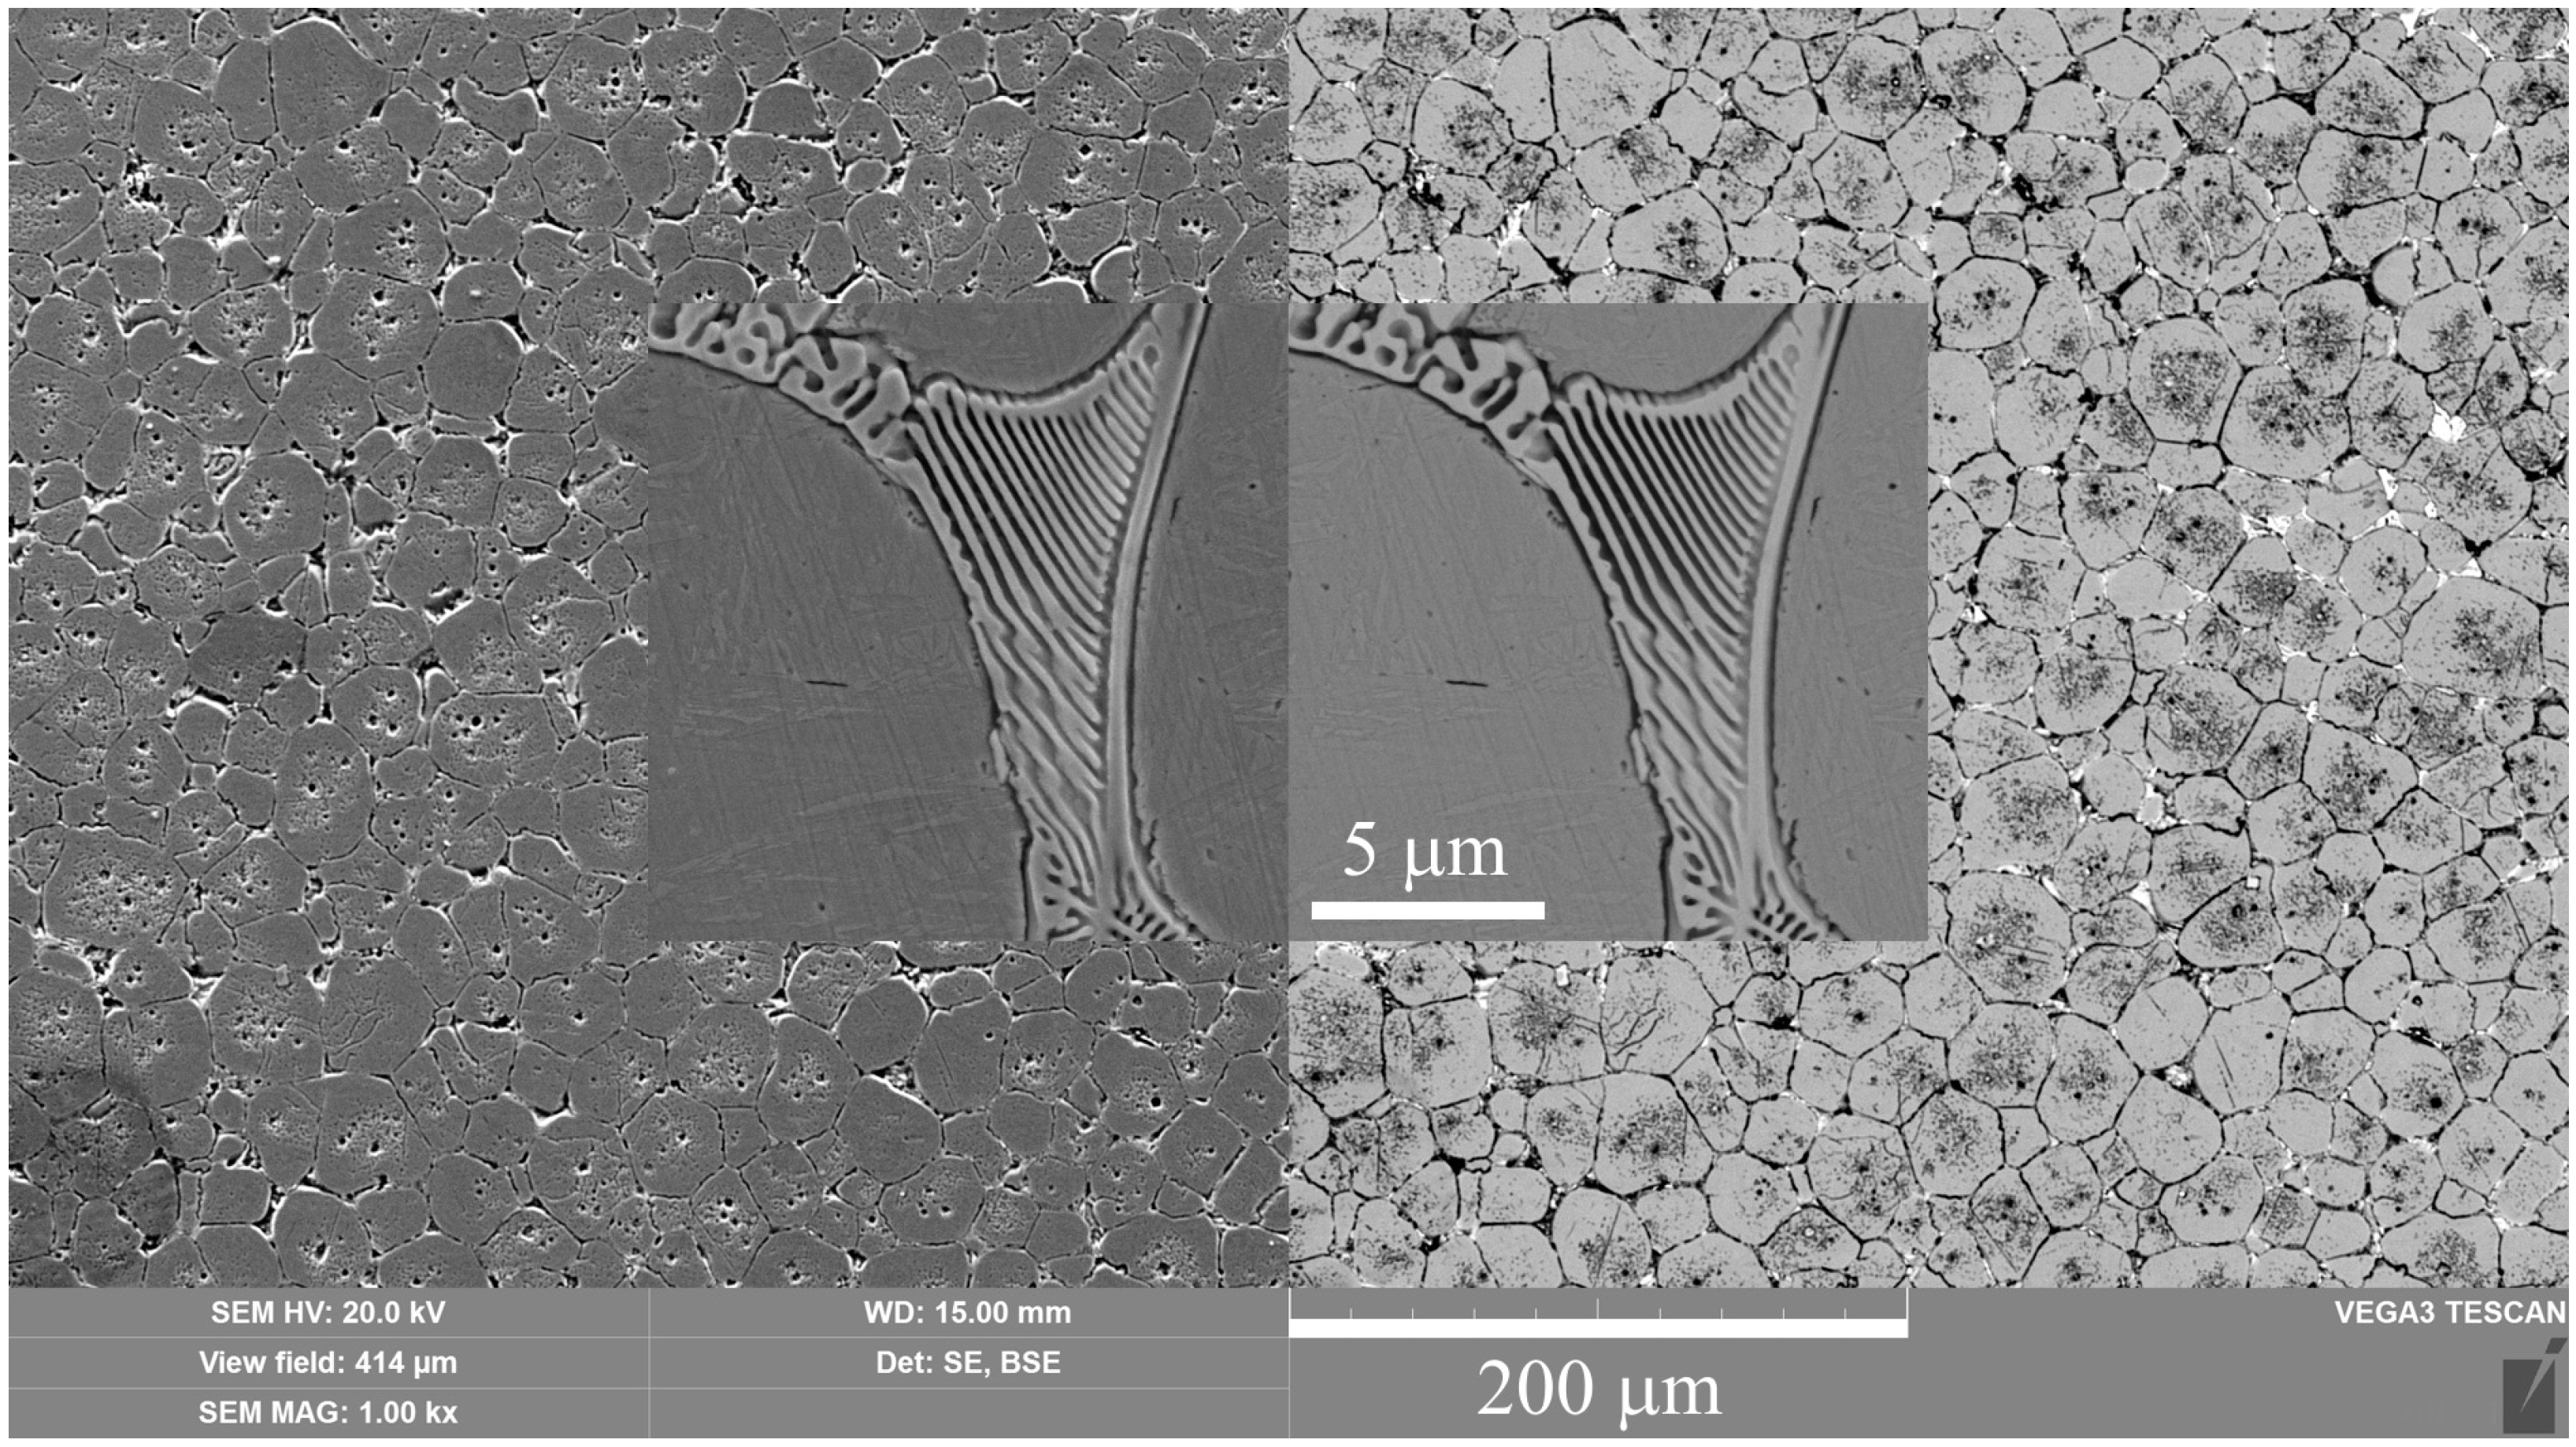
In the core of the samples after PEN and VN quenching, equilibrium ferrite grains with precipitated eutectoid along the grain boundaries are visible (Figure 9).
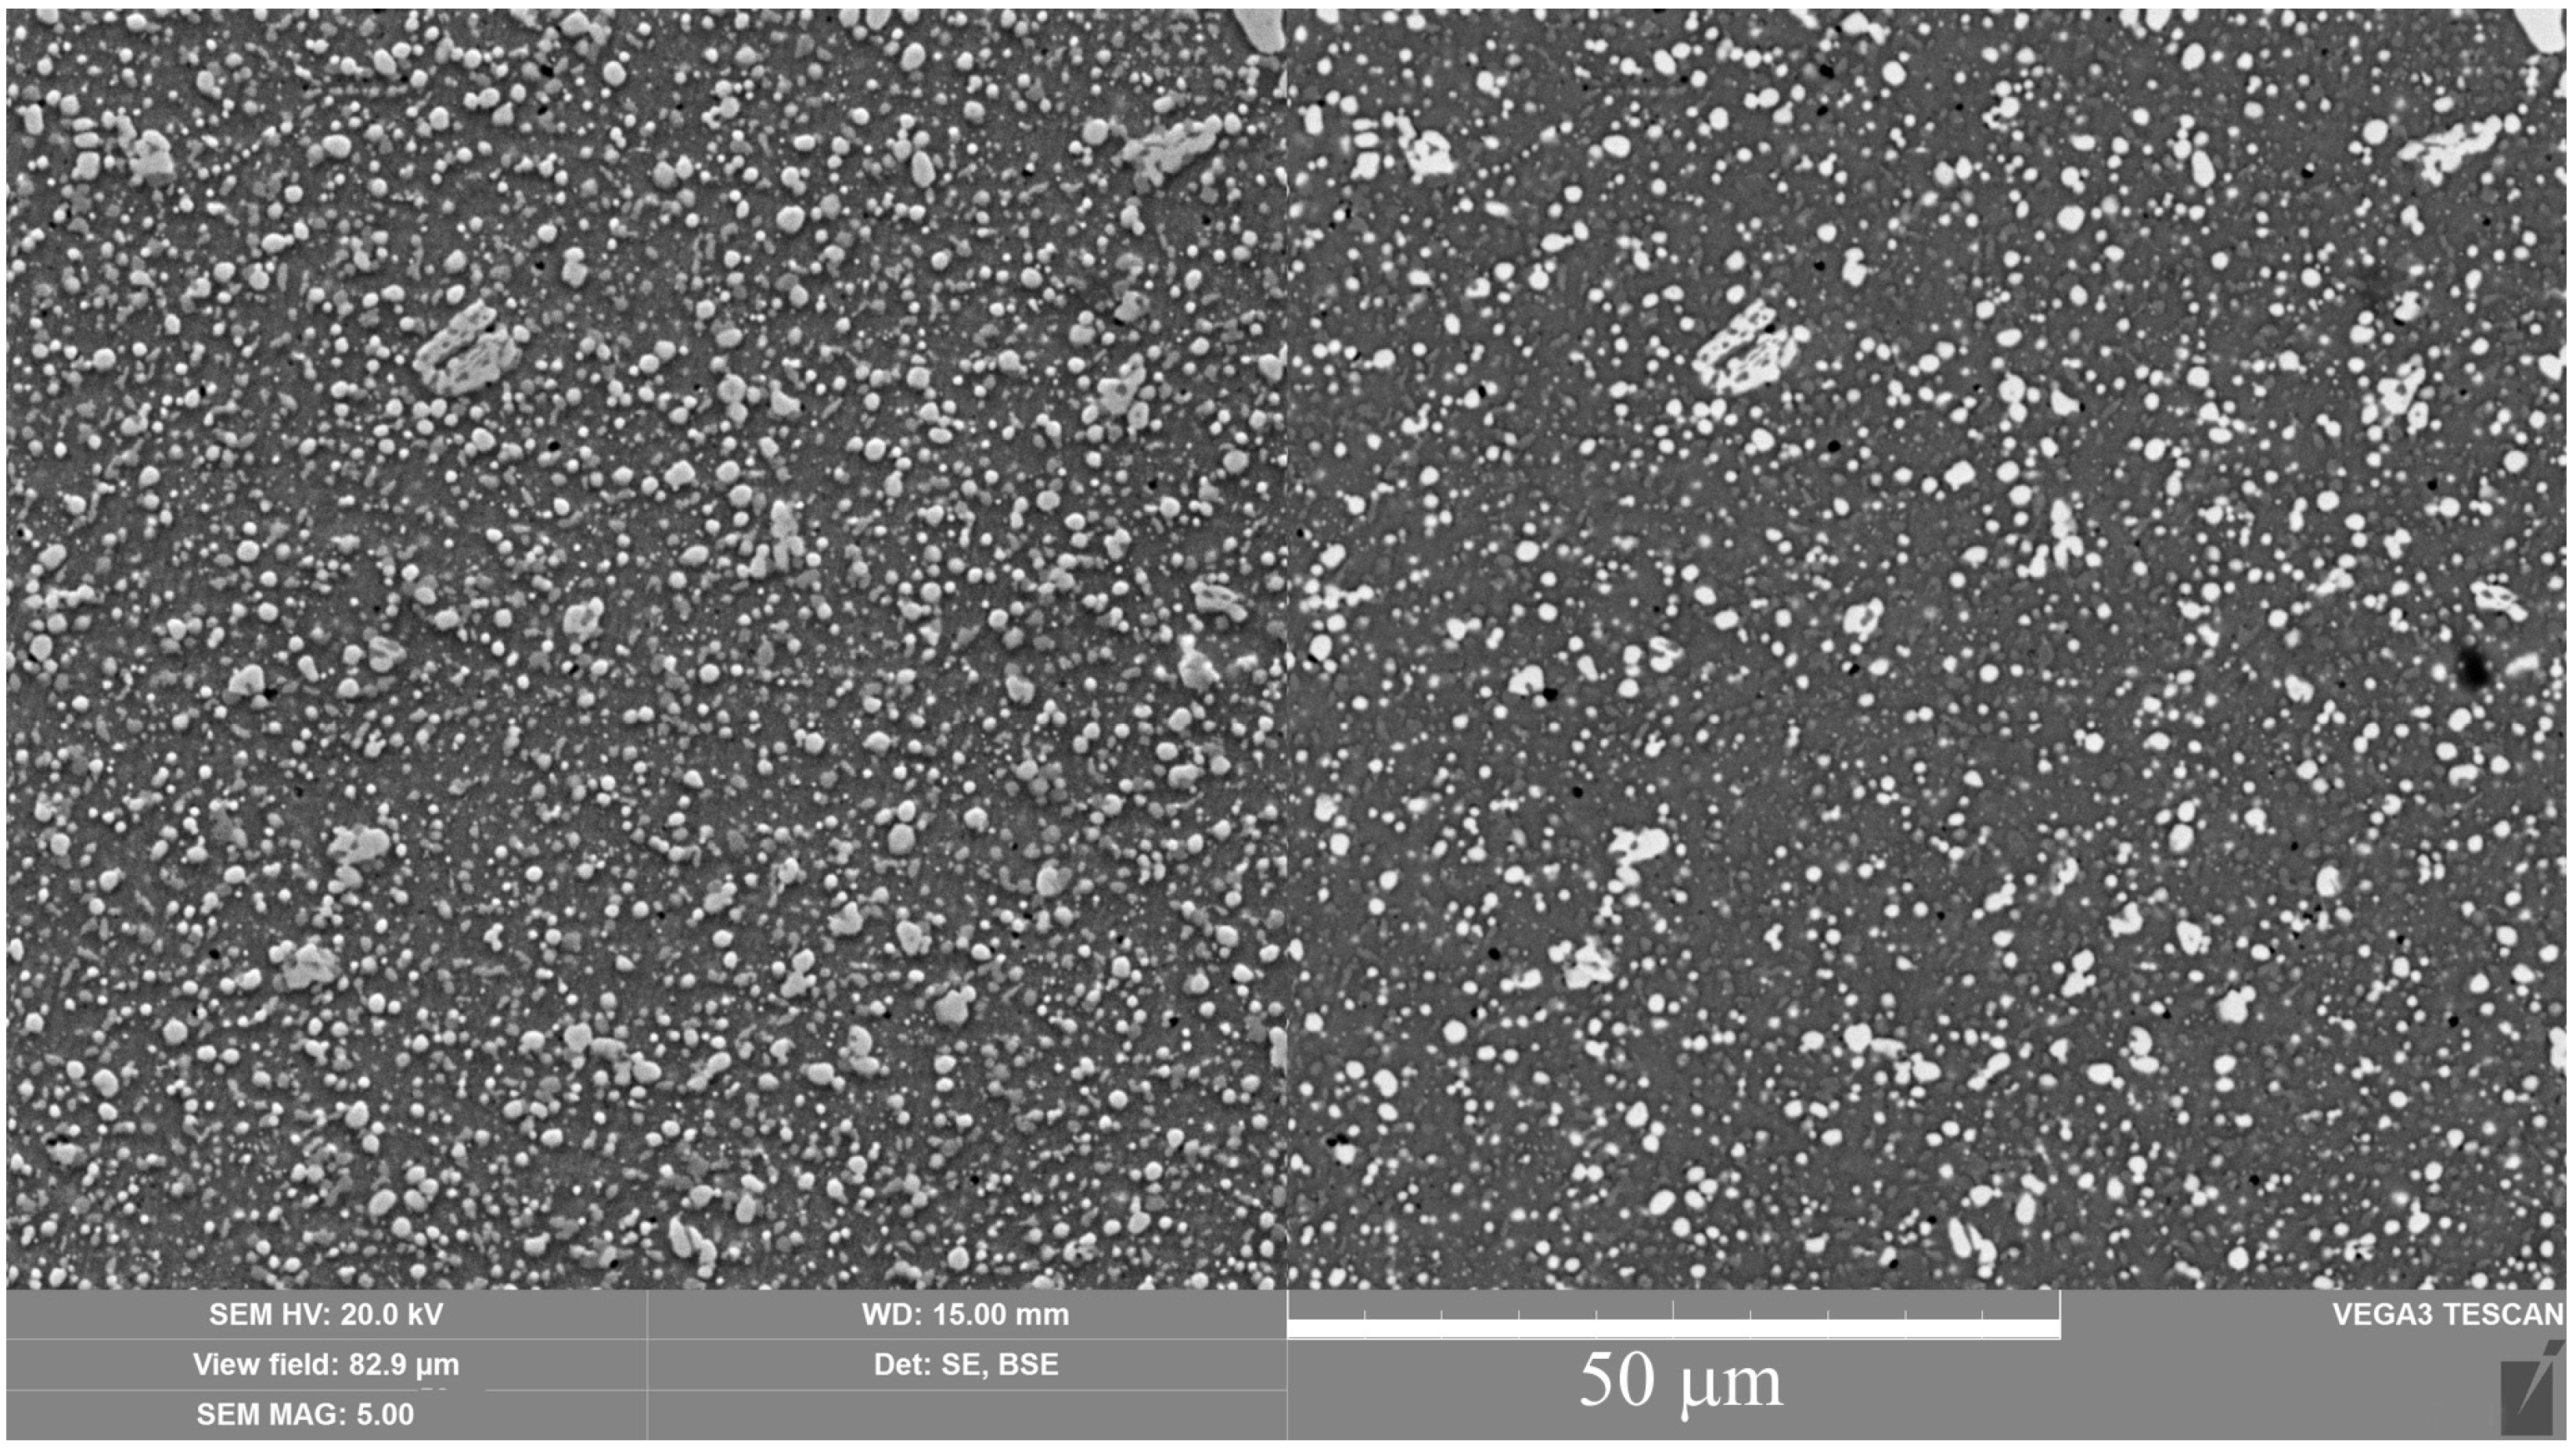
After three temperings in both processing variants, the release of carbides is observed throughout the entire volume of the material (Figure 10).

3.3. Microhardness Test

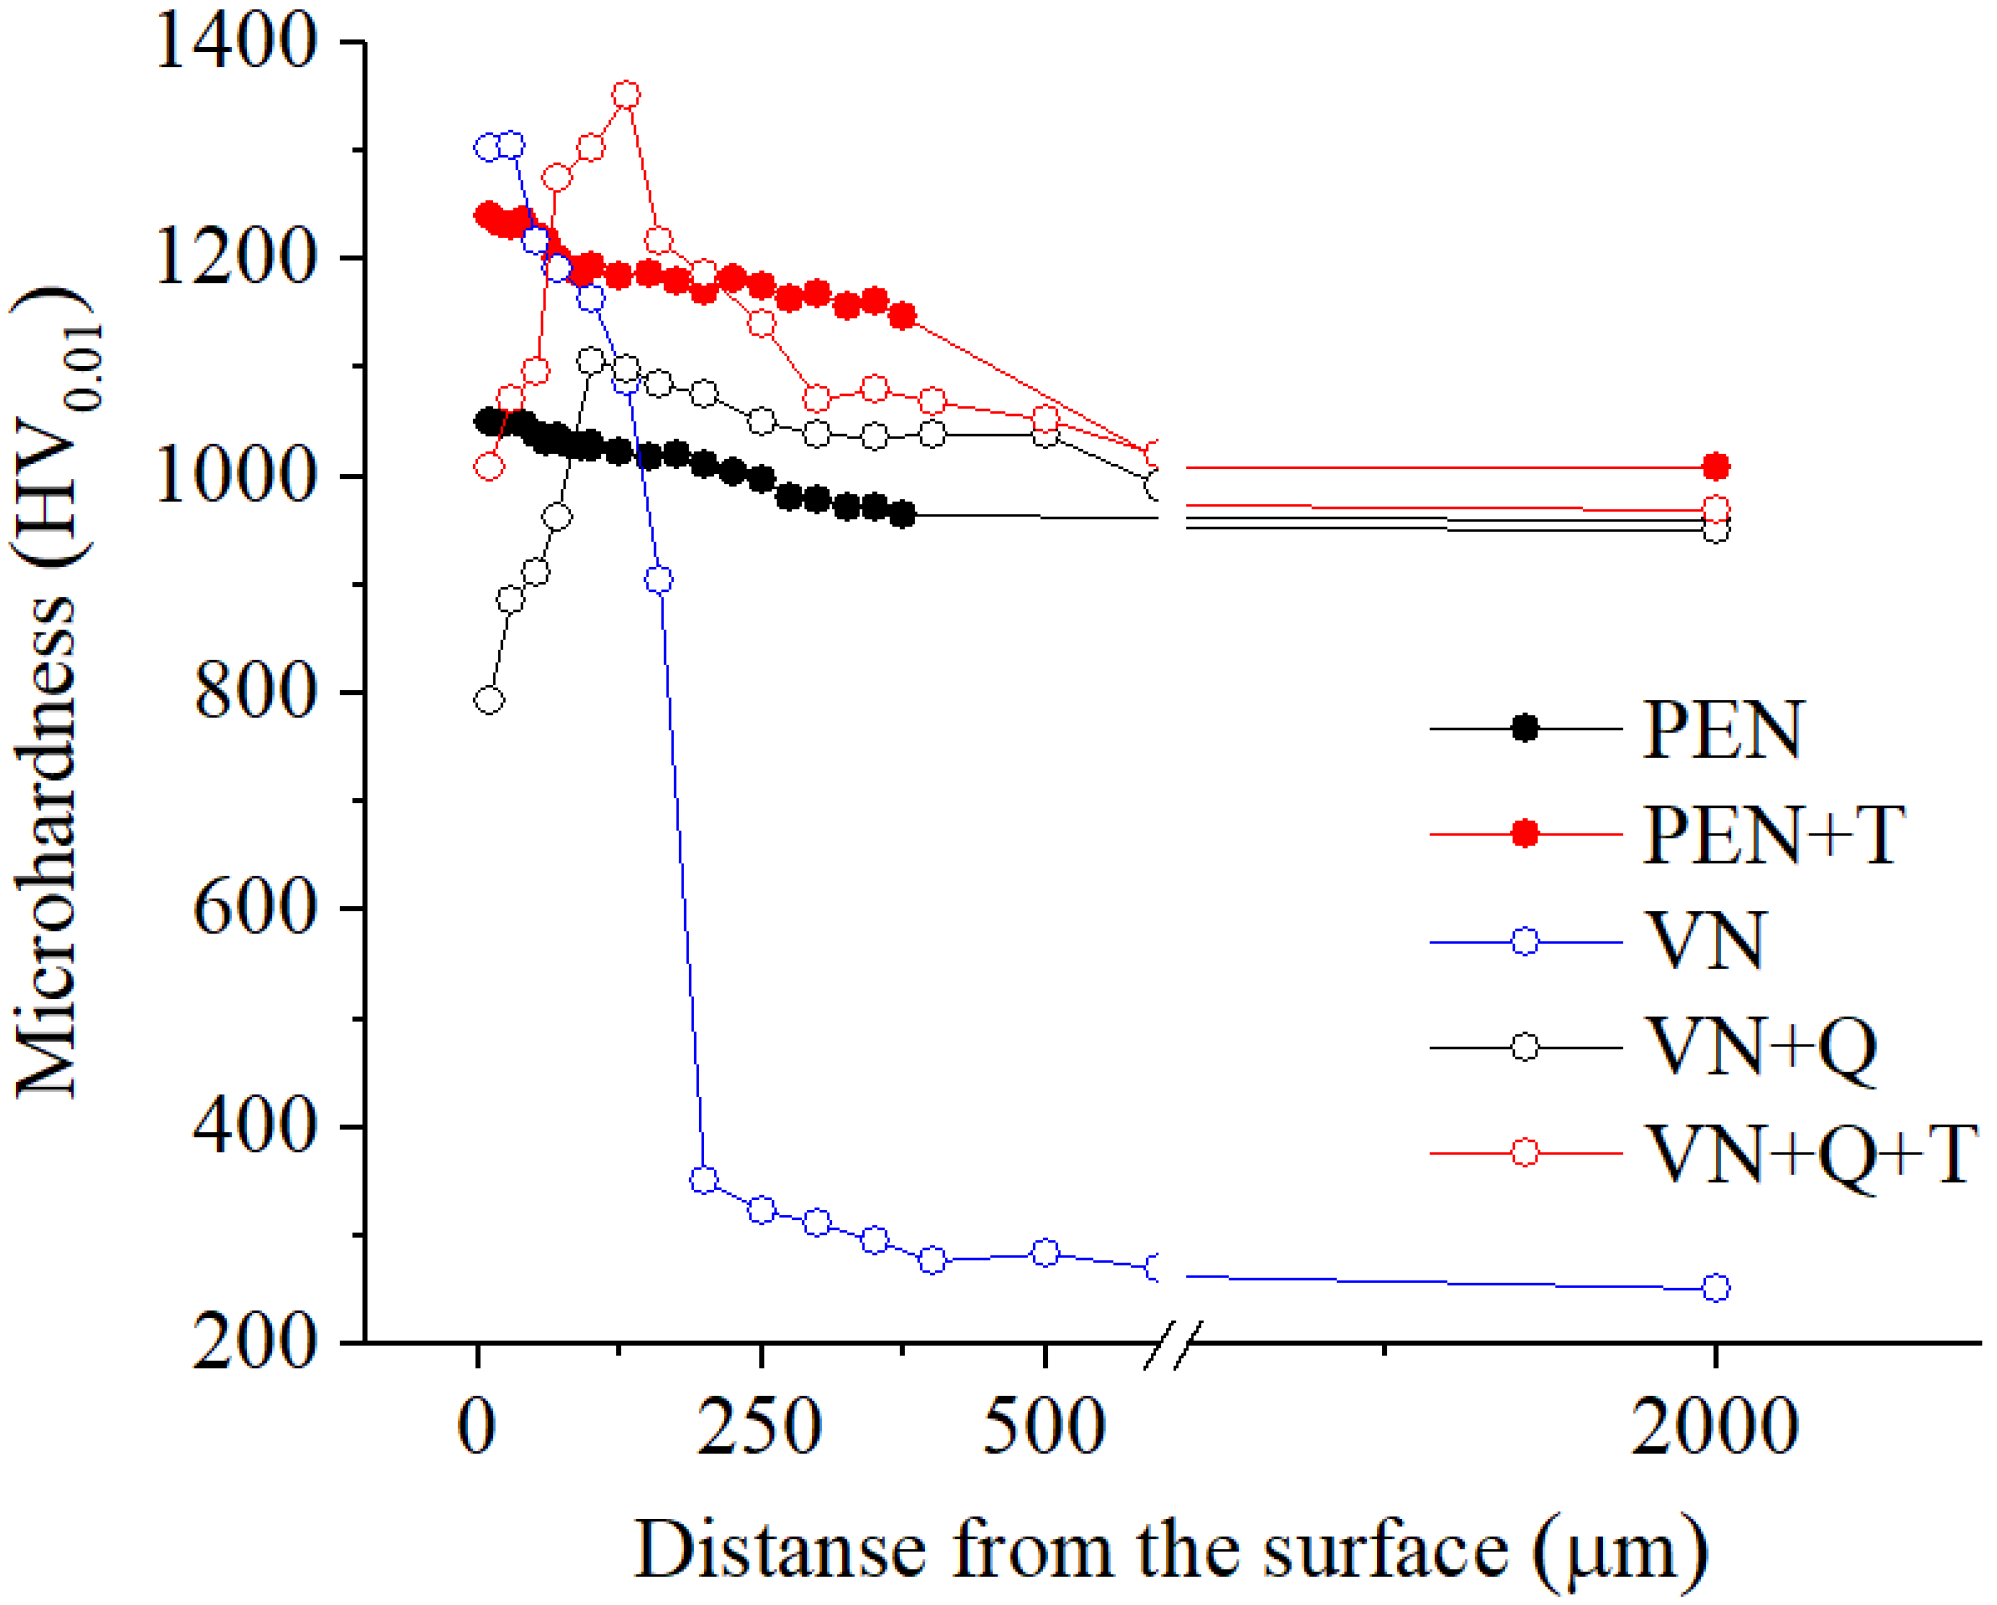
The results of microhardness measurements in the surface layer reflected the structural and phase changes (Figure 11). The microhardness after PEN in the surface layer reaches 1050 HV after quenching and 1240 HV after three-fold tempering due to precipitation hardening. Both after PEN with quenching and after subsequent tempering, the hardness in the core does not decrease below 960 and 1000 HV, respectively.
After VN, hardening occurs only in the nitriding zone, reaching 1300 HV. Plasma-electrolytic hardening provides an increase in hardness over the sample volume (not lower than 950 HV, exceeding the values of the raw sample—650 HV) with a decrease at the surface edge. The decrease in hardness at the edge may be due to the high concentration of nitrogen and its displacement of carbon. At the same time, at a depth of 100 μm, the hardness (1100 HV) exceeds the value of the samples after PEN (1030 HV). This can be explained by the displacement of carbon from the surface edge to a certain depth. Subsequent tempering leads to a symmetrical increase in hardness along the cross-section profile due to dispersion hardening, reaching 1350 HV.
Figure 6 shows the distribution of the nitrogen concentration at a depth of up to 100 μm for the VN + Q + T and PEN + T samples. In the 0–30 μm range, the concentrations are similar in both cases. However, in the 50–100 μm range, the nitrogen concentration in the VN + Q + T case is 4 times higher than the value for the 0–30 μm range, and in the PEN + T case, the concentration is zero. In the corresponding 0–100 μm range in Figure 11, the hardness distribution may appear contradictory, since the hardness in the 0–30 μm range for VN + Q + T is approximately 200 HV lower than for PEN + T. This contradiction is resolved by taking into account the behavior of carbon atoms under the influence of nitrogen atoms diffusing from outside during saturation and subsequent heat treatment. The presence of nitrogen in the surface layer increases the thermodynamic activity of carbon, forcing it into deeper layers of the alloy through diffusion, and its concentration in the region saturated with nitrogen by diffusion decreases. The initial nitrogen concentration in the VN samples before quenching and tempering is significantly higher than after PEN, as is the depth to which nitrogen diffused. This leads to greater decarburization of the surface layer (including during heating for quenching) and to a greater depth in the case of VN + Q + T. This explains the lower hardness in the thin surface layer of the VN samples (0–30 μm) at similar nitrogen concentrations. At greater depths (50–100 μm), the lack of carbon in the VN samples is compensated for by a significant increase in nitrogen concentration, and the hardness exceeds the corresponding value obtained for PEN.

3.4. Tribological Testing

The results of the tribological tests are presented in Figure 12, Figure 13 and Figure 14.
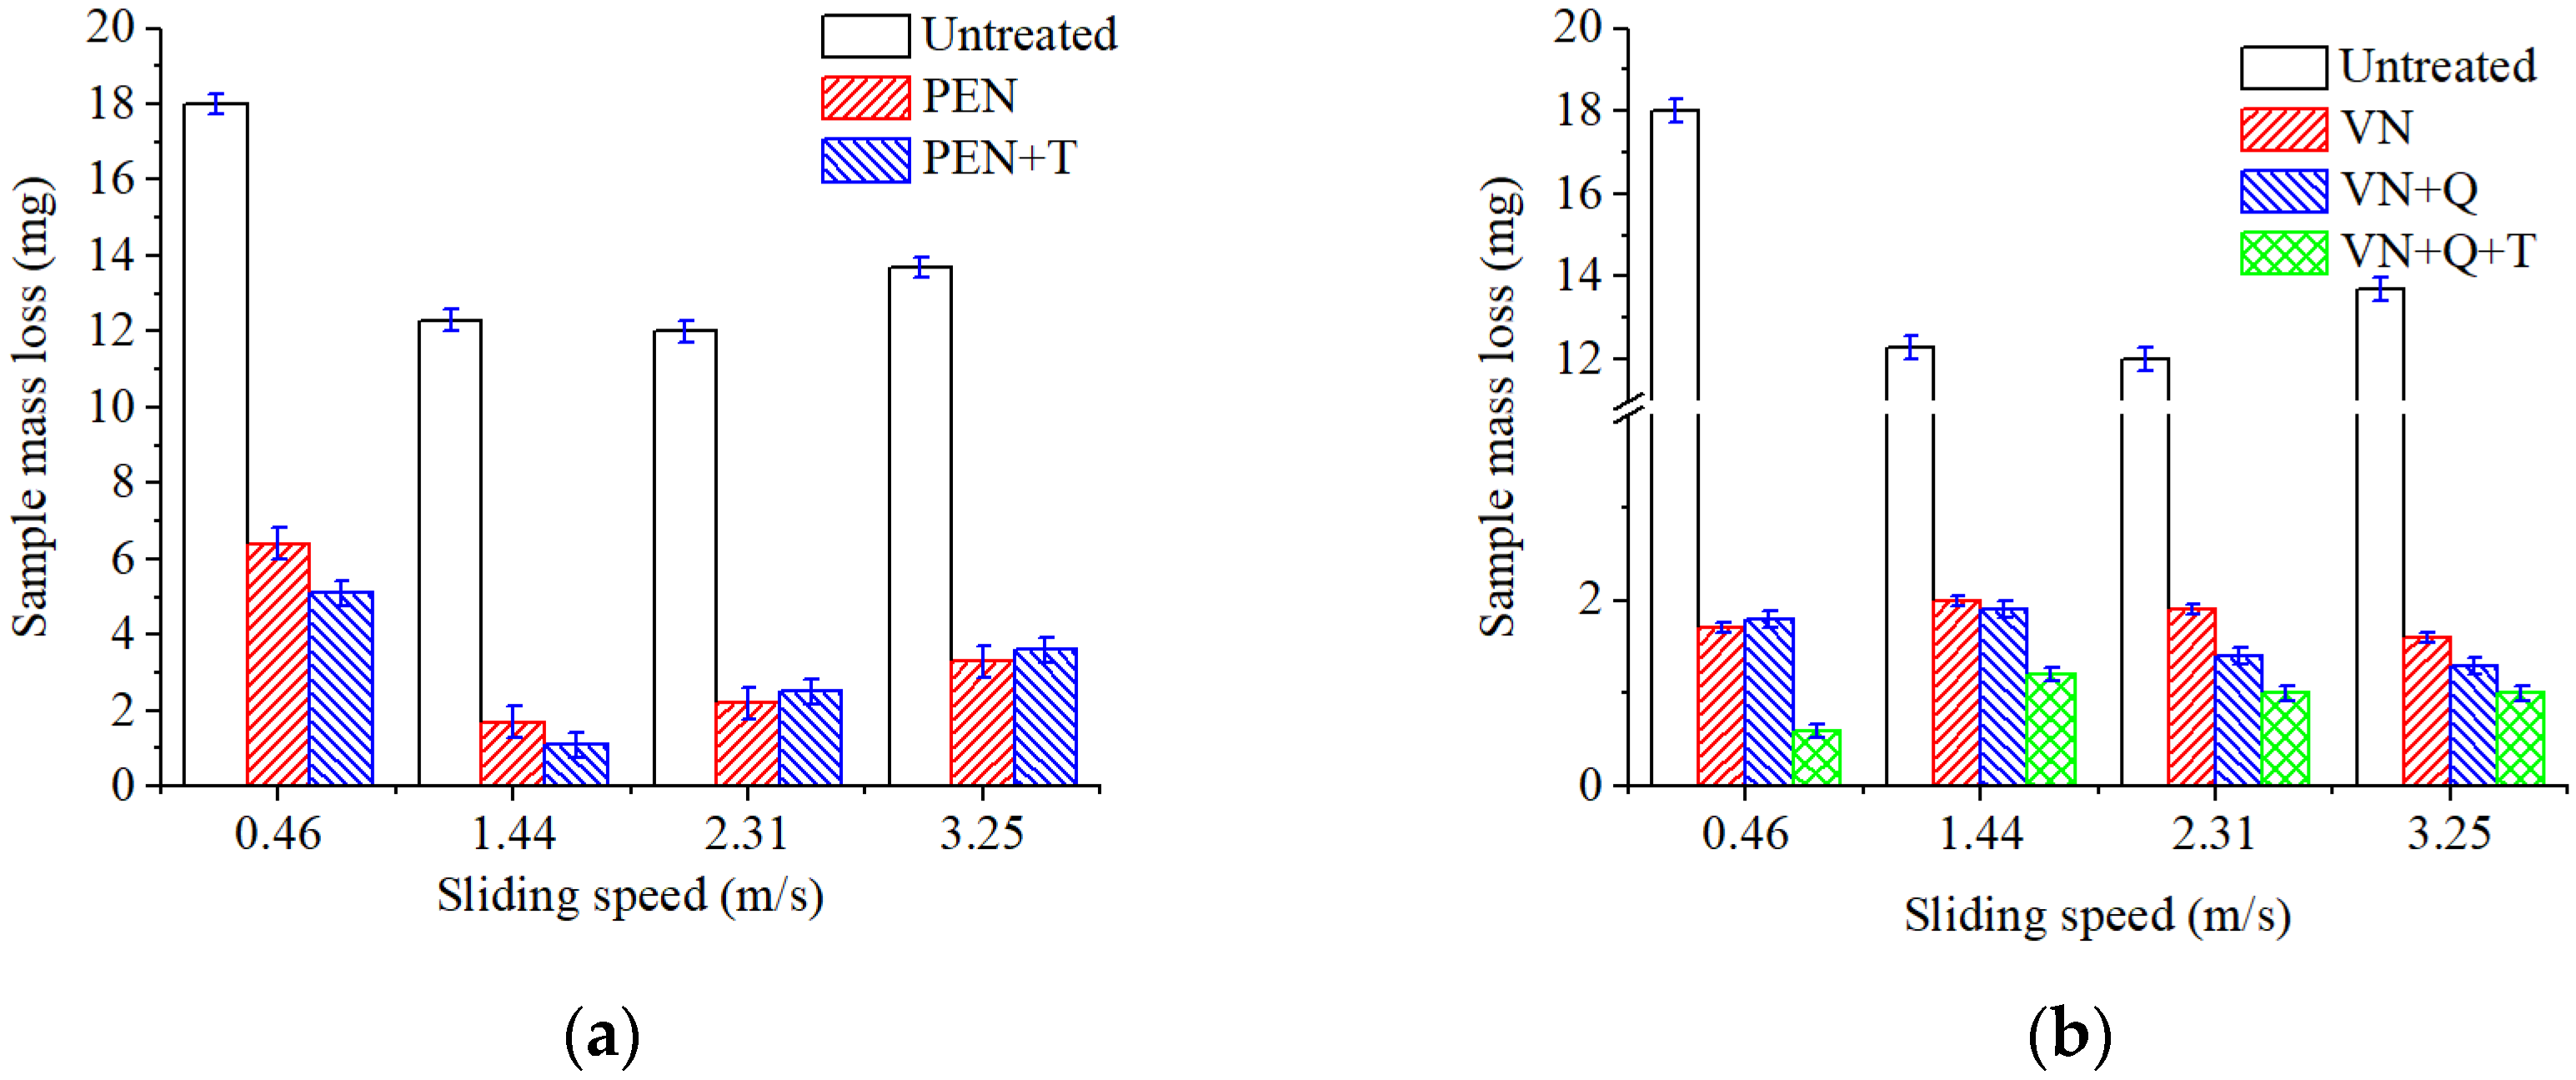
The obtained results showed a decrease in the mass loss of the M2 steel samples after all types of treatment compared to the untreated sample.
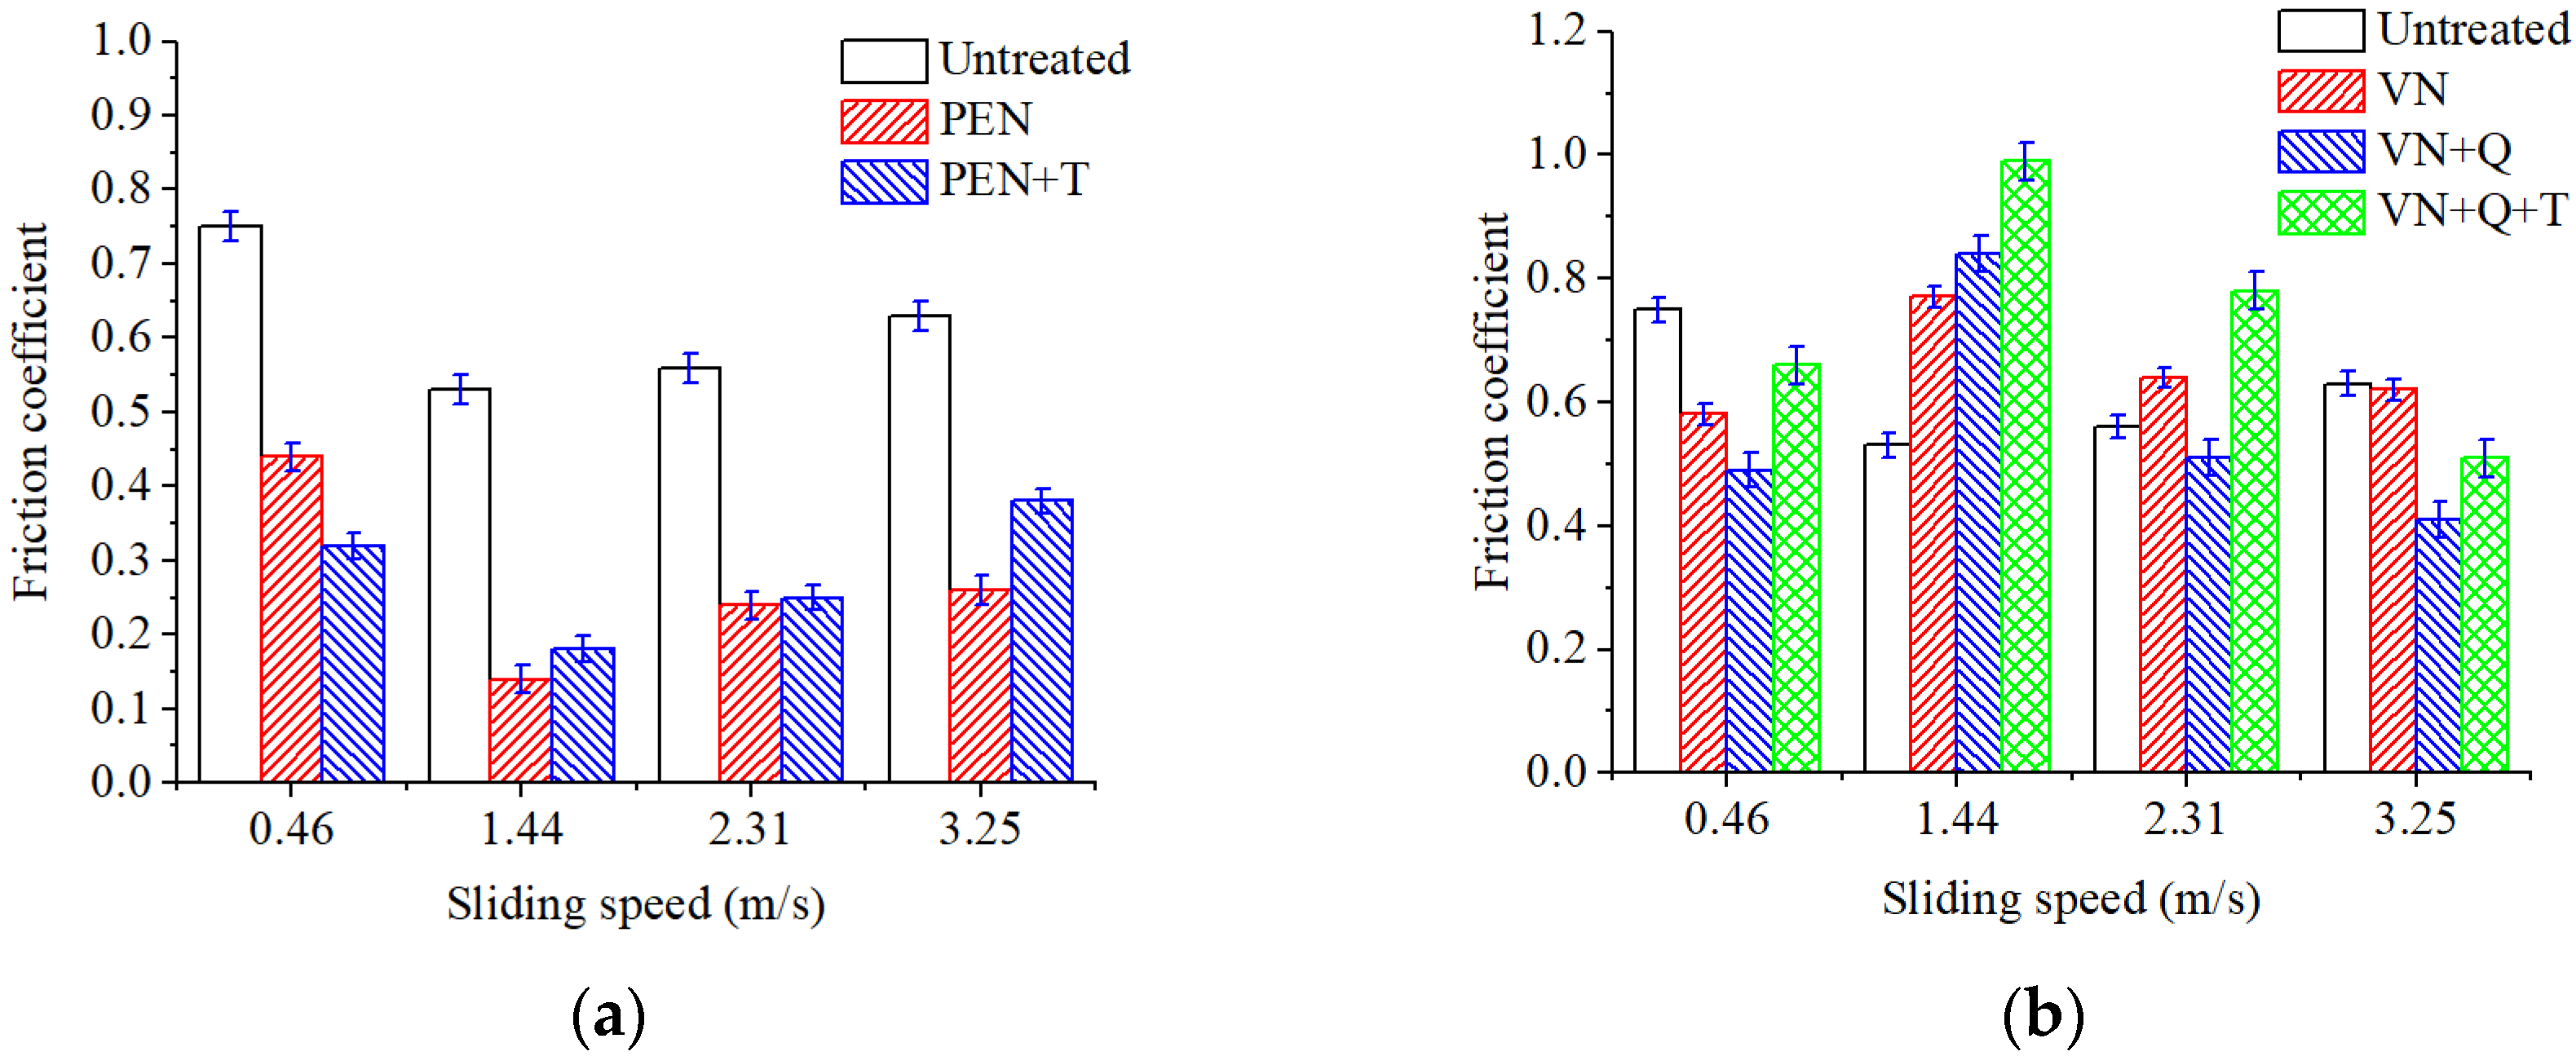
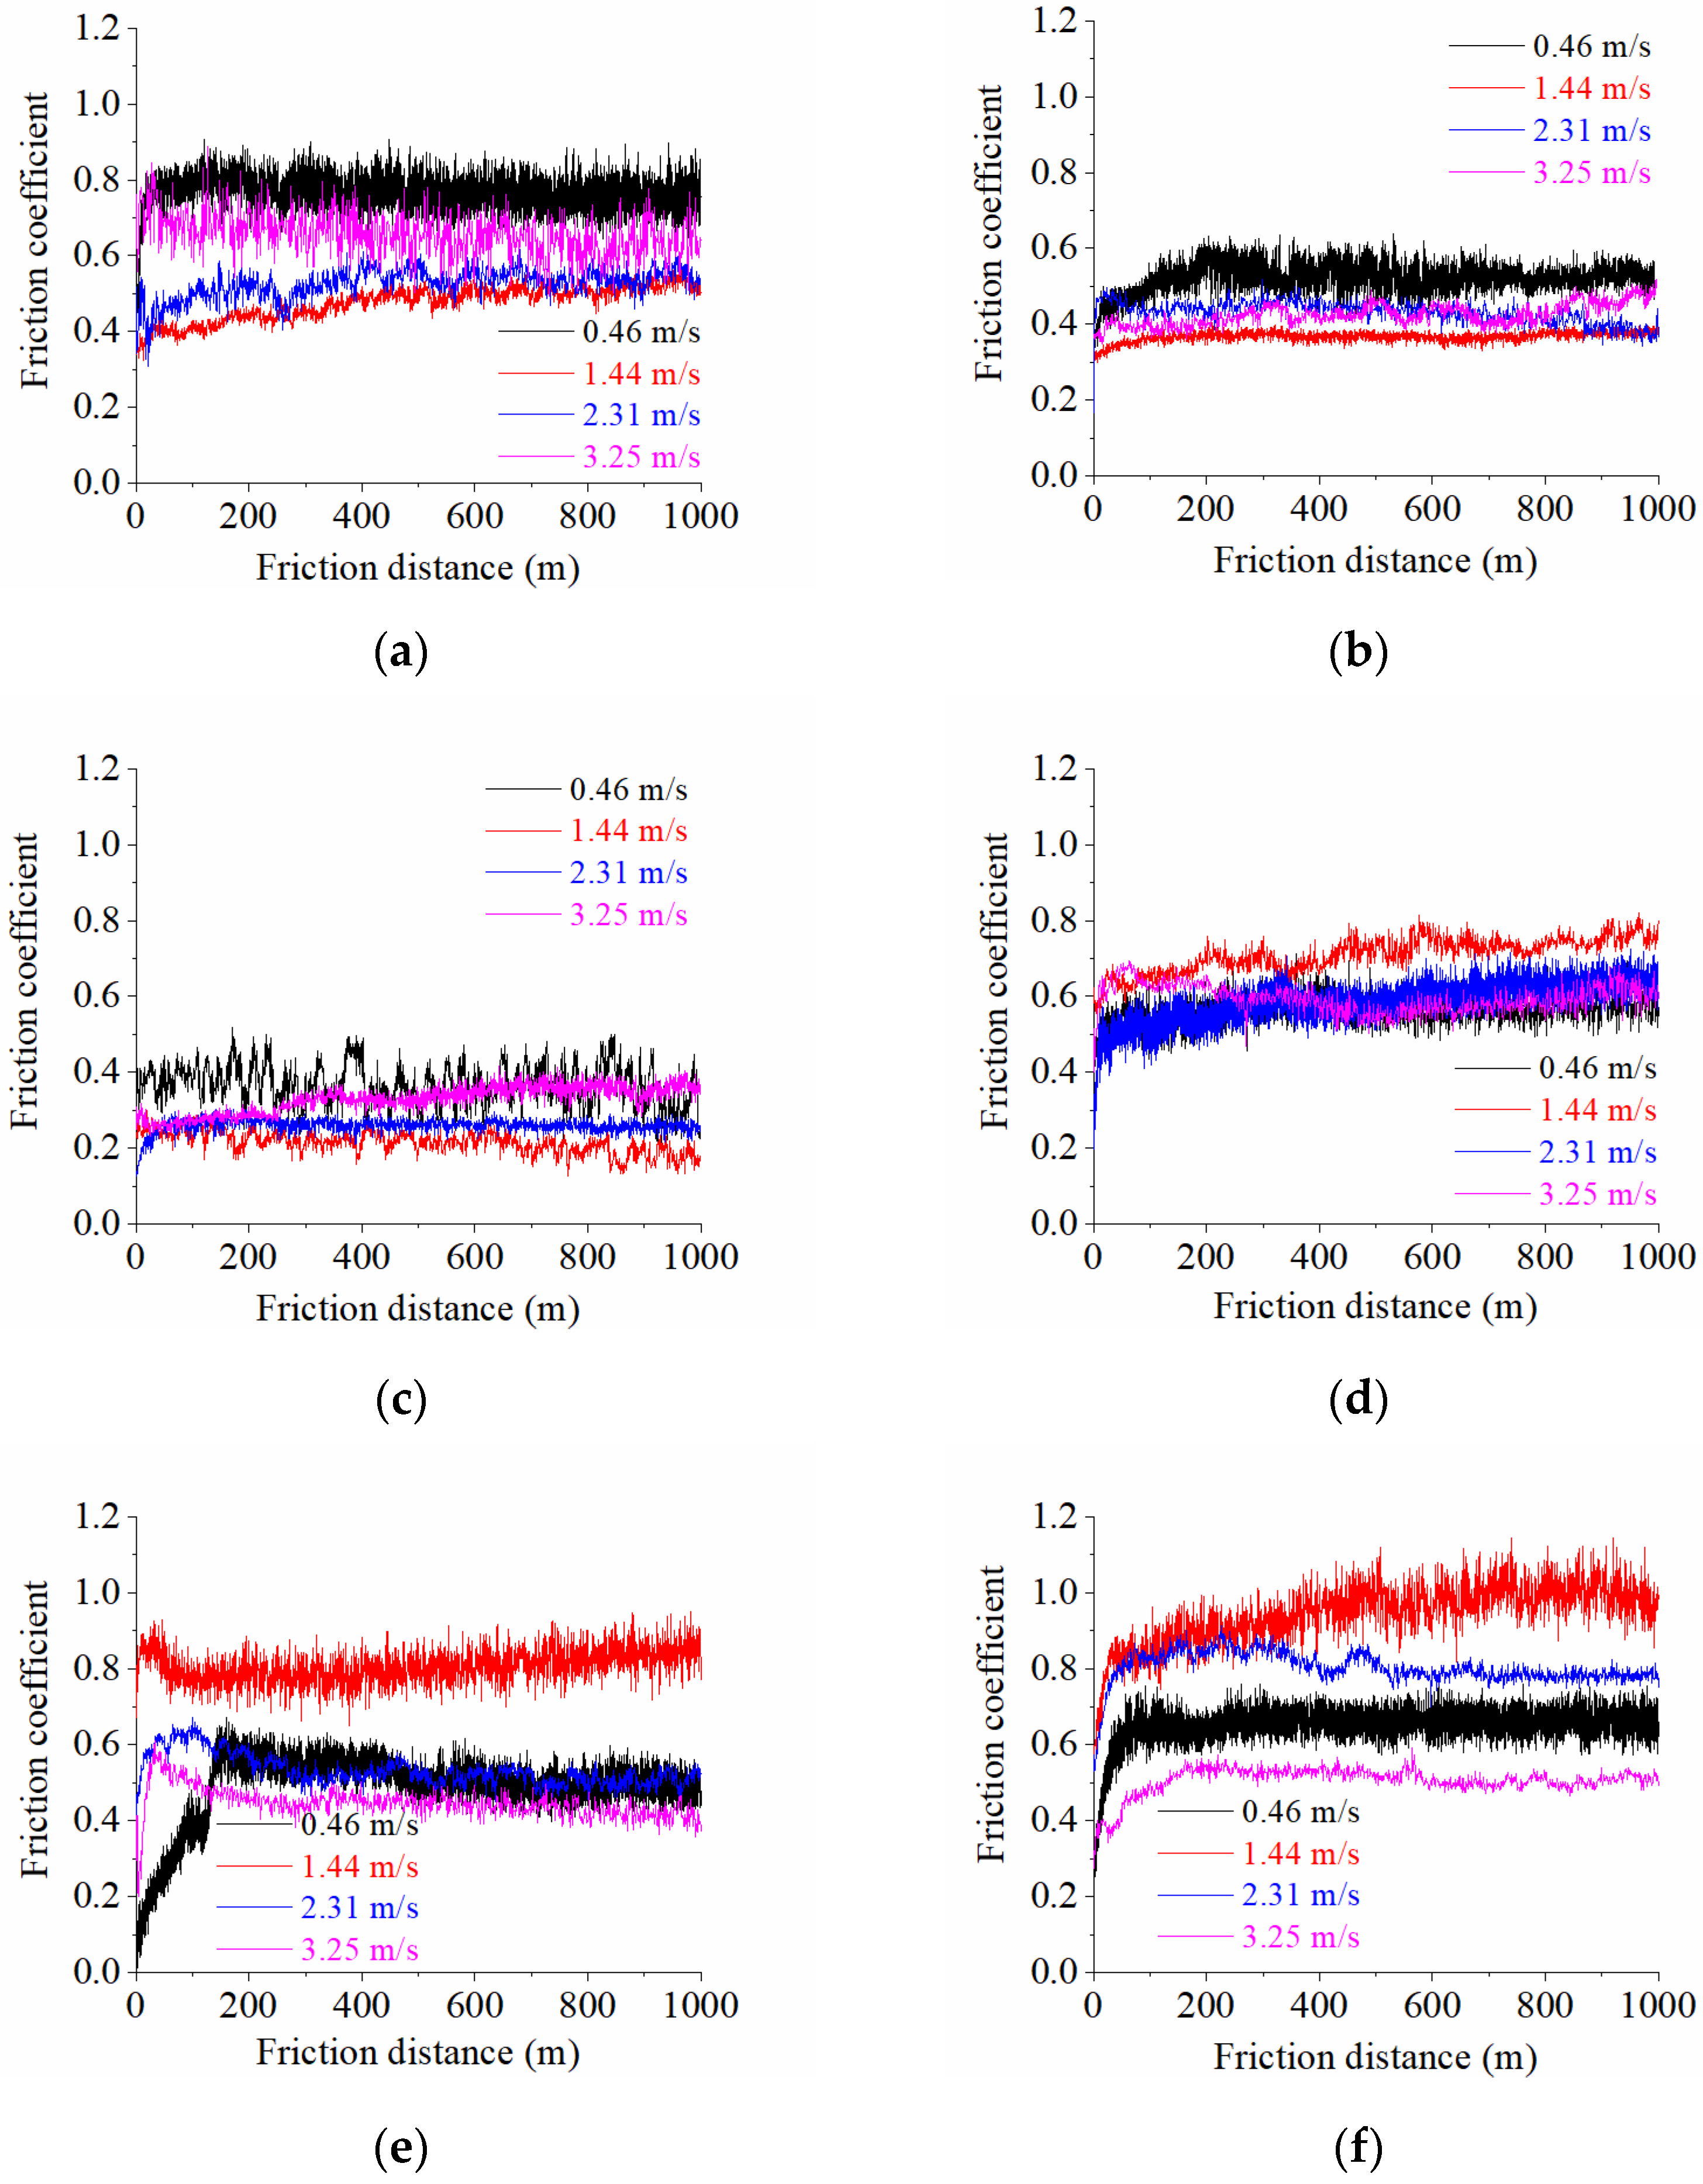
The tribological tests of samples after PEN demonstrated the dependence of the friction coefficient and mass loss on the sliding speed of the sample on the counter body, with a characteristic minimum at a speed of 1.44 m/s, which, to a certain extent, correlates with the test results of the untreated samples. At this sliding speed, the friction coefficient decreases by 3.8 times, and mass loss decreases by 7.2 times, compared to untreated samples. The friction coefficient at a sliding speed of 1.44 m/s has an almost constant value over the entire friction distance (Figure 15b), while, on the untreated sample, it tends to increase (Figure 15a).
Tempered samples after PEN increase in hardness (Figure 11), which complicates plastic deformation. The weight loss during friction decreases both relative to the untreated sample and, in some cases, to randomly quenched nitrided samples without tempering. The general nature of the dependence of the friction coefficient and mass loss on the sliding speed remains the same. The minimum weight losses and the lowest friction coefficient are observed at a sliding speed of 1.44 m/s. In this case, the mass loss will decrease by 11.2 times compared to the untreated sample and by 1.5 times compared to the PEN sample. The friction coefficient at the friction distance, as after PEN without tempering, has a constant value, on average (Figure 15c).
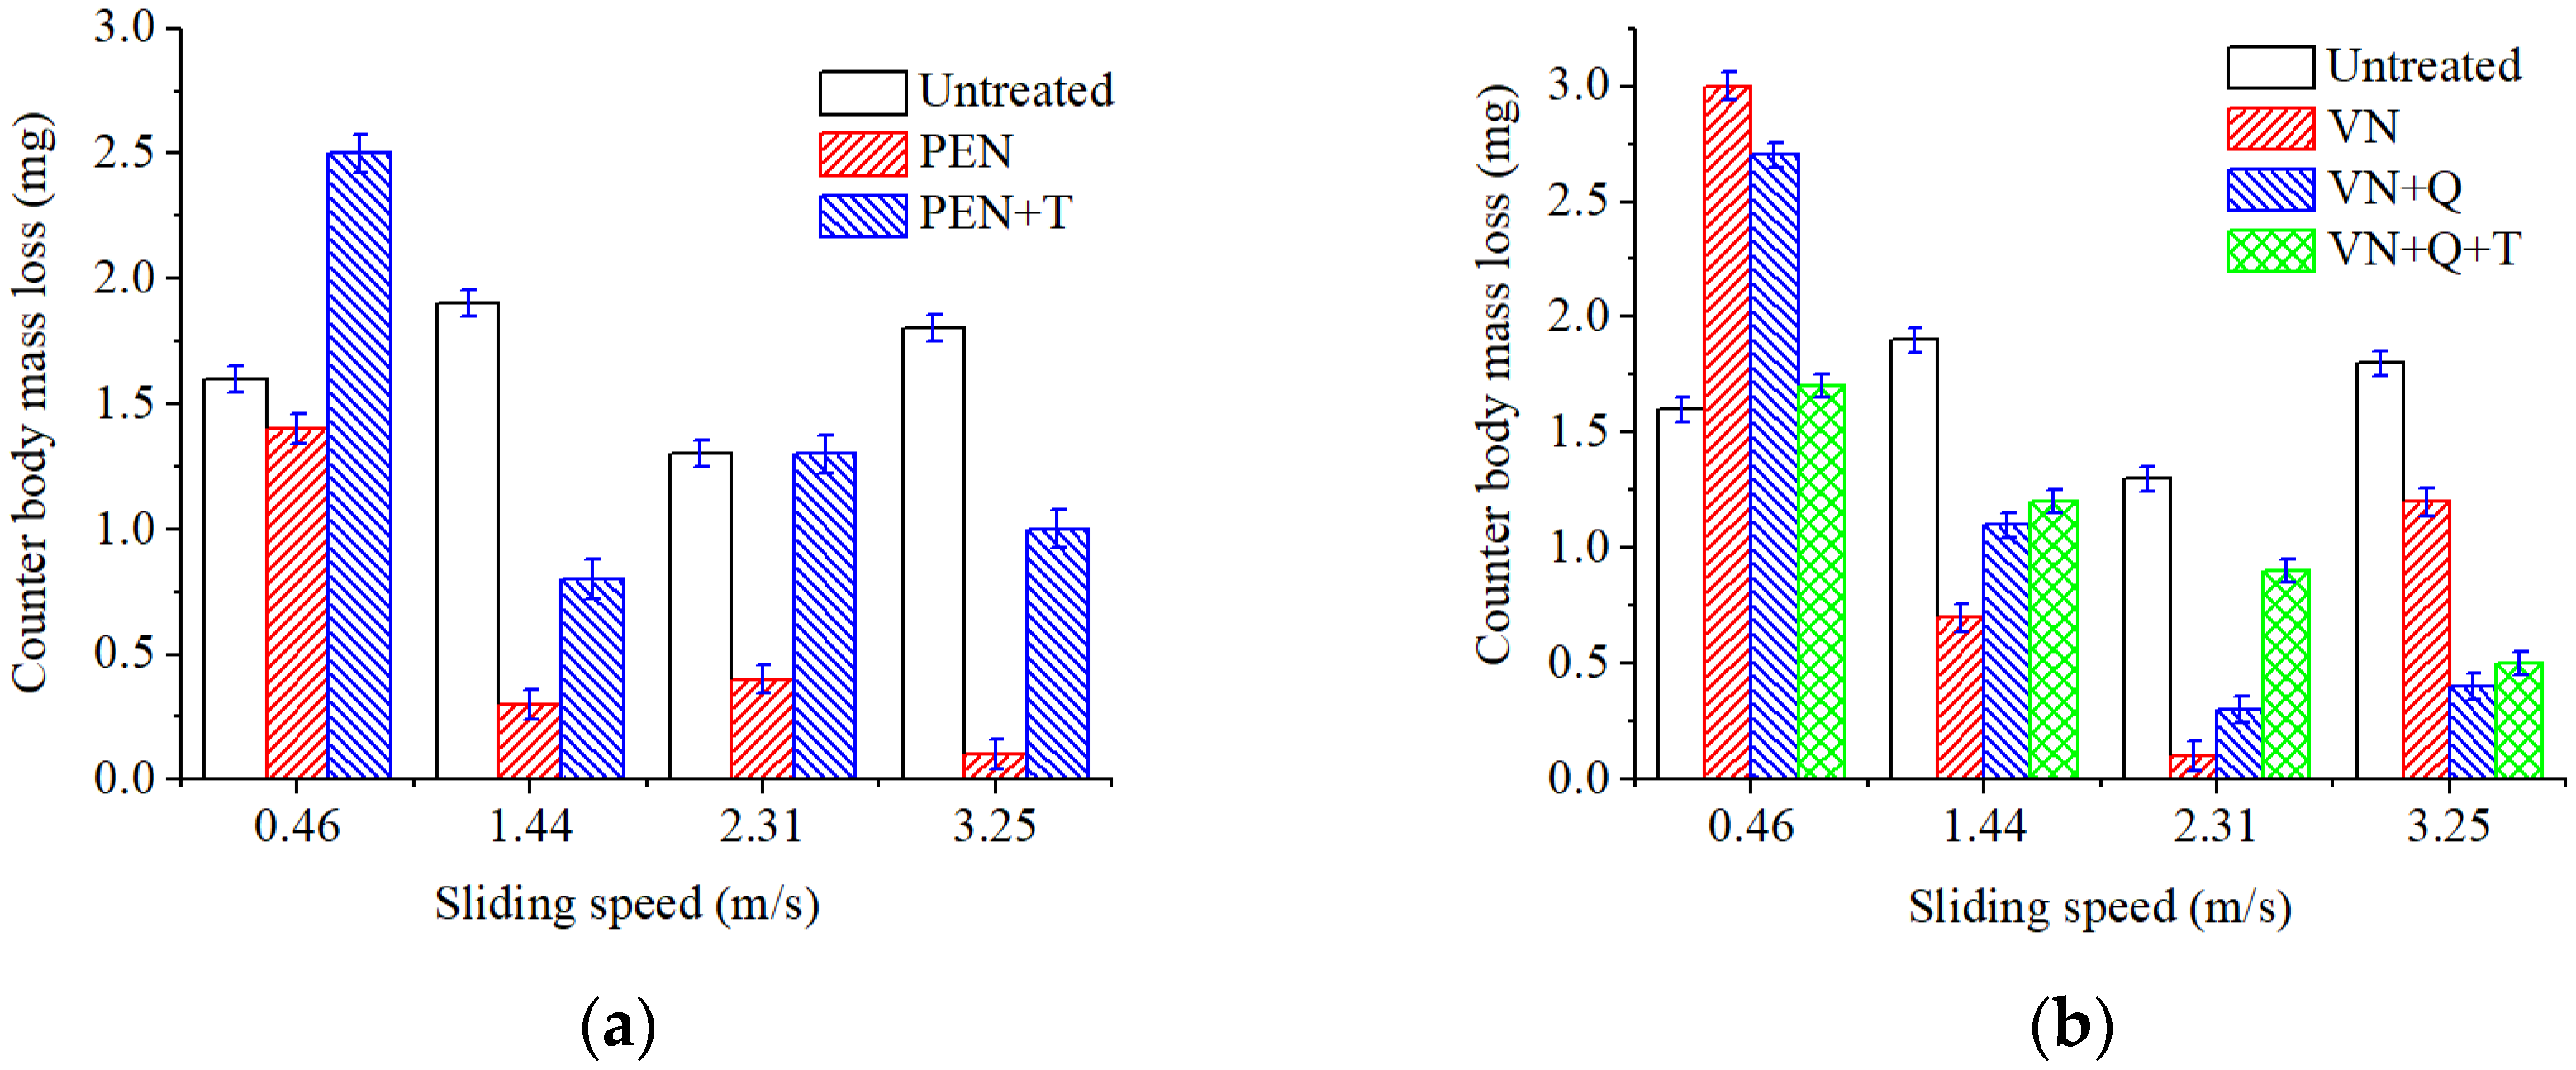
It is worth noting that the loss in weight of the friction pair (the sum of the loss in weight of the sample and the counter body) is minimal in the speed range of 1.44–2.31 m/s.
VN reduces mass loss by 6.2–10.8 times compared to the untreated sample, depending on the sliding speed of the sample on the counter body. The increase in wear resistance is facilitated by an increase in surface hardness (Figure 11), caused by enrichment in the surface layer with iron, chromium, and vanadium nitrides (Figure 4). The lowest sample wear is observed at a sliding speed of 3.25 m/s relative to the untreated sample. The friction coefficient after VN decreases only at the minimum sliding speed relative to the untreated sample, showing an increase in dynamics over the friction distance (Figure 15d).
After quenching the VN samples, a reduced surface hardness is observed (Figure 11). However, this is not accompanied by a decrease in wear resistance. The hardness of the subsurface layers and the core, on the contrary, increases significantly, relative to the VN sample. This leads to a decrease in mass loss by 1.4 times relative to the VN sample and by 8.6 times relative to the untreated sample at a sliding speed of 3.25 m/s. The friction coefficient under these conditions also decreases by 1.2 and 1.1 times relative to the nitrided and untreated samples, respectively, with characteristic decreasing dynamics over the friction distance (Figure 15e).
The minimum weight losses due to friction were recorded after VN with quenching and tempering over the entire range of variation in the sliding speeds of the sample on the counter body. Tempering leads to extensive precipitation of alloying element carbides both on the surface and in the volume of the material, which ensures an increase in hardness (Figure 11). The most significant 30-fold decrease in mass loss compared to the untreated sample occurs at the minimum sliding speed. At the same time, the friction coefficient with an increase in the hardness of the sample, as well as after quenching, continues to grow with relatively stable dynamics over the friction distance (Figure 15f).

4. Discussion

A comparative assessment of the results of structural and phase changes during various types of processing based on plasma electrolyte and vacuum nitriding made it possible to identify both distinctive features and certain similarities.
High-speed PEN, which consists of diffusion saturation of the steel surface with nitrogen and subsequent quenching, ensures the formation of nitrogen martensite, which forms a continuous martensite layer with increased microhardness up to 1050 HV. Below this layer, a hardened sublayer with dispersedly distributed nitrides Fe2-3N and chromium CrN is revealed. The formation of such a structure is due to a higher cooling rate on the surface from the quenching temperature (1230 °C), which leads to martensitic transformation of almost all austenite with diffuse nitrogen dissolved in it, as well as carbides VC, WC, MoxCy, and Cr3C2, which were part of the initial matrix. At a certain depth from the surface, the cooling rate decreases, as does the concentration of diffused nitrogen. This leads to incomplete martensitic transformation, the formation of residual austenite after quenching, and the coagulation of nitrides. The hardness of such a structure is slightly reduced. Below the nitrogen diffusion zone, at an even lower cooling rate, the precipitation of carbides along the grain boundaries is observed while maintaining a sufficiently high hardness of 960 HV.
A significantly longer holding time in a saturated ammonia environment at VN promotes greater nitrogen diffusion and formation of iron, chromium, and vanadium nitrides, unlike PEN. Low-temperature nitriding without heating to the austenitization temperature does not result in the dissolution of the initial carbides. The high concentration of nitrides in the diffusion zone promotes a significant increase in hardness, reaching 1300 HV. At the same time, the hardness of the core is significantly lower than the hardness of steel before treatment (about 1000 HV) because of tempering, which does not allow the use of VN technology without subsequent heat treatment.
The use of plasma electrolytic heating to a temperature of 1230 °C ensures the austenitization of steel and the dissolution of carbides. Subsequent air-cooling leads to hardening with martensitic transformation. In this case, similar processes are observed as in PEN with hardening. At the same time, a distinctive feature is a decrease in hardness at the edge of the surface after hardening. This could be due to the displacement of carbon by a large amount of nitrogen during diffusion and the partial dissolution of nitrides in austenite during subsequent heating for hardening. Thus, after heating to a temperature of 1230 °C, carbon depletion is observed in the surface layer, and almost all the nitrogen from solid nitrides dissolves in austenite and, during hardening, is formed into nitrogen martensite. At a certain depth, with a decrease in the nitrogen concentration in steel and an increase in the carbon concentration, the hardness begins to increase. Additionally, a decrease in the cooling rate promotes the release and coagulation of nitrides of increased hardness.
Evaluation of the tribological efficiency of plasma electrolytic and vacuum nitriding processes showed that samples nitrided by both methods provide friction without microcutting and seizures when operating under dry friction conditions without lubrication. Depending on the nitriding mode and subsequent heat treatment, mass loss during friction is reduced by 6–29 times. Increased wear resistance is determined by the structural state of the deformation zone during friction. Hardened particles of chromium and vanadium nitrides are located in a softer substrate of residual austenite. The applied load during friction is transferred to the hard components of the chromium and vanadium nitride deformation zone, and the substrate of residual austenite has a damping effect. It should be noted that both the compound layer and the diffusion zone affect surface quality from a tribological point of view. Iron nitrides Fe2-3N also have a favorable effect on the tribological characteristics of frictional conjugation.
Chromium and vanadium nitrides formed during VN and chromium nitrides formed during PEN are the result of segregations of alloying elements within the diffusion zone structure. Therefore, such nitrides do not form a coherent bond with the iron matrix. Incoherent nitride particles ensure the formation of a low level of microdeformations in the crystal lattice of the matrix metal. According to [49], the wear resistance of steel increases with the degree of disruption of the coherent bond between nitrides and the matrix in the nitrided layer.
The calculation of contact deformations (plasticity criterion in Equation (7); relative penetration of roughness protrusions of compressed surfaces through the ratio of Equations (7) and (5) in Table 2) made it possible to determine the wear mechanism depending on the sliding speed of the sample along the counter body.
At a low sliding speed of 0.46 m/s for all cases of processing in a tribological conjugation, the leading mechanism of destruction of the emerging frictional bonds is the plastic displacement of the sample material by the roughness protrusions of the counter body (h/r < 0.1; Kp > 3 in Table 2). Under the influence of plastic deformation, the sample surface areas are intensively strengthened and, after the plasticity reserve has expired, weight shear processes begin in them, leading to the appearance of submicroscopic cracks and brittle fatigue failure (Figure 16a).
Increasing the sliding speed to 1.44 m/s activates oxidation processes in the tribocontact. During friction, the surface oxide films are seized and destroyed (Figure 16b). The surface is destroyed by cutting the oxide film, and the leading wear mechanism is oxidative wear. This type of wear is favorable since the destruction processes are localized in the thinnest near-surface layers, which is what causes the minimum wear among all the cases studied.
A further increase in the sliding speed of the sample on the counter body to 2.31 m/s leads to more intense plastic deformations. The relative convergence h/r, determined by the ratio of Equation (7) to Equation (5) and calculated in Table 2, in this case, is greater than 0.1, which indicates the implementation of a plastic contact in the triboconjugation, not an elastic one. Plastic deformations destroy the surface oxide films, and fatigue wear during plastic contact is realized at the points of contact between the film-free metal surfaces of the sample and the counter body. On a portion of the friction track, the oxide films have time to grow again after destruction (Figure 16c); here, the oxidative wear mechanism is realized. Both oxide film wear and mechanical wear take place.
Increasing the sliding speed to 3.25 m/s further intensifies plastic deformations in the surface layer; as a result, the deformation rate becomes higher than the rate of growth of a new oxide film, and friction occurs mainly on metal surfaces (Figure 16d). The leading type of wear becomes fatigue wear, with a predominance of plastic deformations in tribocontact. The predominance of plastic deformations over elastic ones is proven by calculating the plasticity criterion and the relative penetration of rough surfaces according to Equations (5)–(7), as indicated in Table 2.

5. Conclusions

For the first time, the prospects of combining vacuum low-temperature nitriding with subsequent heat treatment (quenching) by the plasma electrolytic method are shown. Such a combination allows for creating thicker diffusion layers with a higher nitrogen concentration by vacuum nitriding than with plasma electrolytic nitriding due to the limited duration of the latter’s treatment. At the same time, subsequent plasma electrolytic treatment can allow controlled hardening.
The possibility of nitriding M2 high-speed tool steel by plasma electrolytic treatment with anodic polarity of the processed products and vacuum nitriding is studied. The results of structural–phase changes are presented, as well as tribological tests of samples processed by a traditional method for each technology and a combination of vacuum nitriding with subsequent quenching under plasma electrolytic heating conditions. The main conclusions of this work are as follows:
(1) The composition of modified layers on the surface of M2 steel after PEN was determined. High-temperature oxidation results in the formation of FeO, Fe2O3, and Fe3O4 oxides. The oxide layers have a porous structure, which ensures the transport of iron ions into the electrolyte during anodic dissolution and N atoms into the surface of the treated steel during diffusion saturation. Immediately beneath the oxide layer, the ε-phase Fe2-3N and chromium nitride CrN with residual austenite are formed, and acicular nitrogen martensite is formed below. The composition of the modified surface zone after VN was determined; in addition to the nitrides detected after PEN, it includes vanadium nitride. A higher percentage of nitrides in the surface layer and a deeper occurrence of nitrogen are shown after vacuum diffusion saturation compared to accelerated plasma diffusion saturation.
(2) Wear resistance was shown to be a structure-sensitive characteristic. The structure of the friction deformation zone depends on the initial structure of the nitrided layer. Modeling the topology of worn surfaces revealed the predominance of plastic deformation in the tribological interface zone during friction after both plasma electrolyte and vacuum nitriding. Surface plastic deformation alters the structure and properties of the friction deformation zone material, creating a friction structure that controls the degree of wear.
(3) The relationship between the tribological characteristics of the structural state of the deformation zone under friction and the structural state of the nitrided layer was determined. Hardened chromium and vanadium nitride particles are embedded in a softer substrate of retained austenite. During friction, the applied load is transferred to the hard components, while the retained austenite substrate acts as a damper. Chromium and vanadium nitride particles, formed at the segregated alloying elements, create low levels of microstrain in the crystal lattice, which also contributes to increased wear resistance.
Further research may focus on the use of plasma electrolytic polishing of surfaces as a finishing treatment after vacuum nitriding and plasma electrolytic hardening. Plasma electrolytic saturation of metal surfaces after vacuum nitriding with carbon, boron, and possibly sulfur atoms appears promising. In this case, a pre-nitrided layer with a high nitrogen concentration and a large nitrided layer depth will be saturated with carbon, boron, and sulfur, forming a unique structural and phase composition that is impossible to achieve using each method separately.
Author Contributions

Conceptualization, M.A.V. and S.N.G.; methodology, T.L.M. and A.E.S.; validation, S.F.K.; formal analysis, S.F.K.; investigation, T.L.M., I.V.T., A.O.K., and A.E.S.; resources, S.N.G. and I.V.S.; writing—original draft preparation, T.L.M., I.V.T., A.O.K., A.E.S., and S.A.K.; writing—review and editing, M.A.V., I.V.S., and S.A.K.; visualization, S.F.K.; supervision, I.V.S.; project administration, S.N.G.; funding acquisition, M.A.V. All authors have read and agreed to the published version of the manuscript.

Funding

This research was carried out with the financial support of the Russian Science Foundation within the framework of scientific project No. 24-19-00811.

Data Availability Statement

The original contributions presented in this study are included in this article; further inquiries can be directed to the corresponding author.

Acknowledgments

This study was carried out on the equipment of the Center of collective use of MSUT “STANKIN”, supported by the Ministry of Higher Education of the Russian Federation.

Conflicts of Interest

The authors declare no conflicts of interest.

Abbreviations

The following abbreviations are used in this manuscript:
VNVacuum nitriding
PENPlasma electrolytic nitriding
QQuenching
TTempering

References

  1. Bhadraiah, D.; Nouveau, C.; Veeraswami, B.; Ram Mohan Rao, K. Plasma based nitriding of tool steel for the enhancement of hardness. Mater. Today Proc. 2021, 46, 940–943. [Google Scholar] [CrossRef]
  2. Song, X.; Zhang, Z.-Q.; Narayanaswamy, S.; Huang, Y.Z.; Zarinejad, M. Numerial and Experimental Study on the Residual Stresses in the Nitrided Steel. J. Mater. Eng. Perform. 2016, 25, 4036–4045. [Google Scholar] [CrossRef]
  3. Smirnov, A.E.; Smirnova, N.A.; Perestoronin, A.V.; Seval’nev, G.S. Vacuum Nitriding of Heat-Resistant Steel After Laser Processing. Met. Sci. Heat Treat. 2024, 66, 66–71. [Google Scholar] [CrossRef]
  4. Hradil, D.; Duchek, M.; Hrbáčková, T.; Ciski, A. Gas nitriding with deep cryogenic treatment of high-speed steel. Acta Metall. Slovaca 2018, 24, 187–193. [Google Scholar] [CrossRef]
  5. Makhneva, T.M.; Goncharova, N.V.; Aleksandrova, G.V. Formation of nitrogen austenite in steel 08Kh15N5D2T due to quenching in closed volume. Met. Sci. Heat Treat. 2006, 48, 554–557. [Google Scholar] [CrossRef]
  6. Aghajani, H.; Behrangi, S. Plasma Nitriding of Steels; Springer: Cham, Switzerland, 2017; 187p. [Google Scholar] [CrossRef]
  7. Somers, M.A.J.; Christiansen, T.L. Surface hardening of iron and steels-nitriding and nitrocarburizing. In Comprehensive Materials Processing, 2nd ed.; Technical University of Denmark: Lyngby, Denmark, 2024; Volume 1–13, pp. 65–94. [Google Scholar] [CrossRef]
  8. Stolbovyi, V.; Andreev, A.; Serdiuk, I.; Kolodii, I.; Shepelev, A. Vacuum-arc nitriding of carbon steels having low tempering temperature. Adv. Mater. 2021, 10, 48–54. [Google Scholar] [CrossRef]
  9. Sezgin, C.T.; Hayat, F. Influence of Vacuum Gas Nitriding on Wear and Corrosion Behavior of a High Manganese Steel. J. Mater. Eng. Perform. 2025. [Google Scholar] [CrossRef]
  10. Uzunova, V.M. Nitriding in vacuum P6M5 steel. Int. J. Mater. Prod. Technol. 1993, 8, 194–199. [Google Scholar] [CrossRef]
  11. Jordan, D. Vacuum gas-nitriding furnace produces precision nitrided parts. Heat Treat. Prog. 2009, 9, 45–48. [Google Scholar]
  12. Apelfeld, A.; Borisov, A.; Dyakov, I.; Grigoriev, S.; Krit, B.; Kusmanov, S.; Silkin, S.; Suminov, I.; Tambovskiy, I. Enhancement of Medium-Carbon Steel Corrosion and Wear Resistance by Plasma Electrolytic Nitriding and Polishing. Metals 2021, 11, 1599. [Google Scholar] [CrossRef]
  13. Wu, J.; Liu, R.; Xue, W.; Wang, B.; Jin, X.; Du, J. Analyses of quenching process during turn-off of plasma electrolytic carburizing on carbon steel. Appl. Surf. Sc. 2014, 316, 102–107. [Google Scholar] [CrossRef]
  14. Rakhadilov, B.; Skakov, M.; Batyrbekov, E.; Erlan, M.; Scheffler, M. Surface modification of high-speed steel by plasma nitriding. Appl. Mech. Mater. 2015, 709, 403–409. [Google Scholar] [CrossRef]
  15. Skakov, M.; Rakhadilov, B.; Batyrbekov, E. The formation of modified layers at high-speed steels after electrolytic-plasma nitriding. Appl. Mech. Mater. 2014, 682, 104–108. [Google Scholar] [CrossRef]
  16. Skakov, M.; Batyrbekov, E.; Rakhadilov, B.M. Scheffler, Structural-phase Transformations in R6M5 Steel While Electrolytic-Plasma Processing. Adv. Mater. Res. 2014, 904, 217–221. [Google Scholar]
  17. Jiang, Y.F.; Bao, Y.F.; Yang, K. Effect of C/N concentration fluctuation on formation of plasma electrolytic carbonitriding coating on Q235. J. Iron Steel Res. Int. 2012, 19, 39–45. [Google Scholar] [CrossRef]
  18. Shen, D.J.; Wang, Y.L.; Nash, P.; Xing, G.Z. A novel method of surface modification for steel by plasma electrolysis carbonitriding. Mater. Sc. Eng. A 2007, 458, 240–243. [Google Scholar] [CrossRef]
  19. Rastkar, A.R.; Shokri, B. Surface modification and wear test of carbon steel by plasma electrolytic nitrocarburizing. Surf. Interface Anal. 2012, 44, 342–351. [Google Scholar] [CrossRef]
  20. Taheri, P.; Dehghanian, C.; Aliofkhazraei, M.; Rouhaghdam, A.S. Nanocrystalline Structure Produced by Complex Surface Treatments: Plasma Electrolytic Nitrocarburizing, Boronitriding, Borocarburizing, and Borocarbonitriding. Plasma Process. Polym. 2007, 4, S721–S727. [Google Scholar] [CrossRef]
  21. Pohrelyuk, I.M.; Tkachuk, O.V.; Proskurnyak, R.V.; Kuznetsov, O.V.; Gnilitskyi, Y.M. Morphology and Corrosion Properties of Hydroxyapatite Coating on VT6 Titanium Alloy. Mater. Sci. 2023, 58, 781–787. [Google Scholar] [CrossRef]
  22. Kusmanov, S.A.; Tambovskiy, I.V.; Silkin, S.A.; Kusmanova, I.A.; Belkin, P.N. Anode plasma electrolytic borocarburising of alpha + beta-titanium alloy. Surf. Interfaces 2020, 21, 100717. [Google Scholar] [CrossRef]
  23. Bayatanova, L.; Rakhadilov, B.; Kurbanbekov, S.; Skakov, D.; Popova, N. Fine structure of low-carbon steel after electrolytic plasma treatment. Mater. Test. 2021, 63, 842–847. [Google Scholar] [CrossRef]
  24. Nie, C.; Zhu, T.; Xie, Y.; Ying, L.; Wang, G. Study on preparation and friction characteristics of steel 1045 modified layer based on plasma electrolytic carbonitriding. Mater. Today Commun. 2022, 33, 104518. [Google Scholar] [CrossRef]
  25. Kang, Q.-F.; Yang, W.-M.; Wei, K.-X.; Wang, D.-D.; Liu, X.-L.; Hu, J. Development of a Novel Plasma Aluminum-nitriding Methodology and Its Effect on the Microstructure and Properties for 42CrMo Steel. Surf. Technol. 2023, 52, 394–400. [Google Scholar] [CrossRef]
  26. Yang, Q.; Fan, X.; Huang, J. Microstructure and properties of plasma electrolytic nitrocarburizing coating on 40Cr steel. Jinshu Rechuli/Heat Treat. Met. 2012, 37, 77–80. [Google Scholar]
  27. Zhurerova, L.G.; Rakhadilov, B.K.; Popova, N.A.; Kylyshkanov, M.K.; Buranich, V.V.; Pogrebnjak, A.D. Effect of the PEN/C surface layer modification on the microstructure, mechanical and tribological properties of the 30CrMnSiA mild-carbon steel. J. Mater. Res. Technol. 2020, 9, 291–300. [Google Scholar] [CrossRef]
  28. Yaghmazadeh, M.; Dehghanian, C. Surface Hardening of AISI H13 Steel Using Pulsed Plasma Electrolytic Carburizing (PPEC). Plasma Process. Polym. 2009, 6, S168–S172. [Google Scholar] [CrossRef]
  29. Alnakhaei, G.A.; Dehghanian, C.; Alavi, S.H. Evaluation of morphological and tribological properties of nanocrystalline nitrocarburised coating produced on AISI H13 carbon steel by pulsed plasma electrolytic saturation (PPES) technique. Trib. Mater. Surf. Interfaces 2011, 5, 82–87. [Google Scholar] [CrossRef]
  30. Hua, X.-Z.; Zhou, L.; Cui, X.; Zou, A.-H.; Xu, W.-B.; Zhou, X.-L. The Effect of Ammonia Water on the Microstructure and Performance of Plasma Electrolytic Saturation Nitriding Layer of 38CrMoAl Steel. Phys. Proc. 2013, 50, 304–314. [Google Scholar] [CrossRef]
  31. Fan, X.; Huang, J.; Yang, Q.; Gan, J. Plasma electrolytic carbonitriding of 20CrMnTi steel. Adv. Mater. Res. 2011, 154–155, 1393–1396. [Google Scholar] [CrossRef]
  32. Skakov, M.; Zhurerova, L.; Scheffler, M. Influence of regimes electrolytic plasma processing on phase structure and hardening of steel 30CrMnSi. Adv. Mater. Res. 2013, 601, 79–83. [Google Scholar] [CrossRef]
  33. Kusmanov, S.A.; Tambovskiy, I.V.; Korableva, S.S.; Dyakov, I.G.; Burov, S.V.; Belkin, P.N. Enhancement of Wear and Corrosion Resistance in Medium Carbon Steel by Plasma Electrolytic Nitriding and Polishing. J. Mater. Eng. Perform. 2019, 28, 5425–5432. [Google Scholar] [CrossRef]
  34. Shelekhov, E.V.; Sviridova, T.A. Programs for X-ray analysis of polycrystals. Metal Sci. Heat. Treat. 2000, 42, 309–313. [Google Scholar] [CrossRef]
  35. Grazulis, S.; Chateigner, D.; Downs, R.T.; Yokochi, A.T.; Le Bail, A. Crystallography open database—An open-access collection of crystal structures. J. Appl. Cryst. 2009, 42, 726–729. [Google Scholar] [CrossRef] [PubMed]
  36. Mukhacheva, T.L.; Belkin, P.N.; Dyakov, I.G.; Kusmanov, S.A. Wear mechanism of medium carbon steel after its plasma electrolytic nitrocarburising. Wear 2020, 462–463, 203516. [Google Scholar] [CrossRef]
  37. Demkin, N.B.; Izmailov, V.V. Surface topography and properties frictional contacts. Trib. Int. 1991, 24, 21–24. [Google Scholar] [CrossRef]
  38. Mukhacheva, T.; Kusmanov, S.; Suminov, I.; Podrabinnik, P.; Khmyrov, R.; Grigoriev, S. Increasing Wear Resistance of Low-Carbon Steel by Anodic Plasma Electrolytic Sulfiding. Metals 2022, 12, 1641. [Google Scholar] [CrossRef]
  39. Matlin, M.M.; Kazankina, E.M.; Kazankin, V.A. Calculation of the actual contact area between a single microasperity and the smooth surface of a part when the hardnesses of their materials are similar. J. Frict. Wear 2011, 32, 140. [Google Scholar] [CrossRef]
  40. ISO 14638:2015; Geometrical Product Specifications (GPS). National Standard of the Russian Federation: Moscow, Russia, 2015.
  41. Tambovskiy, I.; Mukhacheva, T.; Gorokhov, I.; Suminov, I.; Silkin, S.; Dyakov, I.; Kusmanov, S.; Grigoriev, S. Features of Cathodic Plasma Electrolytic Nitrocarburizing of Low-Carbon Steel in an Aqueous Electrolyte of Ammonium Nitrate and Glycerin. Metals 2022, 12, 1773. [Google Scholar] [CrossRef]
  42. Kragelsky, I.V.; Dobychin, M.N.; Kombalov, V.S. Friction and Wear Calculation Methods; Pergamon Press: Oxford, UK, 1982; p. 62. Available online: https://books.google.ru/books?id=QLcgBQAAQBAJ&hl=ru (accessed on 15 September 2025).
  43. Suslov, A.G.; Shalygin, M.G. Simulating pumping equipment unit wear based on elastic and plastic deformations of surface nanoirnesses in a stated friction mode. AIP Conf. Proc. 2021, 2340, 070003. [Google Scholar] [CrossRef]
  44. Suslov, A.G.; Bogomolov, D.Y.; Shalygin, M.G. Fatigue wear of friction surfaces at the sub-roughness level. Frict. Lubr. Mach. Mech. 2015, 4, 7–10. [Google Scholar]
  45. Shalygin, M.G. Surface Parameters with Different Treatment Technologies and Their Effect on Wear. J. Frict. Wear 2019, 40, 213–217. [Google Scholar] [CrossRef]
  46. Suslov, A.G.; Gorlenko, O.A. Experimental Statistical Method in Assurance of Surface Quality in Machine Parts: Monograph. M.: Mashinostroenie-1; 2003; 303p. (In Russian) [Google Scholar]
  47. Suslov, A.G.; Shalygin, M.G. Correlation between subroughness and surface phase composition. AIP Conf. Proc. 2018, 2053, 030072. [Google Scholar] [CrossRef]
  48. Borisov, A.; Mukhacheva, T.; Kusmanov, S.; Suminov, I.; Podrabinnik, P.; Meleshkin, Y.; Grigoriev, S. The Effect of Plasma–Electrolytic Nitrocarburizing of a Medium Carbon Steel Surface on Friction and Wear in Pair with Tin–Lead Bronze. Metals 2023, 13, 1731. [Google Scholar] [CrossRef]
  49. Gerasimov, S.A.; Jicharev, A.V.; Berezina, E.V.; Zubarev, G.L. New ideas on the mechanism of structure formation on nitride steels. Met. Sci. Heat Treat. 2004, 46, 13–17. [Google Scholar] [CrossRef]
Figure 1. Schemes of working (reaction) chambers of the setups for different types of processing: (a) plasma electrolytic nitriding (1—circulation of tap water through the heat exchanger; 2—electrolyzer; 3—workpiece anode; 4—current source; 5—pump; 6—electrolyte; 7—heat exchanger); (b) vacuum nitriding (1—gas inlet; 2—top cover; 3—water drain; 4—current lead-in; 5—thermal insulation; 6— location of samples; 7—viewing window; 8—water supply; 9—bottom cover; 10—thermocouple inlet; 11—pumping branch pipe; 12—table; 13—heat shield; 14—heater).
Jmmp 09 00380 g001
Figure 2. General view of the friction setup (a) and friction unit (b): 1—cylindrical sample; 2—drive shaft; 3—counter body; 4—driven shaft; 5—crank; 6—pneumatic cylinder; 7—guides; 8—infrared digital thermometer; 9—beam-type strain gauge.
Jmmp 09 00380 g002
Figure 3. Diffraction patterns of the surface layer of M2 steel (a) before and after (b) PEN and (c) PEN + T.
Jmmp 09 00380 g003
Figure 4. Diffraction patterns of the surface layer of M2 steel (a) before and after (b) VN, (c) VN + Q, and (d) VN + Q + T.
Jmmp 09 00380 g004
Figure 5. Percentage ratio of phase shares after VN + Q + T and PEN + T.
Jmmp 09 00380 g005
Figure 6. Nitrogen concentration distribution in the surface layer of M2 steel samples after various types of treatment.
Jmmp 09 00380 g006
Figure 7. SEM image of the cross-section of the surface layer of M2 steel after PEN: 1—martensite layer; 2—nitride-rich sublayer; 3—structure with carbides. On the left is the secondary electron image; on the right is the backscattered electron image.
Jmmp 09 00380 g007
Figure 8. SEM image of the cross-section of the surface layer of M2 steel after VN: 1—martensite layer; 2—nitride-rich sublayer; 3—structure with carbides. On the left is the secondary electron image; on the right is the backscattered electron image.
Jmmp 09 00380 g008
Figure 9. SEM image of the core of M2 nitrided steel samples. On the left is the secondary electron image; on the right is the backscattered electron image. The insert is an enlarged fragment of the eutectoid released along the grain boundaries.
Jmmp 09 00380 g009
Figure 10. SEM image of the core of M2 nitrided steel samples after tempering. On the left is the secondary electron image; on the right is the backscattered electron image.
Jmmp 09 00380 g010
Figure 11. Microhardness distribution in the surface layer of M2 steel samples after various types of treatment.
Jmmp 09 00380 g011
Figure 12. Dependence of the friction coefficient on the sliding speed of the M2 steel samples after (a) PEN, PEN + T and (b) VN, VN + Q, VN + Q + T.
Jmmp 09 00380 g012
Figure 13. Dependence of the sample mass loss on the sliding speed of the M2 steel samples after (a) PEN, PEN + T and (b) VN, VN + Q, VN + Q + T.
Jmmp 09 00380 g013
Figure 14. Dependence of the counter body mass loss on the sliding speed of the M2 steel samples after (a) PEN, PEN + T and (b) VN, VN + Q, VN + Q + T.
Jmmp 09 00380 g014
Figure 15. Dependence of the friction coefficient on the sliding distance for the M2 steel samples after various types of treatment: (a) untreated; (b) PEN; (c) PEN + T; (d) VN; (e) VN + Q; (f) VN + Q + T.
Jmmp 09 00380 g015
Figure 16. SEM image and EDX map (oxygen) of friction tracks on the VN + Q samples after different sliding speeds: (a) 0.46 m/s; (b) 1.44 m/s; (c) 2.31 m/s; (d) 3.25 m/s.
Jmmp 09 00380 g016aJmmp 09 00380 g016b
Table 1. Composition of M2 steel samples.
ElementCWMoCrVSiMnNiCoSPFe
wt.%0.82–0.905.5–6.54.8–5.33.8–4.41.7–2.1≤0.5≤0.5≤0.4≤0.5≤0.025≤0.03balance
Table 2. Calculation results of surface microgeometry parameters for determining contact deformations during friction according to Equations (5)–(7) (relative error no more than 2.5%).
Sliding
Speed (m/s)
Surface Roughness Characteristics Plasticity Criterion Kp Radius of Curvature r (μm) Absolute Penetration of Surfaces h (μm) h/r
Ra (μm) Rmax (μm) Rp (μm) tm
(%)
Sm (μm)
Untreated
0.460.2060.7400.540731924131.10.082
1.440.0500.8190.300504932211.90.088
2.310.3741.9001.179562328272.50.091
3.250.3932.5001.279314637181.60.087
PEN
0.460.2151.2200.60041365352.30.064
1.440.2301.2200.50046318644.20.066
2.310.1470.6600.30051214583.20.055
3.250.4422.0991.22054646563.10.056
PEN + T
0.460.8833.3591.86071449372.10.055
1.440.4012.4200.68042267704.10.058
2.310.4252.7001.159566412613.70.061
3.250.4601.2200.95994388542.90.054
VN
0.460.1621.0800.540723014171.00.057
1.440.1250.7200.379193310130.80.062
2.310.2891.2000.779882513140.80.054
3.250.2561.6400.980674615161.10.063
VN + Q
0.460.3491.8800.72051257322.00.061
1.440.2931.5000.88064288120.80.064
2.310.3790.9000.720972512412.90.070
3.250.7402.5791.919946110382.30.059
VN + Q + T
0.460.3252.2291.559527613161.20.071
1.440.3431.4601.1599128970.60.078
2.310.1771.3400.57956256120.80.069
3.250.1811.0390.44051208`211.60.075
Disclaimer/Publisher’s Note: The statements, opinions and data contained in all publications are solely those of the individual author(s) and contributor(s) and not of MDPI and/or the editor(s). MDPI and/or the editor(s) disclaim responsibility for any injury to people or property resulting from any ideas, methods, instructions or products referred to in the content.