Article

Determination of Annealing Temperature of Thin-Walled Samples from Al-Mn-Mg-Ti-Zr Alloys for Mechanical Properties Restoration of Defective Parts After SLM

by
Nikita Nikitin
1,2,*,
Roman Khmyrov
1,
Pavel A. Podrabinnik
1,
Nestor Washington Solis Pinargote
3,4,*,
Anton Smirnov
3,4,
Idarmachev Idarmach
1,
Tatiana V. Tarasova
1 and
Sergey N. Grigoriev
3
1
Laboratory of Innovative Additive Technologies, Moscow State University of Technology “STANKIN”, Vadkovsky per. 1, Moscow 127055, Russia
2
College of New Materials and Nanotechnologies, National University of Science & Technology (MISIS), Leninskii prosp 4, Moscow 119049, Russia
3
Spark Plasma Sintering Research Laboratory, Moscow State University of Technology “STANKIN”, Vadkovsky per. 1, Moscow 127055, Russia
4
Laboratory of 3D Structural and Functional Engineering, Moscow State University of Technology “STANKIN”, Vadkovsky per. 1, Moscow 127055, Russia
*
Authors to whom correspondence should be addressed.
J. Manuf. Mater. Process. 2025, 9(11), 371; https://doi.org/10.3390/jmmp9110371
Submission received: 18 September 2025 / Revised: 4 November 2025 / Accepted: 6 November 2025 / Published: 12 November 2025

Abstract

The aim of this work is to investigate the effect of annealing (at temperatures ranging from 260 °C to 530 °C) of thin-walled Al-Mn-Mg-Ti-Zr samples manufactured by selective laser melting (SLM) on their tensile mechanical properties, hardness, and surface roughness. The results of this study may contribute to the development of post-processing modes for thin-walled products made of corrosion-resistant aluminum alloys with increased strength, manufactured using SLM technology. Hierarchical clustering methods allowed us to identify three groups of thin-walled samples with different strain-hardening mechanisms depending on the annealing temperature. The greatest hardening is achieved in the first group of samples annealed at 530 °C. Metallographic analysis showed that at this heat treatment temperature, there are practically no micropores (macrodefects) and microcracks. X-ray phase analysis showed the precipitation of Ti and Zr, as well as the formation of an intermetallic phase with a composition of Mg8Al16. At lower heat treatment temperatures, from 260 °C to 500 °C, the observed hardening is statistically significantly lower than at 530 °C. This phenomenon, combined with the formation of intermetallic phases and the precipitation of titanium/zirconium, contributes to the hardening of thin-walled Al-Mn-Mg-Ti-Zr alloy samples manufactured by SLM. The main results of this study show that the optimal strain hardening of thin-walled Al-Mn-Mg-Ti-Zr alloy samples manufactured by SLM is achieved by heat treatment at 530 °C for 1 h. The strengthening mechanism has two characteristics: (1) dispersion strengthening due to the formation of precipitates and (2) reduction in macrodefects at high temperatures.

1. Introduction

Additive manufacturing (AM) technologies have gained widespread adoption across multiple industries, enabling the production of high-quality components while significantly reducing both production costs and time-to-market from initial concept to final product. Among metal AM processes, selective laser melting (SLM) has emerged as the predominant technique [1,2,3,4,5,6,7,8]. SLM fabrication typically employs powdered metals and alloys of varying compositions, with aluminum-based systems—particularly aluminum–manganese–magnesium (Al-Mn-Mg) alloys containing transition metal additions—being extensively utilized for manufacturing complex-shaped components.
The primary advantages of Al-Mn-Mg alloys include their favorable strength-to-weight ratio, versatile combination of physicomechanical properties, and cost-effective production [9,10]. The greatest advantage of Al-Mn-Mg alloys is their high corrosion resistance and ductility compared to classic AlSi10Mg alloys [10]. Accordingly, the combination of SLM technology with Al-Mn-Mg alloys allows us to produce corrosion-resistant and ductile parts with minimal time required to complete the cycle from concept to final product. However, these alloys exhibit poor crack resistance when processed via SLM, manifesting as extensive microcrack networks in fabricated components. To address this limitation, researchers employ dispersion strengthening through heat treatment-induced Al3M intermetallic phases (where M represents transition metals). While effective, these strengthening phases demonstrate limited thermal stability [11], presenting challenges for high-temperature applications.
To enhance the thermal stability of intermetallic phases within the 250–350 °C range, researchers have proposed alloying with scandium (Sc), zirconium (Zr), and erbium (Er). However, the prohibitively high cost of these rare-earth elements limits their practical industrial application [12,13,14,15]. Alternative studies have demonstrated that silicon additions promote a more homogeneous distribution of dispersed intermetallic precipitates at 300–425 °C. This effect is particularly evident in silumins (e.g., AlSi10Mg), where hardening occurs through (1) precipitation mechanisms and (2) uniform segregation of silicon at the boundaries of α-solid aluminum solution after annealing at approximately 270 °C [16,17,18,19,20]. Collectively, these dual hardening mechanisms significantly improve creep resistance—a critical performance parameter for high-temperature alloy applications [21,22,23]. In aluminum alloys, dislocation creep becomes significant at 250–350 °C [23,24,25], with four primary mechanisms known to enhance creep resistance [26]: mechanical inhibition of dislocation motion through precipitates and grain boundaries; anchoring of dislocations by solute atoms (Cottrell pinning); atomic-scale interactions that counteract dislocation glide; increased dislocation density promoting mutual entanglement.
All the mechanisms correlate fundamentally with cohesive energy enhancement and impurity atom relaxation phenomena [27,28]. Titanium demonstrates superior cohesive strengthening effects in aluminum compared to scandium, while zirconium effectively reduces dislocation mobility through relaxation energy minimization [29]. This effect is most pronounced in nickel alloys during the formation of the Ni3 (Al, Ti) intermetallic phases [30]. Consequently, these transition metals represent viable, cost-effective alternatives to Sc and Er for simultaneously enhancing both creep resistance and crack propagation resistance in Al-Mn-Mg alloy systems.
On the other hand, current mechanisms for strengthening aluminum alloys do not consider the formation of pores and their spatial distribution in manufactured parts by SLM. As shown in our previous work [31], the geometry of macrodefects can alter the strain hardening coefficients by up to 200%. Although the study was conducted on plastic, the above observation can be applied to metallic materials and alloys, since the research used a model of the effect that occurs on metallic samples.
The formation of macroporosity is a common and significant consequence of the SLM process, which is a serious problem leading to the production of defective parts [32,33]. The formation of pores in the SLM process is determined by many factors, including (1) laser processing parameters, (2) scanning strategies, and (3) powder characteristics (particle size distribution, morphology, purity) [34]. In this regard, some studies suggest that porosity reduction in parts can be achieved by selecting the optimal powder size and production methods [34,35]. However, the real industrial scale of SLM production often does not allow for strict control over the fraction and morphology of the starting powder. Thus, a more promising and technologically advanced approach than preliminary powder fractionation by size can be proposed and used to reduce the emerging macrodefects (in particular, macroporosity) in defective SLM parts: thermal post-processing.
In this work, the effect of the annealing in the temperature range of 260–530 °C on the mechanical properties and surface characteristics of SLM thin-walled Al-Mn-Mg-Ti-Zr alloy samples was investigated. The study focuses on the changes induced by thermal treatment on the tensile properties, including Young’s modulus, Secant modulus, yield strength, ultimate tensile strength, and their corresponding strain values, along with surface roughness parameters (Ra, Rz, Rmax) and Vickers microhardness. Statistical analysis was used to rigorously evaluate experimental data and establish relationships between processes and properties.
The aim of this work is to investigate the influence of heat treatment temperature on the mechanical properties and surface roughness of thin-walled samples obtained using SLM technology from a new Al-Mn-Mg-Ti-Zr alloy. The main methods used are hierarchical clustering and statistical data analysis methods.

2. Materials and Methods

2.1. Materials

The thin-walled specimens were fabricated using an Al-Mn-Mg-Ti-Zr alloy powder (JSC “Rusal”, Volgograd, Russia). The elemental analysis of the raw powder was obtained by energy-dispersive X-ray spectroscopy (EDS), and the result is shown in Table 1.
The morphology and the particle size distribution of the raw powder is given in Figure 1, in which it may appear that the particle size ranges from 1 μm to 106 μm.

2.2. Thin-Walled Samples Fabrication

Thin-walled samples were fabricated using an EOS M280 selective laser melting system (Munich, Germany) equipped with a 400 W maximum power laser. The manufacturing was performed under argon and a fixed layer thickness of 20 μm, while all other printing parameters were kept at the manufacturer’s default settings.
Table 2 shows the main parameters recommended by the equipment manufacturer to produce parts from aluminum alloys based on the AlSi10Mg system.
Figure 2 illustrates the sample geometry and its build platform orientation during fabrication.
It should be noted that the actual dimensions of the samples may differ by ±50 μm from the nominal dimensions shown in Figure 2 [36,37]. The geometry of the sample and its position during printing were selected based on previous studies [38]. In addition, the sample geometry was designed as a thin-walled structure to investigate the mechanical properties used in lightweight and complex components produced by SLM, such as heat exchangers and lattice structures. This approach, although deviating from standard tensile specimen geometries, is justified by the research objective and supported by standards such as DIN 50125 [39], which allows the use of non-standard geometries when justified by the product shape or application. All specimens were manufactured under identical conditions to ensure a uniform baseline for comparative study of the effects of heat treatment. After AM, the samples were sandblasted before annealing to ensure uniform surface conditions. The annealing temperature was chosen based on the recrystallization conditions, and it was estimated as ≈0.4–0.8 Tm, where T m is the melting temperature, which was assumed as 730 °C [40,41]. Thus, the temperatures used in this study for isothermal annealing ranged from 260 to 530 °C in 30 °C increments, with one-hour dwell time followed by furnace cooling in ambient air. The annealing experiments were repeated six times for each temperature used in this study, also including a control group. Thus, the experimental design is composed of 66 specimens.

2.3. Mechanical Properties, Microhardness, and Roughness Analysis

All samples, before and after the annealing, were subjected to the characterization (under an ambient temperature of 20 °C) of mechanical properties by means of tensile testing and Vickers microhardness measurements, as well as the roughness analysis.
Quasi-static tensile testing was conducted on an INSTRON 5989 universal testing machine (Instron, Norwood, MA, USA) with a constant crosshead speed of 2 mm/min. In this testing, six tensile properties (Young’s modulus, Secant modulus, yield strength, ultimate tensile strength, yield strain, and tensile strain) were analyzed.
Microhardness evaluation was carried out using a Vickers microhardness tester METOLAB 501 (Metolab, Moscow, Russia) equipped with a pyramidal diamond indenter. A load of 100 gf was applied for all measurements, and each sample was tested three times to ensure statistical reliability [42]. The measurement was carried out in accordance with ASTM standard e92-17 [43]. The resulting hardness values were recorded as three separate data series (HV_1, HV_2, HV_3) for subsequent analysis.Surface roughness characterization was performed using a HOMMEL-ETAMIC T8000 contact profilometer (Jenoptik, Jena, Germany) to quantify surface roughness parameters (Ra, Rz, and Rmax).

2.4. Test Methods

Samples were prepared for metallographic examination following standardized procedures. The parameters and abrasives used for sample preparation are in Table 3.
Microstructural characterization and elemental analysis were conducted using a Phenom ProX scanning electron microscope (Thermo Fisher Scientific Inc., Eindhoven, The Netherlands) equipped with an energy-dispersive spectroscopy (EDS) system. All SEM observations were performed at an accelerating voltage of 20 kV.
Phase composition was determined by X-ray diffraction (XRD) analysis using a PANalytical Empyrean diffractometer (Malvern Panalytical, Almelo, The Netherlands) with CoKα radiation. The acquired XRD patterns were analyzed using PANalytical HighScore Plus software (v. 3) [44] with reference to the ICCD PDF-2 and COD databases [45]. The shape and size of powder particles were controlled on a Occhio 500NANO grain-morphometry (Liège, Belgium).

2.5. Statistical Analysis Methods

Statistical analysis of experimental data represents a critical component of the research methodology. Figure S1 in the Supplementary Materials illustrates the comprehensive statistical analysis and modeling workflow employed in this study.
The proposed algorithm in Figure S1 can conventionally be divided into four sequential blocks: (1) the first block that comprises descriptive statistics of the dataset; (2) the second, which performs the estimation of the closest distribution law for the experimental data; (3) the third, in which the type of test (parametric or non-parametric) for the subsequent statistical analysis of the data is chosen based on an assessment of the data’s conformity to the normal (Gaussian) distribution; and (4) the fourth block includes the determination of data groups, the construction of regression models, and their validation and interpretation.
For the analysis in the first block, seven descriptive statistics proposed by Tukey (mean, standard deviation, median, maximum value, minimum value, first quartile (Q1) and third quartile (Q3)) served as base metrics, while Tukey’s graphs were used for graphical interpretation [46].
In the second block, for the estimation of the closest experimental data distribution, eight types of distribution laws were evaluated: Normal, Log-normal, Logistic, Gamma, Cauchy, Weibull, Exponential, and Gumbel. Furthermore, the coefficients related to each of the evaluated distribution laws were estimated via the maximum likelihood method [47]. Then, to determine the most appropriate distribution law among those evaluated, the Akaike [48,49] and Bayes [50,51] information criteria were applied.
The third block consists of selecting an appropriate statistical test to assess the data’s conformity to a normal distribution. Four widely used criteria are considered for this purpose: the Shapiro and Wilk [52], D’agostino and Pearson [53], Kolmogorov–Smirnov [54], and Anderson–Darling [55] tests. For data with a normal distribution, analysis of variance (ANOVA) followed by Tukey’s post hoc test [56] was used to identify statistically significant binary differences. For data with non-normal distribution, the Kruskal–Wallis test [57] combined with Dunn’s post hoc criterion [58] was applied, using the Bonferroni correction [59] to adjust for multiple comparisons.
The subsequent step in the second analysis block involves determining whether statistically significant differences exist within the dataset. The selection of appropriate statistical tests depends on the outcome of the normality assessment.
The identified number of statistically distinct data groups serves as input for hierarchical clustering [60]. Cluster quality is evaluated using correlation coefficients, with the specific estimator chosen based on the data’s distributional properties: Pearson correlation [61] is used for normally distributed data, and Spearman correlation [62] is applied otherwise. Finally, the correlation strength is interpreted according to Evans’ scale [63]. To determine the causes of the observed differences in the identified groups, metallographic and X-ray structural analyses of the samples were performed.

3. Results and Discussion

3.1. Experimental Results of the Samples

The structural and phase changes analysis was carried out based on the results of metallographic examination and XRD, respectively. Figure 3 shows a schematic representation of the printing direction of the samples and the viewing direction when examining the microstructure of samples obtained using selective laser melting technology from an Al-Mn-Mg-Ti-Zr alloy at an enlarged scale.
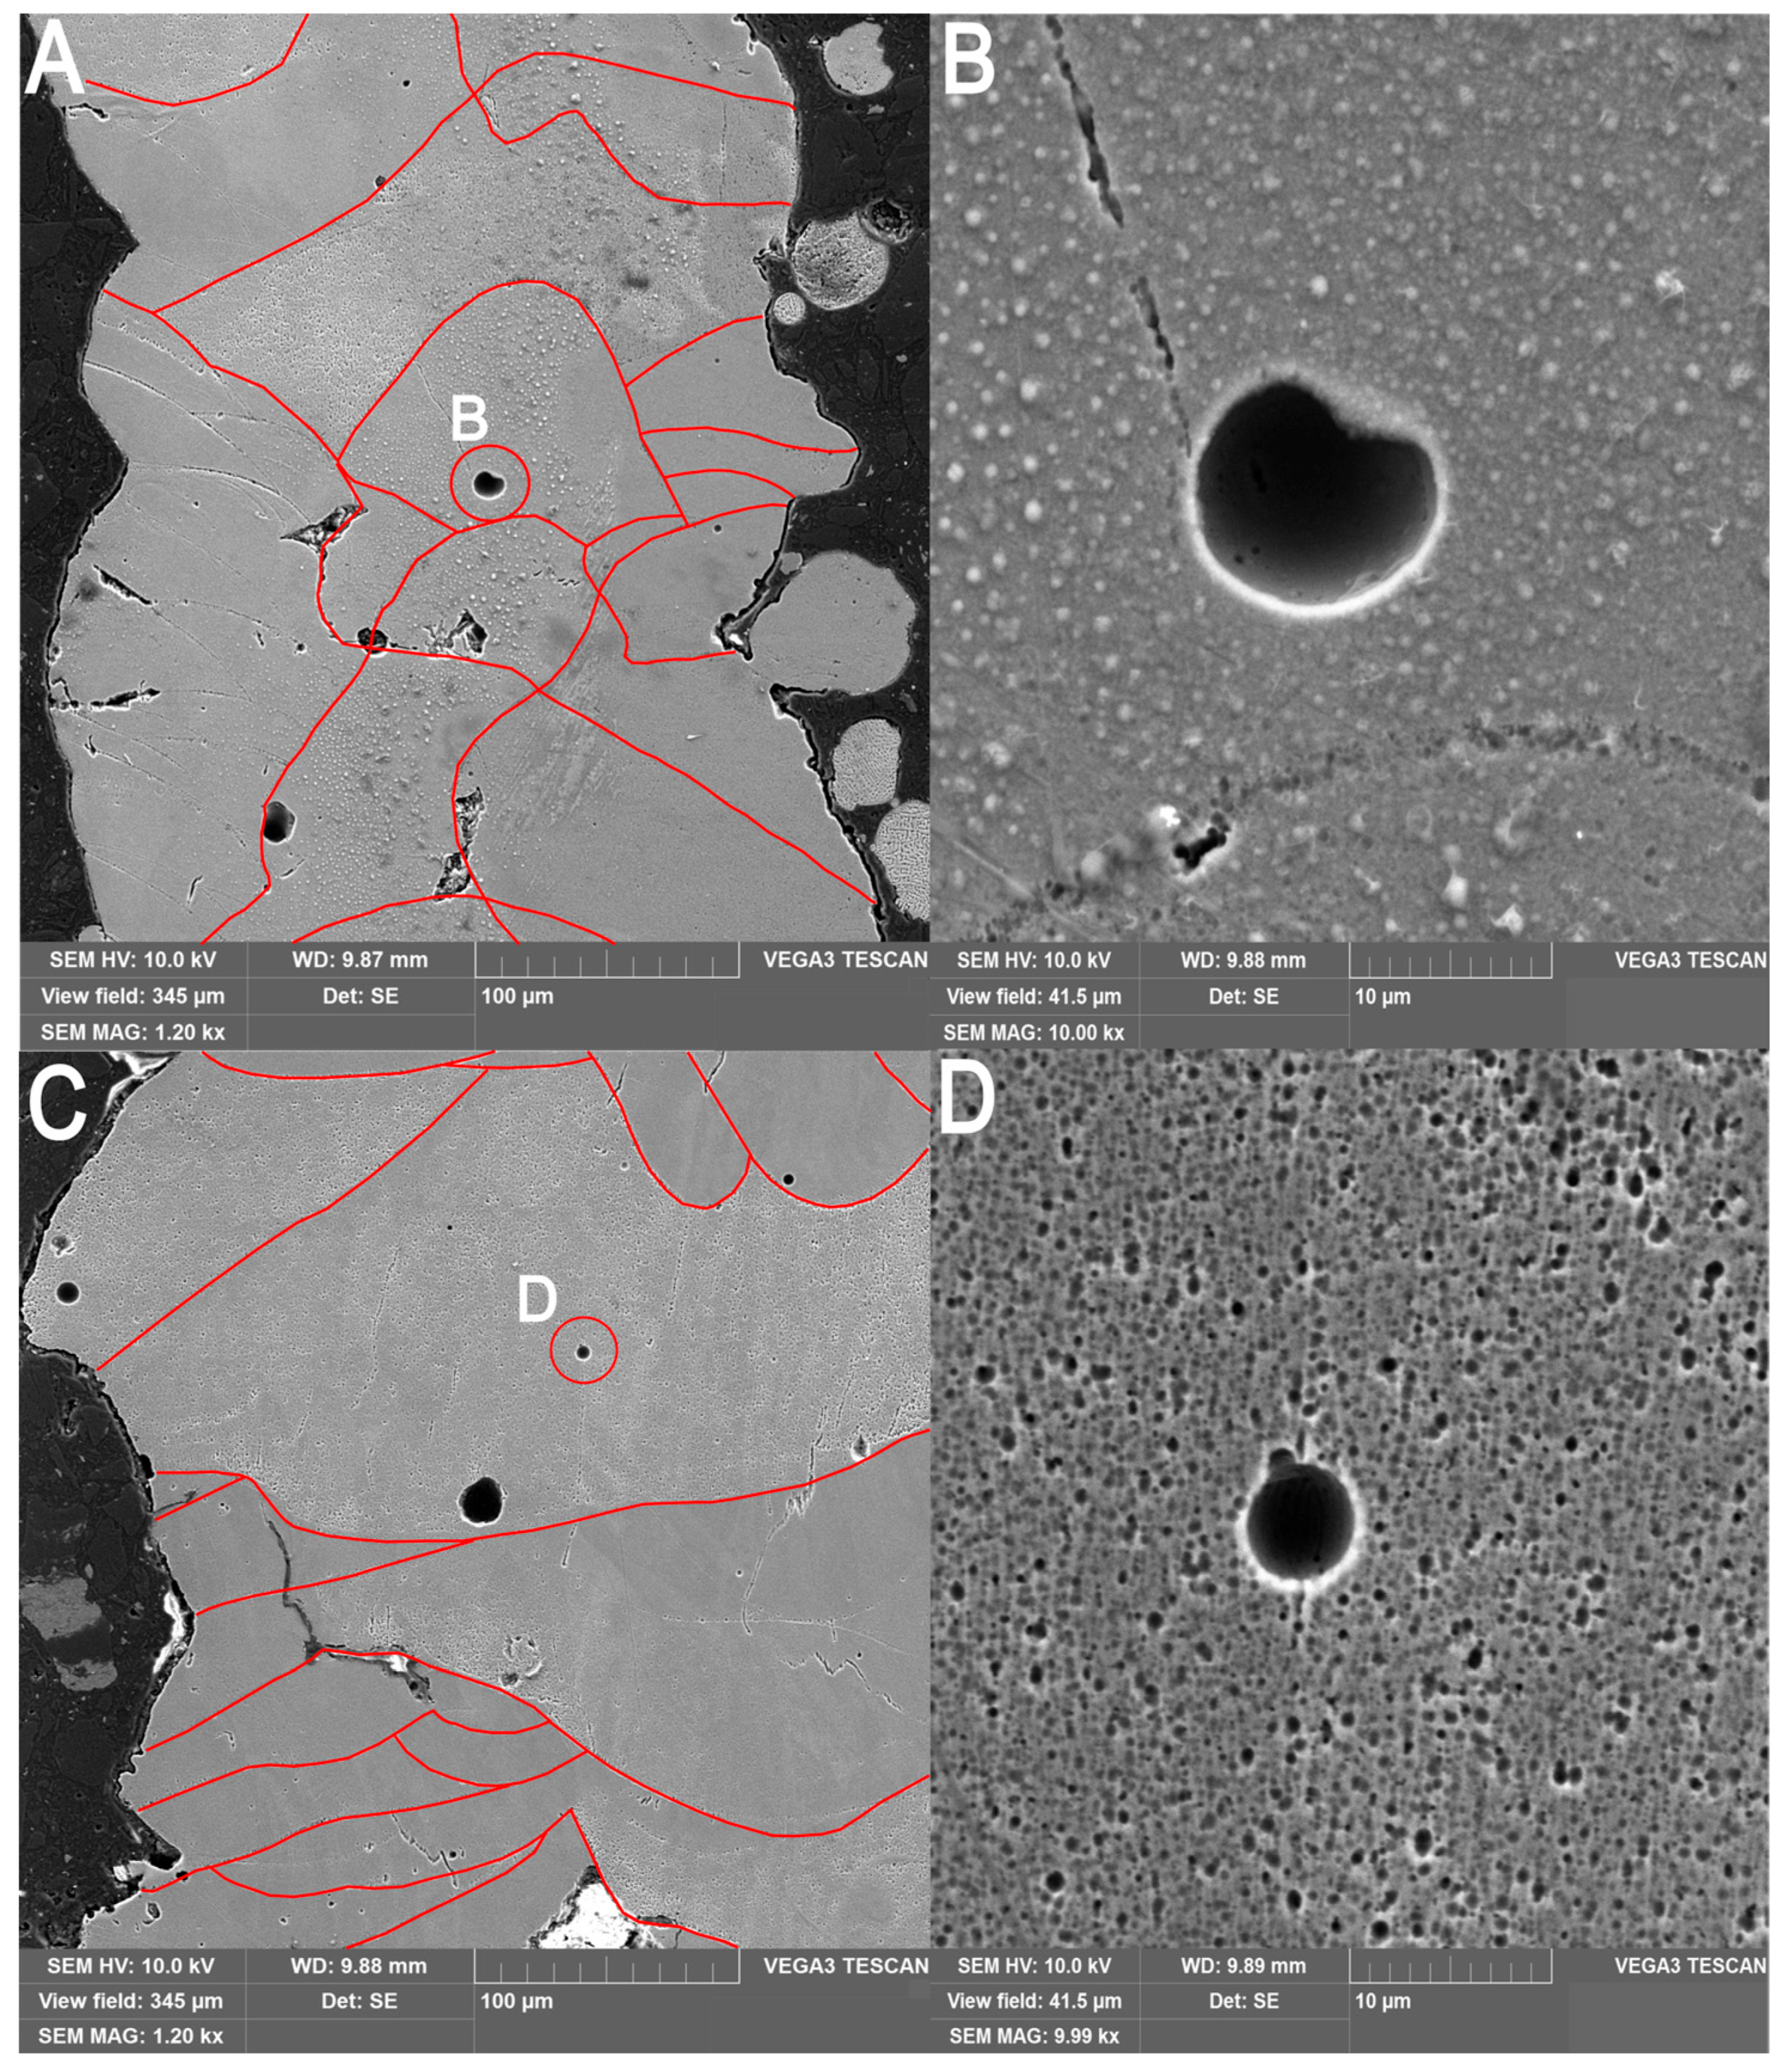
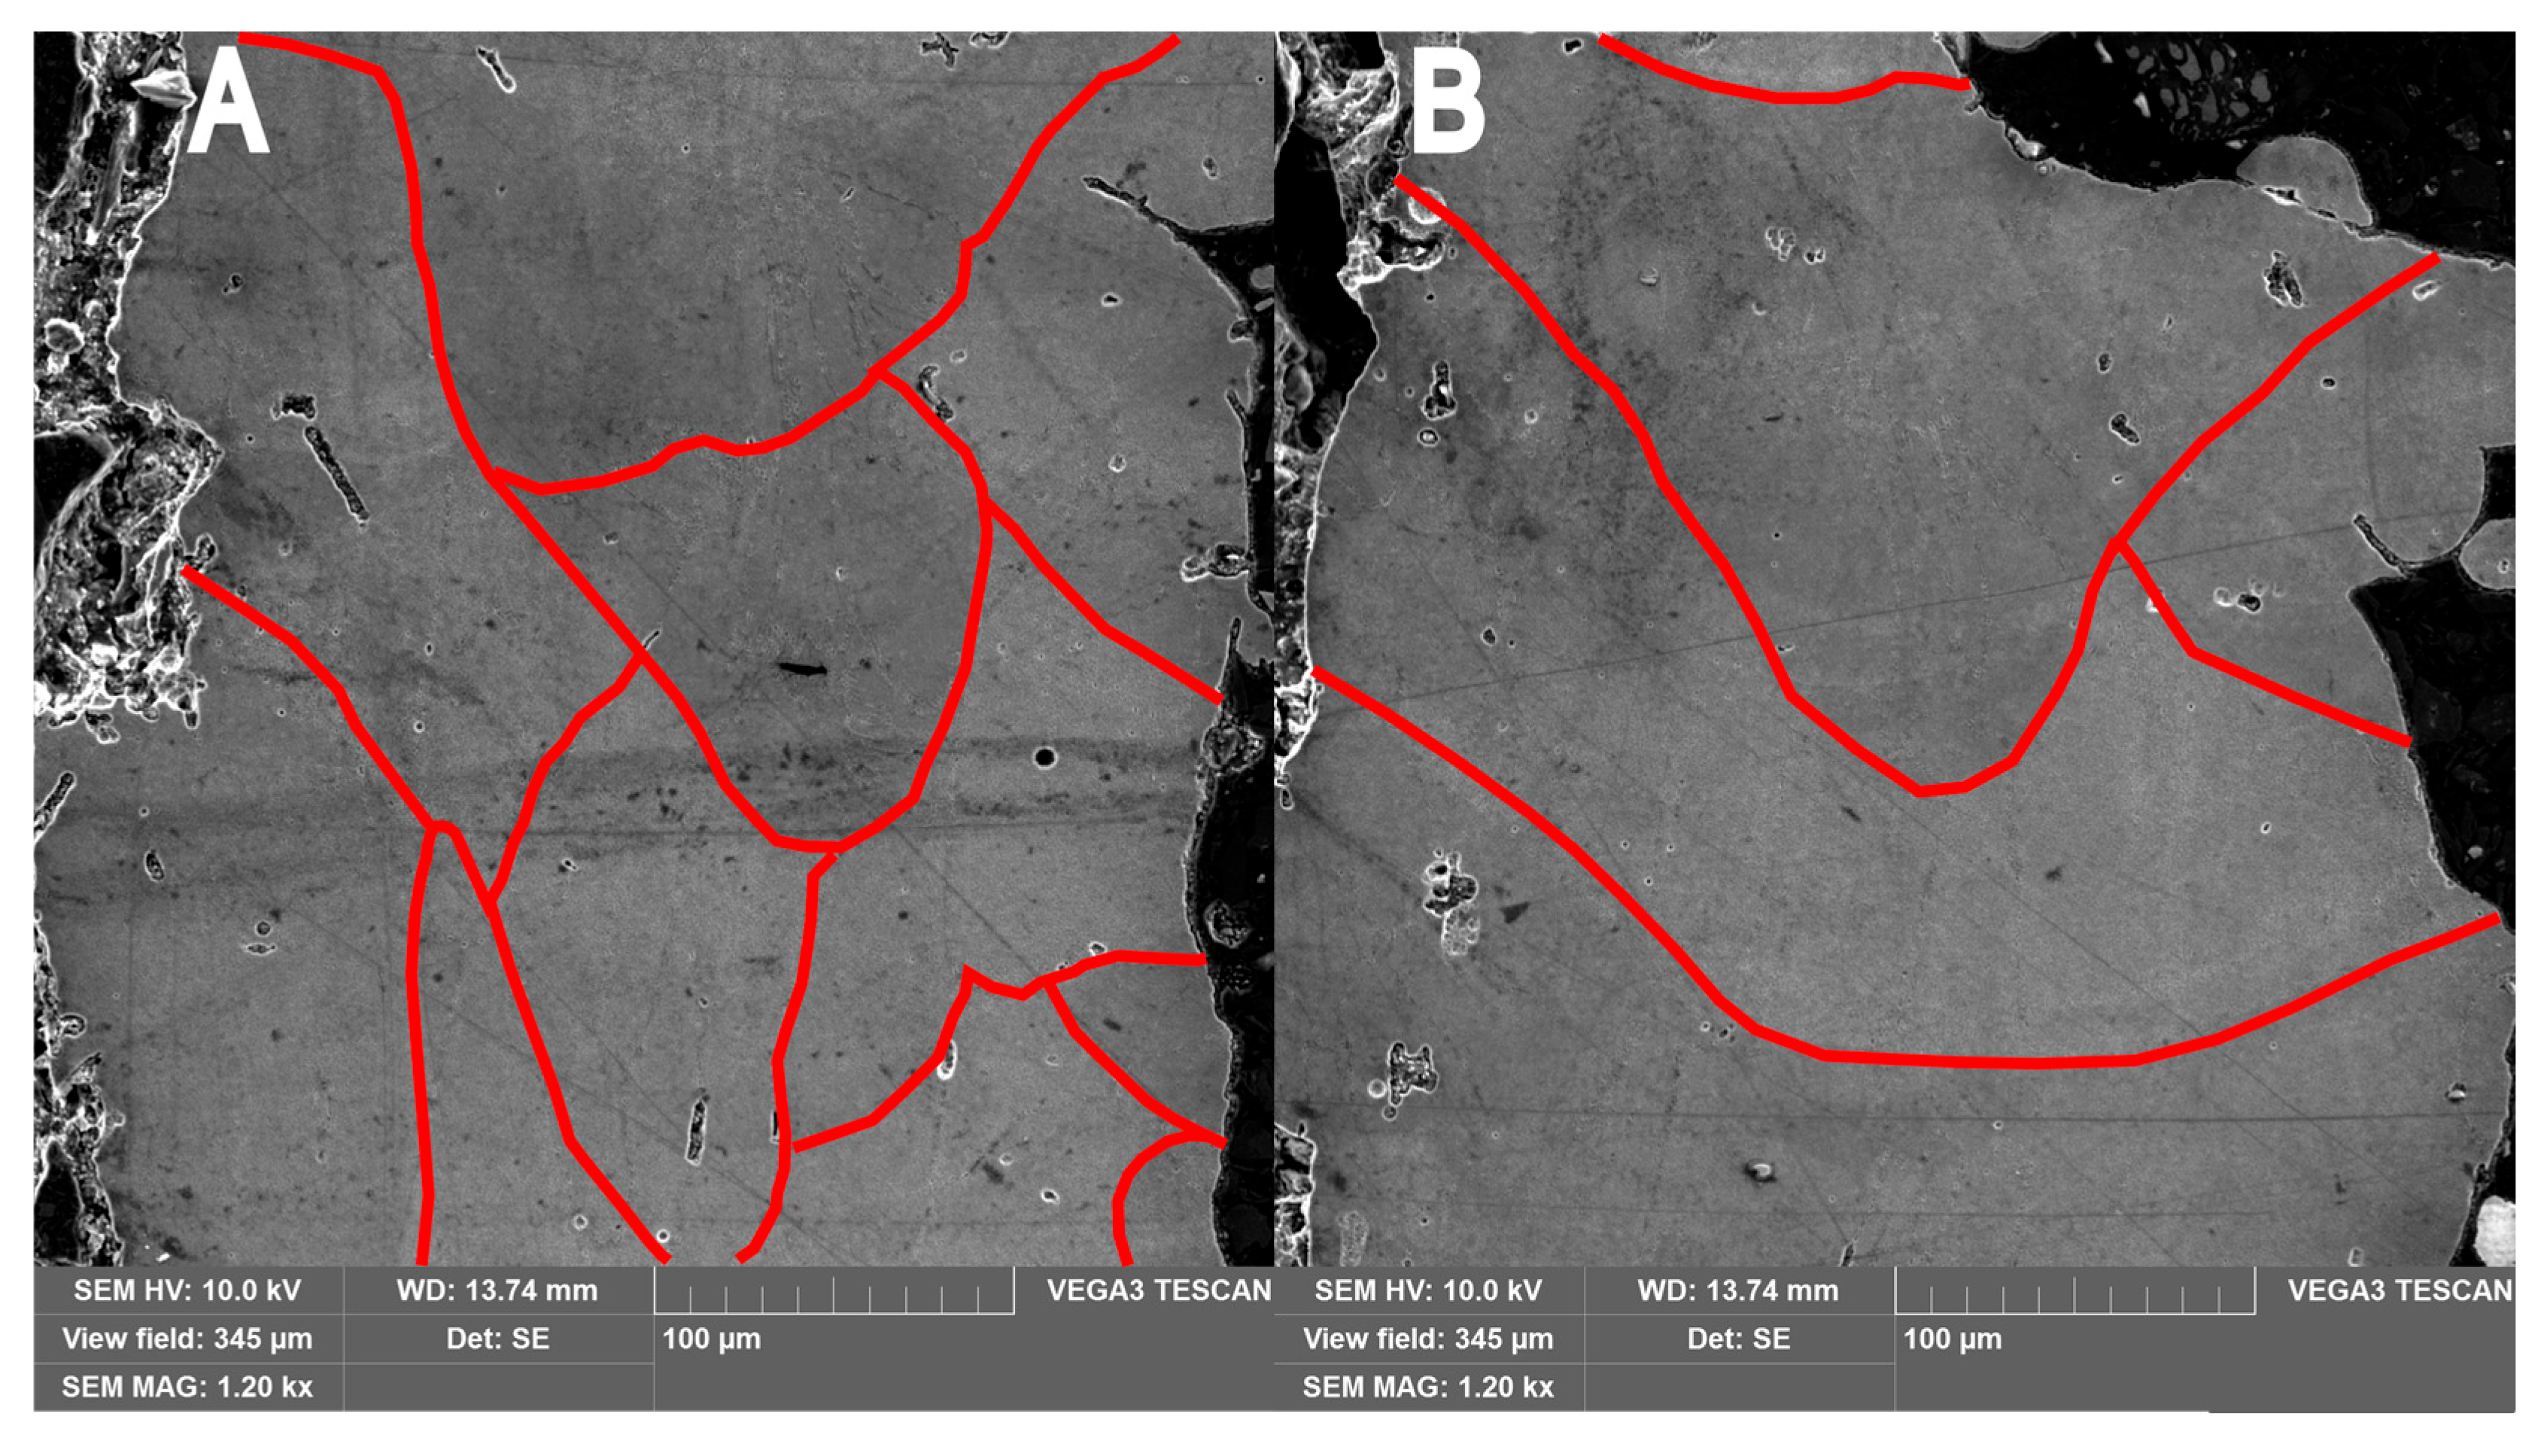
Figure 4 shows the SEM images (right column) of samples without annealing (Figure 4A,B) and after annealing at 290 °C (Figure 4C,D).
In Figure 4A,B, pores formed in the volume of thin-walled samples during SLM, as well as some microcracks and melt pool boundaries (red line), are clearly visible. On the other hand, Figure 4C,D show a substantial reduction in both macropores and microcracks in the sample volume after annealing at 290 °C.
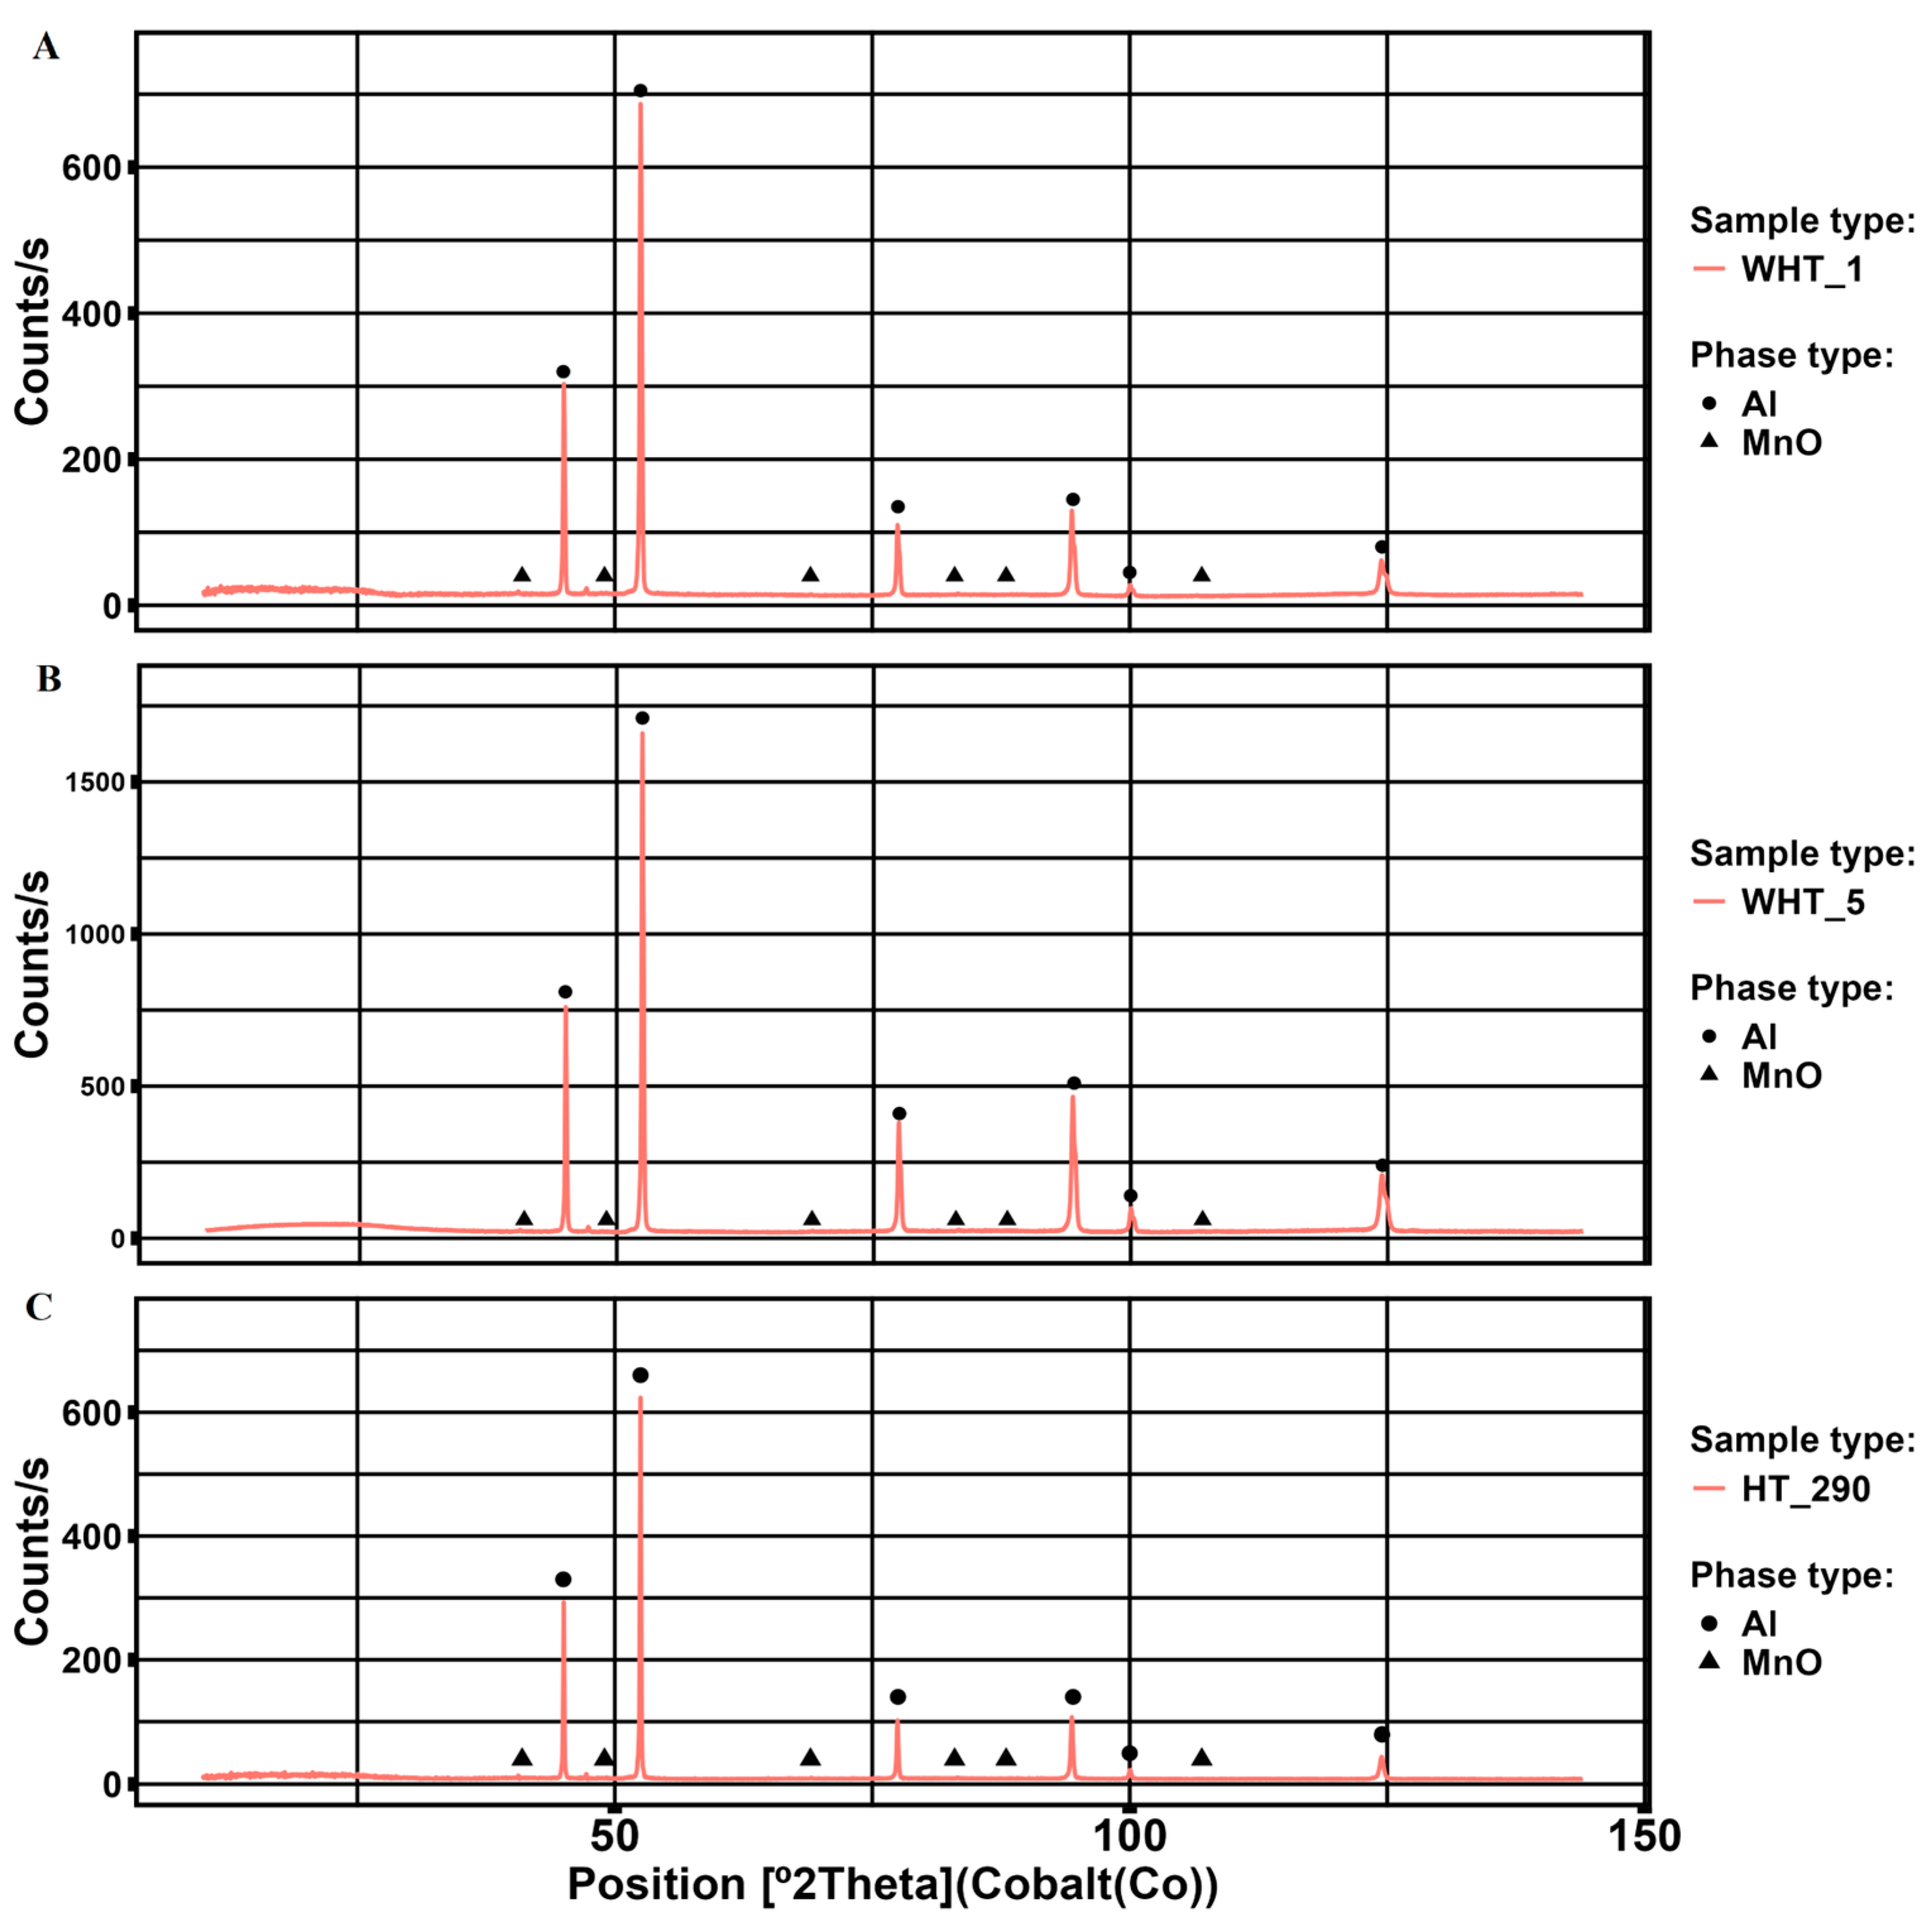
The XRD analysis of thin-walled samples before and after annealing at 290 °C indicates that no phase precipitation from the solid solution of aluminum occurs during annealing to 290 °C, except for manganese oxide, as in Figure 5.
Analysis of the XRD (Figure 5) shows that the structural and phase composition of samples without heat treatment and after annealing at 290 °C has not changed.
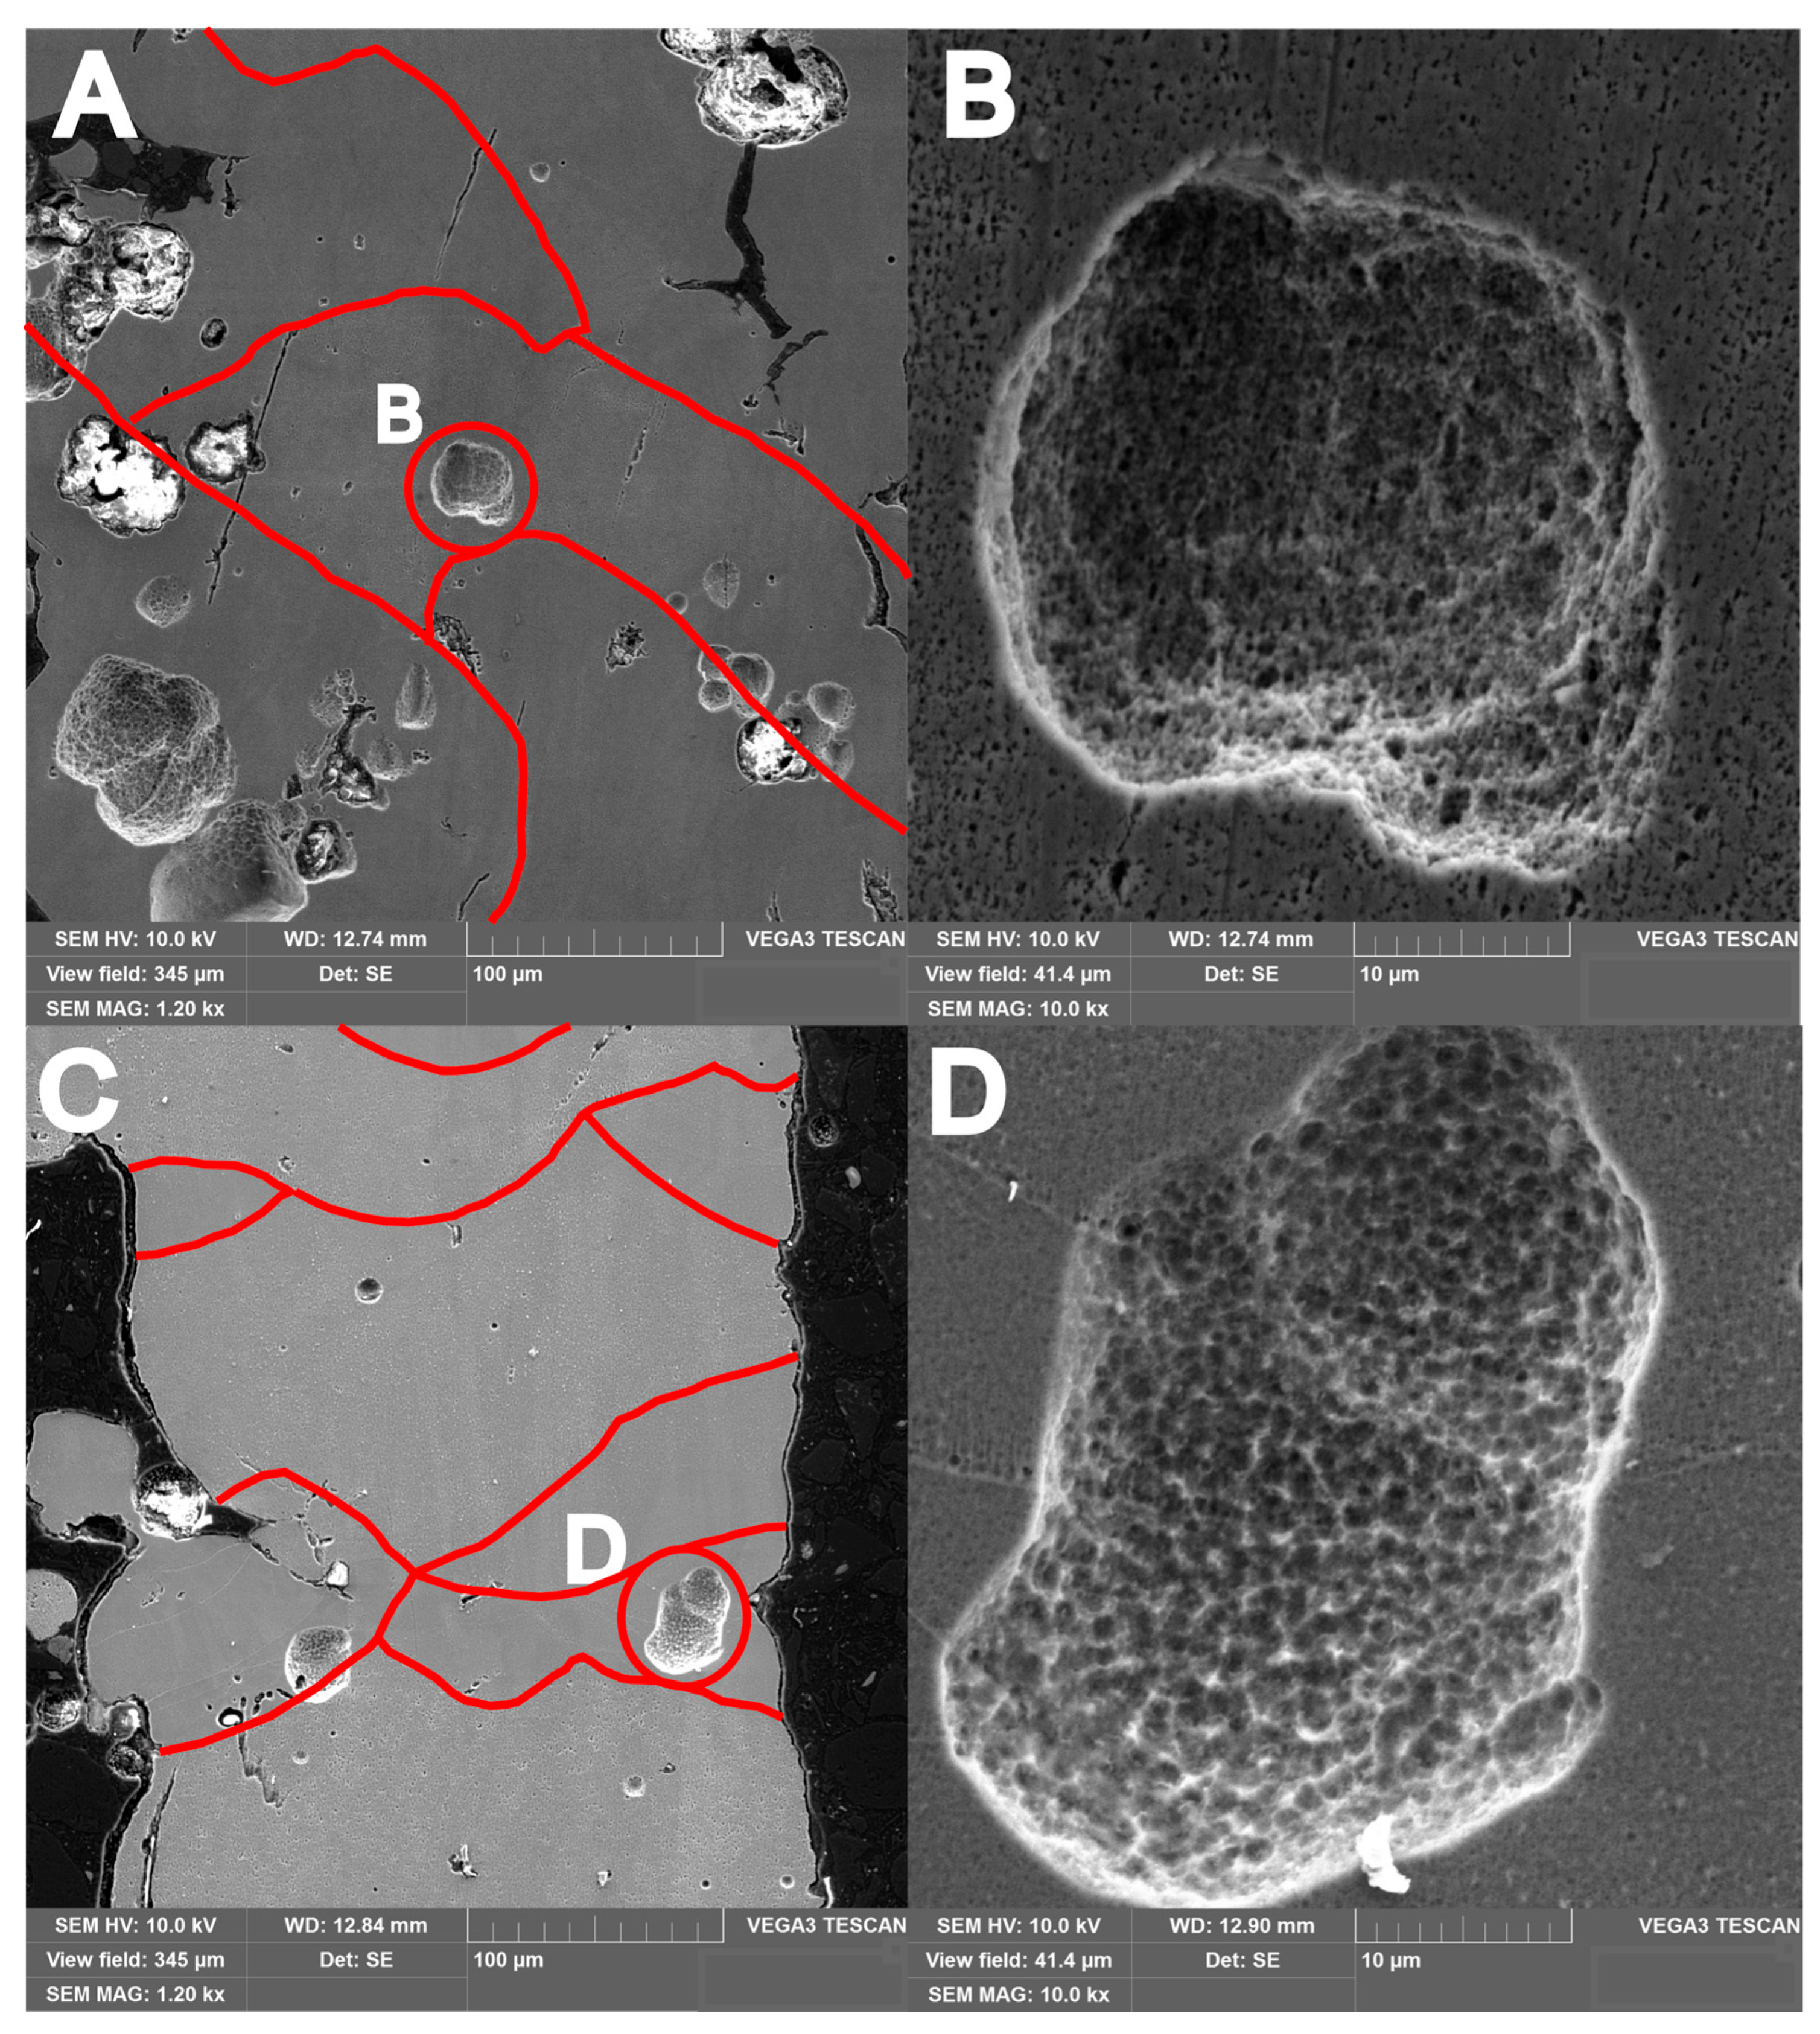
Figure 6 shows images of the microstructure of samples heat-treated at 410 °C and 470 °C.
The images in Figure 6 reveal that at elevated annealing temperatures (410 °C and 470 °C), two concurrent phenomena occur at the melt pool boundaries: (1) defect concentration and (2) formation of characteristic zones along the melt bath boundary (red line) (Figure 6A,C).
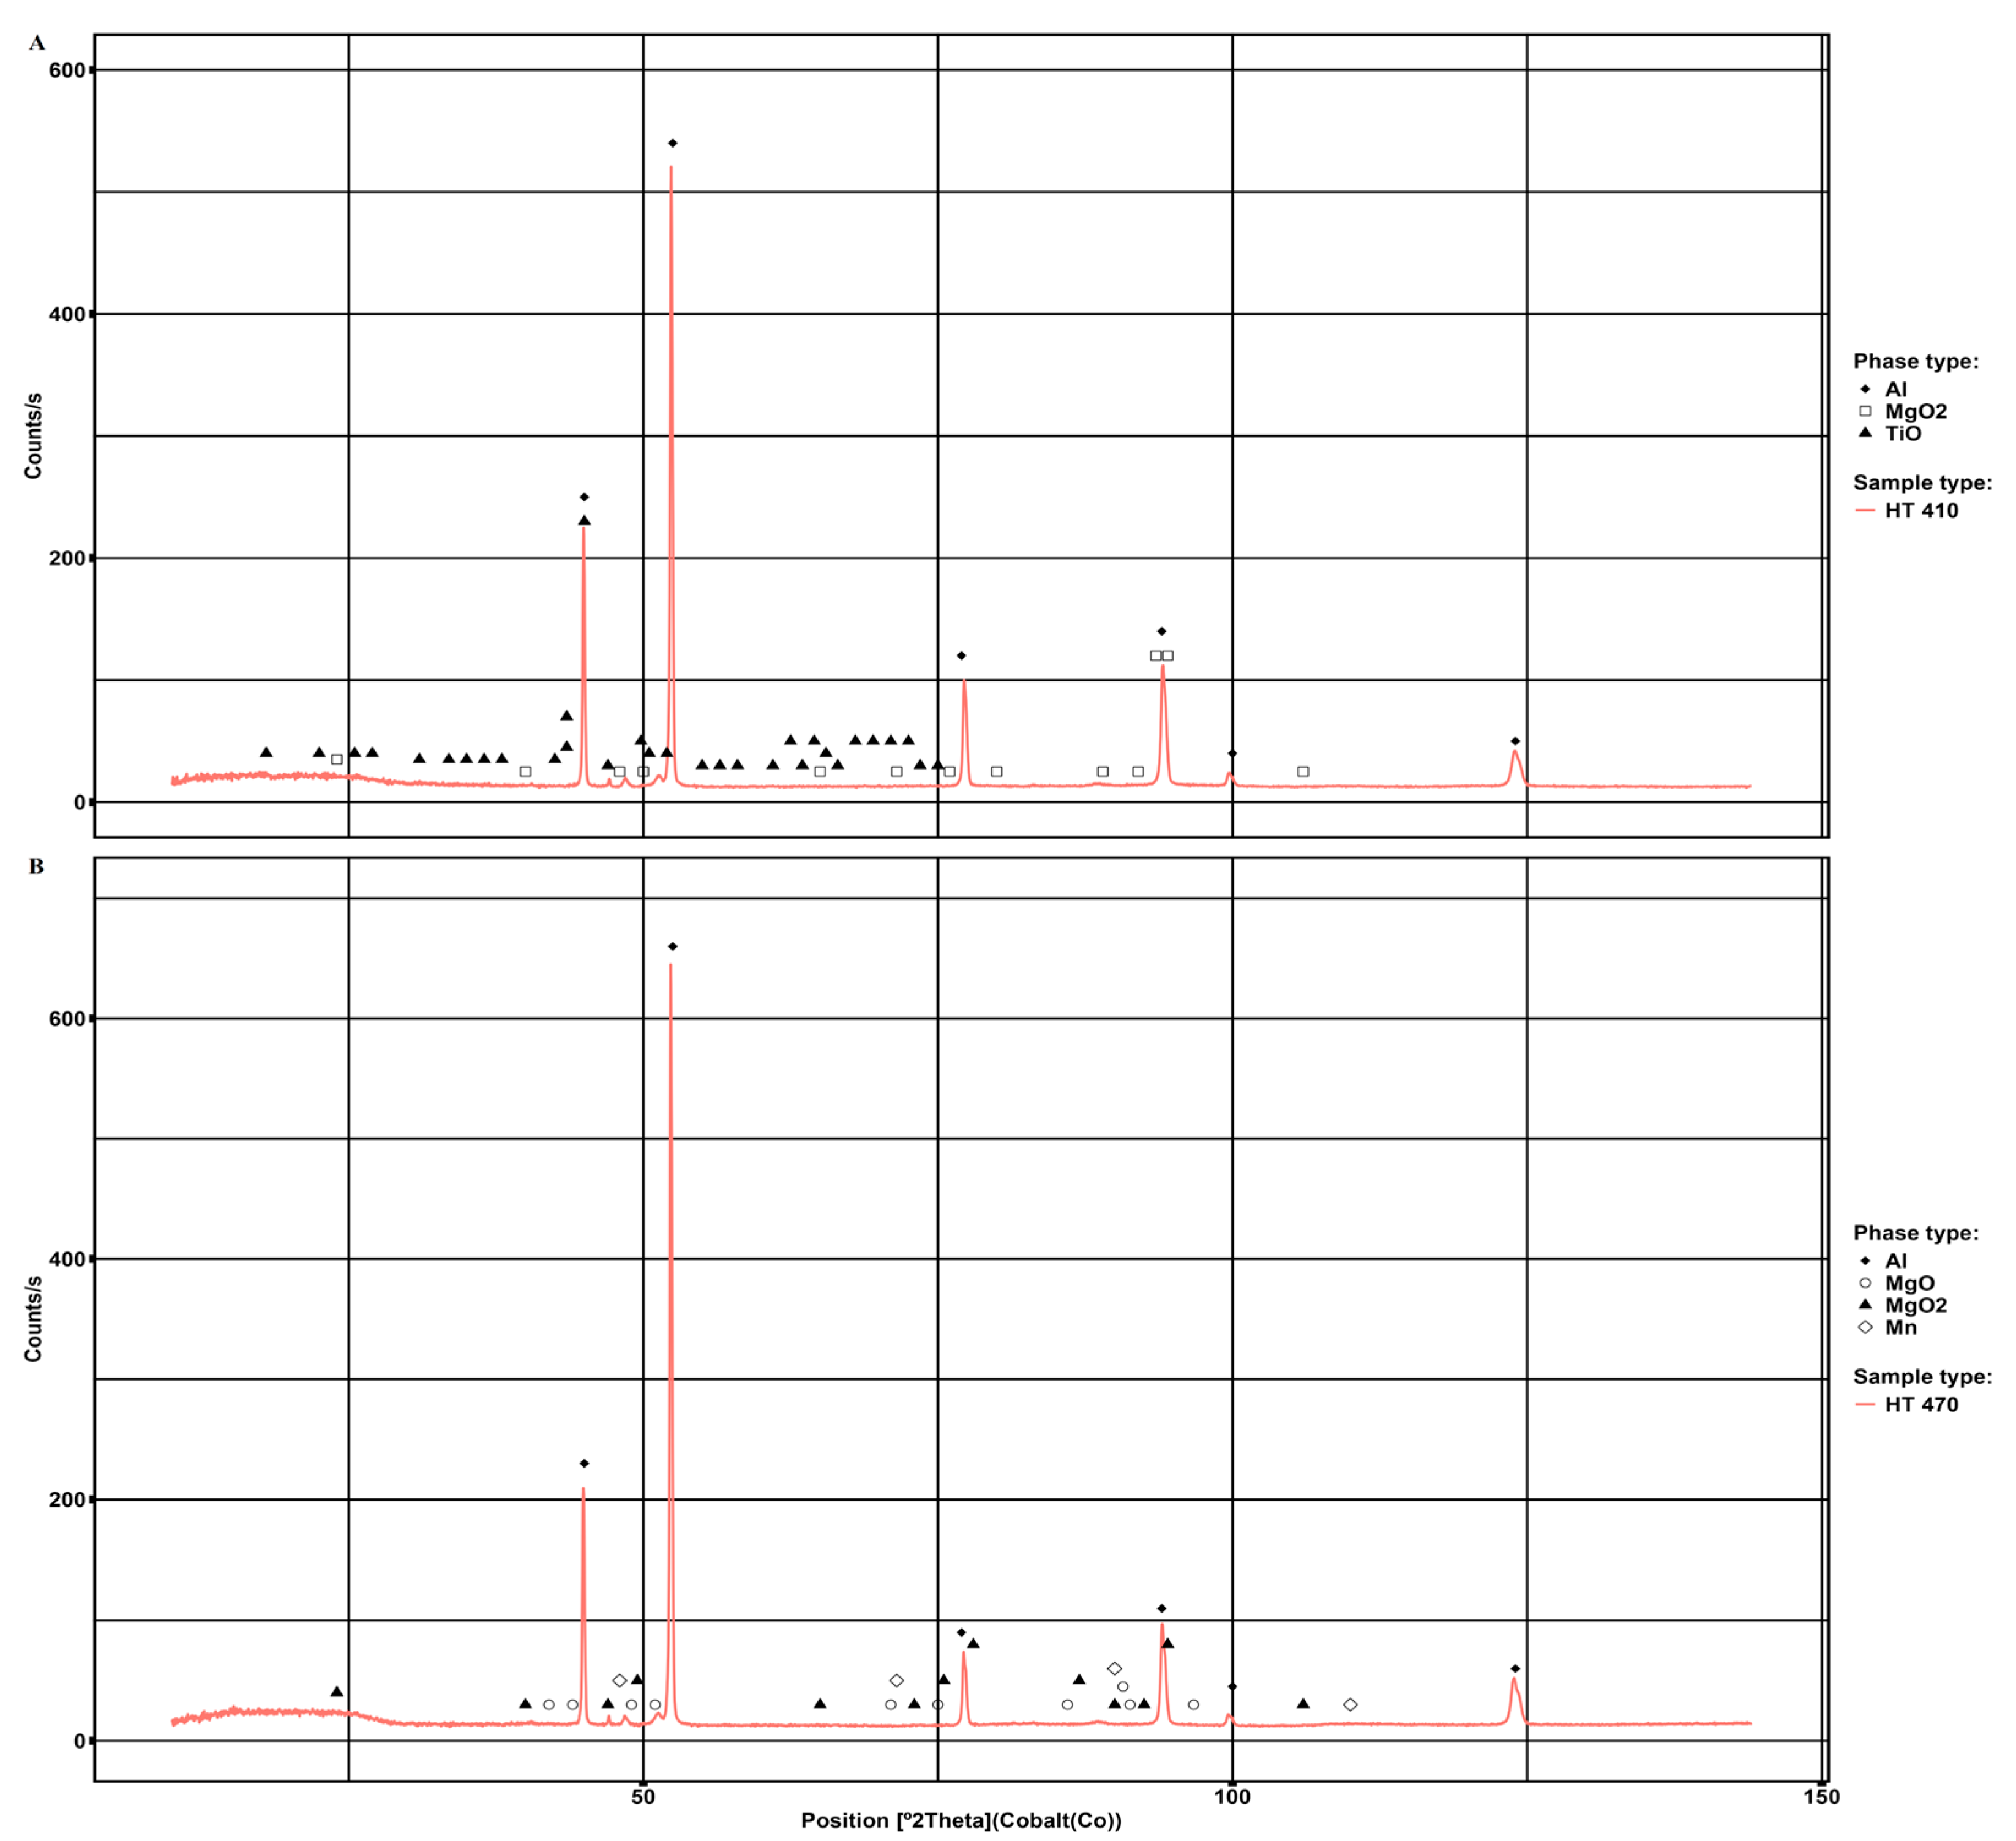
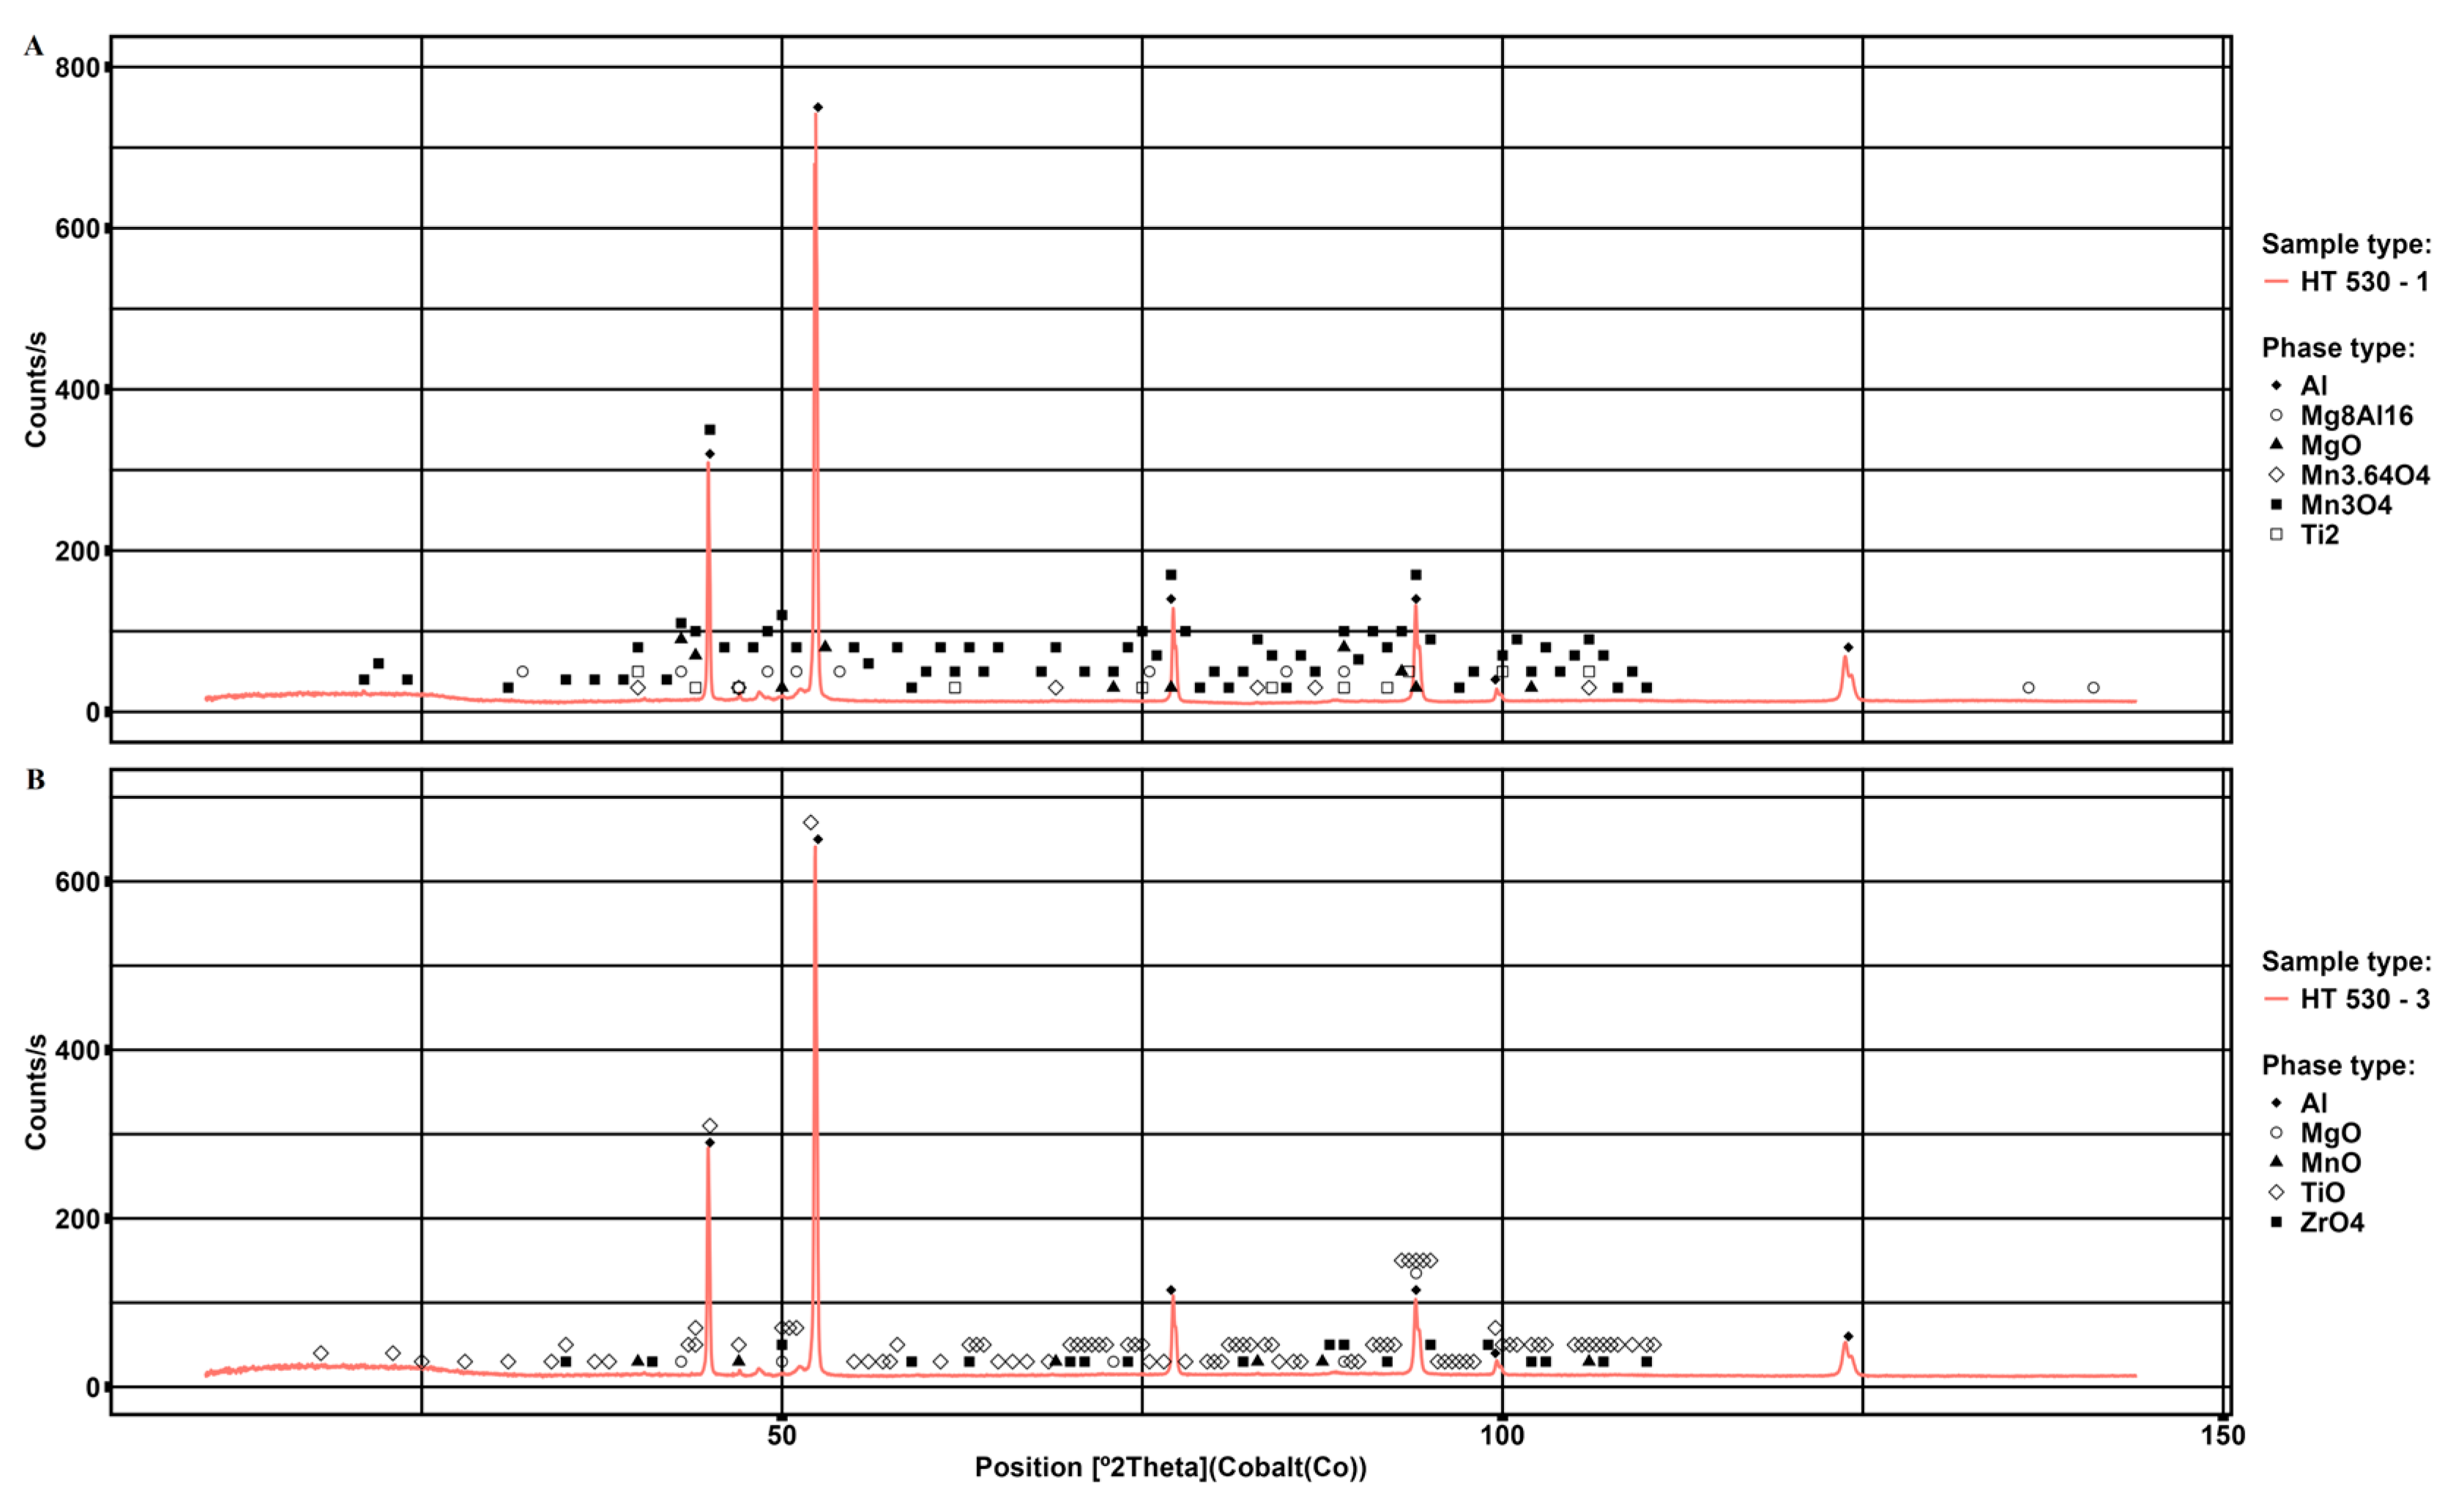
Figure 7 shows the XRD patterns of samples annealed at 410 °C and 470 °C. These patterns reveal a significant phase evolution with increasing annealing temperature, as is evidenced by the appearance of additional diffraction peaks.
A comparison of the microstructure and XRD of annealed samples at 410 °C and 470 °C (Figure 6 and Figure 7) with the microstructure and XRD of samples in Figure 4 and Figure 5 shows that as the annealing temperature increases, the precipitation from the solid solution of titanium, manganese, and magnesium oxide takes place. In addition, a reduction in the number of microcracks and local concentration of micropores is also observed.
Figure 7 shows the microstructure of the sample annealed at 530 °C, where the dark and light areas formed (inclusions) can be seen, and it can also be observed that the macropores and microcracks have completely disappeared from the volume of the sample.
This indicates that, when the samples are heated to 530 °C, a continuous decrease in the concentration of macrodefects is observed compared to other heat treatment temperatures (Figure 8). The red lines indicate the melt bath boundaries. This behavior could be associated with mass transfer, both diffusive and non-diffusional since the temperature of 530 °C is quite close to the melting point of the material under study. Figure 9 shows the XRD of samples annealed at 530 °C.
The XRD patterns of annealed sample at 530 °C (Figure 9) reveal that annealing at this temperature promote two simultaneous microstructural phenomena: (1) the precipitation of hexagonal close-packed titanium from the aluminum solid solution and (2) the formation of Mg8Al16 intermetallic phase. These temperature-dependent transformations demonstrate a complex phase evolution that occurs in the Al-Mn-Mg-Ti-Zr system under annealing.
Figure 10 shows a schematic representation of the sample’s position in the clamps during tensile testing and the direction of printing. The image is shown at an enlarged scale.
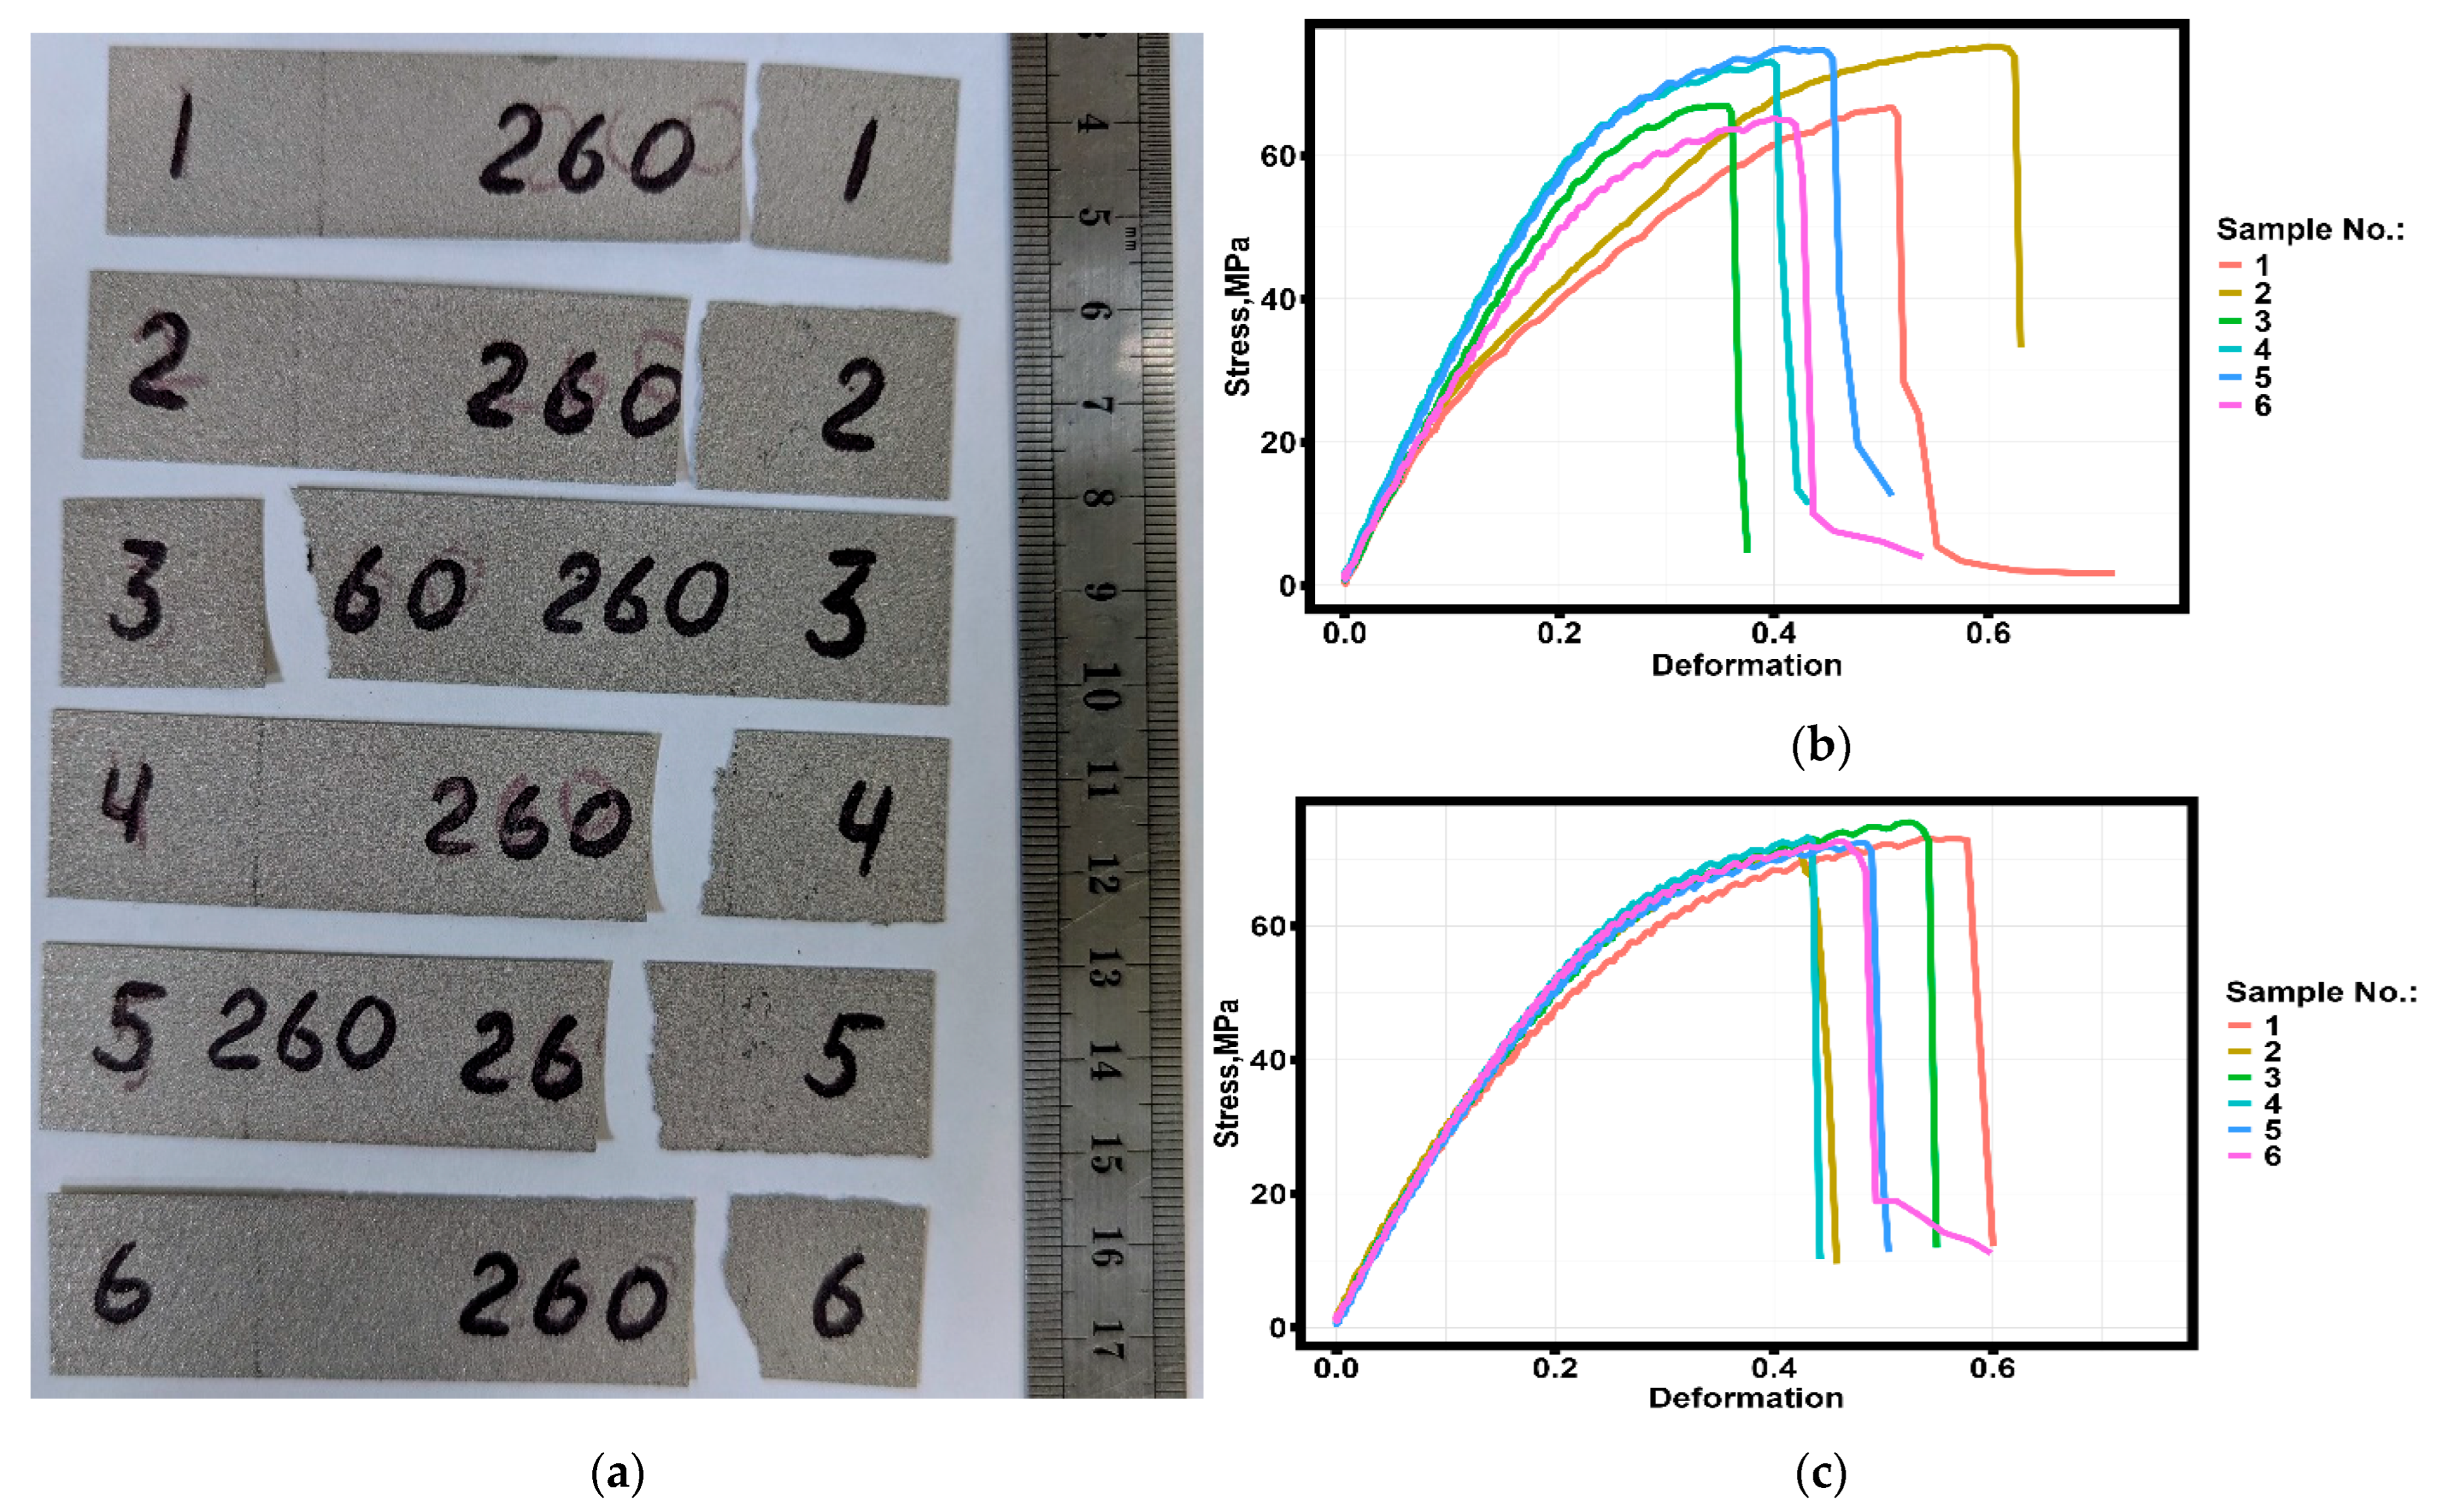
Figure 11 shows some images related to the tensile test: Figure 11a shows some Al-Mn-Mg-Ti-Zr thin-walled samples after tensile test, while Figure 11b,c exhibit the stress–strain diagrams of samples Figure 11b before and Figure 11c after annealing at 260 °C.
The stress–strain curves for samples annealed at temperatures from 290 °C to 530 °C are presented in Figure S2.
Table 4 presents the mean values and their standard deviation of experimental results obtained from tensile tests (Young’s modulus, Secant modulus, yield strength, ultimate tensile strength, yield strain, and tensile strain) obtained from samples before and after annealing. The complete experimental data of tensile tests are presented in Table S1. The abbreviations can be seen in Glossary.
Table 5 shows the mean values and their standard deviation of surface roughness parameters of sandblasted samples before and after annealing. The complete experimental data of roughness parameters are presented in Table S2, and surface profiles are presented in Figure S3.
Table 6 shows the mean values and their standard deviation of Vickers microhardness measurement of samples before and after annealing. The complete experimental data of Vickers microhardness is presented in Table S3.

3.2. Statistical Analysis of Results

For the statistical analysis, seven descriptive statistics (mean, standard deviation, median, maximum value, minimum value, first quartile (Q1), and third quartile (Q3)) of the experimental data were calculated. The descriptive statistics of Young’s modulus, Secant modulus, yield stress, tensile stress, and the deformation corresponding to tensile and yield stress are presented in Table S4. Moreover, the descriptive statistics related to the surface roughness before and after annealing, as well as the Vickers microhardness, are shown in Tables S5 and S6, respectively. The complete algorithm for performing statistical analysis is presented in Figure S1. Further presentation of the results of statistical analysis will be carried out in accordance with this algorithm.
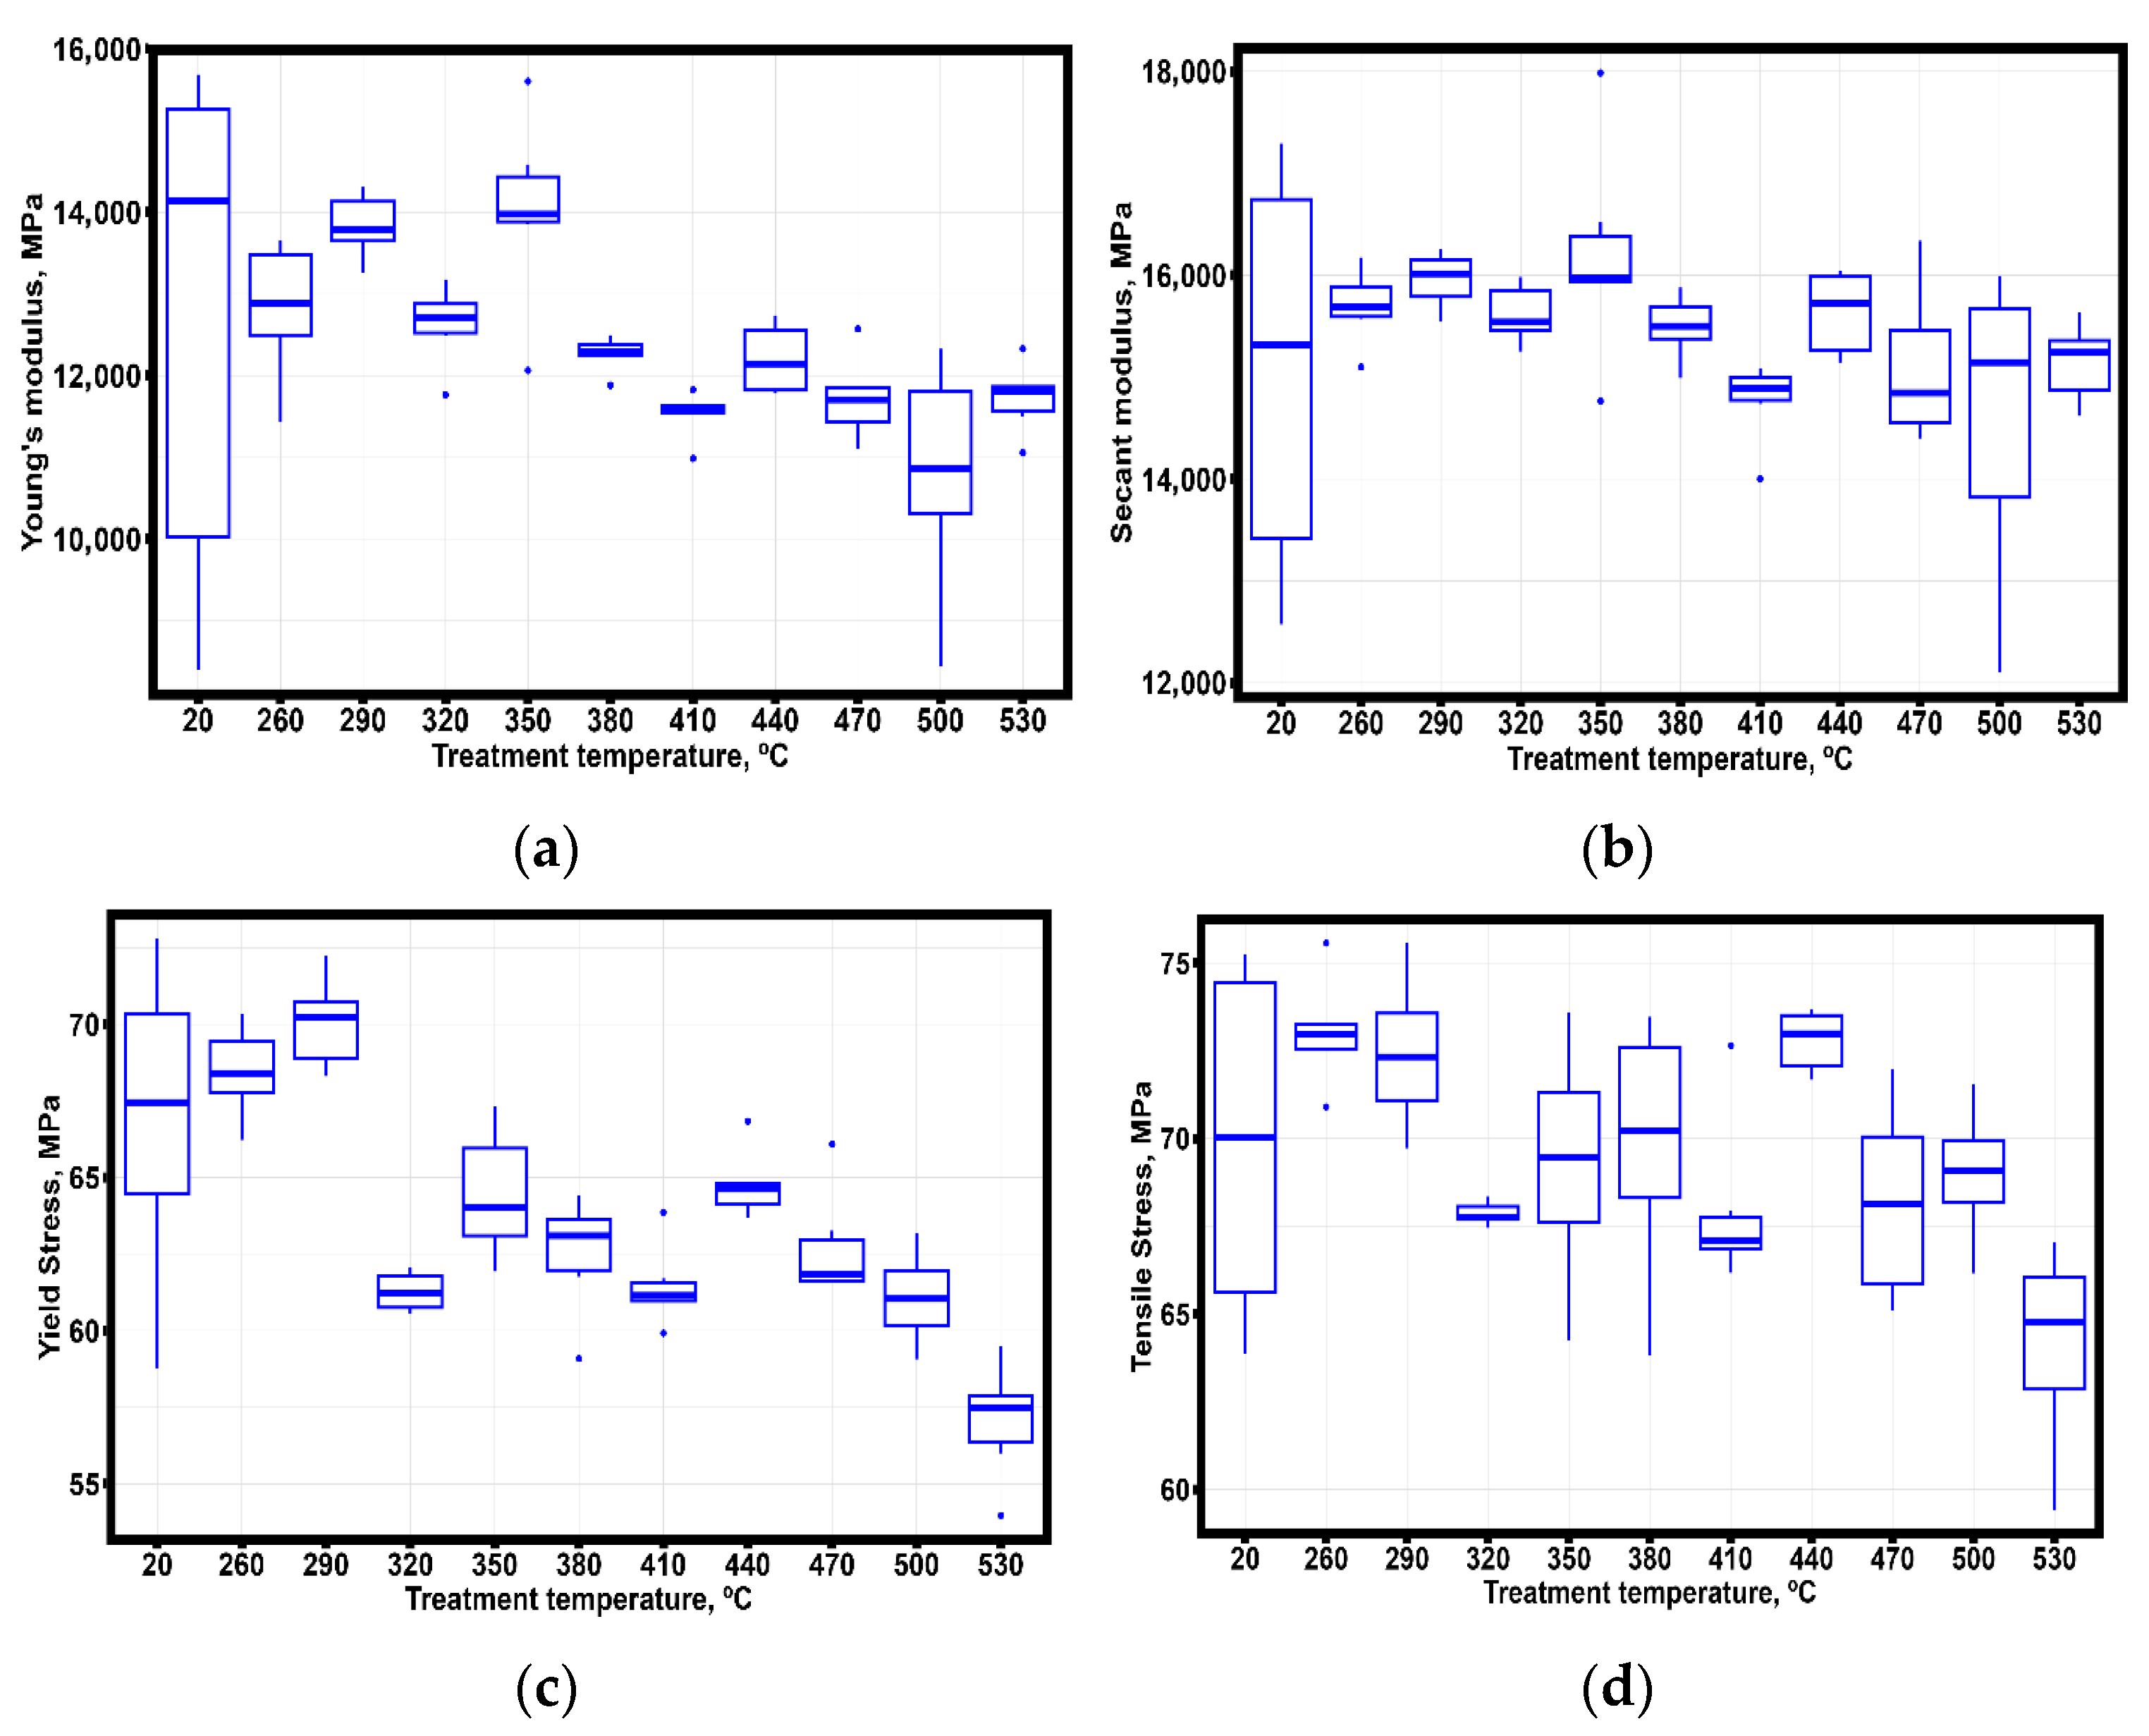
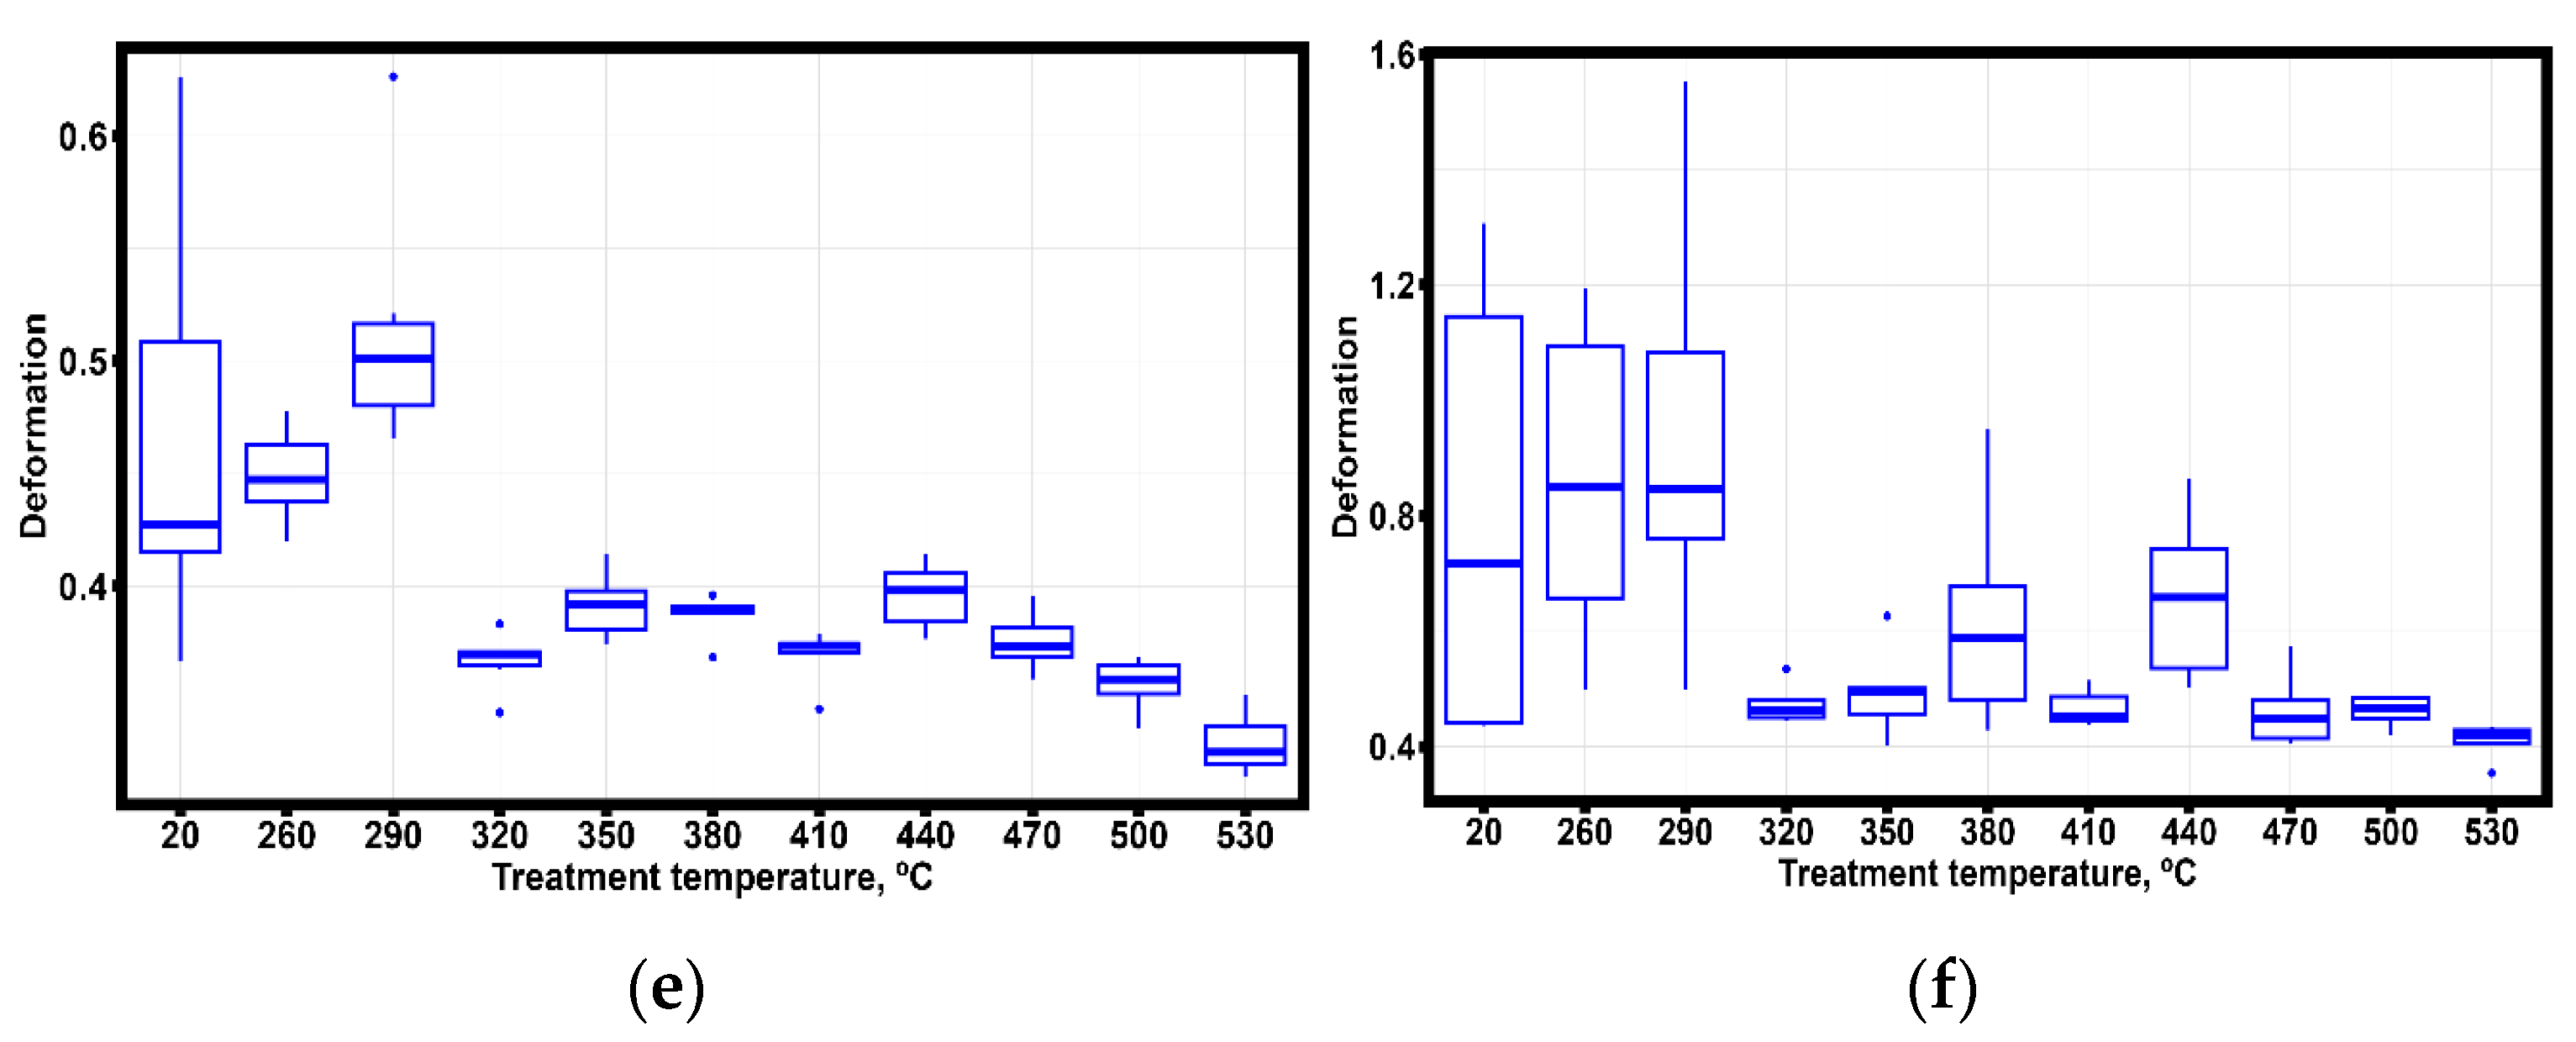
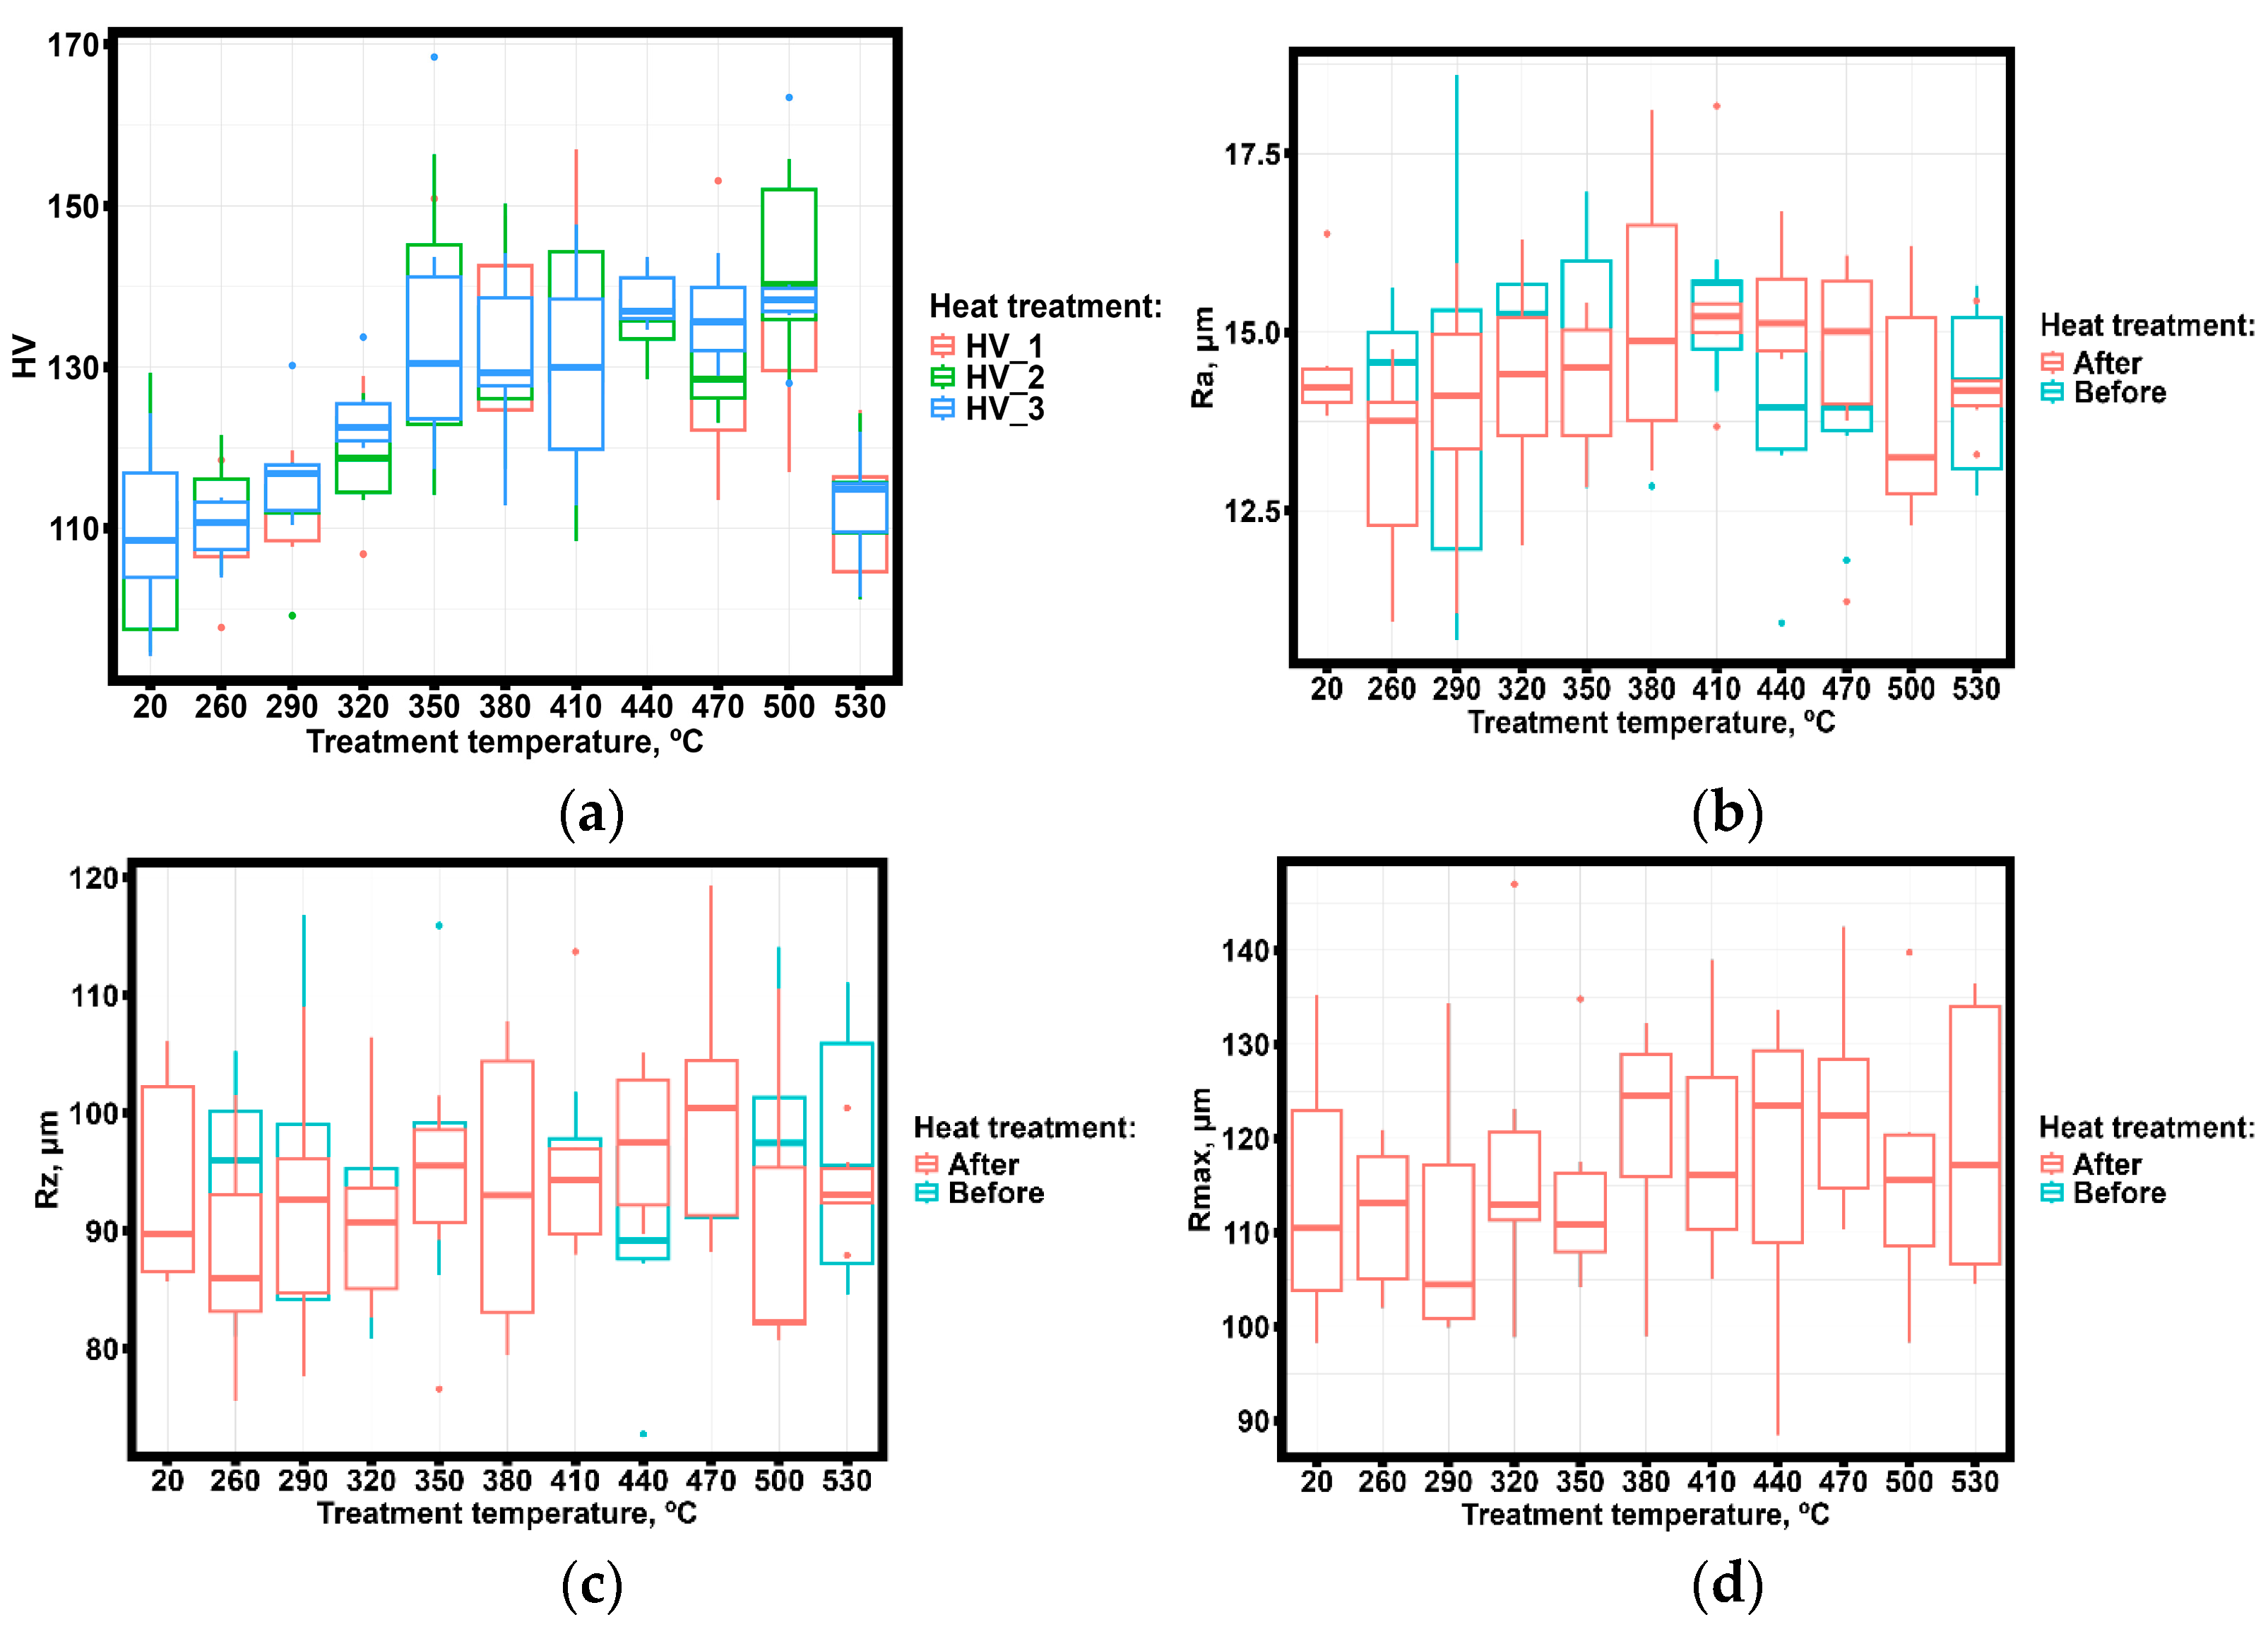
A graphical description of the experimental results is presented in Figure 12 and Figure 13. Figure 12 shows Tukey’s graphs of tensile tests experimental data, while Figure 13 shows the graphical interpretation of the experimental data presented in Tables S5 and S6 of both surface roughness and Vickers microhardness, respectively.
An analysis of the Tukey graphics showed in Figure 12 suggests the potential existence of three different groups of samples, which correspond to different annealing temperatures. These groups exhibit statistically significant differences in mechanical properties. The analysis of the microhardness behavior (Figure 13a) also suggests the existence of three sample groups with different microhardness behavior.
Based on these graphs, it can be assumed that the first group consists of unannealed samples, as well as those annealed up to 320 °C; the second group contains samples annealed in the range from 350 °C to 500 °C; and the third group includes samples annealed at 530 °C. On the other hand, it is impossible to make such an assumption about the surface roughness parameters Ra, Rz, and Rmax, since their values before and after annealing are practically identical, and the observed changes may be apparent. Thus, the hypotheses raised require additional verification through statistical tests and criteria.
To analyze the hardening of the samples during annealing, a study was carried out on the behavior of the strain-hardening coefficient, which was determined by the equation:
θ = σ B σ 0.2 ε B ε 0.2
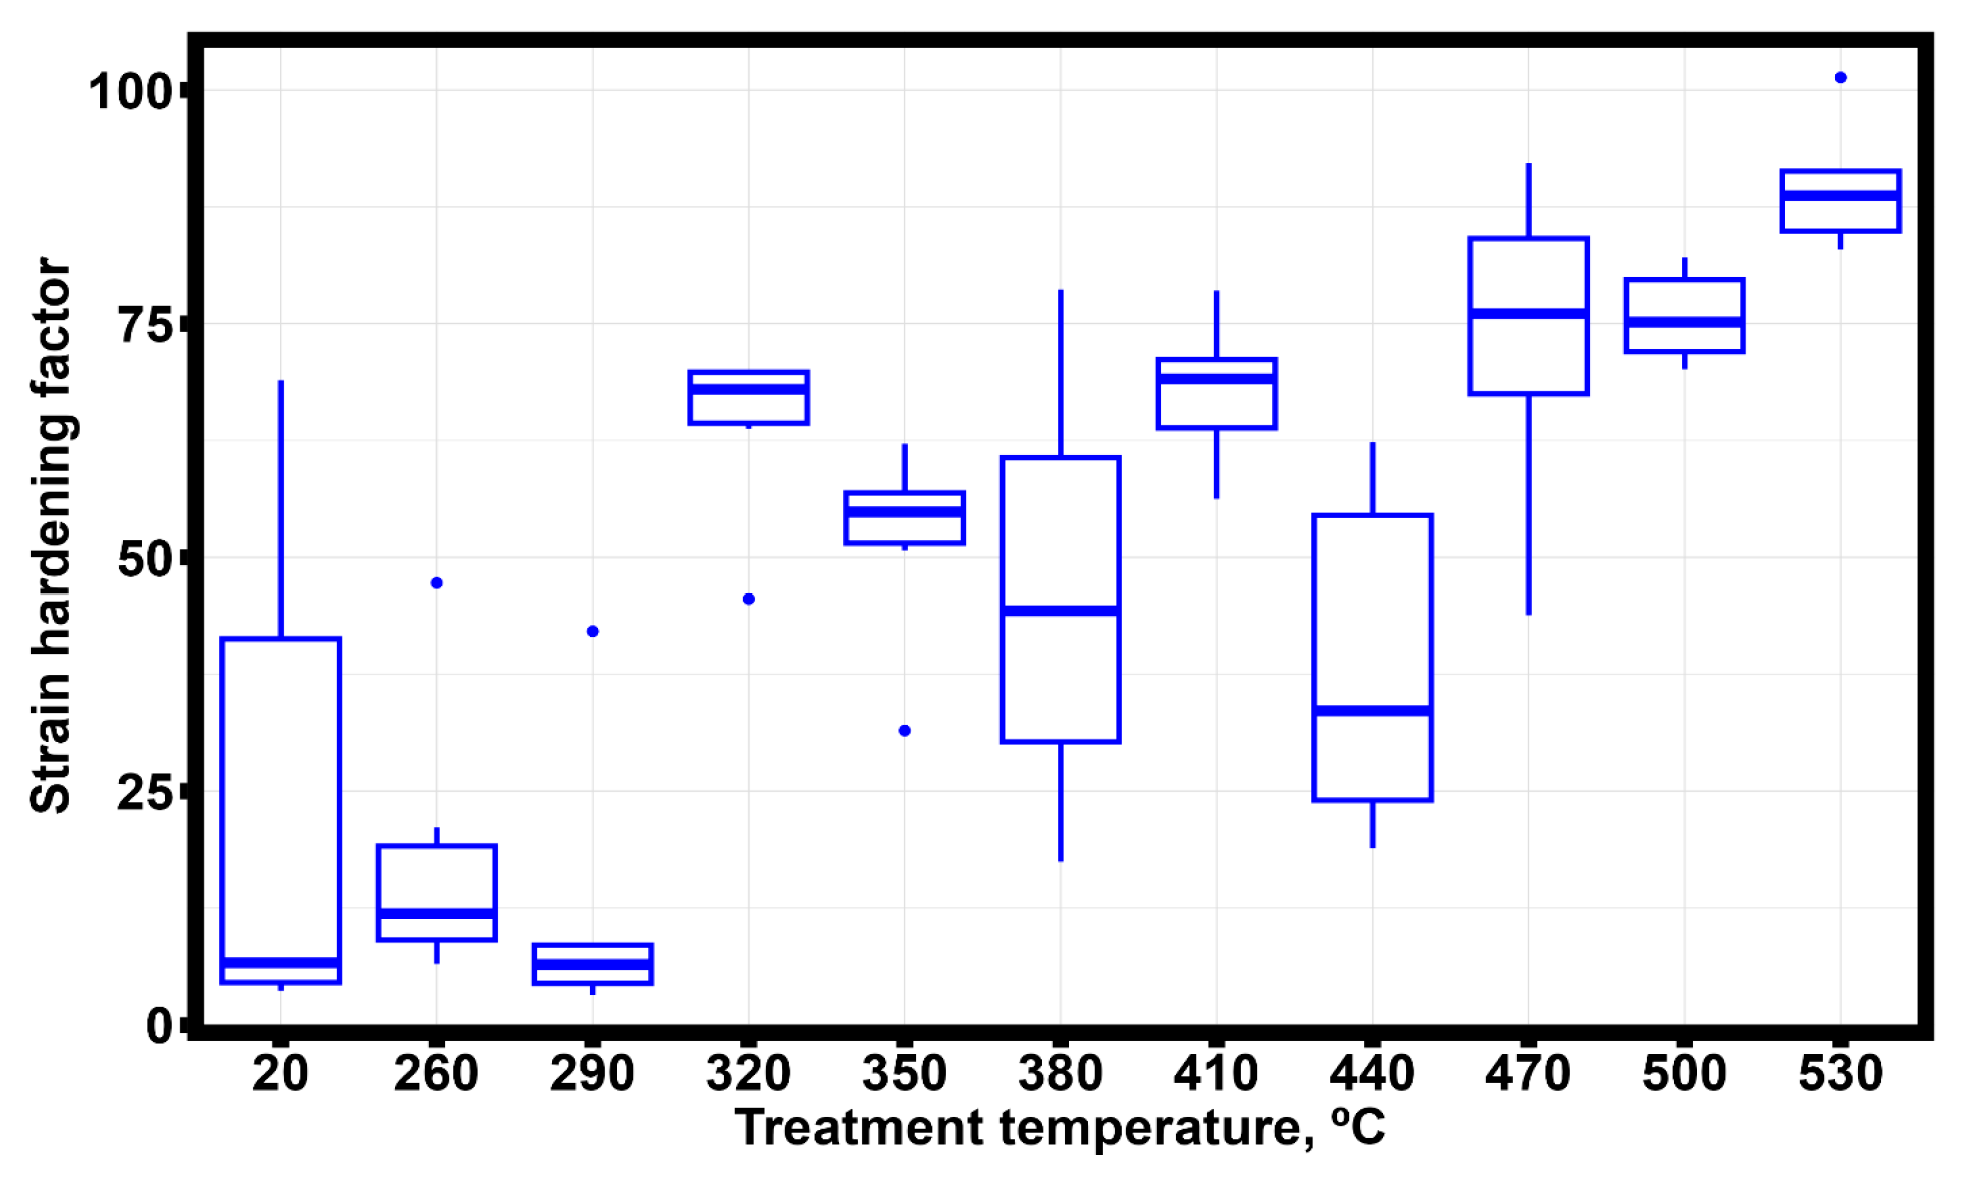
Figure 14 shows the strain-hardening factor of SLMed Al-Mn-Mg-Ti-Zr thin-walled samples before and after annealing.
As in the case of mechanical properties (Figure 12) and microhardness (Figure 13a), the behavior of the strain-hardening coefficient (Figure 14) allows us to distinguish three groups of samples. In this case, it can be assumed that the first group consists of unannealed samples, as well as those annealed up to 290 °C; the second group contains samples annealed in the range from 320 °C to 500 °C; and the third group includes samples annealed at 530 °C.
According to the statistical analysis algorithm in Figure S1, to determine the statistically significant limits of the three datasets, it is first necessary to establish which distribution law each of the measured parameters belongs to. Therefore, the next step is to estimate the distribution law closest to the experimental data.
Here, for each parameter under investigation, eight types of distribution laws were evaluated: Normal, Log-normal, Logistic, Gamma, Cauchy, Weibull, Exponential, and Gumbel. Then, the coefficients related to each of the evaluated distribution laws were estimated via the maximum likelihood method [47]. The optimal distribution law was identified through the application of both Akaike and Bayesian information criteria. The complete analysis results are summarized in Table 7.
The minimum values of the Akaike and Bayesian information criteria indicate the closest distribution law for each parameter under study. Therefore, only five of the eight distribution laws are found among the parameters under study.
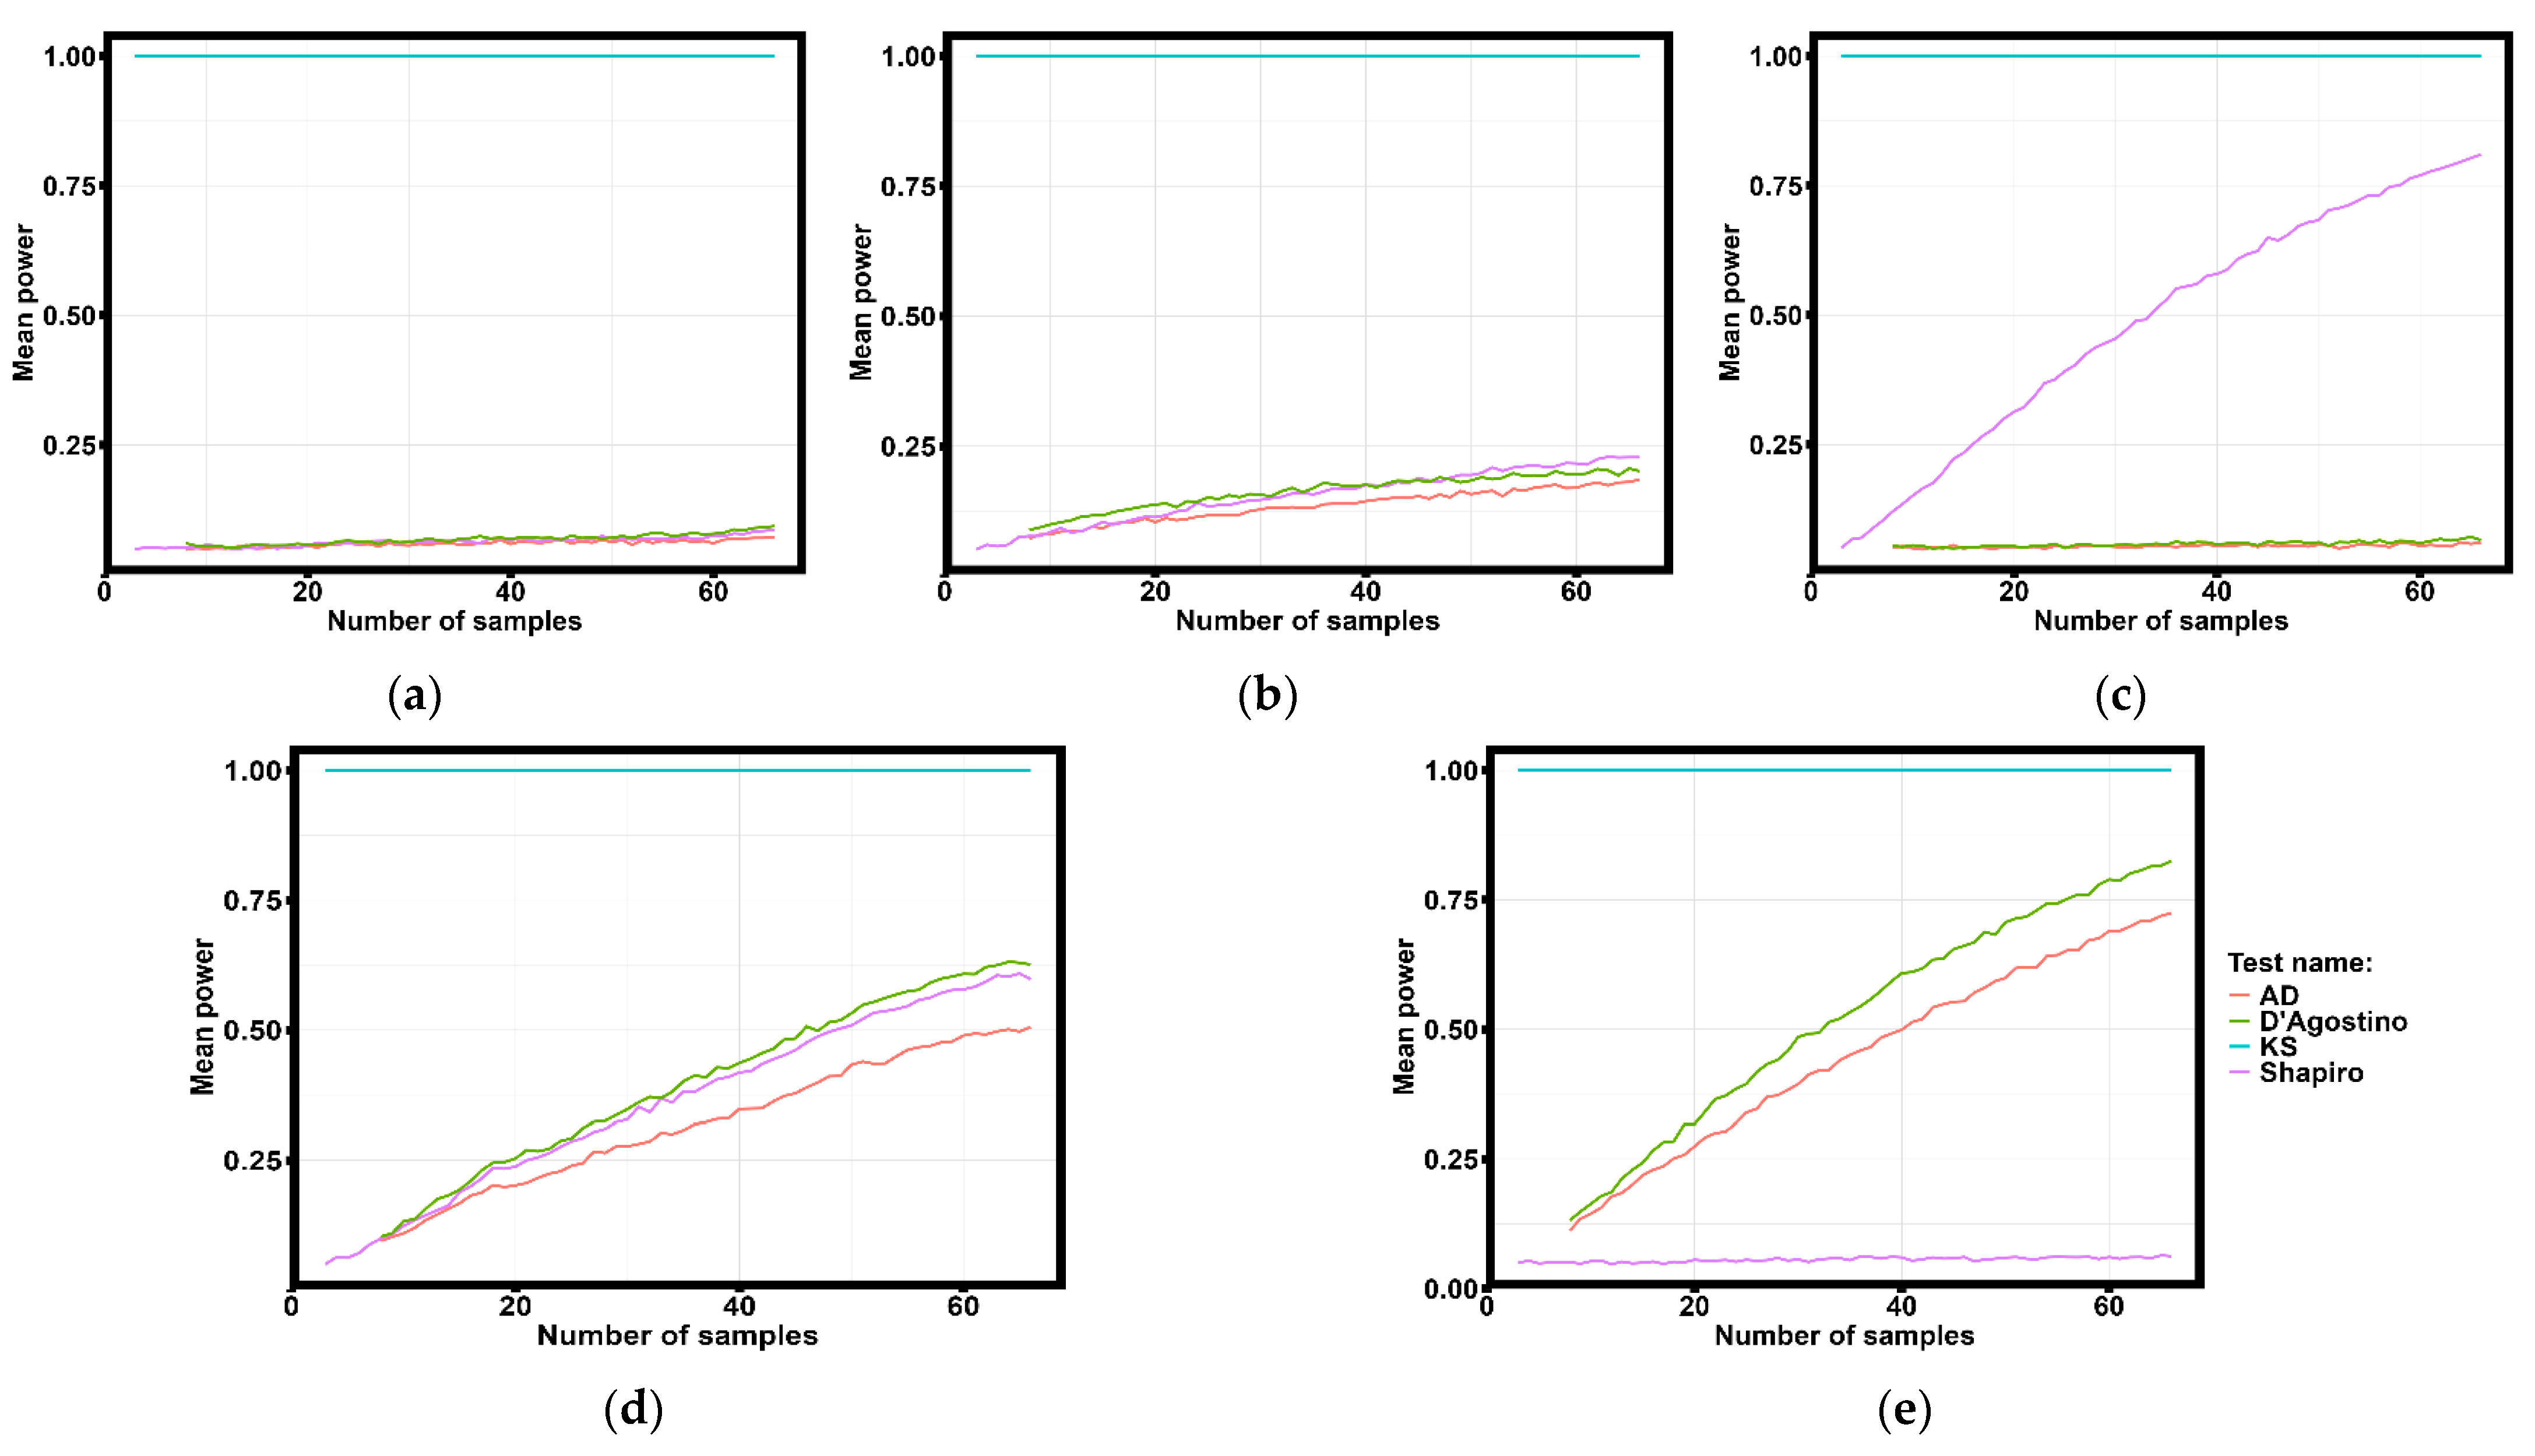
Testing for the compliance with the normal distribution was carried out by the estimation of the average statistical power of the four criteria (Shapiro–Wilk, D’Agusto, Kolmogorov–Smirnov, and Anderson–Darling). Figure 15 shows the average statistical power of the four criteria for the yield strength distribution to the normal distribution law. For the remaining parameters, the behavior of the average power of statistical criteria is similar.
The results presented in Figure 15 show that only the Kolmogorov–Smirnov criterion preserves its statistical power for any amount of data in the five proposed distribution laws. The estimation of the average statistical power on the other parameters shows similar results. Table 8 presents the results obtained for the Kolmogorov–Smirnov criterion estimated for all parameters in this analysis.
The results in Table 8 indicate that all examined parameters exhibit statistically significant deviations from normality (p < 0.05). The results of the distribution law analysis confirm that the experimentally obtained results (as a whole) do not obey the normal distribution law. And the values measured separately have their own distribution law.
The analysis of distribution laws showed the presence of deviations from the normal distribution law. It is in correlation with the observations in [64,65], where it was shown that mechanical properties of a material can have different distribution laws depending on its composition and heat treatment. In these works, the change from Weibull to normal distribution law depending on the annealing temperature [64] and chemical composition [65] was shown.
Thus, it can be assumed that the nature of the mechanical properties’ distribution law of samples in our study is influenced by the phase composition and its distribution in the sample volume, as well as the presence or absence of residual stresses arising during the manufacture of samples by SLM [66]. This representation agrees with Weibull’s ideas on the nature of the distribution laws of material properties [67].
Given that the experimental data under investigation do not follow a normal distribution, non-parametric analysis criteria will be used to confirm the existence of differences in the data. Non-parametric analysis was performed using the Kruskal–Wallis test with Dunn’s post hoc criterion, incorporating a Bonferroni correction for multiple comparisons. Table 9 presents the statistical differences among different annealing temperature groups of thin-walled sample parameters.
From these results, it can be concluded that the mechanical properties of thin-walled samples showed statistically distinguishable groups based on annealing temperature. However, the analysis of surface roughness parameters (Ra, Rz, and Rmax) revealed no statistically significant differences (p > 0.05) in both cases before and after annealing.
The strong agreement between hierarchical clustering results and the original data matrix was confirmed by a high cophenetic correlation coefficient (Spearman’s ρ = 0.834). The temperature ranges and sample distributions across these three distinct groups are presented in Table 10.
The results of hierarchical clustering (Table 10) show that group 1 includes all thin-walled samples annealed at 530 °C, as well as three anomalous samples heat-treated at other temperatures. This group includes samples with the highest strain hardening coefficient.
The second group included all samples annealed at 260 °C and 290 °C, as well as most samples (4 pieces) without annealing, and several anomalous results that underwent heat treatment at other temperatures. The strain hardening coefficient for this group of samples is minimal.
The third group includes all annealed samples in the temperature range from 320 °C to 500 °C, and one anomalous result. These samples show no significant changes in the mechanical properties between each other, i.e., their values are practically at the same level. At the same time, their mechanical properties differ from the results of the first and second groups.
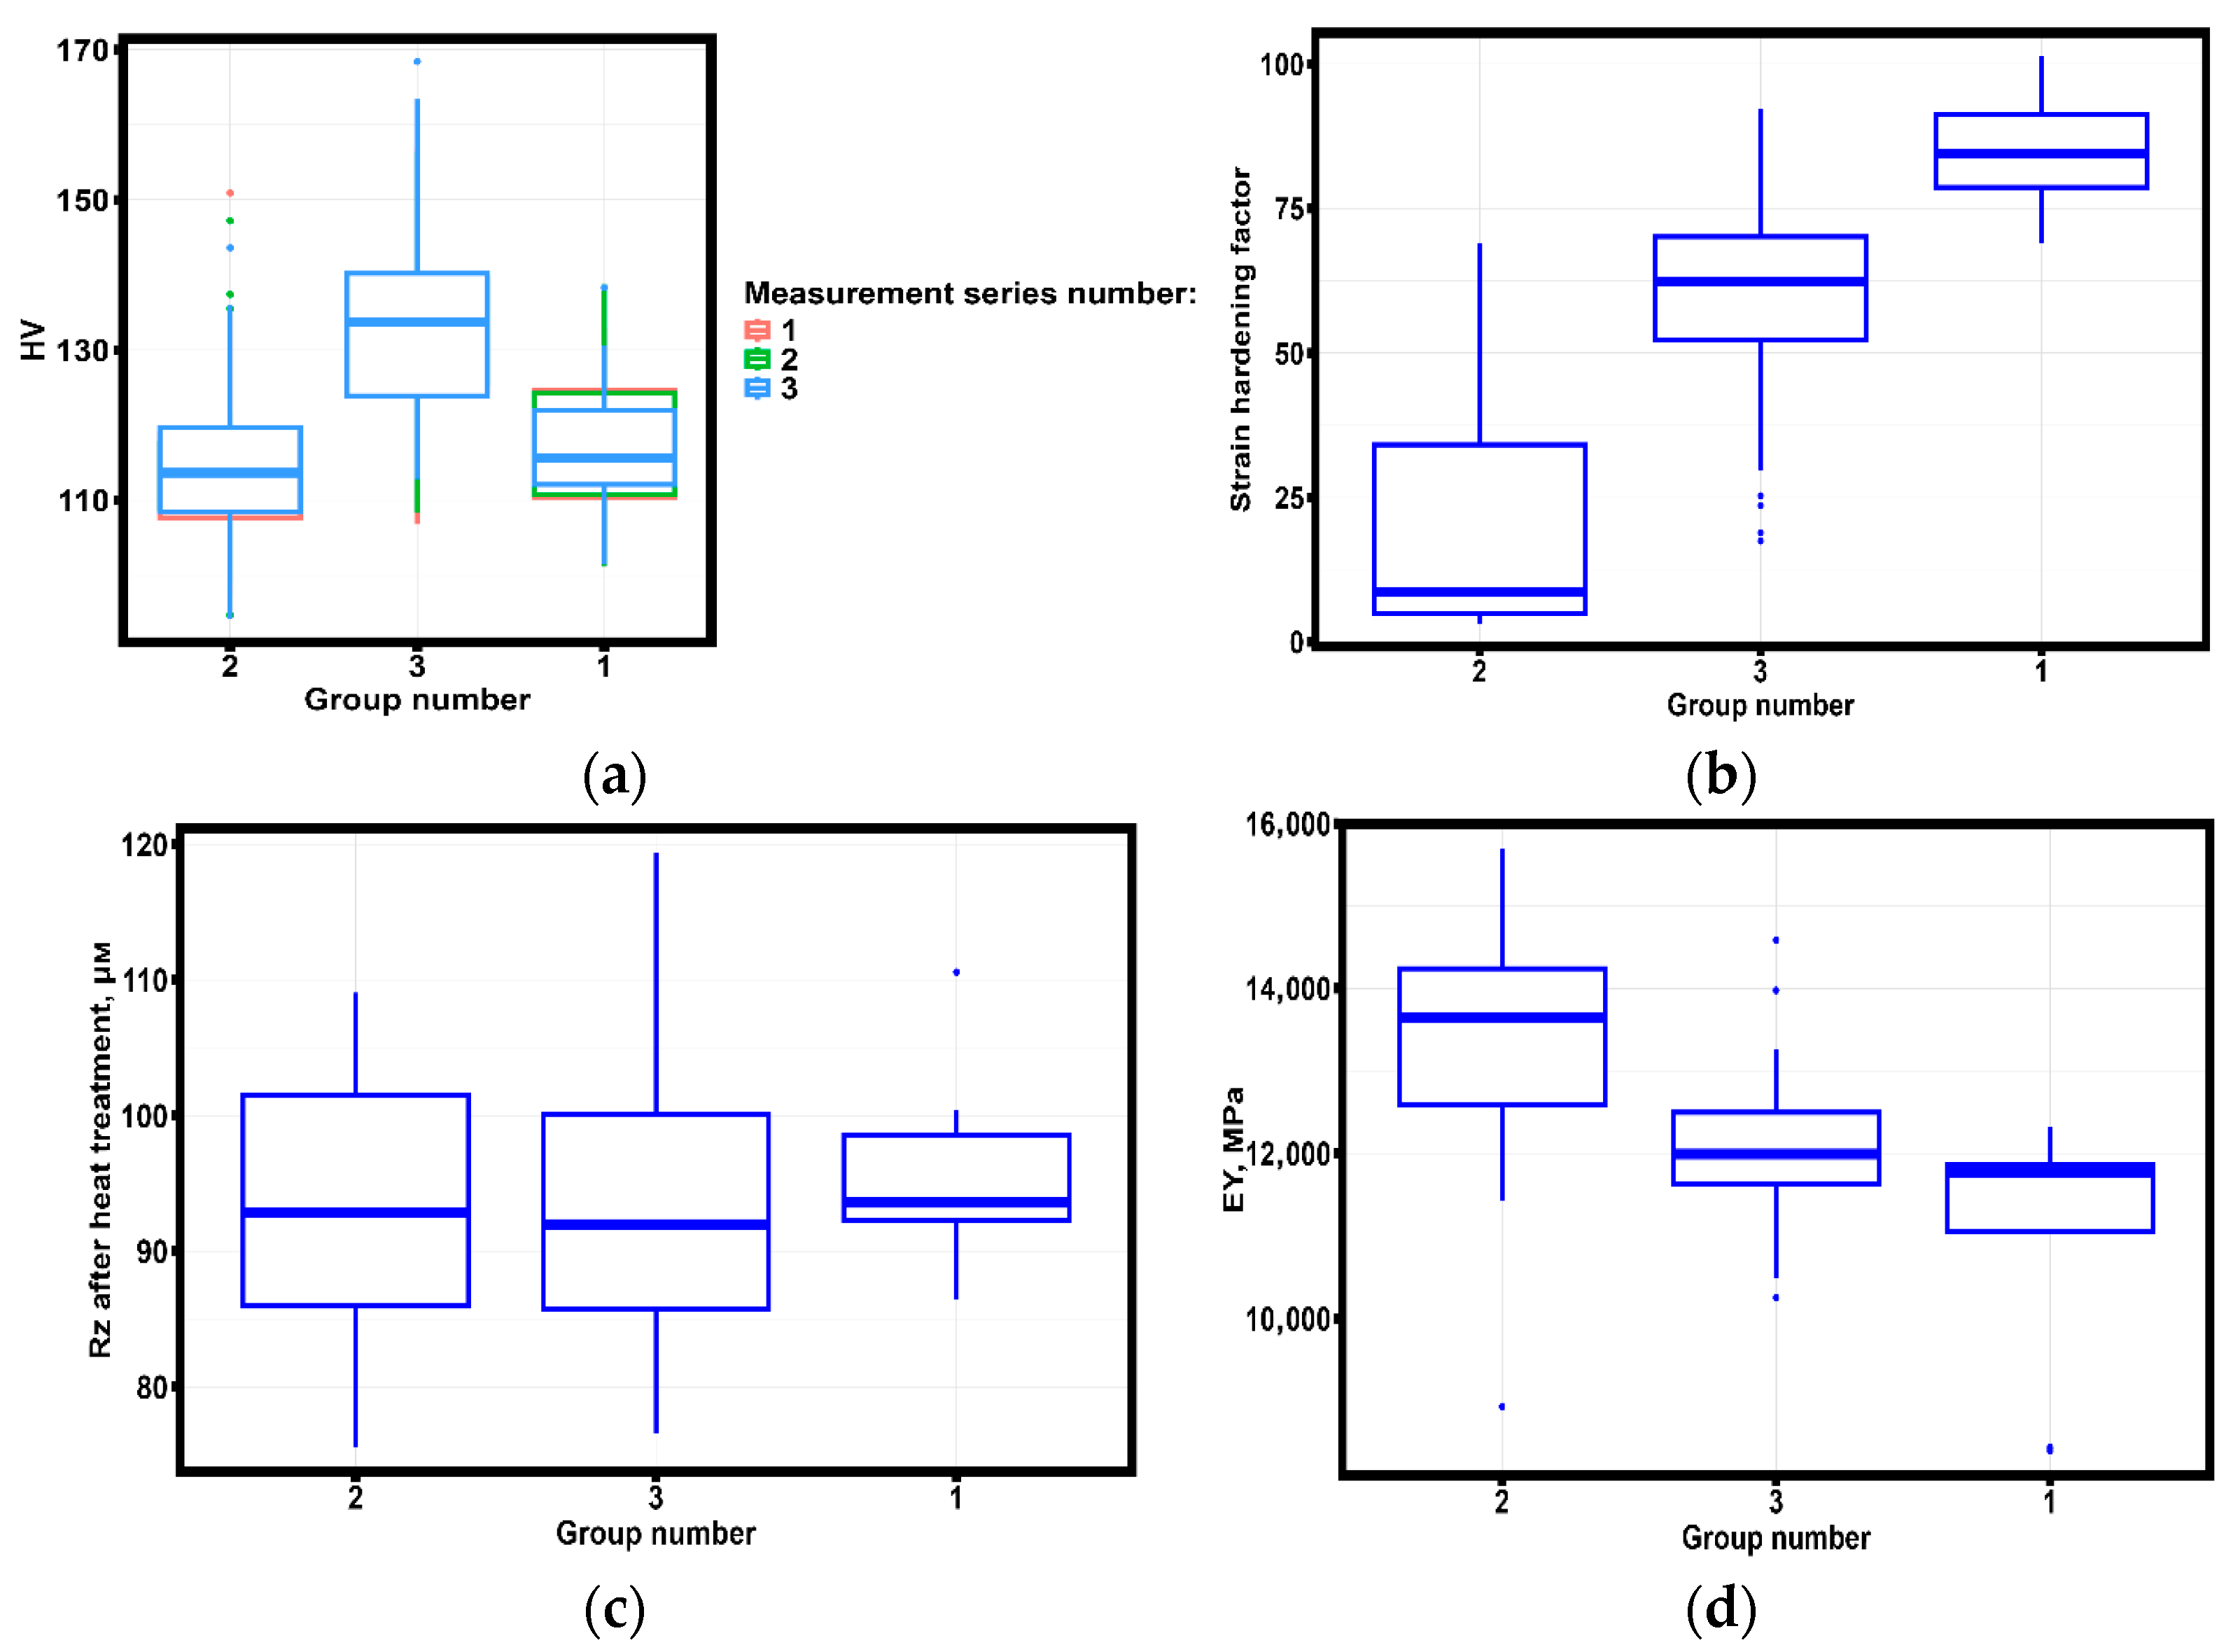
Figure 16 presents Tukey box plots comparing the distributions of four key parameters across the newly identified sample groups: microhardness, strain-hardening coefficient, Young’s modulus, and post-treatment Rz surface roughness. The groups are arranged in ascending order based on their predominant heat treatment temperature ranges.
The analytical results suggest that microhardness–surface roughness correlations may serve as an intermediate connection (Figure 16a) between strain-hardening behavior and elastic properties in the investigated material system. Statistical comparison of the identified groups reveals distinct patterns. Firstly, post-treatment Rz surface roughness shows no statistically significant differences across groups (p > 0.05). Secondly, Young’s modulus demonstrates significant variation between group 2 and both other groups (p < 0.05), but not between Groups 1 and 3 (p > 0.05). Finally, both microhardness and strain-hardening coefficient exhibit statistically significant differences among all three groups (p < 0.05).
These results confirm the existence of three groups of samples with statistically significant differences in mechanical properties. In addition, the results obtained correlate well with metallographic observations: in the first group of samples, structural and phase changes occur that significantly affect the mechanical properties and minimize defects in the sample volume; in the second group (20–290 °C) of samples, no structural phase changes are observed that could affect the mechanical properties, and they have the highest number of macrodefects in volume. In the third group (320–500 °C), structural and phase changes occur that moderately affect the mechanical properties, and a moderate decrease in macrodefects in the sample volume is observed.

3.3. Discussion

Analysis of the distribution laws of experimental results for thin-walled samples obtained using SLM technology from an Al-Mn-Mg-Ti-Zr alloy showed deviations from the normal distribution law. In [64,65], it was shown that the mechanical properties of a material can obey different distribution laws depending on the composition of the substance and heat treatment. The change in the distribution law occurs from the Weibull distribution to the normal distribution law depending on the heat treatment temperature [64] and chemical composition [65]. On this basis, it can be assumed that the nature of the distribution law of mechanical properties is influenced by the phase composition and distribution of phases in the sample volume, as well as the presence or absence of residual stresses arising during the manufacture of samples using the SLM method [66]. This view is consistent with Weibull’s ideas about the nature of distribution laws and material properties [67].
Statistical analysis of the results of tensile tests on thin-walled samples of Al-Mn-Mg-Ti-Zr alloy, heat-treated at temperatures ranging from 260 °C to 530 °C for one hour, showed that the minimum strain-hardening coefficient was observed in samples that had not undergone heat treatment and those that had undergone heat treatment at temperatures between 260 °C and 290 °C (Figure 16b, group 2). As the heat treatment temperature increases, the strain-hardening coefficient shows a uniform increase in group 3 and group 1. This temperature dependence indicates possible changes in the hardening mechanisms during deformation in the studied temperature range. To clarify the reasons for the observed increase in hardening, we conducted comprehensive structural and phase studies, including metallographic and X-ray diffraction analyses of thin-walled samples obtained using selective laser melting technology. The results are shown in Figure 4, Figure 5, Figure 6, Figure 7, Figure 8 and Figure 9.
It is noteworthy that the results of the metallographic observations correlate with the results of statistical grouping: samples that did not undergo heat treatment and samples that underwent heat treatment at ranges between 260 °C and 290 °C belong to group 2 (Table 10) and demonstrate a similar structural phase composition (Figure 4 and Figure 5). Increasing the heat treatment temperature from 320 °C to 500 °C leads to the accumulation of macrodefects at the melt boundary and the precipitation of titanium, manganese, and magnesium from the solid solution, followed by the formation of oxides (Figure 6 and Figure 7). When the heat treatment temperature is increased to 530 °C, the maximum strain hardening coefficient is observed, with no macropores or microcracks, as well as the precipitation of zirconium and the formation of an intermetallic phase (Figure 8 and Figure 9). This observation is partially confirmed by calculating the cohesion energy of various elements at the boundaries of aluminum grains, performed based on first principles. It has been shown that zirconium segregation at grain boundaries increases cohesion strength [68,69,70].
Extending these results to aluminum alloys such as AlSi10Mg suggests that the mechanism of strengthening by precipitation [16,17,18,19,20] may also be associated with an increase in cohesion energy [68,69,70] during silicon precipitation at the boundaries of solid solutions. Consequently, future research directions in the development of aluminum alloys may focus on determining alloy compositions that maximize cohesive strength specifically at grain boundaries, rather than only in the base material, as discussed in [28,29]. Previous studies on model samples [31] have demonstrated an approximately twofold increase in the strain-hardening coefficient corresponding to a decrease in the size of macrodefects. This established relationship explains the increase in the strain-hardening ratio observed in Figure 15b, where the reduction in macrodefects appears to be the dominant factor.
Table 11 presents a comparison of the mechanical properties of thin-walled AlSi10Mg samples obtained in our previous study with the mechanical properties of Al-Mn-Mg-Ti-Zr. We also use the results obtained for Al-Mg alloys doped with Sc, Zr, and Er for comparison.
The increased mechanical properties of the samples studied in [71,72] may be due to the higher content of alloying elements such as Sc, Er, and Zr compared to the content of Ti and Zr in the alloy studied. The second factor affecting the differences in mechanical properties is the type of samples tested. In our work, we focused on the study of thin-walled samples, while in [71,72], full-size samples were tested. The use of thin-walled samples in our study allows us to specifically investigate the influence of the scale factor on mechanical properties (in particular, the relationship between surface roughness and mechanical properties), which manifests itself in conditions close to the actual operating conditions for such structures [73]. At the same time, comparison with full-size samples from [71,72] is incorrect in a direct setting, since the latter are not subject to such a significant influence of geometry, which distorts the picture of strengthening associated exclusively with the structural-phase state. In our further research, we will study thin-walled samples made using SLM technology from Al-Mn-Mg-Sc-Zr and Al-Mn-Mg-Er-Zr alloys to ensure the most accurate comparison. Thus, the comparison allows us to identify potential areas of application: Al-Mn-Mg alloys with the studied alloying additives are promising for the manufacture of corrosion-resistant thin-walled structures that do not bear high mechanical loads, while the AlSi10Mg alloy, which demonstrates higher strength, can be used for loaded parts.
Metallographic and X-ray structural studies conducted on thin-walled samples also confirm these conclusions.
Analysis of microhardness behavior (Figure 14) shows that group 2, subjected to low-temperature heat treatment, exhibits the lowest microhardness values. At the same time, microhardness behavior has a pronounced break in group 3 with a maximum at 440 °C. A similar pattern was observed by the authors [71] in samples obtained by SLM technology from an Al-Mg alloy doped with Sc and Zr after heat treatment at 400 °C for 4 h. In [72], the mechanical properties, microhardness, and microstructure of samples obtained using SLM technology from an Al-Mg alloy doping with Zr and Er subjected to heat treatment were investigated. The maximum microhardness value was achieved at 325 °C and a processing time of 1 to 10 h. In both studies, the increase in microhardness is explained by the precipitation of intermetallic phases with the composition Al3 (Sc, Er, Zr) with an L12 crystallographic structure. Meanwhile, the decrease in microhardness is associated with an increase in the size of intermetallic above 21 nm [71]. Thus, the increase in microhardness observed in Figure 11a and Figure 14a up to 440 °C and its subsequent decrease at higher temperatures may be associated with the formation of nanoscale dispersed particles of Al3 (Ti, Zr) intermetallic and their subsequent increase in size. It should be noted that in samples manufactured using SLM technology with AlSi10Mg aluminum alloys, the hardening mechanism also changes with the heat treatment temperature [74], and the microhardness behavior also depends on the thickness of the network during precipitate hardening [75] and silicon grain size [74,76]. These conclusions can be explained from the perspective of the direct and inverse Hall–Petch [relations [77] but require further research.
Final confirmation of this assumption can be obtained by transmission electron microscopy, which will be the subject of our further research.
A summary of the analysis results shows that as the heat treatment temperature increases, the number of micropores and microcracks (macrodefects) decreases. This phenomenon, combined with the formation of intermetallic phases and the precipitation of titanium and zirconium, contributes to the strengthening of thin-walled samples made by selective laser melting of Al-Mn-Mg-Ti-Zr alloy.
However, the question remains open regarding the distribution and size of intermetallic phases of the Al3 (Ti, Zr) type that may form during heat treatment of thin-walled samples made using selective laser melting technology from an Al-Mn-Mg-Ti-Zr alloy. Accordingly, our research will continue with microstructure analysis using transmission electron microscopy to study the distribution and size of intermetallic phases. In addition, in the presented work, the samples were heat-treated for 1 h. This heat treatment time is quite short and does not allow us to draw conclusions about the finality of the structural phase changes observed in the samples. Accordingly, the analysis of mechanical properties and changes in the structural phase composition depending on the heat treatment time is also one of the important tasks in selecting post-processing modes for products obtained using SLM technology.

4. Conclusions

In this study, we conducted a comprehensive experimental and statistical investigation of heat treatment modes for thin-walled samples obtained using selective laser melting technology from a new Al-Mn-Mg-Ti-Zr alloy, which is a cheaper analog of Al-Mn-Mg-Sc-Zr. The study found that:
  • Heat treatment of thin-walled samples obtained using SLM technology from an Al-Mn-Mg-Ti-Zr alloy at a temperature of 530 °C for one hour allows maximum strain hardening to be achieved.
  • Heat treatment at 530 °C for one hour of thin-walled samples significantly reduced the number of observed microcracks and macropores.
  • At a heat treatment temperature of 530 °C for one hour, titanium and zirconium are released from the solid solution in combination with dispersion strengthening due to the formation of intermetallic phases.
  • The nonlinear change in microhardness shows a peak in hardness in the treatment range of 320–500 °C and a decrease at 530 °C, which may be associated with the formation of nanoscale inclusions of intermetallic phases of the composition Al3 (Ti, Zr) inclusions with an L12 crystallographic structure and a subsequent increase in their size. This conclusion is consistent with the direct and inverse Hall–Petch law.
Further research will focus on studying the change in size and distribution of Al3 (Ti, Zr) intermetallic phases in thin-walled samples using electron microscopy and increasing the heat treatment time to study the change in the size of inclusions and their effect on the mechanical properties of thin-walled samples. In addition, the results of statistical analysis and the experimental data obtained will be used to construct models predicting mechanical properties based on the Monte Carlo method and neural networks.

Supplementary Materials

The following supporting information can be downloaded at: https://www.mdpi.com/article/10.3390/jmmp9110371/s1, Figure S1: Algorithm of statistical analysis of experimental results with verification of modeling results; Figure S2: Stress-strain diagrams of SLMed Al-Mn-Mg-Ti-Zr thin-walled samples after annealing at: (a) 290 °C; (b) 320 °C; (c) 350 °C; (d) 380 °C; (e) 410 °C; (f) 440 °C; (g) 470 °C; (h) 500 °C; (i) 530 °C; Figure S3: Surface roughness profiles of sandblasted samples before and after annealing in the range temperature of 260–530°C; Table S1: Tensile test results of Al-Mn-Mg-Ti-Zr thin-walled samples obtained by SLM; Table S2: Evaluation of the main surface roughness parameters of thin-walled specimens before and after heat treatment at temperatures from 290 °C to 530 °C; Table S3: Results of microhardness measurement of thin-walled specimens manufactured by SLM technology from Al-Mn-Mg-Ti-Zr material and heat-treated at temperatures from 260 °C to 530 °C; Table S4: Descriptive statistics of tensile tests experimental Data (values are rounded to the third decimal place); Table S5: Descriptive statistics of surface roughness experimental Data (values are rounded to the third decimal place); Table S6: Descriptive statistics of Vickers microhardness experimental Data (values are rounded to the third decimal place); Table S7: Abbreviations, Symbols and Nomenclature.

Author Contributions

Conceptualization, N.N.; methodology, N.N.; software, N.N., P.A.P. and A.S.; validation, R.K., N.W.S.P. and I.I.; formal analysis, N.N.; investigation, R.K., P.A.P. and A.S.; resources, I.I. and R.K.; data curation, N.N.; writing—original draft preparation N.N.; writing—review and editing N.N., N.W.S.P. and A.S.; visualization, P.A.P. and N.W.S.P.; supervision, N.N. and S.N.G.; project administration, T.V.T. and S.N.G.; funding acquisition, T.V.T. All authors have read and agreed to the published version of the manuscript.

Funding

The research was supported by the Russian Science Foundation (Grant Agreement No. 23-19-00334 dated 15 May 2023, https://rscf.ru/project/23-19-00334/) (accessed on 5 November 2025).

Data Availability Statement

All data are presented in the publication.

Conflicts of Interest

The authors declare no conflicts of interest.

Glossary

Symbol Abbreviation
Tannealing temperature, [°C]HV_1First series of Vickers microhardness measurement
EY Young’s modulus, [MPa]HV_2Second series of Vickers microhardness measurement
ETSecant modulus, [MPa]HV_3Third series of Vickers microhardness measurement
σ0.2Yield strength, [MPa]Criter.Criterion
σBultimate tensile strength, [MPa]Norm.Normal
εBtensile strain [%]LgNor.Log-Normal
ε0.2yield strain, [%]Log.Logistic
Raarithmetic average roughness, [μm]Exp.Exponential
RzTen-point Height of Irregularities, [μm]DKolmogorov–Smirnov parameter
RmaxMaximum Roughness Depth, [μm]Sample number

References

  1. ISO/ASTM 52900:2015 [ASTM F2792]; International Organization for Standardization. Additive Manufacturing-General Principles-Terminology. ISO: Geneva, Switzerland, 2015.
  2. Gibson, I.; Rosen, D.; Stucker, B. Additive Manufacturing Tecnologies. In 3D Printing, Rapid Prototyping and Direct Digital Manufacturing, 2nd ed.; Springer: New York, NY, USA, 2015; Volume 648. [Google Scholar] [CrossRef]
  3. Borgue, R. 3D printing: The dawn of a new era in manufacturing? Assem. Autom. 2013, 33, 307–311. [Google Scholar] [CrossRef]
  4. Tofail, S.A.M.; Koumoulos, E.P.; Bandyopadhyay, A.; Bose, S.; O’Donoghue, L.; Charitidis, C. Additive manufacturing: Scientific and technological challenges, market uptake and opportunities. Mater. Today 2018, 21, 22–37. [Google Scholar] [CrossRef]
  5. Lee, J.M.; Sing, S.L.; Zhou, M.M.; Yeong, W.Y. 3D bioprinting processes: A perspective on classification and terminology. Int. J. Bioprint. 2018, 4, 151. [Google Scholar] [CrossRef]
  6. DebRoy, T.; Wei, H.L.; Zuback, J.S.; Mukherjee, T.; Elmer, J.W.; Milewski, J.O.; Beese, A.M.; Wilson-Heid, A.; De, A.; Zhang, W. Additive manufacturing of metallic componentseprocess, structure and properties. Prog. Mater. Sci. 2018, 92, 112–224. [Google Scholar] [CrossRef]
  7. Haubrich, J.; Gussone, J.; Barriobero-Vila, P.; Kürnsteiner, P.; Jägle, E.A.; Raabe, D.; Schell, N.; Requena, G. The role of lattice defects, element partitioning and intrinsic heat effects on the microstructure in selective laser melted Ti-6Al-4V. Acta Mater. 2019, 167, 136–148. [Google Scholar] [CrossRef]
  8. Tian, Q. The development status of selective laser melting technology (SLM). J. Phys. Conf. Ser. 2021, 1798, 012045. [Google Scholar] [CrossRef]
  9. Kaufman, J.G. Properties of Aluminum Alloys: Tensile, Creep, and Fatigue Data at High and Low Temperatures; ASM International: Warren, MI, USA, 1999. [Google Scholar]
  10. Polmear, I.J.; Couper, M.J. Design and development of an experimental wrought aluminum alloy for use at elevated temperatures. Metall. Trans. A 1988, 19, 1027–1035. [Google Scholar] [CrossRef]
  11. Wang, G.S.; Liu, K.; Wang, S.L. Evolution of Elevated-Temperature Strength and Creep Resistance during Multi-Step Heat Treatments in Al-Mn-Mg Alloy. Materials 2018, 11, 1158. [Google Scholar] [CrossRef]
  12. Van Dalen, M.E.; Gyger, T.; Dunand, D.C.; Seidman, D.N. Effects of Yb and Zr microalloying additions on the microstructure and mechanical properties of dilute Al–Sc alloys. Acta Mater. 2011, 59, 7615–7626. [Google Scholar] [CrossRef]
  13. Lai, J.; Zhang, Z.; Chen, X.-G. The thermal stability of mechanical properties of Al–B4C composites alloyed with Sc and Zr at elevated temperatures. Mater. Sci. Eng. A 2012, 532, 462–470. [Google Scholar] [CrossRef]
  14. Farkoosh, A.R.; Grant Chen, X.; Pekguleryuz, M. Dispersoid strengthening of a high temperature Al–Si–Cu–Mg alloy via Mo addition. Mater. Sci. Eng. A 2015, 620, 181–189. [Google Scholar] [CrossRef]
  15. Liu, K.; Ma, H.; Chen, X.-G. Enhanced elevated-temperature properties via Mo addition in Al-Mn-Mg 3004 alloy. J. Alloys Compd. 2017, 694, 354–365. [Google Scholar] [CrossRef]
  16. Mikhaylovskaya, A.V.; Portnoy, V.K.; Mochugovskiy, A.G.; Zadorozhnyy, M.Y.; Tabachkova, N.Y.; Golovin, I.S. Effect of homogenisation treatment on precipitation, recrystallisation and properties of Al–3% Mg–TM alloys (TM = Mn, Cr, Zr). Mater. Design 2016, 109, 197–208. [Google Scholar] [CrossRef]
  17. Engler, O.; Liu, Z.; Kuhnke, K. Impact of homogenization on particles in the Al–Mg–Mn alloy AA 5454–Experiment and simulation. J. Alloys Compd. 2013, 560, 111–122. [Google Scholar] [CrossRef]
  18. Radetić, T.; Popović, M.; Romhanji, E. Microstructure evolution of a modified AA5083 aluminum alloy during a multistage homogenization treatment. Mater. Charact. 2012, 65, 16–27. [Google Scholar] [CrossRef]
  19. Engler, O.; Miller-Jupp, S. Control of second-phase particles in the Al-Mg-Mn alloy AA 5083. J. Alloys Compd. 2016, 689, 998–1010. [Google Scholar] [CrossRef]
  20. Engler, O.; Kuhnke, K.; Hasenclever, J. Development of intermetallic particles during solidification and homogenization of two AA 5xxx series Al-Mg alloys with different Mg contents. J. Alloys Compd. 2017, 728, 669–681. [Google Scholar] [CrossRef]
  21. Cadek, J. Creep in precipitation- and dispersion-strengthened alloys (a review). Met. Mater. 1991, 29, 385–398. [Google Scholar]
  22. Knipling, K.E.; Dunand, D.C.; Seidman, D.N. Criteria for developing castable, creep-resistant aluminum-based alloys—A review. Int. J. Mater. Res. 2022, 97, 246–265. [Google Scholar] [CrossRef]
  23. Zhu, A.W.; Gable, B.M.; Shiflet, G.J.; Starke, E.A., Jr. The Intelligent Design of High Strength, Creep-Resistant Aluminum Alloys. MSF 2002, 396–402, 21–30. [Google Scholar] [CrossRef]
  24. Knipling, K.E.; Dunand, D.C. Creep resistance of cast and aged Al–0.1 Zr and Al–0.1 Zr–0.1 Ti (at.%) alloys at 300–400 °C. Scr. Mater. 2008, 59, 387–390. [Google Scholar] [CrossRef]
  25. Krug, M.E.; Dunand, D.C. Modeling the creep threshold stress due to climb of a dislocation in the stress field of a misfitting precipitate. Acta Mater. 2011, 59, 5125–5134. [Google Scholar] [CrossRef]
  26. Marquis, E.A.; Dunand, D.C. Model for creep threshold stress in precipitation-strengthened alloys with coherent particles. Scr. Mater. 2002, 47, 503–508. [Google Scholar] [CrossRef]
  27. Kittel, C.; McEuen, P. Introduction to Solid State Physics; Global, Ed.; John Wiley & Sons: Hoboken, NJ, USA, 2018; 720p. [Google Scholar]
  28. Abuzin, Y.A.; Nikitin, N.Y. Determination of promising areas of research in the field of aluminum-based alloys using the electronic theory of metals. Non-Ferr. Met. 2012, 4, 74–77. [Google Scholar]
  29. Nikitin, N.Y. A first-principles investigation of the effect of relaxation on the alloy formation in the aluminum-3d-transition-metal system. Phys. Met. Metallogr. 2012, 113, 427–437. [Google Scholar] [CrossRef]
  30. Huang, H.; Huang, Y.; Zhang, H. Dissolution and Precipitation Behavior of the γ′ Phase During Heat Treatment of the Nickel-Based High-Temperature Alloy K444. JOM 2025, 77, 7655–7667. [Google Scholar] [CrossRef]
  31. Grigoriev, S.; Nikitin, N.; Yanushevich, O.; Krikheli, N.; Khmyrov, R.; Strunevich, D.; Soloninkin, M.; Pinargote, N.W.S.; Peretyagin, P.; Smirnov, A. Mechanical properties variation of samples fabricated by fused deposition additive manufacturing, as a function of filler percentage and structure for different plastics. Sci. Rep. 2024, 14, 28344. [Google Scholar] [CrossRef]
  32. Nandhakumar, R.; Venkatesan, K. A process parameters review on selective laser melting-based additive manufacturing of single and multi-material: Microstructure, physical properties, tribological, and surface roughness. Mater. Today Comm. 2023, 35, 105538. [Google Scholar] [CrossRef]
  33. Pal, S.; Drstvensek, I.; Brajlih, T. Physical Behaviors of Materials in Selective Laser Melting Process, Chapter 21. In DAAAM International Scientific Book; Katalinic, B., Ed.; DAAAM International: Vienna, Austria, 2018; pp. 239–256. [Google Scholar] [CrossRef]
  34. Zhang, X.; Yocom, C.J.; Mao, B.; Liao, Y. Microstructure evolution during selective laser melting of metallic materials: A review. J. Laser Appl. 2019, 31, 031201. [Google Scholar] [CrossRef]
  35. Li, R.; Shi, Y.; Wang, Z.; Wang, L.; Liu, J.; Jiang, W. Densification behavior of gas and water atomized 316L stainless steel powder during selective laser melting. Appl. Surf. Sci. 2010, 256, 4350–4356. [Google Scholar] [CrossRef]
  36. Eos. info. Available online: https://www.eos.info/var/assets/03_system-related-assets/material-related-contents/metal-materials-and-examples/metal-material-datasheet/titan/ti64/eos_ti64_9011-0014_9011-0039_m290_mds_06-22_en.pdf (accessed on 17 October 2025).
  37. Agile-Manufacturing.com. Available online: https://agile-manufacturing.com/wp-content/uploads/2017/11/aluminum.pdf (accessed on 17 October 2025).
  38. Grigoriev, S.N.; Nikitin, N.; Yanushevich, O.; Kriheli, N.; Kramar, O.; Khmyrov, R.; Idarmachev, I.; Peretyagin, P. Experimental and Statistical Analysis of the Effect of Heat Treatment on Surface Roughness and Mechanical Properties of Thin-Walled Samples Obtained by Selective Laser Melting from the Material AlSi10Mg. Materials 2023, 16, 7326. [Google Scholar] [CrossRef]
  39. DIN 50125; Testing of Metallic Materials—Tensile Pieces. DIN Standards Committee for Materials Testing (NMP): Berlin, Germany, 2016.
  40. Liu, C.; Liu, T.; Wang, T.; Liu, W.; Ma, Y. Effects of heat treatment on the microstructure and properties of graded-density powder aluminum alloys. Metal Sci. Heat Treat. 2022, 63, 590–598. [Google Scholar] [CrossRef]
  41. Kammer, C. Aluminum and aluminum alloys. In Springer Handbook of Materials Data, 2nd ed.; Warlimont, H., Martienssen, W., Eds.; Springer International Publishing: New York, NY, USA, 2018; pp. 161–197. [Google Scholar]
  42. Snopiński, P.; Woźniak, A.; Pagáč, M. Microstructural Evolution, Hardness, and Strengthening Mechanisms in SLM AlSi10Mg Alloy Subjected to Equal-Channel Angular Pressing (ECAP). Materials 2021, 14, 7598. [Google Scholar] [CrossRef]
  43. ASTM E92-17; Standard Test Methods for Vickers Hardness and Knoop Hardness of Metallic Materials. ASTM International: West Conshohocken, PA, USA, 2017.
  44. Shelekhov, E.V.; Sviridova, T.A. Programs for X-ray analysis of polycrystals. Metal Sci. Heat Treat. 2000, 42, 309–313. [Google Scholar] [CrossRef]
  45. Grazulis, S.; Chateigner, D.; Downs, R.T.; Yokochi, A.T.; Quiros, M.; Lutterotti, L.; Manakova, E.; Butkus, J.; Moeck, P.; Bail, A. Crystallography open database an open-accesscollection of crystal structures. J. Appl. Cryst. 2009, 42, 726–729. [Google Scholar] [CrossRef]
  46. Beyer, H. Tukey, John W.: Exploratory Data Analysis. Addison-Wesley Publishing Company Reading, Mass.—Menlo Park, Cal., London, Amsterdam, Don Mills, Ontario, Sydney 1977, XVI, 688 S. Biom. J. 1981, 23, 413–414. [Google Scholar] [CrossRef]
  47. Rossi, R.J. Mathematical Statistics: An Introduction to Likelihood Based Inference; John Wiley & Sons: Hoboken, NJ, USA, 2018; 422p. [Google Scholar] [CrossRef]
  48. Akaike, H. On entropy maximization principle. In Applications of Statistics; Krishnaiah, P.R., Ed.; North-Holland: Amsterdam, The Netherlands, 1977; p. 27. [Google Scholar]
  49. Sakamoto, Y.; Ishiguro, M.; Kitagawa, G. Akaike Information Criterion Statistics; D. Reidel: Dordrecht, The Netherlands, 1983. [Google Scholar]
  50. Neath, A.A.; Cavanaugh, J.E. The Bayesian information criterion: Background, derivation, and applications. Wiley Interdiscip. Rev. Comput. Stat. 2012, 4, 199–203. [Google Scholar] [CrossRef]
  51. Schwarz, G. Estimating the dimension of a model. Ann. Stat. 1978, 6, 461–464. [Google Scholar] [CrossRef]
  52. Shapiro, S.S.; Wilk, M.B. An analysis of variance test for normality. Biom. Trust 1965, 52, 591–611. [Google Scholar] [CrossRef]
  53. D’agostino, R.B.; Pearson, E.S. Tests for Departure from Normality. Empirical Results for the Distributions of b2 and √b1. Biometrika 1973, 60, 613–622. [Google Scholar] [CrossRef]
  54. Kolmogorov, A.N. Sulla determinazione empirica di une legge di distribuzione. G. Ist. Ital. Attuari 1933, 4, 83–91. [Google Scholar]
  55. Anderson, T.W. On the Distribution of the Two-Sample Cramer-von Mises Criterion. Ann. Math. Statist. 1962, 33, 1148–1159. [Google Scholar] [CrossRef]
  56. Araújo-Neto, V.G.; Sebold, M.; Castro, E.F.; Feitosa, V.P.; Giannini, M. Evaluation of physico-mechanical properties and filler particles characterization of conventional, bulk-fill, and bioactive resin-based composites. J. Mech. Behav. Biomed. Mater. 2021, 115, 104288. [Google Scholar] [CrossRef]
  57. Kruskal, W.H.; Wallis, W.A. Use of ranks in one-criterion variance analysis. J. Am. Stat. Assoc. 1952, 47, 583–621. [Google Scholar] [CrossRef]
  58. Dunnett, C.W. New tables for multiple comparisons with a control. Biometrics 1964, 20, 482–491. [Google Scholar] [CrossRef]
  59. Bonferroni, C.E. Teoria Statistica Delle Classi e Calcolo Delle Probabilità; Pubblicazioni del R Istituto Superiore di Scienze Economiche e Commerciali di Firenze: Florence, Italy, 1936. [Google Scholar]
  60. Nielsen, F. Introduction to HPC with MPI for Data Science; Springer: New York, NY, USA, 2016. [Google Scholar]
  61. Pearson, K. VII. Note on regression and inheritance in the case of two parents. Proc. R. Soc. Lond. 1895, 58, 240–242. [Google Scholar] [CrossRef]
  62. Spearman, C. The proof and measurement of association between two things. In Studies in Individual Differences: The Search for Intelligence; Jenkins, J.J., Paterson, D.G., Eds.; Appleton-Century-Crofts: New York, NY, USA, 1961; pp. 45–58. [Google Scholar] [CrossRef]
  63. Evans, J.D. Straightforward Statistics for the Behavioral Sciences; Thomson Brooks/Cole Publishing Co.: Pacific Grove, CA, USA, 1996. [Google Scholar]
  64. Grigoriev, S.N.; Nikitin, N.Y.; Frolov, A.; Shapovalov, P.; Medeltsev, A.; Voronov, M.; Khmyrov, R.; Idarmachev, I.; Peretyagin, P. Modeling of Tensile Stress Distribution Considering Anisotropy of Mechanical Properties of Thin-Walled AlSi10Mg Samples Obtained by Selective Laser Melting. J. Manuf. Mater. Process. 2024, 8, 235. [Google Scholar] [CrossRef]
  65. Lu, C.; Danzer, R.; Fischer, F.D. Fracture statistics of brittle materials: Weibull or normal distribution. Phys. Rev. E 2002, 65, 067102. [Google Scholar] [CrossRef]
  66. Waqar, S.; Guo, K.; Sun, J. Evolution of residual stress behavior in selective laser melting (SLM) of 316L stainless steel through preheating and in-situ re-scanning techniques. Opt. Laser Technol. 2022, 149, 107806. [Google Scholar] [CrossRef]
  67. Weibull, W. Fatigue Testing and Analysis of Results; Pergamon Press: New York, NY, USA, 1961; p. 236. [Google Scholar]
  68. Razumovskiy, V.I.; Ruban, A.V.; Razumovskii, I.M.; Lozovoi, A.Y.; Butrim, V.N.; Vekilov, Y.K. The effect of alloying elements on grain boundary and bulk cohesion in aluminum alloys: An ab initio study. Scr. Mater. 2011, 65, 926–929. [Google Scholar] [CrossRef]
  69. Razumovskiy, V.I.; Razumovskii, I.M.; Ruban, A.V.; Butrim, V.N.; Vekilov, Y.K. The influence of alloying elements on grain boundary and bulk cohesion in aluminum alloys: Ab initio study. Adv. Mater. Res. 2012, 409, 417–422. [Google Scholar] [CrossRef]
  70. Razumovskiy, V.I.; Vekilov, Y.K.; Razumovskii, I.M.; Ruban, A.V.; Butrim, V.N.; Mironenko, V.N. Effect of alloying elements and impurities on interface properties in aluminum alloys. Phys. Solid State 2011, 53, 2189–2193. [Google Scholar] [CrossRef]
  71. Spierings, A.B.; Dawson, K.; Kern, K.; Palm, F.; Wegener, K. SLM-processed Sc- and Zr- modified Al-Mg alloy: Mechanical properties and microstructural effects of heat treatment. Mater. Sci. Eng. A 2017, 701, 264–273. [Google Scholar] [CrossRef]
  72. Sun, Y.; Wang, J.; Shi, Y.; Fei, Q.; Zhao, N.; Ni, C.; Wu, J.; Dong, Y.; Dai, T.; Ding, H.; et al. An SLM-processed Er-and Zr-modified Al–Mg alloy: Microstructure and mechanical properties at room and elevated temperatures. Mater. Sci. Eng. A 2023, 883, 145485. [Google Scholar] [CrossRef]
  73. Bharat, B.; Nosonovsky, M. Scale effect in mechanical properties and tribology. In Nanotribology and Nanomechanics: An Introduction; Springer International Publishing: New York, NY, USA, 2017; pp. 549–589. [Google Scholar]
  74. Kempf, A.; Hilgenberg, K. Influence of heat treatments on AlSi10Mg specimens manufactured with different laser powder bed fusion machines. Mater. Sci. Eng. A 2021, 818, 141371. [Google Scholar] [CrossRef]
  75. Mertens, A.; Delahaye, J.; Dedry, O.; Vertruyen, B.; Tchuindjang, J.T.; Habraken, A.M. Microstructure and properties of SLM AlSi10Mg: Under-standing the influence of the local thermal history. Procedia Manuf. 2020, 47, 1089–1095. [Google Scholar] [CrossRef]
  76. Maamoun, A.H.; Elbestawi, M.; Dosbaeva, G.K.; Veldhuis, S.C. Thermal post-processing of AlSi10Mg parts produced by Selective Laser Melting using recycled powder. Addit. Manuf. 2018, 21, 234–247. [Google Scholar] [CrossRef]
  77. Naik, S.N.; Stephen, M.W. The Hall–Petch and inverse Hall–Petch relations and the hardness of nanocrystalline metals. J. Mater. Sci. 2020, 55, 2661–2681. [Google Scholar] [CrossRef]
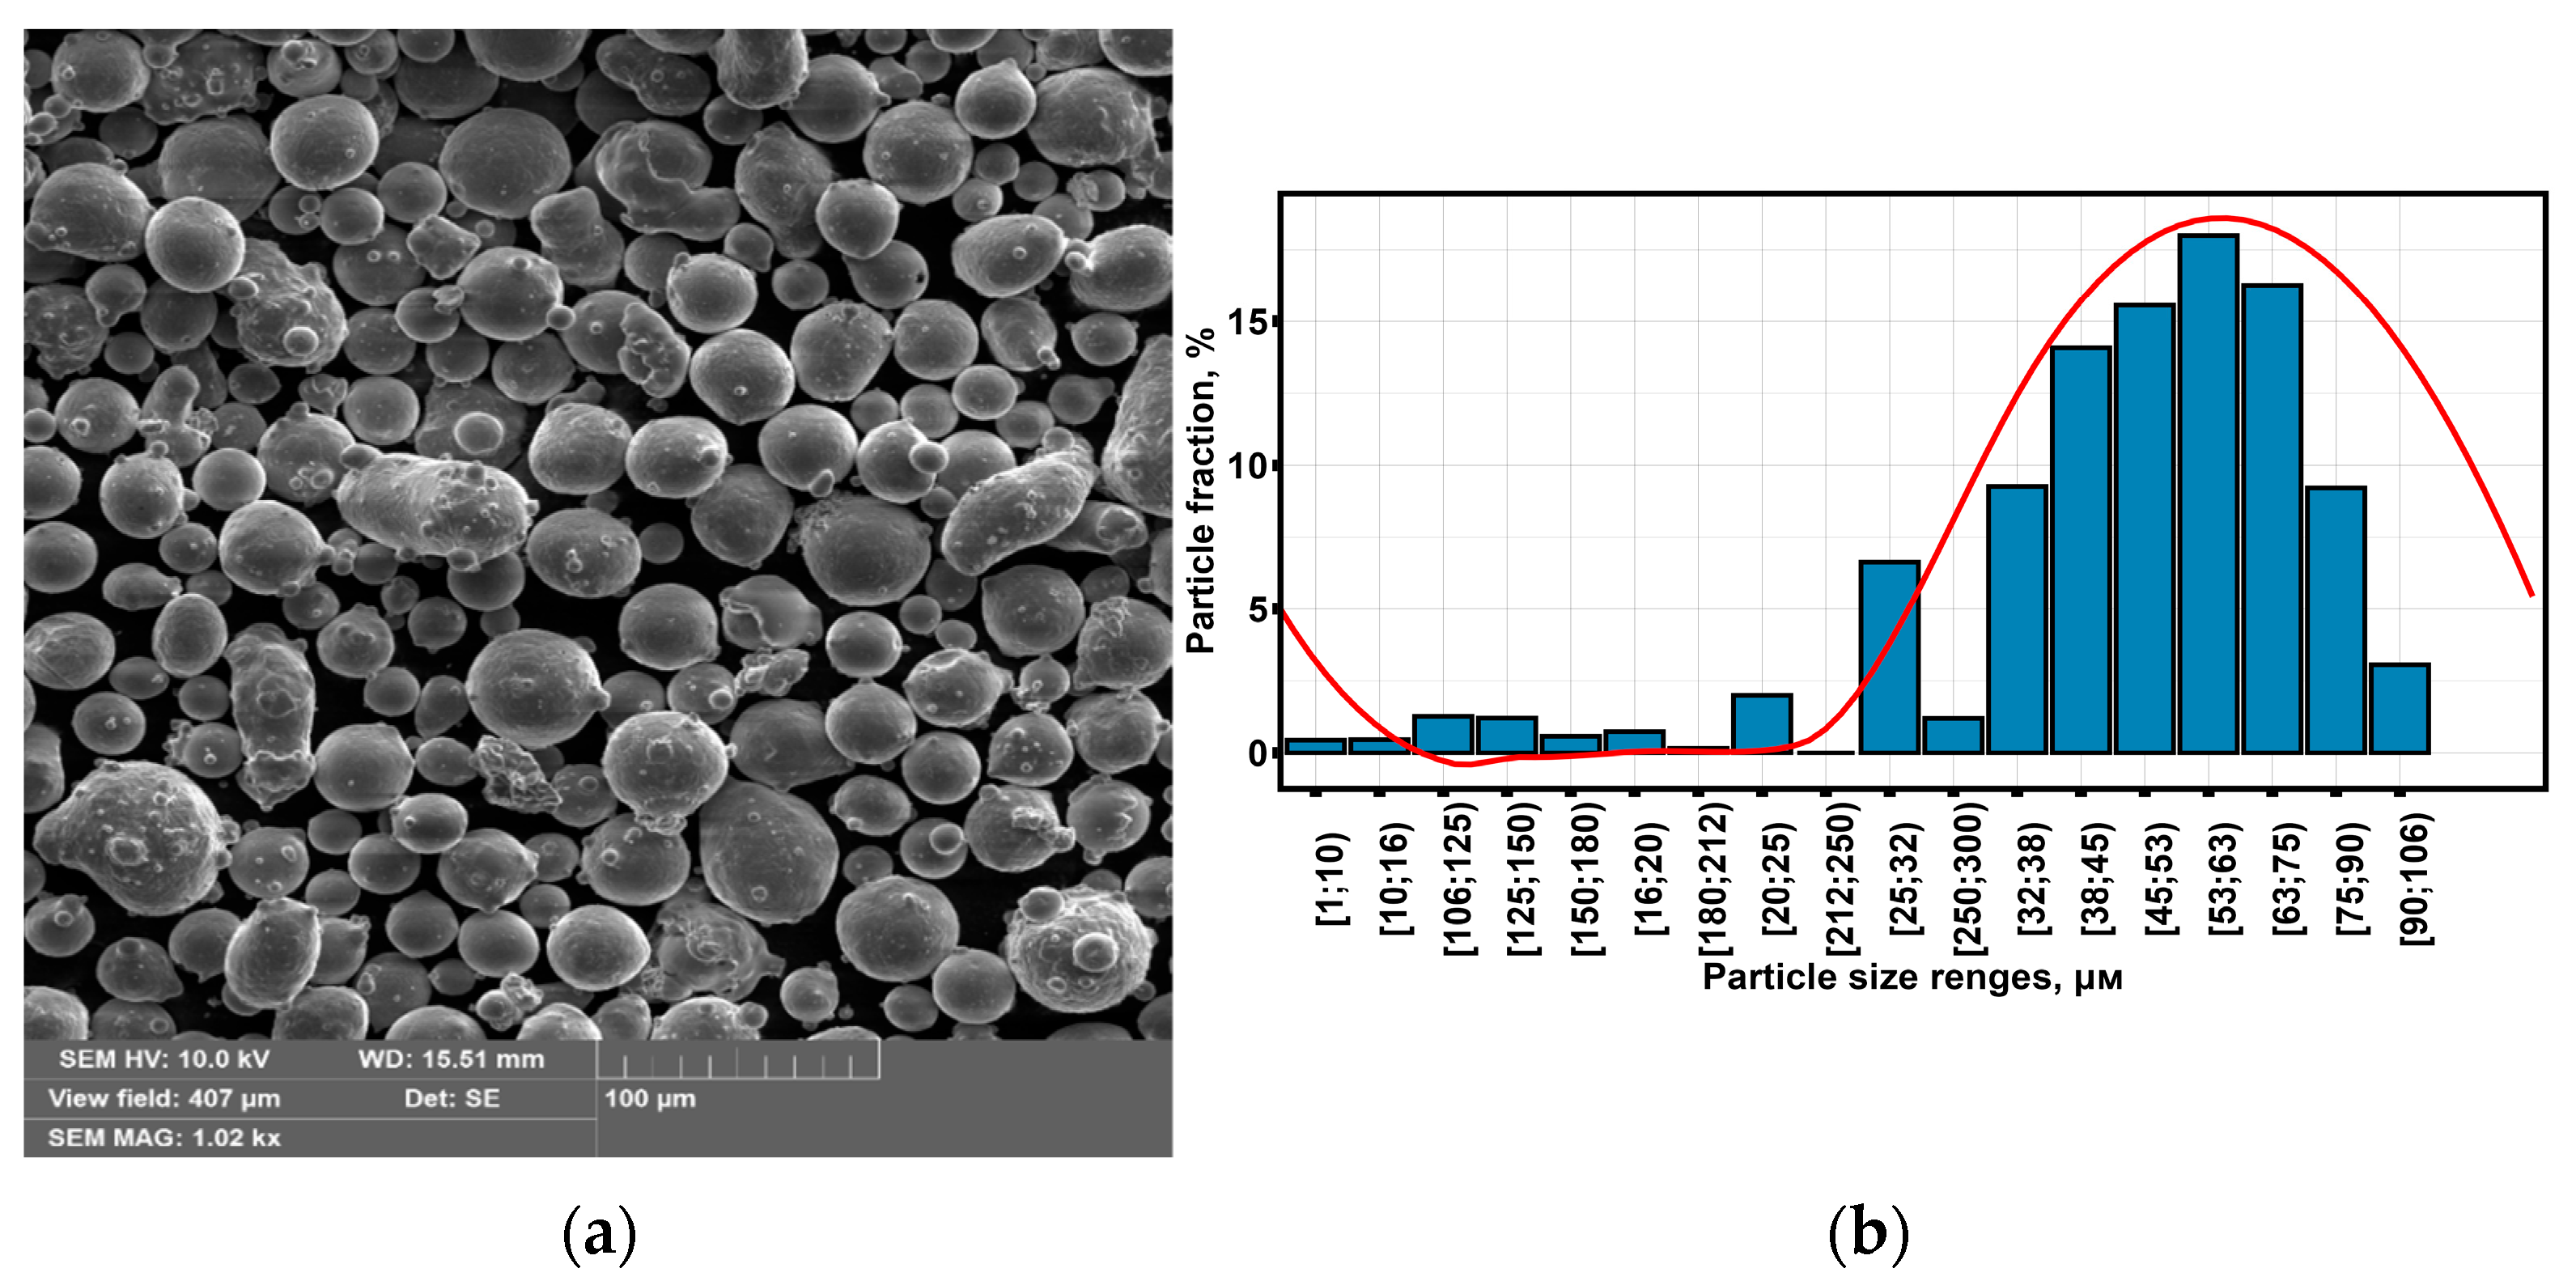
Figure 1. (a) SEM image of the initial powder. (b) Particle size distribution.
Jmmp 09 00371 g001
Figure 2. Thin-walled sample: (a) model with sizes in mm and (b) the arrangement of the thin walls on the substrate plate.
Jmmp 09 00371 g002
Figure 3. Schematic representation of the SLM printing direction and the viewing direction.
Jmmp 09 00371 g003
Figure 4. SEM images of samples’ microstructure without annealing (A,B) and after annealing at 290 °C (C,D).
Jmmp 09 00371 g004
Figure 5. XRD patterns of samples: (A,B) without annealing and (C) after annealing at 290 °C.
Jmmp 09 00371 g005
Figure 6. Microstructure images of samples after annealing at 410 °C (A,B) and 470 °C (C,D).
Jmmp 09 00371 g006
Figure 7. X-ray diffraction patterns of samples after annealing at (A) 410 °C and (B) 470 °C.
Jmmp 09 00371 g007
Figure 8. Microstructure of the sample after annealing at 530 °C: (A,B) image obtained using SEM.
Jmmp 09 00371 g008
Figure 9. XRD patterns of samples (№1 (A) and №3 (B)) after annealing at 530 °C.
Jmmp 09 00371 g009
Figure 10. Schematic representation of the sample position in the clamps, the direction of force application during tensile testing, and the direction of sample printing.
Jmmp 09 00371 g010
Figure 11. Tensile testing: (a) some thin-walled samples after test and stress–strain diagrams of samples (b) before and (c) after annealing at 260 °C.
Jmmp 09 00371 g011
Figure 12. Dependence of the tensile tests’ experimental data on the annealing temperature: (a) EY; (b) ET; (c) σ0.2; (d) σB; (e) ε0.2, and (f) εB.
Jmmp 09 00371 g012aJmmp 09 00371 g012b
Figure 13. Dependence of the experimental data on the annealing temperature of (a) Vickers microhardness; (b) Ra; (c) Rz; (d) Rmax.
Jmmp 09 00371 g013
Figure 14. Dependence of strain-hardening coefficient on heat treatment temperature SLMed Al-Mn-Mg-Ti-Zr thin-walled samples.
Jmmp 09 00371 g014
Figure 15. Dependence of the average statistical power of Shapiro–Wilk (violet line), D’Agostino (green line), Kolmogorov–Smirnov (blue line), and Anderson–Darling (red line) criteria on the number of trials during testing for the compliance with the normal distribution of yield strength values for the (a) log-normal; (b) logistic; (c) Gamma; (d) Weibull; (e) Gumbel.
Jmmp 09 00371 g015
Figure 16. Behavior of central parameters selected based on correlation graph analysis in selected groups: (a) Change in hardness (HV); (b) Change in strain-hardening coefficient; (c) Change in Rz after heat treatment; (d) Change in Young’s modulus (EY).
Jmmp 09 00371 g016
Table 1. Chemical composition of the raw powder for the thin-walled samples.
Measurement SeriesElement Content, % wt.
AlMnMgZrTi
194.343.042.390.140.09
293.973.532.270.110.12
393.613.782.410.090.11
Table 2. Parameters set and recommended by the equipment manufacturer.
Laser Power, WSpot Diameter, μmScan Speed, mm/sAverage Particle Size, μmThickness Layer, μmAtmospherePlatform Temperature, °C
400100~70009020Argon35
Table 3. Steps, abrasives, and time used for metallographic preparation.
StepAbrasiveTime, min
GrindingSiC (sanding paper 180P)1
SiC (sanding paper 800P)1
SiC (sanding paper 1200P)1
PolishingDiamond paste slurry: 9 MKM4
Diamond paste slurry: 3 MKM3
Diamond paste slurry: 1 MKM2
Chemical etchingKeller’s reagent
Table 4. Tensile test results of Al-Mn-Mg-Ti-Zr thin-walled samples obtained by SLM.
TEYETσ0.2σBεBε0.2
-12,776.500
±3295.888
15,083.680
±2009.623
66.869
±5.114
69.877
±5.126
0.803
±0.410
0.466
±0.096
26012,816.200
±844.506
15,693.180
±362.379
68.457
±1.486
73.030
±1.513
0.861
±0.282
0.449
±0.021
29013,830.600
±390.981
15,955.300
±272.271
70.061
±1.477
72.434
±2.111
0.940
±0.366
0.515
±0.058
32012,624.810
±483.839
15,617.230
±289.902
61.270
±0.640
67.857
±0.332
0.473
±0.034
0.367
±0.013
35014,009.450
±1156.348
16,189.620
±1051.402
64.449
±2.078
69.284
±3.338
0.495
±0.075
0.392
±0.015
38012,269.020
±210.441
15,493.390
±313.333
62.523
±1.922
69.801
±3.623
0.618
±0.192
0.387
±0.010
41011,524.460
±283.668
14,770.560
±396.665
61.451
±1.321
67.956
±2.370
0.467
±0.031
0.369
±0.012
44012,202.780
±429.954
15,636.570
±409.780
64.761
±1.104
72.798
±0.870
0.659
±0.144
0.396
±0.015
47011,721.180
±504.737
15,091.690
±752.384
62.704
±1.778
68.182
±2.777
0.461
±0.064
0.375
±0.013
50010,789.990
±1408.964
14,600.230
±1516.584
61.079
±1502
68.994
±1844
0.463
±0.027
0.357
±0.012
53011,727.070
±424.822
15,145.230
±383.635
57.068
±1.895
64.107
±2.835
0.410
±0.030
0.330
±0.014
Table 5. Main surface roughness parameters of samples before and after annealing.
TBefore Annealing, μmAfter Annealing, μm
RaRzRmaxRaRzRmax
26014.408
±0.971
93.559
±9.990
111.892
±8.094
13.185
±1.471
87.780
±9.264
108.369
±22.602
29014.105
±2.894
93.074
±13.879
110.716
±13.960
13.938
±1.706
91.890
±11.111
114.843
±11.632
32014.645
±1.528
91.271
±6.353
117.631
±16.349
14.309
±1.513
91.408
±8.681
108.221
±11.031
35015.061
±1.464
97.751
±10.108
114.300
±11.022
14.284
±1.027
92.960
±9.054
113.142
±17.563
38015.402
±1.269
96.658
±7.386
120.633
±12.498
15.225
±1.967
93.548
±12.394
121.983
±28.169
41015.293
±0.769
95.954
±4.055
119.123
±12.900
15.444
±1.476
96.056
±9.410
118.419
±18.536
44013.728
±1.574
90.125
±10.612
117.430
±17.373
15.357
±0.806
97.466
±6.698
118.456
±12.875
47013.997
±1.346
95.423
±5.493
123.366
±11.815
14.487
±1.800
100.425
±11.656
119.877
±12.952
50014.108
±0.953
98.126
±9.591
116.231
±14.169
13.903
±1.686
89.612
±12.520
109.916
±13.766
53014.198
±1.286
96.750
±11.517
119.667
±15.311
14.228
±0.704
93.777
±4.160
112.182
±8.903
Table 6. Mean values and their standard deviation of Vickers microhardness of samples before and after annealing.
THV_1HV_2HV_3
-109.923 ± 7.852108.120 ± 13.070109.595 ± 10.934
260107.970 ± 6.659112.833 ± 6.042109.900 ± 4.021
290113.433 ± 5.366111.933 ± 6.659117.200 ± 7.194
320120.567 ± 7.887119.383 ± 5.626124.267 ± 5.133
350130.117 ± 10.974134.300 ± 16.065135.450 ± 18.544
380133.367 ± 11.303132.150 ± 11.454130.717 ± 11.199
410135.417 ± 12.979133.583 ± 14.617129.683 ± 13.406
440137.950 ± 3.348135.850 ± 5.000138.350 ± 3.662
470130.483 ± 13.691130.383 ± 6.406136.050 ± 5.852
500133.967 ± 10.129142.367 ± 11.3945140.767 ± 11.890
530111.650 ± 8.918112.450 ± 7.748112.818 ± 7.113
Table 7. Analysis of the closest distribution law by Akaike and Bayesian criteria.
ParameterCriter.Distribution Law
Norm.LgNor.Log.GammaWeibullExp.GumbelCauchy
EYAkaike543.022546.942539.581545.189546.899770.173561.671550.118
Bayes547.401551.322543.960549.568551.278772.362566.050554.497
ETAkaike487.725492.355478.043490.666487.627798.782519.767482.978
Bayes492.104496.734482.423495.045492.007800.971524.146487.357
σ0.2Akaike376.311375.531378.407375.713385.520682.351380.241398.717
Bayes380.690379.911382.786380.093389.900684.540384.620403.097
σBAkaike357.990359.246361.612358.778356.914693.824373.096392.362
Bayes362.369363.625365.999363.157361.294696.014377.475396.741
ε0.2Akaike−176.865−191.149−188.262−186.863−157.17313.121−205.074−196.006
Bayes−172.486−186.770−183.882−182.484−152.79315.311−200.695−191.627
εBAkaike11.803−24.1682.234−14.0184.10067.544−26.774−31.021
Bayes16.182−19.7896.613−9.6398.47969.734−22.394−26.642
HV_1Akaike539.507538.563542.762538.660545.670770.359541.664568.507
Bayes543.887542.942547.142543.040550.049772.548546.043572.887
HV_2Akaike546.838546.405550.042546.297552.062771.179550.850577.117
Bayes551.218550.784554.421550.676556.441773.369555.230581.497
HV_3Akaike543.861542.396545.455542.613553.211772.274545.954572.888
Bayes548.241546.776549.835546.992557.590774.464550.333577.267
Ra *Akaike239.457242.814239.040241.443241.777486.966256.755261.134
Bayes243.836247.194243.420245.822246.157489.156261.135265.513
Ra **Akaike241.394243.092240.343242.265246.914486.481254.274258.246
Bayes245.773247.471244.722246.644251.293488.671258.654262.625
Rz *Akaike479.917479.245481.351479.281488.437734.804485.079506.335
Bayes484.296483.624485.730483.661492.817736.994489.458510.714
Rz **Akaike489.237487.736491.981488.052497.673733.049489.731517.015
Bayes493.617492.115496.360492.431502.053735.239494.111521.395
Rmax *Akaike529.931528.558533.977528.815536.285762.389530.644561.836
Bayes534.311532.937538.356533.194540.664764.578535.024566.215
Rmax **Akaike555.467550.152555.052551.536568.393759.734548.390577.165
Bayes559.846554.531559.431555.915572.772761.924552.770581.544
*: Before annealing; **: After annealing; The minimum values are in bold.
Table 8. Results of testing the conformity of the law of distribution of experimental data to the normal law of distribution by the Kolmogorov–Smirnov criterion.
ParameterKolmogorov–Smirnov Statistics
p-ValueD *
EY<0.00000011.000
ET<0.00000011.000
σ0.2<0.00000011.000
σB<0.00000011.000
ε0.2<0.00000010.624
εB<0.00000010.641
HV_1<0.00000011.000
HV_2<0.00000011.000
HV_3<0.00000011.000
Ra *<0.00000011.000
Ra **<0.00000011.000
Rz *<0.00000011.000
Rz **<0.00000011.000
Rmax *<0.00000011.000
Rmax **<0.00000011.000
*: Before annealing; **: After annealing.
Table 9. Results of non-parametric analysis by Kruskal–Wallis test with Dunn’s criterion and Bonferroni multiple comparison correction (only groups with statistically significant differences are presented).
ParameterComparable Groupsp-Value
EY290–410 °C0.0106
350–410 °C0.0150
290–500 °C0.0078
350–500 °C0.0112
ET290–410 °C 0.0489
σ0.2290–320 °C1.261 × 10−2
290–410 °C1.897 × 10−2
290–500 °C9.948 × 10−3
20–530 °C6.915 × 10−3
260–530 °C1.855 × 10−4
290–530 °C1.889 × 10−5
440–530 °C1.690 × 10−2
σB260–530 °C0.003
290–530 °C0.010
440–530 °C0.003
ε0.2290–320 °C1.219 × 10−2
290–410 °C3.416 × 10−2
20–500 °C3.610 × 10−2
260–500 °C4.459 × 10−3
290–500 °C4.831 × 10−4
20–530 °C2.208 × 10−3
260–530 °C1.910 × 10−4
290–530 °C1.474 × 10−5
εB260–530 °C0.001
290–530 °C0.001
440–530 °C0.013
HV_1260–410 °C0.037
20–440 °C0.011
260–440 °C0.004
290–440 °C0.041
260–500 °C0.046
440–530 °C0.031
HV_220–500 °C0.010
260–500 °C0.024
290–500 °C0.030
500–530 °C0.021
HV_320–440 °C0.023
260–440 °C0.009
260–470 °C0.021
20–500 °C0.021
260–500 °C0.008
500–530 °C0.046
Table 10. Hierarchical clustering of parameter samples by annealing temperature.
Group 1Group 2Group 3
T, °CT, °CT, °C
120220620
43803201320
45004202320
15305203320
253012604320
353022605320
453032606320
553042603350
653052604350
------62605350
------12906350
------22901380
------32902380
------42903380
------52905380
------62906380
------13501410
------23502410
------14403410
------24704410
------------5410
------------6410
------------1470
------------3470
------------4470
------------5470
------------6470
------------1500
------------2500
------------3500
------------5500
------------6500
Table 11. Comparison of some mechanical properties of aluminum alloys with the mechanical properties of thin-walled samples obtained using SLM technology from Al-Mn-Mg-Ti-Zr alloy.
AlloyYS, MPaTS, MPaEY, GPa
Al-Mn-Mg-Ti-Zr for a temperature of 530 °C for 1 h (thin-walled < 500 μm)57.068 ± 1.89564.107 ± 2.83511.727± 0.424
AlSi10Mg for a temperature of 440 °C and a time of 1 h (<500 μm) [38]106.627 ± 2.314167.986 ± 4.032---
Al-Mg alloyed with Sc and Zr [69]482.000 ± 4.100 (493.000 ± 13.000)523.000 ± 18.600 (547.000 ± 4.600)76.200 ± 1.700 (74.900 ± 1.200)
Al-Mg alloyed with Er and Zr [70]70.000 (62.000)107.000 (102.000)24.500 (28.400)
Disclaimer/Publisher’s Note: The statements, opinions and data contained in all publications are solely those of the individual author(s) and contributor(s) and not of MDPI and/or the editor(s). MDPI and/or the editor(s) disclaim responsibility for any injury to people or property resulting from any ideas, methods, instructions or products referred to in the content.