Article

Study on the Layered Structure of Ceramic-Side Bonding Area and the Mechanical Property of Al2O3–Kovar Brazed Joint with Ag-Cu-Ti Filler

1
State Key Laboratory of Clean and Efficient Turbomachinery Power Equipment, Department of Mechanical Engineering, Tsinghua University, Beijing 100084, China
2
Vicvac Electronics Technology Co., Ltd., Changzhou 213018, China
*
Authors to whom correspondence should be addressed.
J. Manuf. Mater. Process. 2025, 9(11), 355; https://doi.org/10.3390/jmmp9110355
Submission received: 19 September 2025 / Revised: 23 October 2025 / Accepted: 27 October 2025 / Published: 29 October 2025
(This article belongs to the Special Issue Advances in Welding Technology: 2nd Edition)

Abstract

During active brazing of alumina ceramics, active elements react with the ceramic to form a reaction layer, which has significant influence on the mechanical property of the brazed joint. However, the composition and formation mechanism of this layer remain unclear among researchers. To fill this gap, different brazing temperatures (900–1100 °C) and heating rates (2.5 °C/min and 10 °C/min) were used to braze 95% Al2O3 ceramics and a Kovar 4J34 alloy using a Ag-Cu-2Ti active brazing filler, and the microstructure and mechanical properties of the joints were investigated. The results show that the joint could be divided into five layers: Al2O3, ceramic-side reaction layer, filler layer, Kovar-side reaction layer, and Kovar. The ceramic-side reaction layer could be further divided into a Ti-O-rich layer and an intermetallics (IMC)-rich layer, and the Kovar-side reaction layer consists of TiFe2 particles, Ag-Cu eutectic, and the remaining Kovar. A belt-like TiFe2+TiNi3 IMC could be found in the filler layer. Increasing the brazing temperature enlarged the belt-like TiFe2+TiNi3 IMC in the filler layer and increased the thickness of the IMC-rich layer in the ceramic-side reaction layer, but had no significant effect on the thickness of the Ti-O-rich layer in the ceramic-side reaction layer. A lower heating rate (2.5 °C/min) was found to suppress the formation of the IMC-rich layer and shift the fracture location in shear tests from the ceramic-side reaction layer to the filler layer, indicating that the strength of the ceramic-side reaction layer was enhanced by controlling the formation of the IMC-rich layer. A maximum shear strength of 170 ± 61 MPa was obtained at a heating rate of 2.5 °C/min and a brazing temperature of 940 °C.

1. Introduction

Ceramics exhibit outstanding properties such as high strength, hardness, and thermal resistance. However, their brittleness and poor machinability necessitate bonding with metals for broader industrial applications, particularly in the automotive and microelectronics industries. Among various ceramic–metal joining techniques, brazing emerges as the most widely adopted and extensively investigated technique due to its high joint strength, process simplicity, and scalability. During brazing, the base materials remain solid while the molten filler metal wets the surfaces of the base materials and forms a joint upon solidification. However, conventional filler metals typically exhibit poor wettability on ceramics. To address this, two main approaches have been developed and employed as follows: direct brazing and indirect brazing. In direct brazing, active elements (e.g., Ti or Ta) are added to conventional fillers (such as Ag-Cu eutectic alloys), and these elements react with the ceramic surface to form a reaction layer, thereby promoting wetting and bonding [1,2,3,4]. Indirect brazing involves metallizing the ceramic surface using techniques such as magnetron sputtering or cold spraying, effectively converting the ceramic–metal interface into a metal–metal interface and improving the wettability [5,6,7,8,9]. Current research in brazing primarily focuses on improving the wettability between ceramic and metal substrates, regulating the formation of brittle intermetallic compounds in the brazing layer, and managing residual stresses induced by mismatched thermophysical properties between the ceramic and metal [10,11,12,13,14,15,16,17,18]. Among various ceramic materials, alumina (Al2O3) is the most widely manufactured and applied globally. A Kovar alloy (Fe-Ni-Co), with a thermal expansion coefficient closely matching that of alumina, is considered the preferred sealing alloy for alumina components and has been extensively investigated [19,20,21,22,23,24]. Therefore, exploring the brazing of alumina ceramics to Kovar alloys holds considerable scientific and practical significance.
The brazing temperature is a critical parameter that governs multiple aspects of the brazing process, including filler metal melting and spreading, intermetallic compound formation, and the thickness of the reaction layer at the bonding interface, which plays a key role in ceramic–metal adhesion. For example, Cao et al. employed a Ag-Cu-8Ti filler to join an alumina ceramic to a Kovar alloy and systematically investigated the effects of the brazing temperature (850–890 °C) on the interfacial microstructure and tensile strength. Their results showed that a reaction layer consisting of Ti3Al and TiO formed at the ceramic/filler interface. The optimal mechanical performance was achieved at 870 °C, with a maximum tensile strength of approximately 76 MPa [25]. Wang et al. used a Ag-5Cu-1Al-1.25Ti (wt%) filler to braze an alumina ceramic to a 4J34 Kovar alloy, examining the effects of brazing temperatures between 940 and 970 °C on the interfacial microstructure and mechanical properties. Their results showed that a reaction layer consisting of Ti3(Cu, Al)3O formed at the bonding interface. Although higher temperatures initially improved the joint strength, excessive temperatures or prolonged holding times caused a reduction in the reaction layer thickness due to interfacial overreaction—ultimately weakening the joint. The optimal shear strength of 150 MPa was achieved at 960 °C [26]. These findings corroborate the prevailing consensus in brazing research that the temperature significantly influences the interfacial microstructure and mechanical properties. However, the underlying mechanisms regulating the interfacial evolution of the ceramic-side reaction layer under elevated temperatures remain unclear. In addition, the heating rate, despite its influence on furnace temperature uniformity, superheat levels, and overall thermal management, is often overlooked in brazing parameter optimization. To date, no systematic investigations on the heating rate have addressed its specific role in alumina–Kovar systems.
To address this research gap, this study statistically analyzes the combinations of the brazing temperature and heating rate reported in the existing literature (Figure 1). This review reveals two critical knowledge gaps in current research: (1) the relationship between microstructural/mechanical evolution and brazing at temperatures ≥1000 °C, and (2) the microstructure and mechanical properties of joints fabricated under low heating rates.
Moreover, in recent years, growing attention has been devoted to the integration of interlayers or reinforcing phases in ceramic brazing to enhance joint performance. However, these studies often focus on the benefits of such additions while neglecting the optimization of process parameters for additive-free brazing systems. For example, Zhu et al. reported that a Ag-Cu-Ti/Cu/Ag-Cu trilayer filler improved the joint strength by 217% compared to a single-layer Ag-Cu-Ti filler in alumina–Kovar joints. Nevertheless, the strength achieved with a conventional Ag-Cu-Ti filler alone remained around 70 MPa [5]. Similarly, Zhang et al. used a B-modified Ag-Cu-Ti filler to braze sapphire to a Kovar alloy, achieving a twofold increase in shear strength with a 0.45 wt% B addition relative to boron-free samples. Under identical conditions, direct brazing using conventional Ag-Cu-Ti yielded only ~50 MPa [6]. While variations in testing protocols may contribute to differences in reported strength, these findings underscore the importance of systematically exploring the boundaries of process parameters.
This study aims to investigate the relationship between microstructural evolution and joint mechanical properties under varying brazing temperatures and heating rates, especially the composition of the ceramic-side reaction layer and its change under different process parameters. Additionally, fracture analysis of all joints is performed to identify the weak regions of various joints and an attempt is made to elucidate the underlying mechanisms governing the processing–microstructure–property relation during the active brazing of alumina ceramics to Kovar alloys. This systematic approach seeks to provide a deeper understanding of the fundamental processes controlling this joining technique.

2. Materials and Methods

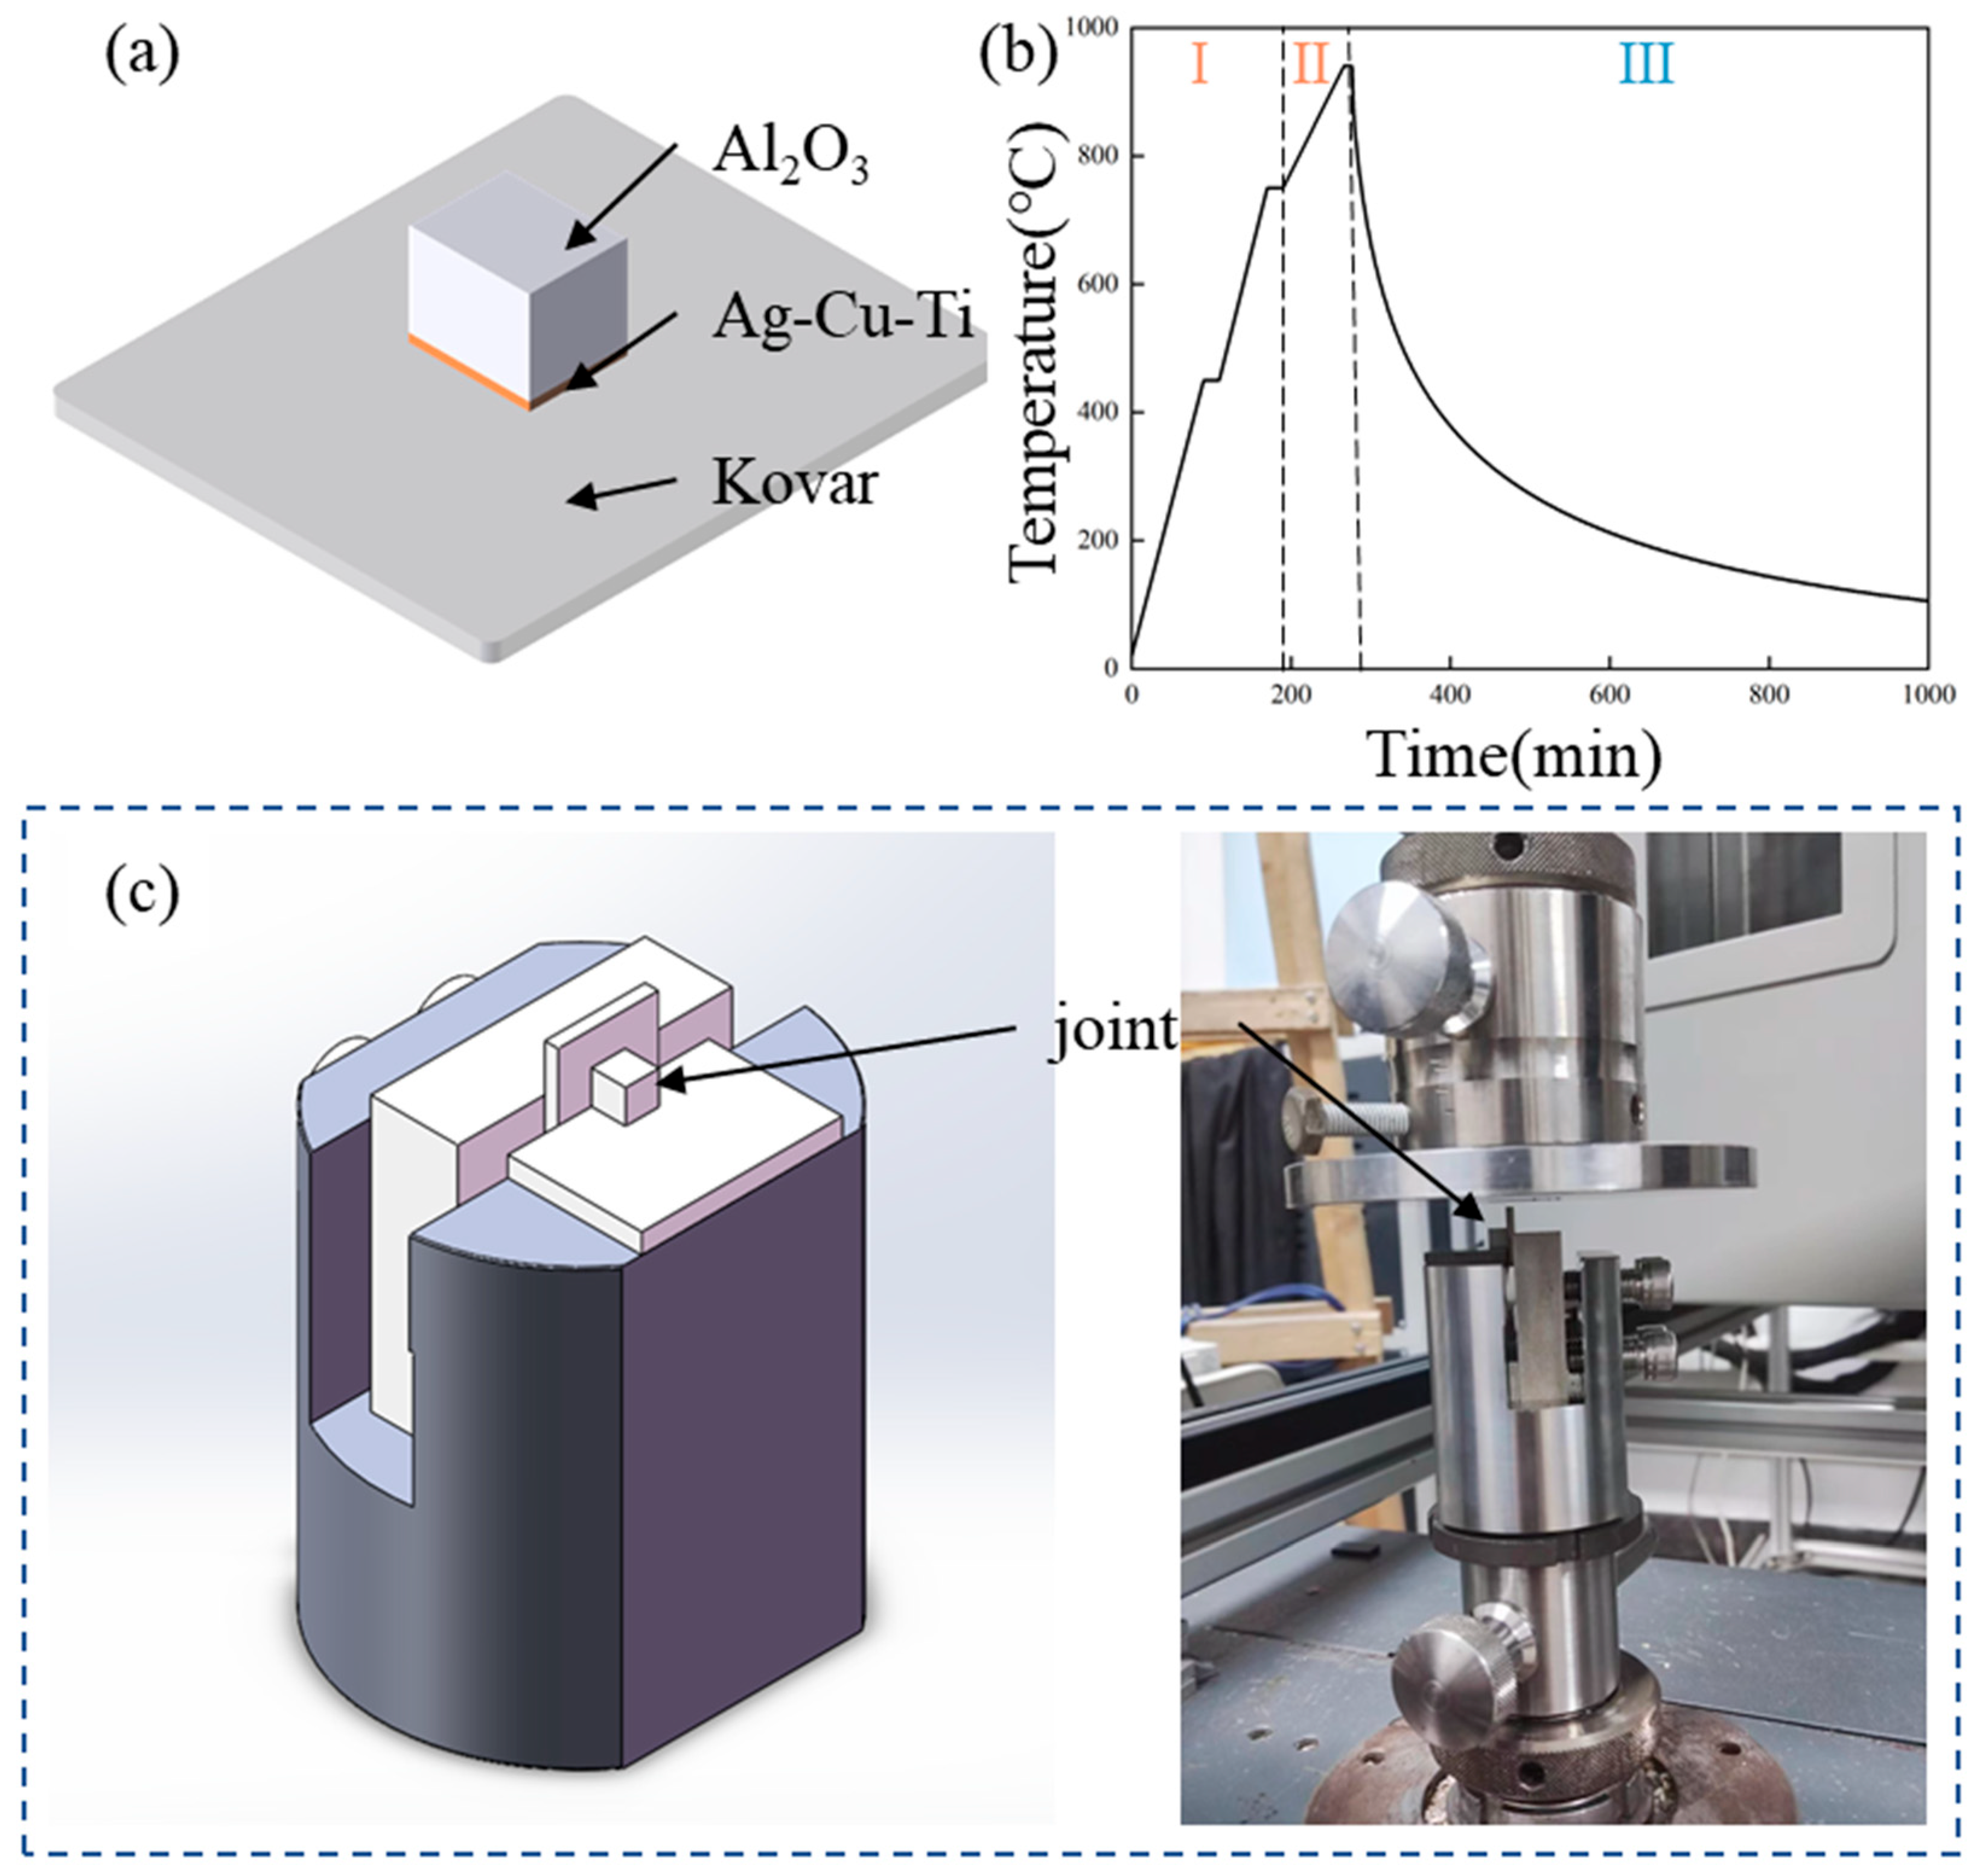
Experiments were conducted using 95% alumina ceramics (Dimeng Precision Ceramics Co., Changsha, China), fabricated into 5 × 5 × 5 mm3 blocks through dry pressing using custom-designed molds. The 4J34 Kovar alloy (Qisheng Alloy Materials Co., Guangdong, China) was machined into 15 × 15 × 3 mm plates via wire electrical discharge machining (WEDM). A Ag-Cu-2Ti filler metal (Yuanqiao Welding Materials Co., Shanghai, China) was used for brazing. As illustrated in Figure 2a, the joint assembly consisted of a ceramic cube, filler metal, and Kovar plate. To ensure complete interfacial filling, paste-state filler metal—with solidus and liquidus temperatures of approximately 770 °C and 810 °C, respectively—was placed into a specially designed mold measuring 6 × 6 × 0.5 mm3 to control filler paste geometry. Fixtures were applied during brazing to prevent misalignment, while a pressure of approximately 1 Pa was exerted on top of the alumina ceramic. Prior to brazing, all contact surfaces were ground with #400 SiC sandpaper and ultrasonically cleaned for 10 min to remove contaminants and oxide films. The chemical compositions of the base materials are presented in Table 1 and Table 2.
The brazing process was performed in a vacuum furnace with less than 5 × 10⁻³ Pa and the brazing thermal cycle, shown in Figure 2b, could be divided into three stages: Firstly, the assembly was heated from room temperature to 450 °C, followed by a 20 min dwell for stabilization, and the temperature was then subsequently heated to 750 °C, with an additional 20 min dwell to ensure a uniform furnace temperature. Secondly, two heating rates (10 °C/min and 2.5 °C/min) were employed to heat the assembly to the target temperatures (900 °C, 940 °C, 1000 °C, and 1100 °C), with each target temperature maintained for 10 min. Finally, the brazed joints were cooled down along with the furnace to room temperature.
Post-brazing, cross-sectional specimens were prepared for metallographic analysis. Samples were sequentially ground using 400#, 800#, 1200#, and 2000# grit SiC papers, followed by coarse and fine polishing with 1.5 µm and 0.5 µm diamond suspensions. Microstructural characterization was performed using a scanning electron microscope (SEM; HITACHI SU8220, Tokyo, Japan) equipped with an energy-dispersive X-ray spectrometer (EDS; Bruker FlatQuad). To ensure electrical conductivity, specimens were sputter-coated with Pt prior to analysis. Quantitative elemental mapping and phase identification were conducted by electron probe microanalysis (EPMA; JEOL JXA-iHP2000, Tokyo, Japan). Shear strength tests were carried out on a universal testing machine (ZWICK-Z020, Ulm, Germany) at a constant loading rate of 0.1 mm/min under ambient conditions, as illustrated schematically in Figure 2c and three samples were tested under each condition. The XRD (Bruker D8 Focus, Karlsruhe, Germany) analysis was carried out to identify the phase structure formed in the brazing process, with the 2θ range set to 20–90°.

3. Results

3.1. Typical Microstructure of the Brazing Joint

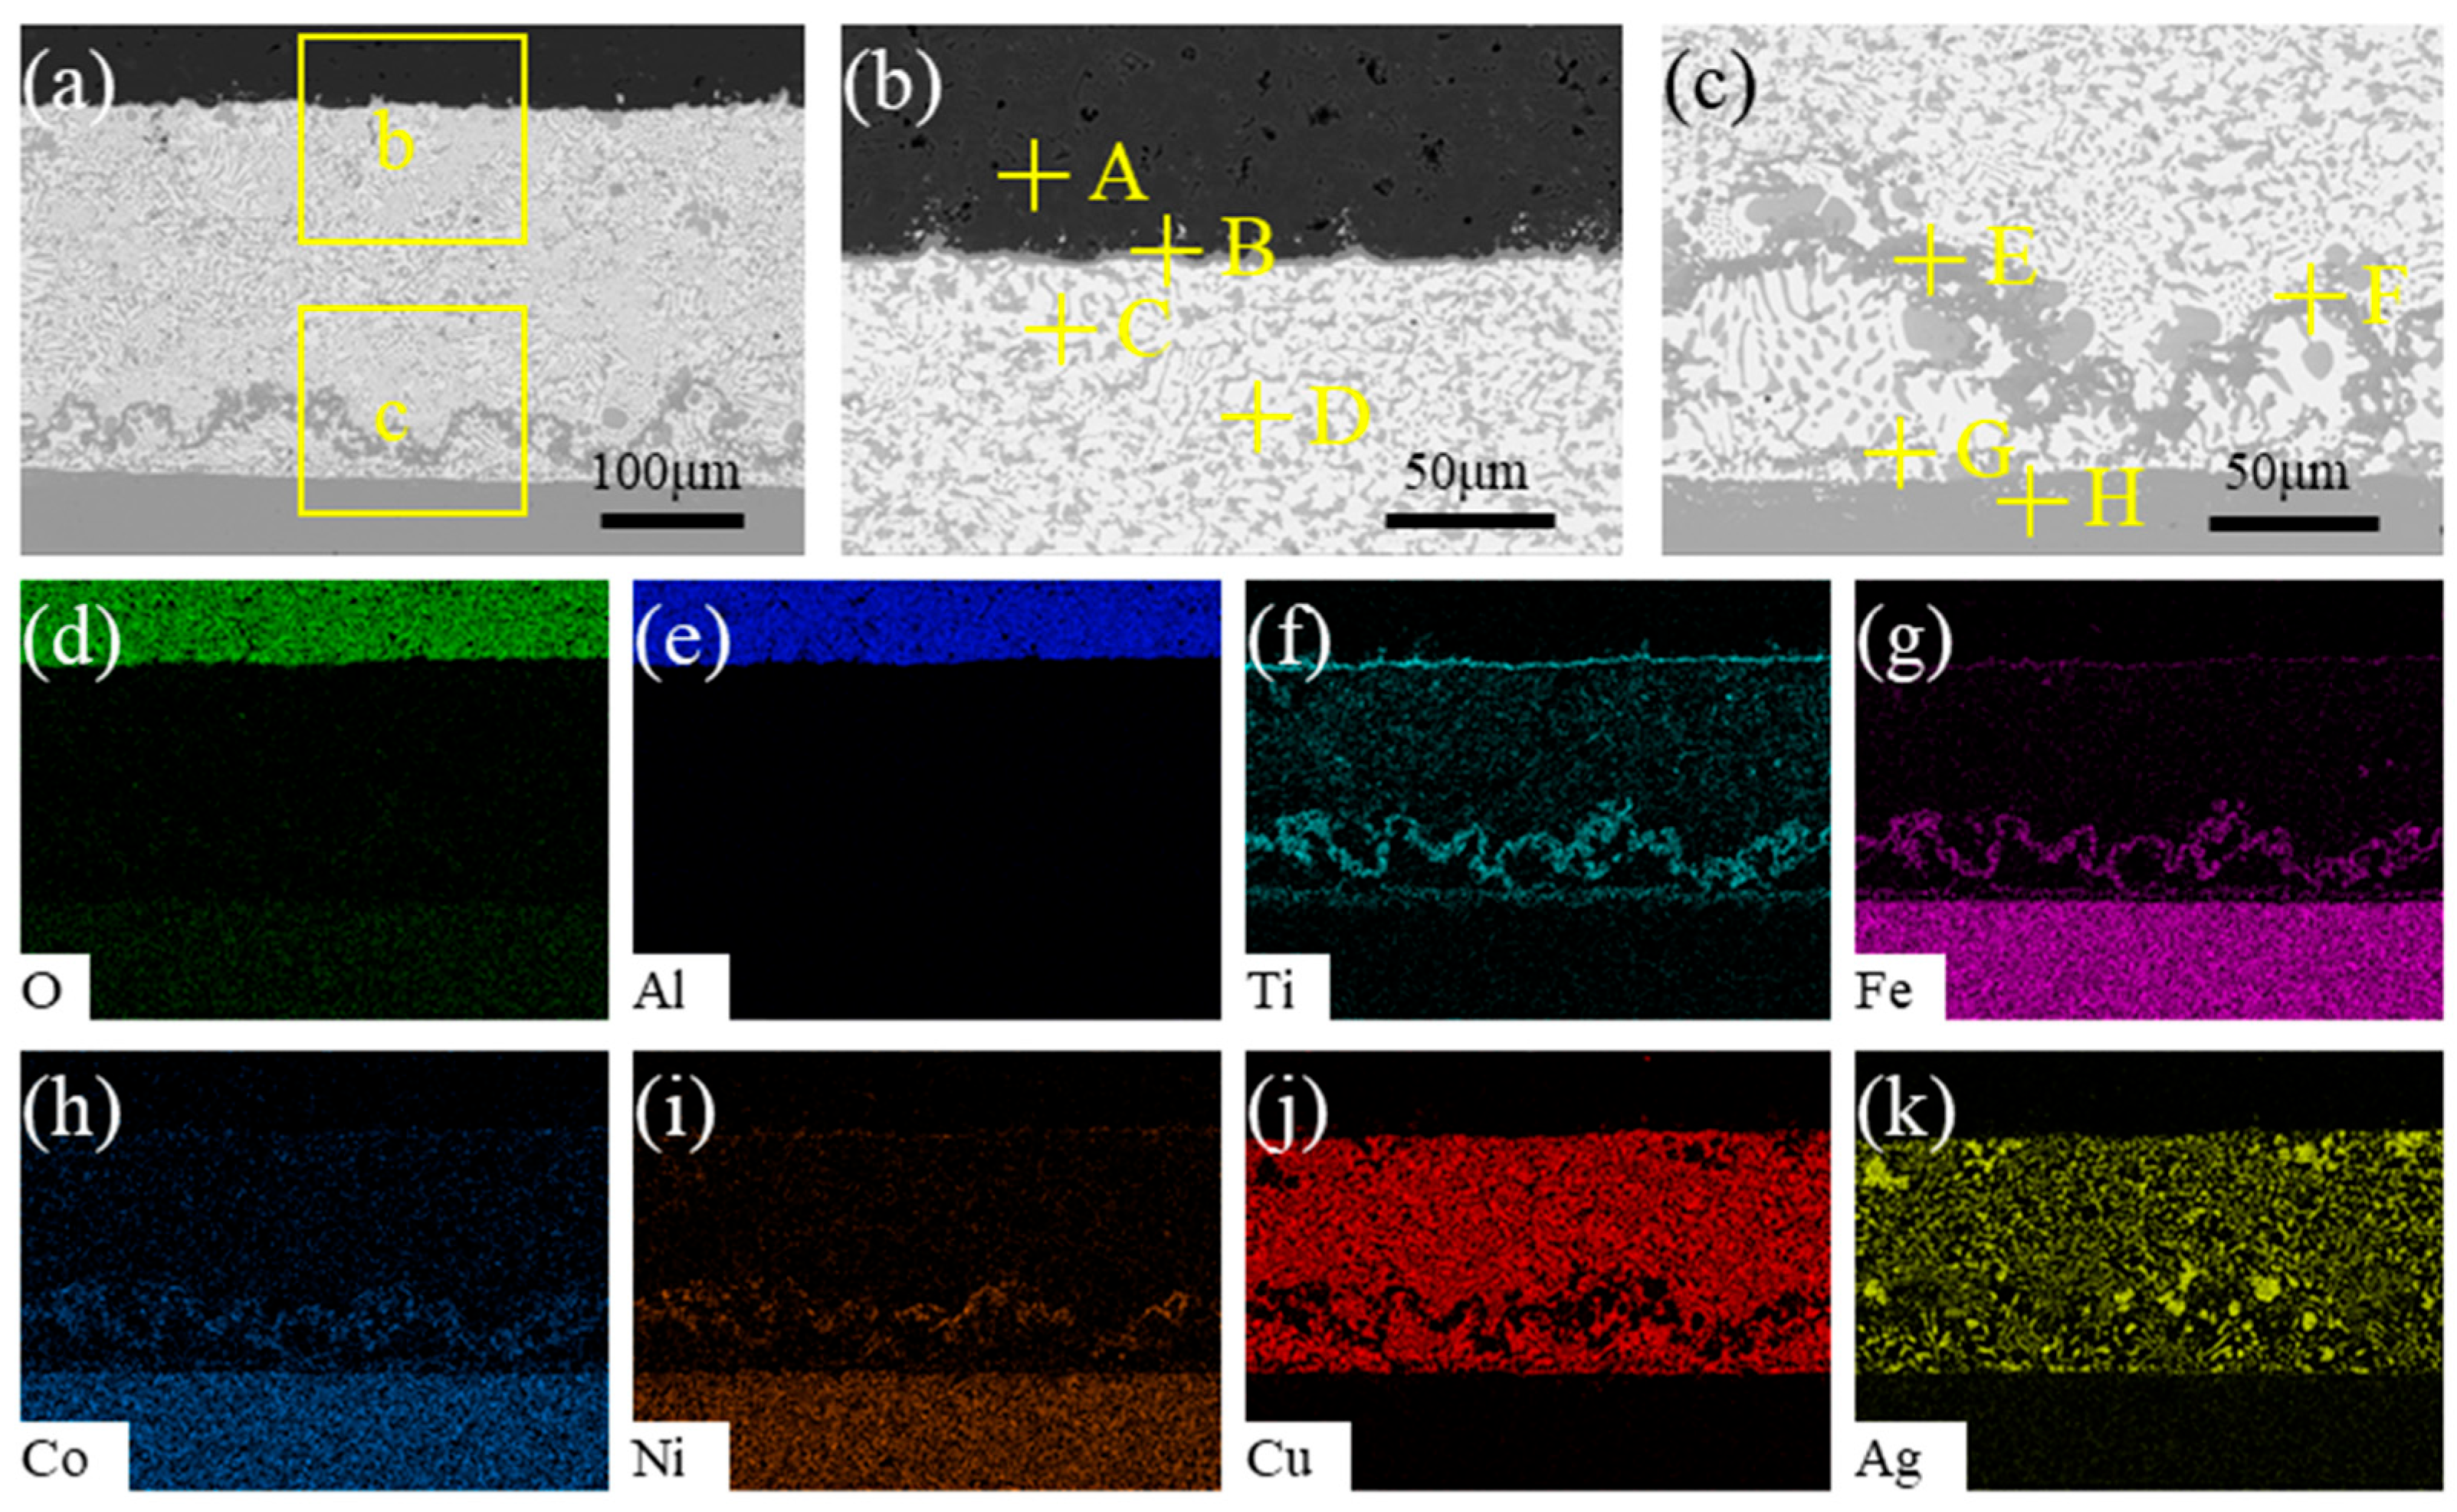
Well-formed brazed joints were achieved under all processing conditions, with no macroscopic defects detected. A representative cross-section of a joint brazed at a heating rate of 10 °C/min and a target temperature of 940 °C was examined after grinding and polishing. The SEM analysis of the microstructure is shown in Figure 3a, with enlarged views of the reaction layer and band-like intermetallics (IMC) presented in Figure 3b and Figure 3c, respectively. Point EDS analysis was performed on the distinct phases identified in the images, with the results summarized in Table 3. The elemental mapping results of O, Al, Ti, Fe, Co, Ni, Cu, and Ag are shown in Figure 3d–k, respectively.
Based on the SEM and EDS results, it can be found that the joint consists of five distinct regions: alumina ceramic substrate/ceramic-side reaction layer (containing Ti-Fe-Ni-O)/Ag-Cu eutectic filler layer containing banded TiFe2 and TiNi3 intermetallic compounds (IMCs)/Kovar-side reaction layer (comprising TiFe2 intermetallic particles, Ag-Cu eutectic, and residual Kovar)/Kovar substrate; the intermetallics component is the same with reference [1,19,20,26]. The Kovar-side reaction layer is mainly caused by the breakage of the contact surface due to the reaction of Ti with the Kovar base material to form TiFe2, which leads to the erosion of the filler metal into the Kovar interior. Discontinuously distributed TiFe2 particles were observed, with approximately equal spacing between the residual Kovar base material and the infiltrated Ag-Cu solder.
The XRD analysis results of the joint, as shown in Figure 4, identified the presence of Al2O3, (Fe, Co)0.64Ni0.36, Ag, and Cu, all of which are the expected constituent phases of Kovar–Al2O3 brazed joints. In addition, Ti was found to react with O during brazing to form TiO2 and Ti2O. Simultaneously, Fe and O reacted with Si originating from both the Kovar alloy and the ceramic to form Fe2SiO4. These findings suggest that the reaction layer comprises multiple distinct sublayers, and Ti serves a critical role in reaction layer formation.
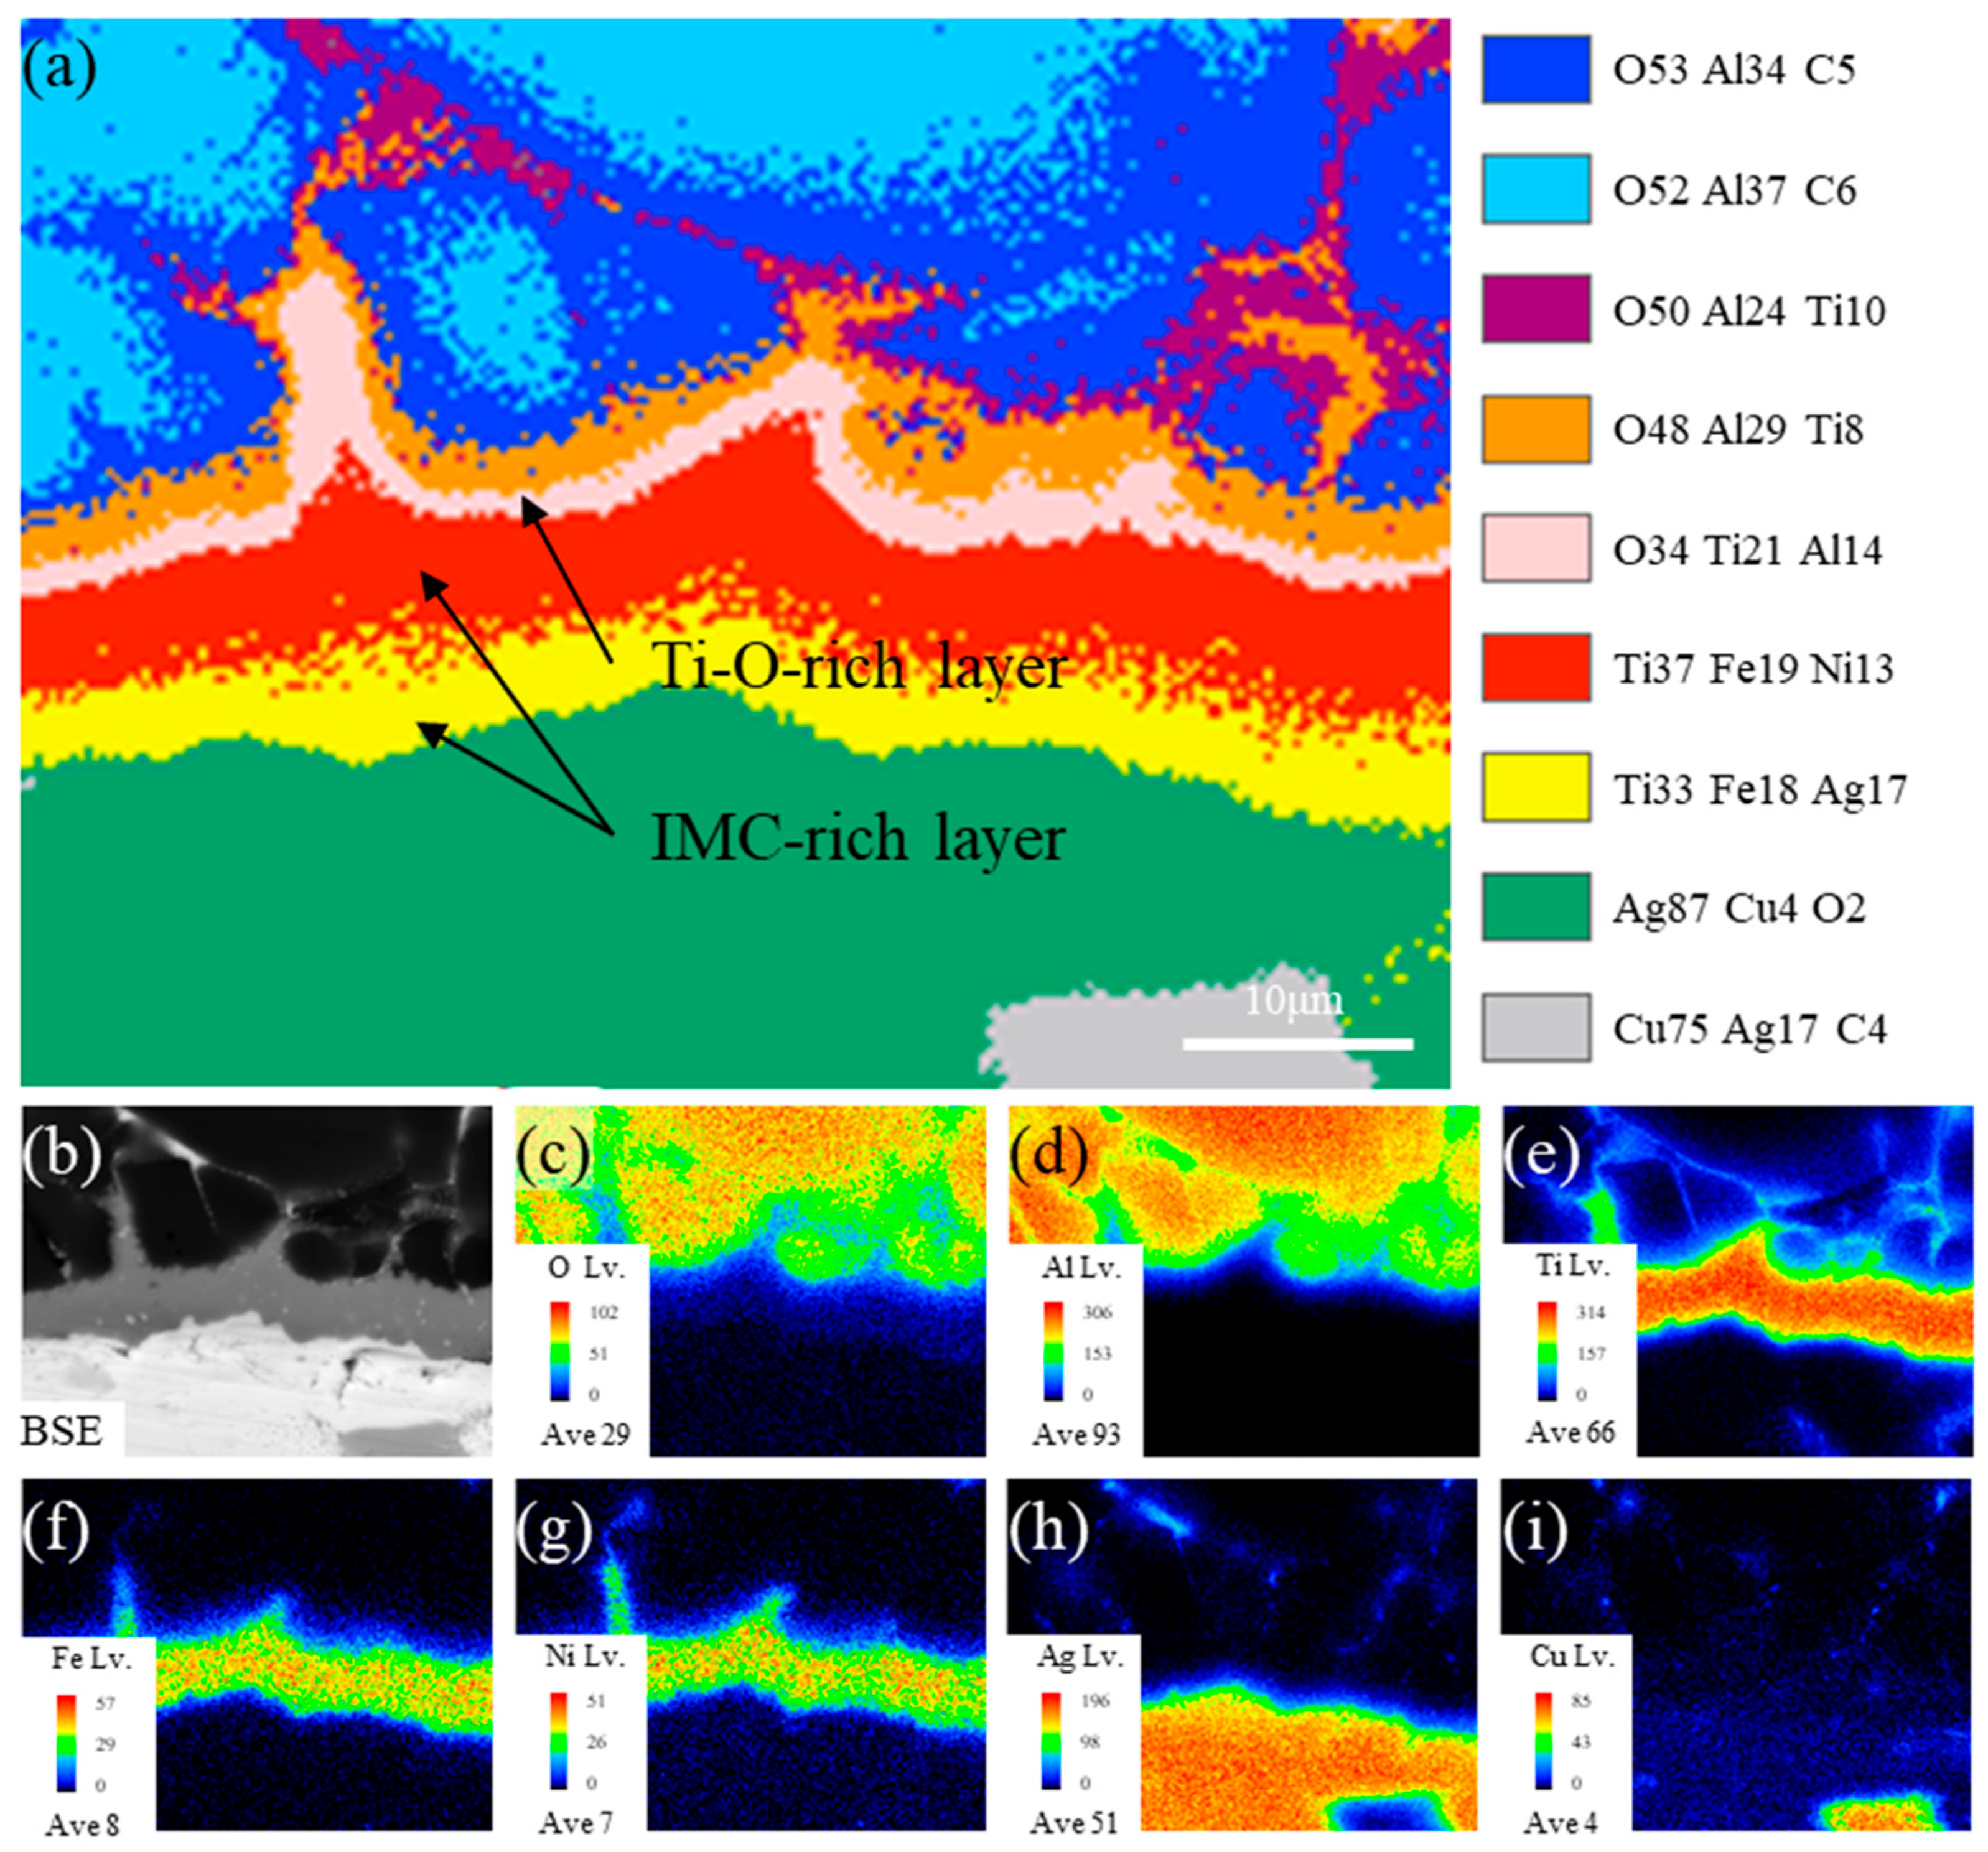
To further examine the microstructure of a typical brazed joint formed at 940 °C with a heating rate of 10 °C/min, EPMA analysis was performed on the reaction layer at the alumina ceramic interface. Figure 5a presents the integrated compositional profile derived from elemental mapping, while Figure 5b–i show the BSE image and the corresponding distributions of O, Al, Ti, Fe, Ni, Ag, and Cu in the bonding region. The comparison between the BSE image and elemental distribution maps, when accounting for potential elemental diffusion, reveals a distinct transition zone on the ceramic side. Moreover, a layered structure is evident within the bonding region, including a Ti-O-rich layer approximately 250 nm thick, consistent with the Ti2O and TiO2 phases identified by XRD, and a 2 μm thick Ti-Fe-Ni-rich region, hereafter referred to as an IMC-rich layer.
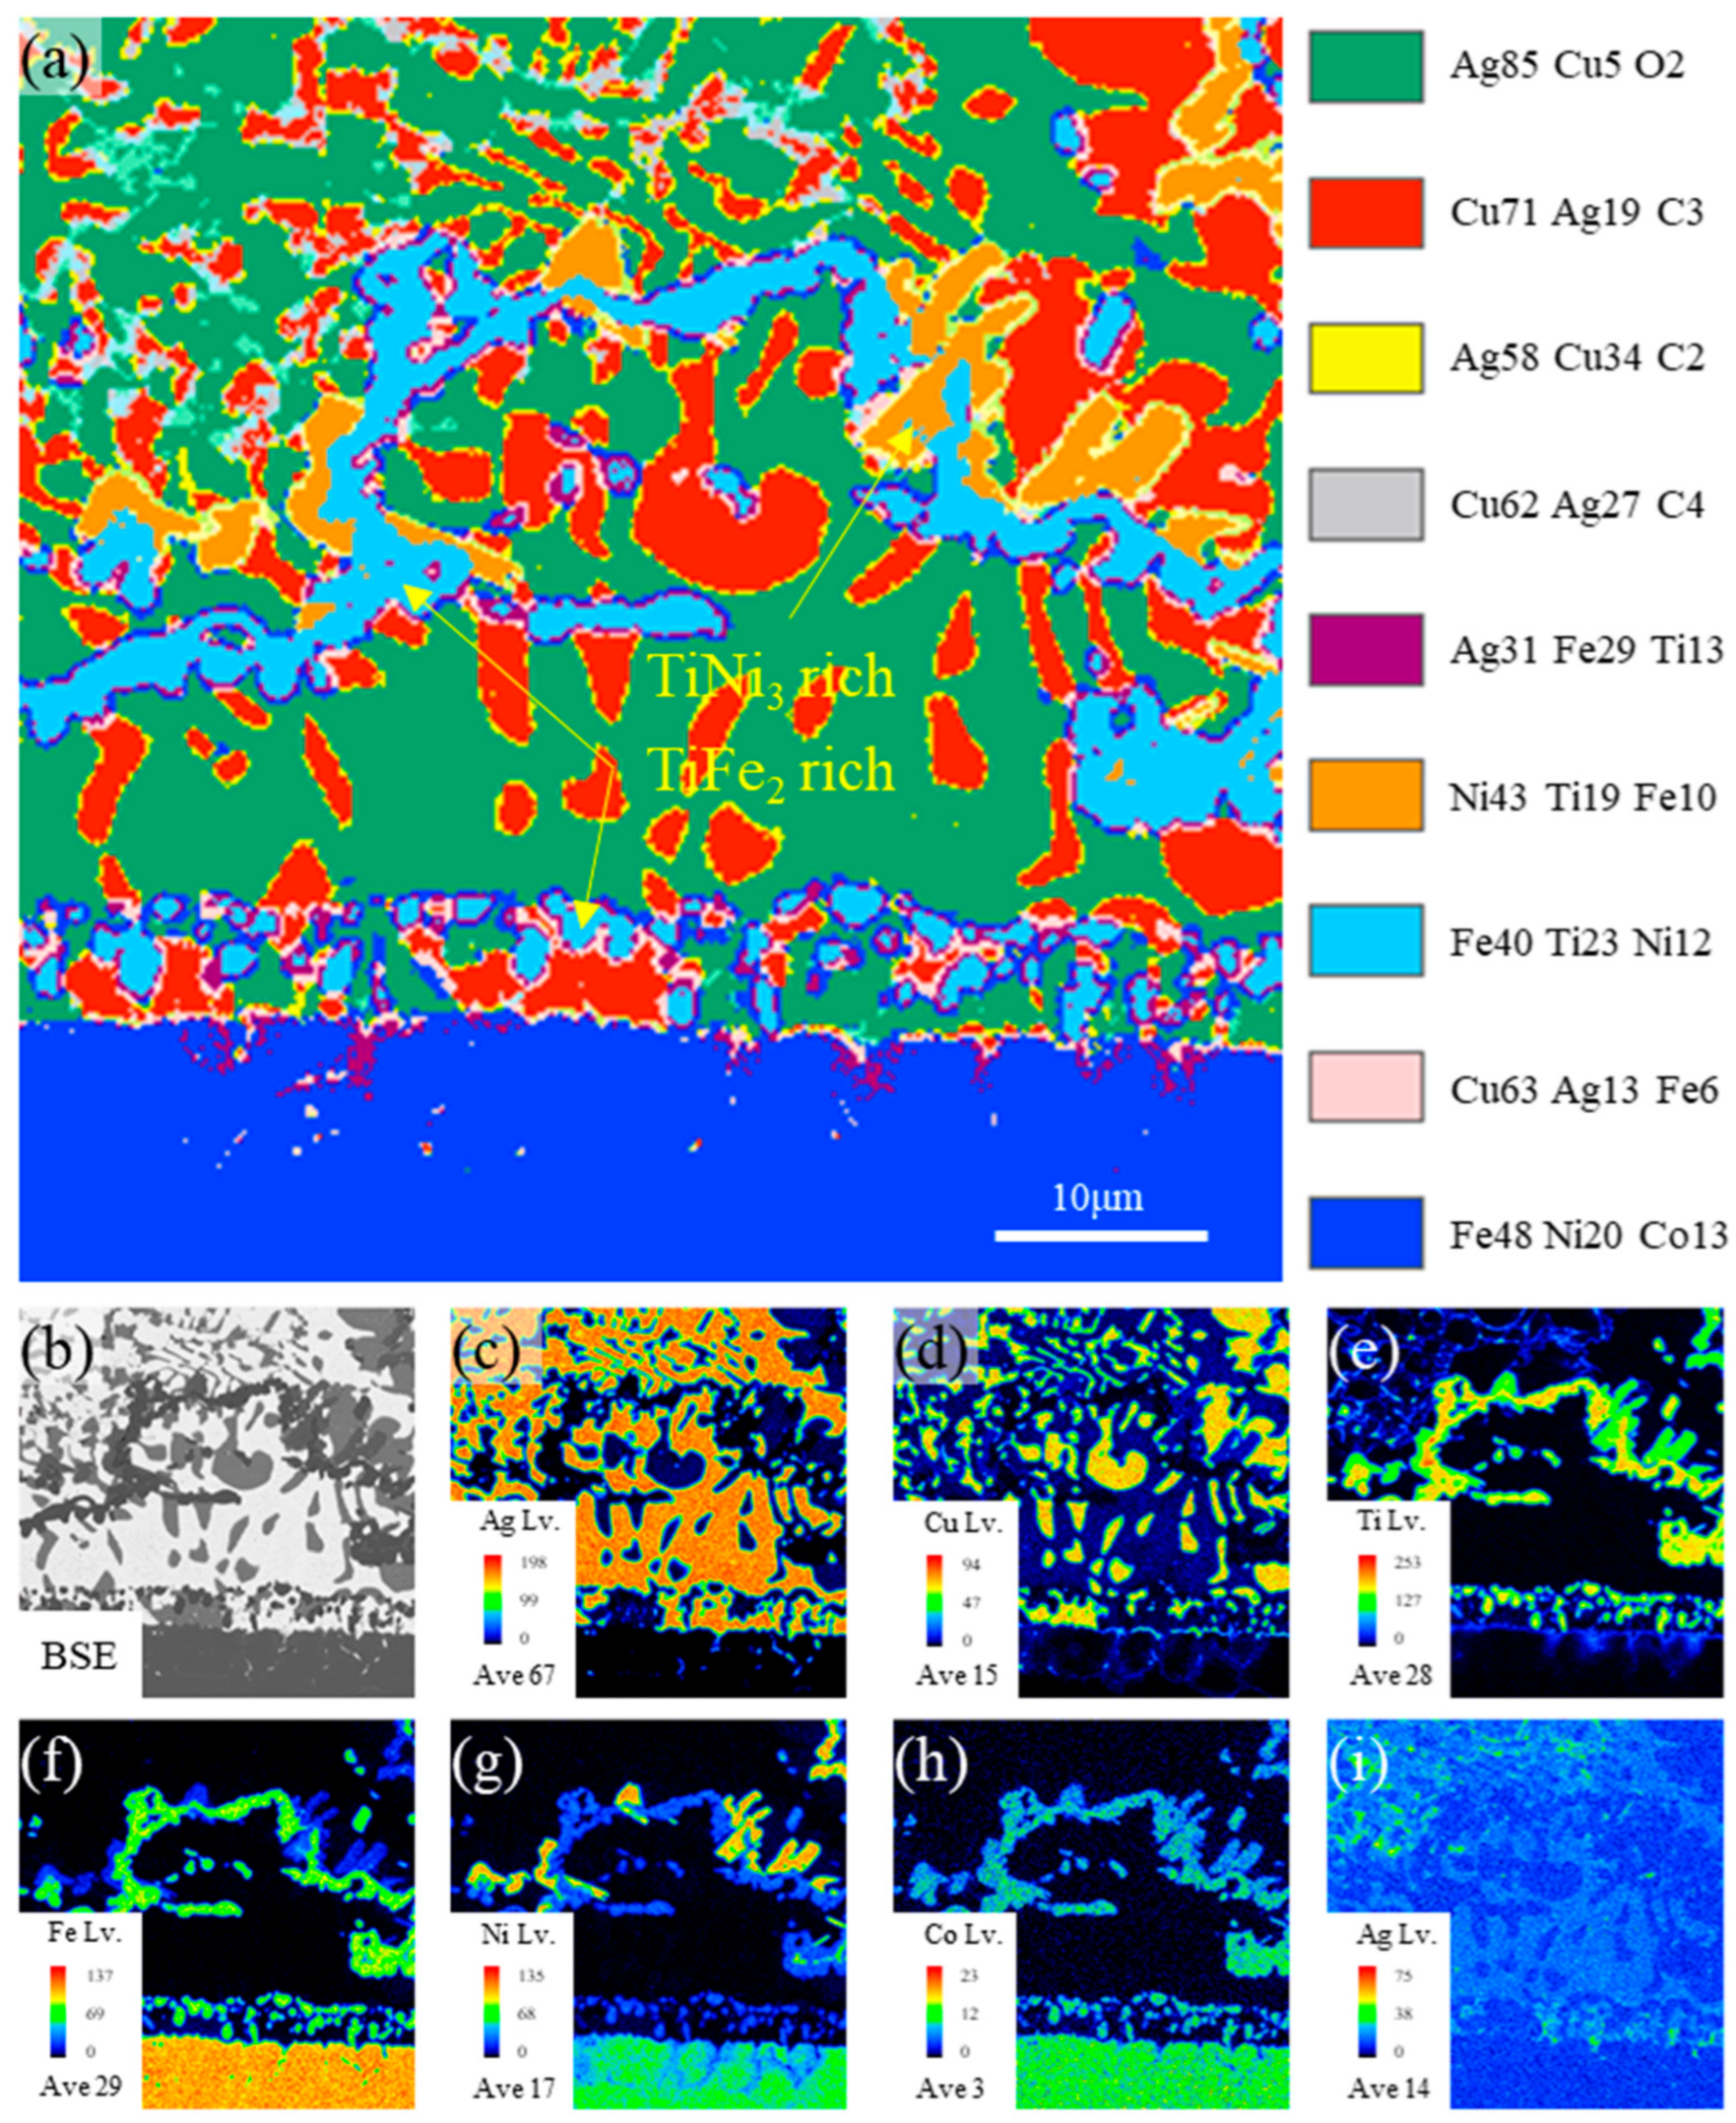
EPMA was also conducted to analyze the reaction layer on the Kovar side of the joint brazed at 940 °C with a heating rate of 10 °C/min. Figure 6a presents the integrated compositional profile based on elemental mapping, while Figure 6b–i show the corresponding BSE image and the elemental distributions of Ag, Cu, Ti, Fe, Ni, Co, and C. The results indicate that the filler metal layer consists primarily of a eutectic structure of Ag and Cu. The band-like intermetallic compounds can be classified into Fe-rich and Ni-rich regions, with compositions closely corresponding to a mixture of TiFe2 and TiNi3 phases. Granular TiFe2 intermetallics are observed adjacent to the Kovar substrate. Additionally, due to elemental diffusion, multiple transitional bands are present, though they are not individually labeled in the EPMA maps.

3.2. Effect of the Brazing Temperature and Heating Rate on the Microstructure of Al2O3–Kovar Joint

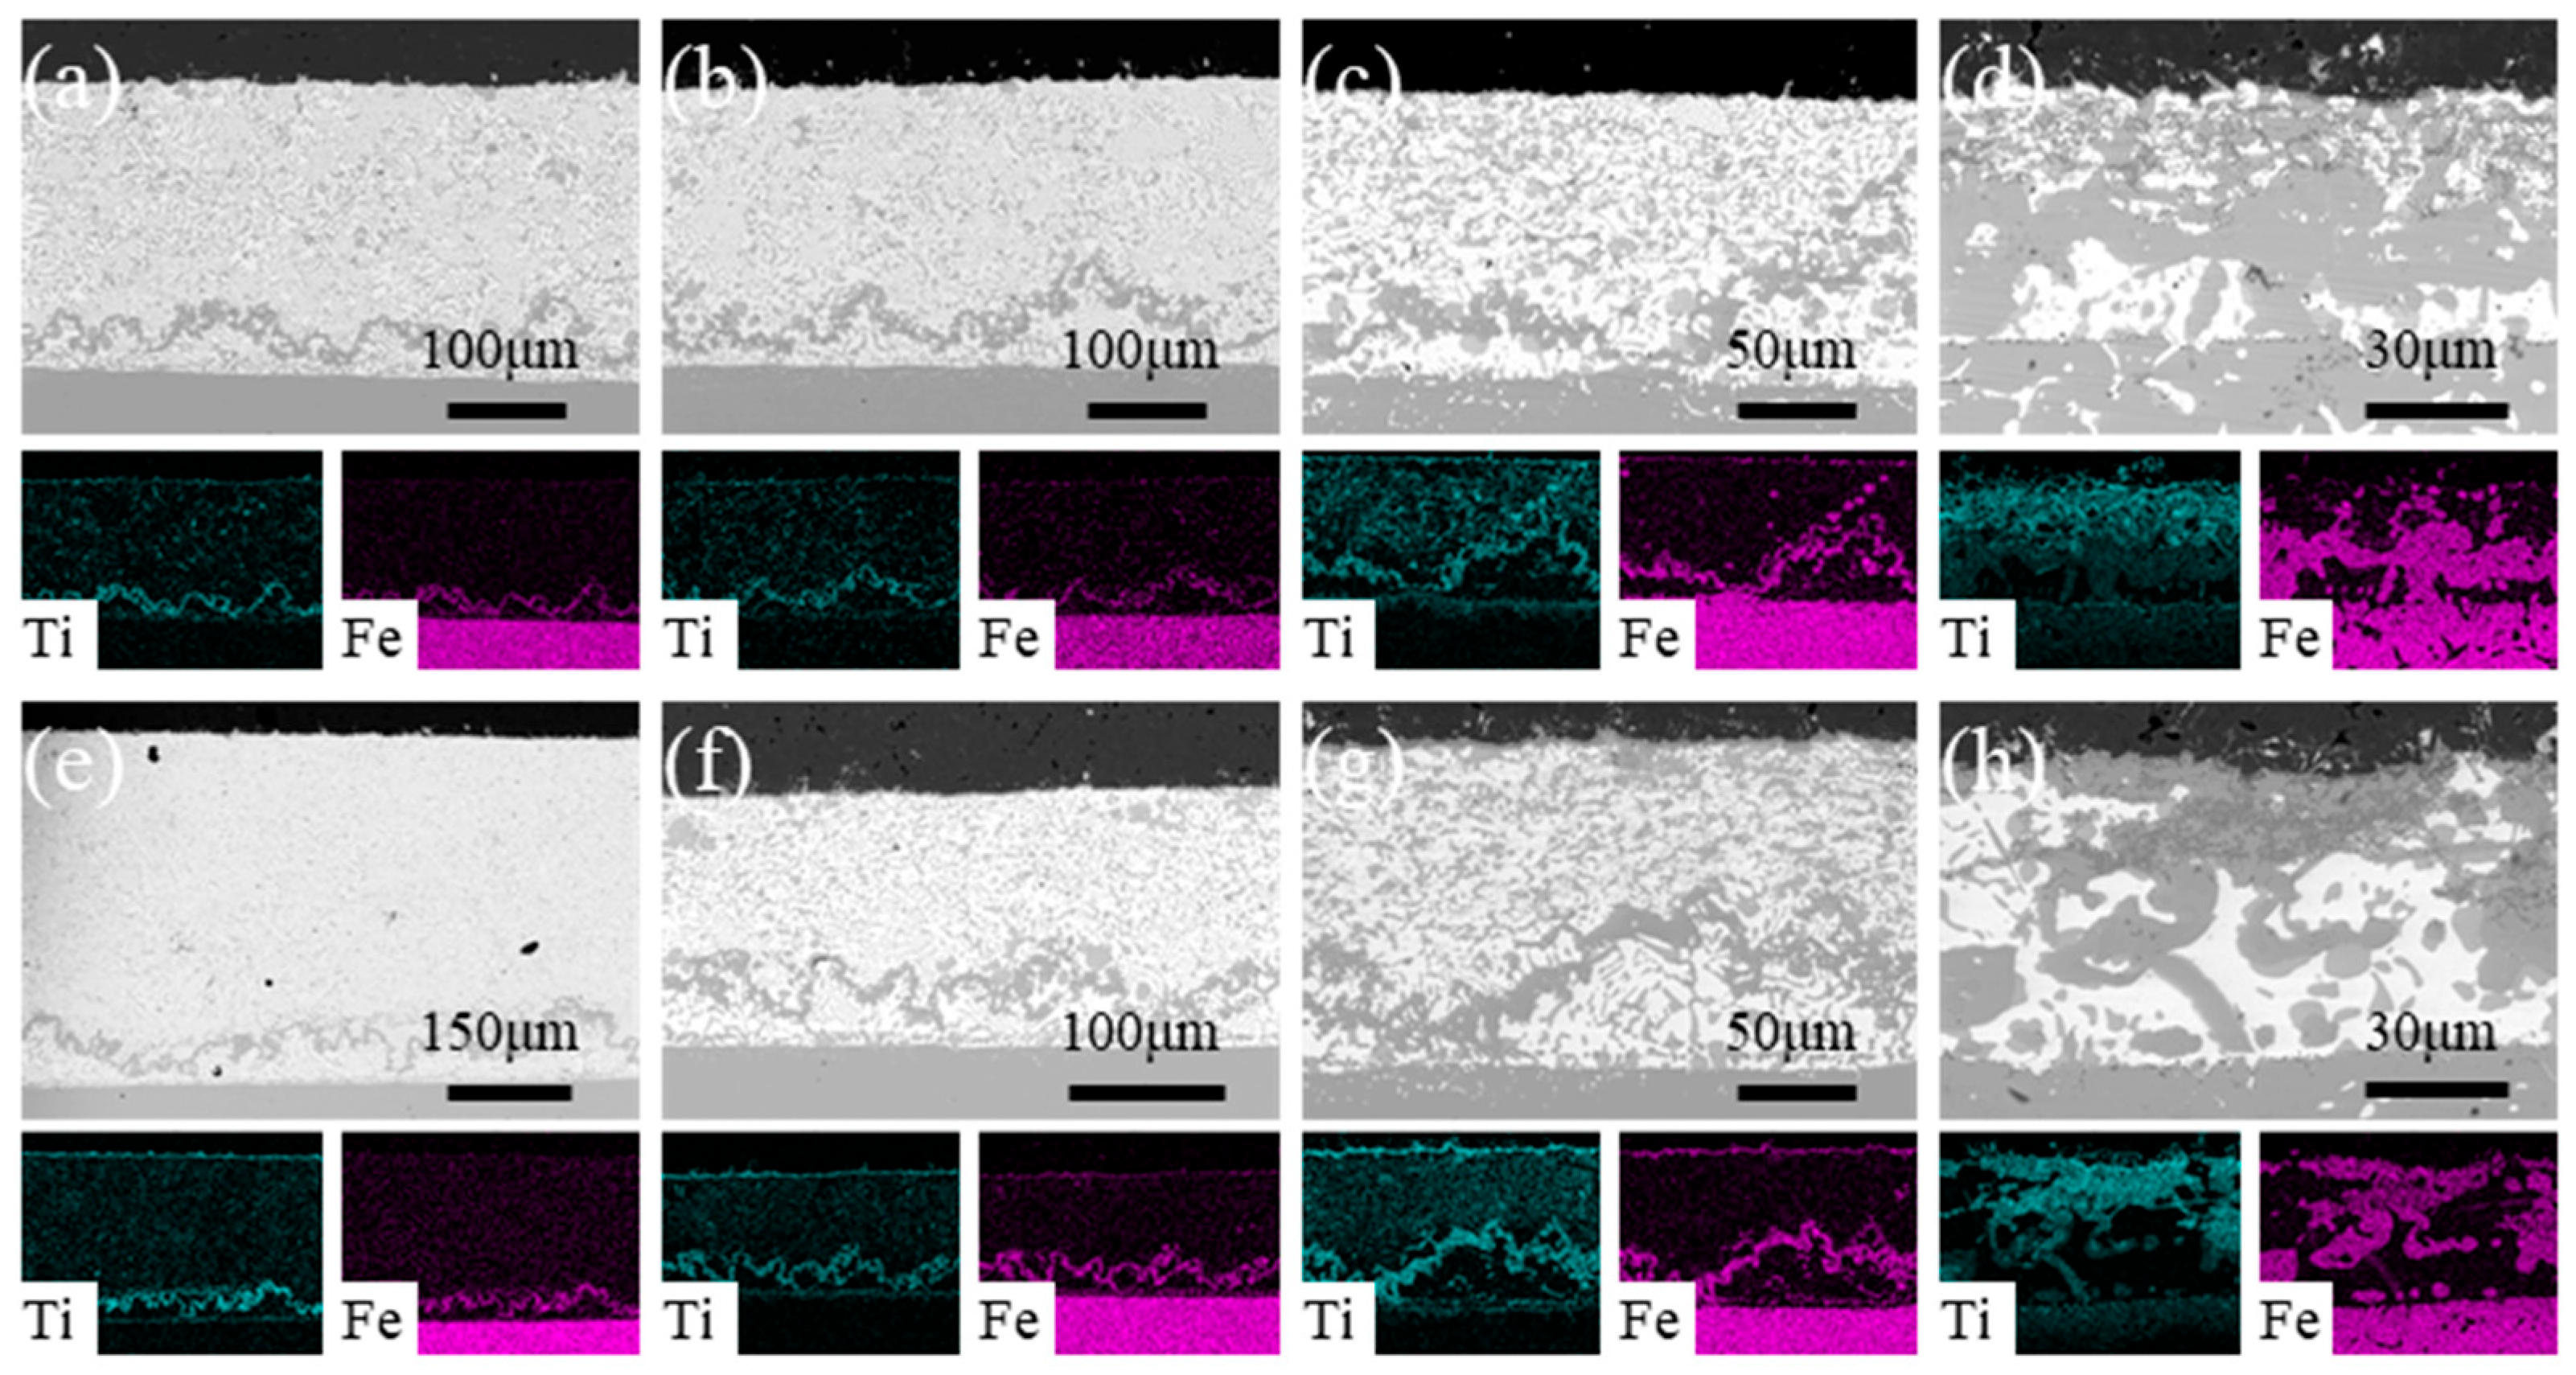
Cross-sections of joints brazed at different temperatures and heating rates were prepared via grinding and polishing, followed by SEM and EDS analysis to characterize their microstructure and elemental distributions—specifically Ti and Fe—under varying processing conditions, as shown in Figure 7. Distinct stratified structures were observed under all process parameters, with both the alumina-side reaction layer and strip-like intermetallic compounds (IMCs) in the filler layer clearly identifiable. Figure 7a–d show the microstructure and the distribution of the Ti and Fe elements of the joints brazed at 900 °C, 940 °C, 1000 °C, and 1100 °C with a heating rate of 2.5 °C/min. As observed, increasing the brazing temperature led to a reduction in the filler layer thickness, enhanced diffusion of Fe toward the alumina-adjacent reaction layer, and a gradual increase in the size of strip-like IMCs. At 1100 °C, the intermetallic compounds almost fill the entire brazing seam, as shown in Figure 7d. Figure 7e–h show the microstructure and the distribution of the Ti and Fe elements of the joints brazed at 900 °C, 940 °C, 1000 °C, and 1100 °C with a heating rate of 10 °C/min. Similar results were obtained by increasing the brazing temperature. In addition, the thickness of the reaction layer on the ceramic side also shows a significant increasing trend, where voids could be seen at 1100 °C.
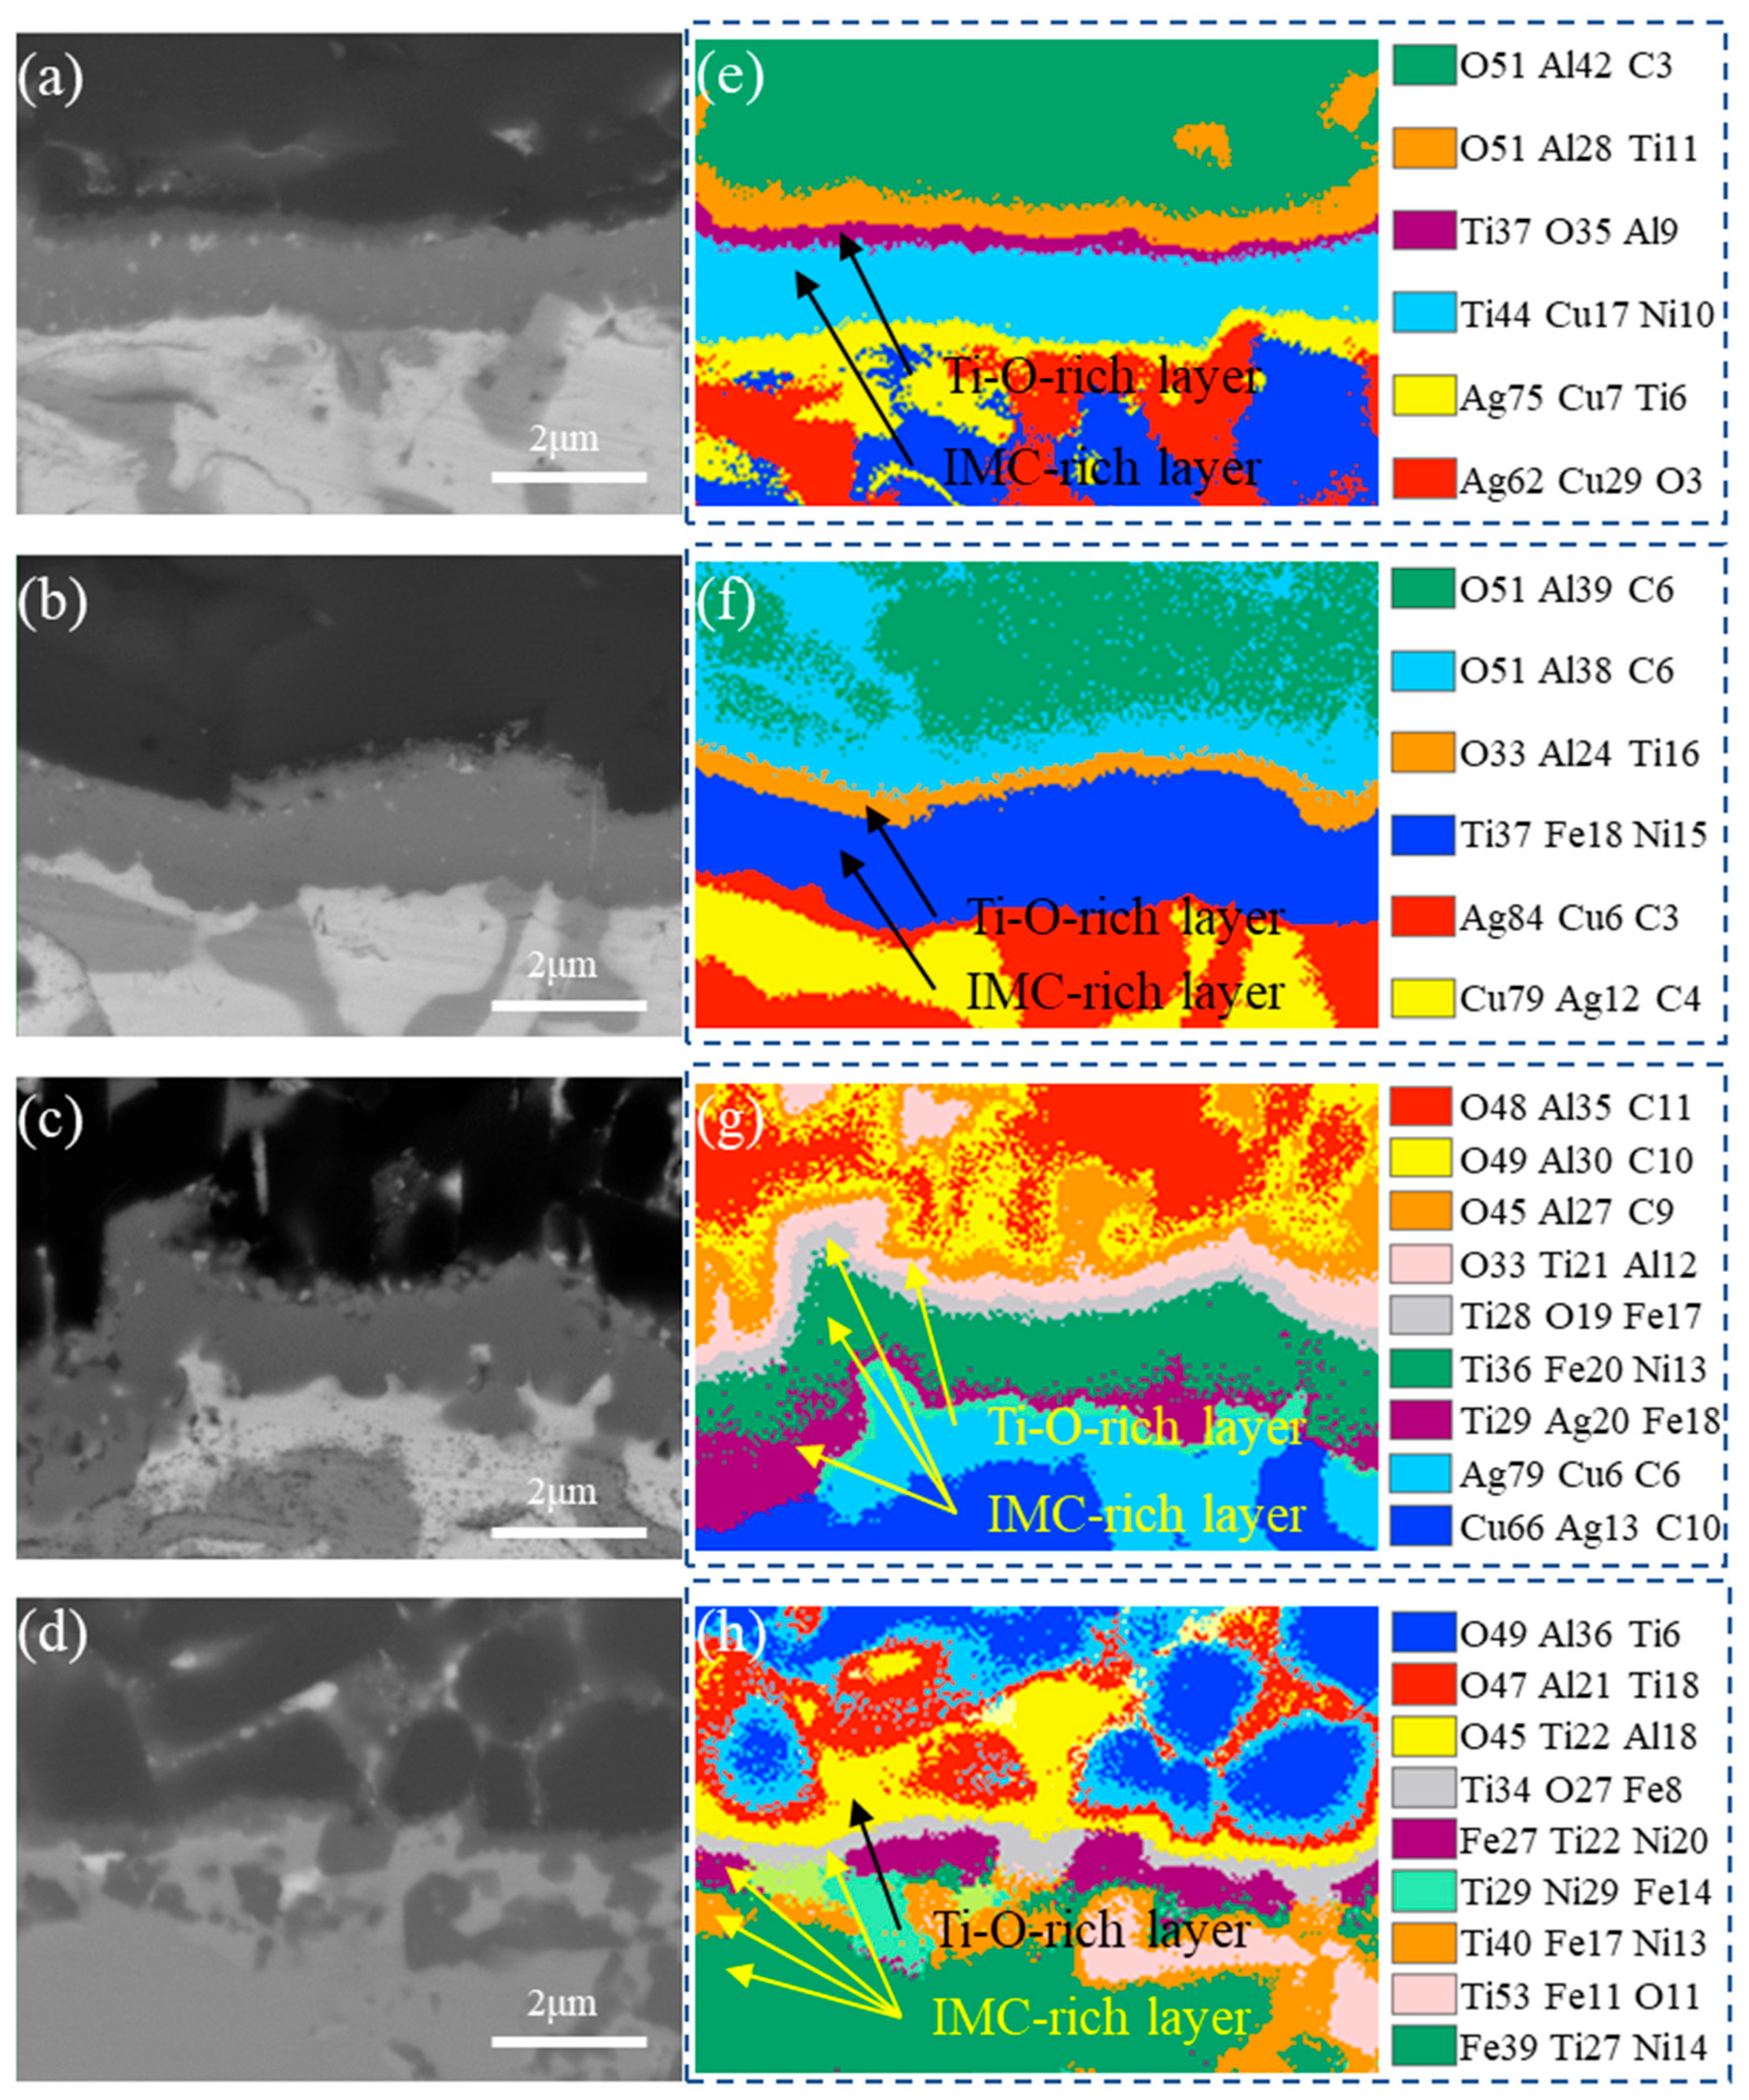
To gain deeper insight into the evolution of the ceramic-side reaction layer, EPMA was used to investigate microstructural differences in sub-layers in the reaction layer of joints brazed at various temperatures with a heating rate of 2.5 °C/min. Figure 8a–d show the BSE images of joints brazed from 900 °C to 1100 °C, while Figure 8e–h present the corresponding element distributions. A Ti-O-rich layer is present in all joints, showing minimal thickness variation across the tested temperature range. At 900 °C, no IMC-rich layer is observed; a discontinuous IMC-rich layer appears at 940 °C, and a continuous, significantly thickened IMC-rich layer forms at 1000 °C. At 1100 °C, due to the elevated temperature and extended holding time, the Ti distribution changes largely, and tends to form TiC particles in the filler layer. No IMC-rich layer is found in the ceramic-side reaction layer under this temperature.
EPMA was also employed to examine the reaction layer of joints brazed at different temperatures with a heating rate of 10 °C/min. Figure 9a–d display the BSE images of the reaction layers at brazing temperatures from 900 °C to 1100 °C, while Figure 9e–h show the corresponding elemental distributions. Distinct layering within the reaction layer is still evident for all brazing temperatures. Although the thickness of the Ti-O-rich layer remains relatively constant, the IMC-rich layer thickness increases significantly, eventually exceeding 4 μm at 1100 °C.
ImageJ 1.46r software was used to statistically analyze the thicknesses of the Ti-O-rich layer and IMC-rich layer under various processing conditions, as presented in Figure 10. Given the non-uniform thickness of the layers, an equivalent thickness was calculated by dividing the measured area of each layer by its corresponding boundary length. Figure 10a shows the thicknesses of the Ti-O-rich layer, IMC-rich layer, and total reaction layer (sum of both layers) at different brazing temperatures with a heating rate of 2.5 °C/min. Figure 10b provides the corresponding data for joints at a heating rate of 10 °C/min. The results indicate that increasing the brazing temperature induces a gradual increase in the IMC-rich layer thickness, while the Ti-O-rich layer thickness remains almost unchanged. Furthermore, a lower heating rate significantly reduces the IMC-rich layer thickness, thereby decreasing the overall reaction layer thickness.

3.3. Effect of Brazing Temperature and Heating Rate on Mechanical Properties

Shear tests were performed on brazed joints fabricated under various processing parameters, with the strength results shown in Figure 11a. The data indicate that lowering the heating rate enhances the shear strength and alters its dependence on the brazing temperature. For specimens brazed at a heating rate of 10 °C/min, the shear strength gradually decreased as the brazing temperature increased. Conversely, at the lower heating rate of 2.5 °C/min, the shear strength initially increased with the temperature. The maximum shear strength of 224 MPa (with an average of 170 ± 61 MPa) was achieved at 940 °C with a heating rate of 2.5 °C/min. The strength decreased when the temperature was higher than 940 °C.
We performed a numerical analysis on the effects of the brazing temperature and heating rate on the joint shear strength using IBM SPSS Statistics 26.0. A two-way ANOVA was initially considered. However, since Levene’s test for homogeneity of variances indicated a violation of the assumption (F(7, 16) = 5.328, p = 0.003), a one-way ANOVA with Welch’s correction was employed instead. The analysis revealed that the combination of different brazing temperatures and heating rates had a statistically significant effect on the shear strength (Welch’s F(7, 6.595) = 18.944, p = 0.001).
Subsequent post hoc comparisons using the Games–Howell test indicated a significant difference in shear strength between the group with a low brazing temperature (900 °C) and a low heating rate (2.5 °C/min) and the group with a high brazing temperature (1000 °C) and a high heating rate (10 °C/min) (p = 0.020). A significant difference was also found between the low brazing temperature (900 °C) and low heating rate (2.5 °C/min) group and the high brazing temperature (1100 °C) and low heating rate (2.5 °C/min) group (p = 0.006). These results confirm that an excessively high brazing temperature significantly reduces the shear strength, regardless of whether a low or high heating rate is used.
Similarly, independent-samples t-tests were conducted for the two variables. For the heating rate, the independent-samples t-test indicated a statistically significant difference in shear strength between the high heating rate (10 °C/min) and the low heating rate (2.5 °C/min) groups. Since Levene’s test for equality of variances was significant (F = 6.19, p = 0.021), suggesting unequal variances, the corrected t-statistic was adopted as follows: t(14.129) = 3.729, p = 0.002. The mean shear strength for the high heating rate group was 53.30 MPa (SD = 22.603), compared to 121.62 MPa (SD = 59.309) for the low heating rate group. The mean difference was 68.32 MPa, with a 95% confidence interval ranging from 29.053MPa to 107.580MPa. These data demonstrate that reducing the heating rate significantly enhances the shear strength of the joints.
In contrast, for the brazing temperature, the independent-samples t-test revealed no statistically significant difference in shear strength between the high brazing temperature (1000 °C, 1100 °C) and low brazing temperature (900 °C, 940 °C) groups. Levene’s test was not significant (F = 0.160, p = 0.693), indicating homogeneity of variances. Therefore, the standard t-test result was reported as follows: t(22) = −1.573, p = 0.130. The mean shear strength was 70.00 MPa (SD = 50.441) for the high-temperature group and 104.92 MPa (SD = 58.008) for the low-temperature group. The mean difference was −34.917 MPa, with a 95% confidence interval ranging from −80.938MPa to 11.104MPa. This non-significant result is potentially due to the large variability in shear strength measurements as well as the large process window for brazing. Increasing the number of shear tests in future work is recommended to improve the accuracy and reliability of the findings.
To further investigate the fracture mechanisms under different processing parameters, an SEM analysis using backscattered electron imaging was conducted on the fracture surfaces of the 940 °C, 2.5 °C/min joint after the shear test. Figure 11b shows a representative fracture morphology, with most fractures occurring within the Al2O3 ceramic. An enlarged view of the metal-containing regions, as shown in Figure 11c, was analyzed by EDS at multiple points. As summarized in Table 4, three distinct phases were identified as follows: Al2O3 ceramic, reaction layers containing Ti-O-Fe-Ni, and filler layers composed of Ag and Cu.
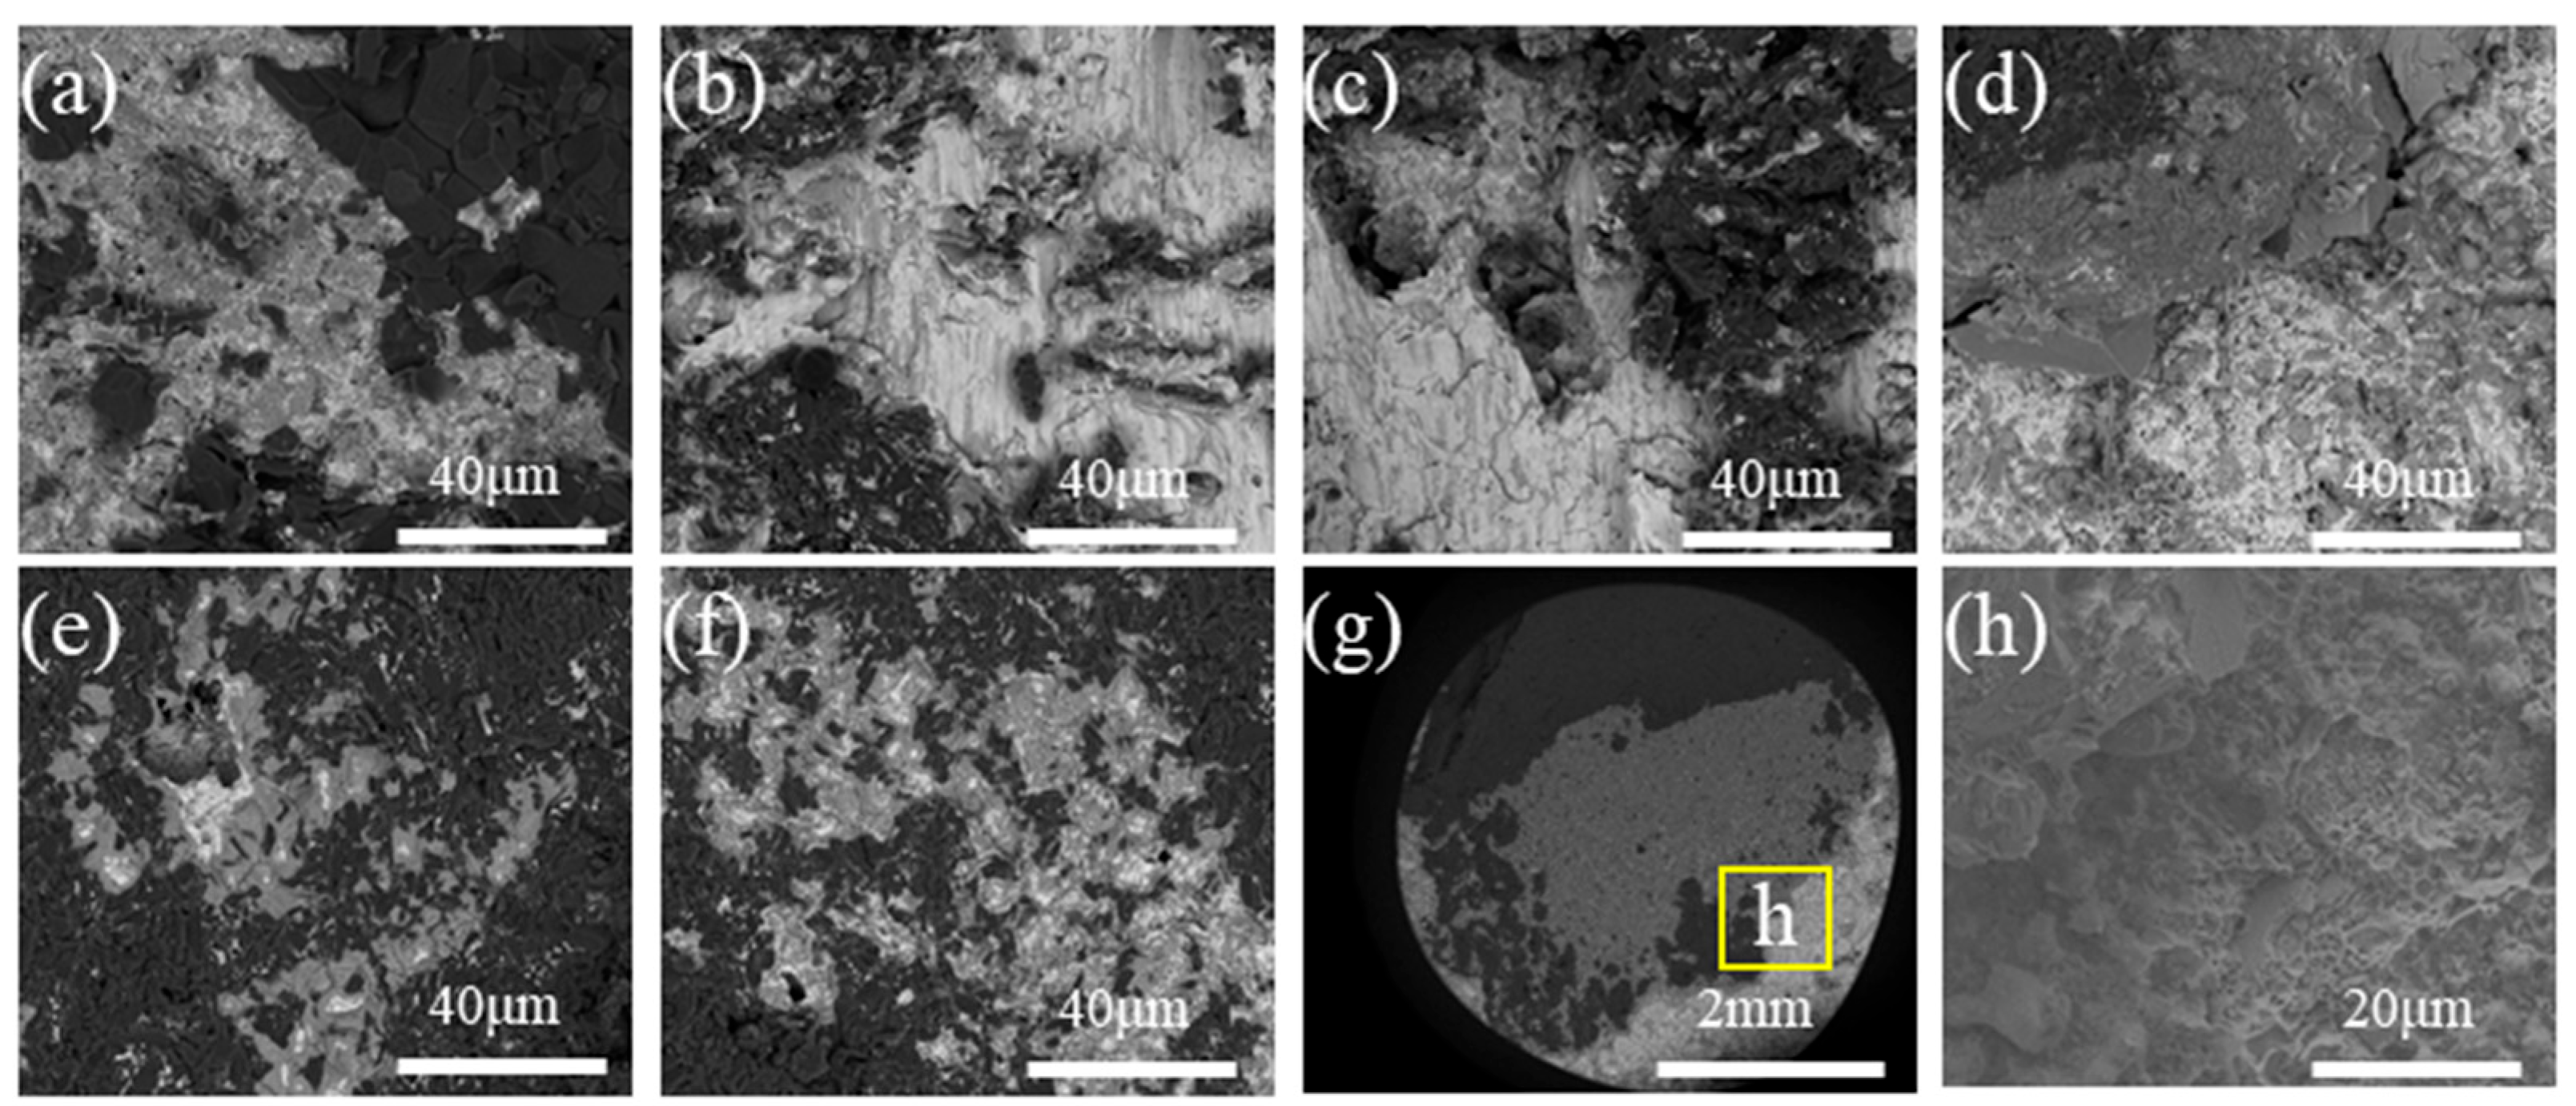
After performing shear tests on joints fabricated under various processing parameters, fracture analysis revealed that, except for the joints brazed at 1100 °C with a heating rate of 2.5 °C/min, most joints exhibited fracture propagation within the Al2O3 ceramic matrix. Only a few fractures occurred in the bonding layer or filler metal layer. Enlarged views of the metal-containing regions are presented in Figure 12a–f.
Figure 12a–d show the fracture morphologies of joints brazed at a heating rate of 2.5 °C/min after shear testing, while Figure 12e,f show those of joints under a heating rate of 10 °C/min. It is observed that lowering the heating rate induced a shift in the fracture location from the reaction layer to the filler metal layer for the 940 °C group, indicating enhanced bonding strength that prevented failure within the reaction layer. This shift explains the observed increase in shear strength at lower heating rates. Furthermore, for joints brazed at a heating rate of 2.5 °C/min, increasing the brazing temperature gradually shifted the fracture location from the reaction layer to the filler metal layer, and led to more pronounced tearing in the filler metal as the temperature increased. This behavior can be attributed to the prolonged reaction time associated with higher brazing temperatures, which enhances the reaction layer strength and shifts the fracture site away from the reaction layer toward the filler metal. However, at even higher temperatures, the intermetallic compounds formed within the filler metal become excessively large. These hard and brittle intermetallics induce stress concentration during cooling and thus generate residual stresses, weakening the filler metal layer.
At the excessively high brazing temperature of 1100 °C, the SEM-observed fracture morphology of the joint is presented in Figure 12g. Severe loss of filler metal occurs during brazing, leaving only the reaction layer and intermetallic compounds filling the joint gap in the ceramic bonding region. Consequently, the underlying Kovar substrate grains were visible beneath the residual filler layer. The Ag-Cu filler metal, which accumulated at the joint edges, melted and solidified, resulting in a weak and unstable connection with the ceramic. Fracture surfaces exhibited ductile characteristics, including dimples, as shown in Figure 12h.

4. Discussion

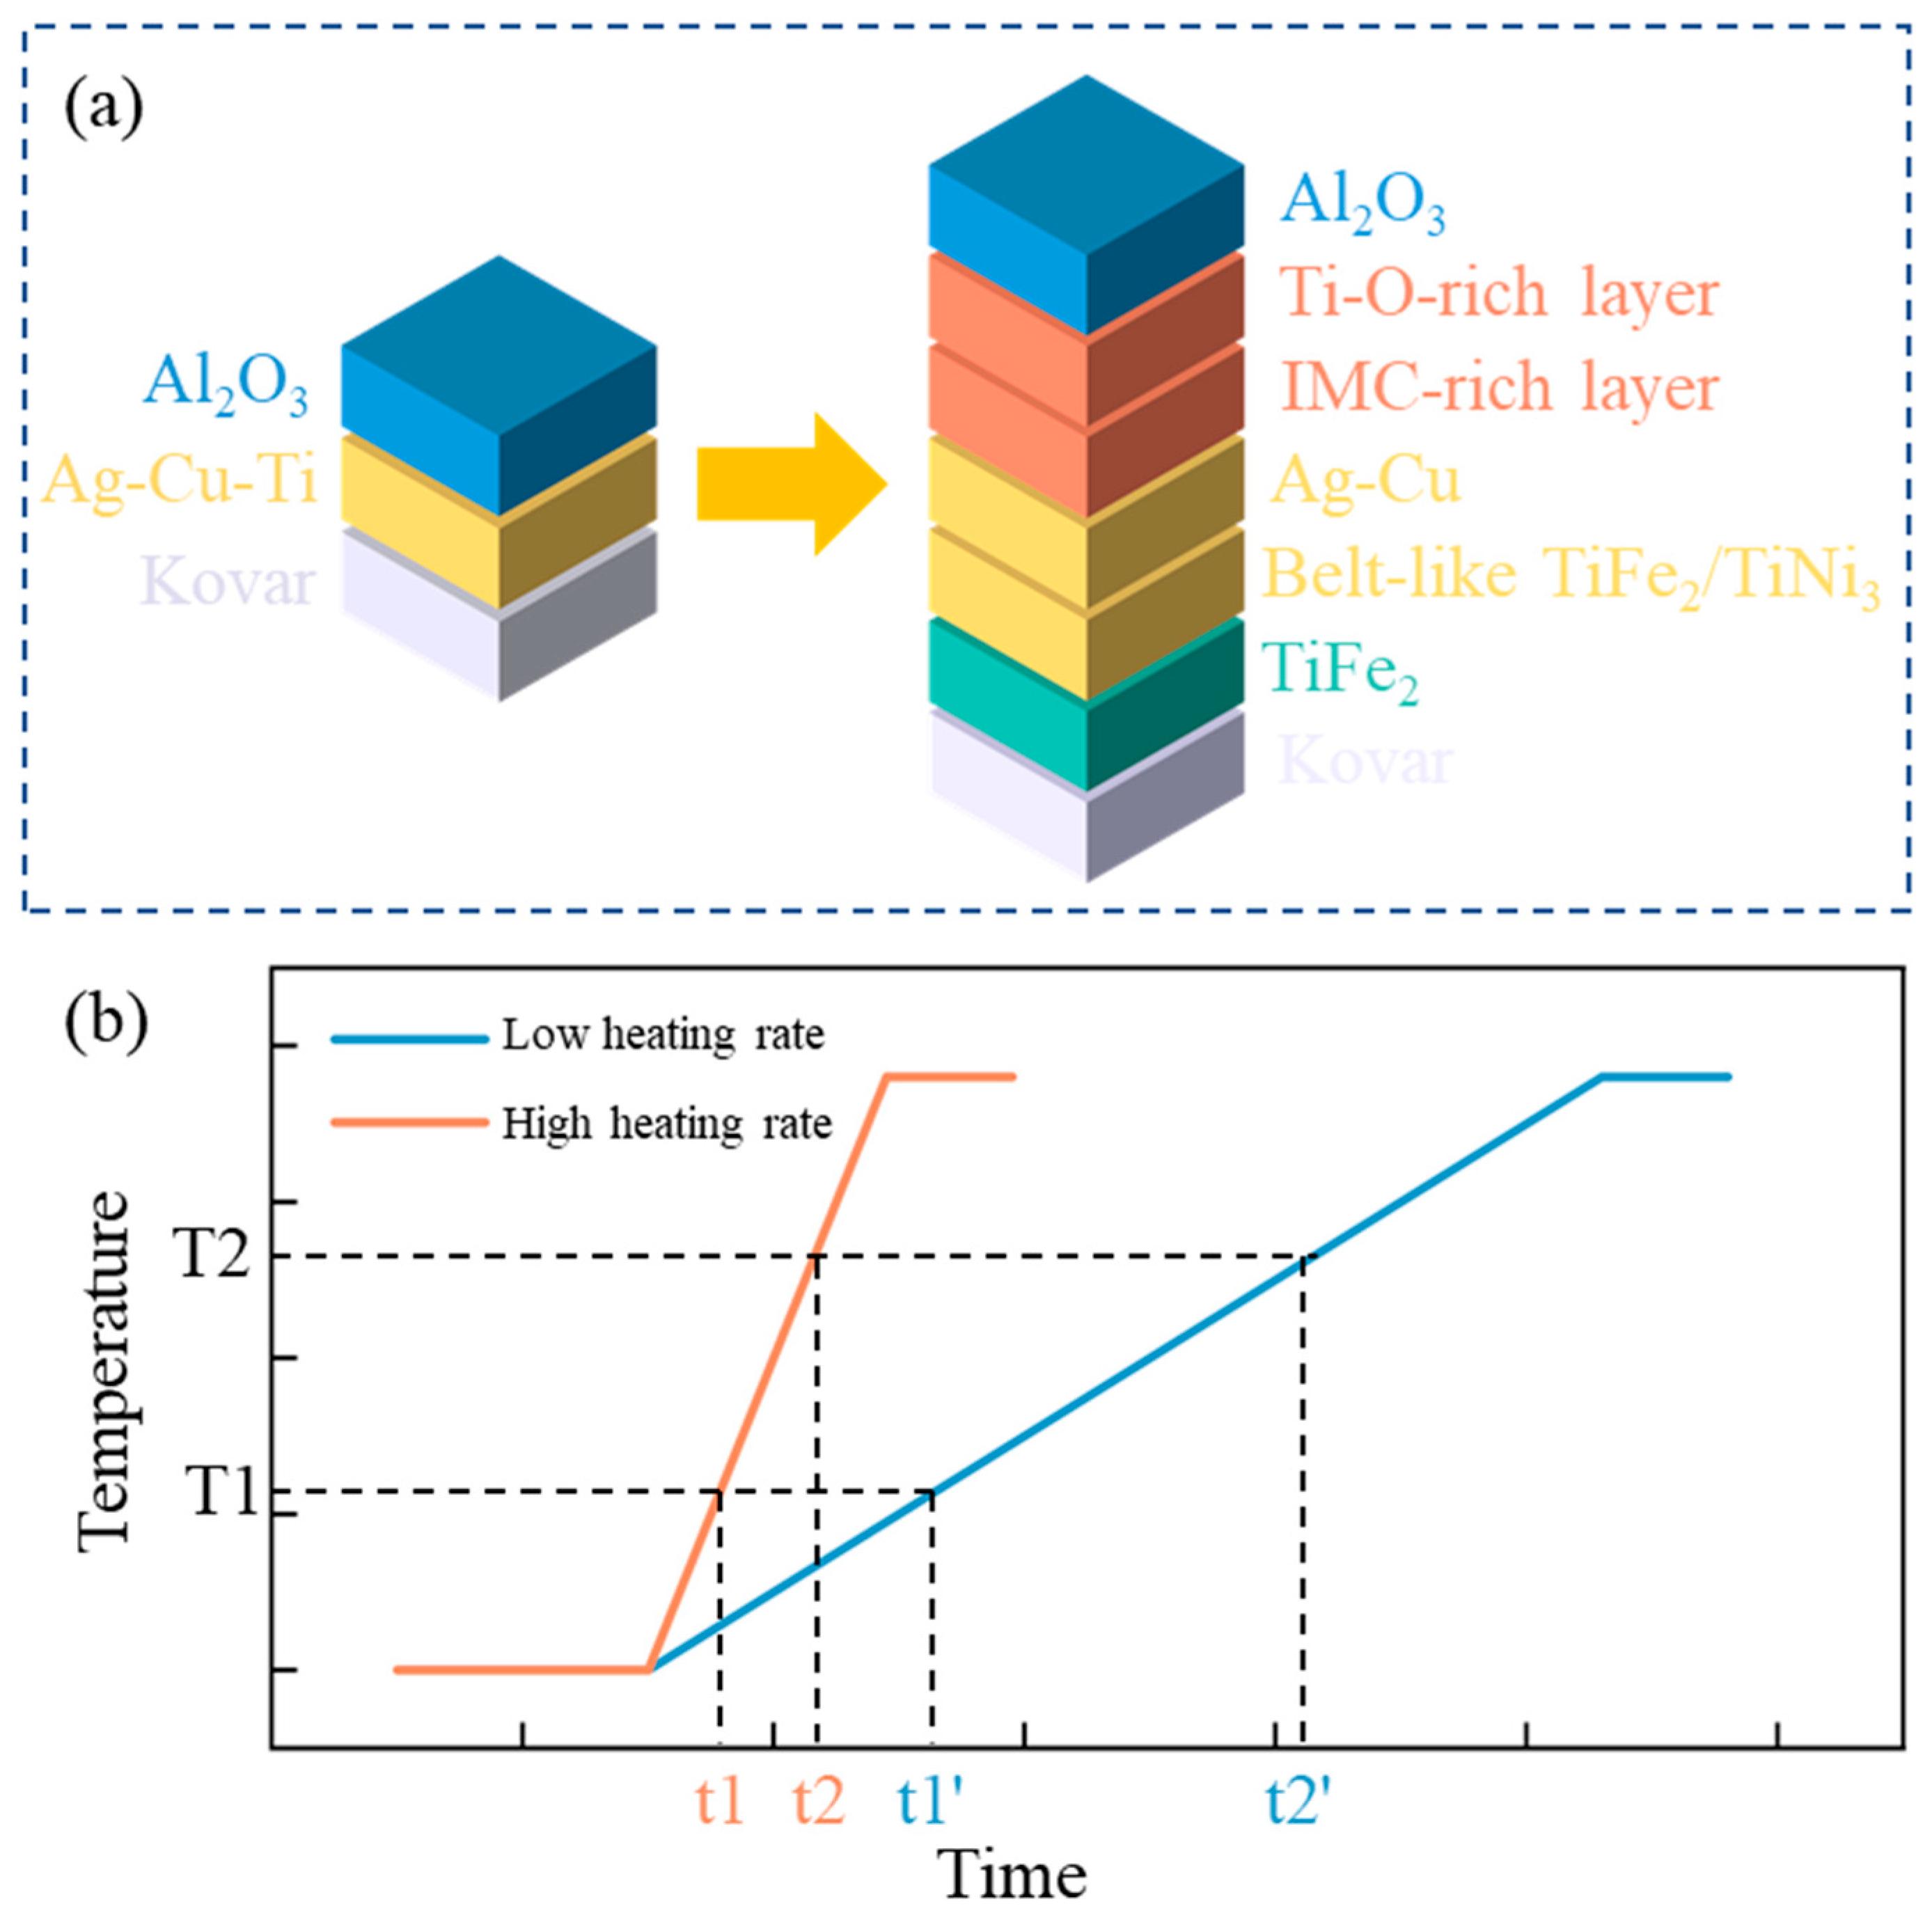
To elucidate the influence of the process parameters on the shear strength, a comprehensive understanding of the interplay between the processing conditions, microstructure, and mechanical performance is essential. As illustrated in Figure 13a, the joint structure transforms during brazing from a three-layer configuration—Al2O3 ceramic/active filler metal/Kovar substrate—into a five-layer structure: Al2O3 ceramic/ceramic-side reaction layer composed of a TiO-rich layer and IMC-rich layer/Ag-Cu filler metal layer and belt-like intermetallic compounds (TiFe2 and TiNi3) within the filler/Kovar-side reaction layer containing particulate TiFe2 intermetallics/Kovar substrate. Fracture analysis suggests that the ceramic-side reaction layer is the critical region for joint failure and thus warrants special attention. In a study by Ali et al., where two kinds of active brazing fillers (Cusil ABA and Trucil ABA) were used to join two sapphire substrates, a layered bonding zone was observed. Under brazing conditions of 900 °C for 1 min, the bonding zone could be divided into Ti3Cu3O and γ-TiO [11]. The presence of γ-TiO is likely to impede the diffusion of Ti and O atoms, and if this layer of TiO grows excessively thick, it may limit the extent of the bonding reactions, ultimately inhibiting the formation of a continuous, effective reaction layer.
Meantime, by comparing layer thickness variations under different processing parameters, particularly the EPMA results for the 900 °C brazed joint (heating rate: 2.5 °C/min), where no IMC-rich layer was detected, several insights emerge as follows: the IMC-rich layer forms only at elevated temperatures, with its thickness increasing as the brazing temperature rises. This is primarily because Fe and Ni in the mixed layer originate from the Kovar alloy and require relatively long diffusion distances, whereas Ti in the filler metal reacts earlier with O from the Al2O3 substrate to form the Ti-O-rich layer. It could be indicated that the Ti-O reaction initiates at a lower temperature than that required for IMC formation, which implies that the Ti-O-rich layer forms earlier during heating. The heating rate translates this temperature difference into a time difference, thereby affecting the Ti-O-rich layer thickness at the onset of IMC-rich layer formation. As illustrated in Figure 13b, let T1 denote the temperature at which Ti-O formation begins, and T2 the temperature at which IMC formation starts. Correspondingly, t1 and t2 represent the reaction times at T1 and T2, respectively. Under a high heating rate, the furnace quickly heats from T1 to T2, resulting in a short reaction interval Δt = t2 − t1. In contrast, a low heating rate prolongs this interval, providing a longer Δt. Consequently, the Ti-O-rich layer has more time to grow before the IMC-rich layer forms, leading to a thicker Ti-O-rich layer at the onset of IMC-rich layer formation under slower heating. Additionally, higher brazing temperatures enhance Fe and Ni diffusion, further promoting IMC-rich layer growth.
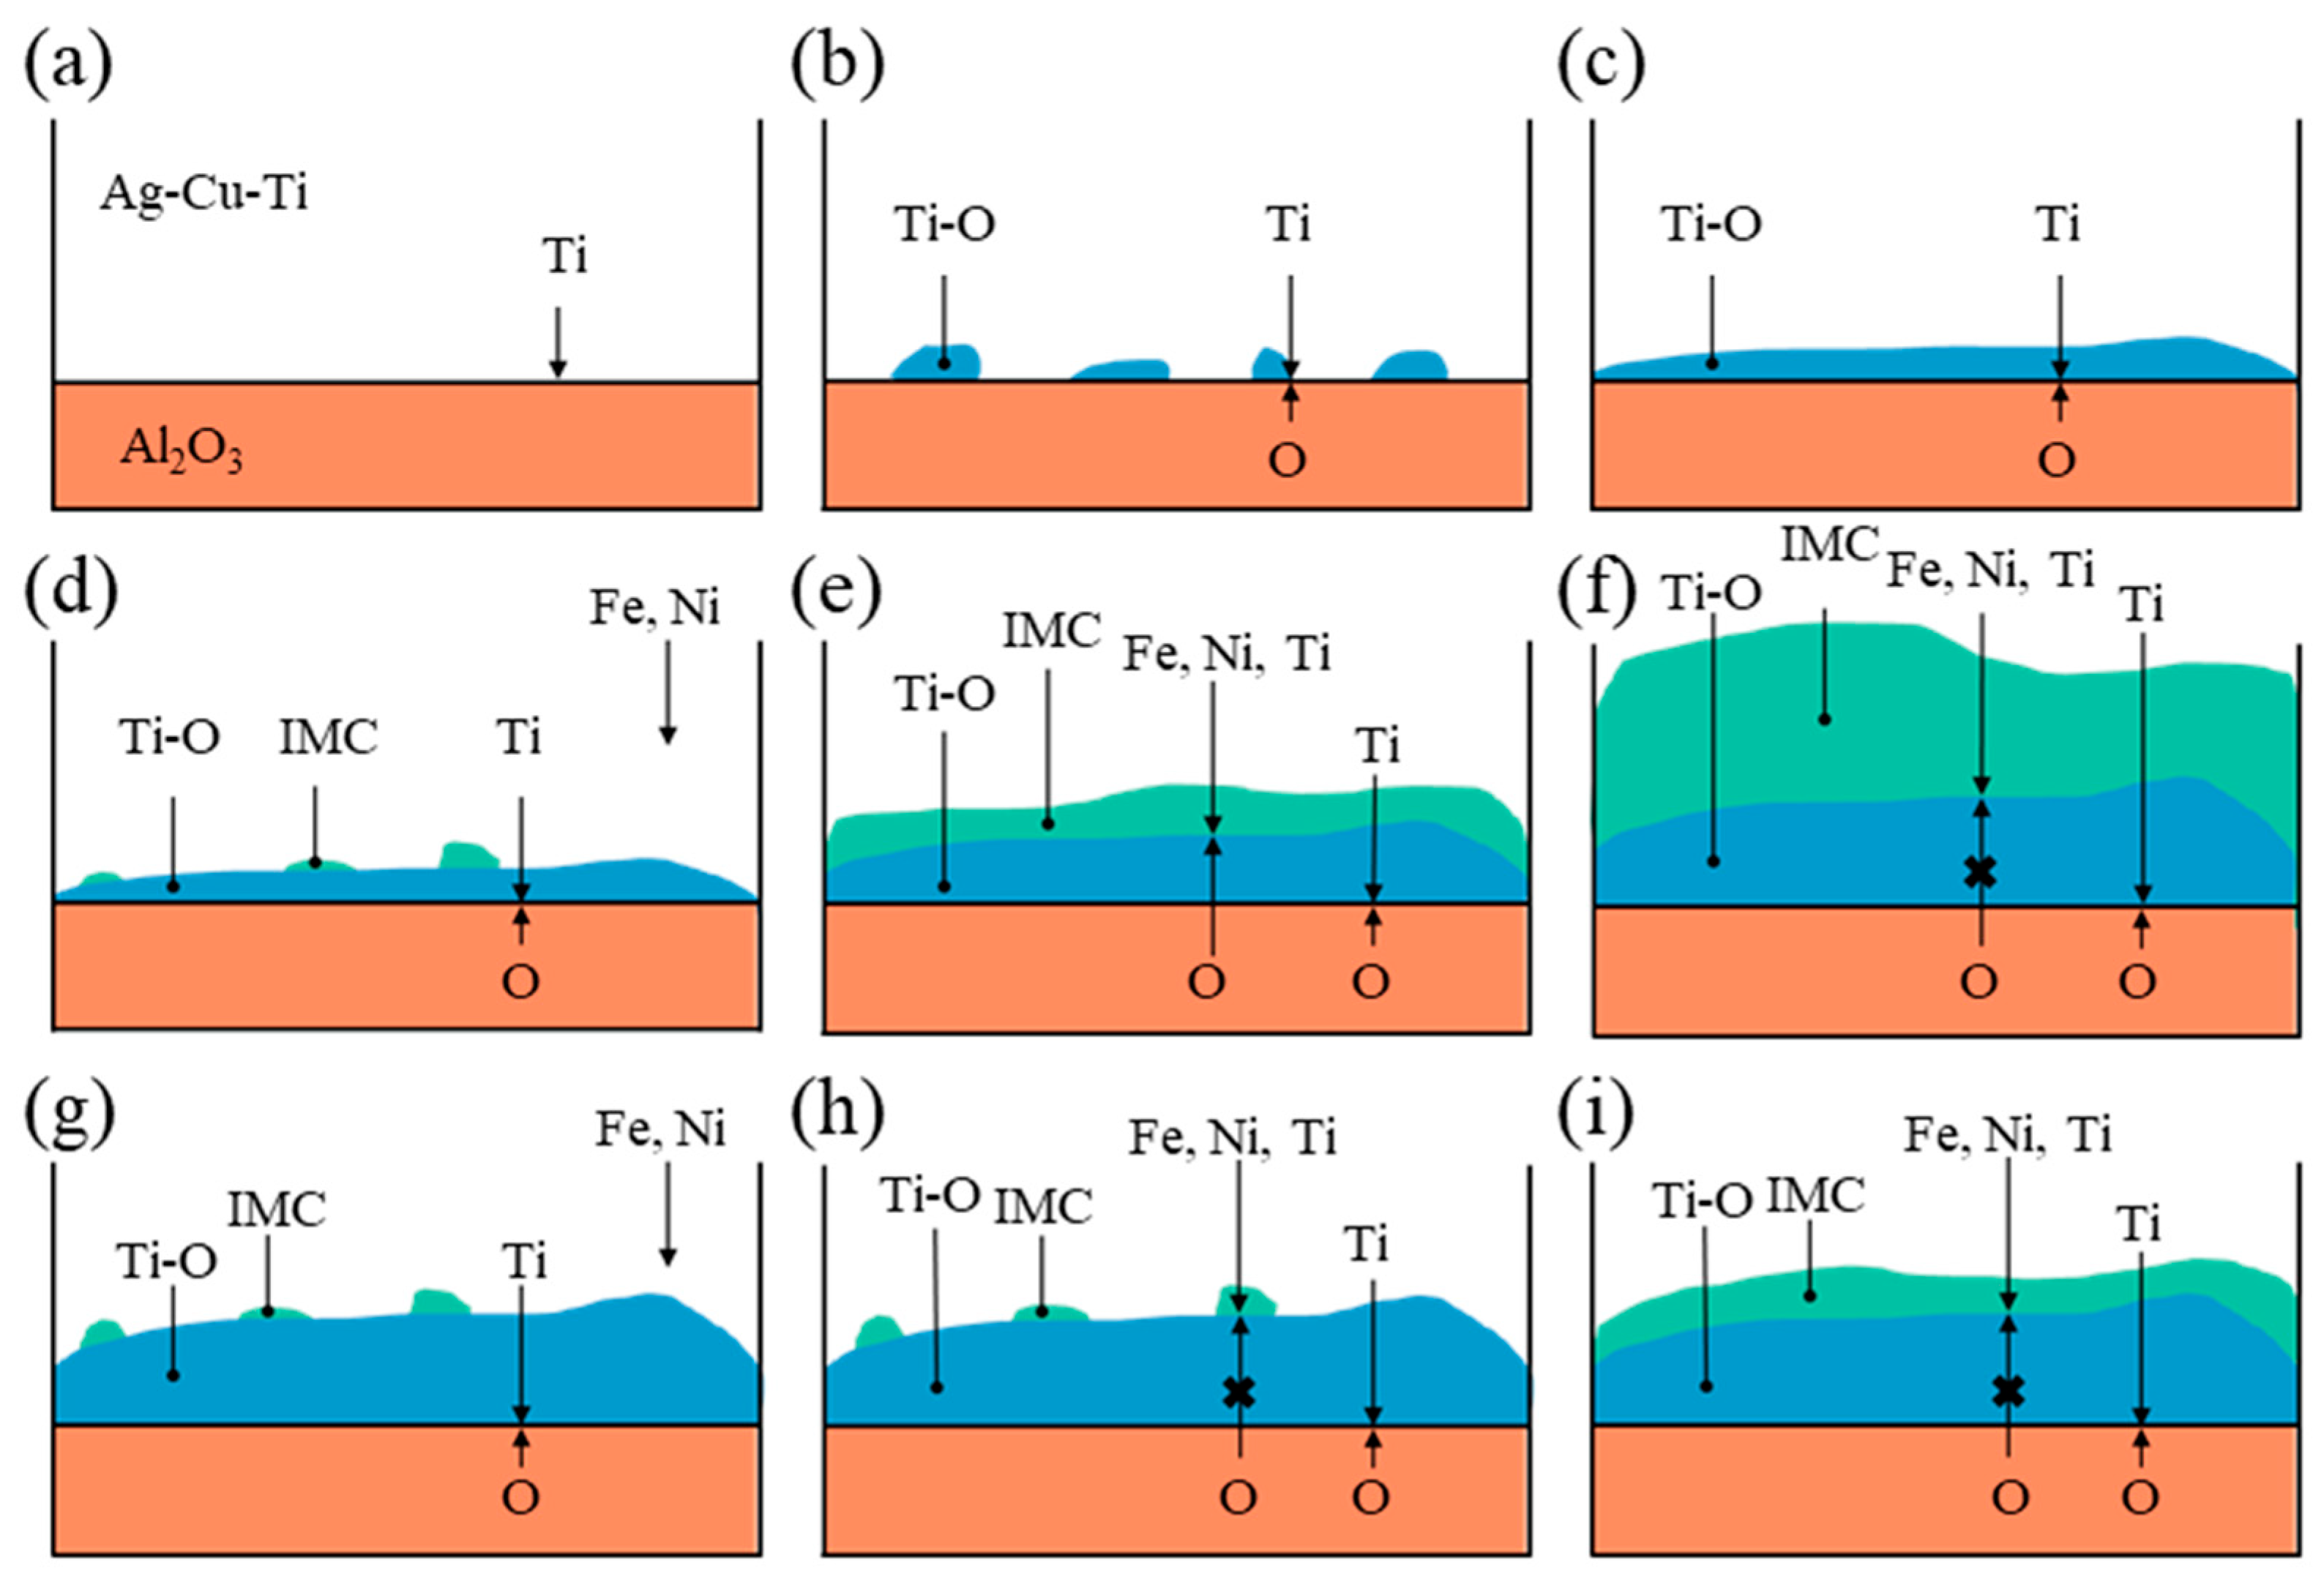
Since a dense Ti-O-rich layer hinders oxygen diffusion, it also influences the subsequent growth of both the Ti-O- and IMC-rich layers. The formation mechanism of the reaction layer on the ceramic side during brazing is illustrated schematically in Figure 14. As shown in Figure 14a–c, Al2O3 ceramics react with the active Ti element in the filler metal to form a Ti-O-rich layer at first. As the reaction progresses and the furnace temperature rises, Fe and Ni diffuse from the Kovar side toward the ceramic reaction layer. For the high heating rate group, as shown in Figure 14d–f, the Ti-O-rich layer remains relatively thin and cannot effectively restrict oxygen diffusion, which allows oxide formation within the IMC-rich layer, promoting the gathering of Fe and Ni, thus accelerating the growth of the IMC-rich layer, and both the Ti-O-rich layer and IMC-rich layer thicken simultaneously; in contrast, for the low heating rate group, as shown in Figure 14g–i, a thicker Ti-O-rich layer forms at an early stage, significantly hindering oxygen diffusion and thereby suppressing the growth of the IMC-rich layer.
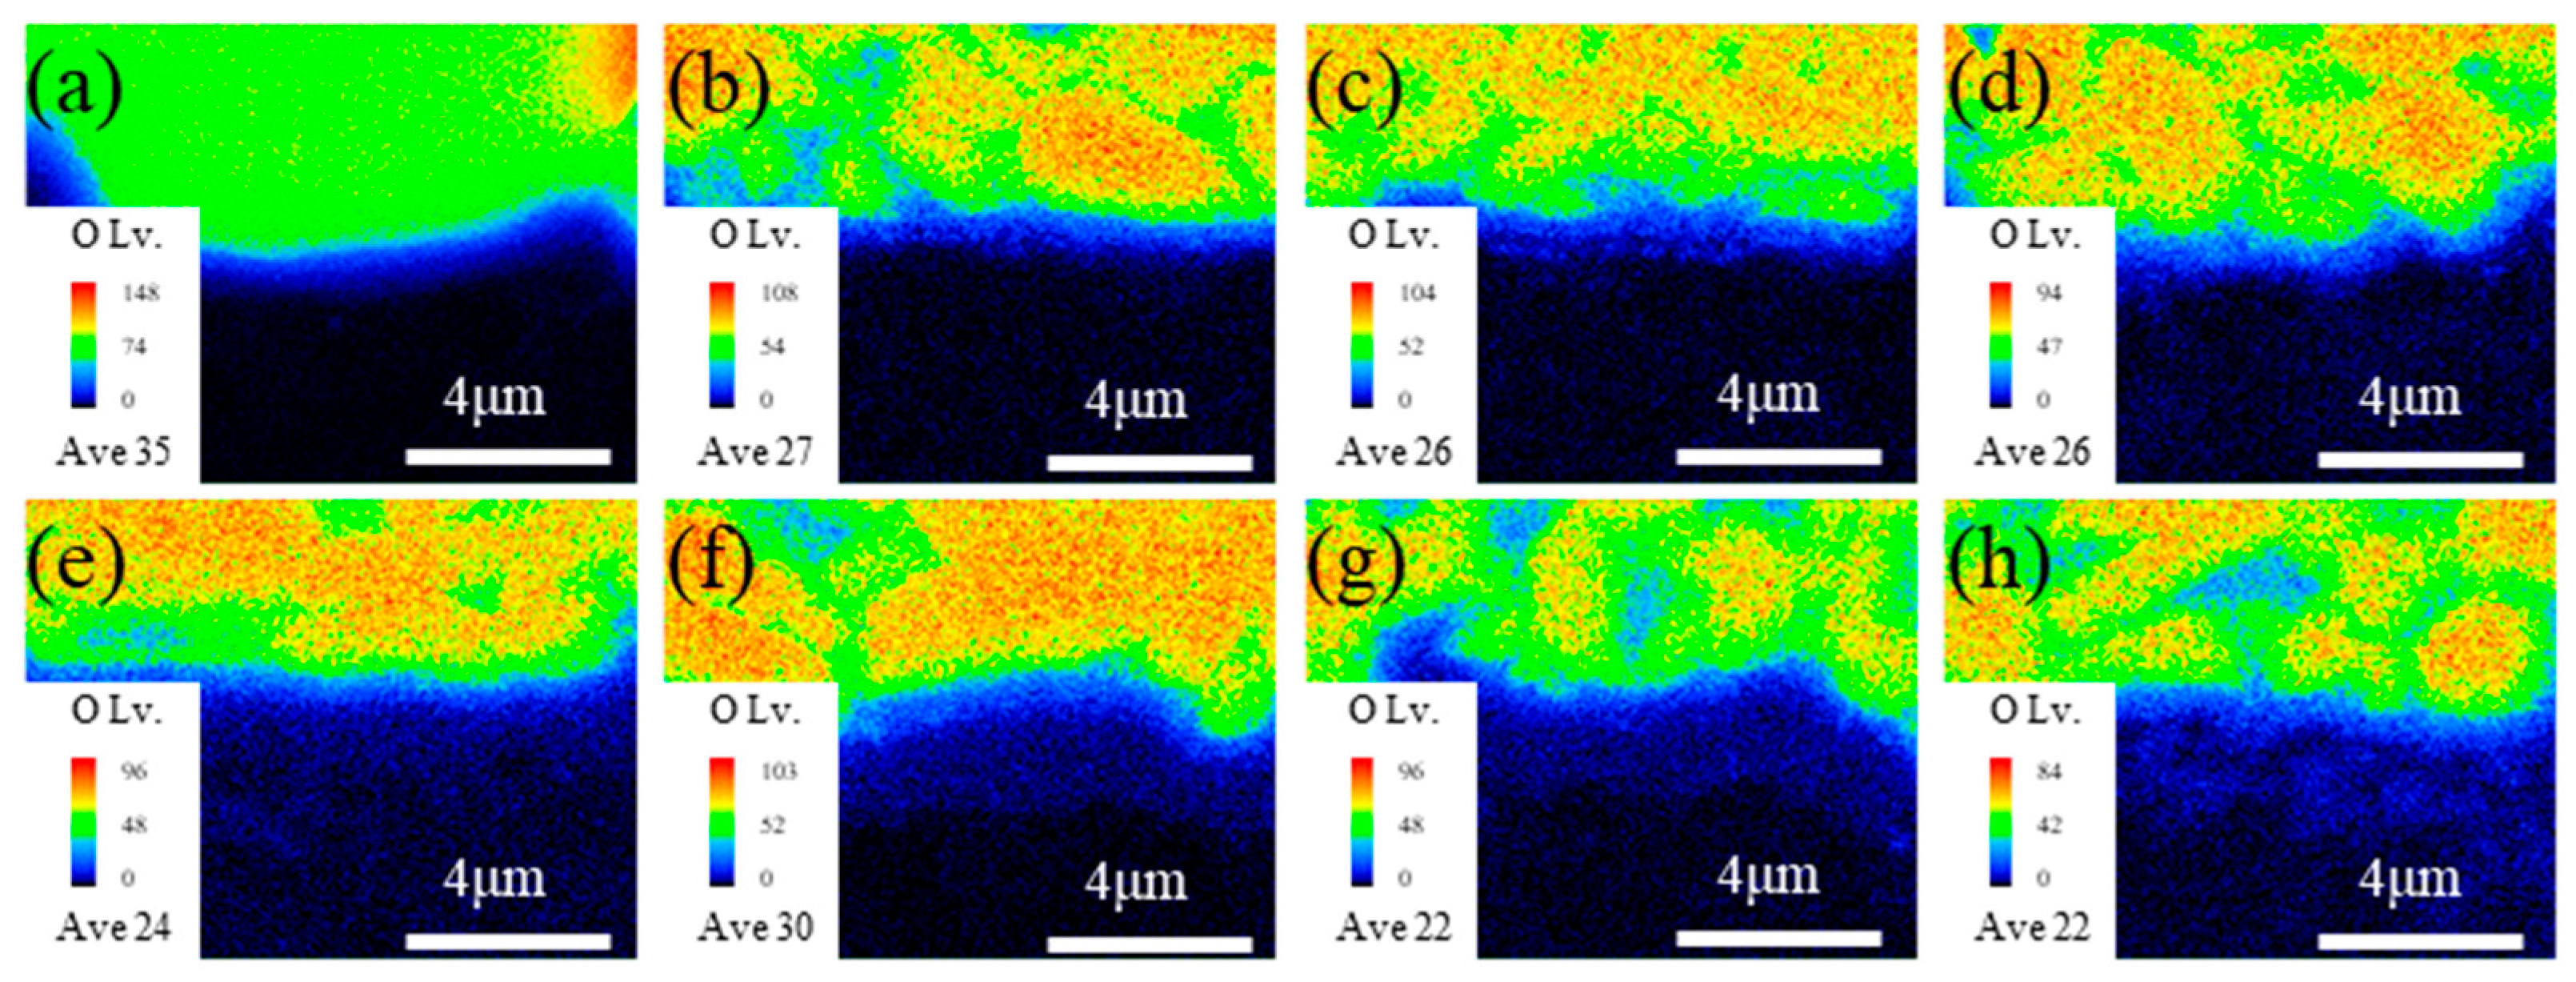
An important factor discussed above is whether the Ti-O-rich layer influences oxygen diffusion, thereby affecting the growth of the IMC-rich layer. To investigate this effect, the oxygen distribution under different processing parameters was compared. Figure 15a–d present the oxygen distribution near the reaction layer on the Al2O3 side at brazing temperatures of 900–1100 °C with a heating rate of 2.5 °C/min. Figure 15e–h show the corresponding distributions at the same temperatures with a heating rate of 10 °C/min. The comparison clearly shows that a lower heating rate significantly suppresses oxygen diffusion, directly supporting the earlier hypothesis that a thicker Ti-O-rich layer formed under slower heating limits the transportation of oxygen, which in turn inhibits the excessive accumulation of Fe and Ni elements and consequently restricts the growth of the IMC-rich layer. Under high heating rates, the excessively thick IMC-rich layer forms a mechanically weak region, leading to fracture propagation within the reaction layer during shear testing; joints produced under low heating rates typically fracture within the filler metal region.

5. Conclusions

Direct brazing of a 95% alumina ceramic to a 4J34 Kovar alloy was performed using a Ag-Cu-Ti active filler metal, and the effects of the brazing temperature and heating rate on the interfacial microstructure and mechanical properties were studied. The following conclusions were drawn:
  • The typical microstructure of the brazed joint could be divided into five layers as follows: Al2O3/ceramic-side reaction layer/filler layer/Kovar-side reaction layer/Kovar. The ceramic-side reaction layer can be further divided into a Ti-O-rich layer and IMC-rich layer, and the filler layer is composed of a Ag-Cu eutectic with a TiFe2 + TiNi3 belt-like IMC embedded. The Kovar-side reaction layer consists of TiFe2 IMC particles, Ag-Cu eutectic, and the remaining Kovar base metal.
  • For both heating rates, as the brazing temperature increases, the size of the TiFe2 + TiNi3 belt in the filler layer and the thickness of the IMC-rich layer in the ceramic-side reaction layer increase while the Ti-O-rich layer in the ceramic-side reaction layer remains relatively constant. For the same brazing temperature, using a higher heating rate (10 °C/min) results in a much thicker IMC-rich layer in the ceramic-side reaction layer.
  • The formation of the ceramic-side reaction layer can be divided into two steps. Firstly, Ti in the brazing filler metal reacts with O from Al2O3 to form the Ti-O-rich layer at a relatively low temperature in the heating process. Secondly, as the temperature increases, the IMC-rich layer forms between the Ti-O-rich layer and the filler layer. The thickness of the formed Ti-O-rich layer will affect the diffusion rate of O, thereby affecting the thickness of the IMC-rich layer.
  • A lower heating rate of 2.5 °C/min consistently yielded higher shear strengths than 10 °C/min. The optimal parameters were 940 °C with the 2.5 °C/min rate, producing a peak strength of 224 MPa (average 170 ± 61 MPa). At this slower rate, the strength initially increased with the temperature (900–940 °C) then decreased, whereas it only decreased at the faster rate.
  • The brazing parameters should be optimized to obtain an appropriate thickness of the ceramic-side IMC-rich layer, so as to shift the fracture position from the ceramic-side reaction layer to the filler layer in shear tests, and increase the overall shear strength of the brazed joints.
  • Future work should systematically investigate a wider range of brazing temperature and heating rate combinations to identify the optimal processing window. Concurrently, finite element analysis (FEA) should be employed to study the residual stress distribution within the brazed joints and to explore strategies for mitigating these stresses, thereby further enhancing mechanical performance. Furthermore, the mechanical characterization of the joints should be augmented by including other testing methods, such as tensile strength and toughness measurements. The percentage of the ceramic region in the fracture surface analysis can be used to evaluate changes in the bonding degree between the ceramic and the filler metal.

Author Contributions

Conceptualization, J.Q. and H.Y.; data curation, D.Z.; formal analysis, J.Q.; funding acquisition, H.Y.; investigation, J.Q.; methodology, D.D., S.X. and B.C.; software, J.Z.; supervision, D.D. and B.C.; validation, J.Q. and J.Y.; writing—original draft preparation, J.Q.; writing—review and editing, B.C. All authors have read and agreed to the published version of the manuscript.

Funding

This work was supported by the Joint Funds of Jiangsu Open bidding for selecting the best candidates (JB2023020).

Data Availability Statement

The raw data supporting the conclusions of this article will be made available by the authors on request.

Conflicts of Interest

Author Haifei You was employed by the Vicvac Electronics Technology Co., Ltd. The remaining authors declare that the research was conducted in the absence of any commercial or financial relationships that could be construed as a potential conflict of interest.

References

  1. Zhang, S.; Lin, J. Improvement of microstructure and mechanical properties of Sapphire/Kovar alloy joints brazed with Ag-Cu-Ti composite filler by adding B powders. J. Manuf. Process. 2023, 99, 243–253. [Google Scholar] [CrossRef]
  2. Yang, M.; Lin, T. In situ synthesis of TiB whisker reinforcements in the joints of Al2O3/TC4 during brazing. Mater. Sci. Eng. A 2011, 528, 3520–3525. [Google Scholar] [CrossRef]
  3. Niu, G.B.; Wang, D.P. Microstructure and mechanical properties of Al2O3/TiAl joints brazed with B powders reinforced Ag-Cu-Ti based composite fillers. Ceram. Int. 2017, 43, 439–450. [Google Scholar] [CrossRef]
  4. Mandal, S.; Ray, A.K. Correlation between the mechanical properties and the microstructural behaviour of Al2O3-(Ag-Cu-Ti) brazed joints. Mater. Sci. Eng. A 2004, 383, 235–244. [Google Scholar] [CrossRef]
  5. Fu, W.; Hu, S.P. Effect of Ti content on the metallization layer and copper/alumina brazed joint. Ceram. Int. 2017, 43, 13206–13213. [Google Scholar] [CrossRef]
  6. Xin, C.; Yan, J. Microstructural evolution during the brazing of Al2O3 ceramic to kovar alloy by sputtering Ti/Mo films on the ceramic surface. Ceram. Int. 2016, 42, 12586–12593. [Google Scholar] [CrossRef]
  7. Xin, C.; Liu, W. Metallization of Al2O3 ceramic by magnetron sputtering Ti/Mo bilayer thin films for robust brazing to Kovar alloy. Ceram. Int. 2016, 42, 9599–9604. [Google Scholar] [CrossRef]
  8. Nascimento, R.M.; Martinelli, A.E. Interface microstructure of alumina mechanically metallized with Ti brazed to Fe-Ni-Co using different fillers. Mater. Sci. Eng. A 2007, 466, 195–200. [Google Scholar] [CrossRef]
  9. Lin, P.; Lin, T. Microstructure evolution and mechanical properties of a vacuum-brazed Al2O3/Ti joint with Mo-coating on Al2O3 and Ti surfaces. Ceram. Int. 2019, 45, 11195–11203. [Google Scholar] [CrossRef]
  10. Ali, M.; Knowles, K.M. Microstructural evolution and characterisation of interfacial phases in Al2O3/Ag-Cu-Ti/Al2O3 braze joints. Acta Mater. 2015, 96, 143–158. [Google Scholar] [CrossRef]
  11. Ali, M.; Knowles, K.M. Interfacial reactions between sapphire and Ag-Cu-Ti-based active braze alloys. Acta Mater. 2016, 103, 859–869. [Google Scholar] [CrossRef]
  12. Li, P.; Yan, Y. The regulation strategy for releasing residual stress in ceramic-metal brazed joints. J. Manuf. Process. 2023, 85, 935–947. [Google Scholar] [CrossRef]
  13. Nai, X.; Wang, P. Unveiling solid-state transformation toughening mechanism of yttria stabilized zirconia on brazed joint by in-situ observation. J. Manuf. Process. 2024, 127, 211–217. [Google Scholar] [CrossRef]
  14. Nai, X.; Zhang, H. Strengthening Ti3SiC2/Cu brazed joint assisted with cold spray additive manufacturing: Lower brazing temperature through interdiffusion and graded reinforcement for stress relaxation. J. Mater. Process. Technol. 2024, 331, 118530. [Google Scholar] [CrossRef]
  15. Way, M.; Luo, D. A new high entropy alloy brazing filler metal design for joining skutterudite thermoelectrics to copper. J. Alloys Compd. 2021, 858, 157750. [Google Scholar] [CrossRef]
  16. Feng, Q.; Lin, P. Controllable distribution of reinforcements for reducing the strain energy in dissimilar ceramic/metal joints. J. Eur. Ceram. Soc. 2021, 41, 1076–1087. [Google Scholar] [CrossRef]
  17. Zhang, J.; Xu, J. High shear strength Kovar/AlN joints brazed with AgCuTi/Cu/AgCuTi sandwich composite filler. Mater. Sci. Eng. A 2023, 862, 144435. [Google Scholar] [CrossRef]
  18. Zhang, Y.; Chen, Y. Compound connection mechanism of Al2O3 ceramic and TC4 Ti alloy with different joining modes. Sci. Rep. 2021, 11, 21251. [Google Scholar] [CrossRef]
  19. Ali, M.; Knowles, K.M.; Mallinson, P.M.; Fernie, J.A. Active metal brazing of Al2O3 to Kovar® (Fe-29Ni-17Co wt.%) using Copper ABA® (Cu-3.0Si-2.3Ti-2.0Al wt.%). Philos. Mag. 2018, 98, 182–202. [Google Scholar] [CrossRef]
  20. Wang, Y.; Jin, C. Effects of Cu interlayers on the microstructure and mechanical properties of Al2O3/AgCuTi/Kovar brazed joints. Int. J. Appl. Ceram. Technol. 2019, 16, 896–906. [Google Scholar] [CrossRef]
  21. Zhu, W.; Chen, J. Effects of Ti thickness on microstructure and mechanical properties of alumina-Kovar joints brazed with Ag-Pd/Ti filler. Ceram. Int. 2014, 40, 5699–5705. [Google Scholar] [CrossRef]
  22. Wang, Y.; Feng, J.C. Microstructure of alumina ceramic/Ag-Cu-Ti brazing alloy/Kovar alloy joint. Mater. Sci. Technol. 2007, 23, 320–323. [Google Scholar] [CrossRef]
  23. Yu, Z.S.; Yang, P. Crack formation mechanisms in Al2O3/Kovar brazed joint. Mater. Sci. Technol. 2006, 22, 864–866. [Google Scholar] [CrossRef]
  24. Li, Y.; Chen, C. The brazing of Al2O3 ceramic and other materials. Int. J. Adv. Manuf. Technol. 2022, 120, 59–84. [Google Scholar] [CrossRef]
  25. Cao, Y.; Yan, J. Effects of brazing temperature on microstructure and mechanical performance of Al2O3/AgCuTi/Fe-Ni-Co brazed joints. J. Alloys Compd. 2015, 650, 30–36. [Google Scholar] [CrossRef]
  26. Wang, J.L.; Yang, Z.W. Microstructural stability and mechanical properties of Al2O3/Kovar 4 J34 joint vacuum brazed using Ag-5Cu-1Al-1.25Ti (wt%) filler metal. J. Manuf. Process. 2021, 72, 553–564. [Google Scholar] [CrossRef]
  27. Zhu, Q.; Li, S. Enhanced mechanical properties and thermal cycling stability of Al2O3-4J42 joints brazed using Ag-Cu-Ti/Cu/Ag-Cu composite filler. Ceram. Int. 2021, 47, 30247–30255. [Google Scholar] [CrossRef]
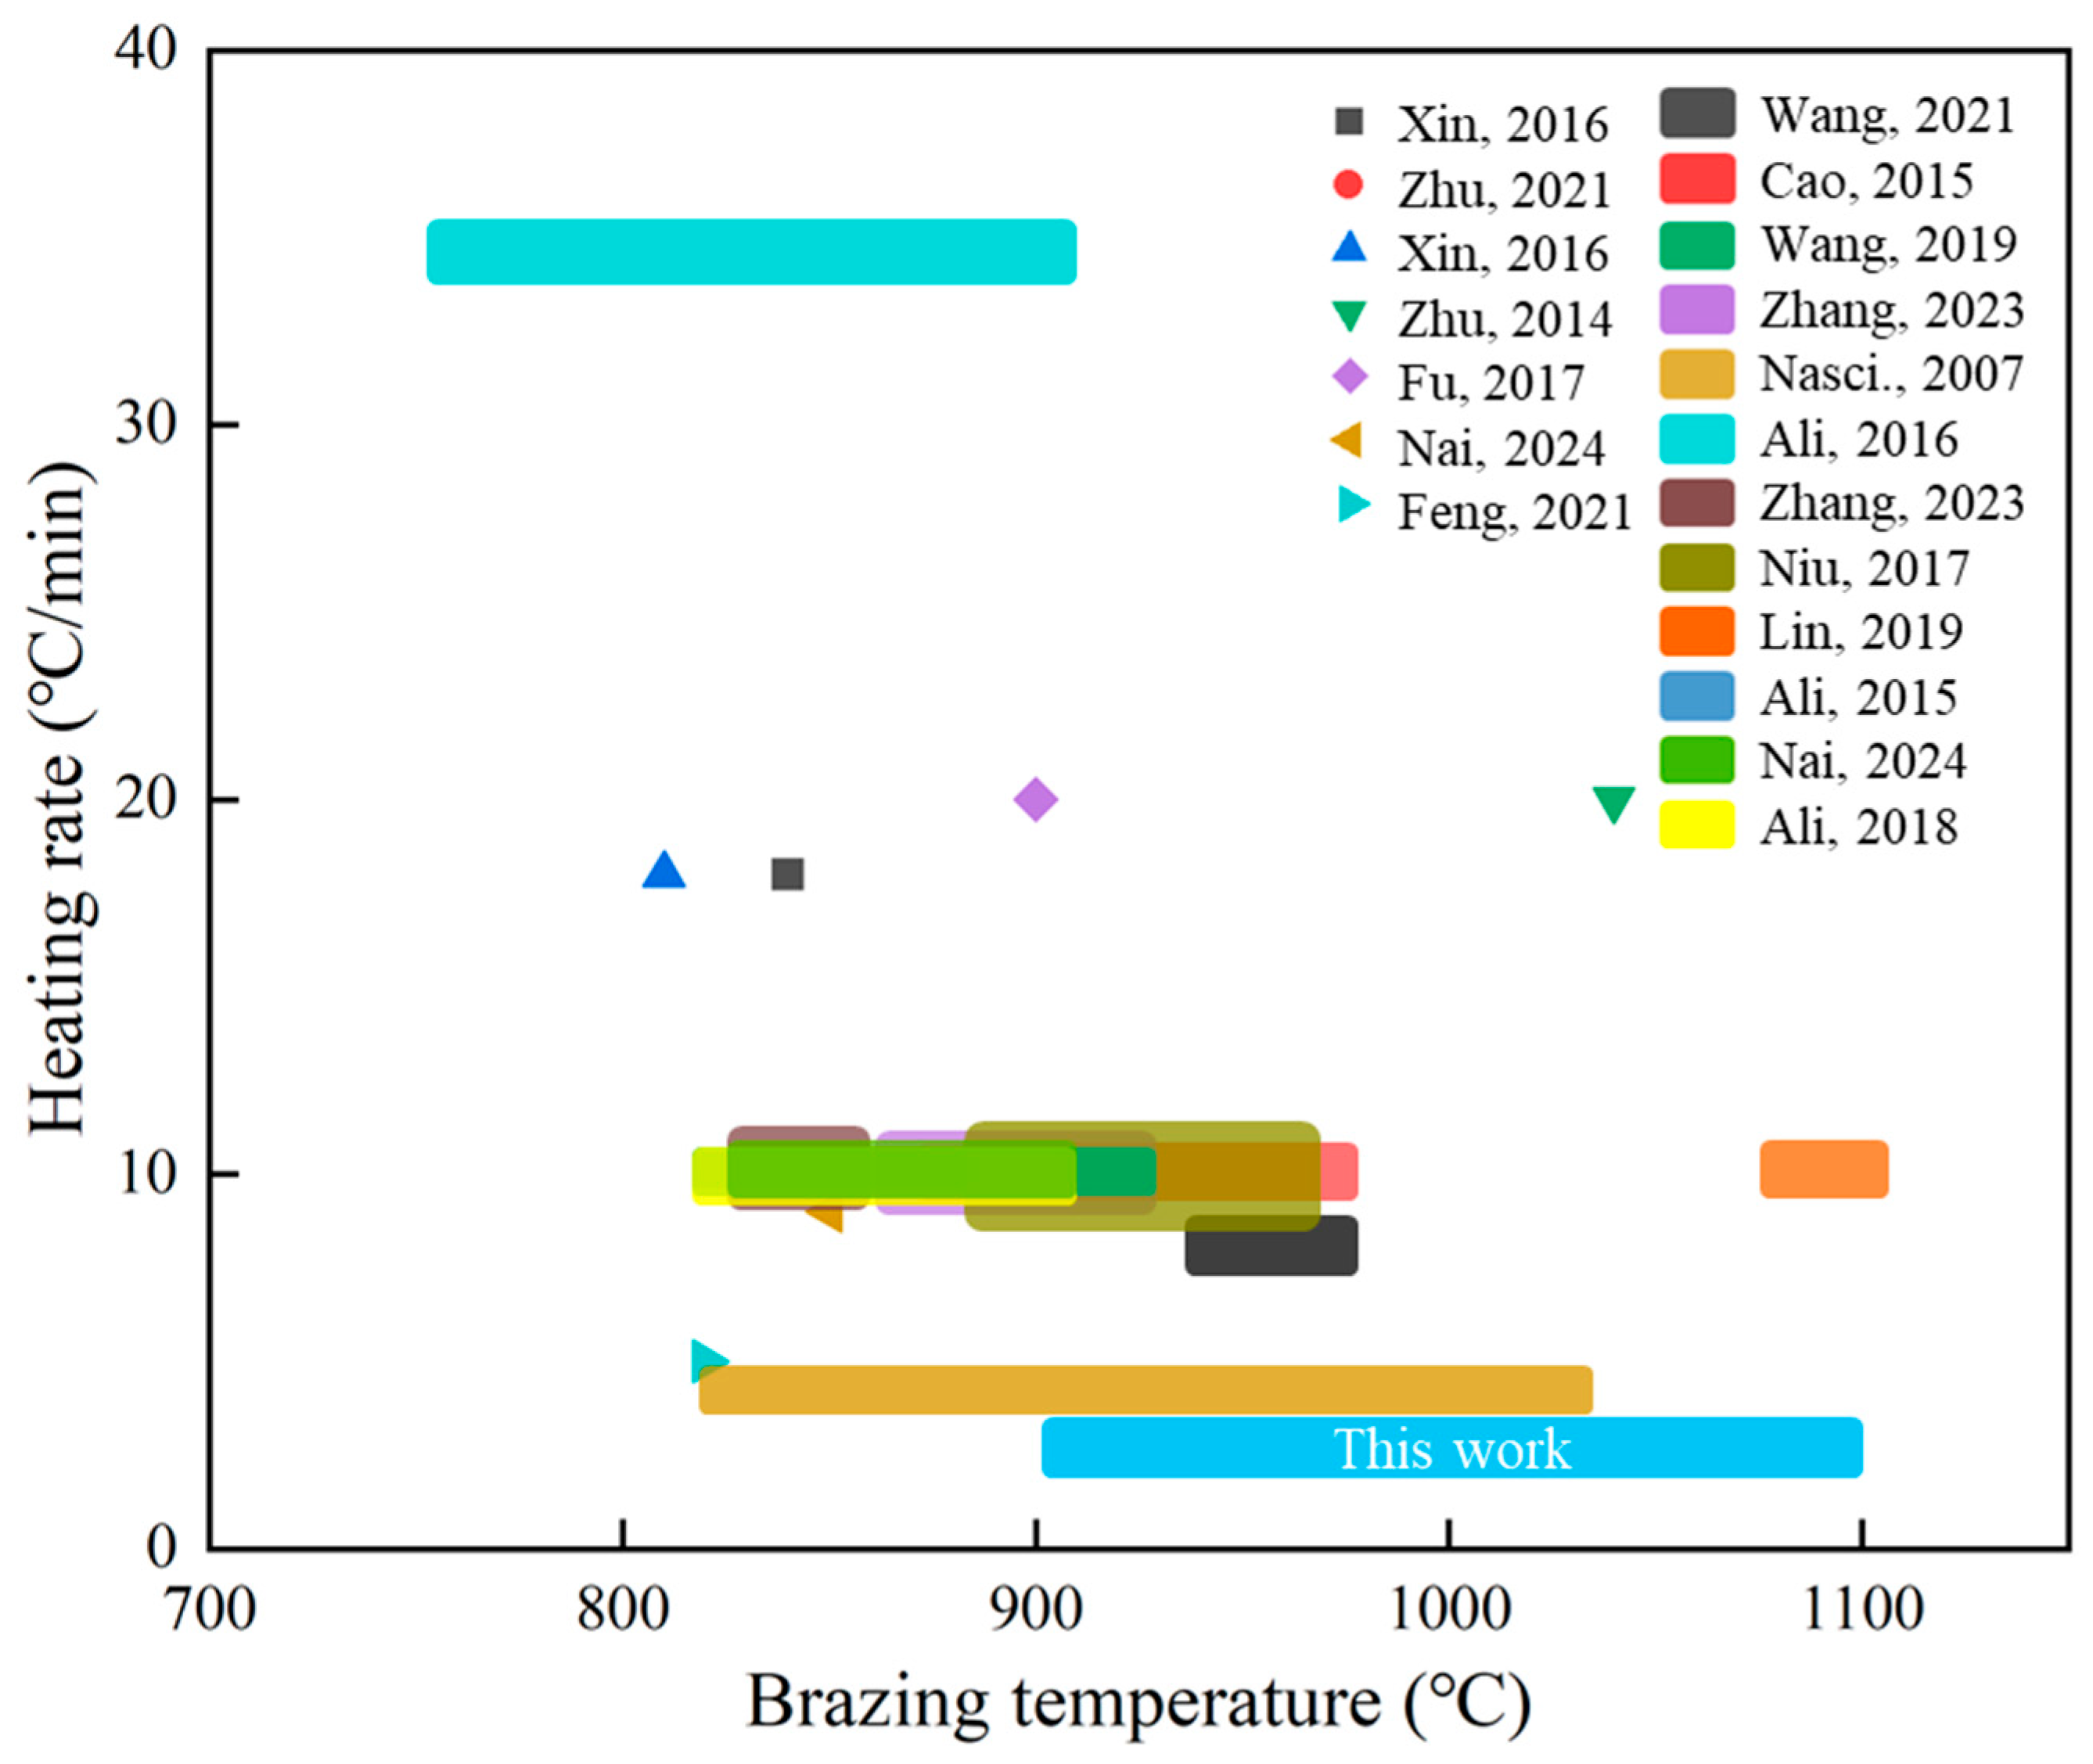
Figure 1. Brazing temperatures and heating rates in previous studies [1,3,5,6,7,8,9,10,11,13,14,16,17,19,20,21,25,26,27].
Jmmp 09 00355 g001
Figure 2. (a) Schematic of the brazed joint assembly; (b) heating curve of the brazing process; (c) schematic of the shear strength testing setup.
Jmmp 09 00355 g002
Figure 3. Typical brazed joint formed at 940 °C with a heating rate of 10 °C/min: (a) SEM image of the overall joint (BSE); (b) enlarged SEM image of the bonding layer (BSE); (c) enlarged SEM image of belt-like intermetallics (BSE); (dk) EDS elemental mapping of O, Al, Ti, Fe, Co, Ni, Cu, and Ag.
Jmmp 09 00355 g003
Figure 4. XRD pattern of reaction phases formed in the Al2O3–Kovar joint brazed at 940 °C with a heating rate of 10 °C/min.
Jmmp 09 00355 g004
Figure 5. EPMA analysis of the reaction layer on the ceramic side of the joint brazed at 940 °C with a heating rate of 10 °C/min: (a) Calculated distribution (at.%); (b) BSE image of the reaction layer; (ci) elemental distribution maps of O, Al, Ti, Fe, Ni, Ag, and Cu.
Jmmp 09 00355 g005
Figure 6. EPMA analysis of the reaction layer on the Kovar side of the joint brazed at 940 °C with a heating rate of 10 °C/min: (a) Calculated distribution (at.%); (b) BSE image of the reaction layer; (ci) elemental distribution maps of Ag, Cu, Ti, Fe, Ni, Co, and C.
Jmmp 09 00355 g006
Figure 7. SEM images (BSE) and Ti, Fe elemental maps of joints brazed at different temperatures and heating rates: (ad) brazing temperatures of 900 °C, 940 °C, 1000 °C, and 1100 °C at a constant heating rate of 2.5 °C/min; (eh) brazing temperatures of 900 °C, 940 °C, 1000 °C, and 1100 °C at a constant heating rate of 10 °C/min.
Jmmp 09 00355 g007
Figure 8. EPMA results of the reaction layers at different brazing temperatures with a heating rate of 2.5 °C/min: (ad) BSE for joint brazed at 900 °C, 940 °C, 1000 °C, 1100 °C; (eh) corresponding element distributions (at.%) for (ad), respectively.
Jmmp 09 00355 g008
Figure 9. EPMA results of the reaction layer at different brazing temperatures with a heating rate of 10 °C/min: (ad) BSE for joint brazed at 900 °C, 940 °C, 1000 °C, 1100 °C; (eh) corresponding element distributions for (ad), respectively (at.%).
Jmmp 09 00355 g009
Figure 10. Thickness of Ti-O-rich layer, IMC-rich layer, and total reaction layer in joints brazed at different temperatures and heating rates: (a) thicknesses at 900 °C, 940 °C, 1000 °C, and 1100 °C with a heating rate of 2.5 °C/min; (b) thicknesses at 900 °C, 940 °C, 1000 °C, and 1100 °C with a heating rate of 10 °C/min.
Jmmp 09 00355 g010
Figure 11. (a) Shear strength of joints fabricated under different processing parameters; (b) SEM (BSE) image of the fracture surface of the entire joint brazed at 940 °C with a heating rate of 2.5 °C/min; (c) enlarged SEM image of the metal-containing regions in the fracture surface.
Jmmp 09 00355 g011
Figure 12. SEM images of fracture surfaces of joints brazed under different conditions: (ad) BSE images of fractures at brazing temperatures of 900 °C, 940 °C, 1000 °C, and 1100 °C with a heating rate of 2.5 °C/min; (e,f) BSE images of fractures at brazing temperatures of 900 °C, 940 °C, and 1000 °C with a heating rate of 10 °C/min; (g) overall fracture morphology of the joint brazed at 1100 °C with a heating rate of 2.5 °C/min; (h) enlarged SE2 image of area shown in (g), highlighting ductile fracture features.
Jmmp 09 00355 g012
Figure 13. Description of the reaction process: (a) Schematic diagram of microstructural changes; (b) reaction process under different heating rates. T1: temperature at which the Ti-O begins to form; T2: temperature at which the IMC begins to form; t1, t1’: time at which the Ti-O begins to form; t2, t2’: time at which the IMC begins to form.
Jmmp 09 00355 g013
Figure 14. Schematic mechanism of interfacial phase evolution at the ceramic-side reaction layer during brazing: (a): Ti from the filler metal reacts with ceramic; (b): Ti-O starts to form; (c) the Ti-O grows to form a Ti-O-rich layer; (d) at high heating rates, by the time the IMC-rich layer forms, the Ti-O-rich layer is still too thin; (e): the Ti-O-rich layer cannot block oxygen diffusion, resulting in simultaneous growth of the Ti-O-rich layer with the IMC-rich layer; (f): after enough time, the Ti-O-rich layer reaches enough width to affect the diffusion of oxygen as well as the growth of the IMC-rich layer; (g) at low heating rates, sufficient time allows the Ti-O-rich layer to form before the IMC-rich layer appears; (h): the Ti-O-rich layer significantly hinders oxygen diffusion and suppresses IMC-rich layer formation; (i): the mixed layer grows slowly and forms a much thinner layer than the high heating rate situation.
Jmmp 09 00355 g014
Figure 15. EPMA oxygen distribution maps of the reaction layer under different brazing temperatures and heating rates: (ad) Brazing temperatures of 900 °C, 940 °C, 1000 °C, and 1100 °C at a heating rate of 2.5 °C/min; (eh) brazing temperatures of 900 °C, 940 °C, 1000 °C, and 1100 °C at a heating rate of 10 °C/min.
Jmmp 09 00355 g015
Table 1. Chemical composition of Kovar alloy used in this study (wt.%).
ElementFeNiCoMnSiCOther
Percentage (%)Bal.32.514.40.270.220.009<0.01
Table 2. Chemical composition of alumina used in this study (wt.%).
ContentAl2O3SiO2CaOOther
Percentage (%)94.843.031.920.21
Table 3. EDS point analysis of different regions in Figure 3 (at.%).
PointOAlTiFeCoNiCuAgPossible Phase
A37.4959.96---0.08-2.47Al2O3
B11.375.3648.7216.292.1415.65-0.48Ti-Fe-Ni-O
C1.95----1.943.1093.01Ag
D-2.623.63-1.64-86.935.19Cu
E--28.6646.3812.1011.310.431.12TiFe2+TiNi3
F2.040.2028.2611.193.6954.62--TiNi3+TiFe2
G-0.4125.9848.1113.989.98-1.54TiFe2
H-1.271.2051.3218.2826.76-1.17Kovar
Table 4. EDS point analysis at different locations in Figure 11 (at.%).
PointOAlTiFeCoNiCuAgPossible PhaseFracture Position
A57.5940.530.71---0.370.80Al2O3Ceramics
B27.043.4632.4216.244.7910.003.592.47Ti-O-Fe-NiReaction layer
C--5.41---12.1982.41AgFiller layer
D--3.03---91.365.62CuFiller layer
Disclaimer/Publisher’s Note: The statements, opinions and data contained in all publications are solely those of the individual author(s) and contributor(s) and not of MDPI and/or the editor(s). MDPI and/or the editor(s) disclaim responsibility for any injury to people or property resulting from any ideas, methods, instructions or products referred to in the content.