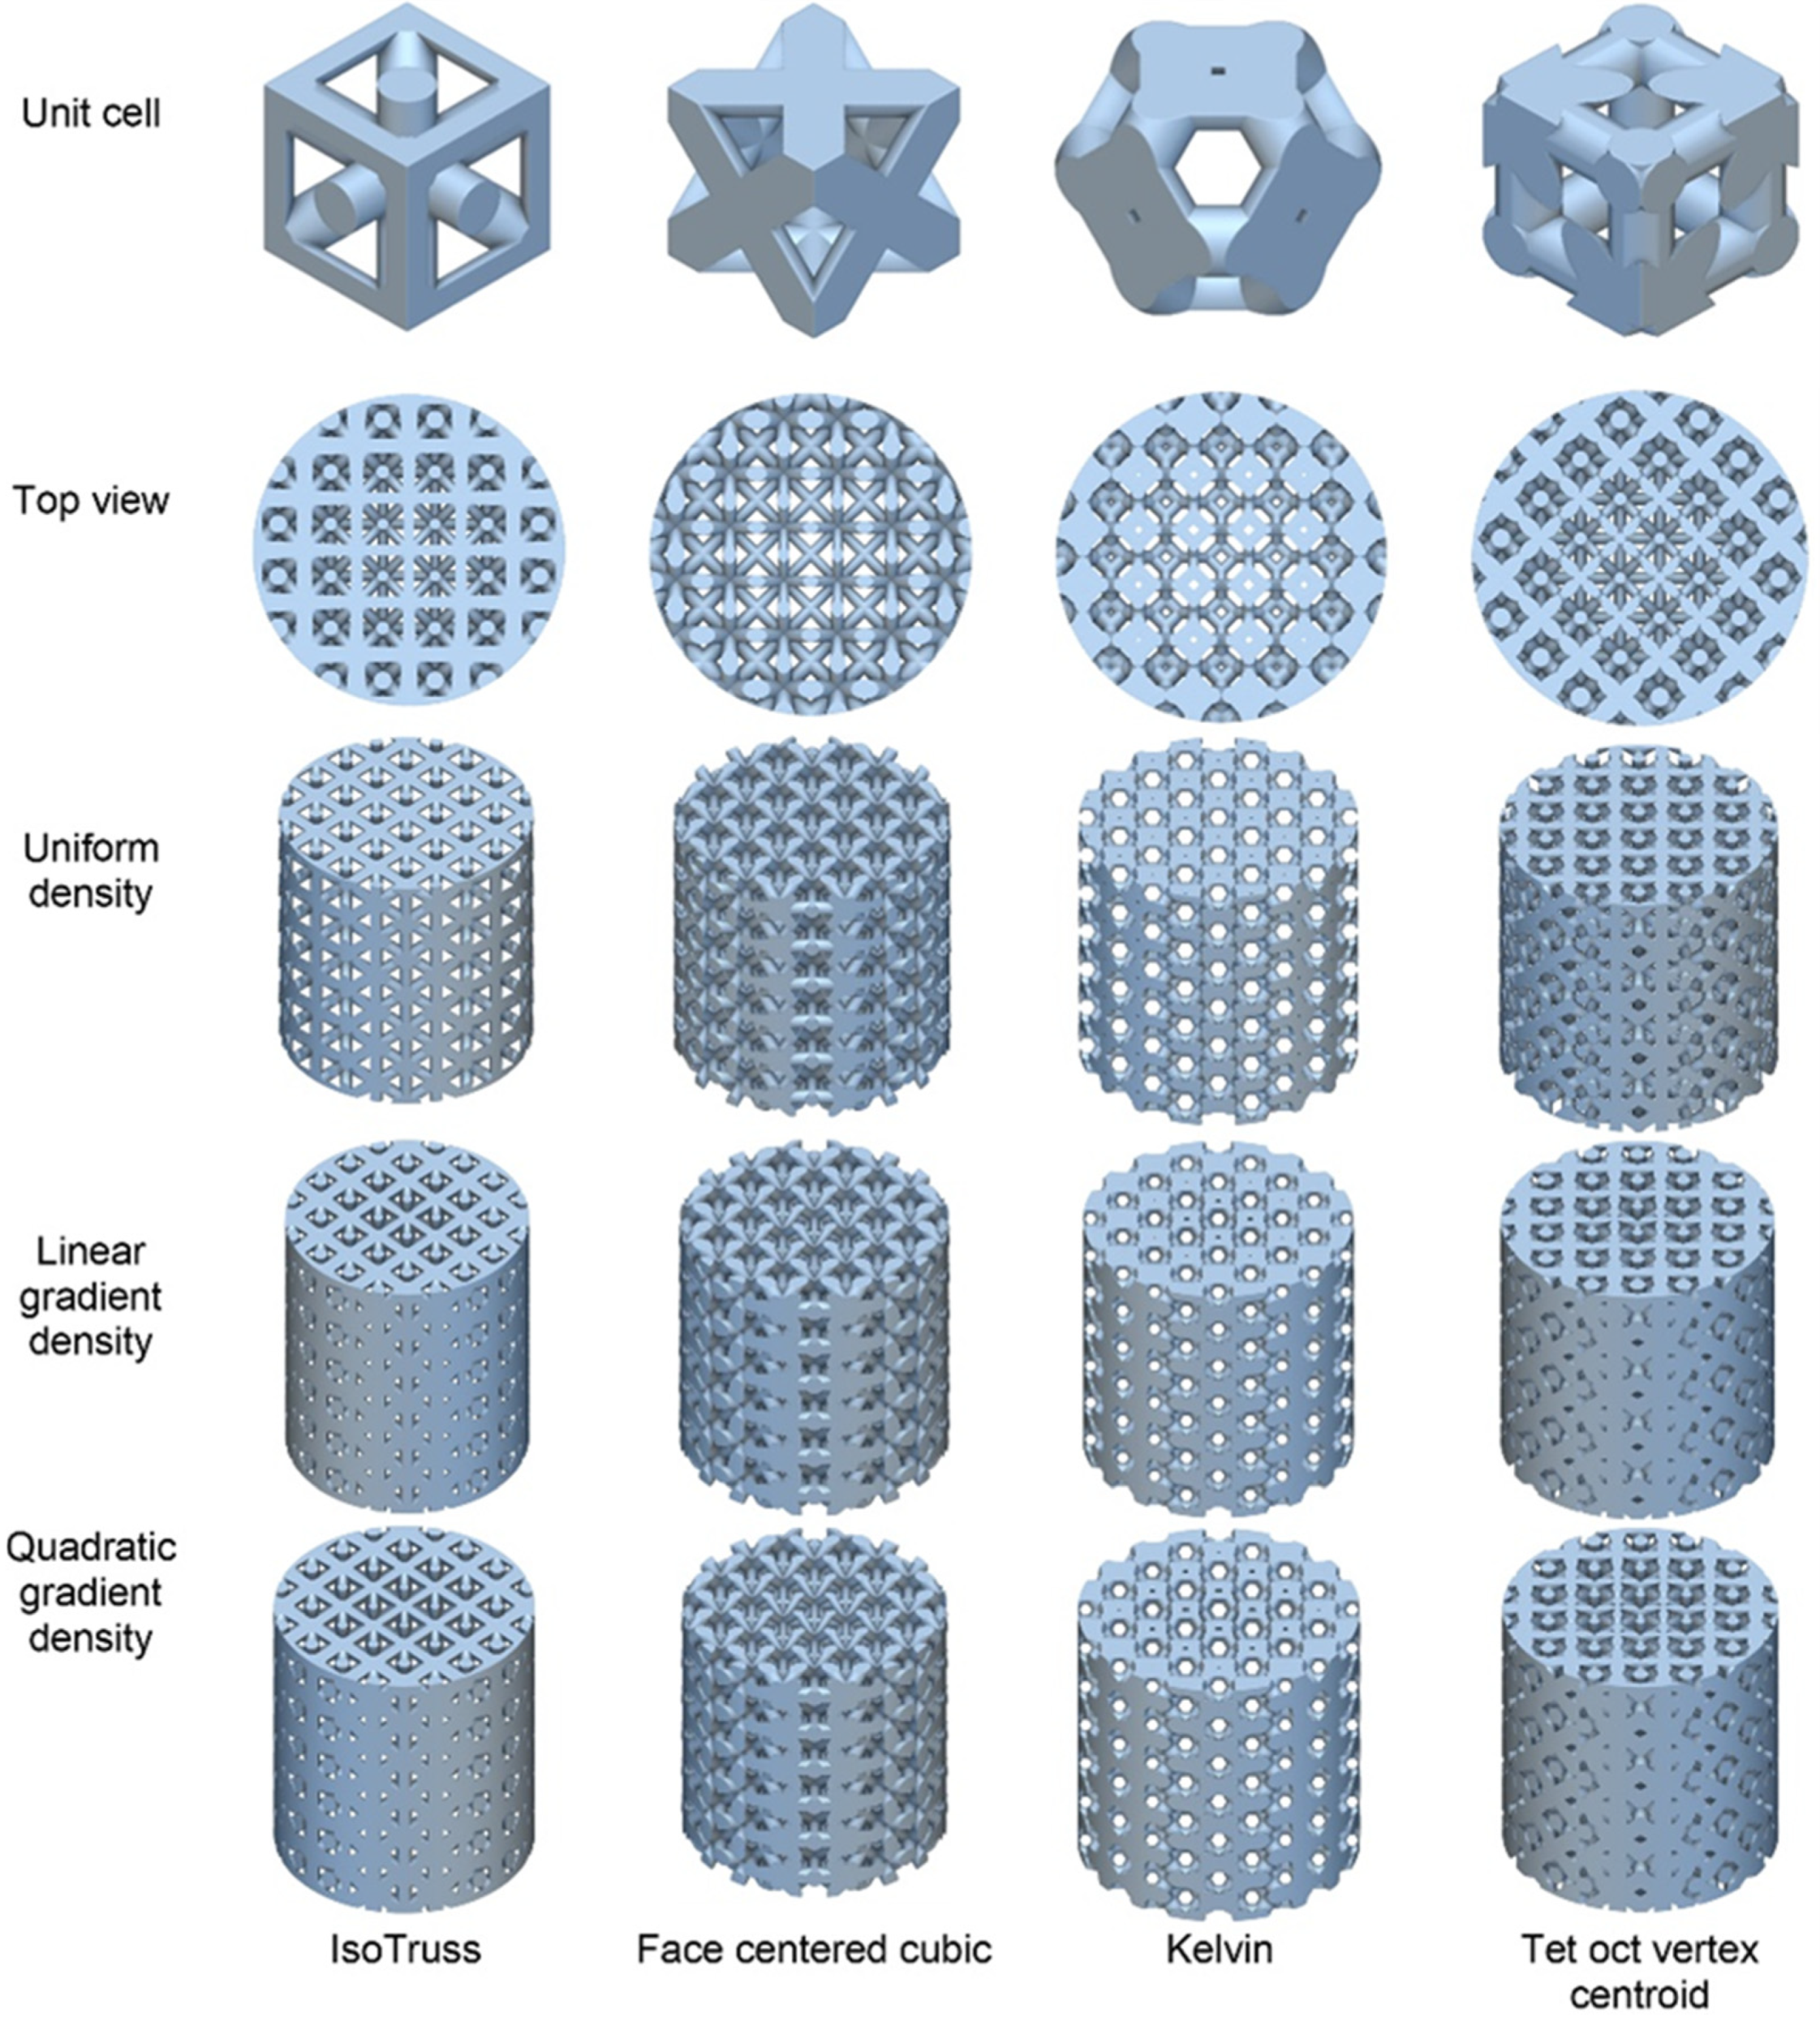
1. Introduction
Advances in additive manufacturing have driven interest in functional gradient steel lattice structures, whose mechanical efficiency is affected by the fabrication parameters and their design. Research indicates a strong relationship between these parameters, the shape of the structures, and their performance, highlighting the impact of geometric configuration and deformation on their mechanical properties [
1]. Selective laser melting manufacturing (SLM) stands out as a critical technique, facing challenges such as precision and surface defects; however, it has potential applications in the aeronautics, automotive, and defense industries [
2]. Biologically inspired designs have been explored, and through 3D printing, structures with improved stiffness and energy absorption have been offered, opening possibilities for lightweight and multifunctional materials [
3]. Studies on lattice cell designs and comparisons between different types of lattice arrays reveal significant variations in their mechanical properties [
4,
5]. Numerical modeling has improved the prediction of mechanical behavior, including actual manufacturing defects, while designs with heterogeneous density and circular designs have shown improvements in strength and energy absorption [
6,
7]. Moreover, structures with step changes in density and design modifications have proven to be effective in optimizing mechanical efficiency. This approach preserves essential properties such as stiffness and structural stability, ensuring functionality and load resistance, without compromising their physical integrity [
8,
9]. Design optimization and evaluation of 316 L stainless steel structures using SLM have enriched the knowledge for the development of high-performance structures in industrial applications [
10,
11]. In this regard, the potential of new lattice cell geometries, as indicated by ongoing research and performance comparisons, is a source of hope for the future of structural engineering, showing the superiority of specific structures in terms of mechanical and energy absorption [
12,
13,
14].
The integration of structural volumetric arrangements by triple periodic minimal surfaces (TPMS) through additive manufacturing has brought about significant changes in materials engineering and structural design, offering applications ranging from mechanical optimization to fabric engineering and thermal management. An equivalent entity (EE) modeling approach simplifies the simulation of these structures, optimizing the design and evaluation process [
15]. In tissue engineering, 3D-printed gyroid-like geometries show promise for bone regeneration, replicating the structure of trabecular bone with high biocompatibility [
16]. The selection of the correct TPMS geometry is crucial for maximizing mechanical performance, which is essential in sectors such as aerospace and automotive [
17]. Studies on compression and resilience are currently vital to the development of innovative damping materials [
18]. Research on the thermal conductivity of TPMS structures fabricated by laser powder melting reveals that thermal conductivity primarily depends on the material composition and quantity, and to a lesser extent, on the cell geometry. This enables the development of lighter and thermally efficient components, with potential applications in electronic devices [
19]. Strategies for graded and hybrid TPMS structures promote applications in medical implants, while a hybrid approach called Meta Grain Structure (MGS) improves design and mechanical properties, offering customized solutions for various applications [
20].
Additive manufacturing has transformed the production of complex structures, especially in polymers and composites, by optimizing lattice cell designs, adjusting printing parameters, and using novel materials. Notably, developing hybrid nylon lattice cell structures with BCC and N-type geometries by Laser Powder Bed Fusion (LPBF) significantly improves mechanical properties [
21]. Further research indicates that filler density, layer thickness, and build orientation affect energy absorption in materials such as ABS and FPU, providing directions for the fabrication of devices with specific requirements [
22]. The study of thermoplastic polyurethane (TPU) cubic structures reveals that configurations featuring sinusoidal columns and honeycomb structures optimize both strength and energy absorption [
23]. Another study evaluates how various printing factors affect the mechanical properties of nutshell and PLA composites using the filament printing technique, identifying that extruder temperature and layer height are critical to optimizing strength and dimensional accuracy. These results support the use of sustainable materials in additive manufacturing for industrial applications [
24]. In addition, research on the design and processing of polymeric lattice structures by digital light processing (DLP) highlights the importance of topology and exposure time adjustments to modify mechanical properties [
25]. The addition of glass powder, nozzle size, and filler density in PLA is analyzed to optimize the mechanical strength while also considering economic and environmental aspects [
26,
27]. These studies highlight the importance of additive manufacturing in enhancing the mechanical and energy absorption properties of advanced materials.
The stereolithography 3D fabrication technique has shown that graded TPMS structures exhibit optimal deformation behavior for mechanical shock absorption [
28,
29]. Optimization of resin formulation and printing parameters in DLP and liquid crystal display (LCD) technologies is crucial to improve material performance [
30]. Similarly, carbon fiber- and graphene oxide-reinforced composites have improved the mechanical properties of lattice structures by SLA [
31], while adjustments in UV laser power and layer thickness have influenced the mechanical properties of components fabricated with acrylic resins and zirconia lattice structures [
32,
33].
On the other hand, the potential of bidirectional gradient lattice structures has been explored by LPBF, showing improvements in properties such as compressive modulus and energy absorption capacity, with applications in lightweight and multifunctional design [
34]. In another case, gradient lattice structures generated in NiTi shape memory alloys, designed by topological optimization and fabricated by LPBF, stand out for their exceptional energy absorption capability [
35]. These studies, like others, demonstrate how additive manufacturing opens up new avenues for developing advanced materials and structures, thereby promoting innovative applications across various sectors.
The present research explores lattice cell designs and cylindrical structures with graded density and printing parameters to enhance mechanical properties. These innovations open avenues for the customization and efficient design of parts in various applications, marking a promising future for the mechanical characterization of additively manufactured structures with applications requiring specific mechanical properties while retaining strength and energy absorption [
1,
35,
36,
37].
The novelty of this study lies in the systematic evaluation of the effect of density variations, specifically uniform, linear, and quadratic, on the mechanical behavior and failure modes of cylindrical lattice structures fabricated through stereolithography (SLA). A full factorial design was employed to analyze the interactions between cell geometry and density distribution comprehensively. The results revealed that the IsoTruss configuration with linear density exhibited superior mechanical performance and high energy absorption capacity, providing valuable insights for the design and optimization of additively manufactured structures with enhanced mechanical properties [
38,
39,
40].
3. Results and Discussion
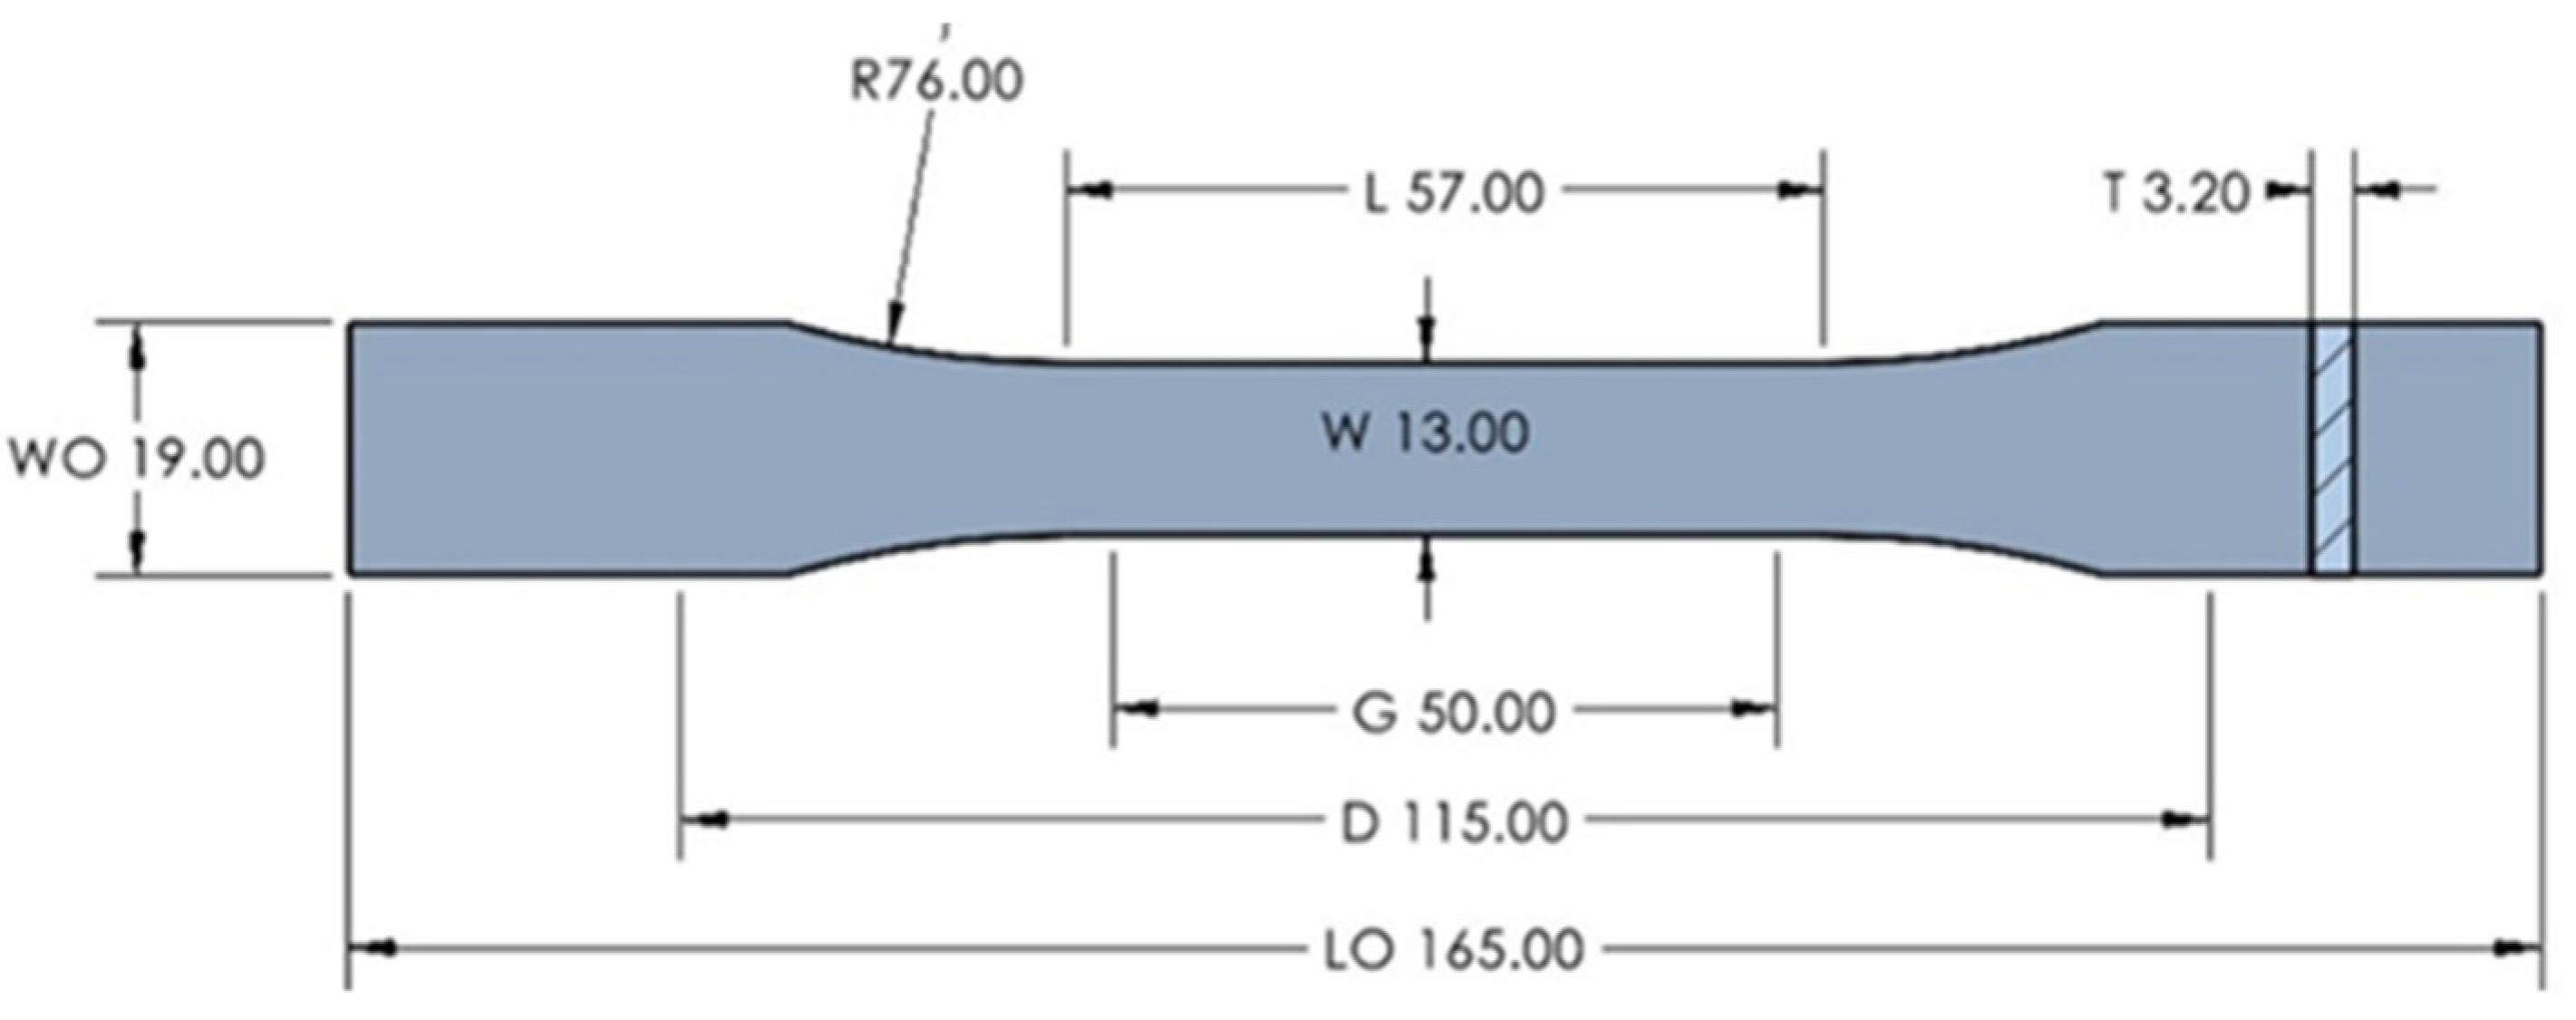
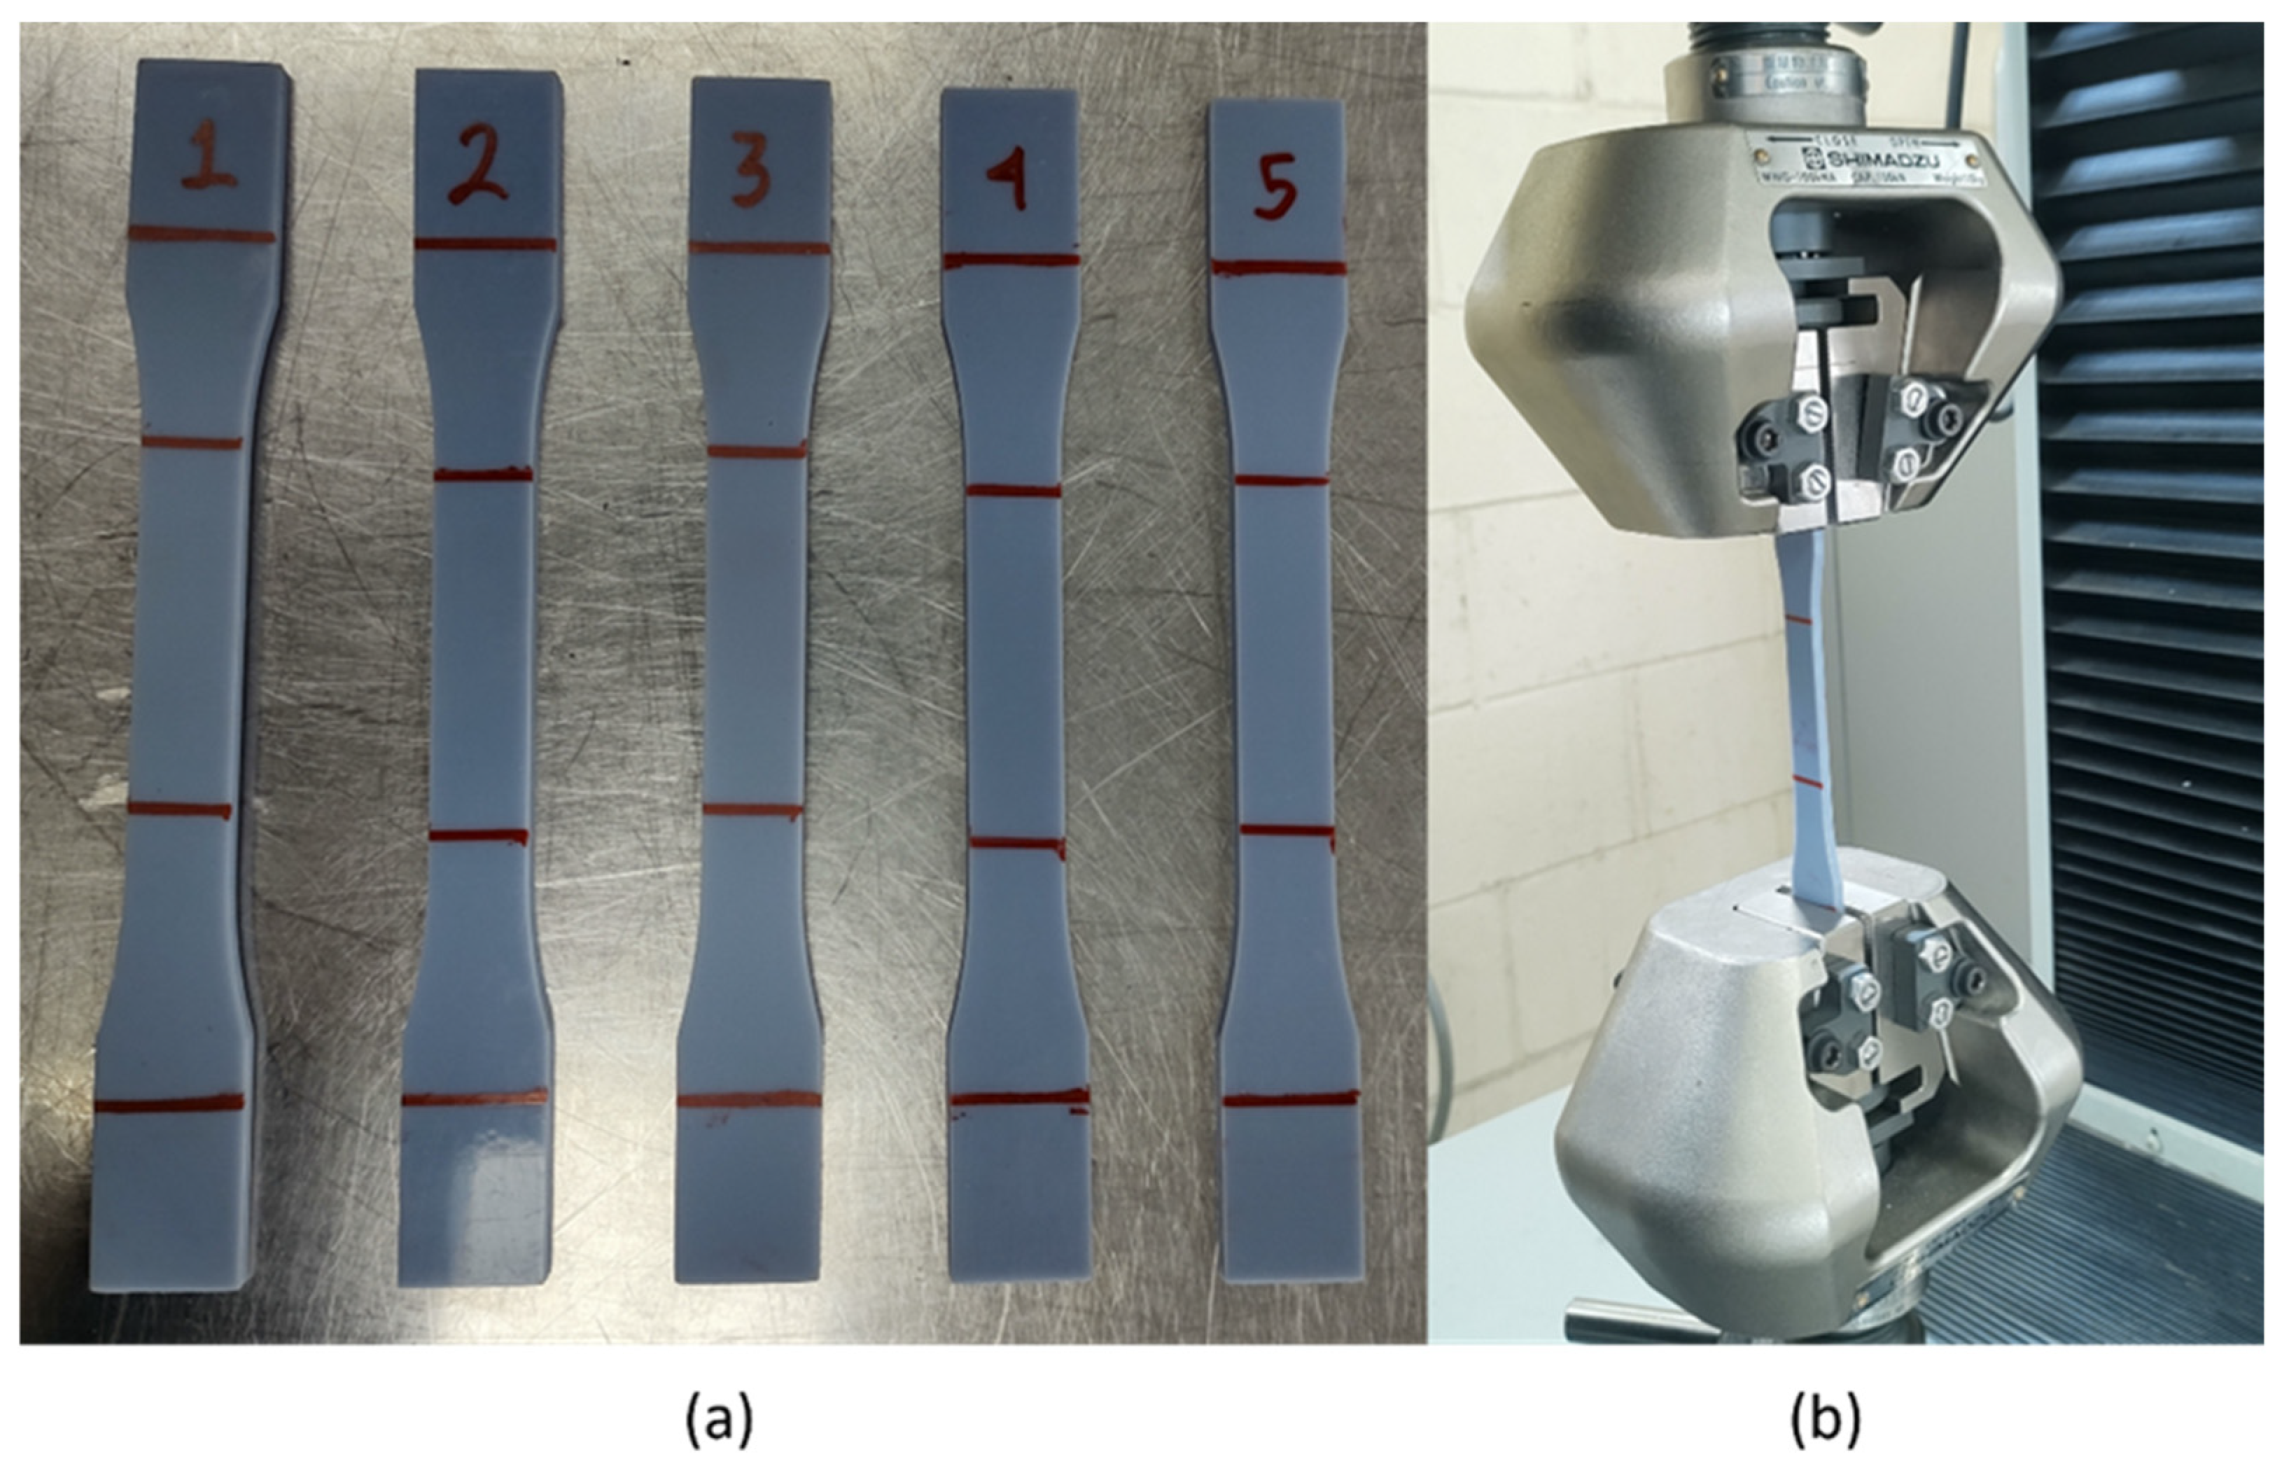
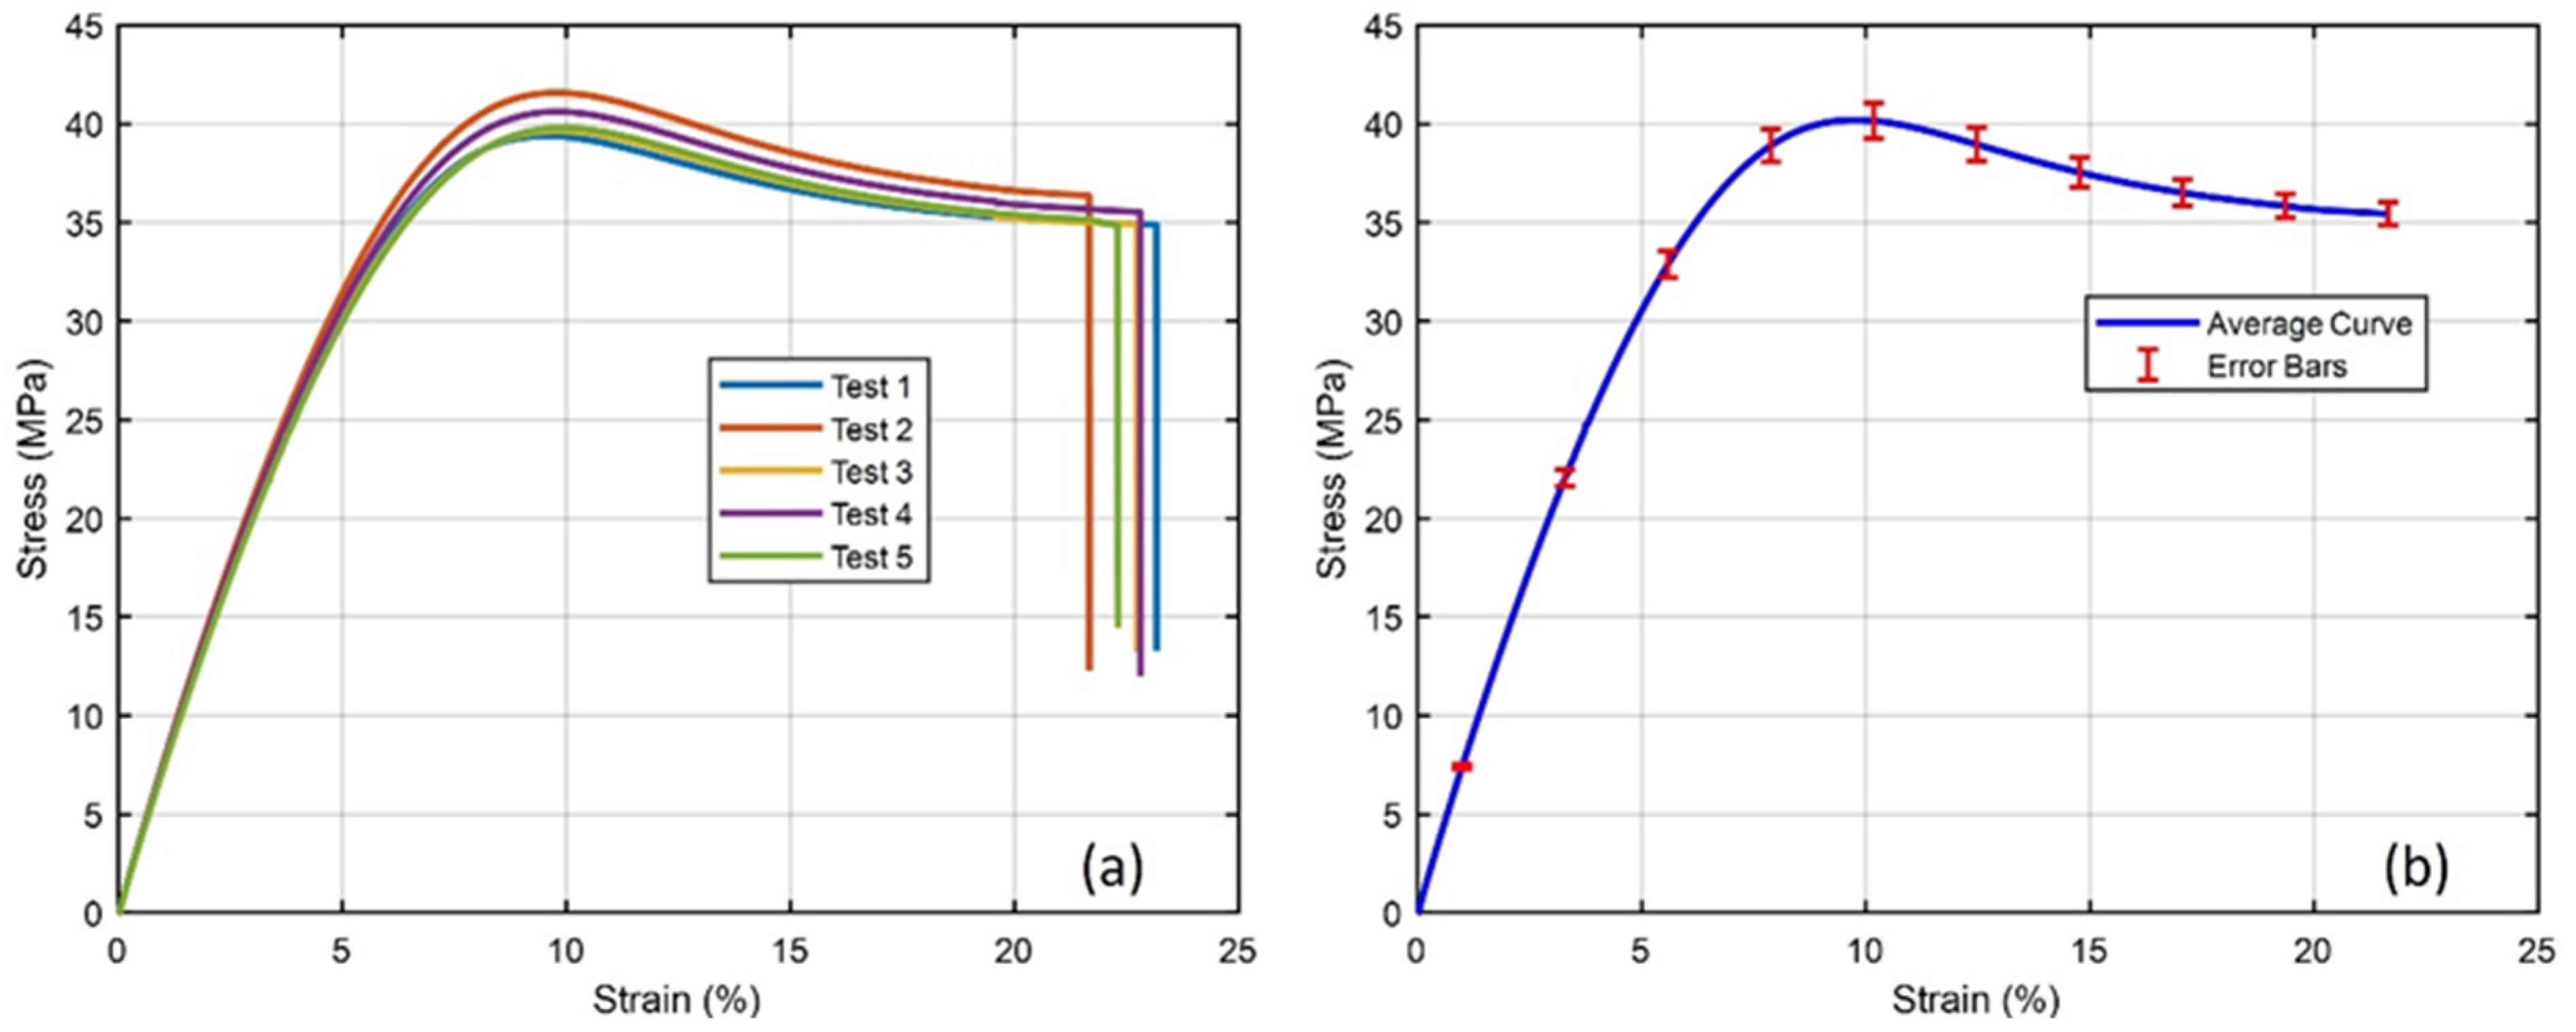
Figure 4a shows the graph of the mechanical behavior of the tensile test performed at a speed of 3 mm/s on the five specimens tested. The ordinate axis indicates the stress in megapascals (MPa), and the abscissa axis shows the strain in percent (%). The curve starts at the origin and rises to approximately 38 MPa of stress for a strain of about 9%, indicating the elastic behavior of the material. After this point, the behavior ceases to be linear, implying that the material has reached its elastic limit and begins to exhibit elastoplastic behavior with permanent deformation without further increase in strain. The five curves correspond to five different specimens labeled 1 to 5. The negatively sloped part of the curves indicates the ductility property of the polymers, resulting in flow behavior with plastic deformation. In all five curves, similar behaviors are observed in both the elastic and plastic stages, indicating consistency in the material’s processing during printing. Finally, there is an abrupt drop in stress, indicating fracture or breakage of the material. The fracture occurs at approximately 22.5% of the strain for all specimens, although the curve of specimen two fractures earlier than the others.
Figure 4b presents the average stress–strain curve derived from these individual tests, along with error bars that provide a visual indication of the variability between tests. The elastic modulus (E) of the material was determined to be 664.400 MPa, with a standard deviation of 12.992 MPa. This value represents the stiffness of the material in the elastic region of the curve, where the deformation is reversible and proportional to the applied stress. In addition, the maximum stress reached, corresponding to the highest point of the stress–strain curve before the material’s creep, is 40.220 MPa with a standard deviation of 0.889 MPa. This value is an indicator of the maximum tensile strength of the material. The small value in standard deviation suggests that the behavior of the material is reasonably uniform in terms of its ultimate tensile strength. The variation between specimen results in the elastoplastic region could be the result of several factors, such as minor inconsistencies in material composition and differences in specimen fabrication or preparation during testing.
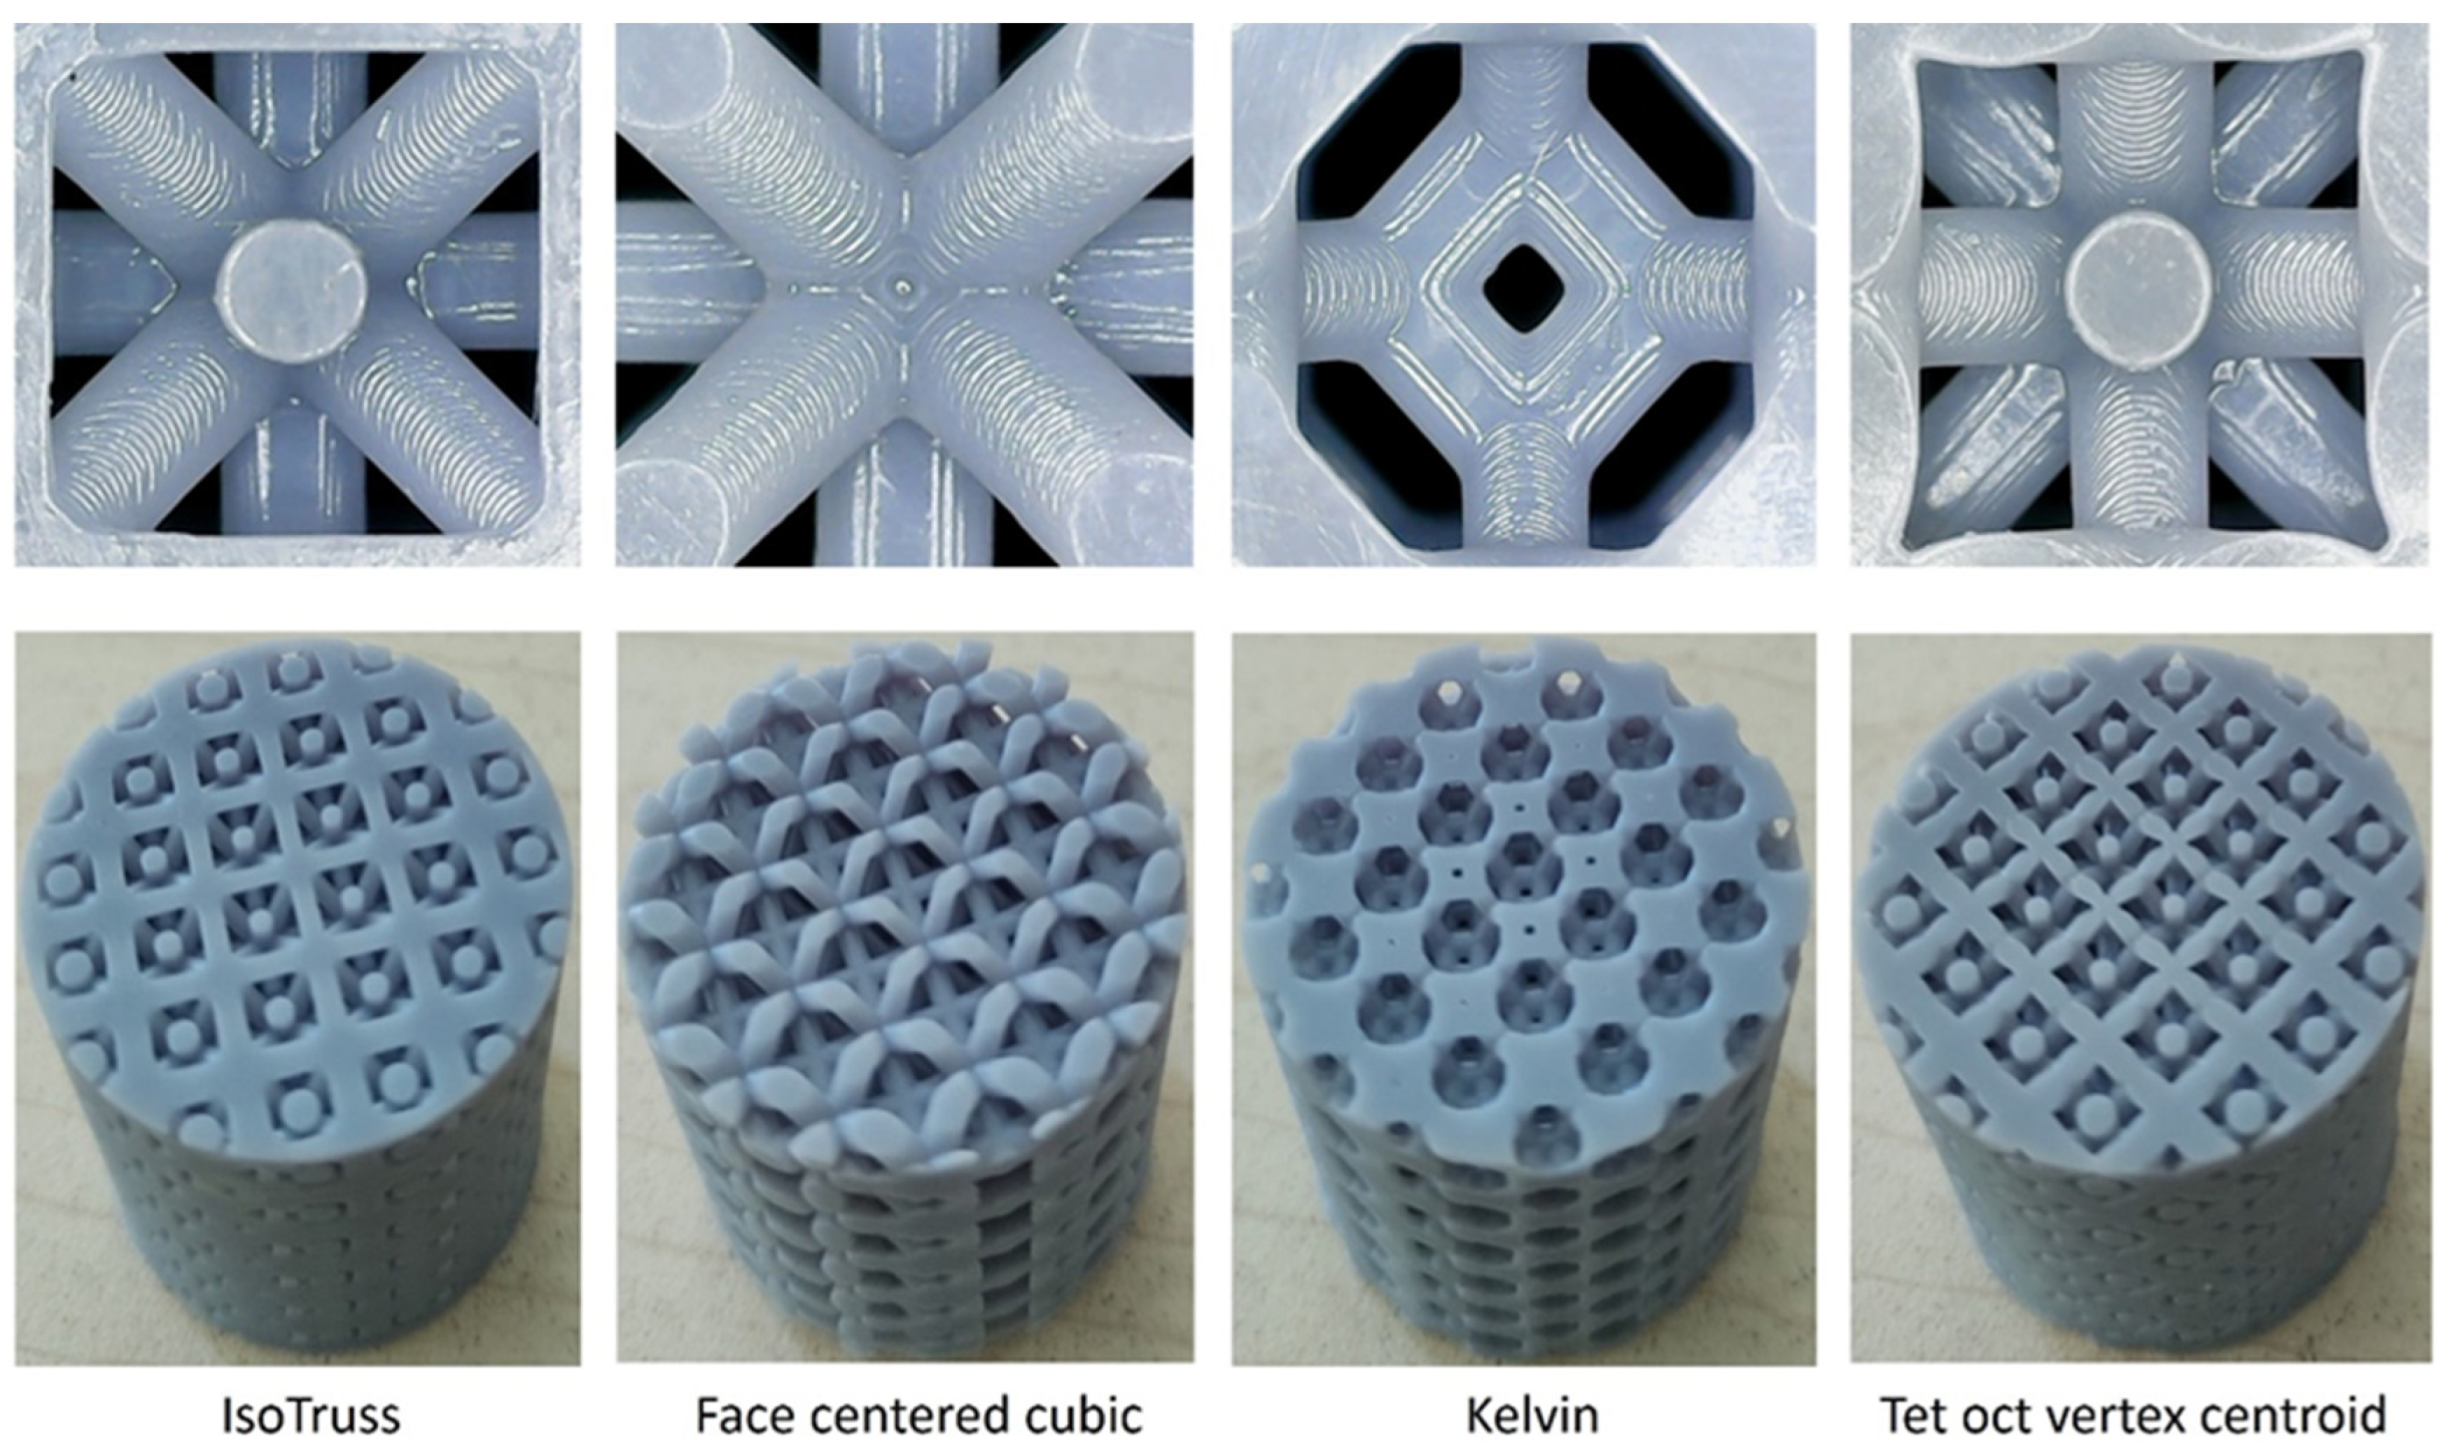
Figure 5 shows the top views of the lattice cells for each configuration, obtained using a digital microscope at 40× magnification. Despite the high precision inherent in the manufacturing process, significant geometric differences persist between the ideal design and the manufactured structure, which inevitably compromise the material’s mechanical properties, stiffness, strength, and toughness [
48,
49,
50]. These defects manifest themselves through surface roughness, the step effect, porosity, or geometric deviations such as node displacement, variations in bar thickness, and misalignment of the bar axis [
47,
49].
Table 2 compares the masses obtained with the CAD model with the results obtained after fabrication for the different types of structures. The IsoTruss structures have relative errors ranging from 2.863% to 4.584%, suggesting that the manufacturing accuracy is quite good. However, there is more variation in the quadratic density than in the linear or uniform, on the other hand, this configuration has the highest average mass of 18.194 g with a standard deviation of ±0.048 g for the linear density. For the Tet oct vertex centroid type structures, the relative error varies between 3.300% and 4.080%, also indicating good manufacturing accuracy, with a mass of 17.966 g (±0.060 g) for the linear density configuration. The Cubic Center Face structures show similar relative errors, around 3%, which is also a good indication of fabrication quality; this configuration presents a lower mass, with a mean value of 13.409 g and a standard deviation of ±0.103 g, for the configuration with linear density. Kelvin structures present an average mass of 12.481 g and a standard deviation of ±0.039 g for the linear density configuration, with a higher variation in the relative error when comparing the masses of the manufactured part with the designed part, especially for the quadratic density one, with a value of 4.731%, which may indicate a higher difficulty in the control of the manufacturing process for this type of structure.
In
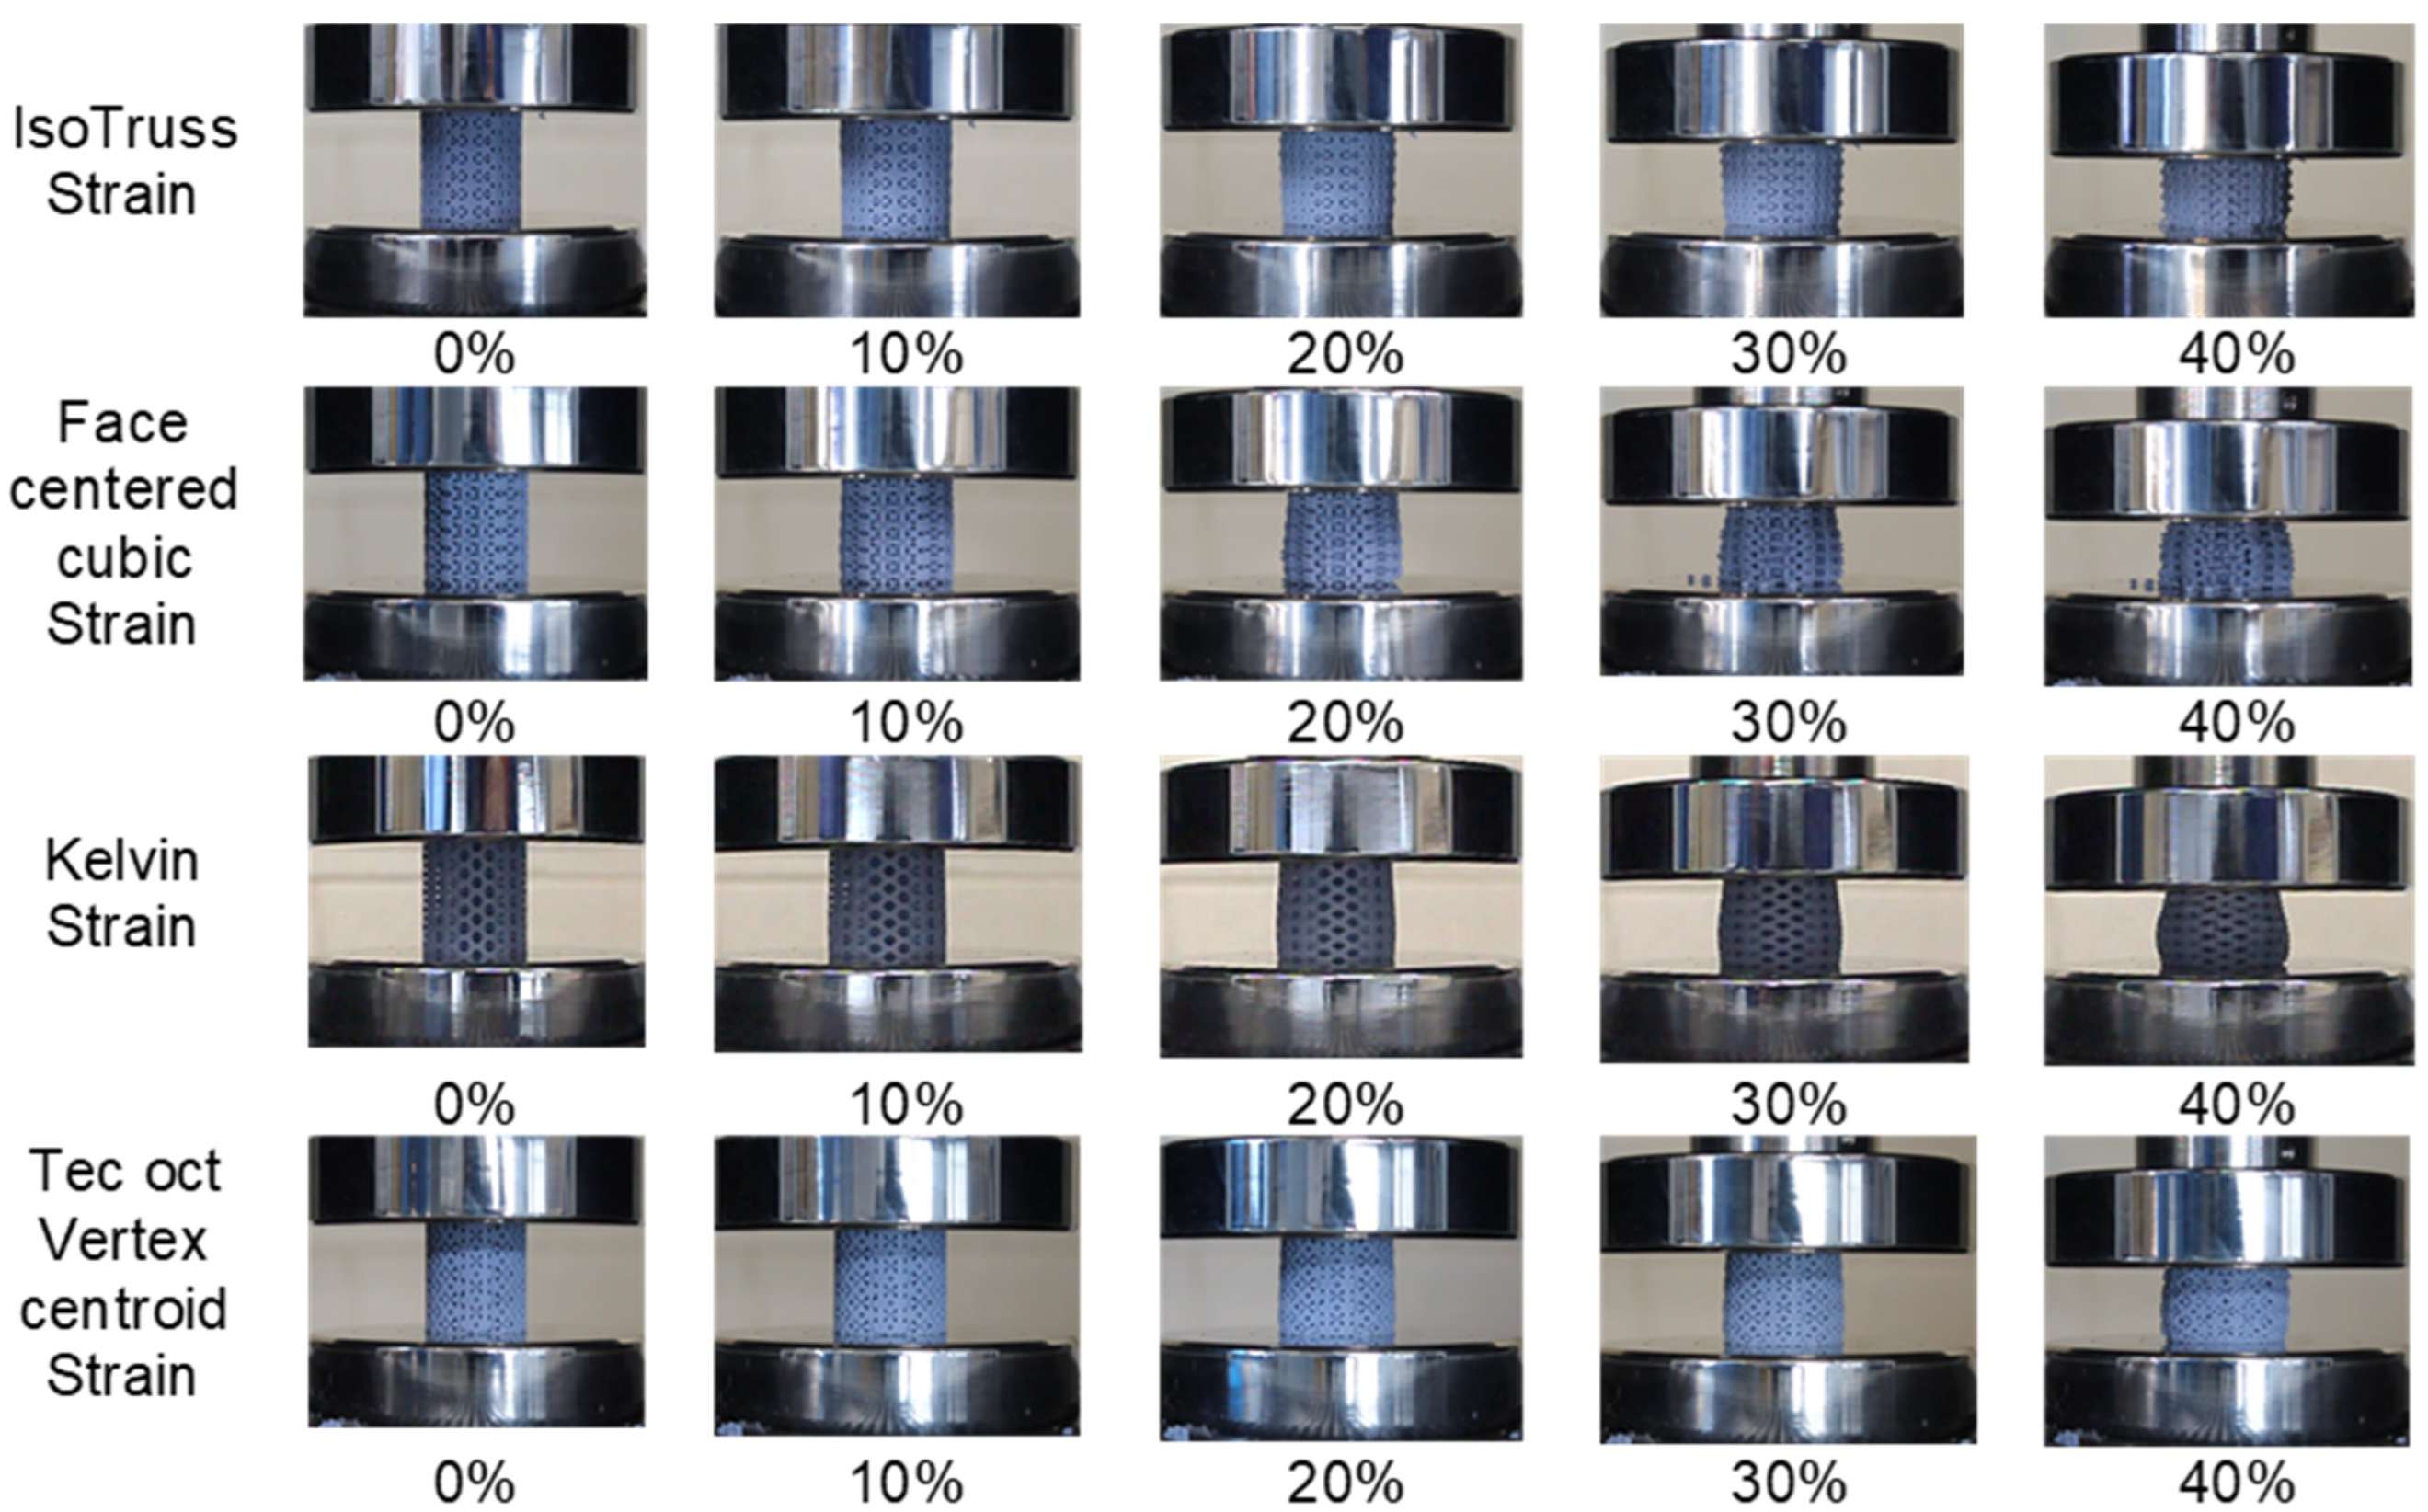
Figure 6, photographs of the specimens under compressive loading are observed during the initial phase, from 0% to 10% deformation. All specimens exhibit an elastic response, where any deformation is reversible. As the load increases and reaches 10–20% strain, it is observed that the Face-centered cubic and Kelvin specimens begin to exhibit local buckling, indicating a transition from elastic to plastic behavior; this deformation is permanent. When approaching 20–30% of the deformation, buckling becomes more evident and generalized for all specimens, evidencing plastic deformation and the onset of structural collapse. Beyond 30%, the lattice cells experience global buckling and progressive collapse, severely compromising the structural integrity of the specimen. In the last column, at 40% strain, it is observed that all specimens fail structurally, modifying the original shape and functionality.
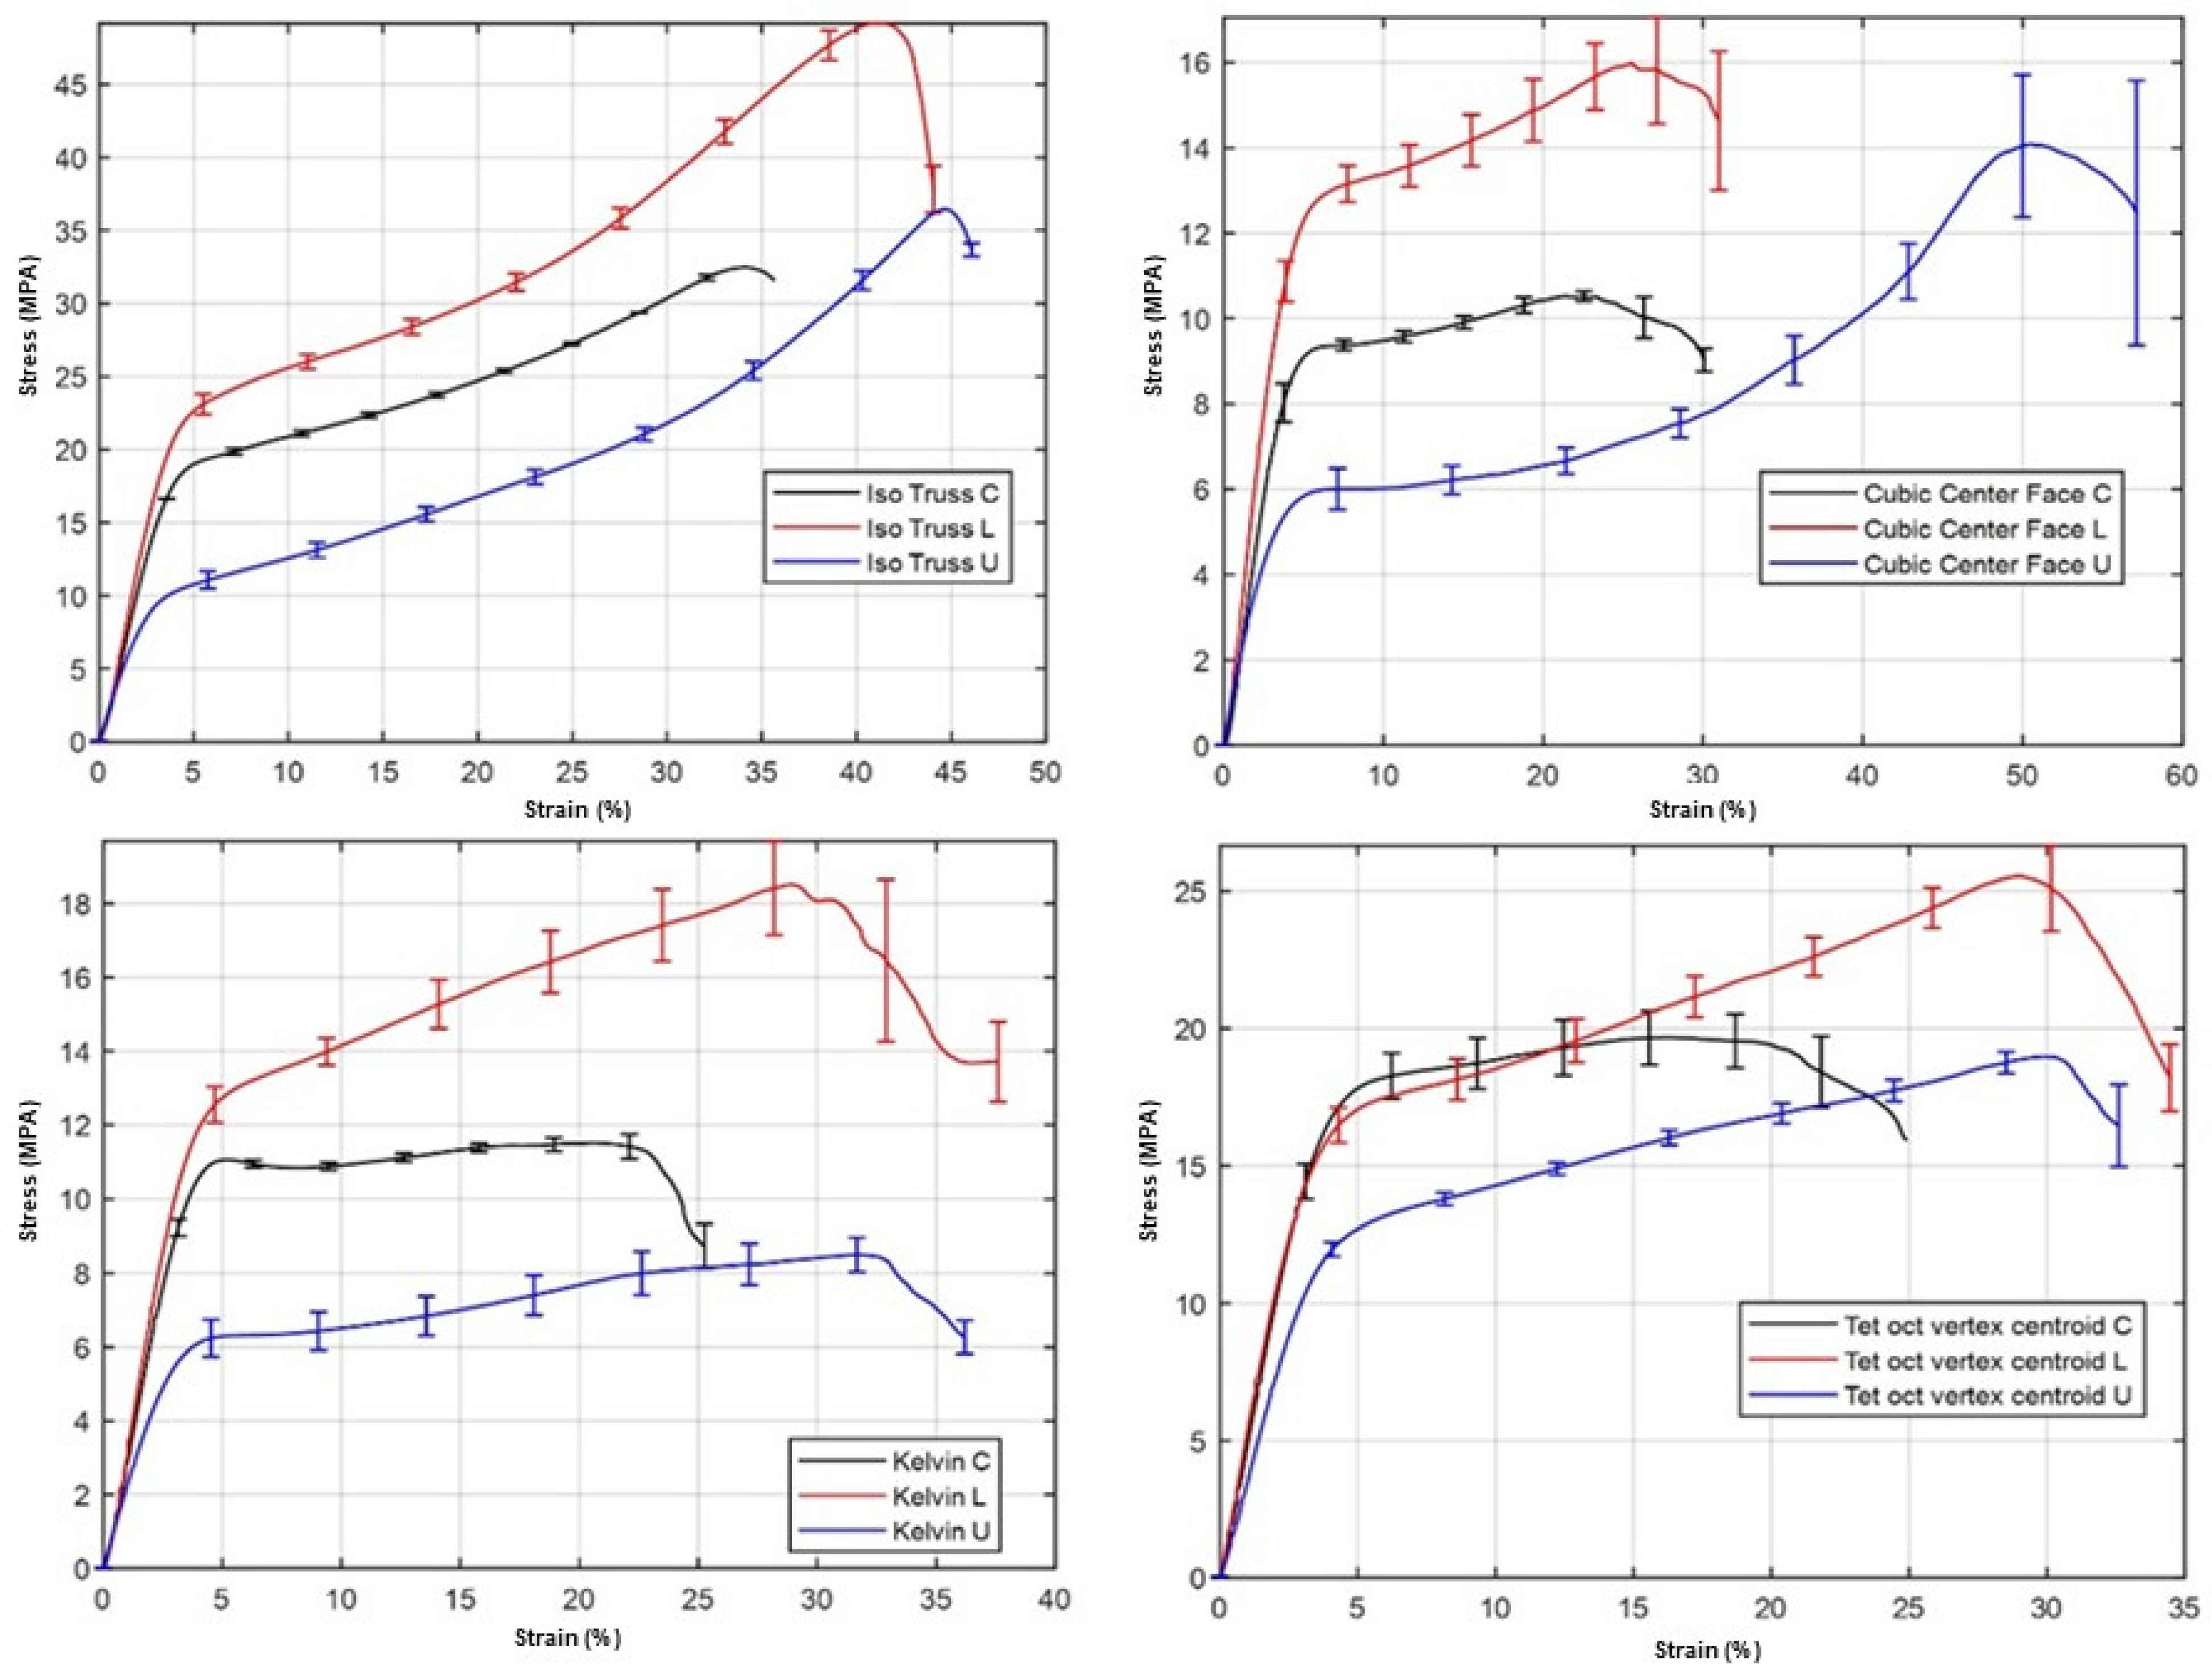
Figure 7 illustrates the mechanical behavior of the specimens through the stress–strain curves for the four different structural configurations, each subjected to density variations designated as L for linear, C for quadratic, and U for uniform. Specifically, the curves corresponding to the IsoTruss configuration in compression testing reveal distinct characteristics of each density type. The curve labeled “IsoTruss C” in
Figure 7 is notable for its gradually increasing quadratic density profile; it starts smoothly and exhibits a steep increase, reaching a peak strength near 32 MPa at 34% strain before dropping slightly. In the red curve, “IsoTruss L”, linear gradual density begins with a steady increase and rises steeply to over 48 MPa at 42% strain, then drops significantly, indicating possible structural failure. Finally, the blue curve, “Iso Truss U”, with uniform density, increases moderately to a maximum of approximately 36 MPa near 44% strain and then decreases exponentially; all curves show error bars reflecting the variability in the experimental data. The results of compression tests on parts with the Cubic center phase configuration with different lattice densities are: the black curve “Cubic Center Face C” shows the behavior with quadratic density and presents a progressive increase to a peak of 9 MPa at 23% strain, followed by a decline; the red colored curve “Cubic Center Face L” of linear density rises to a peak of over 13 MPa at 25% strain before a significant drop, suggesting structural failure; and the blue “Cubic Center Face U” of uniform density rises smoothly to a peak near 14 MPa at 50% strain, then declines rapidly, with all curves exhibiting error bars denoting measurement variability.
Figure 7 also presents the three curves for the parts with Kelvin lattice structures: the “Kelvin C” curve in black, representing a quadratic density, rises steeply to about 11 MPa before stabilizing and then decreasing slightly past 22% strain; the “Kelvin L” curve in red, symbolizing a linear density, shows a rapid increase to exceed 12 MPa near 5% strain, then rises to a value of 18 MPa with a percentage for strain of 28%, then experiences an abrupt decrease, which could indicate failure after the maximum load; finally, the “Kelvin U” curve in blue, reflecting uniform density, gradually rises to 6 MPa and remains relatively flat before dropping after 25% strain. The error bars present on all the curves indicate the variability in the test measurements. From the tests for the “Tet oct vertex centroid” specimens, it is observed that for the “C” specimen, in black, there is an increase of stress in the elastic stage up to 17.5 MPa; then, in the plastic stage, there is a maximum increase of 19 MPa, with a maximum deformation percentage of 25%. For the sample type “L” in red, the elastic behavior is observed up to 17 MPa, after which it exhibits plastic behavior up to a maximum value of 25 MPa, accompanied by a plastic deformation of 30%. In the sample type “U” in blue, the stress increases steadily up to 11 MPa, followed by a second stage (plastic) up to 18 MPa, also with a deformation of 30%. The curves show the error bars, denoting the variability in the experimental data and reflecting differences in strength and structural stability between the different lattice density configurations. On the other hand,
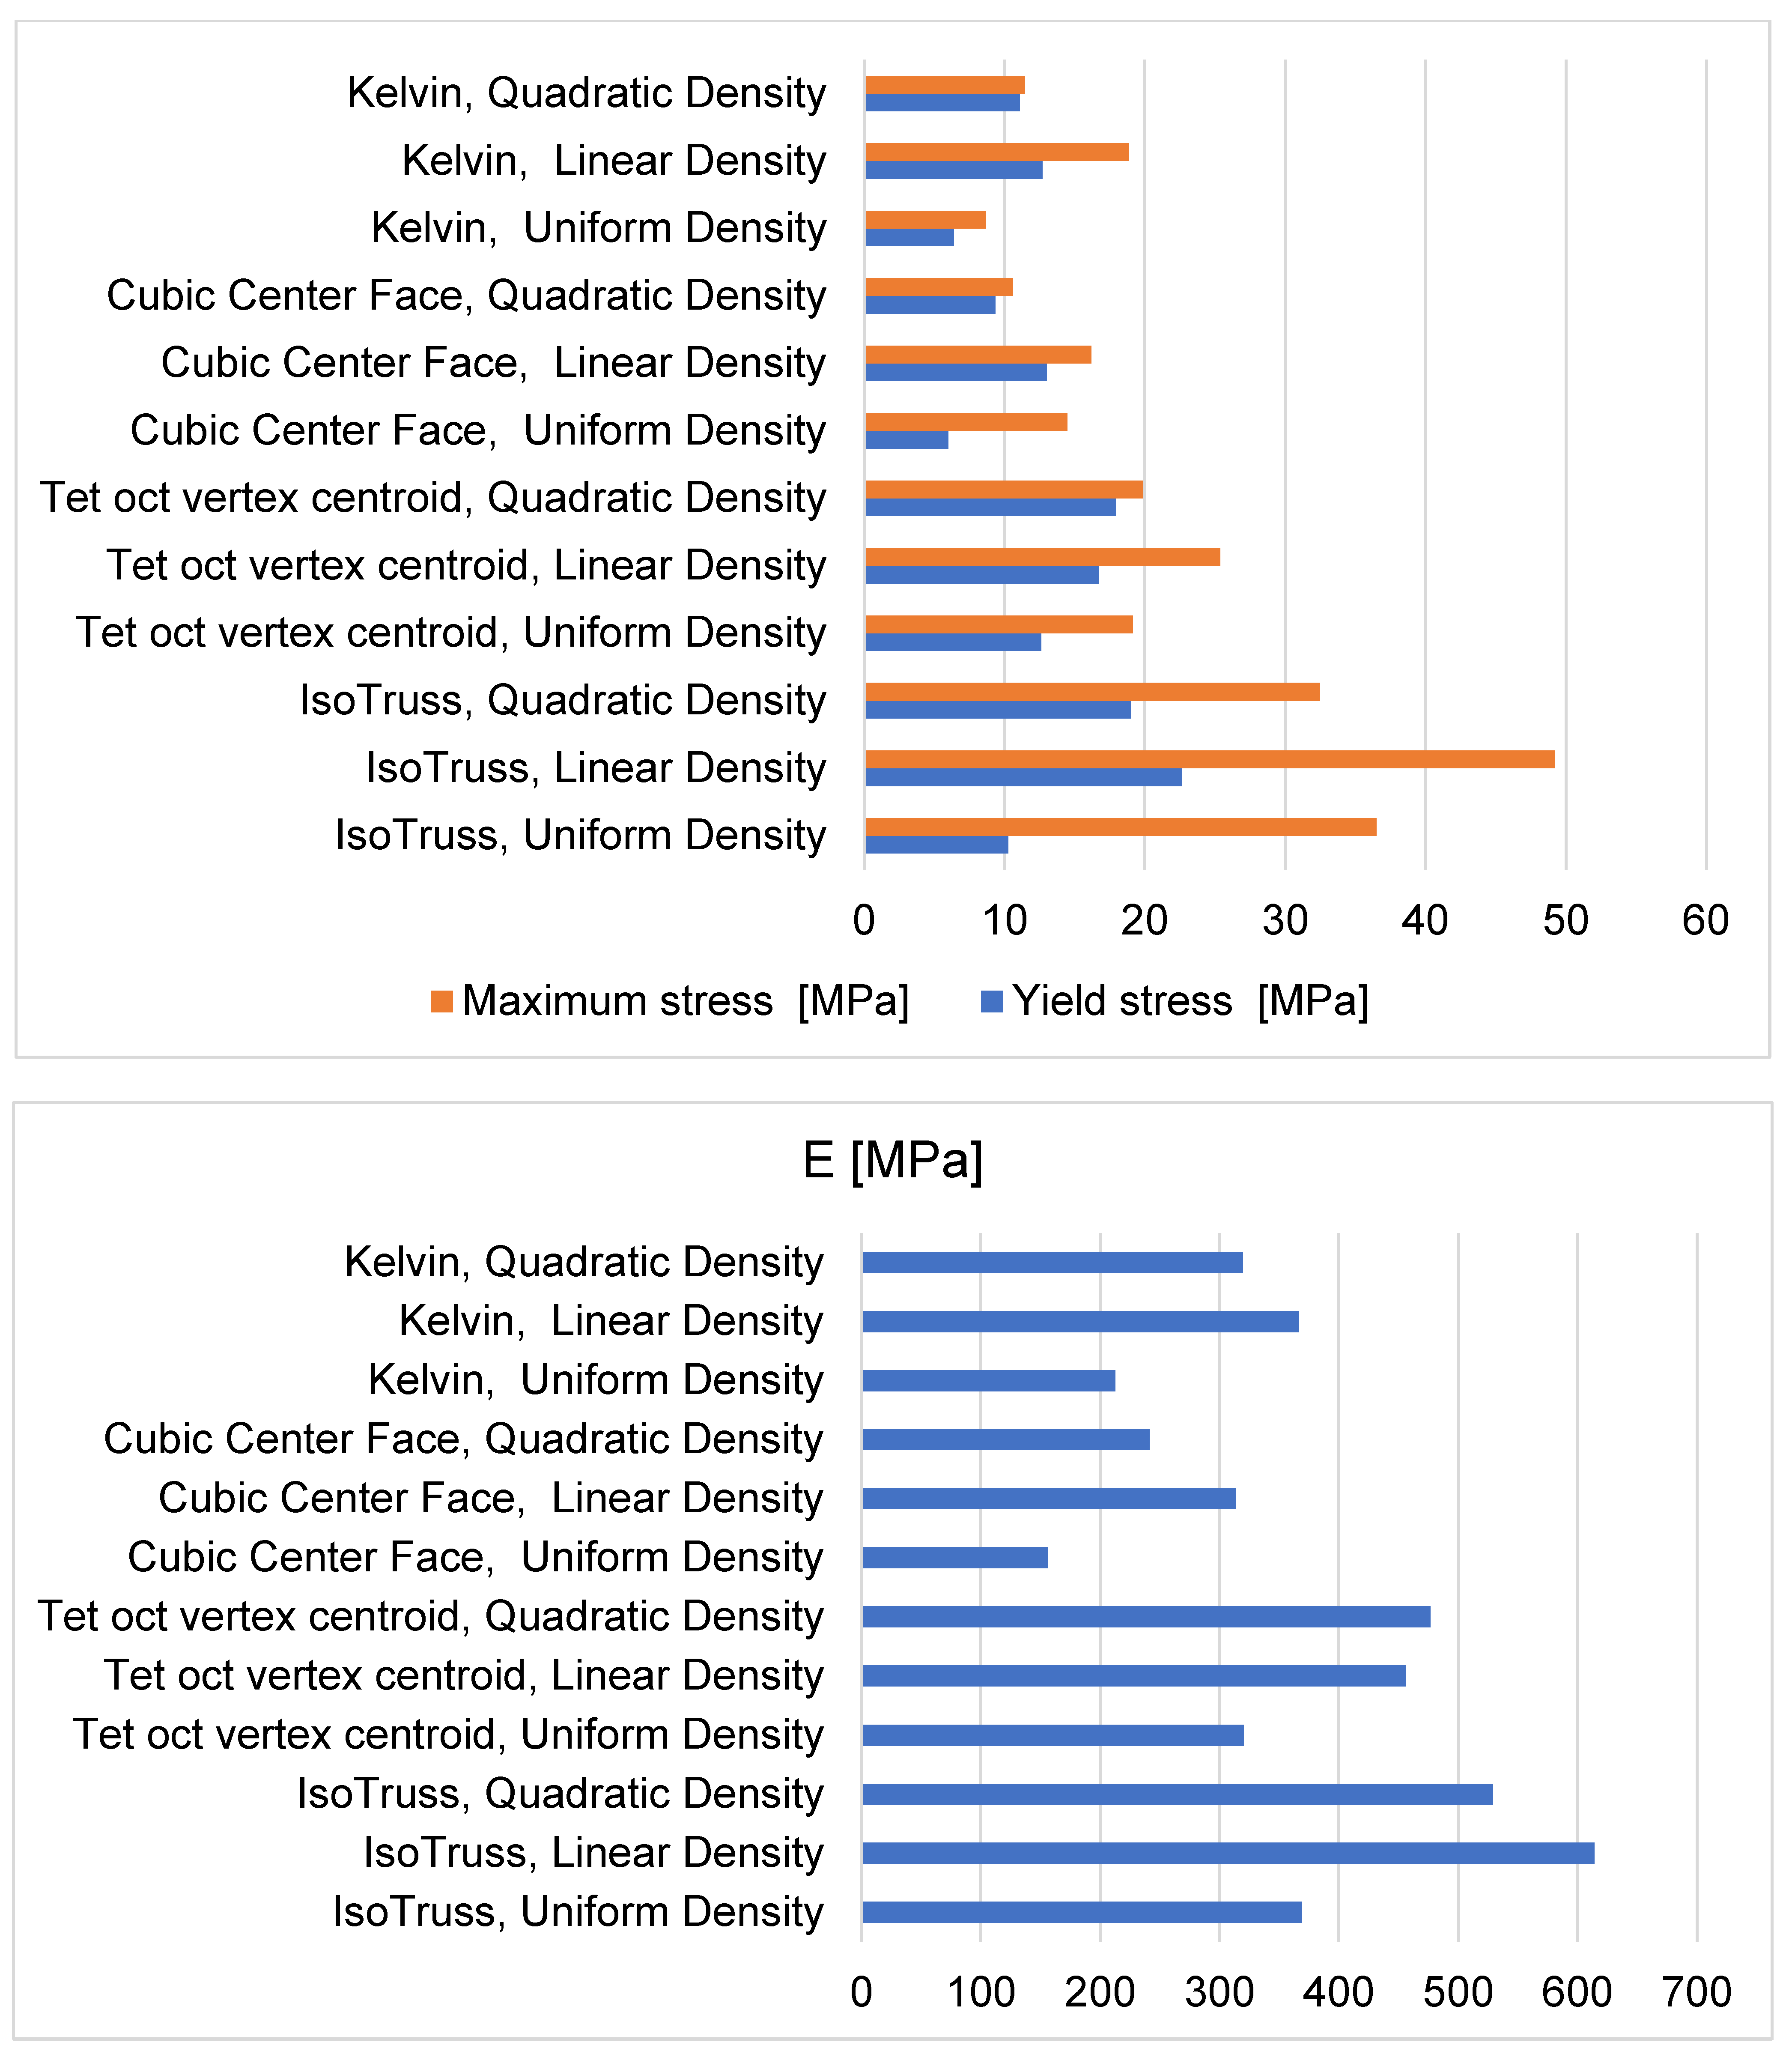
Table 3 shows the mechanical behavior of the factorial combinations analyzed. According to these data, it can be seen that the “IsoTruss” type specimen with a gradually linearly varying density in radial direction stands out in several categories: the highest modulus of elasticity of 613.97 MPa (±43.162 MPa) and the highest compressive strength with a yield stress of 22.646 MPa (±0.812 MPa). It also has the highest maximum stress with an average of 49.193 MPa (±1.134 MPa). These results suggest that the “IsoTruss” configuration is superior in terms of weight, stiffness, and compressive strength.
Thus, with the information presented in
Figure 8, it can be concluded that the FCC configuration presents the lowest properties; this configuration has a modulus of elasticity with an average value of 156.42 MPa (±3.603 MPa) and a yield stress of 5.991 MPa (±0.500 MPa). It also records the lowest maximum stress with an average of 14.476 MPa (±1.661 MPa). This indicates that it has the lowest strength in terms of stiffness and mechanical strength in compression. The “Kelvin” configuration under the linear variation configuration shows intermediate characteristics in terms of mechanical properties; its modulus of elasticity is moderate at 366.67 MPa (±45.784 MPa). As for creep, it is 12.706 MPa (±0.402 MPa) and a maximum compressive stress of 18.846 MPa (±1.511 MPa), values that, although not the lowest, are not the highest among the tested configurations. On the other hand, the “Tet oct vertex centroid” configuration under a linear density variation exhibits a remarkably high modulus of elasticity of 456.09 MPa (±16.519 MPa), indicating good structural stiffness. This configuration also shows good mechanical strength with a yield stress of 16.697 MPa (±0.646 MPa) and a maximum stress of 25.348 MPa (±0.935 MPa), which places it among the best-performing configurations in tensile and compressive strength of those presented in
Table 3.
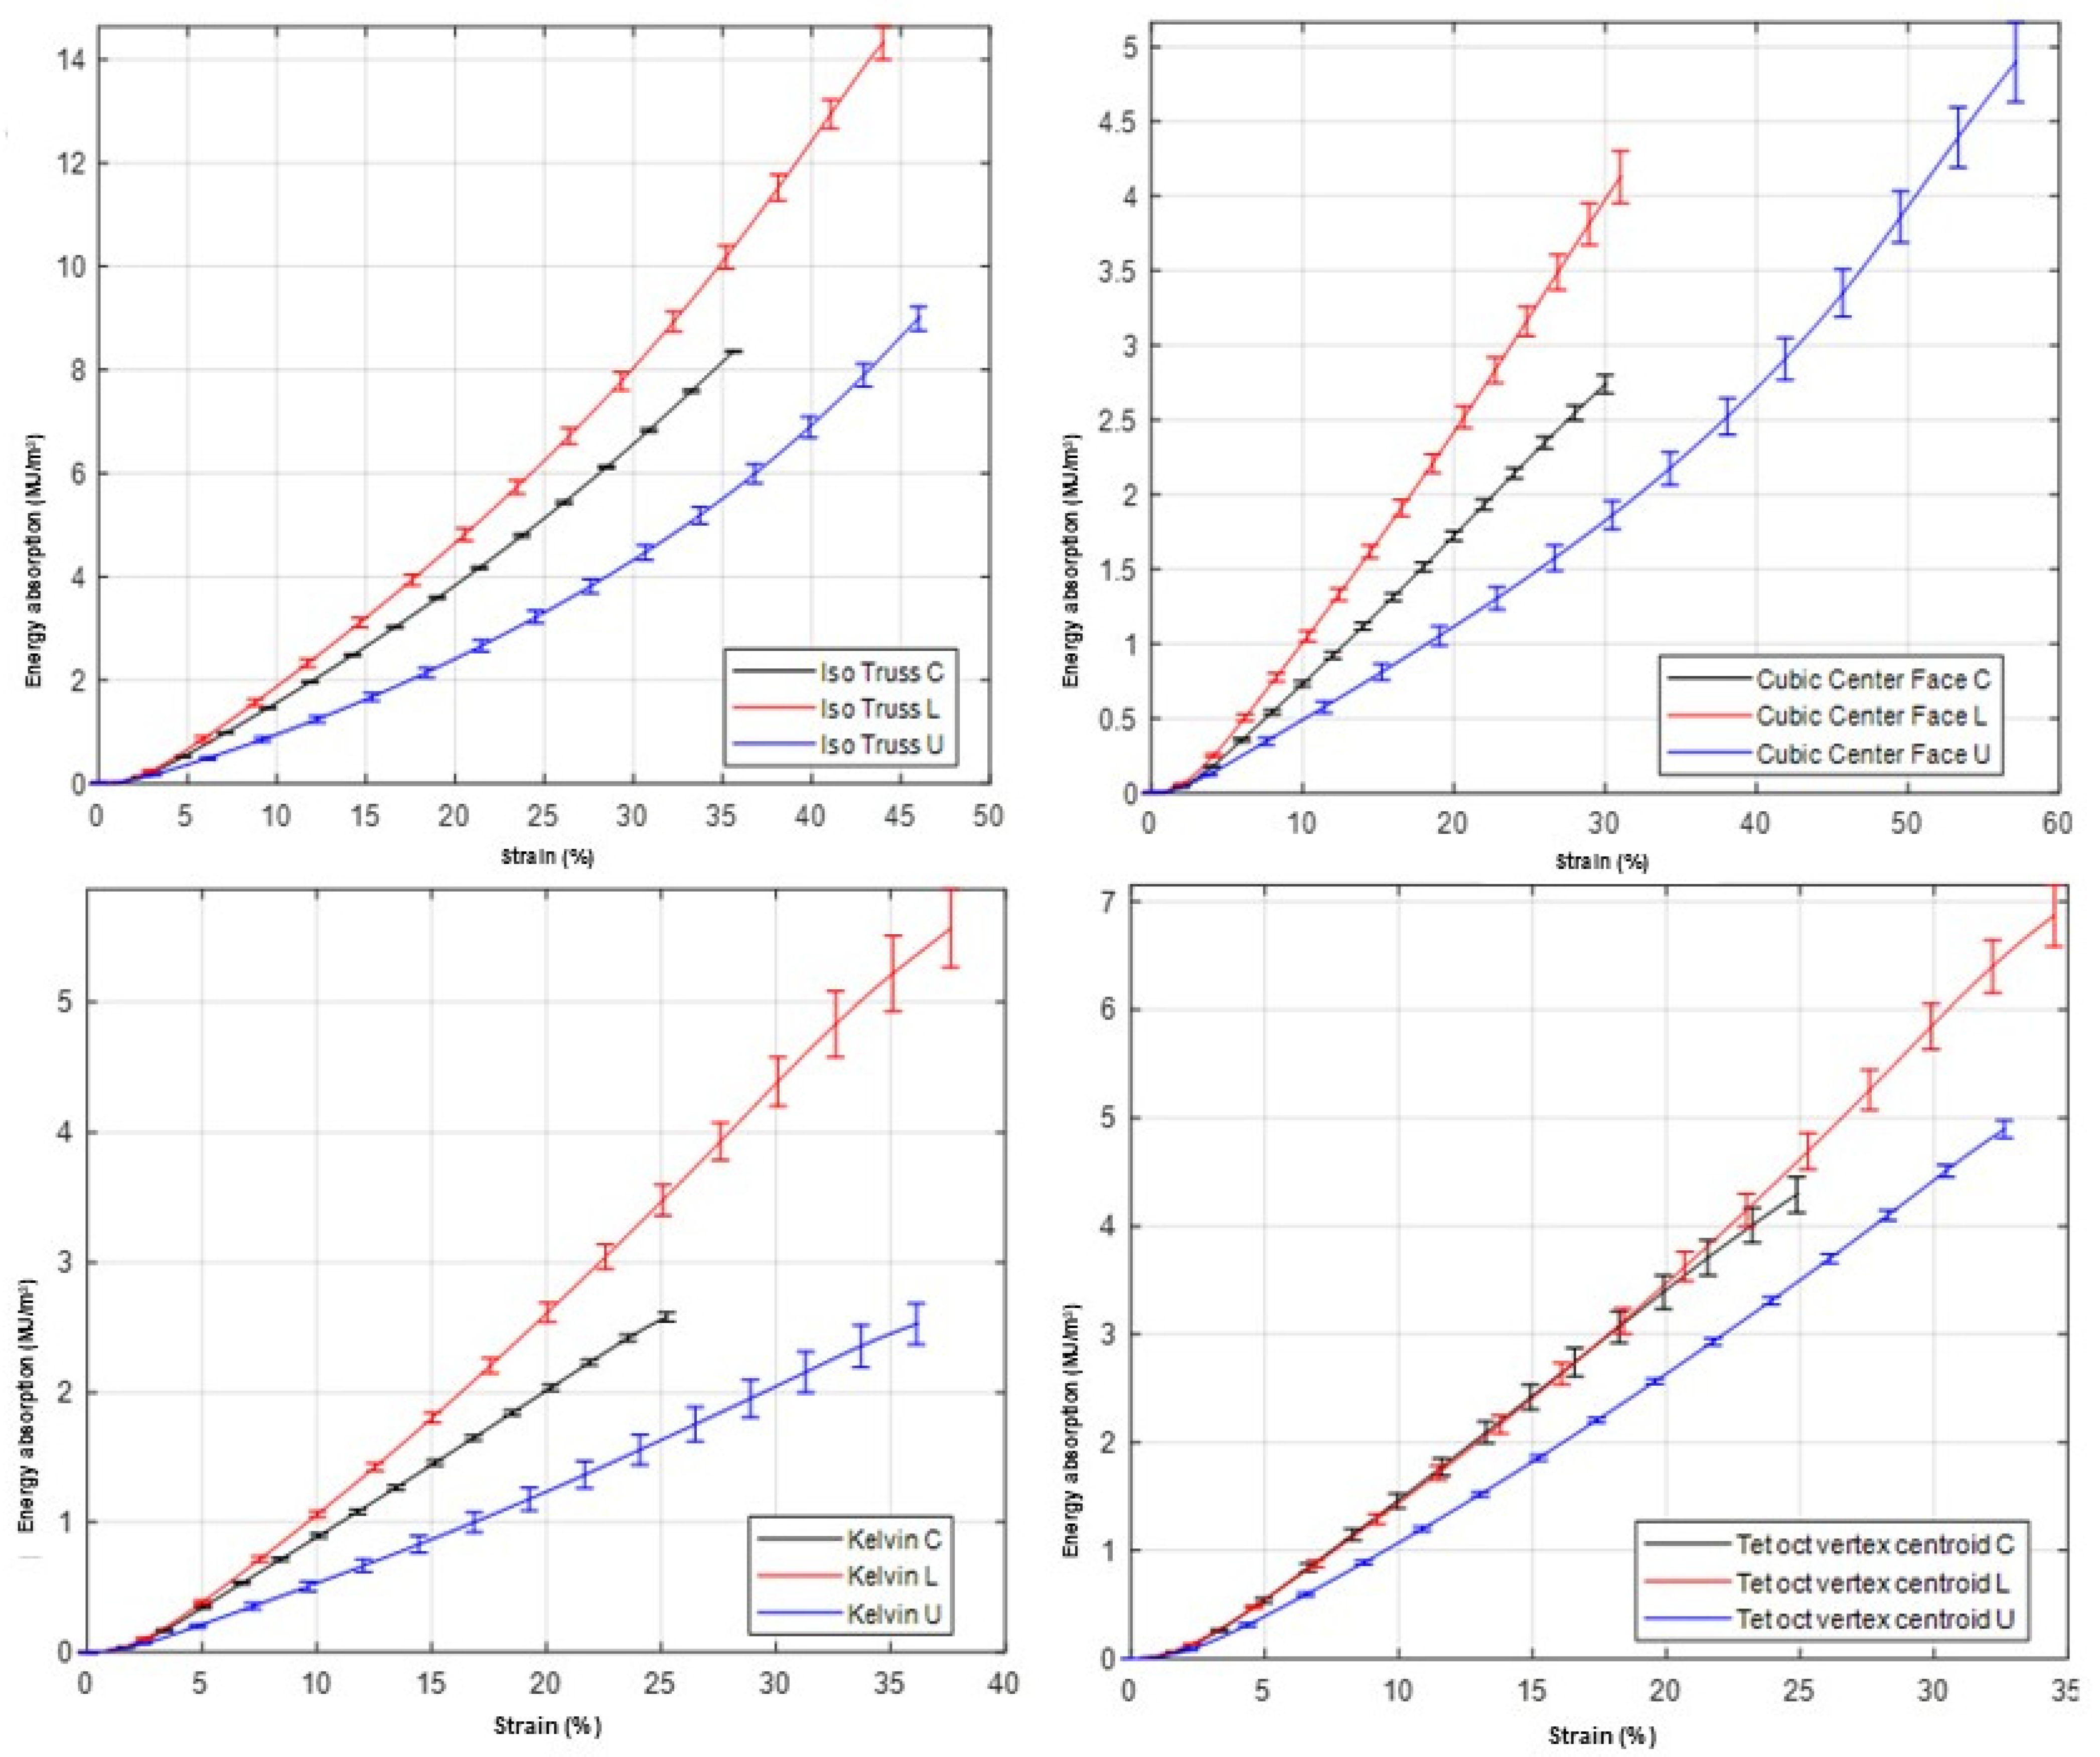
Figure 9 also shows graphically the behavior of the cumulative absorbed energy as a function of the percentage deformation. The graph shows that the energy absorption of “Iso Truss” specimens with different lattice densities behaves as follows: “IsoTruss C” (black) increases quadratically, reaching about 8 MJ/m
3 at 36% strain; ‘IsoTruss L’ (red) exhibits the highest absorption, with a steeper slope reaching about 15 MJ/m
3 before reaching 44% strain; and ‘IsoTruss U’ (blue) also increases linearly to about 9 MJ/m
3 at 46% strain. The error bars indicate variability in the measurements, with the “L” curve standing out for its absorptive capacity and “U” showing a steady increase with deformation. The graph behaviors for energy absorption in specimens with Cubic Face Center lattice structures are: “Cubic Center Face C” (black) shows an almost linear energy absorption behavior, reaching about 2.6 MJ/m
3 at 30% deformation; “Cubic Center Face L” (red) presents a similar growth initially, but with a steeper slope, reaching almost 4. 0 MJ/m
3 at 55% strain, indicating higher energy absorption efficiency; and “Cubic Center Face U” (blue) follows a quadratic pattern, with its energy absorption reaching 4.7 MJ/m
3 toward 57% strain, demonstrating a significant increase in absorption capacity as strain increases. The error bars reflect variability in the data, and the “L” curve stands out for its superior energy absorption capacity, while the “U” curve reveals an improvement in absorption at higher strain.
Figure 9 compares the energy absorption per unit volume in specimens with lattice structures. “Kelvin C” (black) has a linear growth and reaches 2.5 MJ/m
3 at 25% deformation, while “Kelvin L” (red) shows higher efficiency with a rapid increase up to about 5. 5 MJ/m
3 at 37% strain, and “Kelvin U” (blue) starts linear but improves its absorption after 15% strain, reaching 2.5 MJ/m
3 at 37% strain; the error bars indicate variations in the measurements, with the “L” curve excelling in absorption capacity and “U” showing potential for resistance at higher strains. Finally, the energy absorption plots of “Tet oct vertex centroid C” (black) specimens show a linear increase reaching 4.4 MJ/m
3 at 27% strain, “Tet oct vertex centroid L” (red) exhibits the highest efficiency with a steeper increase up to 6. 7 MJ/m
3 at 34% strain, and “Tet oct vertex centroid U” (blue) starts similar to “C” but improves past 15% strain, reaching 5 MJ/m
3 at 33% strain; the error bars indicate some variability in the measurements, with “L” excelling in energy absorption and “U” showing increasing potential with strain.
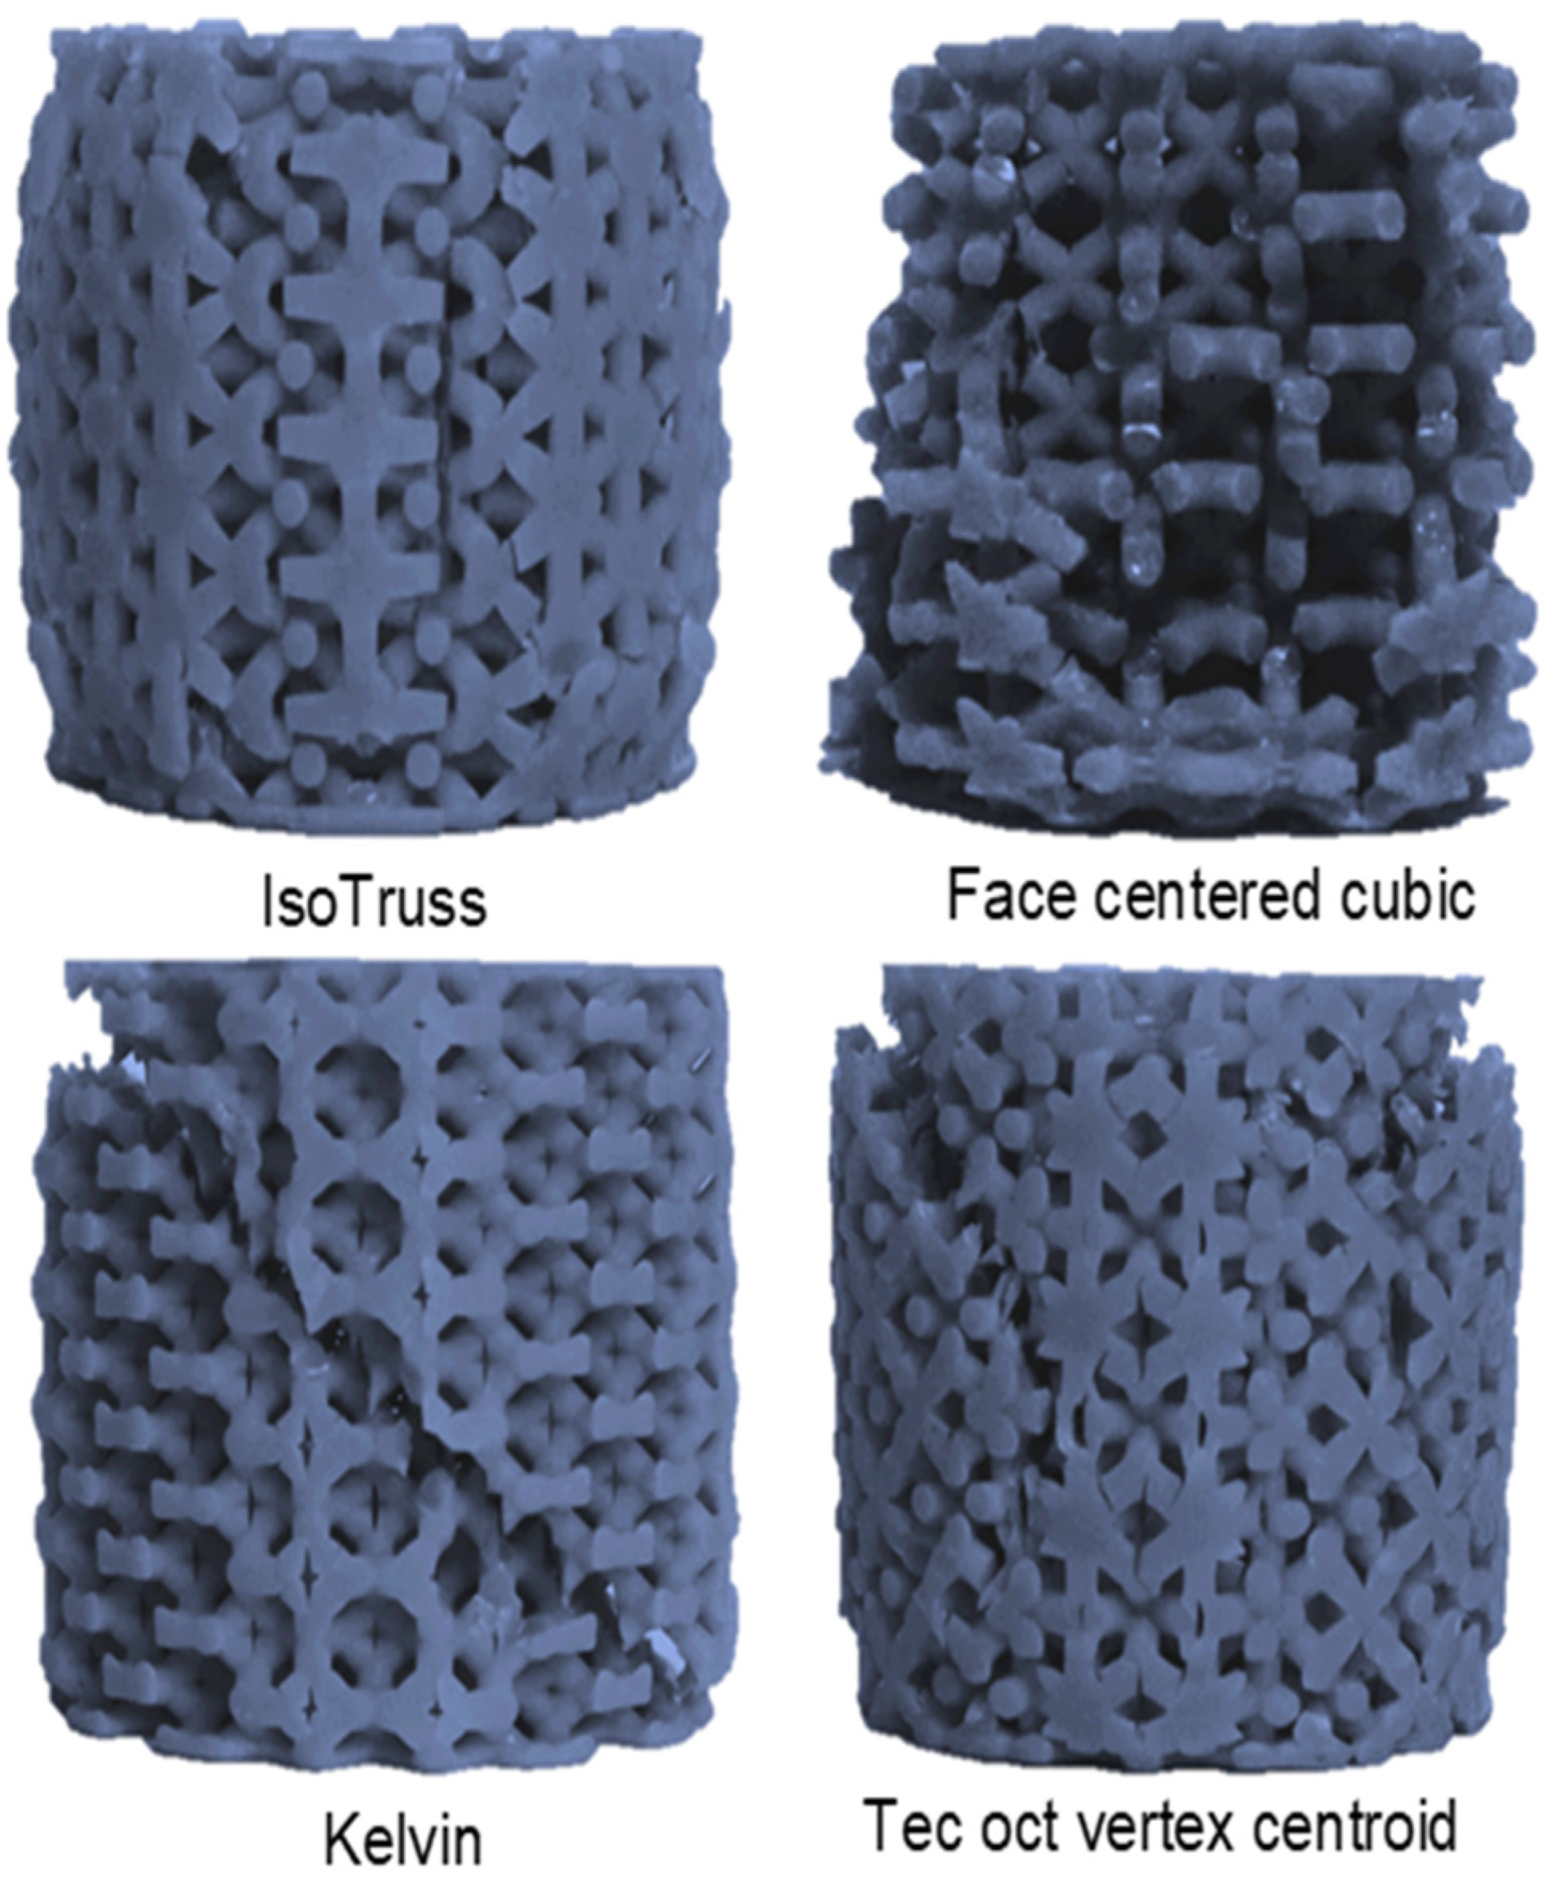
Figure 10 presents the images of the specimens that failed after the compression test. In the case of the specimen with IsoTruss structure geometry, compression resulted in a deformation simulating a barrel, which is indicative of a localized barreling phenomenon. The observed vertical fractures are consistent with a non-uniform stress distribution. The FCC sample exhibited a detachment failure in the peripheral region, indicating a stress concentration and potential weakness in the three-dimensional network connections at the ends. This same image clearly shows the detachment of the material, which, in turn, allows us to deduce the areas of greatest vulnerability and load transfer in the lattice structure under study.
In the Kelvin-type structure, diagonal deformation—a characteristic of a shear pattern at approximately 45 degrees relative to the compression axis—was observed. The test image reveals how this deformation is uniformly distributed, which is indicative of a strength similar to the isotropic behavior of the material and the effectiveness of the Kelvin lattice design in distributing the stresses, the visualization of the failure, which shows four radial fracture lines, provides evidence for the hypothesis of stress concentrations at the junction points of the lattice structure. The Tet Oct Vertex Centroid specimen evidenced failure at a 60-degree angle, which could correspond to a fracture pattern under axial loading combined with a torsional effect. The symmetry of the fracture at four points around the cylinder indicates a homogeneous structural response and an equal distribution of internal stresses. The image demonstrates the effectiveness of the design in absorbing and distributing compressive forces.
Detailed analysis by scanning electron microscopy (SEM) has revealed distinctive features in the fracture surfaces of specimens with post-compression lattice configurations. The SEM analysis was performed using a Tescan
® VEGA3 scanning electron microscope (Tescan, Brno, Czech Republic). The operational voltage for all images is the same SEM HV: 12.0 kV. The SEM images, characterized by their high resolution and depth of field, show the specific morphology of the fracture surfaces and the texture inherent to the 3D printing process used to fabricate the specimens. In
Figure 11a,b, the level of finish is observed at 37× and 52× magnification, respectively, showing the typical roughness of the stereolithographic growth process, with failure patterns that suggest fragility in the cross-section of each of the posts of the material, due to the type of flat cut. In
Figure 11c,d, the morphology of the relief attributed to the quality of the 3D printing is observed in greater detail. The configuration for the images included (a) View Field: 5.0 mm, SEM MAO: 27×, WD: 20.31 mm; (b) View Field: 4.0 mm, SEM MAO: 52×, WD: 18.94 mm; (c) View Field: 500 μm, SEM MAO: 415×, WD: 18.41 mm; (d) View Field: 151 μm, SEM MAO: 1.38k×, WD: 18.54 mm. The grayscale of the images denotes electron scattering, with lighter shades indicating areas of higher density and darker shades indicating lower scattering.
The center section of the image in
Figure 11b shows visible fracture patterns and rough textures at the rupture surfaces. Fracture lines are noted as internal stress patterns, suggesting failure propagation from the edges towards the center, and material displacements indicating variations in structural strength along the cross-section.
Figure 11c at 415× magnification allows detailed visualization of the abrupt fracture and stress patterns, while
Figure 11d at 1.38k× magnification provides a high-resolution view of the surface morphology and individual layers of the impression, allowing visualization of the orientation of the layers; it is also observed that at the root of each impression layer, there is an initiation of fracture patterns, indicating that stress concentrations occur in this region. These detailed observations are fundamental to understanding the mechanical behavior of the material under compressive loading and the influence of the fabrication process on the strength and failure mode of 3D printed structures with the stereolithography technique.
4. Discussion
While this study demonstrates the feasibility and benefits of lattice cell structures, it also opens the way for future research in design optimization, improvement of fabrication processes, and exploration of new applications. Specifically, it raises the need to investigate further the relationship between structural configurations, fabrication conditions, and final mechanical behavior.
The stress–strain behavior of the lattice structures under compression for four different configurations and three density variation patterns: linear (L), quadratic (C), and uniform (U). The IsoTruss configuration exhibits the most distinct response among all tested geometries, demonstrating a clear correlation between density gradient and mechanical performance. Specifically, the “IsoTruss L” curve exhibits a steady increase in stress, followed by a sharp rise, reaching a maximum compressive strength of over 48 MPa at approximately 42% strain. The subsequent abrupt stress drop indicates the onset of structural instability and localized failure, likely due to buckling of the central struts.
In contrast, the “IsoTruss C” specimen, characterized by a quadratic density gradient, exhibits a more progressive load bearing response, attaining a peak strength of 32 MPa at 34% strain before a gradual decline. This suggests a more distributed failure mechanism, potentially involving sequential collapse of regions with lower density. The uniform density “IsoTruss U” configuration reaches a slightly higher maximum stress of 36 MPa at 44% strain, but the curve shows a smoother post peak decay, indicating a relatively ductile failure mode. These results imply that linear density gradation enhances stiffness and load capacity, whereas uniform and quadratic profiles promote more stable energy absorption under compression.
For the face-centered cubic (FCC) configurations, the stress–strain curves reveal considerably lower compressive strengths across all density variations, reflecting their intrinsically lower stiffness. The “Cubic Center Face L” specimen achieved a maximum of approximately 13 MPa at 25% strain, while the “Cubic Center Face C” and “Cubic Center Face U” reached peaks of about 9 MPa and 14 MPa, respectively. The early stress drops in the linear and quadratic configurations suggest premature instability due to stress concentration at nodal junctions. The uniform density FCC specimen, however, maintained load-bearing capacity up to 50% strain, implying better deformation tolerance despite its lower strength.
Overall, these findings highlight that the IsoTruss configuration with a linear density distribution exhibits superior mechanical behavior, achieving nearly five times the compressive strength of the weakest FCC configuration. The distinct trends observed across the density profiles emphasize the strong dependence of mechanical performance on both geometric design and density distribution. These results are consistent with previous studies that have demonstrated the benefits of graded density and hierarchical geometries in optimizing stiffness to weight ratios and improving energy absorption efficiency in additively manufactured lattices.
Failure can also be studied in a specimen with a reticulated configuration designed to be subjected to compression, which can be used to iteratively improve the design by adjusting the lattice geometry, material, or fabrication parameters in future tests.
However, important differences across studies deserve attention: base material and fabrication route: mechanical properties strongly depend on the material used (SLA resins vs. extrusion polymers or LPBF metals) and on manufacturing defects; scale and cell size: mechanical response changes with the relative cell size compared to overall specimen dimensions and with printer resolution; gradient patterns: while some works report clear benefits of linear concentric gradients in concentrating mass where needed, others find that advantages depend on loading regime and targeted metric (peak strength vs. energy absorption). For failure modes, the literature documents various failure mechanisms, including local buckling in slender elements, brittle fracture in stiff resins, and shear/delamination in lattices with weak nodal connections [
51,
52].
Methodologically, this study contributes by employing a full factorial design, enabling detection of interactions between cell geometry and density distribution that single-factor studies may miss. To extend and generalize these findings, future work should include: (i) finite element analysis calibrated with experimental data to broaden predictive capability; (ii) sensitivity studies on printing parameters and material properties; (iii) fractographic and SEM-mechanical correlation to elucidate initiation and propagation mechanisms; and (iv) testing in metallic or composite materials to assess the transferability of trends observed in SLA resins [
53].
On the other hand, a detailed analysis of SEM images and their subsequent correlation with mechanical test data, according to the compression process, is a promising line of research. This research could provide a deeper understanding of the interactions at the microstructural level during load application. As a result, optimization strategies for 3D printing designs and parameters could be developed, with the goal of significantly improving structural integrity in various additive manufacturing applications.
Finally, exploring the results obtained in lattice structures in metallic or composite materials is highly relevant, given the current increase in the use of the stereolithographic growth process.
5. Conclusions
The 3D printing additive manufacturing technique, specifically stereolithography, has proven effective for creating complex structures based on lattice cells. This represents a significant contribution to determining the capabilities that this technique offers in additive manufacturing. Reticle cell structures offer the possibility of adjusting their mechanical properties, such as stiffness and strength, by varying the dimensions of the unit cells. This modification capability allows the optimization of materials for specific applications, maximizing efficiency in energy absorption and weight reduction.
Lattice structures manufactured using additive manufacturing present a wide range of emerging applications and research avenues to explore. For example, the systematic review “Lattice Structures in Additive Manufacturing for Biomedical Applications” highlights the significant opportunity these architectures offer for customized implants, regenerative bone scaffolds, and multifunctional biomedical devices. Similarly, the review “Additive Manufacturing and Influencing Factors of Lattice Structures: A Review” identifies key challenges, such as optimizing unitary topologies, designing with functional density gradients, and integrating multiple morphological modes, which pave the way for structurally efficient devices with adaptive mechanical responses. Therefore, a promising direction lies in the transition to hybrid structures or controlled density gradients, which allow for optimizing not only stiffness or energy absorption, but also damping, thermal response, and sensor integration. These structures could be applied in the aerospace sector (lightweight fatigue-resistant structures) or in automotive (impact-absorbing components), biomedical (implants with a modulus equivalent to bone) and energy systems (lightweight heat exchangers with high thermal conductivity).
In this work, we explored the configuration of various lattice structures, including IsoTruss, face-centered cubic (FCC)-type cells, Kelvin structures, and Tet oct vertex centroid, demonstrating that different geometries offer varied mechanical responses under load. This underscores the importance of selecting the right design to meet specific performance requirements.
The results of the study indicate that lattice cell-based structures have potential in various fields, such as biomedical engineering, lightweight construction, and the manufacture of advanced structural materials. This is due to their mechanical strength and efficiency in energy absorption and weight reduction, properties valued in sectors such as aerospace, automotive, and defense.
The research highlights the potential of lattice cell structures manufactured by stereolithography, offering a valuable alternative to the design, manufacture, and applicability in improving efficiency in energy absorption and weight reduction in advanced materials. The study showed, as a result, that the best structure was ¨IsoTruss¨ with density in a linear form, which presented the highest maximum stress with an average of 49.193 MPa, followed in second place by ¨IsoTruss¨ with density in a uniform form with a maximum stress of 36.485 MPa and in third place by ¨IsoTruss¨ with density in a quadratic form; the lowest maximum stress was found for Kelvin with density in a uniform form, obtaining a value of 8.669 MPa. These results suggest that the “IsoTruss” configuration is superior in terms of weight, stiffness, and compressive strength, with results up to 5 times higher than the minimum strength obtained in the present study.
