1. Introduction
Additive Manufacturing (AM, i.e., 3D printing), is a part of Industry 4.0 that enables mass customization. Indeed, 3D printing is able to answer several requirements in Industry 4.0, such as speedy delivery, mass customization, and effectiveness [
1]. In contrast to subtractive manufacturing processes, 3D printing is the process of fabrication from a digital model by adding material through a layer-by-layer deposition mechanism. Three-dimensional printing has proved its advantages compared to traditional manufacturing techniques. For example, 3D printing can minimize material waste and reduce production cycle times, which is economical. Particularly, for parts with complex geometries, a considerable time is required to provide suitable tool paths and machine setups for machining, but complexity in geometry has no influence on the 3D printing process because the component is sliced into layers. In addition, 3D printing has indicated its benefits in the fabrication of multi-material structural elements, lightweight parts, thin-walled structures, and customized components. Despite the aforementioned benefits of 3D printing, there are some limitations and challenges in this field. For instance, some 3D printing techniques are not suitable for mass production [
2]. Moreover, sometimes post-processing techniques are required for 3D-printed parts, which takes a lengthy time [
3]. Review of the literature reveals that residual stress [
4], anisotropy in properties [
5], pre- and post-processing [
6], maintenance issues [
7], and limited recyclability of materials [
8] should be considered as limitations and current challenges in 3D printing techniques. Considering the above-mentioned advantages and limitations, 3D-printed parts have been used in a wide range of applications, such as the aerospace industry [
9], medicine [
10], the automotive industry [
11], electronics [
12], and the food industry [
13]. According to ISO/ASTM 52900:2021 [
14], 3D printing has been classified into seven techniques: material jetting, VAT photopolymerisation, binder jetting, powder bed fusion, directed energy deposition, sheet lamination, and finally material extrusion, which has been used in the current study.
It is noteworthy that production by 3D printing has special characteristics. For instance, layer-by-layer accumulation, cyclic heating, and high cooling rates, which lead to a unique microstructure in 3D-printed parts [
15]. Therefore, printing parameters, such as layer thickness, printing speed, infill density, and raster angle, have an influence on the mechanical behavior of 3D-printed parts [
16,
17,
18]. For instance, in [
16], the mechanical properties of PLA-Zn composites with different infill patterns were determined. For this purpose, PLA-Zn filament was used to fabricate composite specimens through the FDM process. The experiments indicate that octet and cubic infill patterns have higher mechanical properties. In different studies [
19,
20,
21], the effects of printing parameters on the strength and mechanical performance of 3D-printed structural elements have been investigated. In [
22], the FDM technique was used to fabricate the specimens. The mechanical tests indicate that strength and formability increased and decreased, respectively, in all loading modes when the amount of PLA was increased. Moreover, compared to the PLA70 and PLA50 compounds, the PLA90 exhibited fracture toughness that was 1.69 and 2.36 times higher, respectively. In a subsequent study, the effects of printing parameters on the fracture behavior of 3D-printed parts were investigated in [
23]. In this respect, nickel-plated carbon fiber powder and Polylactic Acid (PLA) thermoplastic powder were mixed and used in the Fused Deposition Modeling (FDM) process, which belongs to the material extrusion category. Although the FDM is a common material extrusion process, there is not sufficient strength in 3D-printed parts made by the FDM process. Therefore, strength improvement in FDM 3D-printed parts is a necessity. The experiments showed that Young’s modulus and tensile strength can be improved with adjustment of the printing parameters. Most recently, the fracture behavior and mechanical response of FDM 3D-printed parts were investigated in [
24]. To this end, the essential work of fracture was employed to determine the weak interface-dependent fracture behavior of 3D-printed samples. In particular, double-edge-notched tension specimens were printed with varying raster angles using a high-performance plastic material. Following tensile tests, the brittle, quasi-brittle, and ductile fracture behavior of the specimens was recorded. The specimens with +45°/−45° raster angles showed the maximum fracture toughness.
The current study aims to determine the effects of the manufacturing process on the mechanical strength and fracture behavior of FDM 3D-printed parts. To this end, Polyethylene Terephthalate Glycol (PETG) material is used to print notched specimens based on the FDM process. In this study, notches in the specimens were made by (i) 3D printing and (ii) milling to determine the effects of the manufacturing process on the fracture behavior of the notched specimens. Moreover, all specimens are printed with different building angles (+45°/−45° and 0°/90°) to evaluate the influence of printing direction on the mechanical strength of the specimens. Based on a series of three-point bending tests, the effects of the manufacturing process and printing direction on the notched specimens are determined. The rest of this paper is structured as follows: In
Section 2, a brief overview of the current challenges in the FDM process has been presented. The preparation of samples is explained in
Section 3. In
Section 4, details of the experimental tests are described. In
Section 5, numerical simulations are outlined. The obtained results are described and discussed in
Section 6. Finally, a short conclusion has been presented in
Section 7.
2. A Brief Overview on Current Challenges in the FDM Process
The FDM process is one of the most widely used 3D printing techniques and can be used for the fabrication of parts that are typically impossible to manufacture with conventional manufacturing processes. FDM is widely utilized in various applications due to its low material waste, ease of use, and low cost. Although FDM is one of the fastest-growing 3D printing techniques, there are different challenges, such as low mechanical properties, the presence of voids in 3D-printed parts, and some difficulties in printing that must be overcome. In this respect, the mechanical strength and performance of 3D-printed parts can be improved with the addition of fibers [
25,
26,
27]. In this context, different fibers, such as glass fiber, kevlar, and carbon fiber, can be used. Adding fibers during the printing process is continuous fiber reinforcement and has been employed in the polymer industry to increase the strength of parts in conventional composites. Moreover, the mechanical strength of FDM 3D-printed parts can be improved by optimizing printing parameters. Indeed, as printing parameters have an influence on the mechanical behavior of FDM 3D-printed parts, printing with optimal parameters (e.g., printing direction, nozzle temperature, and printing speed) can increase the mechanical strength of 3D-printed components.
As mentioned earlier, discontinuities and voids have been observed in FDM 3D-printed parts, which is a challenging issue. The voids can be introduced during the printing process, which leads to 3D-printed parts with relatively poor mechanical strength. Void formation is dependent on the neck growth in rasters. The incomplete neck growth between the next intra-layer and inter-layer might lead to internal voids [
28]. It is noteworthy that print bed temperature is an important parameter in void creation. Therefore, a suitable print bed temperature (appropriate for the utilized material) is a necessity to obtain a relatively isotropic 3D-printed component. It should be noted that other printing parameters, such as infill pattern, position on the Z axis, and printing speed, have effects on the voids in the FDM process, which should be considered prior to the printing process.
The dimensions of 3D-printed parts are limited by the printing bed size in all 3D printers. In fact, limitations in printer size can be considered as another challenge, but in the FDM technique, the 3D printer is theoretically scalable and can be fabricated large enough to print large parts. In addition, in order to overcome the size limitation, large parts can be divided into several parts, which can be printed separately. The components can be assembled after the printing process.
Although the FDM process is suitable for the fabrication of thermoplastic components, because of difficulties in printing thermoplastic elastomers, only a few thermoplastic elastomers are appropriate for the FDM process [
29]. In fact, the 3D printing of thermoplastic elastomeric materials is still being developed. Filament buckling and misalignment of soft thermoplastic elastomers are common problems and current challenges in commercial FDM 3D printers. This occurs because the filament has no support in the space between the feeding and the entrance of the extruder. Eliminating the free-column length after the driving wheel is an efficient method for preventing the buckling of soft thermoplastic elastomeric materials in the FDM process. In this context, a guide tube can be installed between the nozzle and the bottom of the drive wheel. By this technique, buckling can be avoided in the fabrication of parts using soft thermoplastic elastomeric materials. In order to prevent any buckling in super-soft thermoplastic elastomeric materials, some changes in the guide tube are necessary to provide a zero free-column length.
3. Specimen Preparation
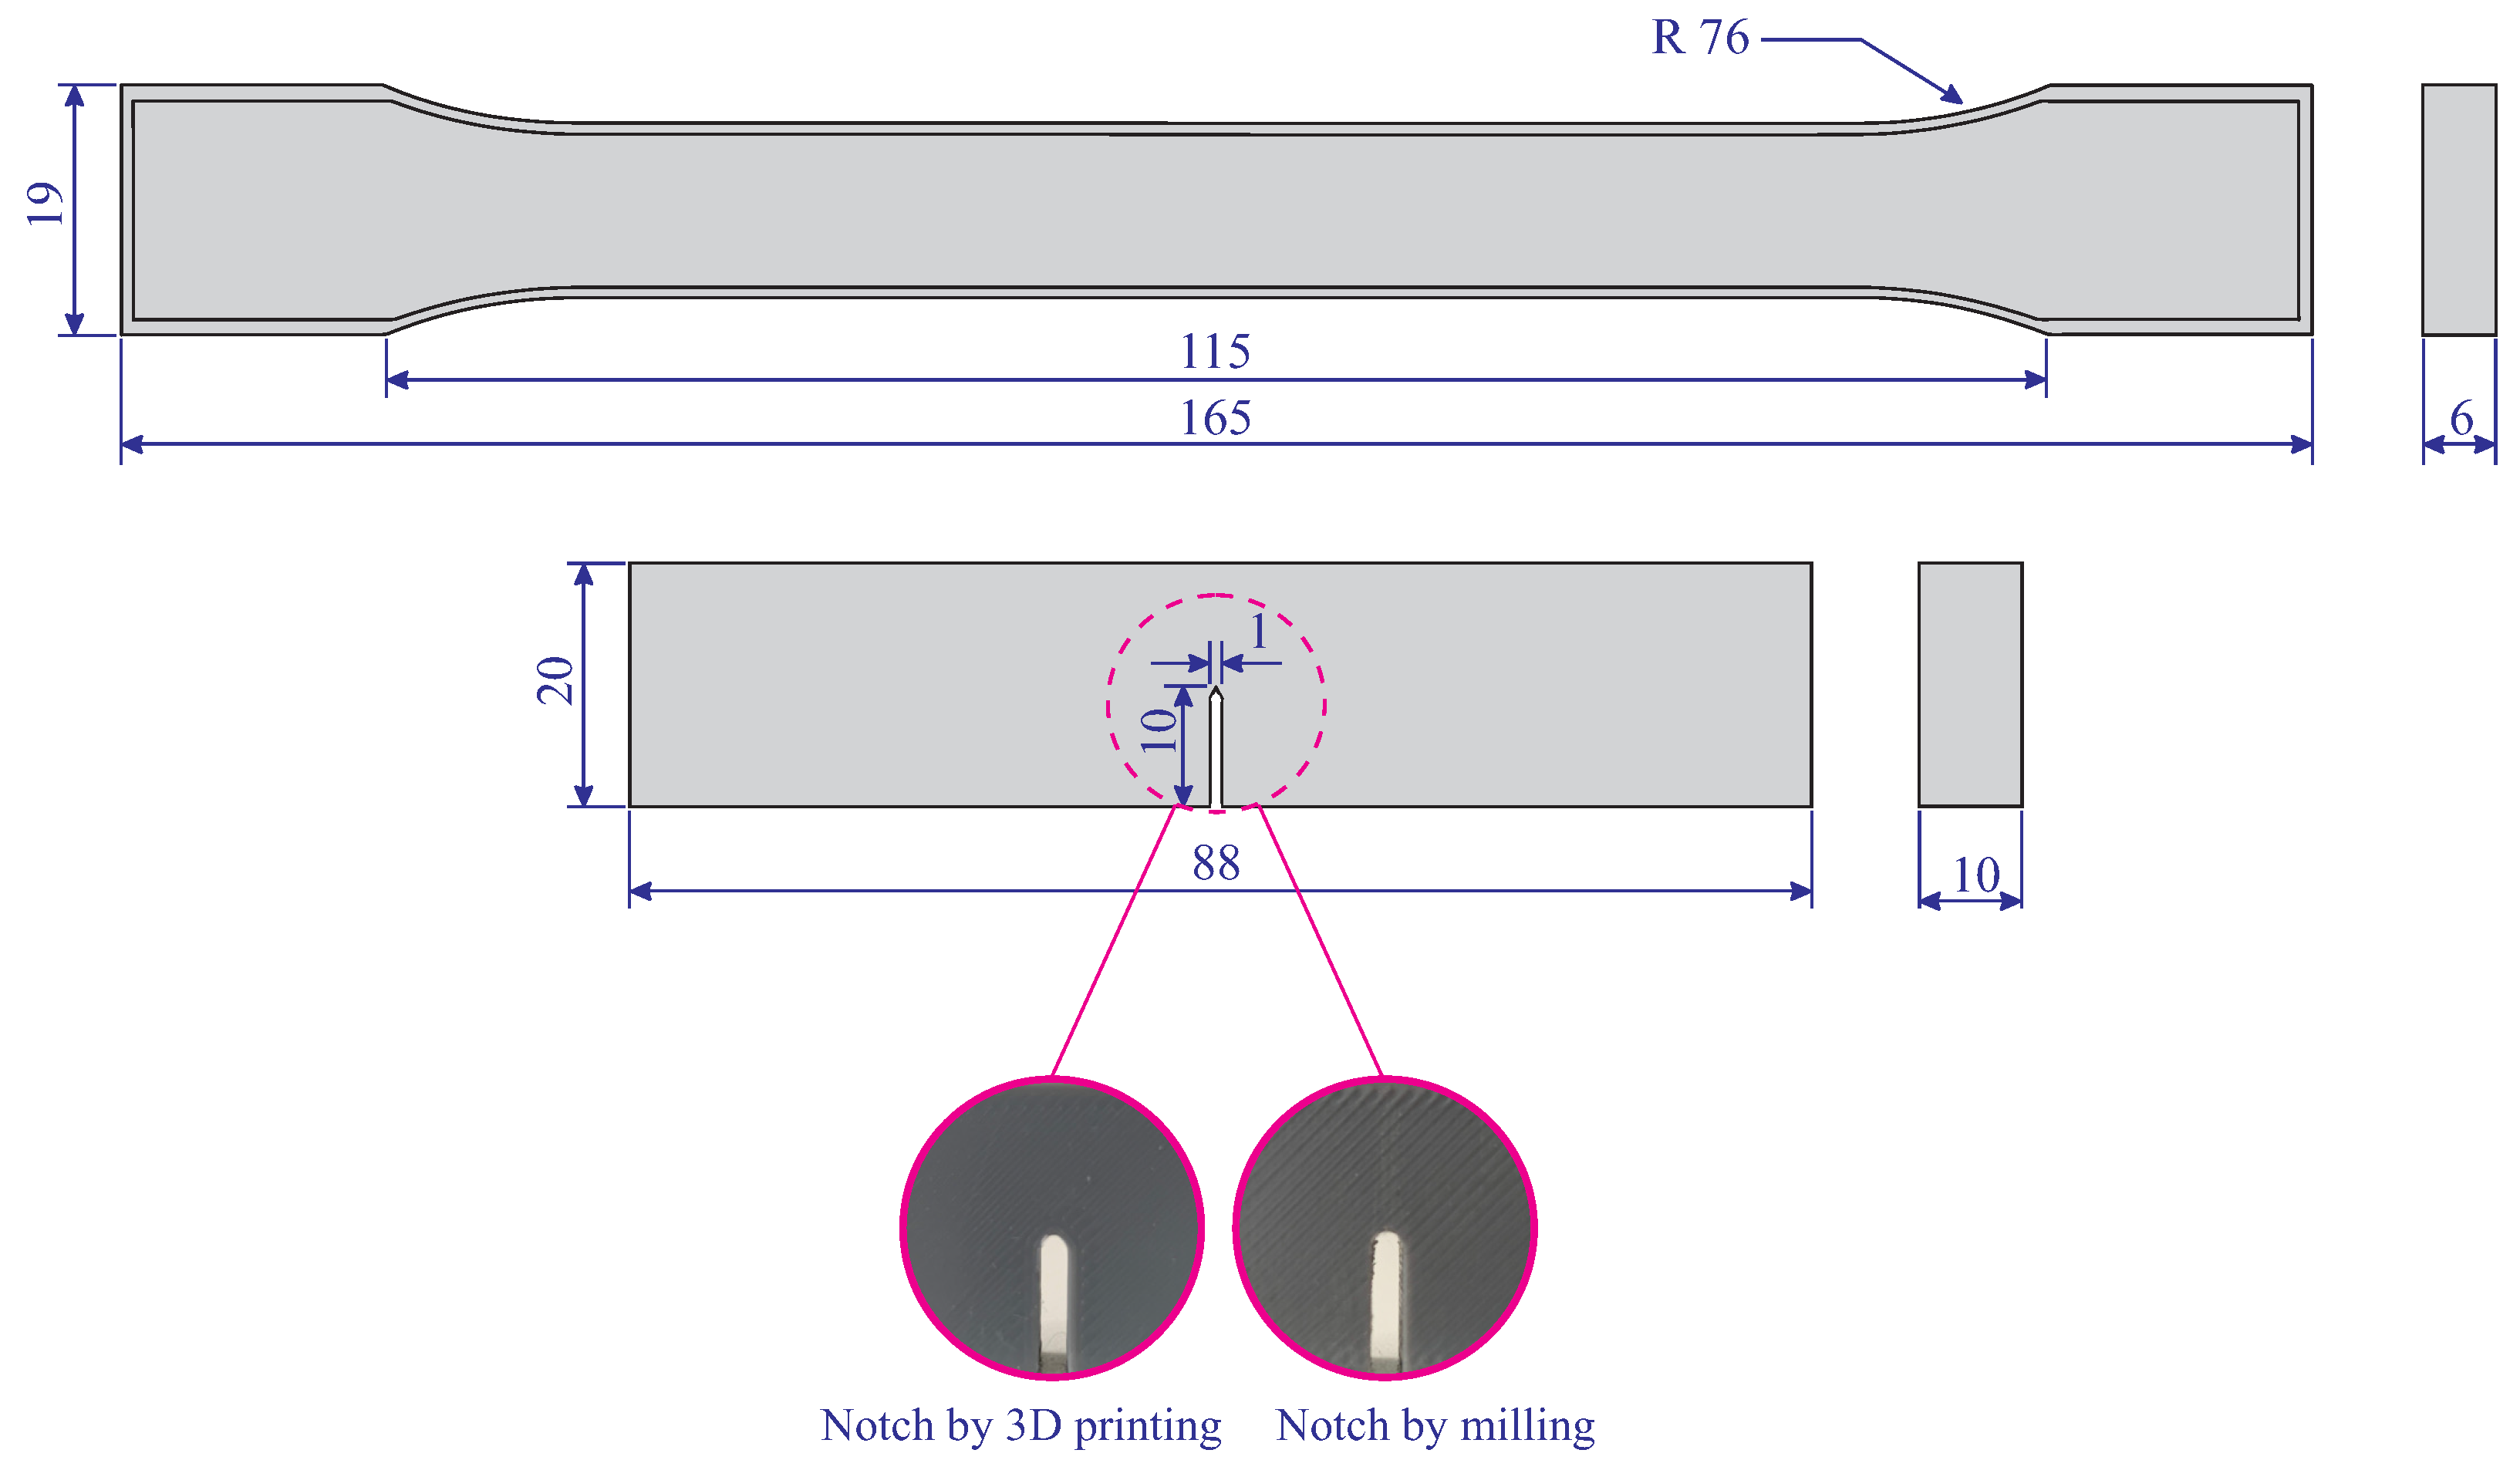
In this study, Single Edge Notched Bend (SENB) specimens were designed and printed using PETG material. The SENB specimens are notched test coupons, which are commonly used to study the fracture behavior of different materials. Here, two groups of SENB specimens were fabricated. In the first group, the notch was considered in the CAD platform and printed using the FDM technique. In this group of specimens, the notch region and the circumference of the specimens were surrounded by two outer walls. In the second group of SENB samples, the notches were made by milling. In this context, a 1 mm drill bit was used. It is noteworthy that the specimens were continuously cooled during the milling process to ensure that overheating does not occur and to avoid recrystallization in the notched area. A microscopic investigation confirmed similar shape and dimensions of the notches in 3D-printed and milled notches. In addition, dumbbell-shaped samples were printed to determine basic mechanical properties. The dumbbell-shaped samples and SENB specimens are schematically illustrated in
Figure 1. It should be noted that the dumbbell-shaped and SENB specimens were designed according to ASTM D638 [
30] and ASTM D5045 [
31] standards, respectively.
All dumbbell-shaped and SENB specimens were printed with two different filament orientations: (i) +45°/−45°, and (ii) 0°/90°, and infill density of 100% (infill pattern: lines). Although the specimens were printed with different raster directions, all other printing parameters (e.g., nozzle temperature, layer thickness) were kept constant to ensure consistent printing quality. All specimens were printed with a layer thickness of 0.2 mm. In
Table 1, material properties of PETG and printing parameters are summarized.
All specimens were fabricated within a validated area of the build platform under the same conditions. In order to ensure printing quality of the SENB specimens, the visual appearance of 3D-printed specimens was investigated, and failed parts were replaced to provide statistically consistent results. In total, five identical SENB specimens were considered for testing each notch and printing direction.
4. Experimental Tests
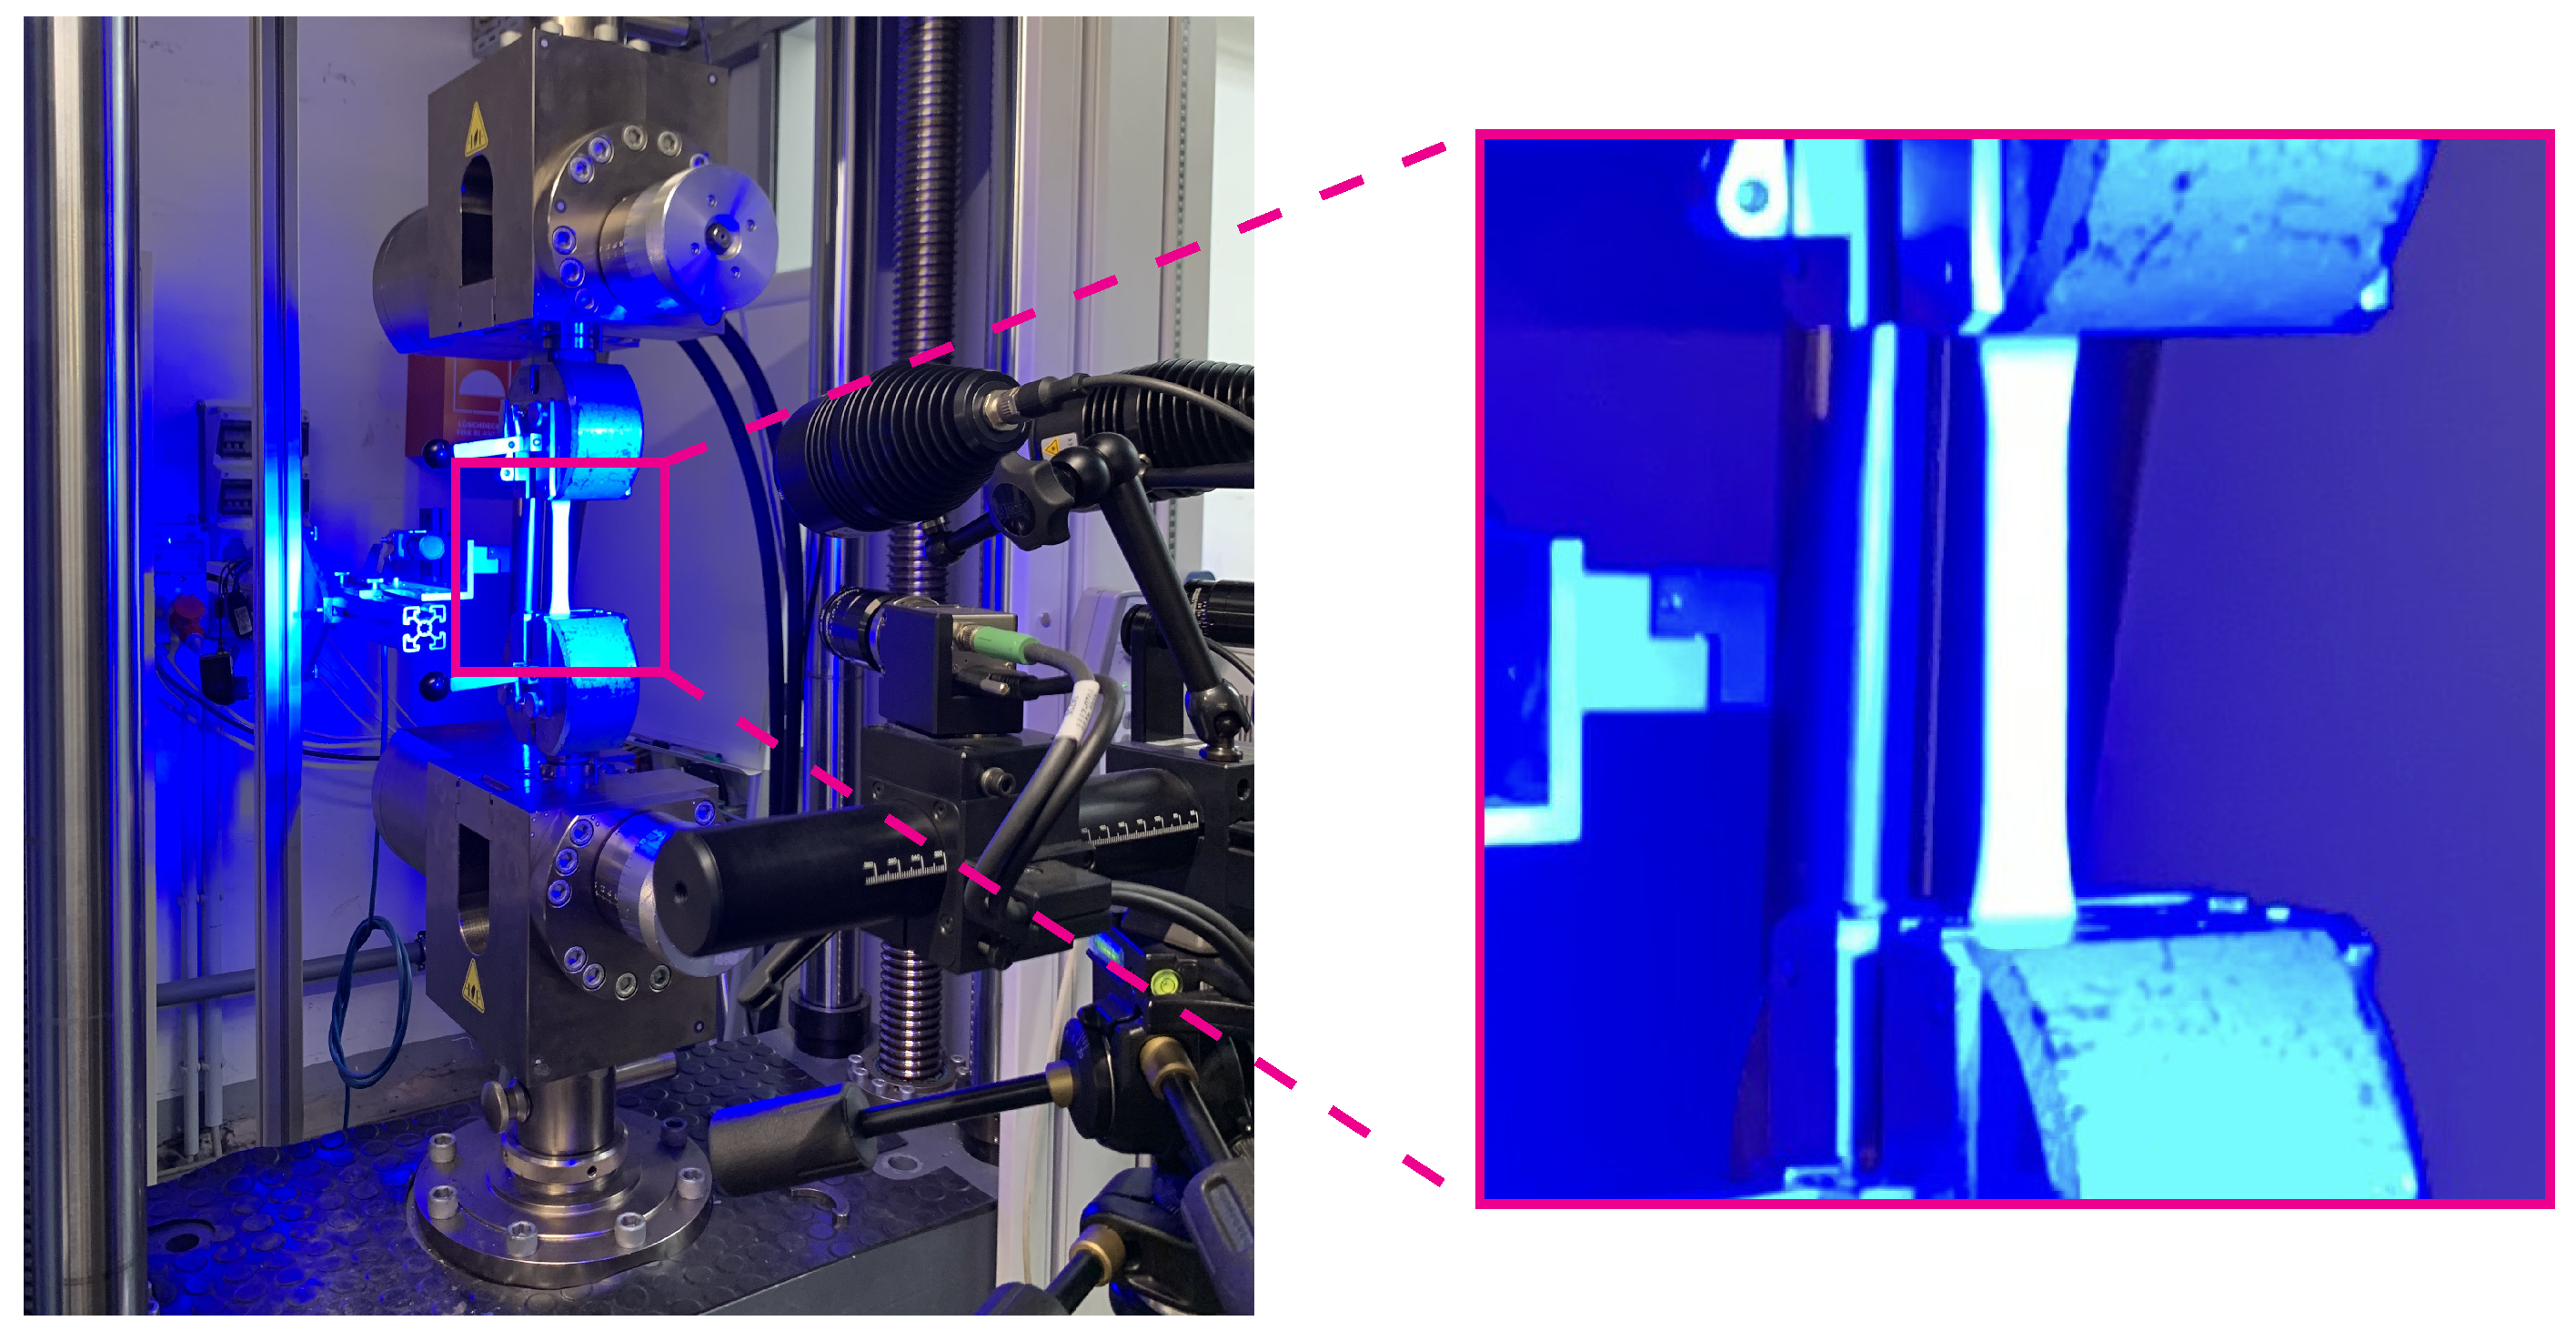
We used a hydraulic machine fitted with a 15 kN load cell for the tests on the dumbbell-shaped specimens. The machine has a cross-head speed range of 0.01 mm/s to 30 mm/s, and all tests are conducted under displacement control conditions with a constant rate of 1 mm/min. Prior to the tests, we applied a pre-load of 20 N to the specimens to take up slack from gripping the apparatus. This pre-load was applied to the specimens to remove slack and ensure proper seating in the fixtures (grips), preventing slippage, and securing an accurate start of the test. In
Figure 2, a dumbbell-shaped specimen under tensile test conditions is illustrated. It is noteworthy that, considering the effects of thickness on the results, we used a precise micrometer to confirm the dimensions of the 3D-printed test coupons.
Moreover, a universal testing machine (Inspekt duo 5 kN) is used to examine the SENB specimens. The utilized machine is a table-top machine with a high bending stiffness. All three-point bending tests were conducted under static loading conditions with a displacement rate of 1 mm/min.
Figure 3 shows an SENB under three-point bending test conditions. In three-point bending tests, the load was applied to the center of the specimens. In this study, we used an appropriate jig in three-point bending tests to keep the specimens properly. In detail, the distance between the support rollers was 80 mm in all jigs prepared. The specimens were designed and examined in compliance with the related standard [
31]. The standard specifies that the specimen’s length should be 4.4 times its width (
W). Since
W is 20 mm in our SENB specimens, the length is 88 mm in the examined specimens. According to the above-mentioned standard, the support span must be equal to four times the width (4
W = 80). Since ambient temperature has an impact on the mechanical behavior of materials, all specimens were tested according to the standards for room temperature. Particularly, the room conditions for testing the specimens were 23 ± 3 °C and 50 ± 5% temperature and relative humidity, respectively. In this study, for each notch condition (3D-printed and milled) and each printing direction (+45°/−45° and 0°/90°), five identical SENB specimens were tested to ensure repeatability and reproducibility of the results.
In the current study, no external extensometer was used for strain measurement. A linear variable displacement transducer is used to measure the displacements of the specimens. All test coupons were tested under the same conditions, and the experimental results are presented in the following section. Considering the wide applications of 3D printing, appropriate standardized techniques are required for the evaluation of 3D-printed components.
5. Numerical Simulations
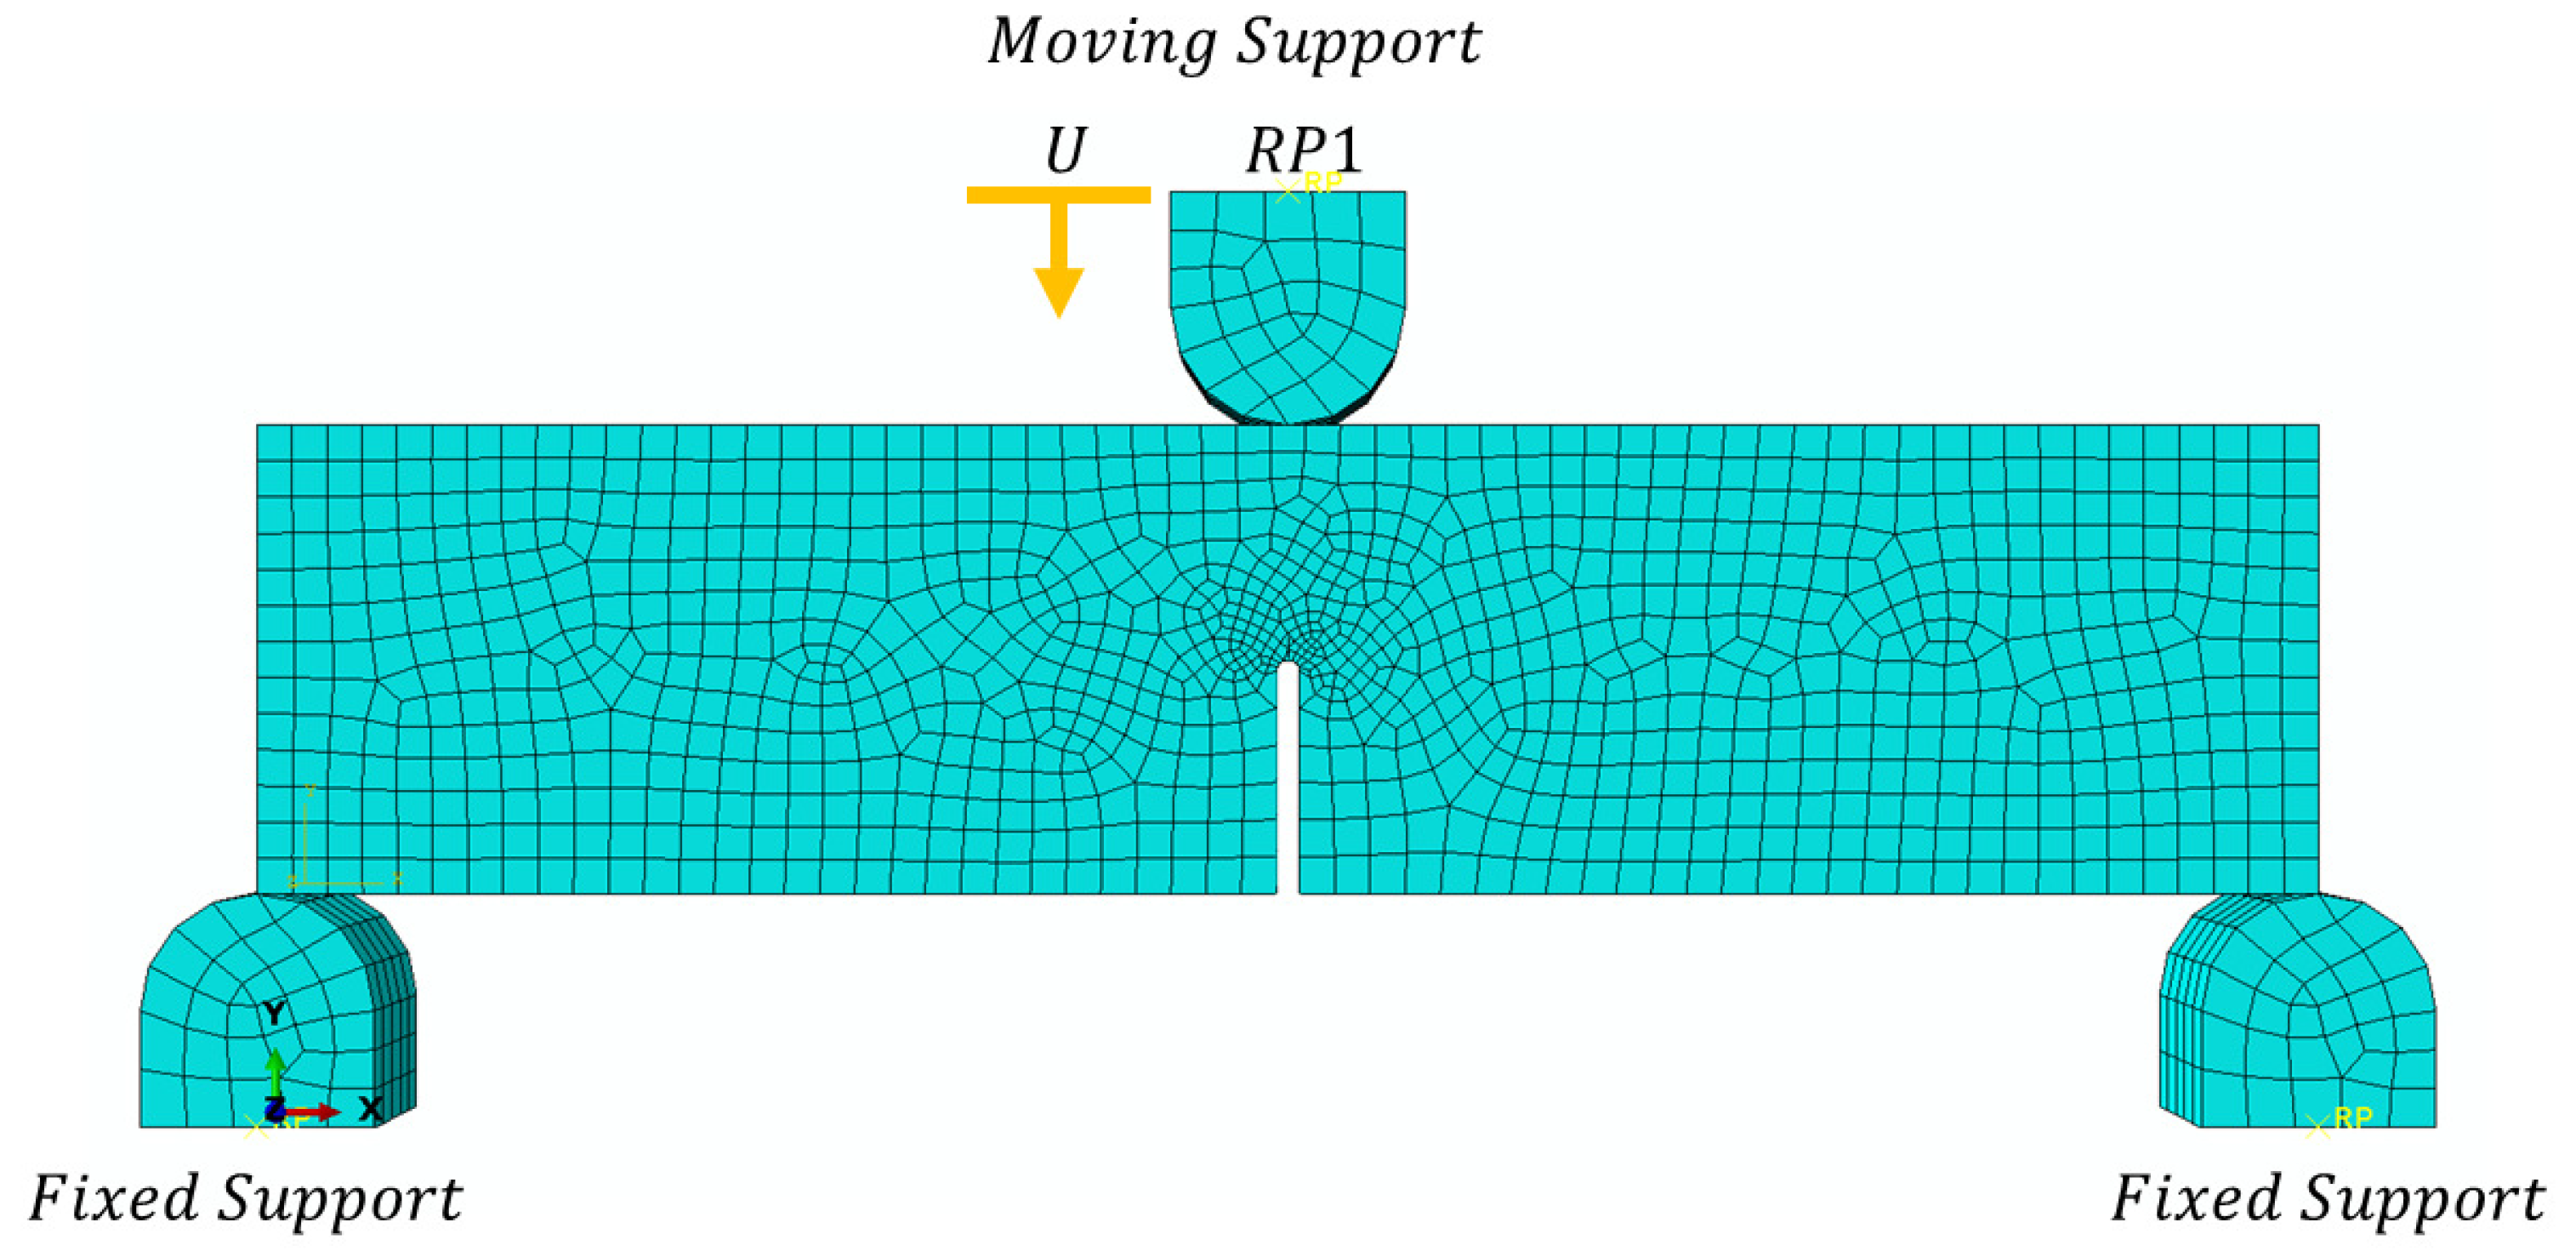
A 3D Finite Element (FE) model was developed using ABAQUS software 2022, to simulate the mechanical behavior and fracture of an SENB specimen under three-point bending. This non-linear FE model employs the Extended Finite Element Method (XFEM) to capture crack initiation and propagation in the notched specimen without requiring re-meshing. The FE model mimics the experimental bending test, as previously depicted in
Figure 3. The FE model (
Figure 4) features a beam with an edge notch at midspan, supported by two rigid supports at its ends and loaded by a central rigid support. A Reference Point (RP1) is defined on the central loading support to apply a vertical downward displacement
U (bending load) at the beam’s midspan, which is also used to capture the overall force reaction. The beam is meshed using 7154 hexahedral elements (C3D8R) with reduced integration, ensuring smooth discretisation around the notch area to accurately capture stress concentrations and crack propagation paths. A mesh sensitivity analysis was conducted by refining elements near the notch tip to an average size of 0.5 mm, ensuring convergence in stress distribution and crack initiation load (changes < 3% upon further refinement). This discretization adequately captures the localized phenomena in XFEM without excessive computational cost. The rigid supports are modeled as analytical rigid surfaces to represent the three-point bending fixture, with surface-to-surface contact interactions incorporating a friction coefficient of 0.1 and hard contact behavior. The material properties of the PETG printed beam are modeled to exhibit elasto-plastic behavior, coupled with a maximum principal stress damage initiation criterion and energy-based damage evolution under mixed-mode conditions.
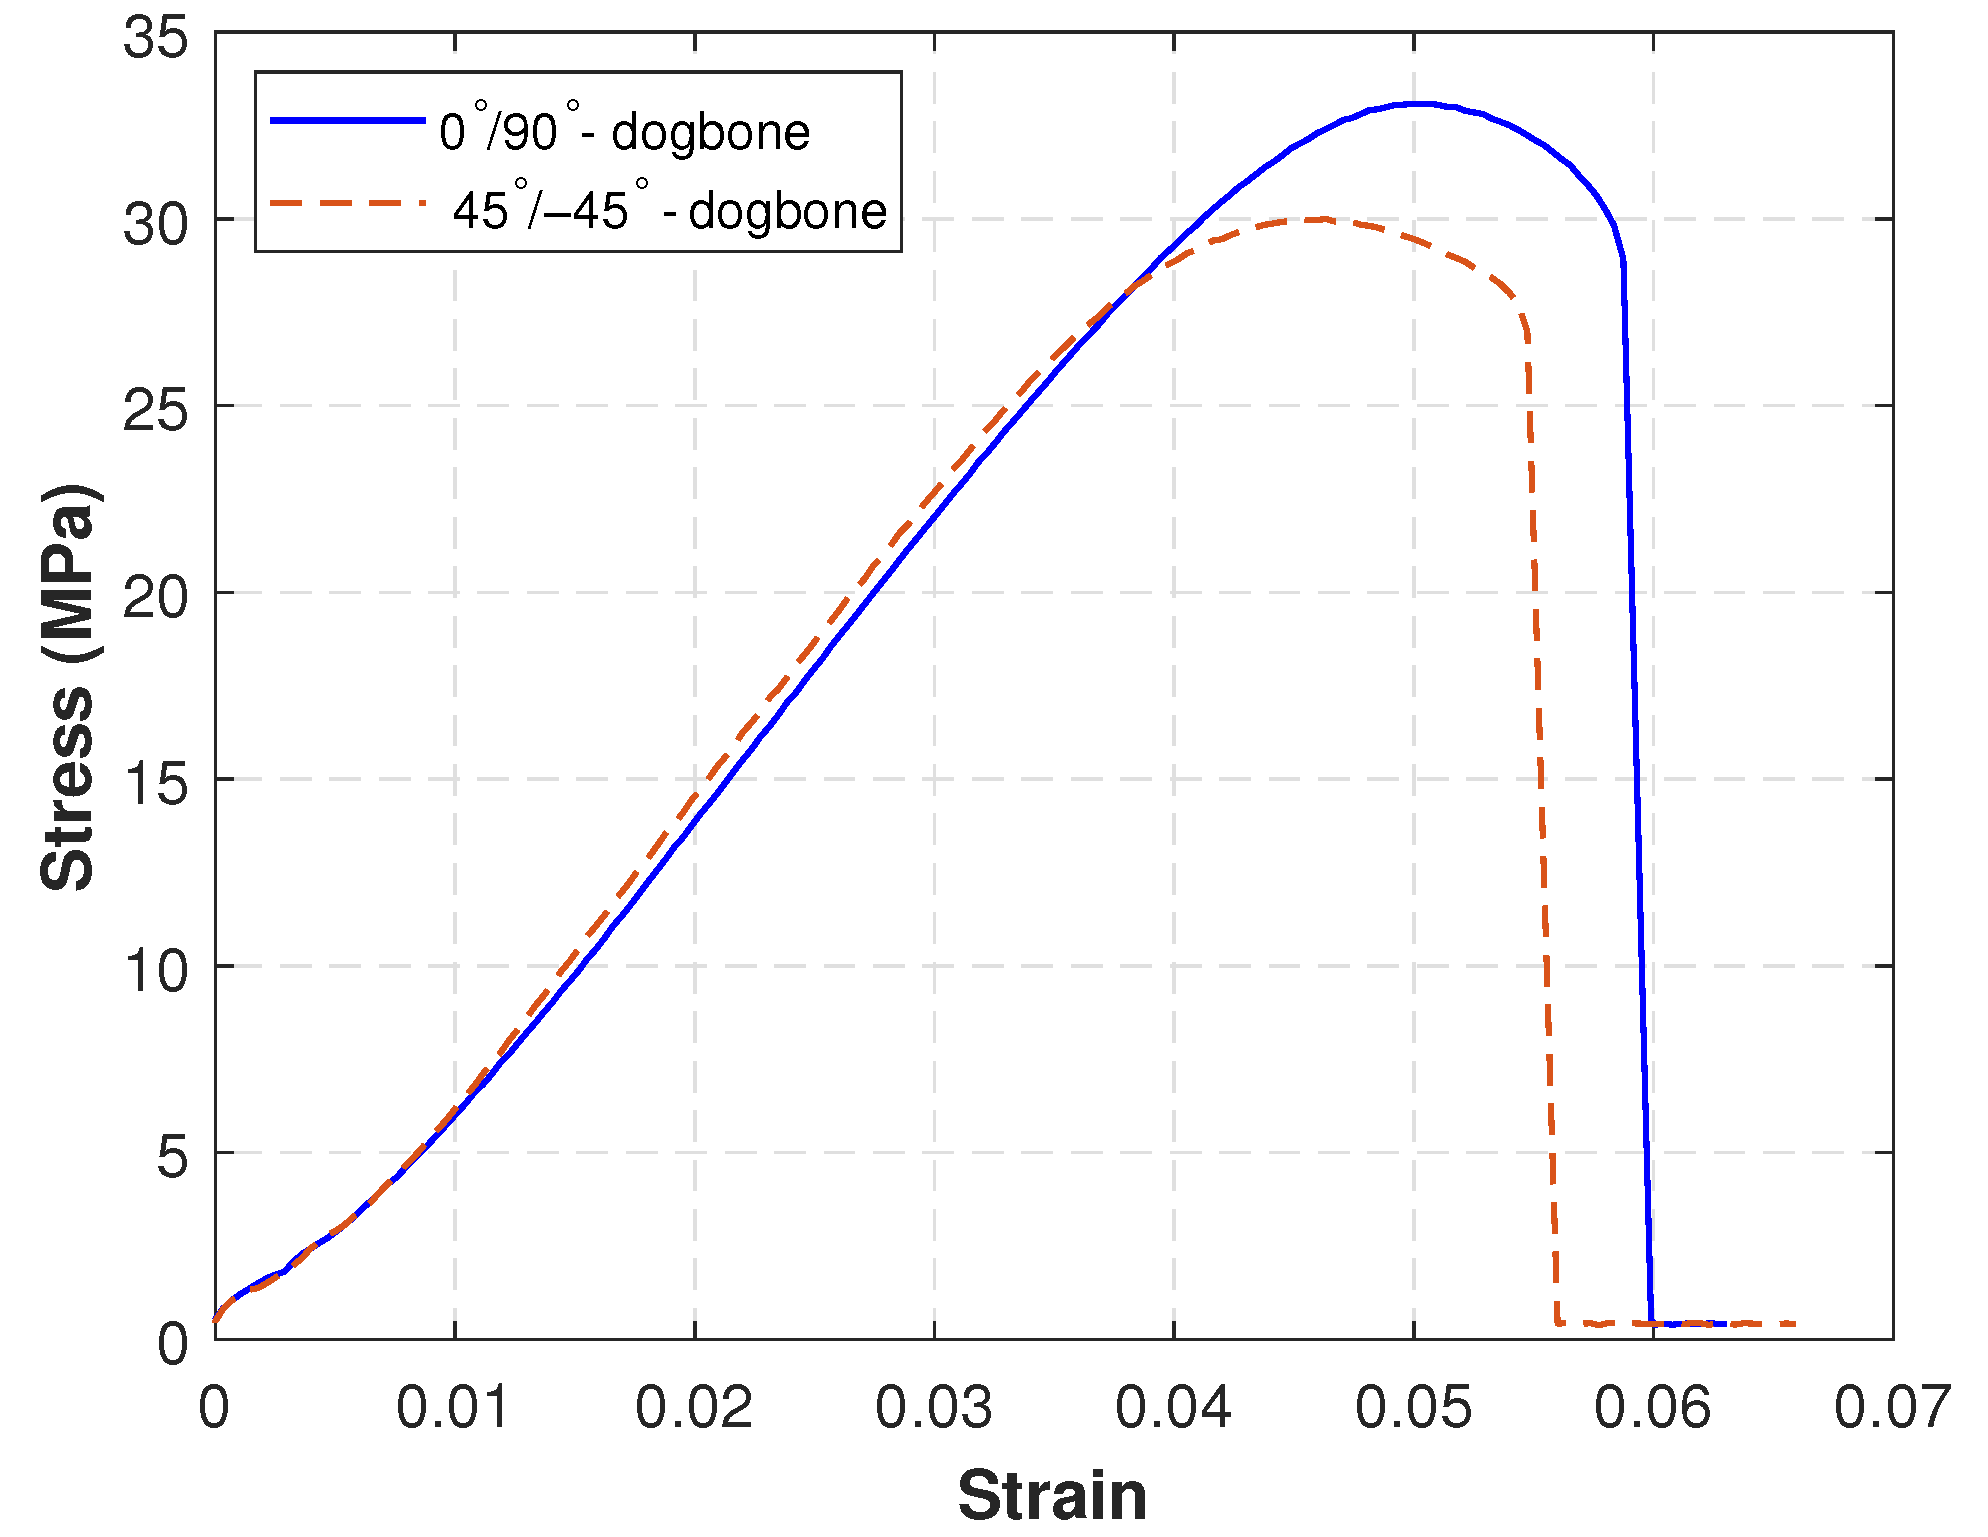
The material properties of both types of SENB specimens are derived from experimental force–displacement data obtained by a standard uniaxial tensile test. The experimental stress–strain curves for both samples, with printing directions of +45°/−45° and 0°/90°, are calculated and plotted in
Figure 5. Both curves in this figure exhibit elasto-plastic behavior with nearly identical elastic stiffness (Young’s modulus). A detailed comparison of the mechanical properties of these two types of printed materials is presented in
Table 2. While tensile-derived properties were used due to their consistency and the observed similarity in elastic moduli across orientations, we recognize that flexural modulus may differ in anisotropic FDM parts. This approximation was deemed adequate for comparative fracture analysis, though future work could incorporate flexural test data for enhanced stiffness accuracy. It is observed from this table that the mechanical strengths and properties of both specimens are very similar and can be considered almost identical. Consequently, both specimens exhibit nearly the same mechanical behavior under a standard tensile test. In this section, the material properties of the SENB printed sample with a printing direction of 0°/90° are used and incorporated into the FE model.
The FE model is executed with a vertical downward displacement of
U = 6 mm and a predefined crack at the notch tip with a length of 1 mm, as required for XFEM analysis in ABAQUS. The model is solved using 418 increments, simulating full crack propagation and rupture of the beam. The gradual bending, deformation, and von Mises stress distribution in the beam at different bending loads
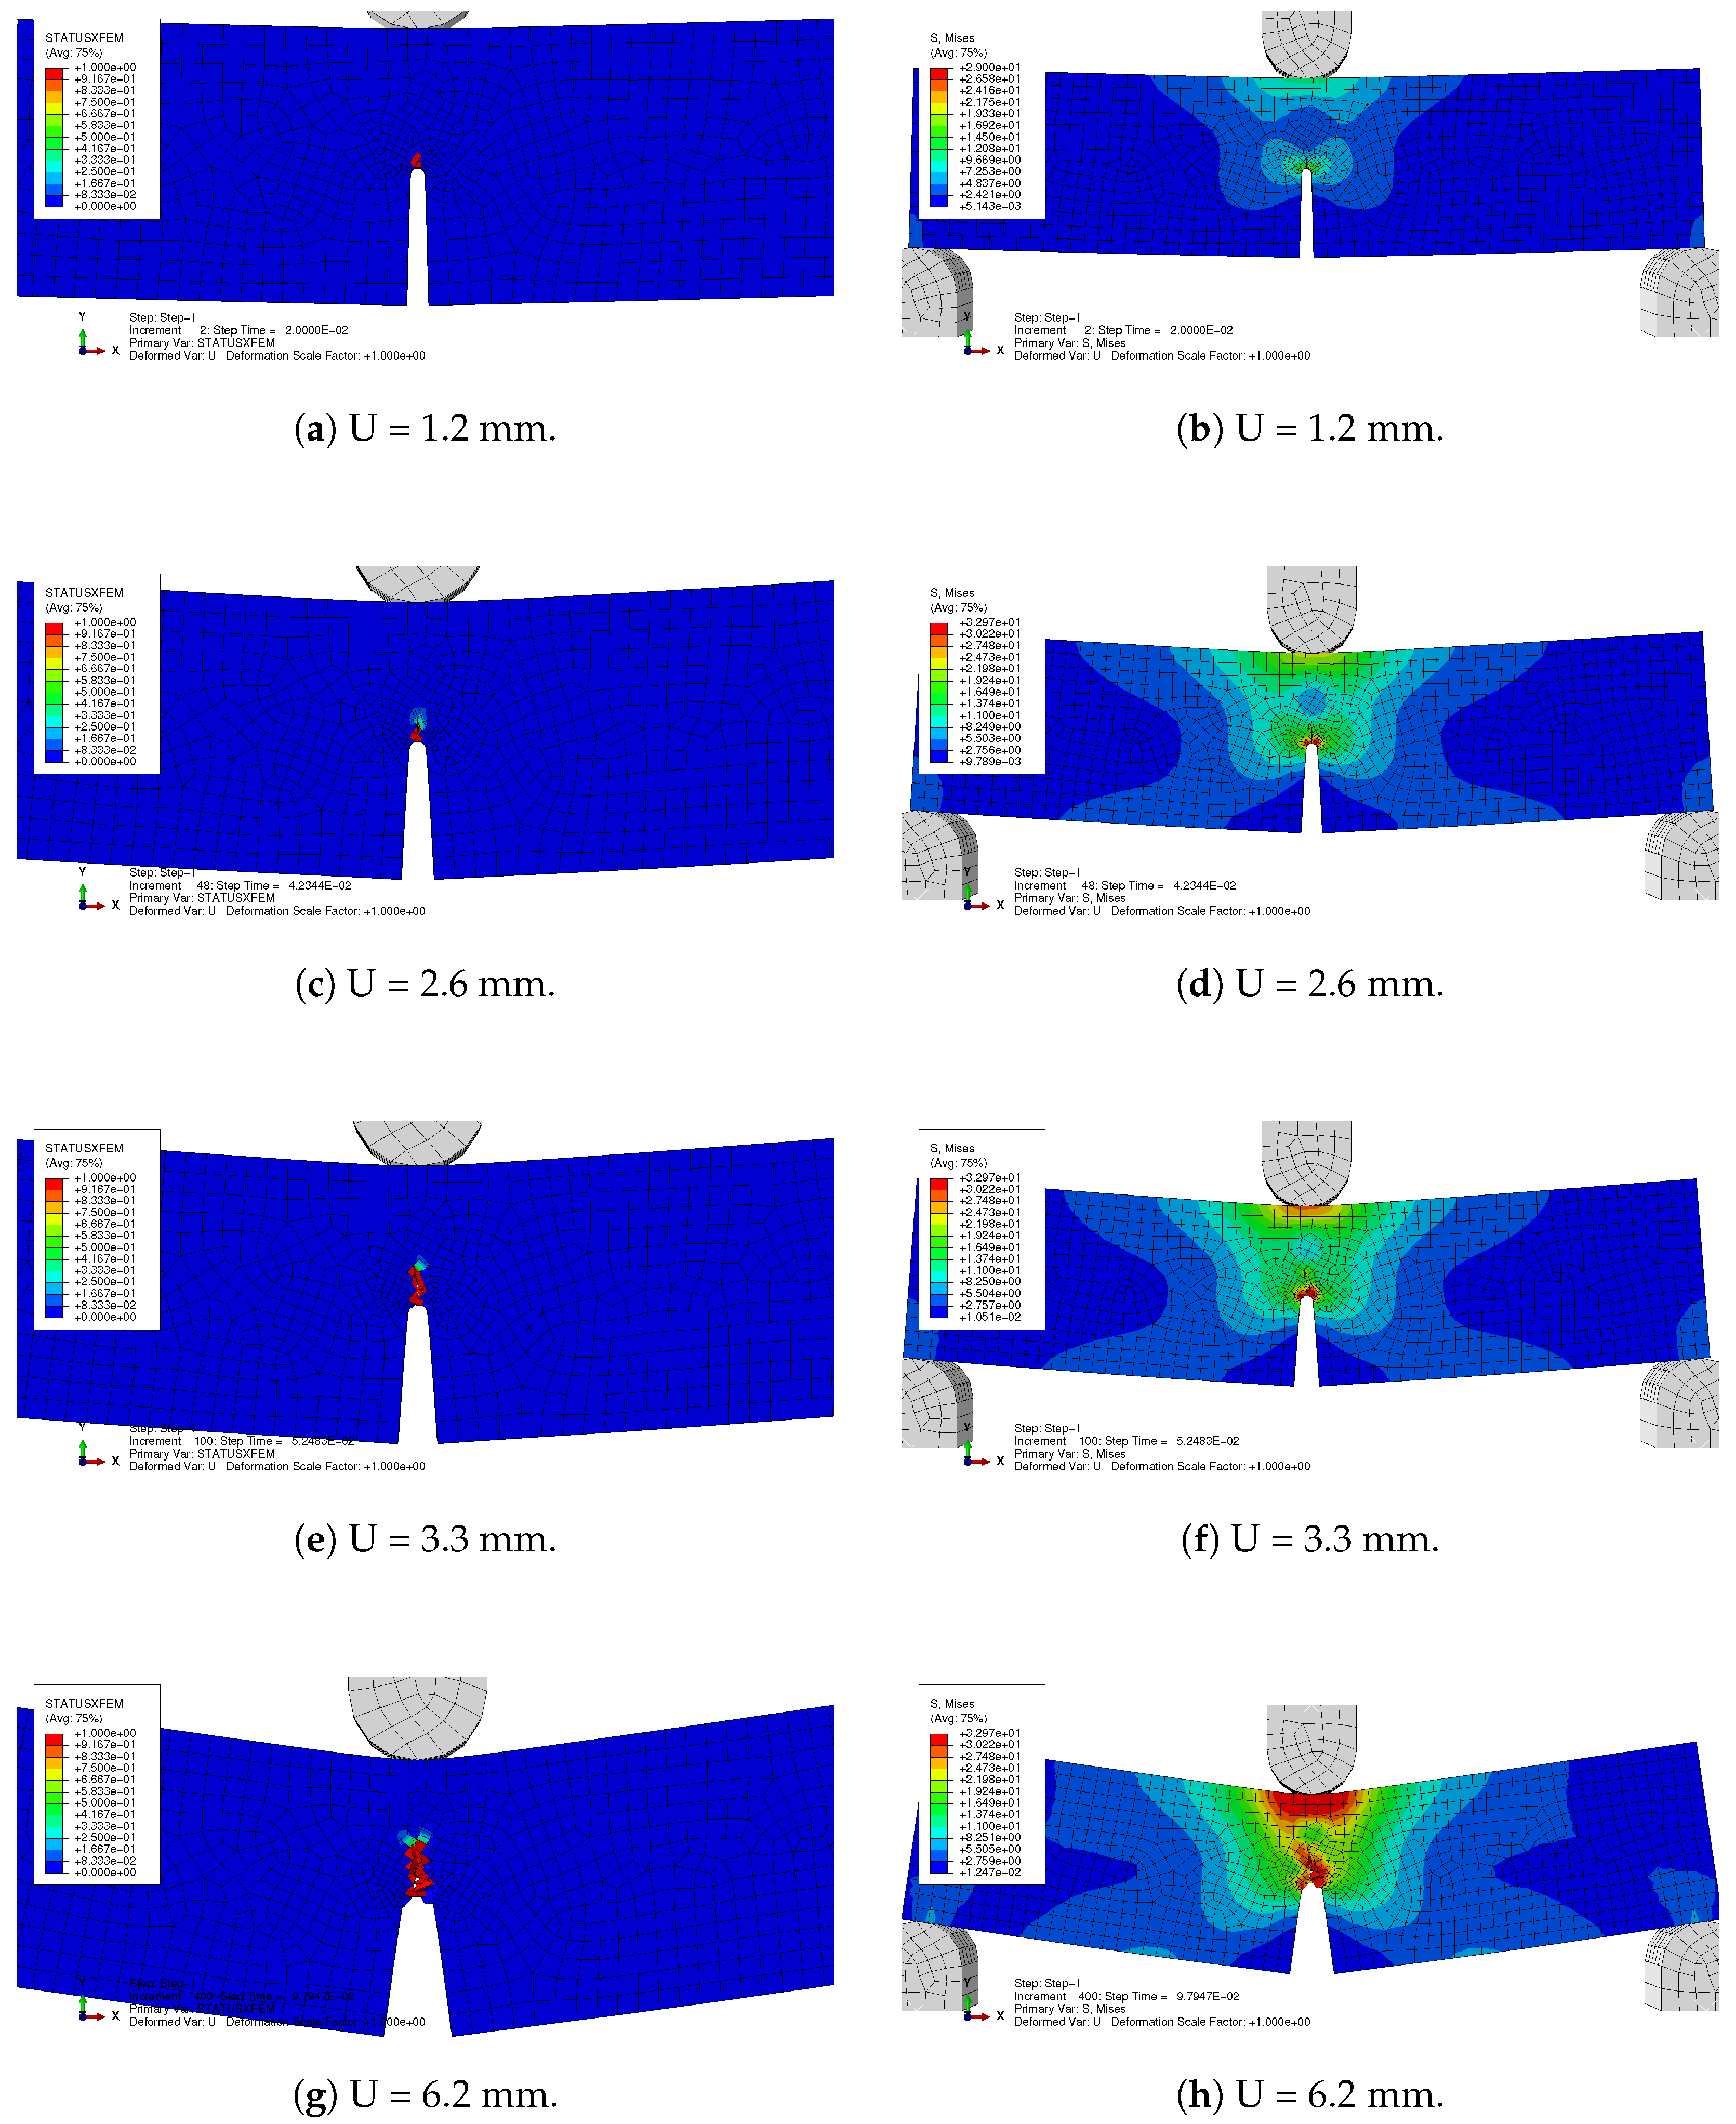
U are presented in
Figure 6. The figures (in the left column) show distributions of STATUSXFEM, a parameter that facilitates monitoring of crack initiation and propagation in XFEM, varying between zero (i.e., no damage) and one (fully propagated crack). As expected, the crack initiates from the notch tip under mode I at
U = 1.2 mm and propagates vertically towards the top midpoint of the beam as the bending load increases. Full rupture of the beam, indicated by divergence of the FE solver, occurs at
U = 6.33 mm for this model. Additionally, in
Figure 6 (right column), the corresponding von Mises stress distributions across the beam are plotted at different bending loads
U. These stress contours reveal stress concentrations initially at the notch tip at low bending loads, with the maximum stress location shifting towards the crack tip as it propagates towards the top midspan of the beam. It is also noteworthy that the maximum von Mises stress at different bending loads
U, when
1.2 mm, remains constant at approximately 33 MPa, confirming that additional bending energy as
U increases is expended on crack propagation and beam deterioration.
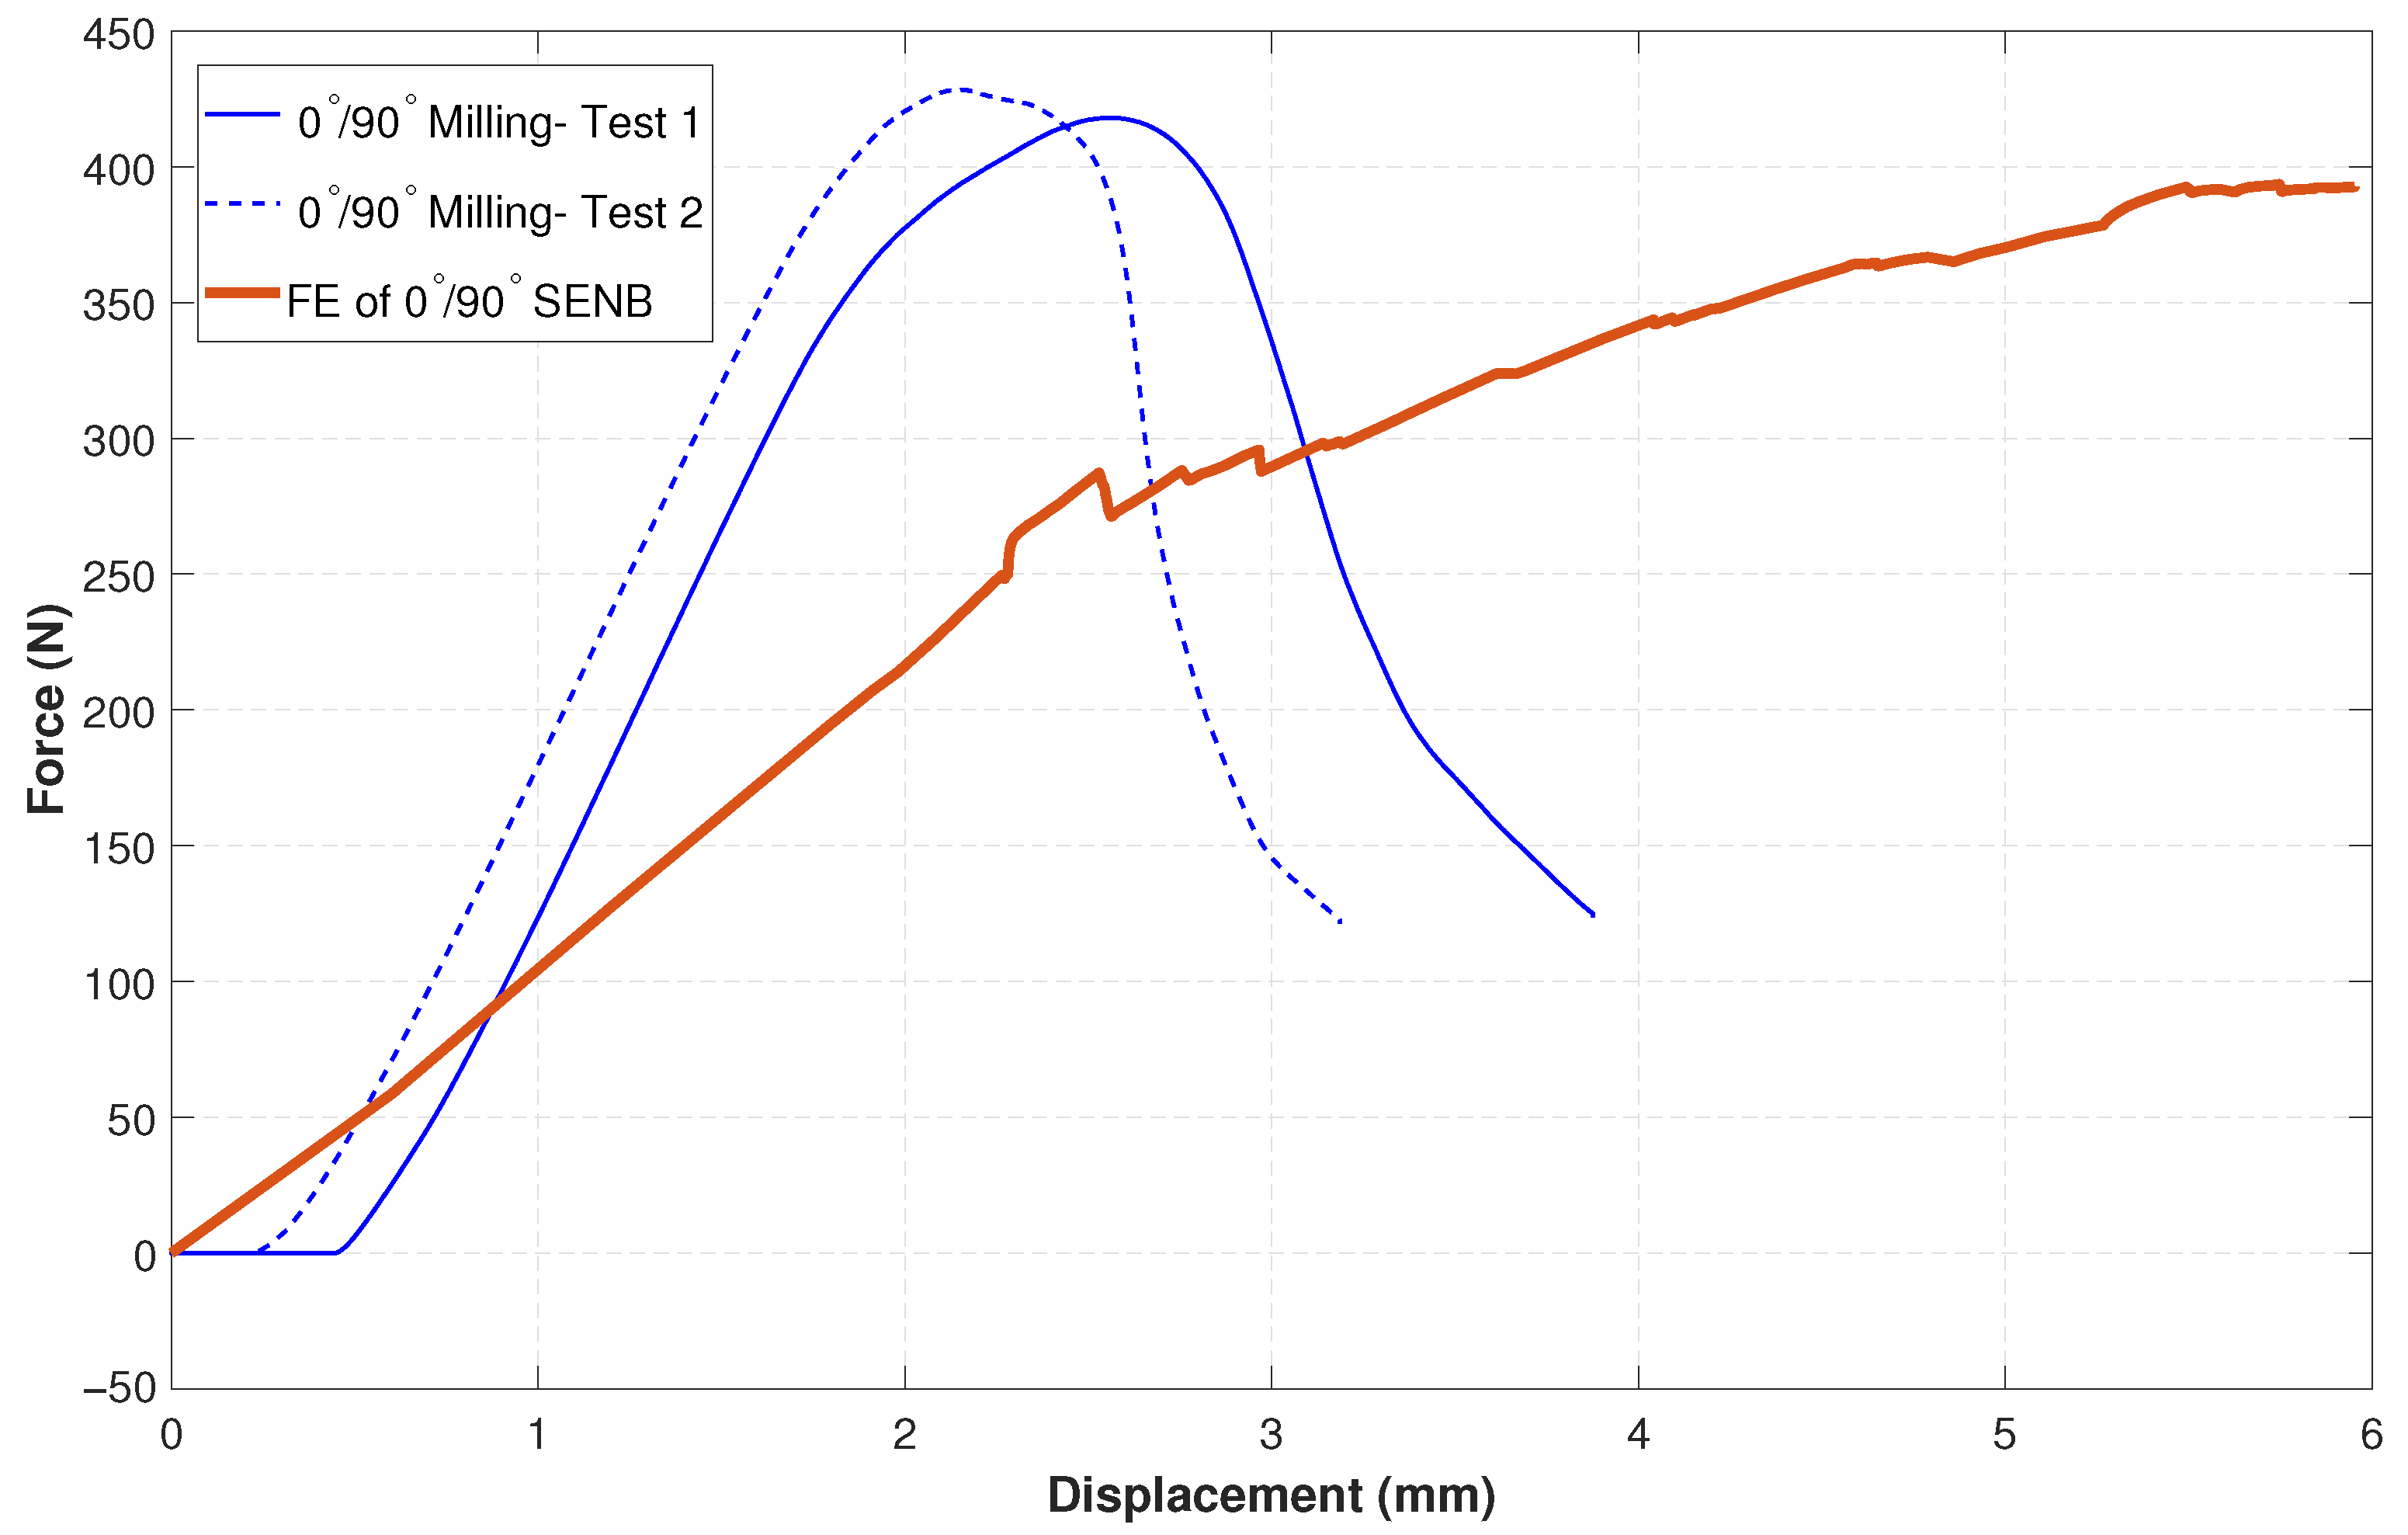
A comparison of the force–displacement curves presented in
Figure 7 provides valuable insights. The figure compares the force–displacement outputs from bending tests on two SENB samples (
3D printed with a notch created by milling) with the corresponding curve from the FE model described above. The average bending stiffness of the experimental samples is approximately 250 N/mm, whereas the FE model exhibits a softer stiffness of around 110 N/mm. However, the average maximum load measured in the two experiments is approximately 423 N, which is close to the 393 N calculated by the FE model. Notably, the maximum load in the FE model occurs at a higher displacement, reflecting its softer behavior compared to the experimental results. In summary, the FE simulation accurately reproduces the peak load observed experimentally; however, it significantly underestimates the initial bending stiffness and overestimates the bending displacement (
U) at which failure occurs. Quantitative validation of
Figure 7 shows a Root Mean Square Error (RMSE) of approximately 85 N between the experimental and FE force–displacement curves (up to peak load), reflecting the stiffness discrepancy and supporting the need for future refinements in material modeling. These discrepancies are attributed to several factors: (1) material properties derived from tensile tests may not accurately reflect flexural stiffness, particularly for anisotropic 3D-printed materials; (2) the FE model may not account for viscoelastic behavior, which is known to influence the response of PETG; and (3) the fracture initiation and evolution parameters in the XFEM setup may not be sufficiently calibrated, leading to delayed crack propagation and the absence of a post-peak load drop. The omission of viscoelasticity, a key property of PETG, likely contributes to the stiffness discrepancy and delayed crack propagation. Including viscoelastic effects is expected to increase initial stiffness and accelerate the post-peak load drop by accounting for time-dependent deformation and energy dissipation, and will be addressed in future models with creep data integration. A preliminary sensitivity analysis on damage evolution energy (±20% of default) showed <5% variation in peak load, indicating moderate parameter influence. Future work will focus on calibrating these parameters using experimental fracture data for improved reliability.
It is good to note that the observed stiffness discrepancy may be further refined in future studies by integrating anisotropic material properties or viscoelastic behavior into the FE model, which could enhance the accuracy of stiffness predictions and crack propagation dynamics. Future work can focus on parameter calibration using the digital image correlation (DIC) technique and incorporate viscoelastic-plastic behavior to achieve more accurate predictions.
6. Results and Discussion
Experimental results showed that all failures occurred within the gauge length in the dumbbell-shaped test coupons. This confirms the validity of the experiments. In
Table 3, the maximum fracture load and tensile strength of the examined dumbbell-shaped specimens are presented, which have been utilized in the numerical simulations. A two-sample test on fracture loads (3D-printed
: 599 ± 17 N vs. milled
: 417 ± 19 N) yielded a
p-value < 0.01, confirming that the differences between milled and 3D-printed notches are statistically significant.
Fracture toughness is an essential material property that measures a material’s capability to resist crack initiation and propagation under externally applied load. It is necessary for assessing the robustness and consistency of materials utilized in crucial applications. Fracture toughness is measured using parameters like the Stress Intensity Factor (SIF) for elastic conditions [
32] and Crack-Mouth Opening Displacement (CMOD) or J-integral for elastic–plastic conditions [
33]. Each parameter provides a unique viewpoint on fracture behavior. Particularly, the SIF characterizes the stress distribution around a crack tip in linear elastic materials. According to [
34,
35], the SIF for SENB specimen is as follows:
In [
36], the SIF for the SENB specimen is presented as follows:
where
and
Substituting Equations (
3) and (
4) into Equation (
2) gives
where
S and
P support span and applied load, respectively. Moreover,
B is the thickness and
W shows the depth. In addition,
a,
M, and
indicate average crack length, the applied moment, and the bending stress, respectively. From Equations (
1) and (
5), it can be noted that
While Tada et al. [
36] are not specified, Srawley [
34] considered thickness in determining the SIF. The SIF computed using Srawley [
34] is directly proportional to SIF computed using Tada et al. [
36], wherein thickness is a constant of proportionality.
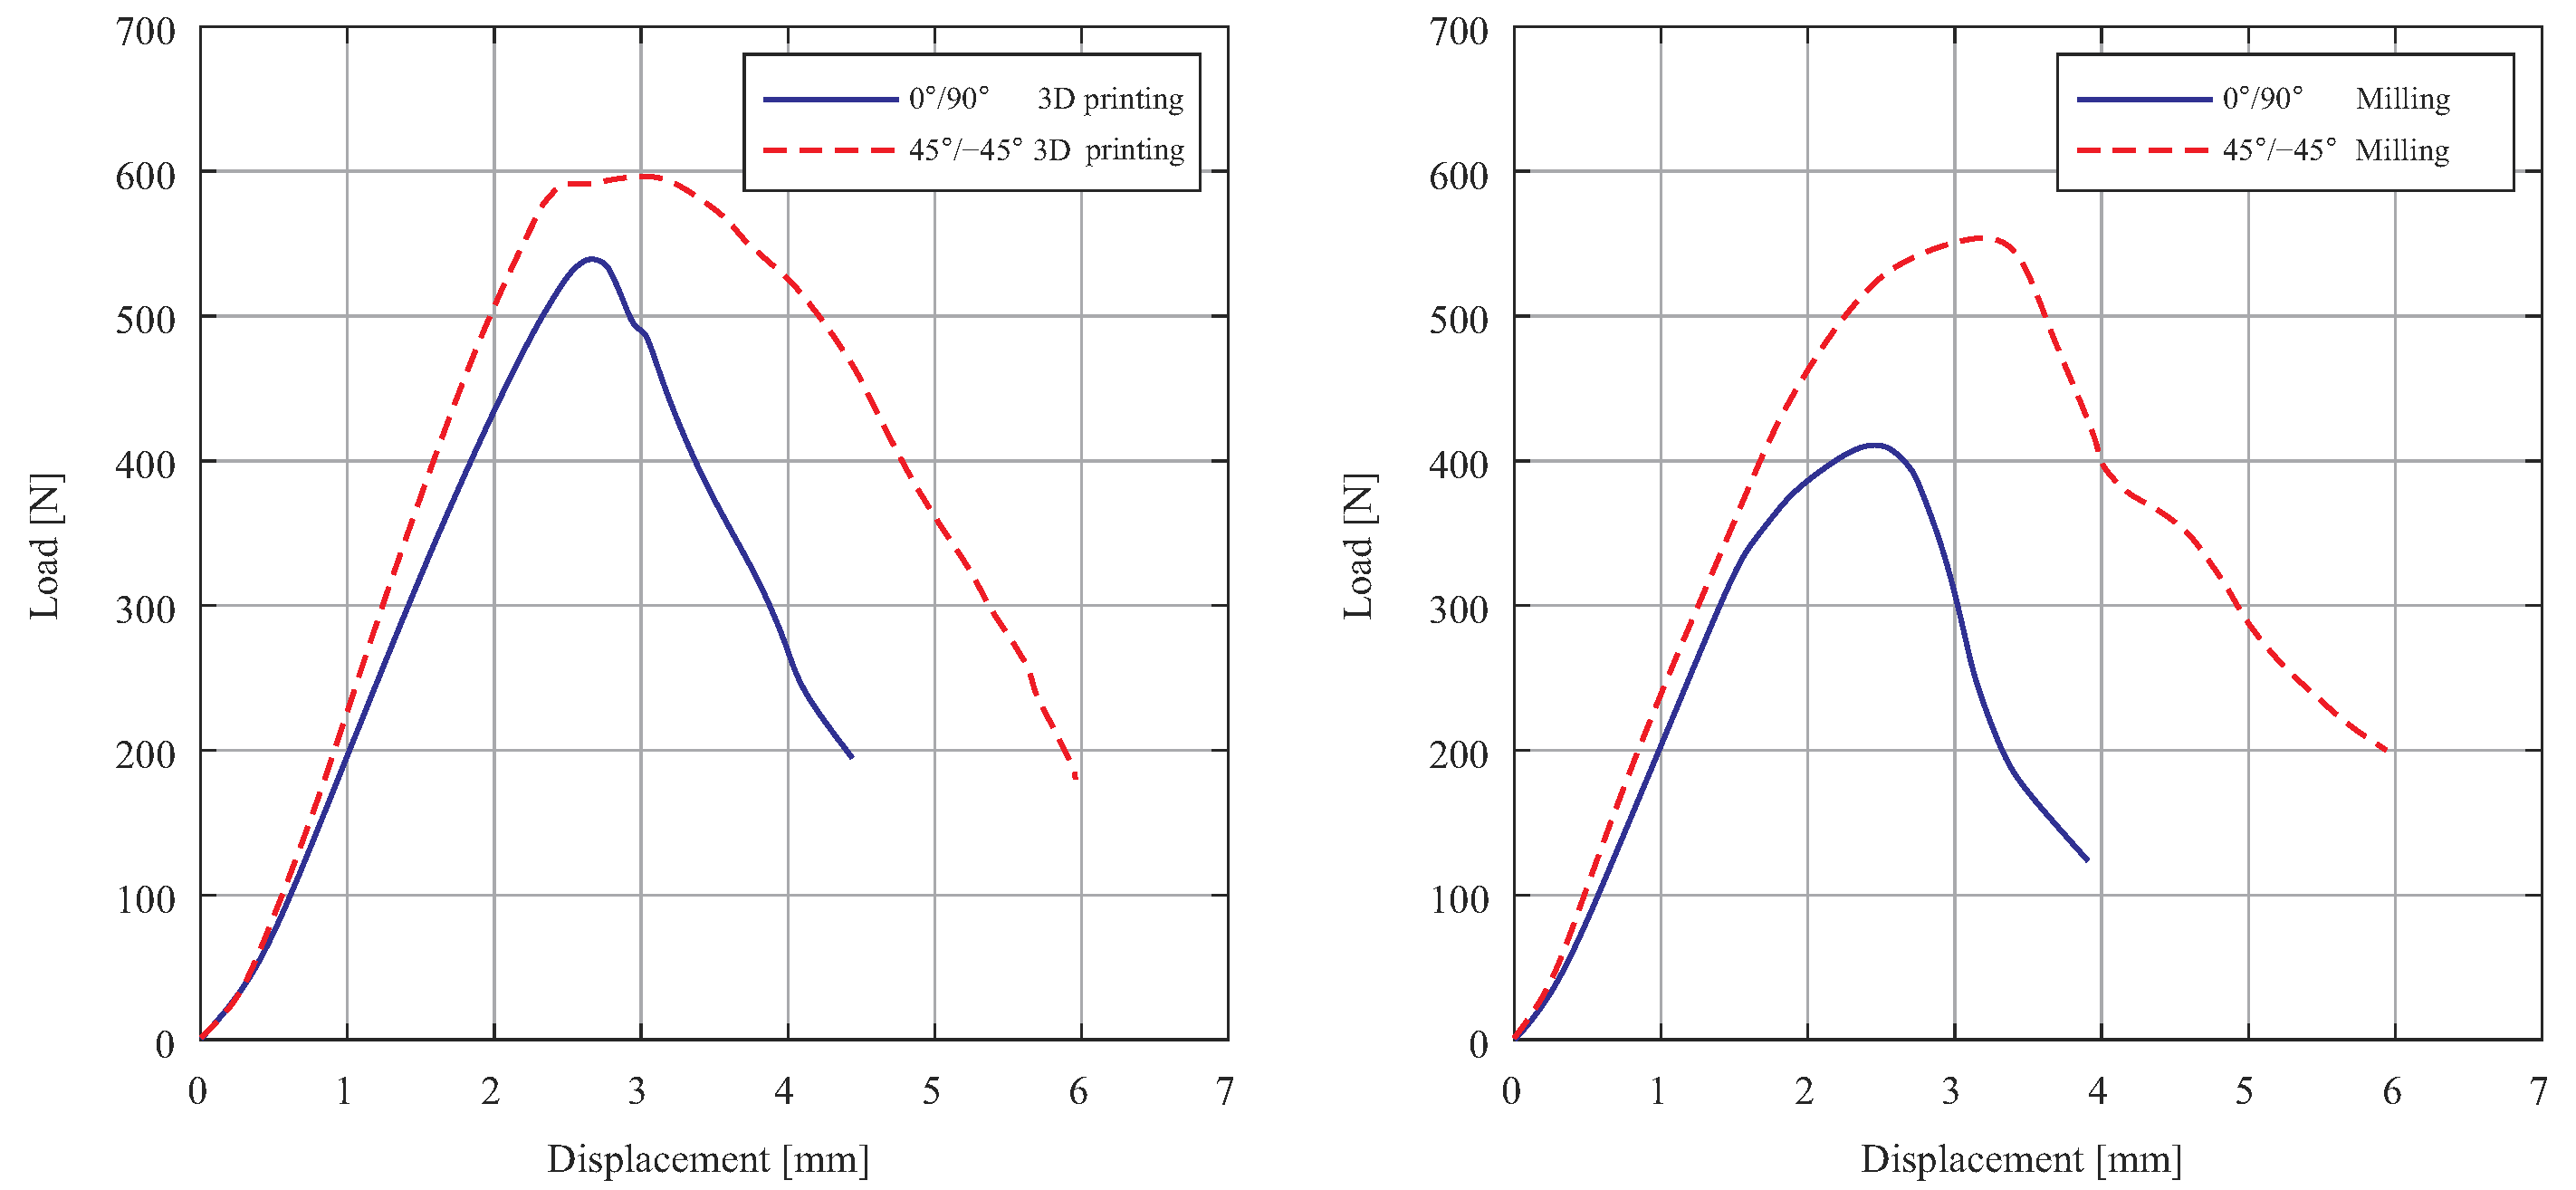
The obtained results of three-point bending tests indicated that the slope of the load–displacement curve is approximately linear at the beginning of the test. After reaching the critical load, there is a decrease in the load and the crack is propagated. Then, in the load–displacement curve, the slope was smaller until the specimen collapsed.
Figure 8 shows the load–displacement relationships of examined SENB specimens manufactured by different methods. From this figure, one can observe that printing direction and fabrication methods have led to different mechanical behaviors in the examined parts. Comparison of force–displacement curves confirmed that the highest fracture load is obtained from the test of specimens with 3D-printed notches. Particularly, the highest and the lowest fracture loads are 599.1 N and 417.2 N for 3D-printed and milled parts, respectively. The mean fracture loads (±standard deviation, n = 5) are as follows: 3D-printed +45°/−45°: 545 ± 24 N; 3D-printed 0°/90°: 599 ± 17 N; milled +45°/−45°: 440 ± 22 N; milled 0°/90°: 417 ± 19 N. The small standard deviations confirm good repeatability and the sufficiency of the sample size for capturing the manufacturing effects reliably. It is noteworthy that the fracture areas of the specimens are investigated, which confirmed different orientations of crack propagation based on the manufacturing process (3D printing and milling) and printing direction. Considering the obtained results, all dumbbell-shaped and SENB specimens showed brittle failure without any plastic deformation.
The results of the examined specimens confirmed that the fracture behavior of the specimens notched by different techniques (3D printing and milling) is dependent on the manufacturing process. Moreover, the influence of the angle between the raster lines and the notch in the specimens has an effect on the mechanical strength of the parts. The results indicate that the specimens with a 3D-printed notch have higher fracture load; therefore, this issue must be considered when a structural component with a higher mechanical strength is required. This indicates that optimizing the manufacturing parameters could enhance the performance of the final products. Further research into the relationship between notch geometry and loading conditions may provide deeper insights into improving material resilience.
Although in this study the specimens were loaded under mode I, experiments show that the fracture route does not follow the same path as in isotropic material because of the inclined rasters present in the
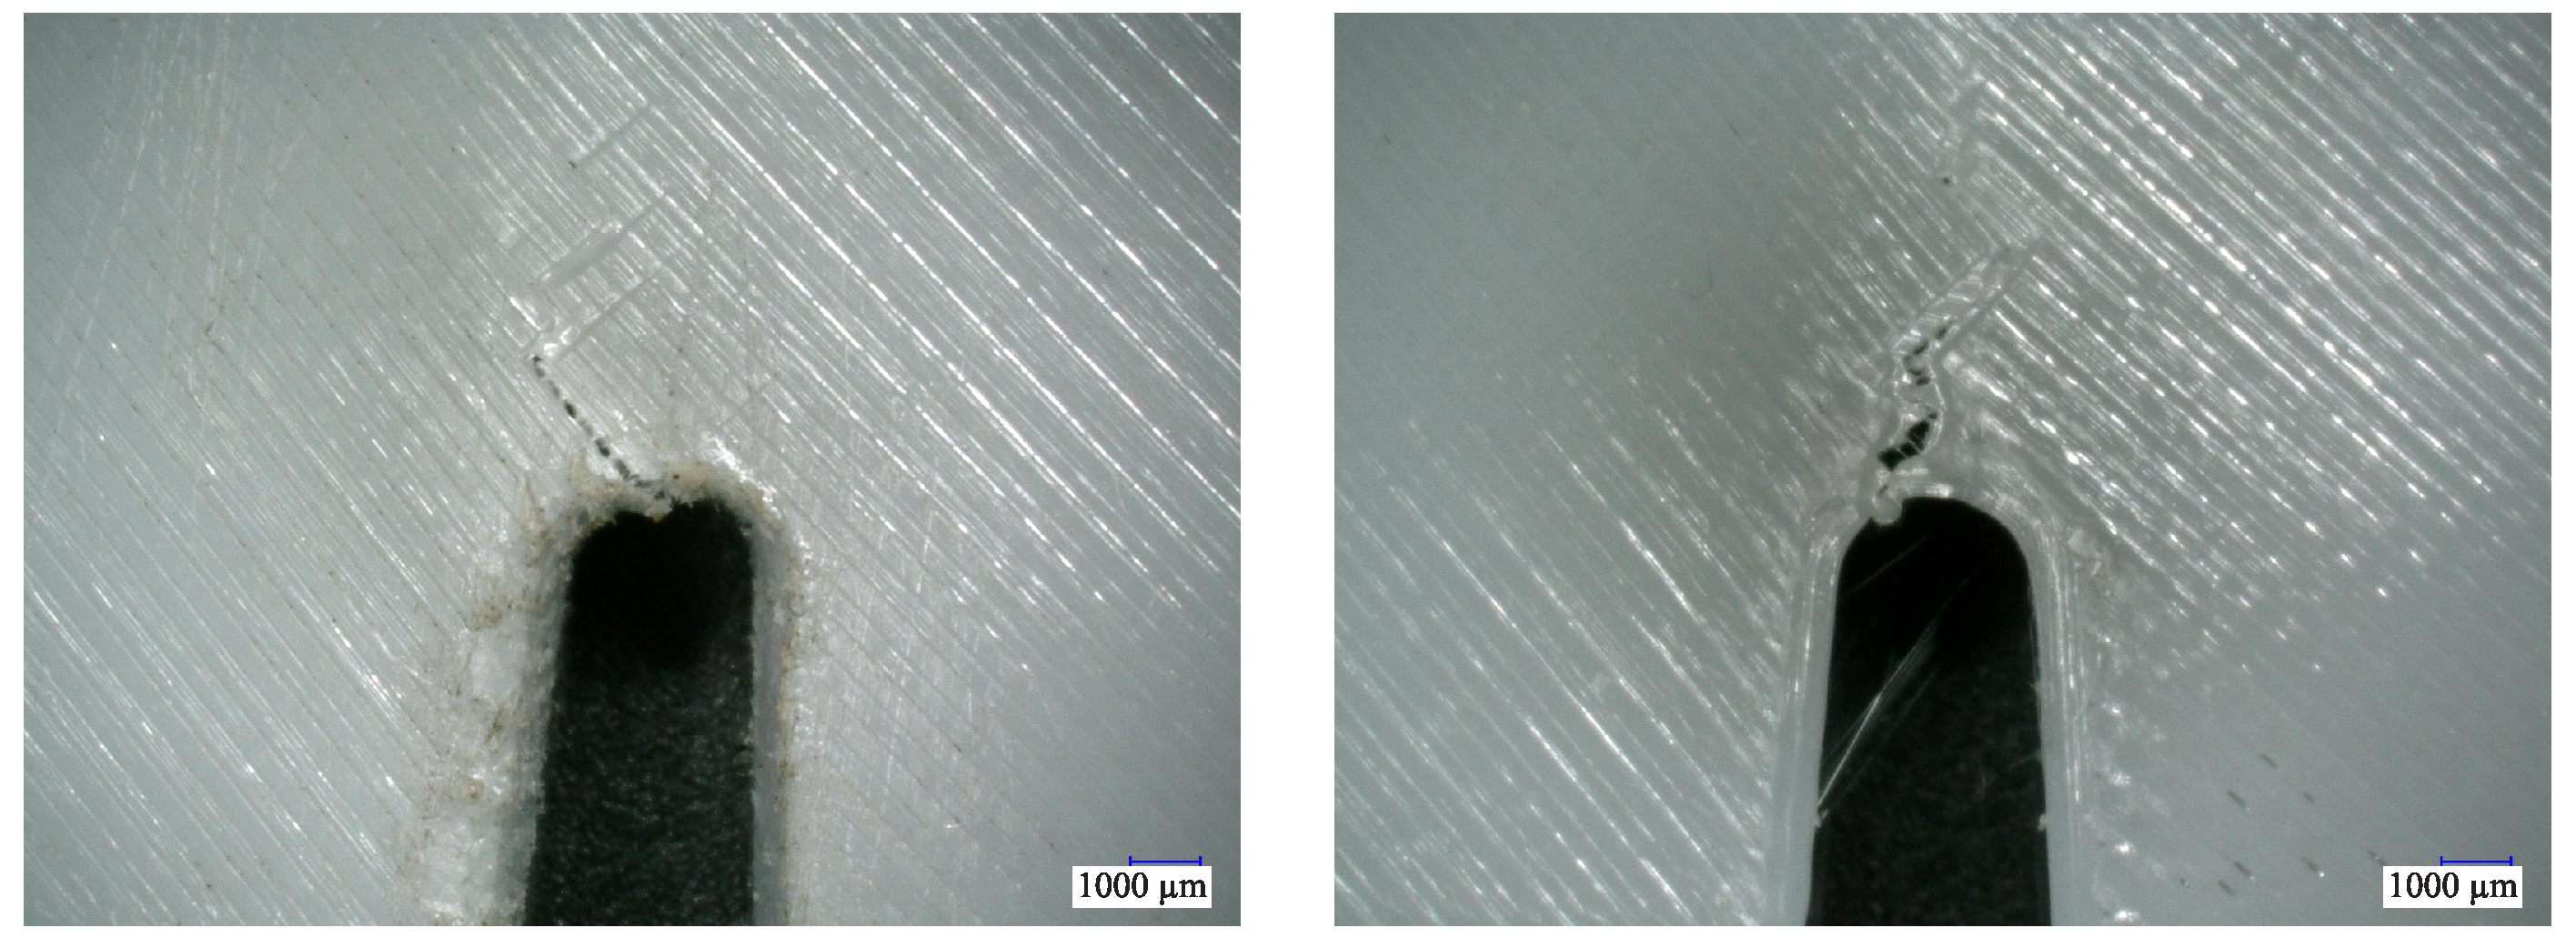
specimens. In this instance, the crack wants to spread along the notch bisector line but is compelled to follow the 45° raster because of the local mixed mode loading condition in front of the crack tip. This constraint can lead to complex stress distributions that may influence the crack’s propagation path. Understanding these dynamics is crucial for predicting failure in materials subjected to similar loading conditions. The experimental tests confirm that the fracture paths started from the notch root. Here, we used a free-angle observation system (VHX-S90F) to show fractured specimens after tests.
Figure 9 shows fracture paths in +45°/−45° specimens with milled and 3D-printed notches. The crack initiates along the notch and then kink at 45° following the raster angle. A higher fracture process zone is visible in the specimen with a 3D-printed notch, which could explain the higher value of the fracture load for this case.
Future research should focus on optimizing the design and material properties to further enhance the performance of 3D-printed components under various loading conditions.
7. Conclusions
Effects of the manufacturing process on the fracture behavior of 3D-printed parts have been investigated. To this end, notches in SENB specimens have been made by 3D printing and milling. A series of three-point bending tests under static loading conditions showed that the highest and the lowest fracture loads are 599.1 N and 417.2 N for 3D-printed and milled parts, respectively. The milled notches reduced the fracture load by around 32% compared to 3D-printed notches. The results demonstrate the effectiveness of fabrication by 3D printing in enhancing the structural integrity of materials. This reduction in fracture load suggests that 3D-printed notches would be a more reliable option for applications requiring greater durability and performance. The experimental findings proved that the cracks are propagated in different orientations based on the notch manufacturing process (3D printing and milling). On the numerical side, a non-linear FE model was used to capture crack initiation and propagation in the notched specimen. The FE models estimated a maximum load of 393 N, and it is not far from the average maximum load obtained by the experiments, which is roughly 423 N. In both specimens with 3D-printed and milled notches, brittle fracture occurred by fast crack growth with no plastic deformation of the material. This behavior highlights the limitations of the materials used in these specimens, emphasizing the need for further research into enhancing their toughness. Understanding the mechanisms behind such fractures can lead to improvements in manufacturing techniques and material selection for critical applications. The presented results can be used for innovative design, further numerical analysis, and the fabrication of 3D-printed parts with higher structural integrity. In order to further improve the performance of 3D-printed components under varied loading situations, future research can concentrate on the fracture toughness quantification, multi-material PETG studies, and design optimization.
