Abstract
Wire Arc Additive Manufacturing (WAAM) has been recognized as an efficient and cost-effective metal additive manufacturing technique due to its high deposition rate and scalability for large components. However, the quality and repeatability of WAAM parts are highly sensitive to process parameters such as arc voltage, current, wire feed rate, and torch travel speed, requiring advanced monitoring and adaptive control strategies. In this study, a vision-based monitoring system integrated with a reinforcement learning framework was developed to enable intelligent in situ control of WAAM. A custom optical assembly employing mirrors and a bandpass filter allowed simultaneous top and side views of the melt pool, enabling real-time measurement of layer height and width. These geometric features provide feedback to a tabular Q-learning algorithm, which adaptively adjusts voltage and wire feed rate through direct hardware-level control of stepper motors. Experimental validation across multiple builds with varying initial conditions demonstrated that the RL controller stabilized layer geometry, autonomously recovered from process disturbances, and maintained bounded oscillations around target values. While systematic offsets between digital measurements and physical dimensions highlight calibration challenges inherent to vision-based systems, the controller consistently prevented uncontrolled drift and corrected large deviations in deposition quality. The computational efficiency of tabular Q-learning enabled real-time operation on standard hardware without specialized equipment, demonstrating an accessible approach to intelligent process control. These results establish the feasibility of reinforcement learning as a robust, data-efficient control technique for WAAM, capable of real-time adaptation with minimal prior process knowledge. With improved calibration methods and expanded multi-physics sensing, this framework can advance toward precise geometric accuracy and support broader adoption of machine learning-based process monitoring and control in metal additive manufacturing.
1. Introduction
As a subclass of Directed Energy Deposition (DED) process, Wire Arc Additive Manufacturing (WAAM) has proven to be an apt alternative for manufacturing medium- and large-scale metal parts [1,2,3]. WAAM utilizes an electrical arc as the heat source to melt and fuse feed wire and deposits layer-by-layer to create a three-dimensional (3D) component [4]. Compared to other types of AM, the major advantages of WAAM are high deposition rates, fast production, and high material utilization [5].
Recent studies have further demonstrated the versatility of wire-arc directed energy deposition for various material systems and geometric configurations [6,7], highlighting the need for robust process control strategies to ensure consistent quality across diverse applications.
It is vital to develop and integrate reliable monitoring systems capable of identifying defects during the WAAM process to ensure the manufacturing quality and integrity of WAAM parts, improve repeatability, and satisfy industrial requirements. Recently, a multitude of studies on monitoring and control for the WAAM process have been conducted. Xia et al. [8] Applied a deep learning method in visual monitoring to diagnose different anomalies during the WAAM process. The melt pool images of different artificial defects were collected for training and validation. They showed that Convolutional Neural Network (CNN) models can be used in process monitoring; however, they require a considerable amount of image data and data augmentation to train the models.
Chabot et al. [9] used a thermal camera to monitor temperature profiles and history during the WAAM process. Zhan et al. applied a welding camera to monitor wire deflection [10]. Jun et al. [11] developed a multi-channel visual sensing system to detect weld pool dimensions. They used a thermal camera along with an optical assembly, which detects the top and side view of the weld pool. Research in WAAM process control does not merely rely on visual systems; sensor-based process controllers have also been developed by researchers, for instance, Aljaz et al. [12] implemented a monitoring ecosystem for layer height control by controlling welding current and voltage via Hall Effect sensors.
Rahman et al. [13] developed a continuous, multi-layer, in situ monitoring technique based on an acoustic emission method. They utilized K-means clustering machine learning algorithms for data analysis and classification. Their findings affirm the effectiveness of acoustic signals in monitoring processes during the continuous deposition and indicate that acoustic signals can potentially identify several process states across all layers.
Recent advances in machine learning have expanded beyond WAAM-specific applications to broader manufacturing contexts. Information exchange frameworks and knowledge graphs have been developed for additive manufacturing digital threads [14,15] while reinforcement learning approaches have demonstrated effectiveness in complex manufacturing tasks, including multi-agent coordination and optimization [16,17]. These developments highlight the growing potential of data-driven approaches across manufacturing domains.
Yeon et al. [18] theoretically implemented a sensor-based in situ process control framework. The physical setup employs a profilometer to measure geometrical features such as bead width and height, while a thermal camera collects cooling-time temperature. They proposed a Q-Learning algorithm as an off-policy reinforcement learning technique to iteratively learn the impacts of various process parameters.
While Yeon et al. [18] proposed a theoretical Q-learning framework for WAAM control, the present work advances beyond simulation to demonstrate physical hardware integration and real-time closed-loop control. Key distinctions of this study include a direct hardware-level actuation through stepper motor control of voltage and wire feed rate, enabling true closed-loop operation rather than theoretical parameter selection, a real-time vision-based measurement and control at the layer deposition timescale, and an experimental validation of disturbance recovery and adaptation across multiple build conditions. This work, therefore, represents a complete implementation of reinforcement learning control in an operational WAAM system.
In this study, a vision-based monitoring system integrated with a reinforcement learning framework was developed to enable in situ control of the WAAM process. The vision system comprises a high-speed camera in combination with an optical assembly incorporating three mirrors and composite filters designed to suppress spatter and extraneous light from the weld pool. This setup enables accurate extraction of key dimensional features, including weld pool width and height. For process control, a Q-Learning algorithm is employed, which efficiently adapts process parameters within the initial few layers. Due to its data-efficient nature, the algorithm requires minimal training data and continuously learns during the print.
2. Materials and Methods
Simple multi-layer walls, 240 mm in height, were manufactured using stainless steel solid wire as the feedstock material, and 3.2 mm thick rectangular plates made of mild steel were used as substrates. Figure 1 depicts a schematic of the WAAM process of multi-layer walls.
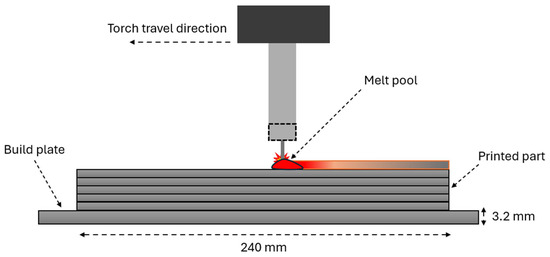
Figure 1.
The WAAM process of multi-layer walls.
The smart WAAM ecosystem developed in this study is composed of three main components: an in-house constructed WAAM machine, an optical assembly, and a controller module. These principal building blocks of the smart ecosystem are explained in detail in the following sections.
2.1. WAAM Machine
A simple yet versatile WAAM machine was constructed in-house from baseline components to maximize control of process parameters during experimentation. As shown in Figure 2 and Figure 3, the prototype system integrates a Tooliom 211 MIG welder (Tooliom, Caledon, ON, Canada) with a repurposed three-axis Ender 5 FDM printer (Creality, Shenzhen, China) frame. While the frame provides three degrees of freedom and is not intended for fabricating complex geometries, it offers a stable and flexible platform ideal for controlled studies. This configuration enables precise evaluation of parameter effects and facilitates the development of monitoring and control strategies central to this research.
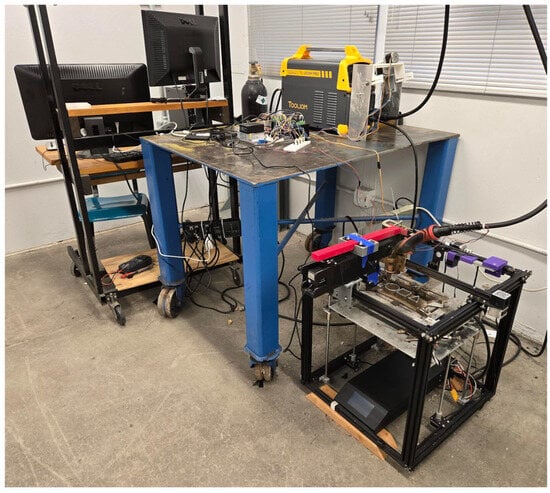
Figure 2.
Custom Wire Arc Additive Manufacturing Machine.
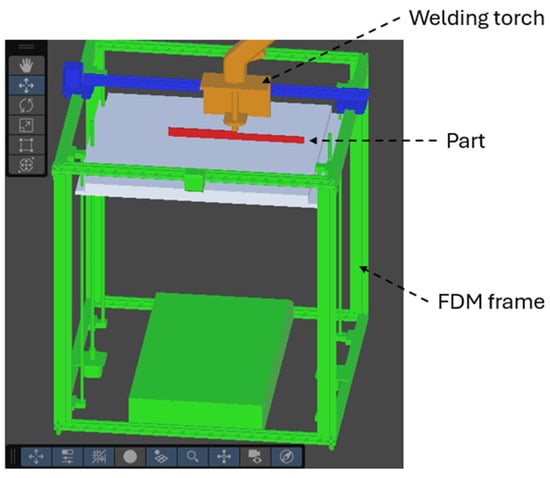
Figure 3.
Schematic representation of the WAAM machine used in this research.
The welding torch replaces the original extruder head of the FDM printer, which is controlled using G-code commands. First, the CAD model is prepared, and the G-code file is generated from the open-source 3D printer software Creality version 6.0.2. Next, the G-code file is fed into the FDM printer, dictating the welding torch path, extruder head speed, and controlling deposition.
2.2. Optical Assembly
The optical assembly developed for this study is composed of a cost-effective high-speed camera, three mirrors, and a 760 nm bandpass filter. As shown in Figure 4, the top mirror (M1) maps the top view of the melt pool to the upper portion of the camera’s field of view (FOV), while the middle mirror (M2) and lower mirror (M3) map the side view of the melt pool to the bottom portion of the camera’s FOV.
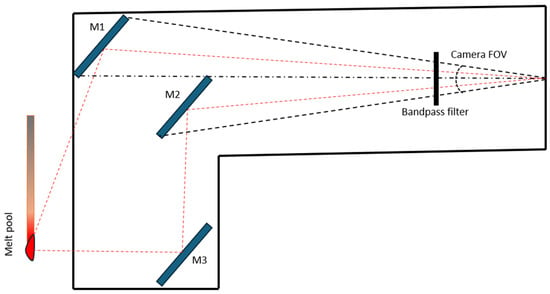
Figure 4.
Optical assembly for real-time melt pool data collection.
M2 and M3 are oriented at 45 degrees with respect to the horizontal axis. M1 is oriented at approximately 60 degrees to provide a better top view. A bandpass filter is placed in front of the camera to block excessive light and spatter emitted from the weld arc. Figure 5 presents sample images of the melt pool from two perspectives. The top image (a) shows a top-down view, which is utilized to measure the melt pool width, while the bottom image (b) provides a side view, enabling measurement of the melt pool height.
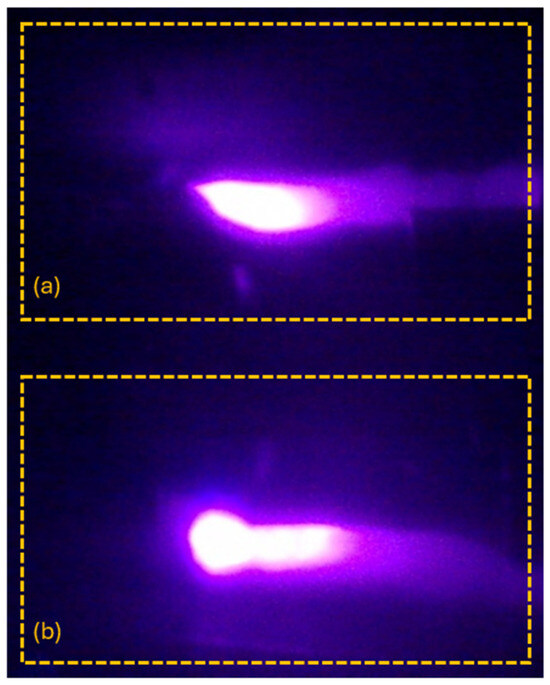
Figure 5.
Sample photo containing: (a) top and (b) side view of the melt pool.
2.3. Controller
The controller module consists of two primary components: an Image Preprocessor (IP) and a Q-Learning Algorithm (QLA), which together establish the interface between the physical system and the computational framework. The IP processes real-time images to extract key melt pool dimensions, while the QLA interprets this feedback to determine optimal parameter adjustments. These decisions are then executed directly on the WAAM system, enabling adaptive closed-loop control. Figure 6 illustrates the overall logic of this architecture, highlighting the interaction between the software modules and the physical components of the process.
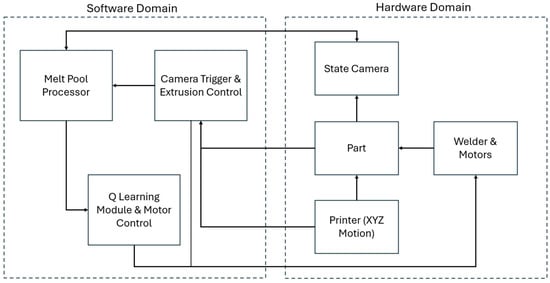
Figure 6.
Schematic representation of the control system architecture.
2.4. Image Processor (IP)
The image processor is activated upon receiving a trigger command aligned with the G-code execution. Once activated, it captures synchronized snapshots from a real-time camera feed, acquiring both top and side views of the melt pool. These views are processed to extract key geometric features: the melt pool width and height. The raw images undergo a preprocessing stage that includes Gaussian blurring to suppress high-frequency noise, followed by the suppression of arc-induced illumination artifacts using elliptically shaped masks centered on regions of maximum intensity (red ellipse in Figure 7b). Contour analysis is then applied to segment the melt pool boundary, which contains the area with maximum intensity.
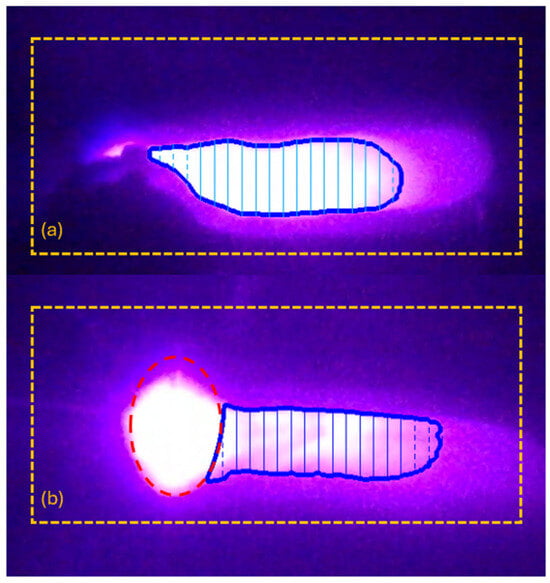
Figure 7.
Processed images for melt pool dimensions extraction: (a) top-half measurement representing the melt pool width, and (b) bottom-half measurement representing the melt pool depth. The elliptical shape in b shows the masked out bright light emitted from the melt pool. Dashed lines indicate outlier measurements (obstructed by the welding torch) that were discarded and replaced with the average of valid measurements for more accurate width determination.
The image processing system was calibrated iteratively to optimize boundary detection of the active melt pool zone. The intensity threshold was adjusted while visually comparing the detected contours against the actual melt pool boundaries in real-time imagery across multiple test depositions. A threshold of 248 (on a 0–255 scale) was selected as it provided the most consistent boundary detection across varying arc conditions. It should be noted that calibration accuracy is sensitive to several experimental factors, including optical component cleanliness (spatter accumulation on lens shields), minor adjustments to mirror alignment, and arc stability. These factors introduce variability that necessitates periodic recalibration, particularly after hardware maintenance or significant changes in welding parameters. This sensitivity to environmental conditions represents a key limitation of the current vision-based approach and motivates the need for more robust calibration methods.
2.5. Q-Learning Algorithm (QLA)
Q-learning is an off-policy Reinforcement Learning (RL) algorithm in which convergence is guaranteed for any agent’s policy [19]. The basis of the Q-Learning algorithm stems from the concept of a Quality Matrix, or Q-Matrix [18], with a matrix size of where S is the number of possible states () and is the number of possible actions () that can be taken by the agent from the current state. The Q-Matrix is populated with Q-values that represent the quality of a specific action given the current state. Algorithm 1 summarizes the general Q-learning method.
| Algorithm 1. Q learning code structure |
| Set parameters: α, γ Initialize Q-matrix Q(s, a) to zeros Repeat for each episode: Initialize state s randomly Loop for each step of the episode: Choose at from st using 𝜖-greedy policy Take action at obtain reward rt, and next state st+1 Update Q(s, a) table st ← st+1; at ← at+1 until st is terminal |
In the above algorithm, is the learning rate and is the discount factor. We implemented a Q-learning algorithm, which is a simple probabilistic exploratory technique frequently used in RL. represents a value between 0 and 1. If the randomly generated number is less than , the agent takes a completely random action from the current state. Otherwise, it takes the action that maximizes the Q-value.
3. Integration of Q-Learning Algorithm in WAAM Process
3.1. State and Action Space Definition
In this study, the Q-table comprises 81 states and 130 actions. The action space is defined by pairs of voltage (V) and wire feed rate (F), with V ranging from 17 to 23 V in increments of 0.5 V (13 values) and F ranging from 280 to 316 mm/min in increments of 4 mm/min (10 values), resulting in 130 discrete (V, F) combinations. The state space is determined by the layer geometry, where the layer height (H) varies from 1 to 3 mm in increments of 0.25 mm (9 values) and the layer width (W) varies from 4 to 6 mm in increments of 0.25 mm (9 values), producing 81 distinct (H, W) states.
Voltage and wire feed rate were selected as control variables because they directly govern melt pool energy input and material deposition rate while being readily actuated via stepper motors interfaced with the welder’s mechanical adjustment dials. Torch travel speed and interlayer dwell time, which are controlled through the FDM printer’s G-code system via serial communication, were held constant. Including these parameters would expand the action space from 130 to over 1000 combinations, substantially increasing training data requirements and learning time. This constrained action space allows focused investigation of welder parameter control before integration with motion control in future work.
3.2. Reward Function Design
The effectiveness of each action is evaluated through a reward function that penalizes deviations from the target geometry, thereby reinforcing parameter combinations that produce desirable melt pool characteristics. The reward function is defined by Equation (1):
where and are the actual layer height and width, while and are the optimal layer height and width, respectively. The reward function applies equal weight to height and width deviations, reflecting both their equal importance for part quality and their physical coupling in the WAAM process. Over-melting produces reduced height with increased width, while under-melting produces the opposite effect, creating a natural trade-off that the equal penalty structure appropriately captures.
The action space bounds (voltage 17–23 V, wire feed rate 280–316 mm/min) were determined through parameter sweep experiments, which identified the operating window that produces optimal print quality. While equal weighting was chosen based on the physical coupling of height and width, alternative weighting schemes were not systematically explored. The equal penalty structure treats a 0.5 mm height error equivalently to a 0.5 mm width error, despite different absolute magnitudes (target height ~1.5 mm vs. target width ~5.6 mm). On a percentage basis, height deviations therefore contribute more heavily to the reward signal, potentially biasing the controller toward prioritizing height control. However, experimental results suggest comparable control performance for both dimensions, with oscillations of similar relative magnitude.
3.3. Q-Learning Implementation
The action-selection strategy is governed by a tabular Q-learning policy that uses the current state and historical outcomes to determine the optimal direction and magnitude of parameter adjustments. The Q-learning algorithm follows the ε-greedy method with ε = 0.1. The learning rate (α = 0.5) and discount factor (γ = 0.77) were selected based on values commonly reported in tabular Q-learning literature [19] and were validated to achieve stable convergence in preliminary testing.
State transitions and rewards are stored in the Q-table, and future actions are guided by estimating expected long-term returns over similar states. Selected actions are physically executed via stepper motors that adjust the V and F by rotating mechanical dials through GPIO commands. Each action corresponds to a discrete change in one or both parameters, enabling fine-grained, hardware-level control within the learning loop.
The computational requirements of the tabular Q-learning approach are minimal, with state lookup, reward calculation, and Q-table updates executing in under 1 ms on standard hardware. The primary sources of latency are image acquisition, processing, and physical actuation via stepper motors. The system executes 6 control decisions per layer with approximately 6 s between actions, providing substantial computational margin. This computational efficiency enables real-time operation without specialized hardware and represents a practical advantage of the tabular approach for manufacturing control applications.
3.4. Safety and Exploration Strategy
The ε-greedy exploration strategy means the agent occasionally selects random actions (10% probability), which could theoretically explore sub-optimal parameter combinations during operation. To mitigate unsafe exploration, the action space was constrained to the viable operating window (17–23 V, 280–316 mm/min) identified through parameter sweep experiments, preventing selection of parameters outside the stable deposition regime. During experimental validation, exploratory actions occasionally produced temporary quality degradation but were corrected in subsequent layers without catastrophic failure.
3.5. Justification for Reinforcement Learning Approach
The use of reinforcement learning for this control task offers several advantages over traditional approaches. While the measurement task itself is geometric, the control problem involves navigating a complex, non-linear relationship between process parameters and resulting geometry under varying thermal conditions. Traditional control methods, such as PID, require explicit process models or extensive parameter tuning for each material and geometry combination. In contrast, the Q-learning approach learns optimal parameter adjustments directly from observed state transitions without requiring prior knowledge of the underlying physics. This data-driven adaptability is particularly valuable in WAAM, where thermal history effects, material variations, and environmental factors create time-varying dynamics that are difficult to model analytically. The Q-learning framework naturally handles the discrete action space imposed by stepper motor control and explores the parameter space to discover control strategies that may be non-intuitive. The learning capability also enables the system to adapt to process drift over extended builds, a feature not easily achieved with fixed-gain controllers.
The choice of tabular Q-learning over more advanced deep reinforcement learning methods (e.g., DQN, actor-critic) was deliberate and practical. First, the state and action spaces in this application are sufficiently small (81 states × 130 actions) to be represented in tabular form, eliminating the need for function approximation. Second, tabular Q-learning offers interpretability. The Q-table can be inspected to understand learned behaviors, which is valuable for process validation and debugging. Third, the computational requirements are minimal, enabling real-time operation on standard hardware without GPUs. Fourth, sample efficiency is superior for small state spaces; tabular methods converge with fewer interactions than deep learning approaches that require extensive training data. While deep RL methods could handle larger state spaces or continuous actions, they would introduce unnecessary complexity, longer training times, and reduced interpretability for this discrete, bounded control problem. The simplicity and reliability of tabular Q-learning align well with the practical constraints of a manufacturing environment.
4. Results and Discussion
In this section, the effect of the reinforcement learning algorithm on the WAAM machine output is investigated. By analyzing both the impact of parameter adjustments on the part in situ and the learning behavior of the model, its effectiveness in guiding the process toward the desired setpoints can be assessed.
Five runs were performed starting from a blank Q-table to evaluate training speed and control accuracy. These included the following (1)—a control case with no adjustments; (2) and (3)—two runs beginning from optimal starting parameters (OS: 22 V, 300 mm/min F) with active control; and (4) and (5)—two runs starting from non-optimal conditions: a high setting (HS: 23 V, 316 mm/min F) and a low setting (LS: 17 V, 280 mm/min F).
4.1. Setpoint Determination and Control
Target geometry was established from prior calibration data. A 20-layer control print was completed at the OS parameters, with six height and width measurements taken per layer. Averaging these values yielded setpoints of 1.54 mm for layer height and 5.6 mm for layer width. This control dataset serves as the baseline for comparison against the reinforcement learning runs. Importantly, the control print also illustrates the natural tendency of the system to drift without feedback, thereby providing context for evaluating the corrective effect of the Q-learning controller.
4.1.1. Geometric Data: Layer Width
Figure 8 shows the width response for all five runs relative to the 5.6 mm setpoint. Across all reinforcement learning runs, the controller consistently converged toward roughly 4.5 mm, a systematic offset of about 20% below the desired width. While this offset likely reflects calibration differences between physical caliper measurements and the digital values from CCD camera images, the system demonstrates stable convergence rather than uncontrolled drift.
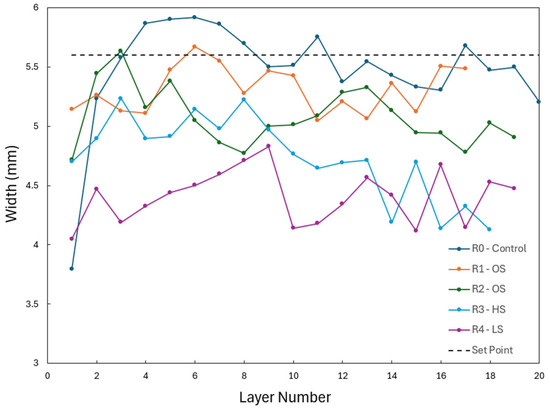
Figure 8.
Layer width (in mm) measured for different layers throughout the print.
Runs R1 and R2 show gradual drift away from the setpoint, while R3 and R4 stabilize more quickly and oscillate around their convergence point. This suggests that after only four reinforcement learning runs, the controller effectively identified a repeatable process region. Although absolute accuracy is limited by sensing and calibration errors, the system demonstrated the ability to maintain a bounded, repeatable operating condition in a first-generation learning framework.
Figure 9 shows the measurement discrepancy, where the digital estimate of width exceeds the actual melt pool boundary. Light arc and hardware limitations prevented consistent image segmentation in all conditions. This underscores the challenge of sensor reliability in closed-loop control. Even with effective decision-making, the accuracy of control is inherently limited by the fidelity of feedback.
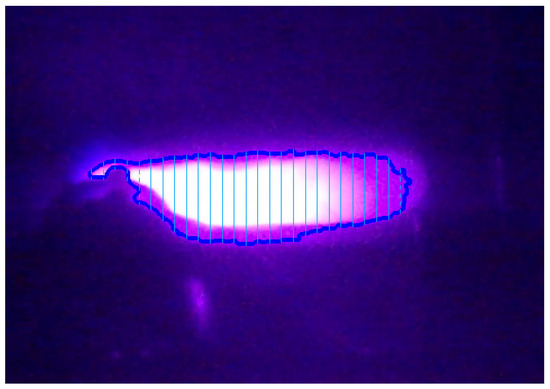
Figure 9.
Digital width measurement exceeding the melt pool boundary.
4.1.2. Geometric Data: Layer Height
Height data is presented in two ways for clarity. The average layer height across each build is plotted in Figure 10, which shows an oscillatory pattern around the target. Similar to the width results, the controller converges slightly above the setpoint at 1.75 mm, again indicating a calibration mismatch between the physical and digital measurements.
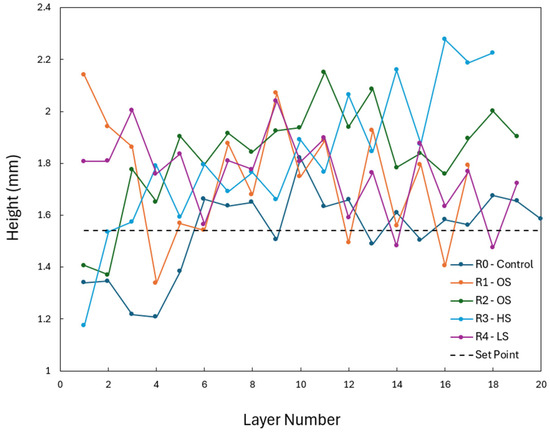
Figure 10.
Layer height (in mm) measured for different layers throughout the print.
Figure 11 shows the trendlines observed from these measurements, demonstrating the sinusoidal nature of the response. This oscillation suggests the controller was consistently correcting errors to minimize height deviation, a characteristic similar to proportional feedback systems under noisy sensing conditions. While not perfectly converging, this pattern shows that the controller successfully prevented cumulative error, so that deviations remained bounded rather than increasing layer by layer. From a practical manufacturing standpoint, such stability is preferable to drift as it prevents compounding defects over long builds.
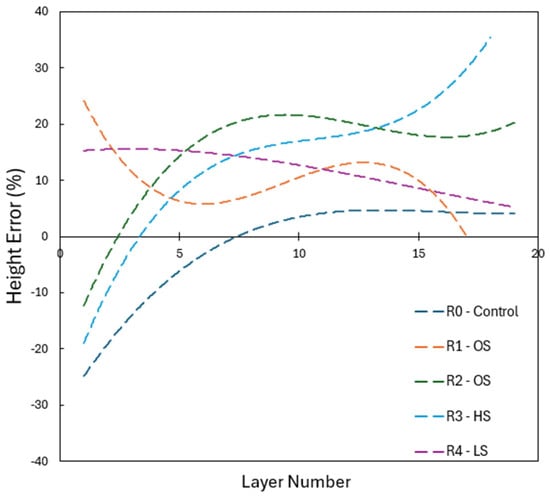
Figure 11.
Layer height deviation from the setpoint (%).
4.2. Case Study
Photographs were taken to validate the numerical trends and demonstrate corrective behavior. Figure 12 shows the LS run. The low starting voltage produced poor contact with the substrate, generating excessively tall initial layers. The controller responded with gradual voltage increases, increasing the melting and lowering the layer height, ultimately restoring stable deposition conditions and producing a well-formed pass.
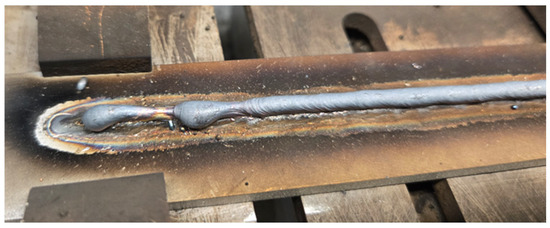
Figure 12.
Corrected quality using the proposed controller in layer 2 started at low settings.
Figure 13 presents a mid-print disturbance incident in which the voltage was reduced below the wetting threshold by the controller, producing a defective layer. The subsequent layer was automatically corrected to restore proper deposition. Such behavior demonstrates that the controller not only stabilizes the process in steady-state conditions but also learns under sudden disturbances, a critical feature for industrial robustness. Together, these visual results reinforce the conclusion that reinforcement learning can manage real-time variability in the WAAM process.
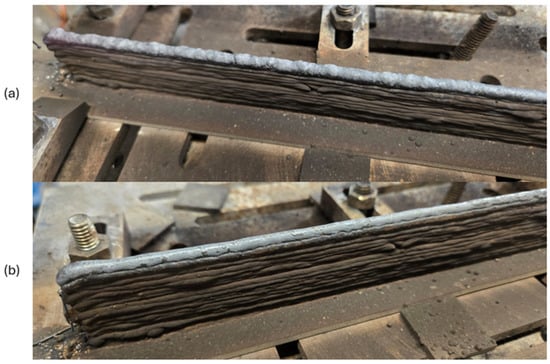
Figure 13.
Corrected quality using the proposed controller in layer 13; (a) Suboptimal layer due to overcorrection, and (b) Corrected subsequent layer.
4.3. Discussion & Summary
4.3.1. Control Performance and Convergence Behavior
Overall, the reinforcement learning controller demonstrated real-time control capability to influence the WAAM part geometry. While the model consistently converged to stable operating regions, width and height trends exhibited offsets from the target setpoints, attributed primarily to calibration mismatch between physical and digital measurements.
Oscillating height control was a characteristic behavior observed across all reinforcement learning runs (Figure 10). This oscillation was a result of the controller over- and under-correcting around the setpoint rather than settling exactly on it, exhibiting a sinusoidal pattern (Figure 11). This behavior is similar to proportional feedback systems operating under noisy sensing conditions, where the controller consistently works to minimize height deviation without achieving perfect steady-state convergence. While not perfectly stable, this pattern demonstrates that the controller successfully prevented cumulative error accumulation, maintaining bounded deviations rather than allowing drift that would compound over multiple layers. From a practical manufacturing standpoint, such bounded oscillation is preferable to uncontrolled drift, as it prevents progressive quality degradation over long builds.
Despite such offsets and oscillations, photographic evidence confirmed that the controller effectively corrected large deviations, particularly during low-setting starts and mid-print disturbances, to restore stable layer deposition.
4.3.2. Limitations of Geometry Specific State Representations
The current implementation uses only geometric features (height and width) as state variables, which limits the controller’s awareness of underlying process physics. Thermal effects, including interlayer temperature, cooling rate, and heat accumulation over multiple layers, directly influence material microstructure, residual stress, and mechanical properties but are not captured in the geometric state representation. This limitation means the controller optimizes for dimensional accuracy without considering thermal history effects that could lead to defects such as porosity, cracking, or unfavorable grain structure. Additionally, the geometric measurements represent only the external melt pool boundary and provide no information about internal quality or subsurface defects. Future work should integrate thermal sensing, such as thermocouples and thermal cameras, to expand the state space and enable thermal-aware control strategies. This multi-physics approach would allow the RL agent to balance geometric accuracy with thermal management, potentially preventing defects before they occur rather than merely correcting dimensional deviations.
4.3.3. Calibration and Measurement Challenges
The systematic offset between target setpoints and converged values warrants deeper analysis. Several factors in the image processing pipeline likely contribute to this discrepancy. First, the mirror-based optical assembly introduces perspective distortion, particularly for the top-view width measurements, where the viewing angle is approximately 60 degrees rather than perpendicular. Second, the fixed intensity threshold of 248 (determined during calibration) may not account for variations in arc brightness across different voltage settings, leading to inconsistent boundary detection. Third, lens distortion and the complex geometry of the three-mirror system create non-linear mapping between pixel measurements and physical dimensions. The robustness of the vision system under industrial conditions presents additional challenges. Arc light intensity fluctuates with changes in voltage and arc length, affecting boundary detection consistency. The fixed bandpass filter at 760 nm reduces but does not eliminate this variability. Spatter accumulation on the lens shield progressively degrades image quality, requiring periodic cleaning, a maintenance burden that limits continuous operation. Shielding gas flow variations can cause arc instability and affect the visible melt pool profile. Future work should implement more robust calibration procedures, including a multi-point spatial calibration across the entire measurement field of view, adaptive thresholding that accounts for arc intensity variations, periodic validation against physical measurements during operation, and potential integration of a secondary measurement system (e.g., laser profilometry) for cross-validation and sensor fusion. More robust sensing approaches, adaptive filtering, or redundant measurement modalities less sensitive to arc conditions would improve industrial readiness.
4.3.4. Scalability Considerations
The current framework is validated on simple multi-layer walls, which provide controlled conditions for evaluating the RL controller’s fundamental capabilities. Scalability to complex 3D geometries represents a significant challenge, as path-dependent effects from geometries such as corners, overhangs, and varying cross-sections would require expanded state representations and potentially larger action spaces to include torch orientation adjustments. While the tabular approach is well-suited for repetitive geometries, complex parts would likely necessitate function approximation methods or hierarchical control strategies to manage the increased state-action space complexity.
4.3.5. Comparison with Prior Approaches
The present work advances WAAM process control beyond several recent approaches in the literature. Yeon et al. [18] proposed a Q-learning framework for WAAM control using profilometer measurements and thermal imaging, but their implementation remained theoretical without physical hardware integration or real-time closed-loop operation. This work demonstrates the practical realization of RL-based control with direct hardware actuation and validated disturbance recovery.
Xia et al. [8] demonstrated CNN-based monitoring for anomaly detection in WAAM, achieving high classification accuracy for defect identification. However, their approach required extensive training data with artificial defects and did not close the control loop to adjust process parameters. In contrast, this Q-learning approach learns from normal process variations with minimal training data and actively adjusts parameters to maintain target geometry.
Ščetinec et al. [12] implemented closed-loop layer height control using Hall effect sensors to adjust welding current and voltage, demonstrating effective geometric control. However, their approach used fixed control logic without adaptive learning capability. The RL framework presented here learns optimal control strategies from experience and can adapt to process drift, material variations, and unforeseen disturbances without manual retuning.
Compared to these approaches, this research uniquely combines data-efficient learning, physical hardware integration with real-time actuation, and demonstrated robustness to disturbances, representing a complete implementation rather than simulation or open-loop monitoring. The accessible nature of the system, developed using readily available components, further distinguishes it from approaches requiring specialized sensors or extensive computational resources.
4.3.6. Summary
Despite the limitations identified above, the controller’s ability to maintain bounded oscillations and prevent drift demonstrates that relative geometric control is sufficient for stable operation. These results indicate that the present approach achieves robust relative control of geometry, but that further refinement of sensing and calibration is required to achieve absolute accuracy at the target setpoints.
5. Conclusions
This study demonstrated the feasibility and practical implementation of integrating vision-based monitoring with reinforcement learning for closed-loop control of the WAAM process. Key contributions include a complete hardware-integrated RL control system operating in real-time with direct parameter actuation via stepper motors, demonstration of autonomous disturbance recovery and adaptation across varying initial conditions, validation of tabular Q-learning as a computationally efficient approach suitable for manufacturing environments using standard hardware, and honest assessment of practical limitations, including calibration challenges, geometric-only state representation, and scalability constraints.
Using a Q-learning controller to adjust welding voltage and wire feed rate, the system controlled part geometry in real-time and recovered from disturbances during deposition. Through multiple test conditions, including low-setting starts and mid-print perturbations, the controller exhibited consistent convergence behavior and corrected large deviations in layer height while stabilizing deposition quality. The bounded oscillatory response observed in height control, while not achieving perfect steady-state accuracy, successfully prevented cumulative error accumulation over multiple layers—a critical requirement for extended builds.
However, persistent offsets between target setpoints and converged values revealed important limitations. Systematic calibration mismatches between digital measurements and physical dimensions stem from perspective distortion in the mirror-based optical system, fixed intensity thresholding across varying arc conditions, and lens distortion effects. Additionally, the geometric-only state representation limits awareness of thermal history effects, which influence microstructure and mechanical properties but are not captured in the current framework. The vision system’s sensitivity to spatter accumulation and arc fluctuations presents challenges for continuous industrial operation.
Despite these challenges, the results confirm that reinforcement learning is a viable and practical strategy for adaptive process control in WAAM, providing robustness against parameter variation and initial condition mismatches. The approach’s accessibility, developed with minimal funding using readily available components, demonstrates that intelligent process control does not require expensive specialized equipment, lowering barriers to adoption. With further optimization of the image-processing pipeline, implementation of adaptive calibration procedures, and integration of thermal sensing to enable multi-physics control, this approach can advance toward precise geometric accuracy and repeatable, industrial-grade performance. This work, therefore, establishes a foundation for the broader adoption of machine learning-based control strategies in metal additive manufacturing, where in situ adaptability, practical accessibility, and reliability are critical to process maturity.
6. Future Work
This work remains in the early stages of development, but continuous research into additional data types and sensing capabilities will further advance the state of wire arc additive manufacturing. The long-term goal is a fully automated, intelligent closed-loop system that not only detects residual stress, porosity, and microstructural defects but also actively prevents defects using predictive parameter control and optimizes the entire build process.
Immediate efforts will concentrate on refining and calibrating the existing control system to achieve high accuracy and consistency between the physical and digital domains. With this baseline established, thermal monitoring will be added through thermal cameras and embedded thermocouples for a dataset of melt pool temperatures, cooling rates, and local thermal profiles. Such information has been shown to influence residual stress formation, microstructure development, and material properties in other AM processes [20,21,22,23,24]. Integrating these insights will enable prediction of stress evolution, support microstructure-aware control strategies, and allow for finer tuning of deposition geometry. Beyond reducing defects, this approach lays the groundwork for more advanced, multi-physics process control that can support increasingly complex geometries, higher-performance components, and broader adoption of WAAM in industrial applications.
Author Contributions
Conceptualization, A.L. and S.B.; methodology, A.L. and S.B.; software, A.L. and S.B.; validation, A.L. and S.B.; formal analysis, A.L. and S.B.; investigation, A.L. and S.B.; resources, A.L. and S.B.; data curation, A.L. and S.B.; writing—original draft preparation, A.L. and S.B.; writing—review and editing, A.L., S.B. and Y.H.P.; visualization, A.L. and S.B.; supervision, Y.H.P.; project administration, Y.H.P.; All authors have read and agreed to the published version of the manuscript.
Funding
This research received no external funding.
Data Availability Statement
The data presented in this study are available on request from the corresponding author. The data are not publicly available due to proprietary equipment configurations and ongoing research.
Conflicts of Interest
The authors declare no conflict of interest.
References
- Zeng, Z.; Cong, B.Q.; Oliveira, J.P.; Ke, W.C.; Schell, N.; Peng, B.; Qi, Z.W.; Ge, F.G.; Zhang, W.; Ao, S.S. Wire and Arc Additive Manufacturing of a Ni-Rich NiTi Shape Memory Alloy: Microstructure and Mechanical Properties. Addit. Manuf. 2020, 32, 101051. [Google Scholar] [CrossRef]
- Rodrigues, T.A.; Bairrão, N.; Farias, F.W.C.; Shamsolhodaei, A.; Shen, J.; Zhou, N.; Maawad, E.; Schell, N.; Santos, T.G.; Oliveira, J.P. Steel-Copper Functionally Graded Material Produced by Twin-Wire and Arc Additive Manufacturing (T-WAAM). Mater. Des. 2022, 213, 110270. [Google Scholar] [CrossRef]
- Ke, W.C.; Oliveira, J.P.; Cong, B.Q.; Ao, S.S.; Qi, Z.W.; Peng, B.; Zeng, Z. Multi-Layer Deposition Mechanism in Ultra High-Frequency Pulsed Wire Arc Additive Manufacturing (WAAM) of NiTi Shape Memory Alloys. Addit. Manuf. 2022, 50, 102513. [Google Scholar] [CrossRef]
- Suryakumar, S.; Karunakaran, K.; Chandrasekhar, U.; Somashekara, M. A Study of the Mechanical Properties of Objects Built through Weld-Deposition. Proc. Inst. Mech. Eng. Part B J. Eng. Manuf. 2013, 227, 1138–1147. [Google Scholar] [CrossRef]
- Lopes, J.G.; Machado, C.M.; Duarte, V.R.; Rodrigues, T.A.; Santos, T.G.; Oliveira, J.P. Effect of Milling Parameters on HSLA Steel Parts Produced by Wire and Arc Additive Manufacturing (WAAM). J. Manuf. Process. 2020, 59, 739–749. [Google Scholar] [CrossRef]
- Thangamani, G.; Anand, P.I.; Sahu, A.; Singh, I.; Gianchandani, P.K.; Tamang, S.K. Enhance the Microstructure and Mechanical Properties of Directed Energy Deposition-Arc (DED-Arc) Stainless Steel 308L Using Laser Shock Peening Process. Prog. Addit. Manuf. 2025, 10, 8537–8555. [Google Scholar] [CrossRef]
- Thangamani, G.; Tamang, S.K.; Patel, M.S.; Narayanan, J.A.; Pallagani, J.; Rose, P.; Gianchandani, P.K.; Thirugnanasambandam, A.; Anand, P.I. Post-Processing Treatment of Wire Arc Additive Manufactured NiTi Shape Memory Alloy Using Laser Shock Peening Process: A Study on Tensile Behavior and Fractography Analysis. Int. J. Adv. Manuf. Technol. 2025, 136, 3315–3327. [Google Scholar] [CrossRef]
- Xia, C.; Pan, Z.; Li, Y.; Chen, J.; Li, H. Vision-Based Melt Pool Monitoring for Wire-Arc Additive Manufacturing Using Deep Learning Method. Int. J. Adv. Manuf. Technol. 2022, 120, 551–562. [Google Scholar] [CrossRef]
- Chabot, A.; Rauch, M.; Hascoët, J.-Y. Towards a Multi-Sensor Monitoring Methodology for AM Metallic Processes. Weld. World 2019, 63, 759–769. [Google Scholar] [CrossRef]
- Zhan, Q.; Liang, Y.; Ding, J.; Williams, S. A Wire Deflection Detection Method Based on Image Processing in Wire + Arc Additive Manufacturing. Int. J. Adv. Manuf. Technol. 2017, 89, 755–763. [Google Scholar] [CrossRef]
- Xiong, J.; Zhang, K. Monitoring Multiple Geometrical Dimensions in WAAM Based on a Multi-Channel Monocular Visual Sensor. Measurement 2022, 204, 112097. [Google Scholar] [CrossRef]
- Ščetinec, A.; Klobčar, D.; Bračun, D. In-Process Path Replanning and Online Layer Height Control through Deposition Arc Current for Gas Metal Arc Based Additive Manufacturing. J. Manuf. Process. 2021, 64, 1169–1179. [Google Scholar] [CrossRef]
- Rahman, M.A.; Jamal, S.; Cruz, M.V.; Silwal, B.; Taheri, H. In Situ Process Monitoring of Multi-Layer Deposition in Wire Arc Additive Manufacturing (WAAM) Process with Acoustic Data Analysis and Machine Learning. Int. J. Adv. Manuf. Technol. 2024, 132, 5087–5101. [Google Scholar] [CrossRef]
- Xiao, J.; Anwer, N.; Huang, H.; Bonnard, R.; Eynard, B.; Huang, C.; Pei, E. Information Exchange and Knowledge Discovery for Additive Manufacturing Digital Thread: A Comprehensive Literature Review. Int. J. Comput. Integr. Manuf. 2025, 38, 1052–1077. [Google Scholar] [CrossRef]
- Xiao, J.; Lan, B.; Jiang, C.; Terzi, S.; Zheng, C.; Eynard, B.; Anwer, N.; Huang, H. Graph Attention-Based Knowledge Reasoning for Mechanical Performance Prediction of L-PBF Printing Parts. Int. J. Adv. Manuf. Technol. 2025, 138, 4175–4195. [Google Scholar] [CrossRef]
- Gao, J.; Wang, G.; Xiao, J.; Zheng, P.; Pei, E. Partially Observable Deep Reinforcement Learning for Multi-Agent Strategy Optimization of Human-Robot Collaborative Disassembly: A Case of Retired Electric Vehicle Battery. Robot. Comput. Integr. Manuf. 2024, 89, 102775. [Google Scholar] [CrossRef]
- Xiao, J.; Gao, J.; Anwer, N.; Eynard, B. Multi-Agent Reinforcement Learning Method for Disassembly Sequential Task Optimization Based on Human–Robot Collaborative Disassembly in Electric Vehicle Battery Recycling. J. Manuf. Sci. Eng. 2023, 145, 121001. [Google Scholar] [CrossRef]
- Kwak, Y.K.; Lehmann, T.; Tavakoli, M.; Qureshi, A. Sensor-Based In-Situ Process Control of Robotic Wire Arc Additive Manufacturing Integrated with Reinforcement Learning. In Proceedings of the 4th Holistic Innovation in Additive Manufacturing (HI-AM) Conference, Anaheim, CA, Canada, 25–26 June 2021. [Google Scholar]
- Sutton, R.S.; Barto, A.G. Reinforcement Learning: An Introduction, 2nd ed.; Adaptive Computation and Machine Learning Series; MIT Press: Cambridge, MA, USA, 2018; ISBN 978-0-262-03924-6. [Google Scholar]
- Huang, W.; Ji, X.; Garmestani, H.; Liang, S.Y. Analytical Modeling of Grain Size Prediction in Additive Manufacturing. Int. J. Adv. Manuf. Technol. 2025, 139, 2627–2641. [Google Scholar] [CrossRef]
- Farshidianfar, M.H.; Khajepour, A.; Gerlich, A.P. Effect of Real-Time Cooling Rate on Microstructure in Laser Additive Manufacturing. J. Mater. Process. Technol. 2016, 231, 468–478. [Google Scholar] [CrossRef]
- Chen, S.; Gao, H.; Zhang, Y.; Wu, Q.; Gao, Z.; Zhou, X. Review on Residual Stresses in Metal Additive Manufacturing: Formation Mechanisms, Parameter Dependencies, Prediction and Control Approaches. J. Mater. Res. Technol. 2022, 17, 2950–2974. [Google Scholar] [CrossRef]
- Bertini, L.; Bucchi, F.; Frendo, F.; Moda, M.; Monelli, B.D. Residual Stress Prediction in Selective Laser Melting. Int. J. Adv. Manuf. Technol. 2019, 105, 609–636. [Google Scholar] [CrossRef]
- Hooper, P.A. Melt Pool Temperature and Cooling Rates in Laser Powder Bed Fusion. Addit. Manuf. 2018, 22, 548–559. [Google Scholar] [CrossRef]
Disclaimer/Publisher’s Note: The statements, opinions and data contained in all publications are solely those of the individual author(s) and contributor(s) and not of MDPI and/or the editor(s). MDPI and/or the editor(s) disclaim responsibility for any injury to people or property resulting from any ideas, methods, instructions or products referred to in the content. |
© 2025 by the authors. Licensee MDPI, Basel, Switzerland. This article is an open access article distributed under the terms and conditions of the Creative Commons Attribution (CC BY) license (https://creativecommons.org/licenses/by/4.0/).