
Towards Developing Big Data Analytics for Machining Decision-Making


Abstract
:1. Introduction
- How should the documentation process for manufacturing be carried out?
- What should be the process for digitizing and integrating the prepared documents with process-relevant BD in terms of DMCs?
- What is the proper procedure for utilizing the relevant dataset found in the shared documents?
- What should be the method for meeting the computational challenges underlying the relevant datasets generated from multiple sources?
- What is the recommended method for extracting rules and drawing conclusions?
2. Literature Review
3. Proposed BDA
3.1. Fundamental Concepts
- How should the documentation process for manufacturing be carried out? (Q1)
- What should be the process for integrating the prepared documents with process-relevant BD? (Q2)
- What is the proper procedure for utilizing the relevant dataset (specifically, CV–EV-related datasets) found in the shared documents? (Q3)
- What should be the method for meeting the computational challenges? (Q4)
- What is the recommended method for extracting rules and drawing conclusions? (Q5)
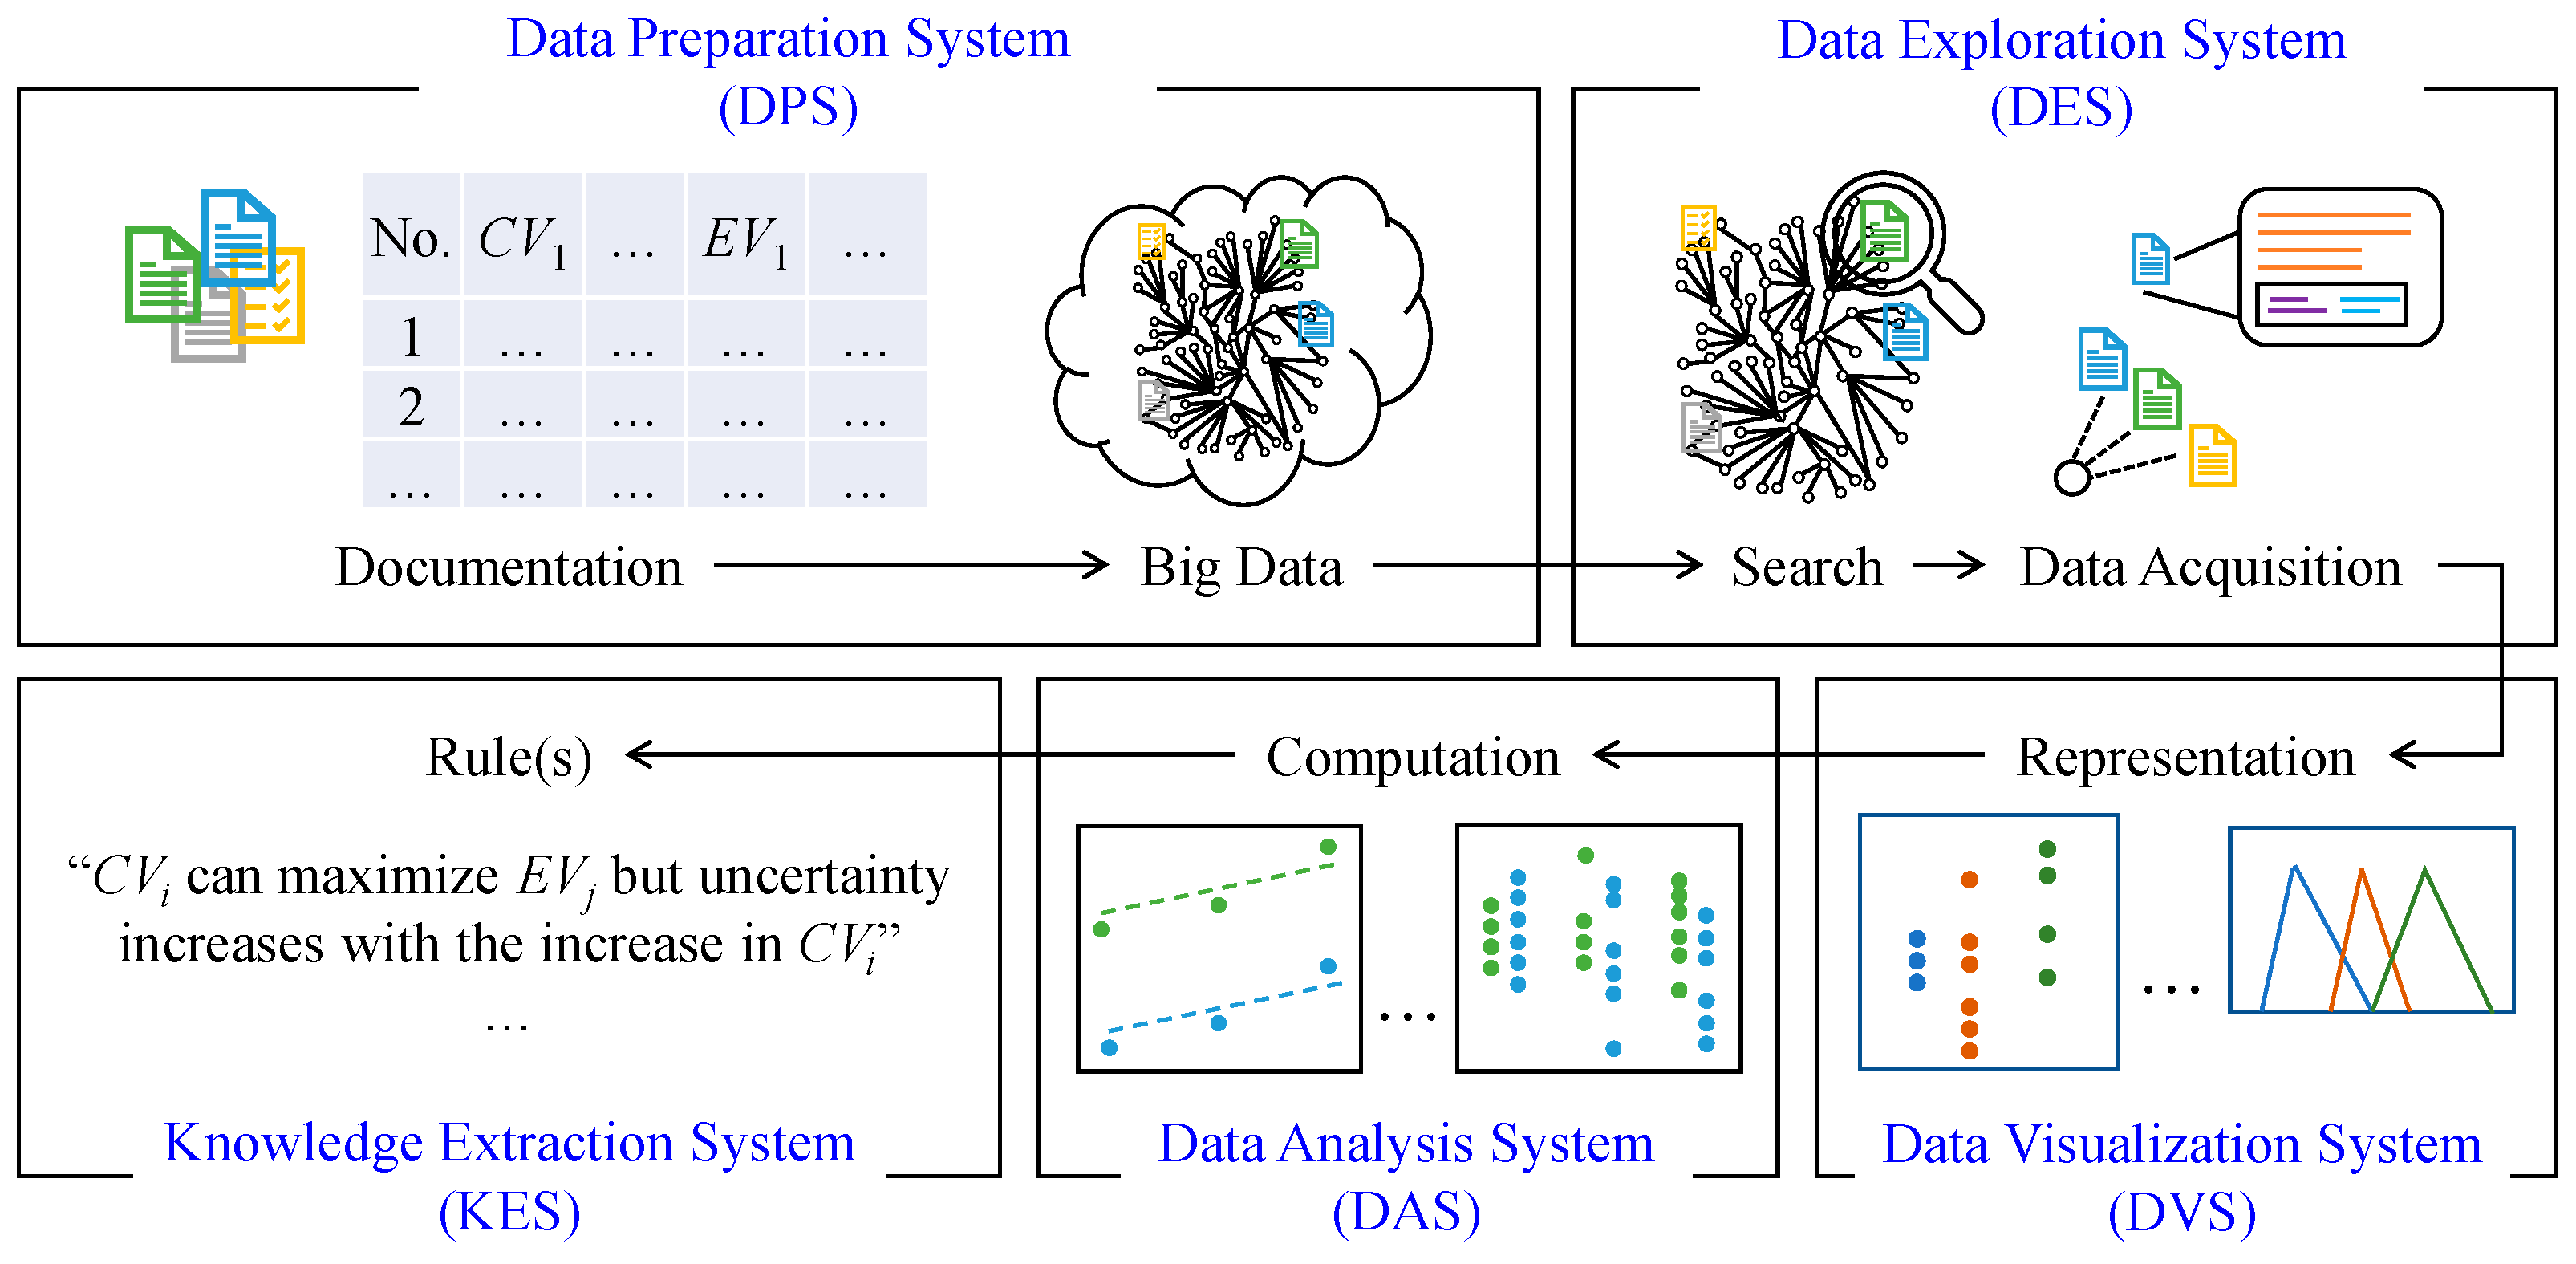
3.2. BDA Framework
- (1)
- Data Preparation System (DPS);
- (2)
- Data Exploration System (DES);
- (3)
- Data Visualization System (DVS);
- (4)
- Data Analysis System (DAS);
- (5)
- Knowledge Extraction System (KES).
4. Developing BDA
4.1. Data Preparation System (DPS)
4.2. Data Exploration System (DES)
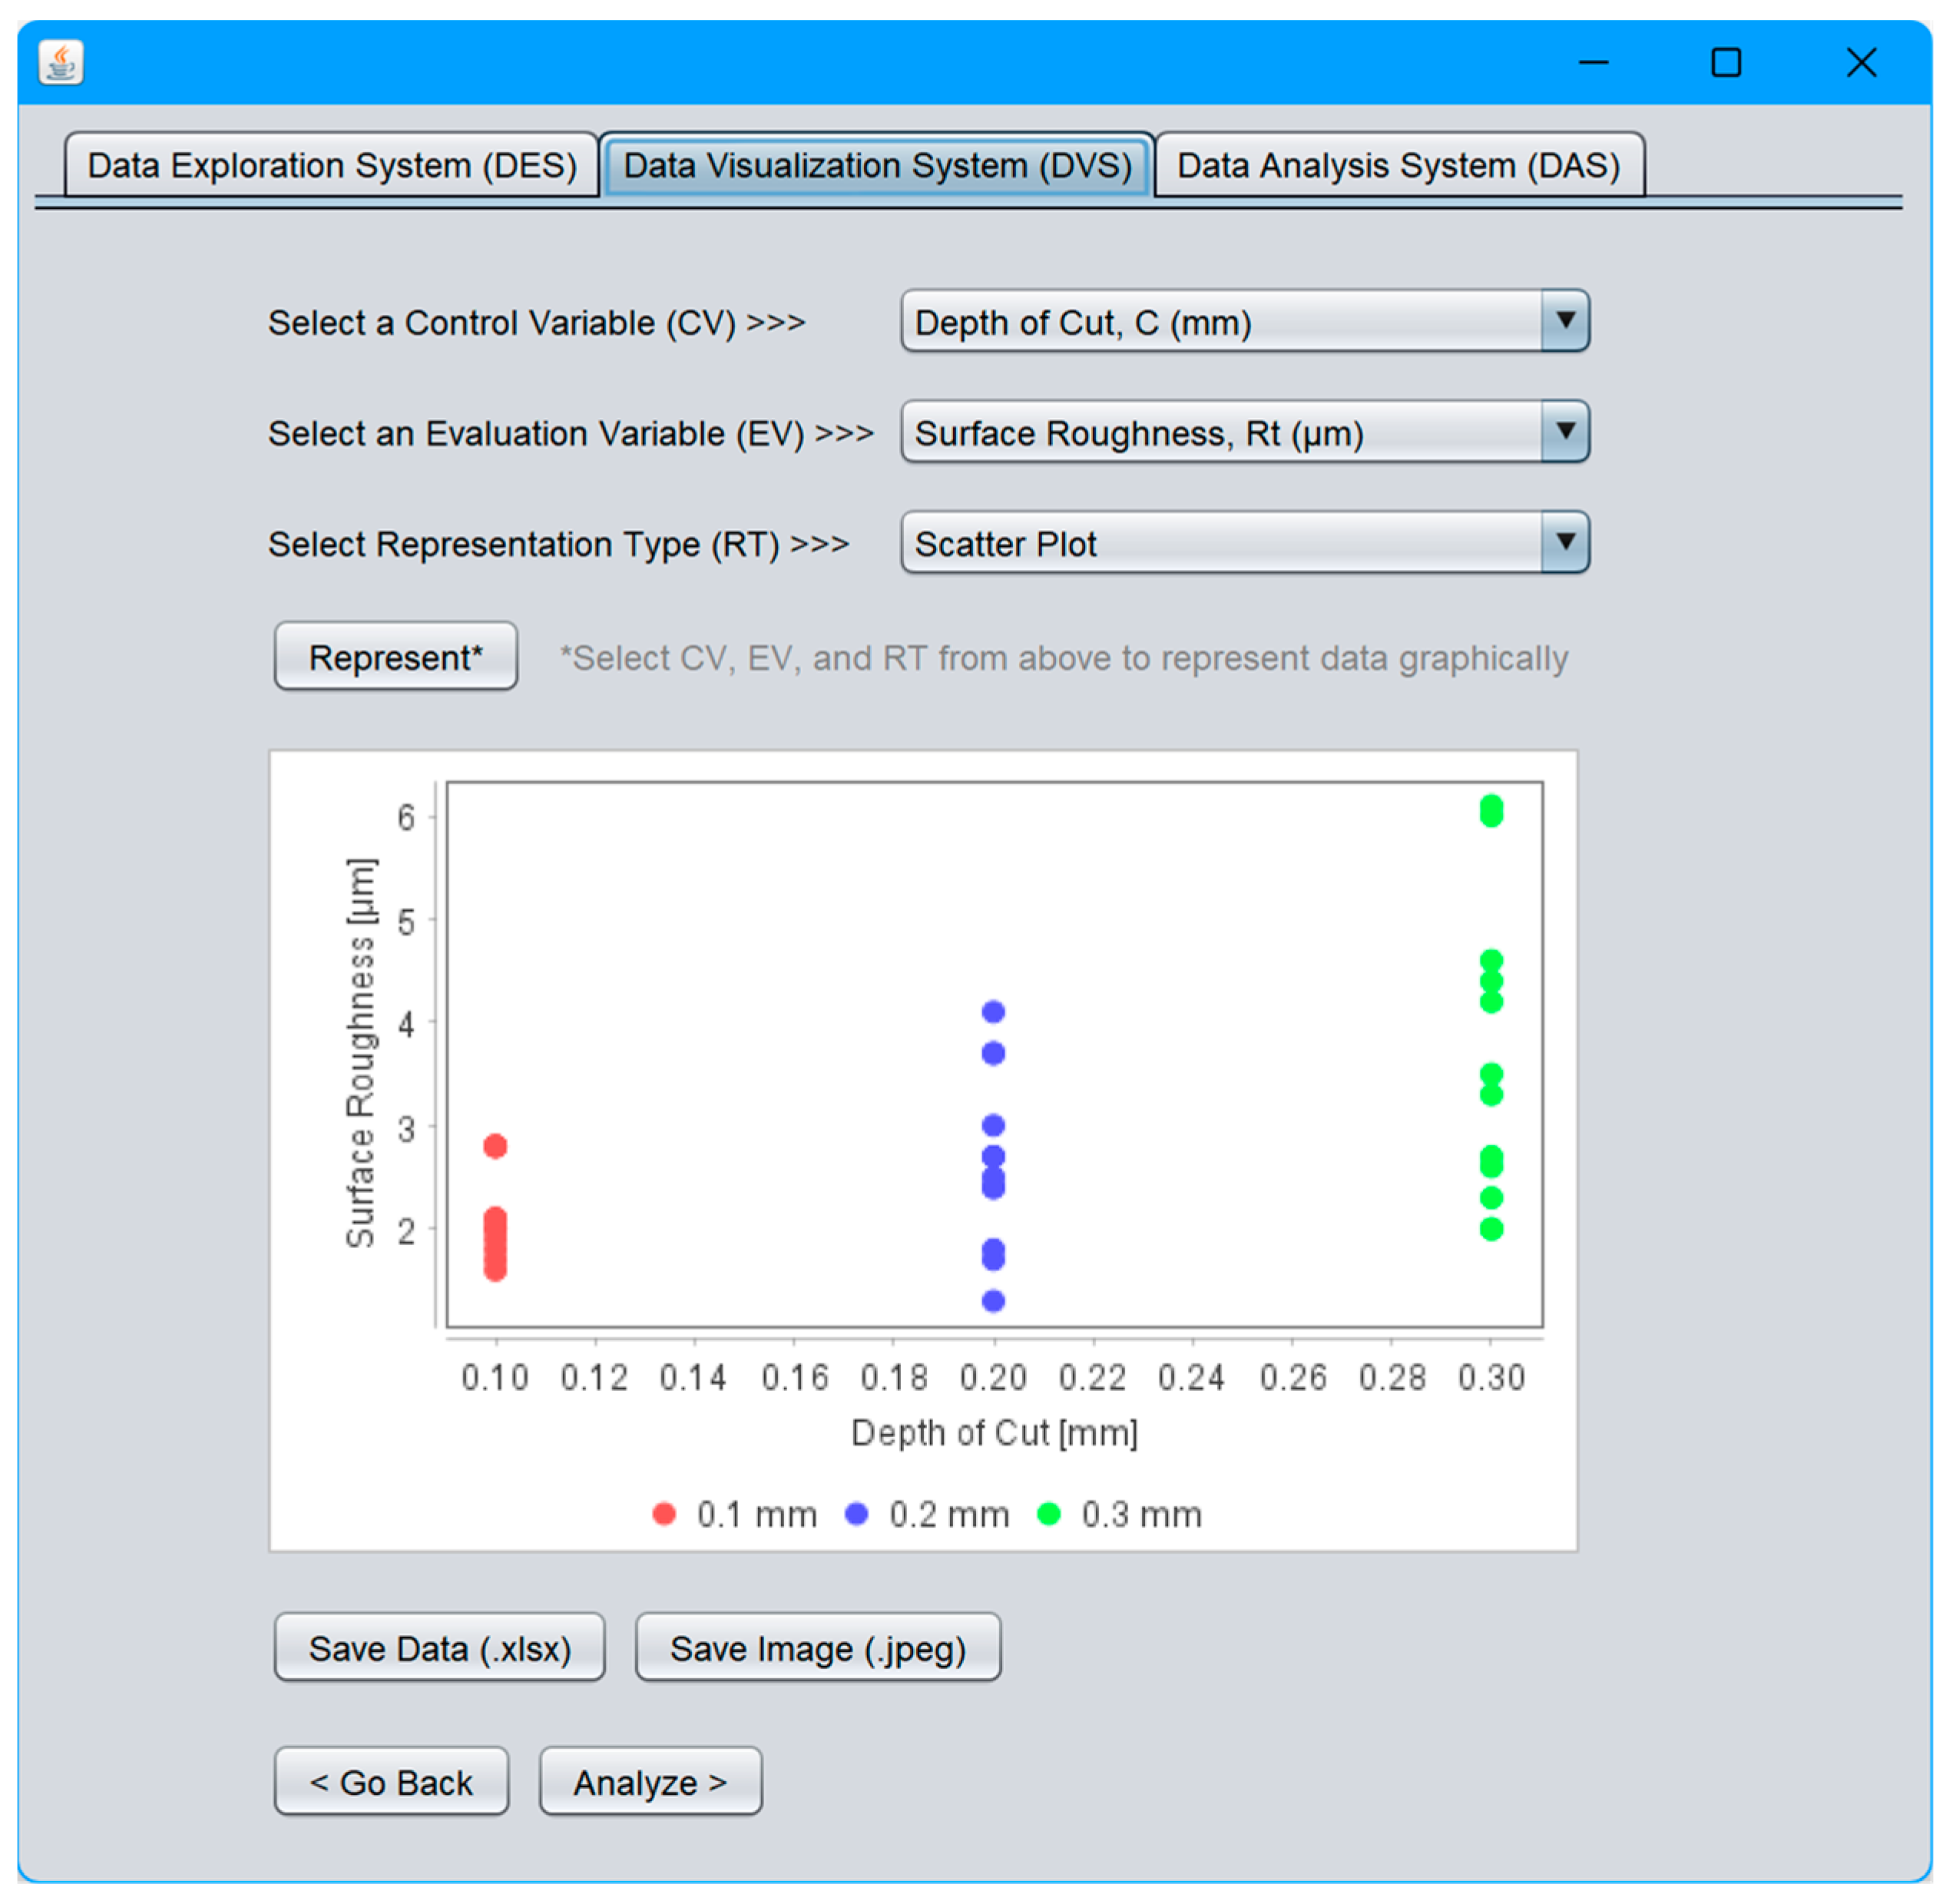
4.3. Data Visualization System (DVS)
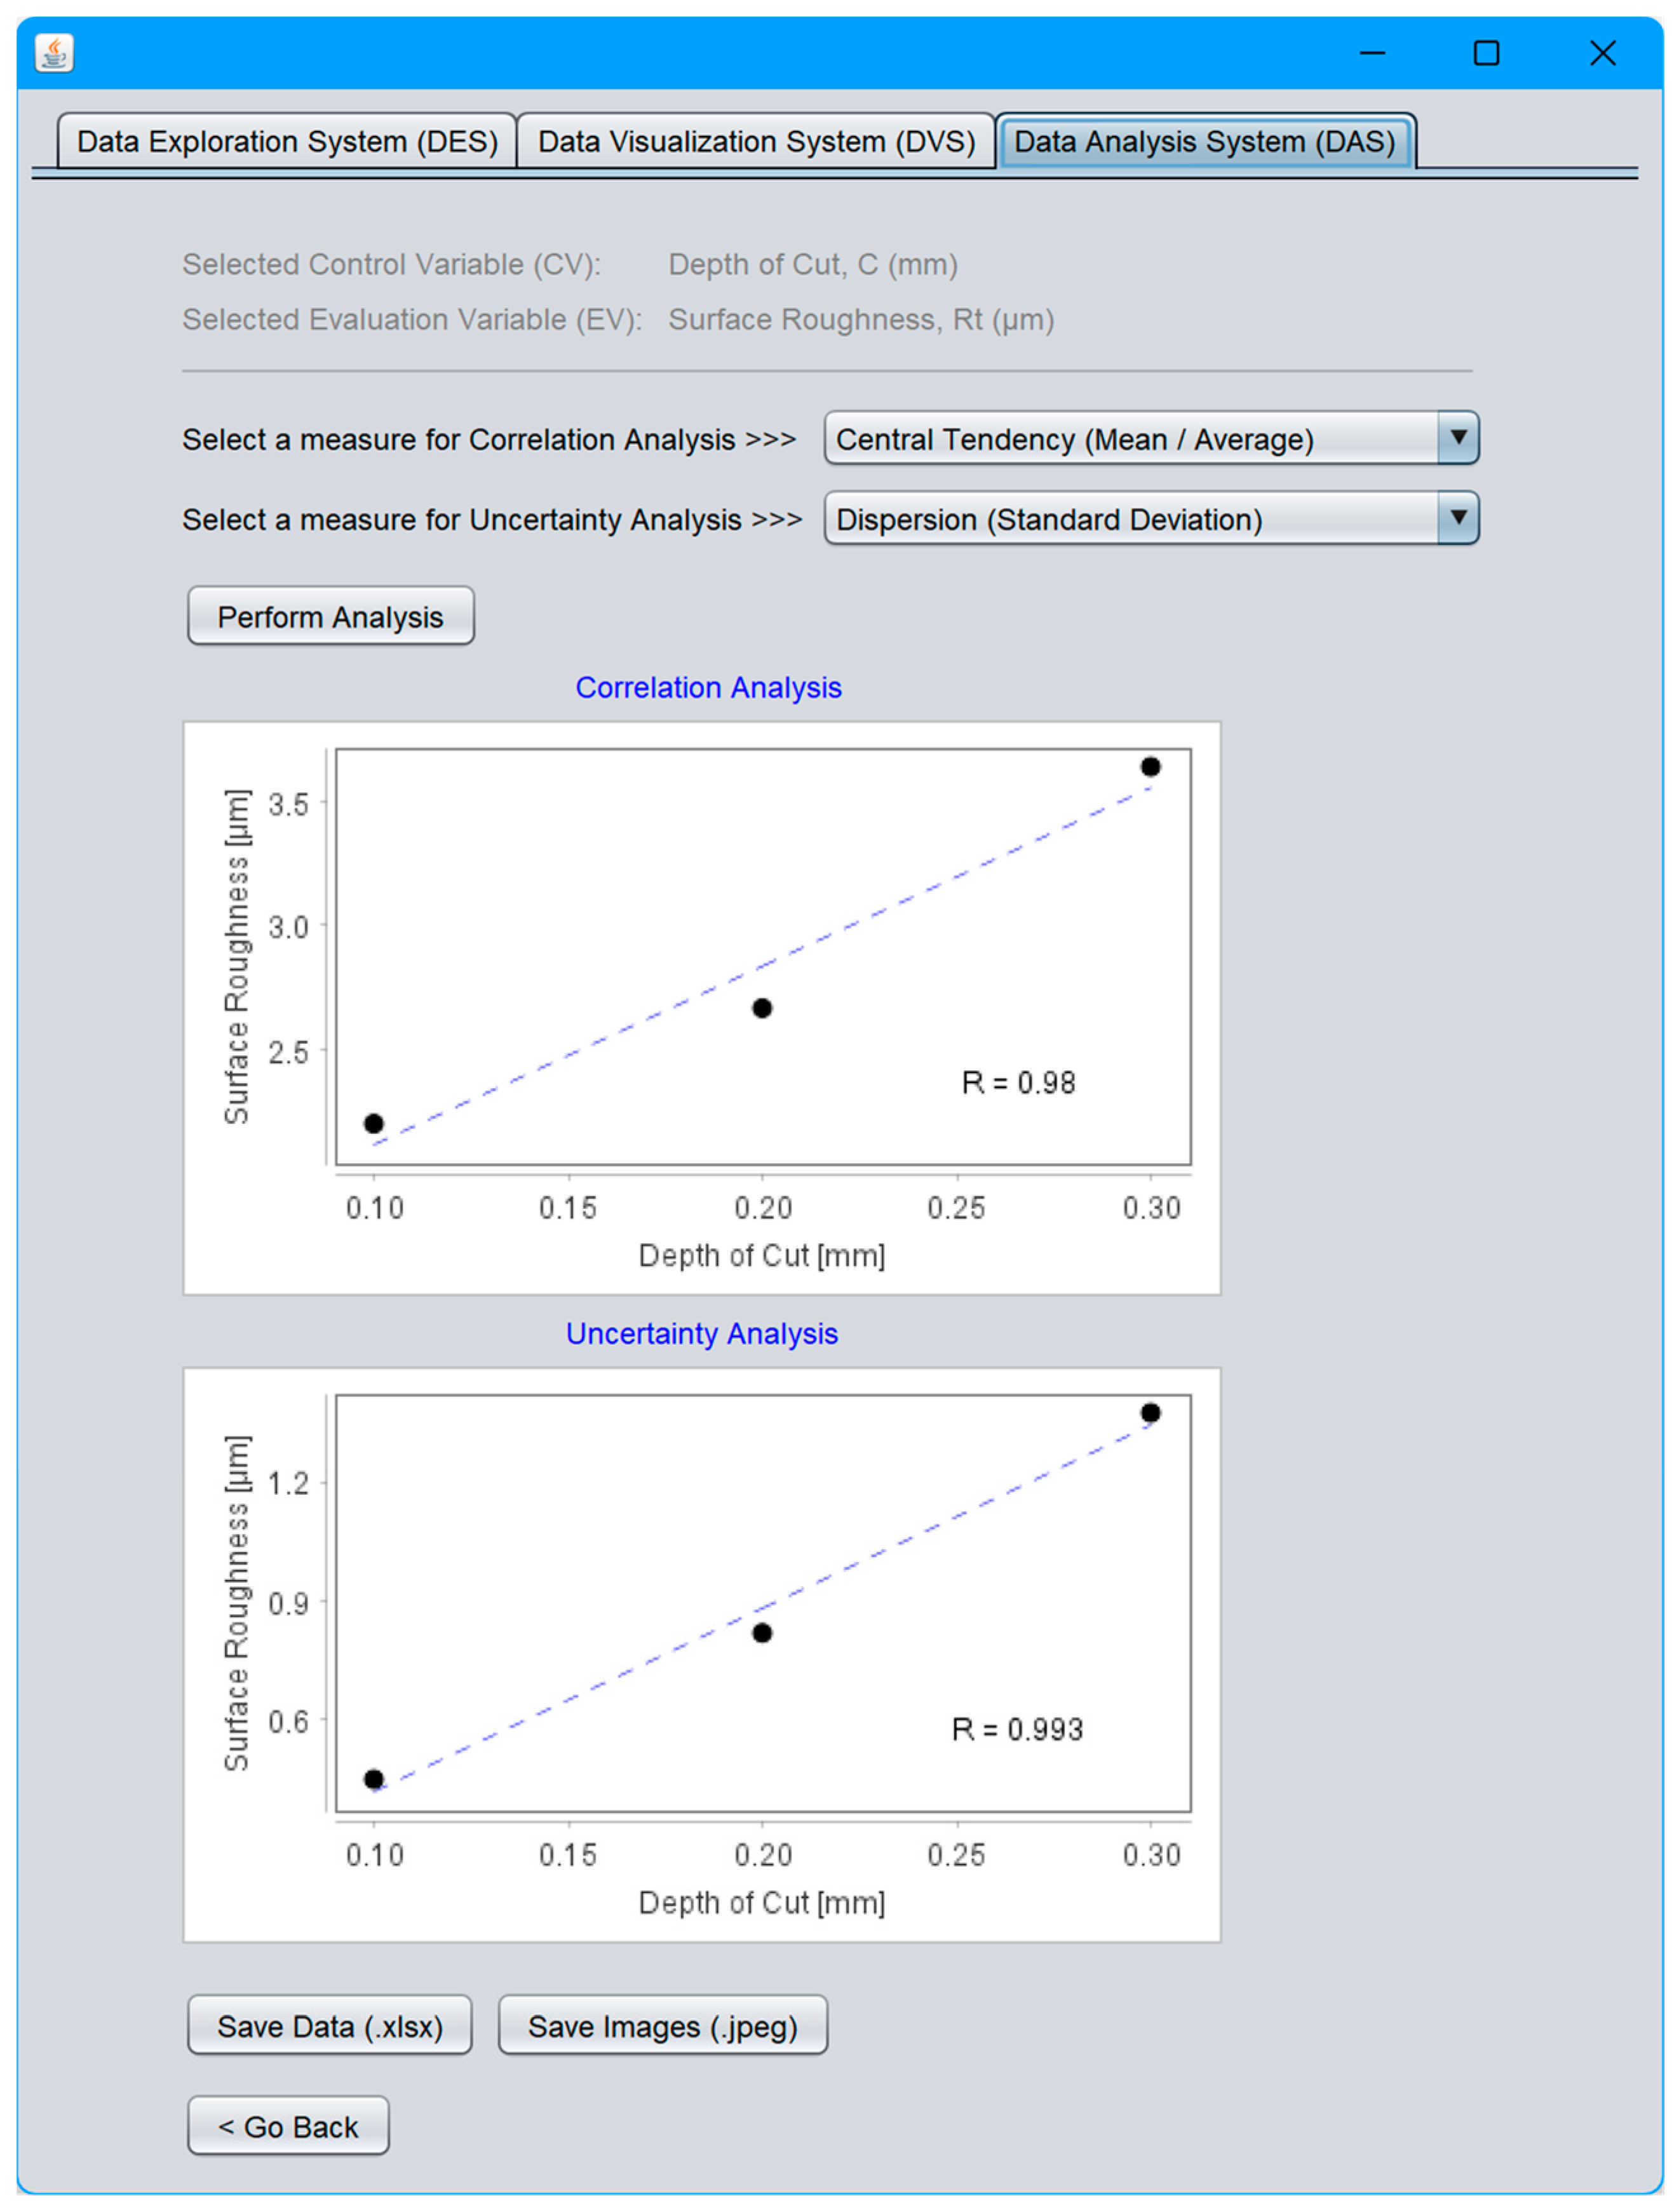
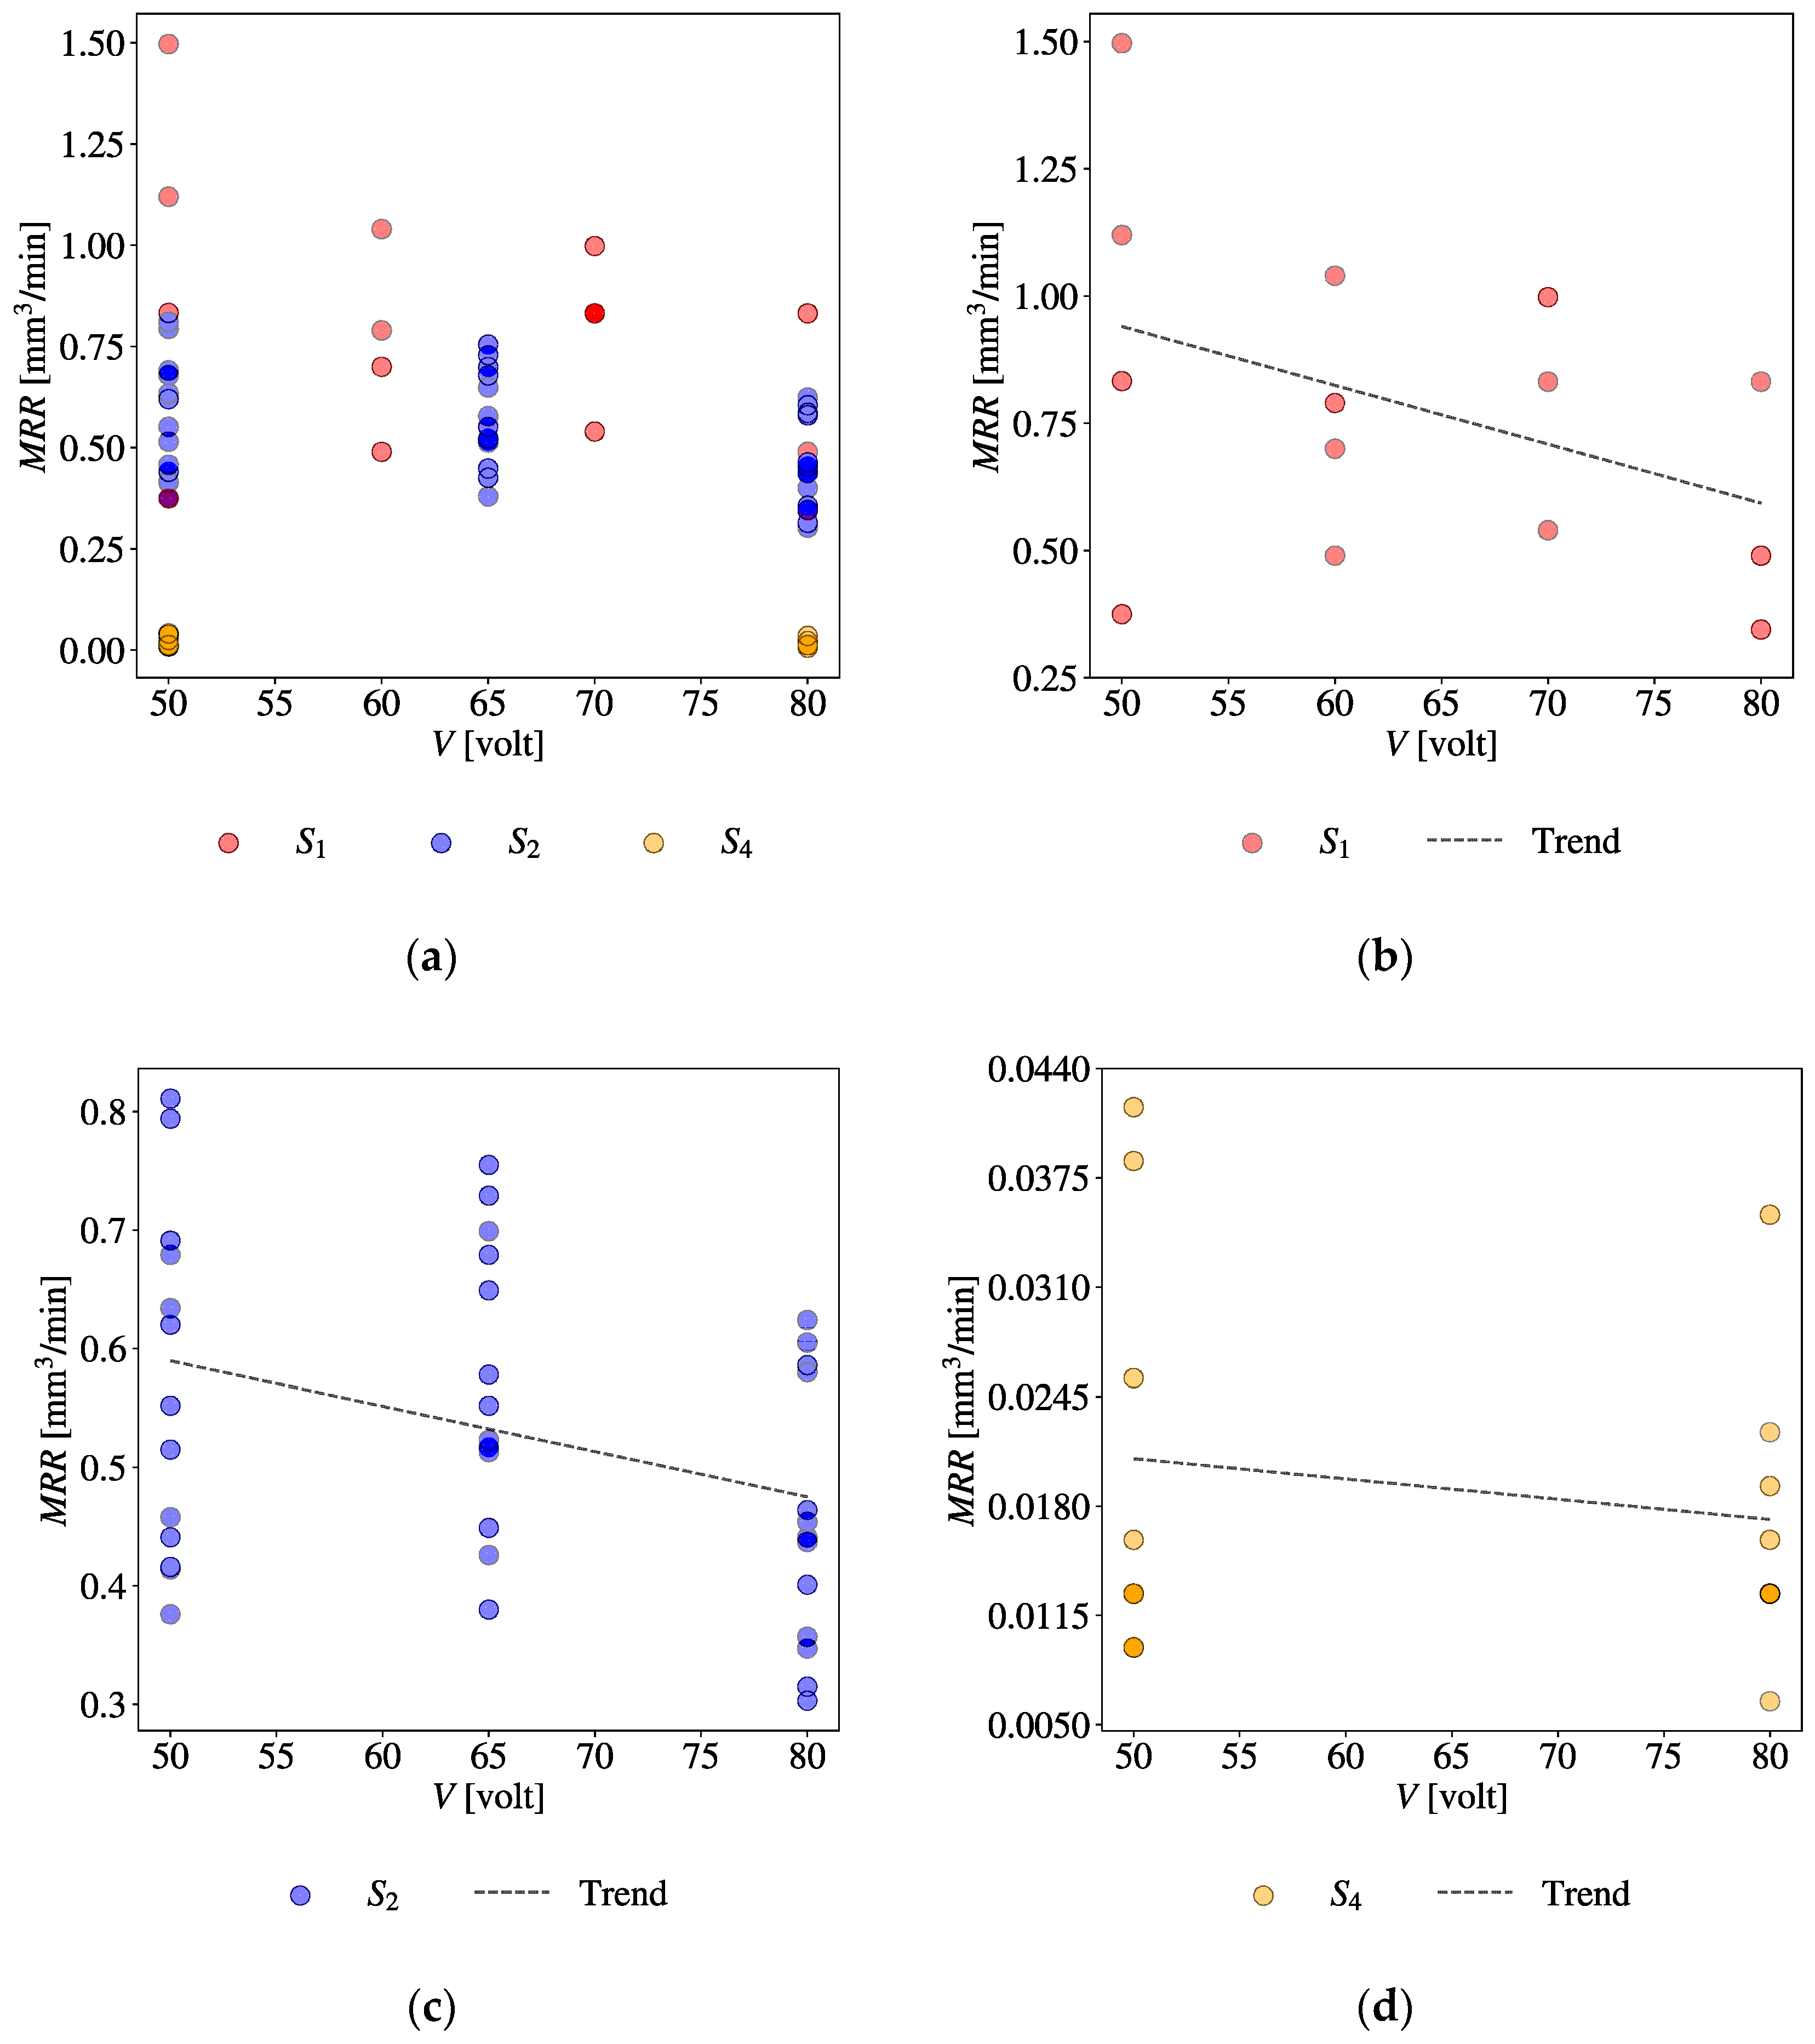
4.4. Data Analysis System (DAS)
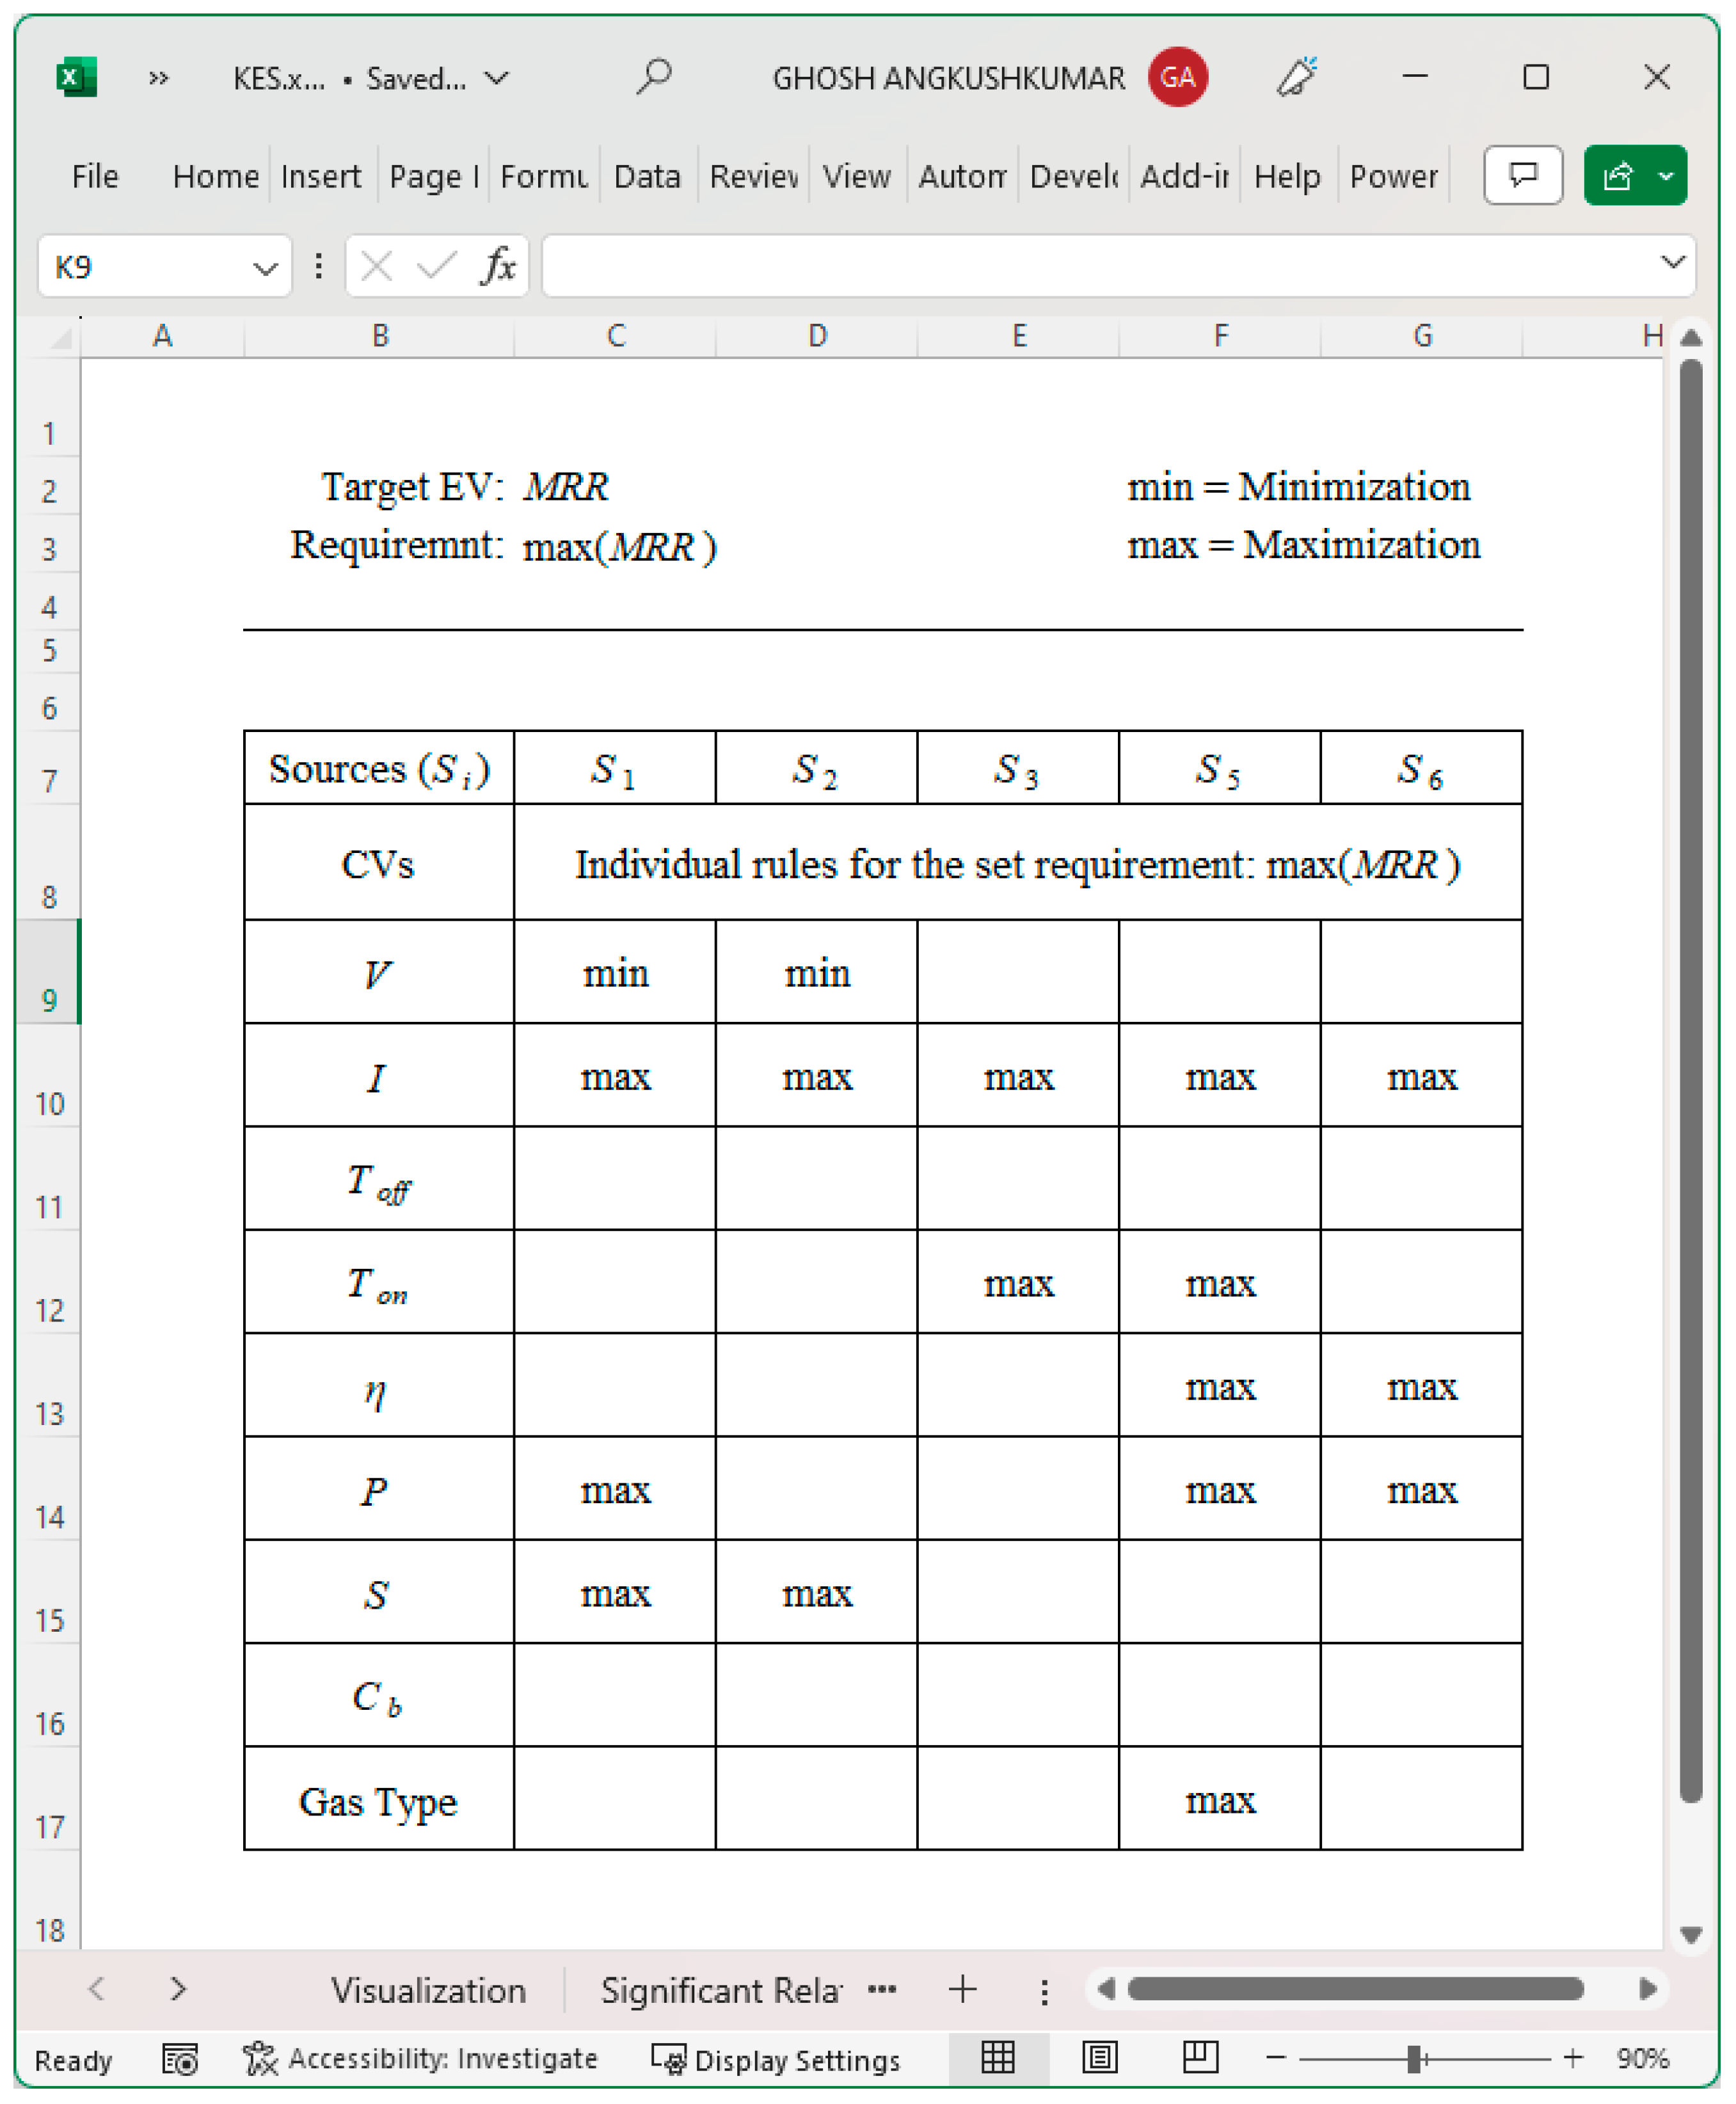
4.5. Knowledge Extraction System (KES)
5. Case Study
6. Conclusions
- Data Preparation System (DPS);
- Data Exploration System (DES);
- Data Visualization System (DVS);
- Data Analysis System (DAS);
- Knowledge Extraction System (KES).
Author Contributions
Funding
Data Availability Statement
Conflicts of Interest
References
- Diebold, F.X. On the Origin(s) and Development of the Term ‘Big Data’. SSRN Electron. J. 2012. [Google Scholar] [CrossRef]
- Shah, G.; Shah, A.; Shah, M. Panacea of challenges in real-world application of big data analytics in healthcare sector. J. Data Inf. Manag. 2019, 1, 107–116. [Google Scholar] [CrossRef]
- Hassani, H.; Huang, X.; Silva, E. Banking with blockchain-ed big data. J. Manag. Anal. 2018, 5, 256–275. [Google Scholar] [CrossRef]
- Hallur, G.G.; Prabhu, S.; Aslekar, A. Entertainment in Era of AI, Big Data & IoT. In Digital Entertainment; Das, S., Gochhait, S., Eds.; Springer Nature Singapore: Singapore, 2021; pp. 87–109. [Google Scholar] [CrossRef]
- Wang, Y. Big Opportunities and Big Concerns of Big Data in Education. TechTrends 2016, 60, 381–384. [Google Scholar] [CrossRef]
- Zhu, L.; Yu, F.R.; Wang, Y.; Ning, B.; Tang, T. Big Data Analytics in Intelligent Transportation Systems: A Survey. IEEE Trans. Intell. Transp. Syst. 2019, 20, 383–398. [Google Scholar] [CrossRef]
- Henke, N.; Bughin, J.; Chui, M.; Manyika, J.; Saleh, T.; Wiseman, B.; Sethupathy, G. The Age of Analytics: Competing in a Data-Driven World. December 2016. Available online: https://www.mckinsey.com/capabilities/quantumblack/our-insights/the-age-of-analytics-competing-in-a-data-driven-world (accessed on 15 July 2023).
- Yin, S.; Kaynak, O. Big Data for Modern Industry: Challenges and Trends [Point of View]. Proc. IEEE 2015, 103, 143–146. [Google Scholar] [CrossRef]
- Andre, L. 53 Important Statistics about How Much Data Is Created Every Day. Available online: https://financesonline.com/how-much-data-is-created-every-day/ (accessed on 15 July 2023).
- Sreenivasan, R.R. Characteristics of Big Data—A Delphi Study. Master’s Thesis, Memorial University of Newfoundland, St. John’s, NL, Canada, 2017. Available online: https://research.library.mun.ca/13080/ (accessed on 12 September 2022).
- Verevka, T.; Mirolyubov, A.; Makio, J. Opportunities and Barriers to Using Big Data Technologies in the Metallurgical Industry. In Innovations in Digital Economy; Rodionov, D., Kudryavtseva, T., Skhvediani, A., Berawi, M.A., Eds.; Springer International Publishing: Cham, Switzerland, 2021; pp. 86–102. [Google Scholar] [CrossRef]
- Fattahi, S.; Ullah, A.S. Optimization of Dry Electrical Discharge Machining of Stainless Steel using Big Data Analytics. Procedia CIRP 2022, 112, 316–321. [Google Scholar] [CrossRef]
- Chang, W. NIST Big Data Reference Architecture for Analytics and Beyond. In Proceedings of the10th International Conference on Utility and Cloud Computing, Austin, TX, USA, 5–8 December 2017; p. 3. [Google Scholar] [CrossRef]
- NIST Big Data Public Working Group. NIST Big Data Interoperability Framework: Volume 1, Definitions; NIST: Gaithersburg, MD, USA, October 2019. [CrossRef]
- NIST Big Data Public Working Group; Subgroup, T. NIST Big Data Interoperability Framework: Volume 2, Big Data Taxonomies; NIST: Gaithersburg, MD, USA, November 2019. [CrossRef]
- Chang, W.; Fox, G. NIST Big Data Interoperability Framework: Volume 3, Use Cases and General Requirements; NIST: Gaithersburg, MD, USA, October 2019. [CrossRef]
- Chang, W.; Roy, A.; Underwood, M. NIST Big Data Interoperability Framework: Volume 4, Security and Privacy; NIST: Gaithersburg, MD, USA, October 2019. [CrossRef]
- Chang, W.; Mishra, S. NIST Big Data Public Working Group. NIST Big Data Interoperability Framework: Volume 5, Architectures White Paper Survey; NIST: Gaithersburg, MD, USA, October 2015. [CrossRef]
- Chang, W.; Boyd, D.; Levin, O. NIST Big Data Interoperability Framework: Volume 6, Reference Architecture; NIST: Gaithersburg, MD, USA, October 2019. [CrossRef]
- Chang, W.; von Laszewski, G. NIST Big Data Interoperability Framework: Volume 8, Reference Architecture Interfaces; NIST: Gaithersburg, MD, USA, June 2018. [CrossRef]
- NIST Big Data Public Working Group. NIST Big Data Interoperability Framework: Volume 7, Standards Roadmap, Version 2; NIST: Gaithersburg, MD, USA, June 2018. [CrossRef]
- Chang, W.; Austin, C.C.; Reinsch, R. NIST Big Data Interoperability Framework: Volume 9, Adoption and Modernization; NIST: Gaithersburg, MD, USA, October 2019. [CrossRef]
- Farboodi, M.; Mihet, R.; Philippon, T.; Veldkamp, L. Big Data and Firm Dynamics. AEA Pap. Proc. 2019, 109, 38–42. [Google Scholar] [CrossRef]
- Cinnamon, J. Data inequalities and why they matter for development. Inf. Technol. Dev. 2020, 26, 214–233. [Google Scholar] [CrossRef]
- Qureshi, S. Overcoming Technological Determinism in Understanding the Digital Divide: Where Do We Go from Here? Inf. Technol. Dev. 2014, 20, 215–217. [Google Scholar] [CrossRef]
- Hilbert, M. Big Data for Development: A Review of Promises and Challenges. Dev. Policy Rev. 2016, 34, 135–174. [Google Scholar] [CrossRef]
- Favaretto, M.; De Clercq, E.; Elger, B.S. Big Data and discrimination: Perils, promises and solutions. A systematic review. J. Big Data 2019, 6, 12. [Google Scholar] [CrossRef]
- Shah, D.; Wang, J.; He, Q.P. Feature engineering in big data analytics for IoT-enabled smart manufacturing—Comparison between deep learning and statistical learning. Comput. Chem. Eng. 2020, 141, 106970. [Google Scholar] [CrossRef]
- Evans, P.C.; Annunziata, M. Industrial Internet: Pushing the Boundaries of Minds and Machines. January 2012. Available online: https://www.researchgate.net/publication/271524319_Industrial_Internet_Pushing_the_boundaries_of_minds_and_machines (accessed on 15 July 2023).
- Banerjee, A.G.; Beckmann, B.; Carbone, J.; DeRose, L.; Giani, A.; Koudal, P.; Mackenzie, P.; Salvo, J.; Yang, D.; Yund, W. Cloud Computing-Based Marketplace for Collaborative Design and Manufacturing. In Internet of Things. IoT Infrastructures; Mandler, B., Marquez-Barja, J., Campista, M.E.M., Cagáňová, D., Chaouchi, H., Zeadally, S., Badra, M., Giordano, S., Fazio, M., Somov, A., et al., Eds.; Springer International Publishing: Cham, Switzerland, 2016; pp. 409–418. [Google Scholar] [CrossRef]
- Wu, D.; Rosen, D.W.; Wang, L.; Schaefer, D. Cloud-based design and manufacturing: A new paradigm in digital manufacturing and design innovation. Comput. Des. 2015, 59, 1–14. [Google Scholar] [CrossRef]
- Beckmann, B.; Giani, A.; Carbone, J.; Koudal, P.; Salvo, J.; Barkley, J. Developing the Digital Manufacturing Commons: A National Initiative for US Manufacturing Innovation. Procedia Manuf. 2016, 5, 182–194. [Google Scholar] [CrossRef]
- Samimi, F.; Mckinley, P.; Sadjadi, S.; Tang, C.; Shapiro, J.; Zhou, Z. Service Clouds: Distributed Infrastructure for Adaptive Communication Services. IEEE Trans. Netw. Serv. Manag. 2007, 4, 84–95. [Google Scholar] [CrossRef]
- Bi, Z.; Jin, Y.; Maropoulos, P.; Zhang, W.-J.; Wang, L. Internet of things (IoT) and big data analytics (BDA) for digital manufacturing (DM). Int. J. Prod. Res. 2021, 61, 4004–4021. [Google Scholar] [CrossRef]
- Wang, J.; Xu, C.; Zhang, J.; Zhong, R. Big data analytics for intelligent manufacturing systems: A review. J. Manuf. Syst. 2022, 62, 738–752. [Google Scholar] [CrossRef]
- Kahveci, S.; Alkan, B.; Ahmad, M.H.; Ahmad, B.; Harrison, R. An end-to-end big data analytics platform for IoT-enabled smart factories: A case study of battery module assembly system for electric vehicles. J. Manuf. Syst. 2022, 63, 214–223. [Google Scholar] [CrossRef]
- Fattahi, S.; Ura, S.; Noor-E-Alam, M. Decision-Making Using Big Data Relevant to Sustainable Development Goals (SDGs). Big Data Cogn. Comput. 2022, 6, 64. [Google Scholar] [CrossRef]
- Chen, T.; Wang, Y.-C. Hybrid big data analytics and Industry 4.0 approach to projecting cycle time ranges. Int. J. Adv. Manuf. Technol. 2022, 120, 279–295. [Google Scholar] [CrossRef]
- Woo, J.; Shin, S.-J.; Seo, W.; Meilanitasari, P. Developing a big data analytics platform for manufacturing systems: Architecture, method, and implementation. Int. J. Adv. Manuf. Technol. 2018, 99, 2193–2217. [Google Scholar] [CrossRef]
- Bonnard, R.; Arantes, M.D.S.; Lorbieski, R.; Vieira, K.M.M.; Nunes, M.C. Big data/analytics platform for Industry 4.0 implementation in advanced manufacturing context. Int. J. Adv. Manuf. Technol. 2021, 117, 1959–1973. [Google Scholar] [CrossRef]
- Kozjek, D.; Vrabič, R.; Rihtaršič, B.; Lavrač, N.; Butala, P. Advancing manufacturing systems with big-data analytics: A conceptual framework. Int. J. Comput. Integr. Manuf. 2020, 33, 169–188. [Google Scholar] [CrossRef]
- Jun, C.; Lee, J.Y.; Kim, B.H. Cloud-based big data analytics platform using algorithm templates for the manufacturing industry. Int. J. Comput. Integr. Manuf. 2019, 32, 723–738. [Google Scholar] [CrossRef]
- Dubey, R.; Gunasekaran, A.; Childe, S.J.; Bryde, D.J.; Giannakis, M.; Foropon, C.; Roubaud, D.; Hazen, B.T. Big data analytics and artificial intelligence pathway to operational performance under the effects of entrepreneurial orientation and environmental dynamism: A study of manufacturing organisations. Int. J. Prod. Econ. 2020, 226, 107599. [Google Scholar] [CrossRef]
- Zhang, C.; Wang, Z.; Ding, K.; Chan, F.T.S.; Ji, W. An energy-aware cyber physical system for energy Big data analysis and recessive production anomalies detection in discrete manufacturing workshops. Int. J. Prod. Res. 2020, 58, 7059–7077. [Google Scholar] [CrossRef]
- Zhong, R.Y.; Newman, S.T.; Huang, G.Q.; Lan, S. Big Data for supply chain management in the service and manufacturing sectors: Challenges, opportunities, and future perspectives. Comput. Ind. Eng. 2016, 101, 572–591. [Google Scholar] [CrossRef]
- Zhong, R.Y.; Xu, C.; Chen, C.; Huang, G.Q. Big Data Analytics for Physical Internet-based intelligent manufacturing shop floors. Int. J. Prod. Res. 2017, 55, 2610–2621. [Google Scholar] [CrossRef]
- Zhang, Y.; Ren, S.; Liu, Y.; Si, S. A big data analytics architecture for cleaner manufacturing and maintenance processes of complex products. J. Clean. Prod. 2017, 142, 626–641. [Google Scholar] [CrossRef]
- Lu, Y.; Xu, X. Cloud-based manufacturing equipment and big data analytics to enable on-demand manufacturing services. Robot. Comput. Integr. Manuf. 2019, 57, 92–102. [Google Scholar] [CrossRef]
- Ji, W.; Wang, L. Big data analytics based fault prediction for shop floor scheduling. J. Manuf. Syst. 2017, 43, 187–194. [Google Scholar] [CrossRef]
- Liang, Y.C.; Lu, X.; Li, W.D.; Wang, S. Cyber Physical System and Big Data enabled energy efficient machining optimisation. J. Clean. Prod. 2018, 187, 46–62. [Google Scholar] [CrossRef]
- Ji, W.; Yin, S.; Wang, L. A big data analytics based machining optimisation approach. J. Intell. Manuf. 2019, 30, 1483–1495. [Google Scholar] [CrossRef]
- Chen, C.C.; Hung, M.H.; Suryajaya, B.; Lin, Y.C.; Yang, H.C.; Huang, H.C.; Cheng, F.T. A Novel Efficient Big Data Processing Scheme for Feature Extraction in Electrical Discharge Machining. IEEE Robot. Autom. Lett. 2019, 4, 910–917. [Google Scholar] [CrossRef]
- Fattahi, S.; Okamoto, T.; Ura, S. Preparing Datasets of Surface Roughness for Constructing Big Data from the Context of Smart Manufacturing and Cognitive Computing. Big Data Cogn. Comput. 2021, 5, 58. [Google Scholar] [CrossRef]
- Li, C.; Chen, Y.; Shang, Y. A review of industrial big data for decision making in intelligent manufacturing. Eng. Sci. Technol. Int. J. 2022, 29, 101021. [Google Scholar] [CrossRef]
- Nasir, V.; Sassani, F. A review on deep learning in machining and tool monitoring: Methods, opportunities, and challenges. Int. J. Adv. Manuf. Technol. 2021, 115, 2683–2709. [Google Scholar] [CrossRef]
- Hildebrandt, M.; Koops, B.-J. The Challenges of Ambient Law and Legal Protection in the Profiling Era. Mod. Law Rev. 2010, 73, 428–460. Available online: http://www.jstor.org/stable/40660735 (accessed on 15 July 2023). [CrossRef]
- Emmert-Streib, F.; Yli-Harja, O.; Dehmer, M. Artificial Intelligence: A Clarification of Misconceptions, Myths and Desired Status. Front. Artif. Intell. 2020, 3, 524339. [Google Scholar] [CrossRef]
- Bzdok, D.; Altman, N.; Krzywinski, M. Statistics versus machine learning. Nat. Methods 2018, 15, 233–234. [Google Scholar] [CrossRef] [PubMed]
- Citron, D.K.; Pasquale, F.A. The Scored Society: Due Process for Automated Predictions. Washingt. Law Rev. 2014, 89, 1. [Google Scholar]
- d’Alessandro, B.; O’Neil, C.; LaGatta, T. Conscientious Classification: A Data Scientist’s Guide to Discrimination-Aware Classification. Big Data 2017, 5, 120–134. [Google Scholar] [CrossRef]
- Leese, M. The new profiling: Algorithms, black boxes, and the failure of anti-discriminatory safeguards in the European Union. Secur. Dialogue 2014, 45, 494–511. [Google Scholar] [CrossRef]
- Ullah, A.S.; Harib, K.H. A human-assisted knowledge extraction method for machining operations. Adv. Eng. Inform. 2006, 20, 335–350. [Google Scholar] [CrossRef]
- Ullah, A.M.M.S.; Shamsuzzaman, M. Fuzzy Monte Carlo Simulation using point-cloud-based probability–possibility transformation. Simulation 2013, 89, 860–875. [Google Scholar] [CrossRef]
- Puthumana, G.; Joshi, S.S. Investigations into performance of dry EDM using slotted electrodes. Int. J. Precis. Eng. Manuf. 2011, 12, 957–963. [Google Scholar] [CrossRef]
- Govindan, P.; Joshi, S.S. Experimental characterization of material removal in dry electrical discharge drilling. Int. J. Mach. Tools Manuf. 2010, 50, 431–443. [Google Scholar] [CrossRef]
- Murickan, R.T.; Jakkamputi, L.P.; Kuppan, P. Experimental Investigation of Dry Electrical Discharge Machining on SS 316L. Int. J. Latest Trends Eng. Technol. 2013, 2, 100–107. Available online: http://www.ijltet.org/wp-content/uploads/2013/06/14.pdf (accessed on 15 July 2023).
- Puthumana, G.; Agarwal, R.; Joshi, S.S. Experimental Investigation on Dry Electrical Discharge Machining Using Helium Gas. In Proceedings of the 3rd International & 24th AIMTDR (All India Manufacturing Technology, Design and Research), Visakhapatnam, India, 13–15 December 2010; Available online: https://backend.orbit.dtu.dk/ws/portalfiles/portal/123939189/AIMTDR2010.pdf (accessed on 15 July 2023).
- Fattahi, S.; Baseri, H. Analysis of dry electrical discharge machining in different dielectric mediums. Proc. Inst. Mech. Eng. Part E J. Process Mech. Eng. 2017, 231, 497–512. [Google Scholar] [CrossRef]
- Fattahi, S.; Shyha, I.; Baseri, H. Optimisation of Dry Electrical Discharge Machining of High Speed Steel using Grey-Relational Analysis. Int. J. Robot. Mechatron. 2015, 2, 132–139. [Google Scholar] [CrossRef]
- Ghosh, A.K.; Ullah, A.M.S.; Teti, R.; Kubo, A. Developing sensor signal-based digital twins for intelligent machine tools. J. Ind. Inf. Integr. 2021, 24, 100242. [Google Scholar] [CrossRef]
- Leng, J.; Ruan, G.; Jiang, P.; Xu, K.; Liu, Q.; Zhou, X.; Liu, C. Blockchain-empowered sustainable manufacturing and product lifecycle management in industry 4.0: A survey. Renew. Sustain. Energy Rev. 2020, 132, 110112. [Google Scholar] [CrossRef]


| Source (Si) | Control Variable (CVj=1, …, m) | Evaluation Variable (EVk=1, …, n) | Datasets ) | ||
|---|---|---|---|---|---|
| j | CVj | k | EVk | ||
| S1 [64] | 1 2 3 4 5 | Gap Voltage Current Pulse Off Time Gas Pressure Rotational Speed | 1 2 3 4 | Material Removal Rate Tool Wear Rate Radial Over Cut Depth Achieved | 20 |
| S2 [65] | 1 2 3 4 5 6 | Gap Voltage Current Pulse Off Time Gas Pressure Rotational Speed Shielding Clearance | 1 2 3 4 5 | Material Removal Rate Tool Wear Rate Oversize (entry of hole) Oversize (50% of hole depth) Oversize (90% of hole depth) | 30 |
| S3 [66] | 1 2 3 4 | Current Pulse On Time Duty Factor Rotational Speed | 1 2 | Material Removal Rate Tool Wear Rate | 8 |
| S4 [67] | 1 2 3 4 5 6 | Gap Voltage Current Pulse Off Time Gas Pressure Rotational Speed Shielding Clearance | 1 2 3 4 | Material Removal Rate Tool Wear Rate Oversize Depth Achieved | 24 |
| S5 [68] | 1 2 3 4 5 6 | Current Pulse On Time Duty Factor Gas Pressure Rotational Speed Gas Type | 1 2 3 | Material Removal Rate Surface Roughness Radial Over Cut | 18 |
| S6 [69] | 1 2 3 4 5 | Current Pulse On Time Duty Factor Gas Pressure Rotational Speed | 1 2 3 | Material Removal Rate Surface Roughness Radial Over Cut | 15 |
| Total number of CV–EV-centric datasets | 115 | ||||
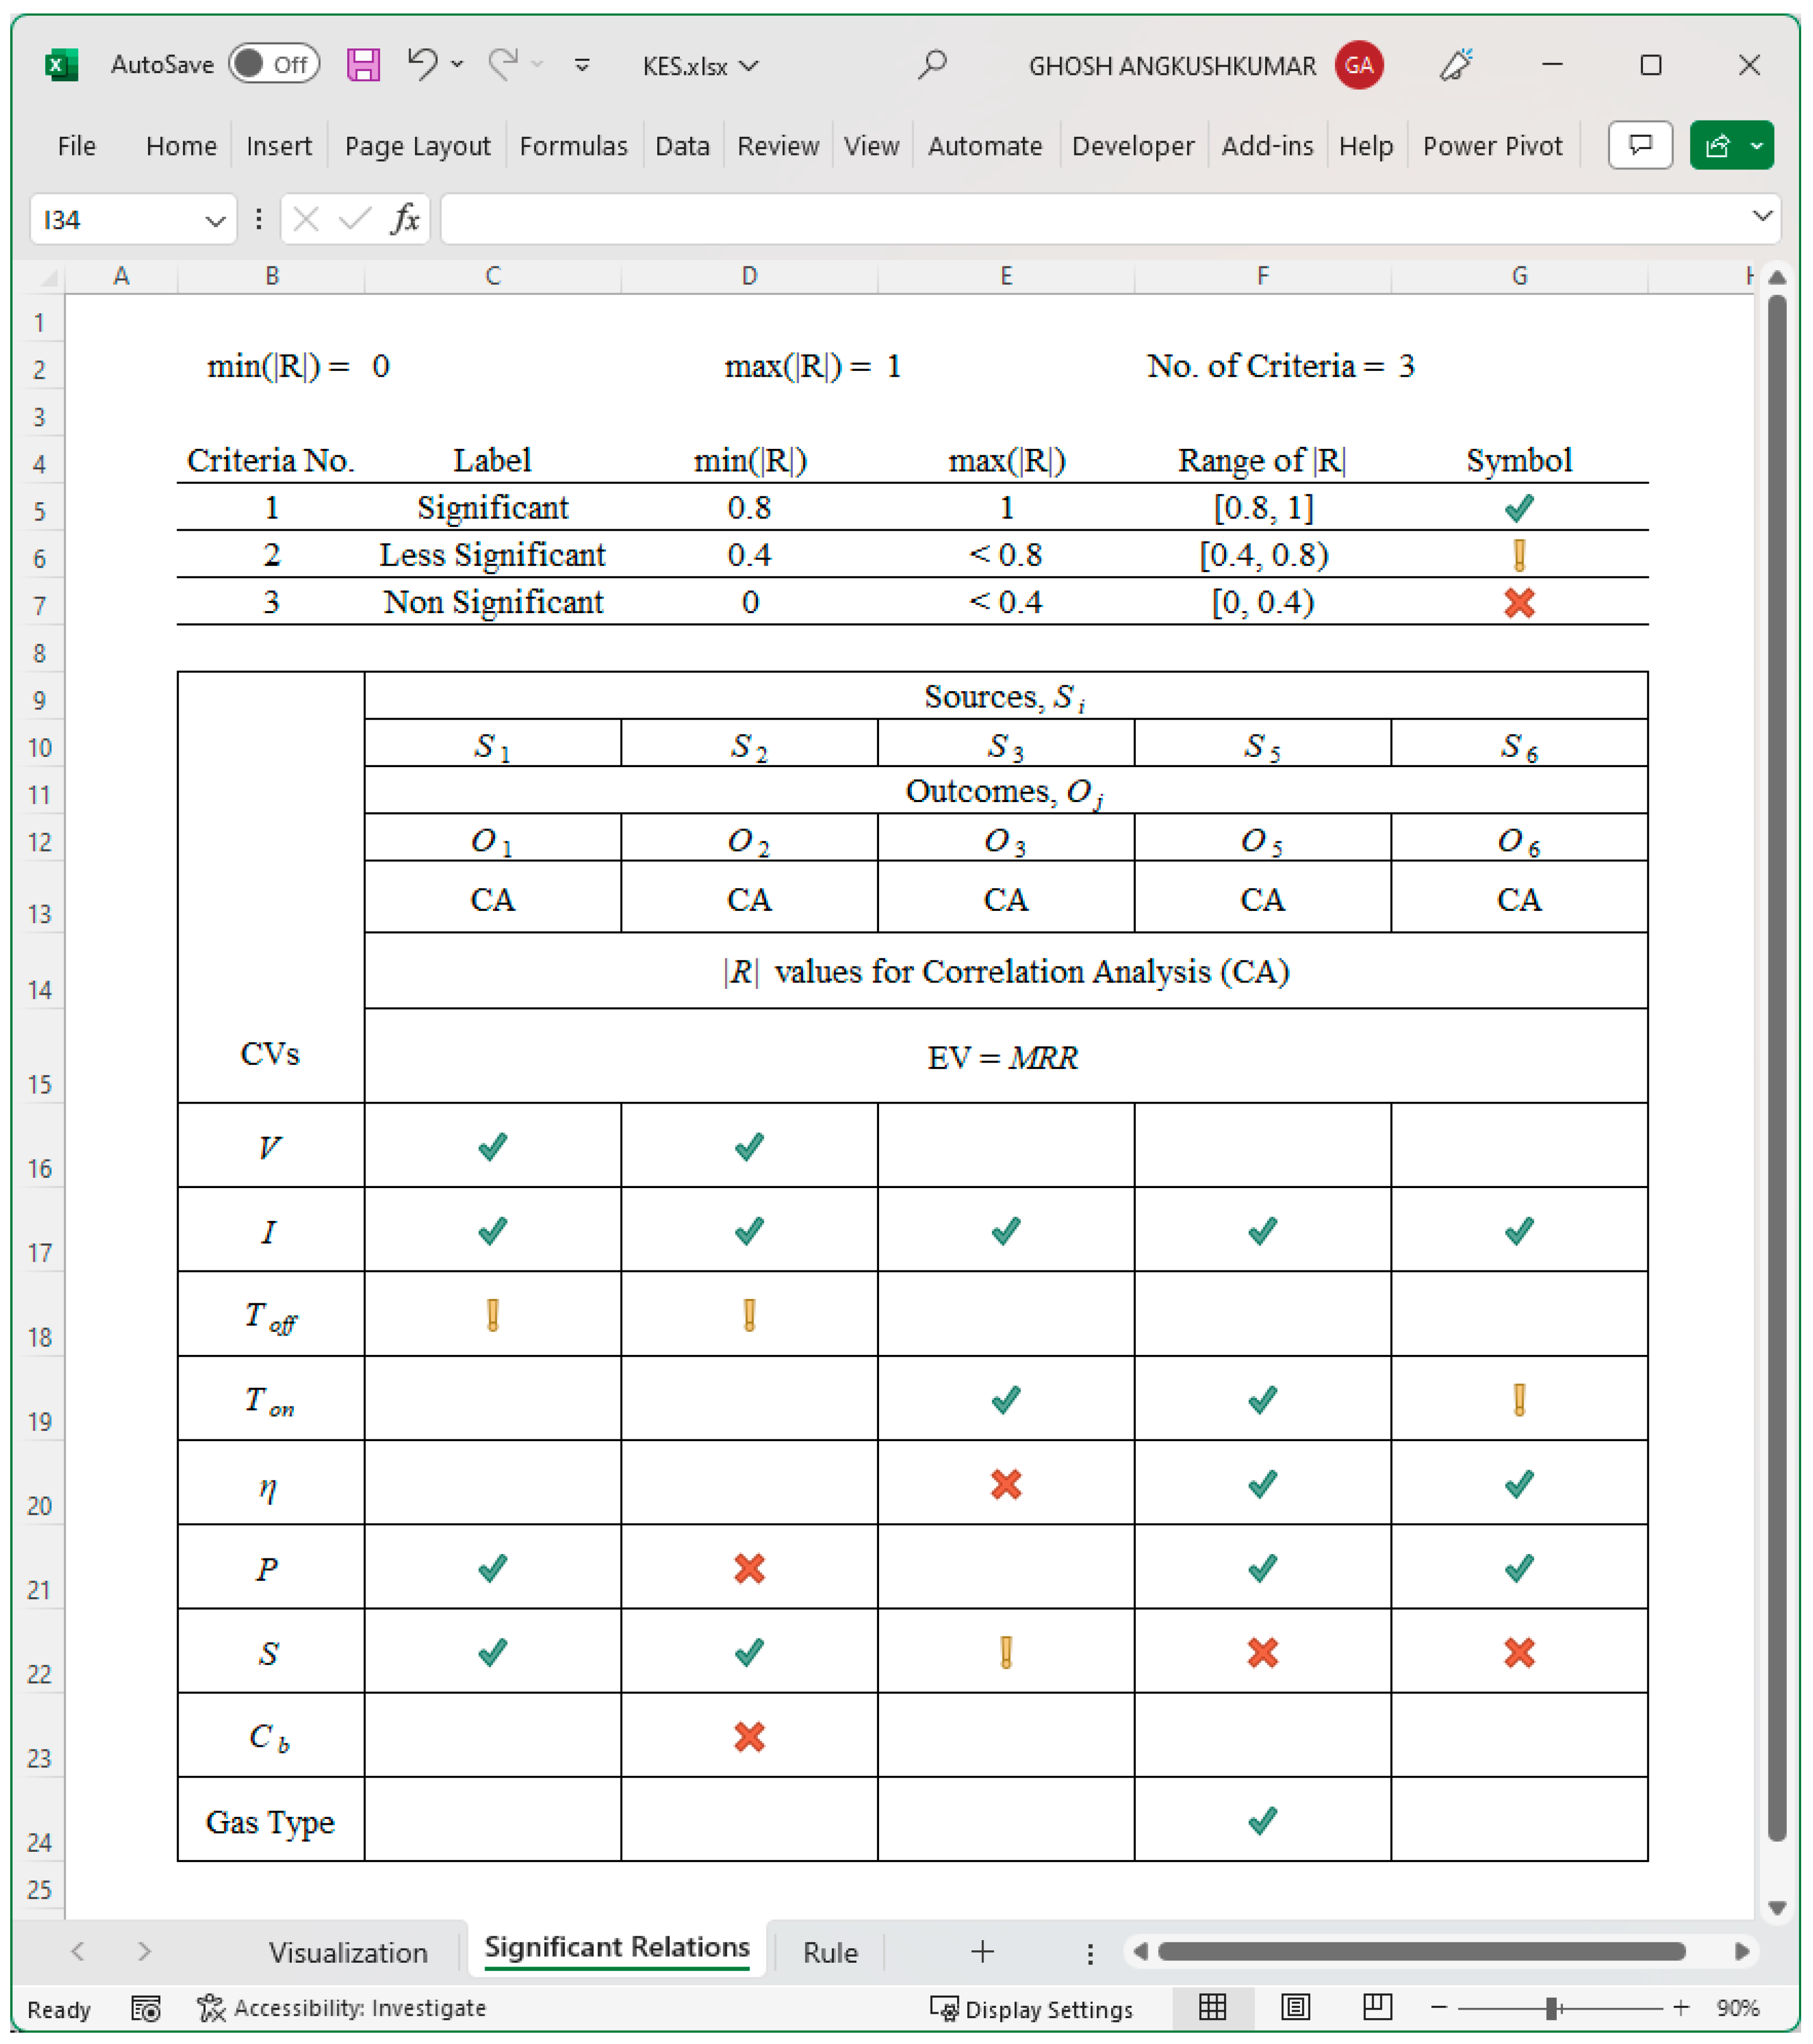
| CVs | Sources, Si | |||||||||
| S1 | S2 | S3 | S5 | S6 | ||||||
| Outcomes, Oj | ||||||||||
| O1 | O2 | O3 | O5 | O6 | ||||||
| CA | UA | CA | UA | CA | UA | CA | UA | CA | UA | |
| R-values for Correlation Analysis (CA) and Uncertainty Analysis (UA) | ||||||||||
| EV = MRR | ||||||||||
| V | −0.904 | −0.75 | −0.852 | −0.957 | ||||||
| I | 0.996 | 0.917 | 0.997 | 0.993 | 0.989 | 0.195 | 0.999 | 0.972 | 0.995 | 0.998 |
| Toff | −0.653 | −0.69 | −0.661 | −0.754 | ||||||
| Ton | 0.989 | 0.071 | 0.978 | 0.993 | 0.523 | 0.593 | ||||
| η | 0.222 | 0.181 | 0.986 | 0.99 | 0.944 | 0.987 | ||||
| P | 0.93 | 0.926 | 0.369 | 0.965 | 0.902 | 0.863 | 0.996 | 0.798 | ||
| S | 0.993 | 0.826 | 1 | 0.957 | 0.707 | −0.009 | −0.419 | −0.691 | 0.265 | 0.452 |
| Cb | −0.397 | 0.585 | ||||||||
| Gas Type | 0.934 | 0.967 | ||||||||
| Si | Rk | Rules |
|---|---|---|
| S1 | R1 | |
| S2 | R2 | |
| S3 | R3 | |
| S5 | R5 | |
| S6 | R6 |
| Si | Rk | MRR′ (mm3/min) | MRR″ (mm3/min) |
|---|---|---|---|
| S1 | R1 | 1.497 | 1.497 |
| S2 | R2 | 0.811 | 0.811 |
| S3 | R3 | No conclusion | 9.9425 |
| S5 | R5 | No conclusion | 3.77 |
| S6 | R6 | 5.31 | 5.31 |
Disclaimer/Publisher’s Note: The statements, opinions and data contained in all publications are solely those of the individual author(s) and contributor(s) and not of MDPI and/or the editor(s). MDPI and/or the editor(s) disclaim responsibility for any injury to people or property resulting from any ideas, methods, instructions or products referred to in the content. |
© 2023 by the authors. Licensee MDPI, Basel, Switzerland. This article is an open access article distributed under the terms and conditions of the Creative Commons Attribution (CC BY) license (https://creativecommons.org/licenses/by/4.0/).
Share and Cite
Ghosh, A.K.; Fattahi, S.; Ura, S. Towards Developing Big Data Analytics for Machining Decision-Making. J. Manuf. Mater. Process. 2023, 7, 159. https://doi.org/10.3390/jmmp7050159
Ghosh AK, Fattahi S, Ura S. Towards Developing Big Data Analytics for Machining Decision-Making. Journal of Manufacturing and Materials Processing. 2023; 7(5):159. https://doi.org/10.3390/jmmp7050159
Chicago/Turabian StyleGhosh, Angkush Kumar, Saman Fattahi, and Sharifu Ura. 2023. "Towards Developing Big Data Analytics for Machining Decision-Making" Journal of Manufacturing and Materials Processing 7, no. 5: 159. https://doi.org/10.3390/jmmp7050159
APA StyleGhosh, A. K., Fattahi, S., & Ura, S. (2023). Towards Developing Big Data Analytics for Machining Decision-Making. Journal of Manufacturing and Materials Processing, 7(5), 159. https://doi.org/10.3390/jmmp7050159