An Assessment of Thermoset Injection Molding for Thin-Walled Conformal Encapsulation of Board-Level Electronic Packages

 , , and
Abstract
:1. Introduction
2. Materials and Methods
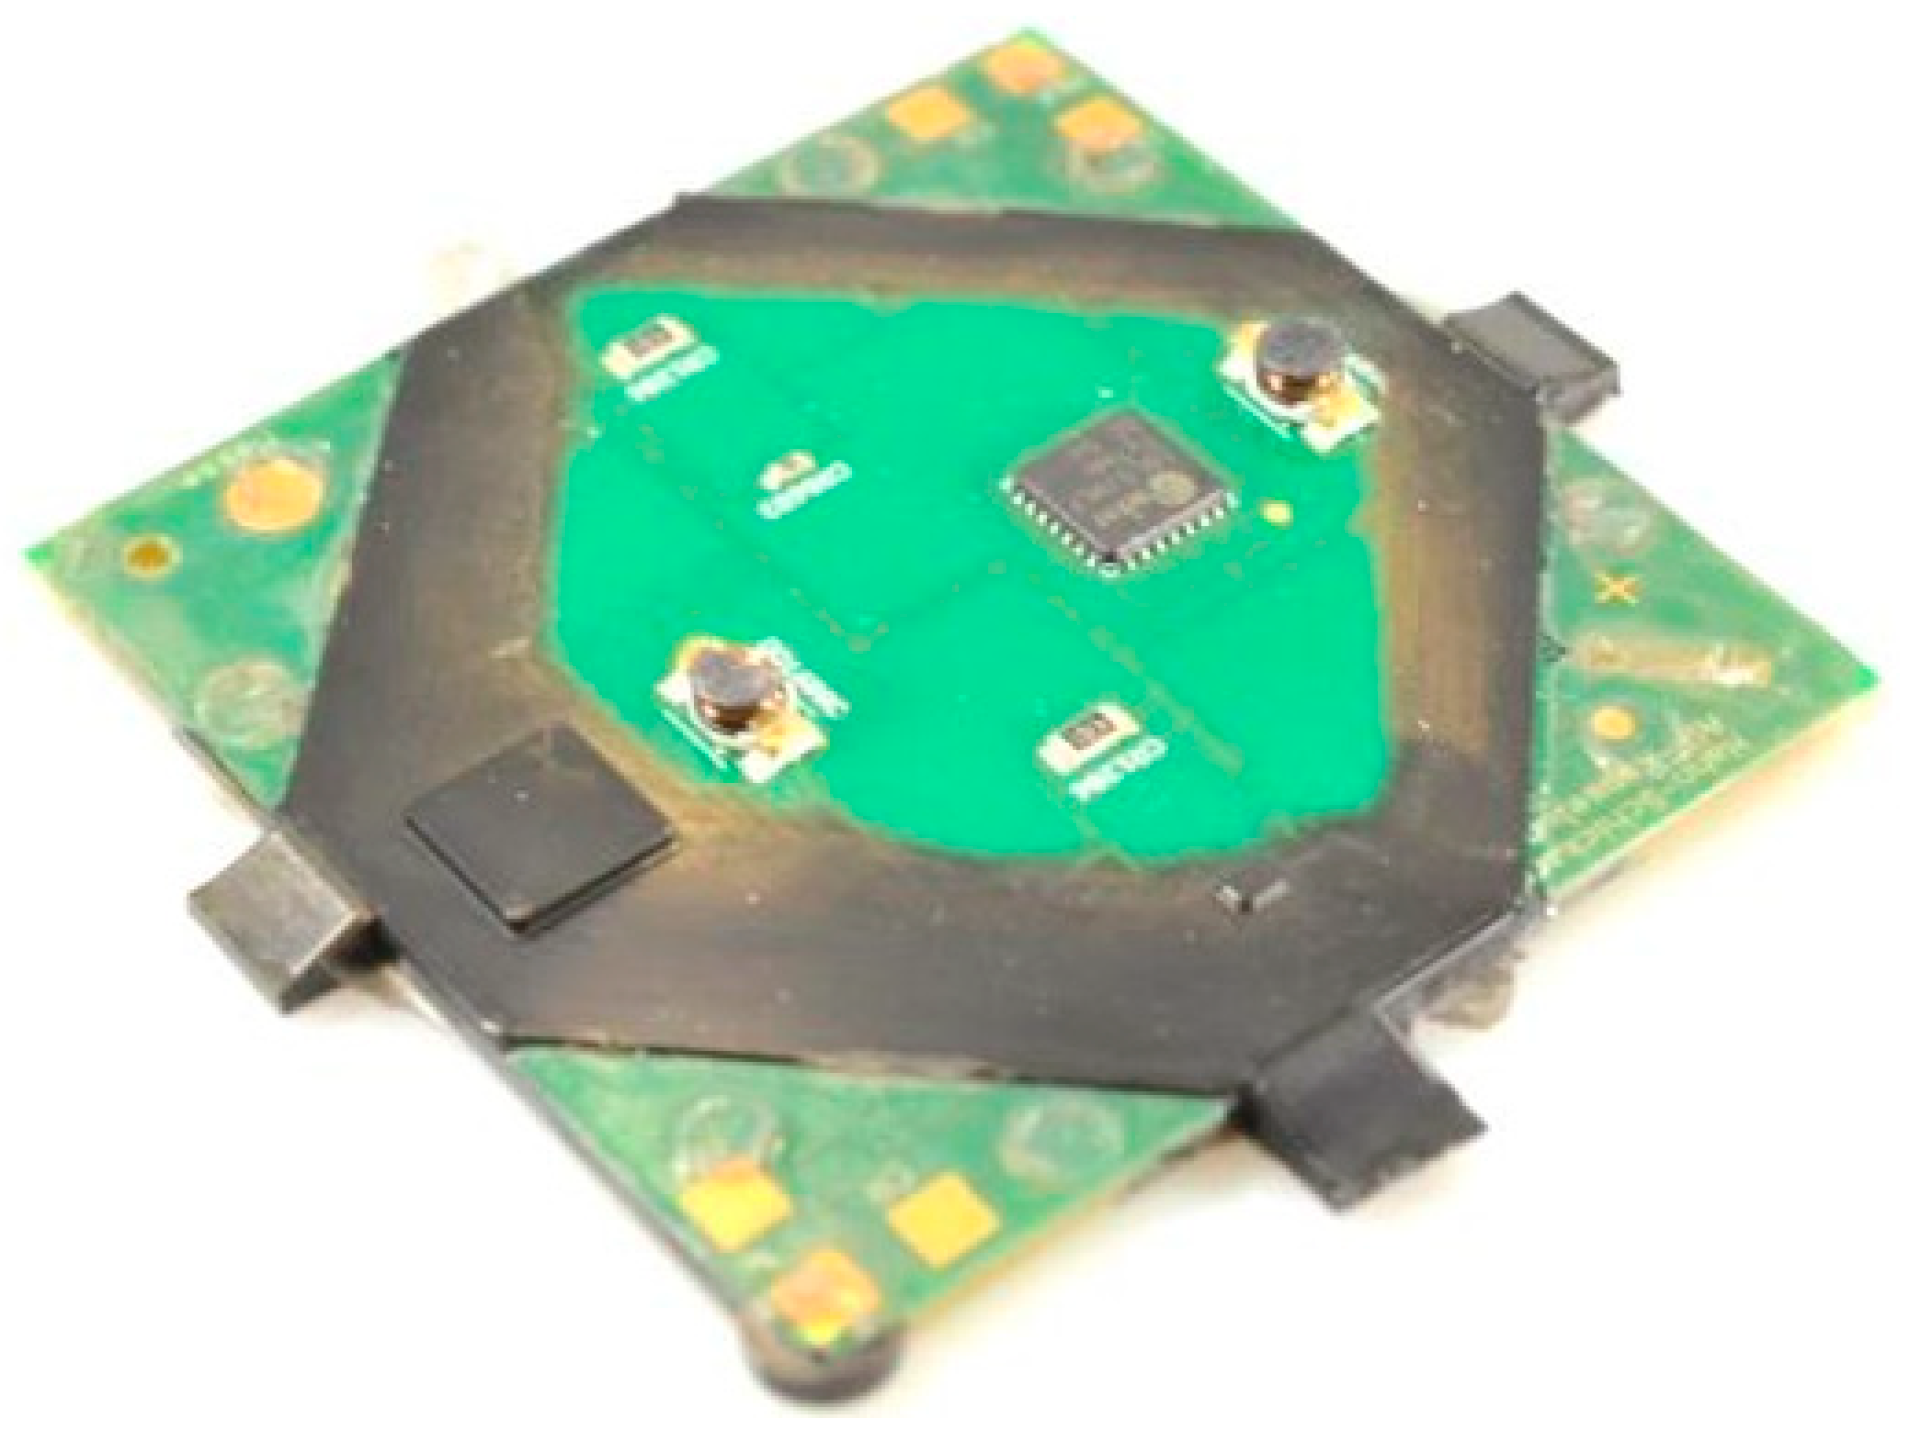
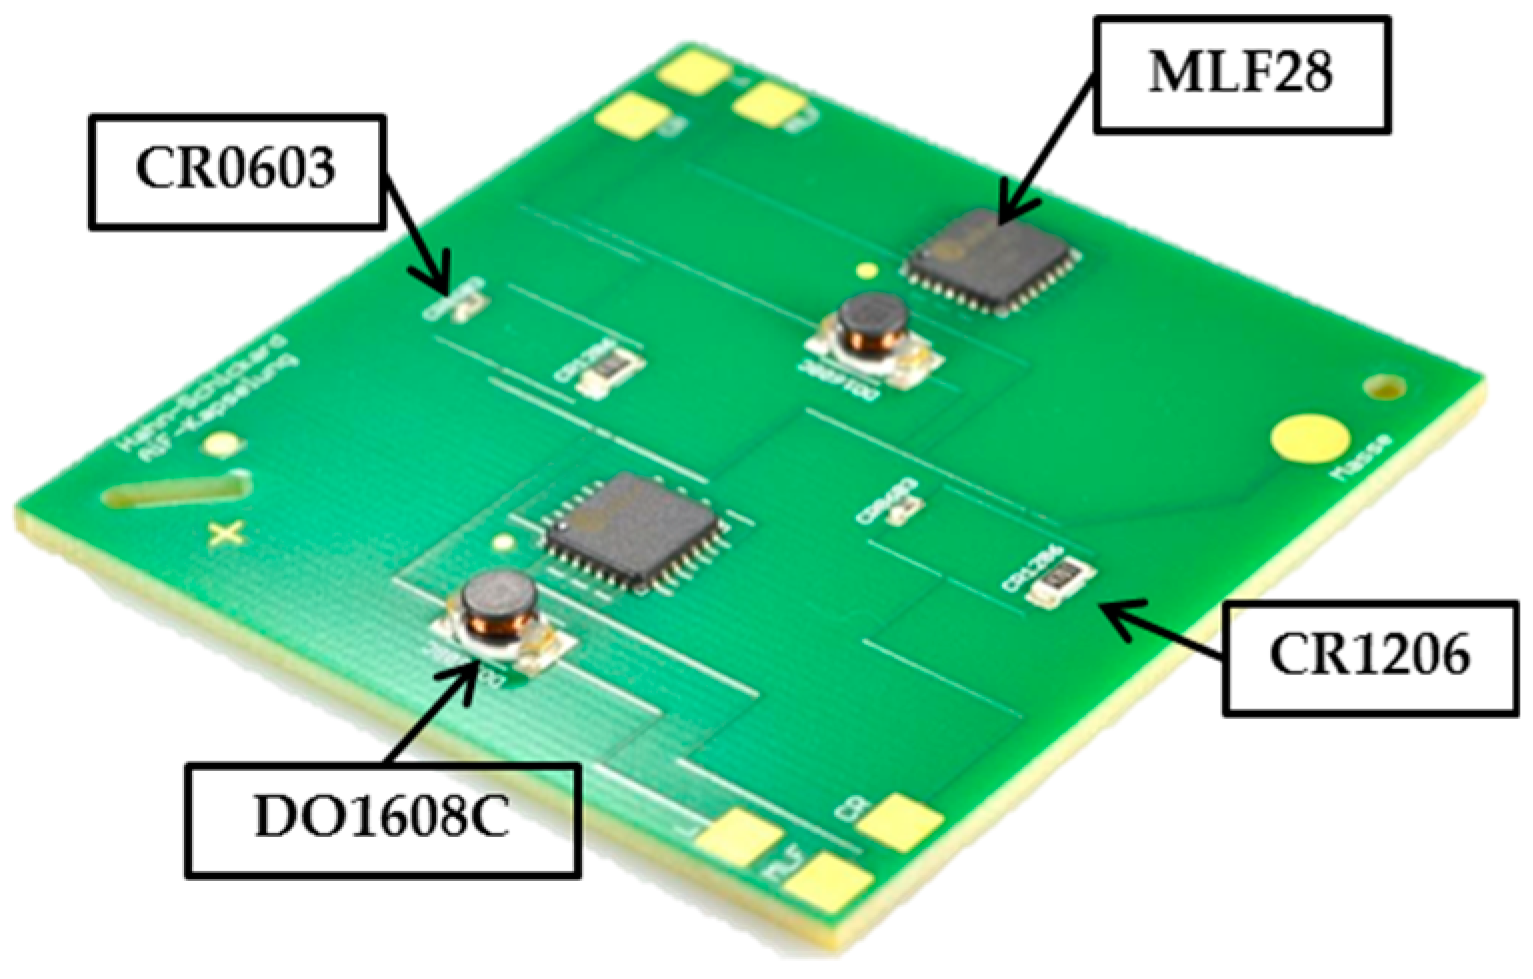
2.1. Conception of the Demonstrator
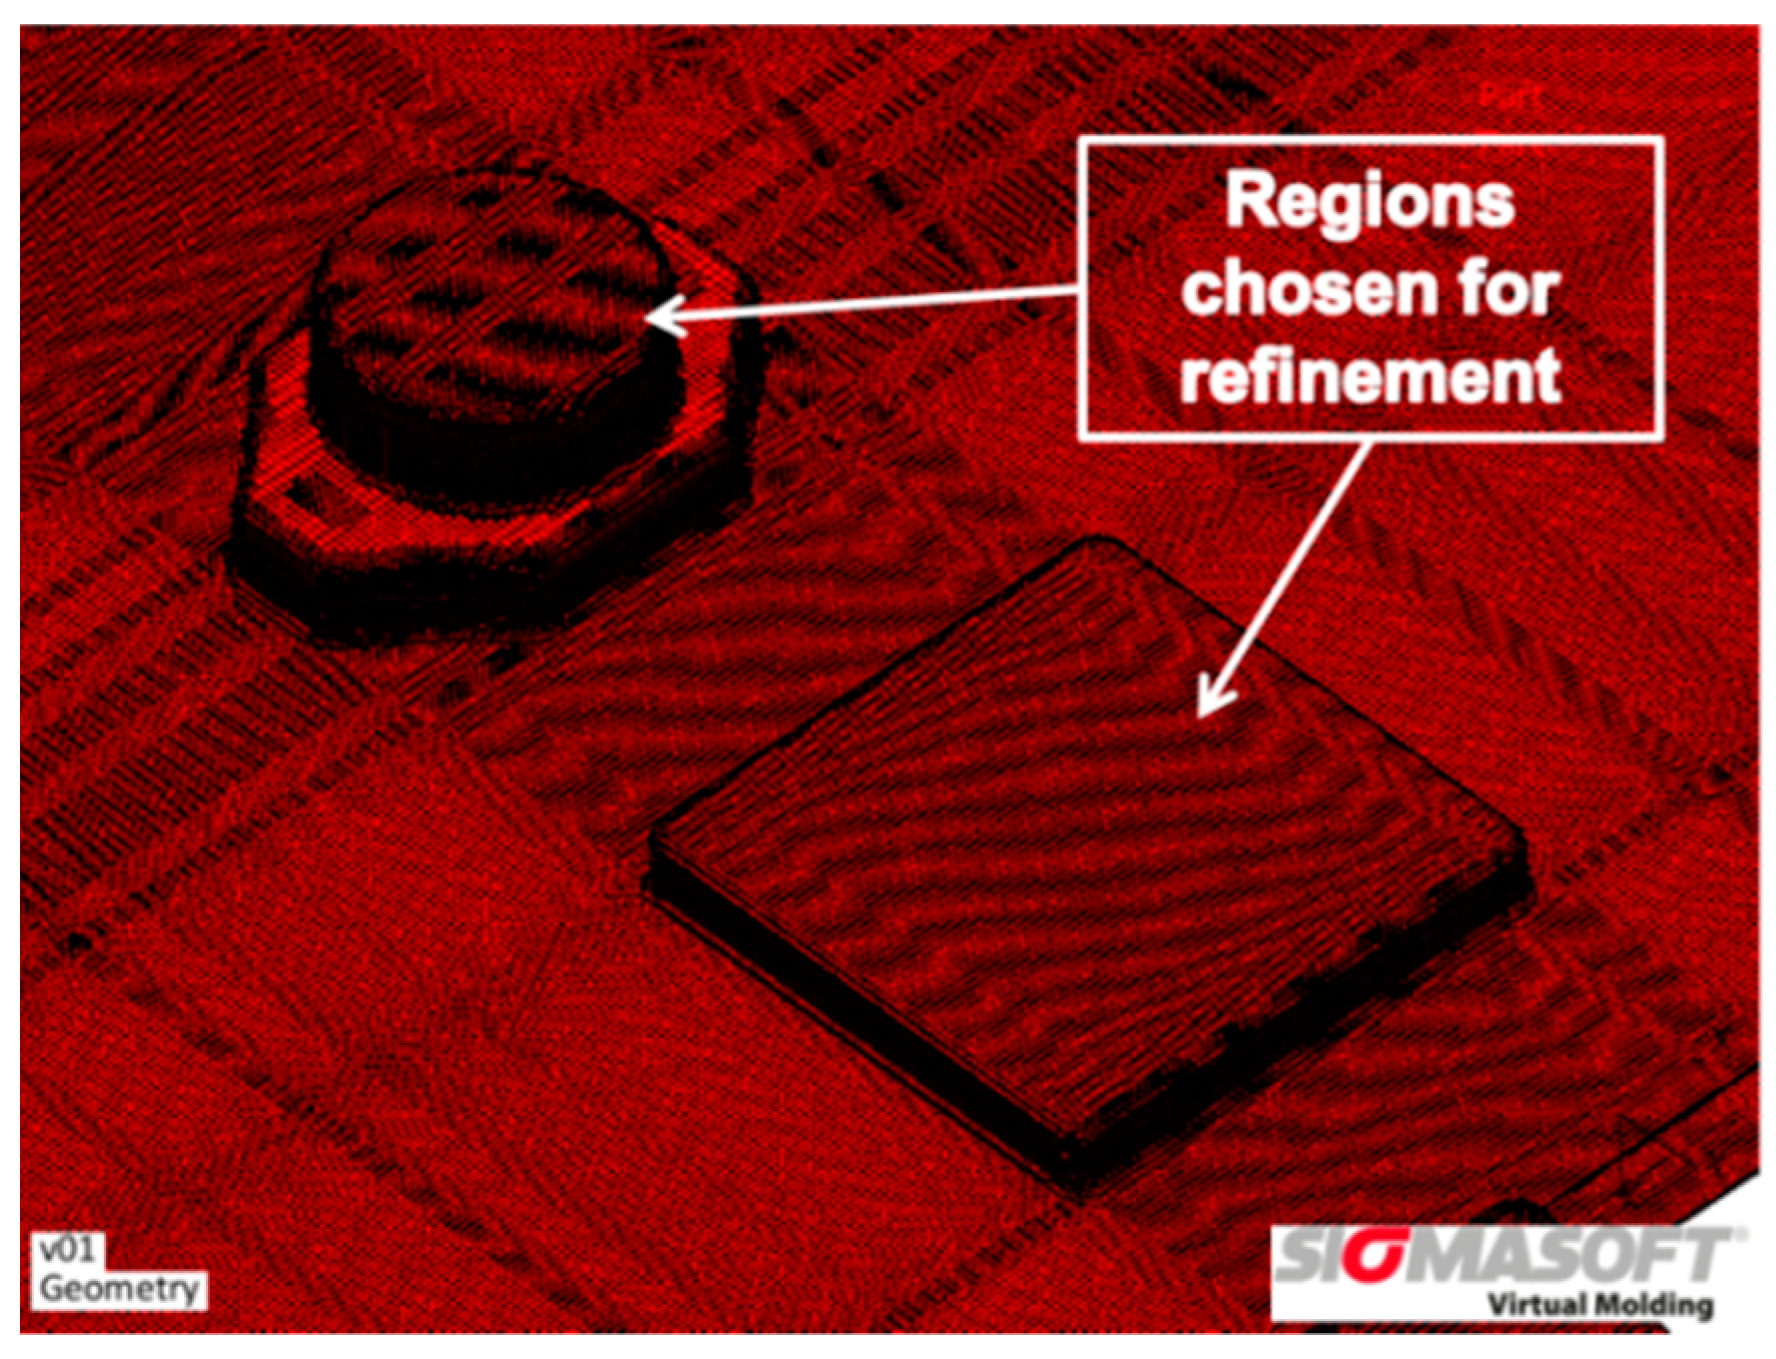
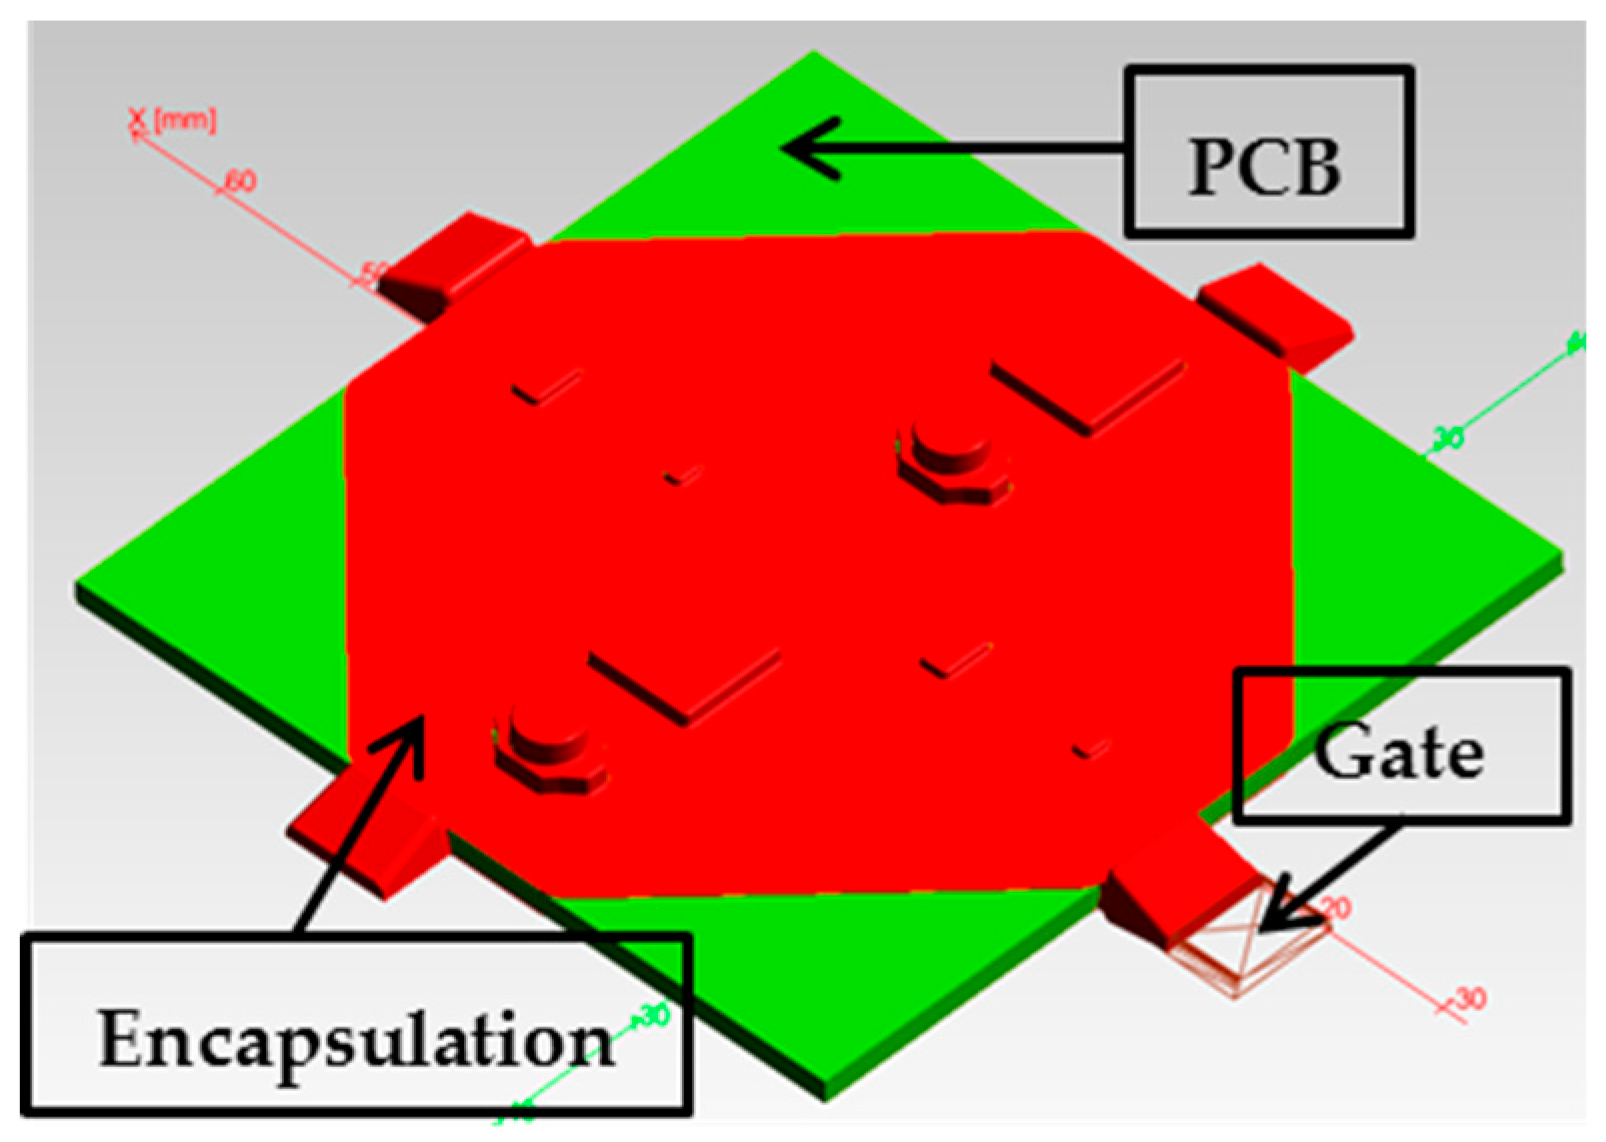
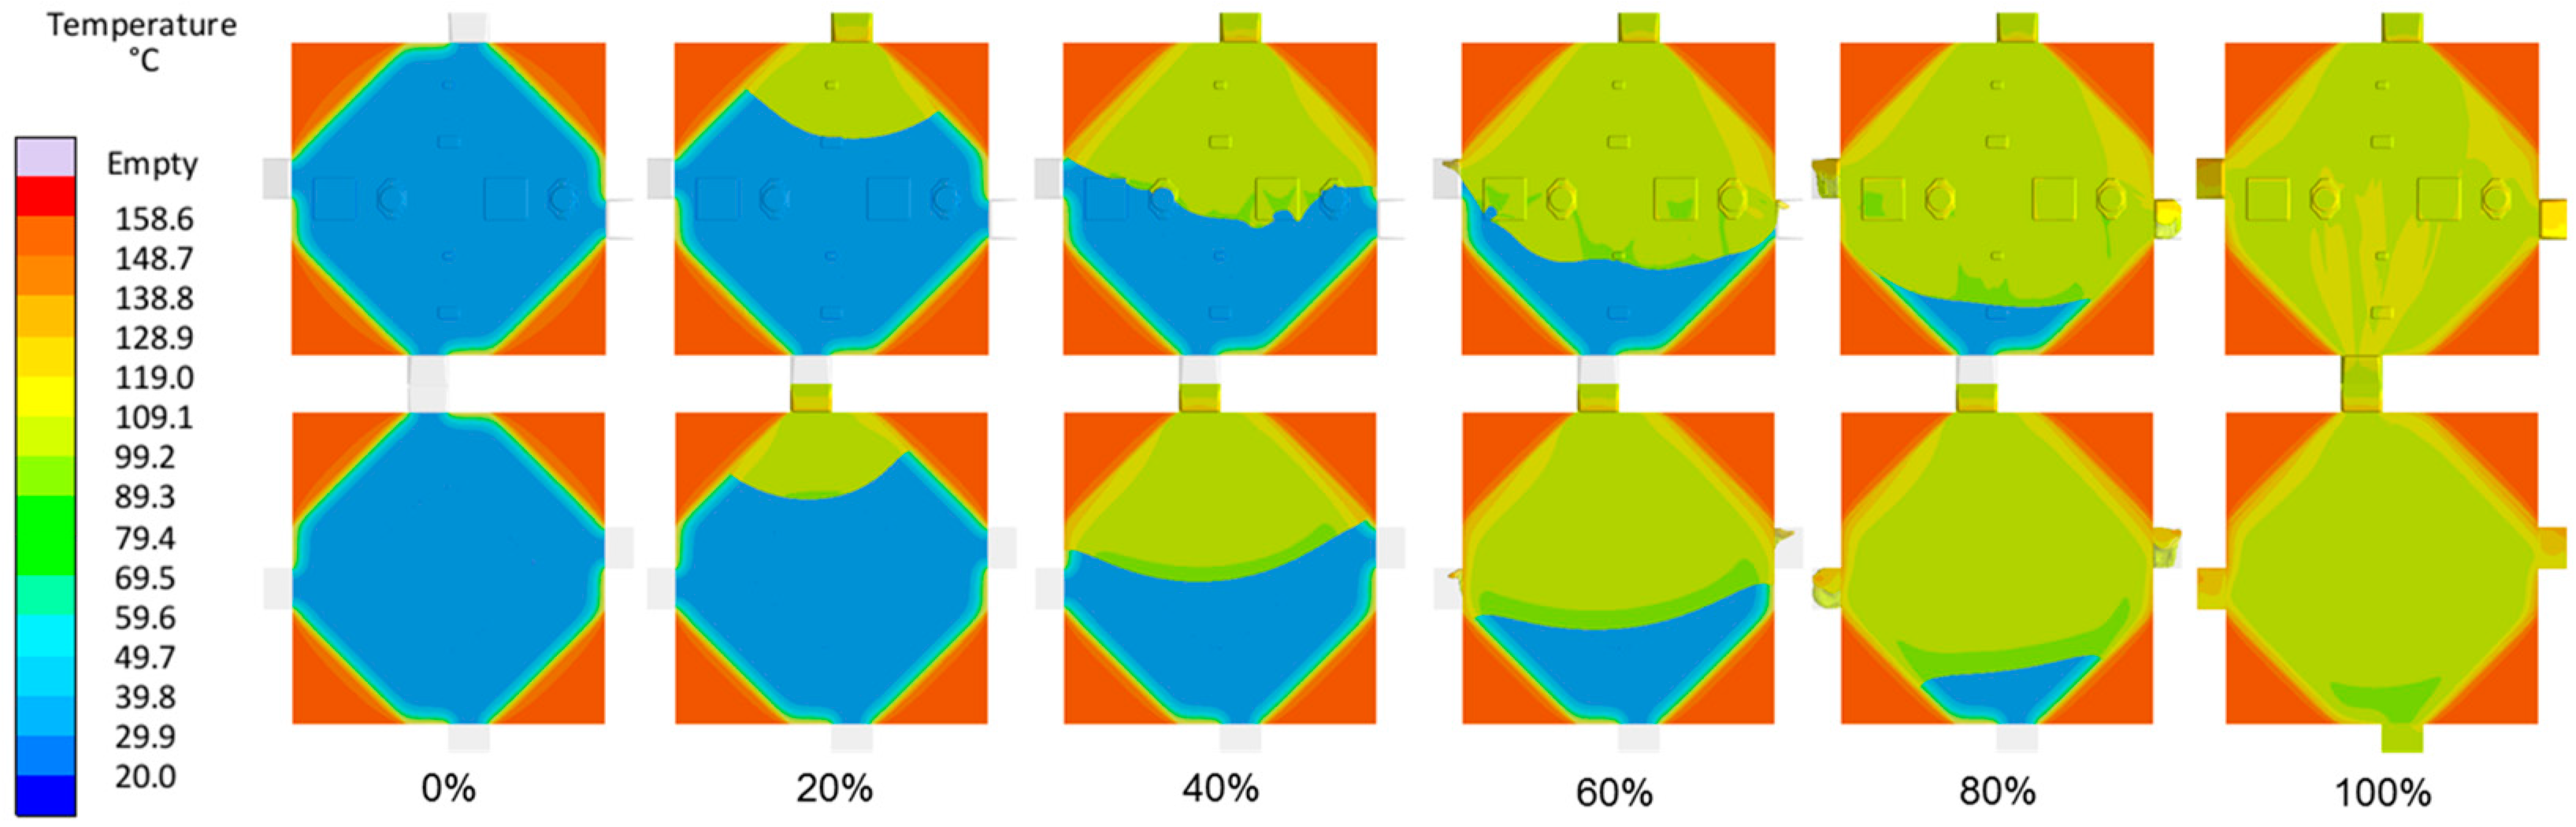
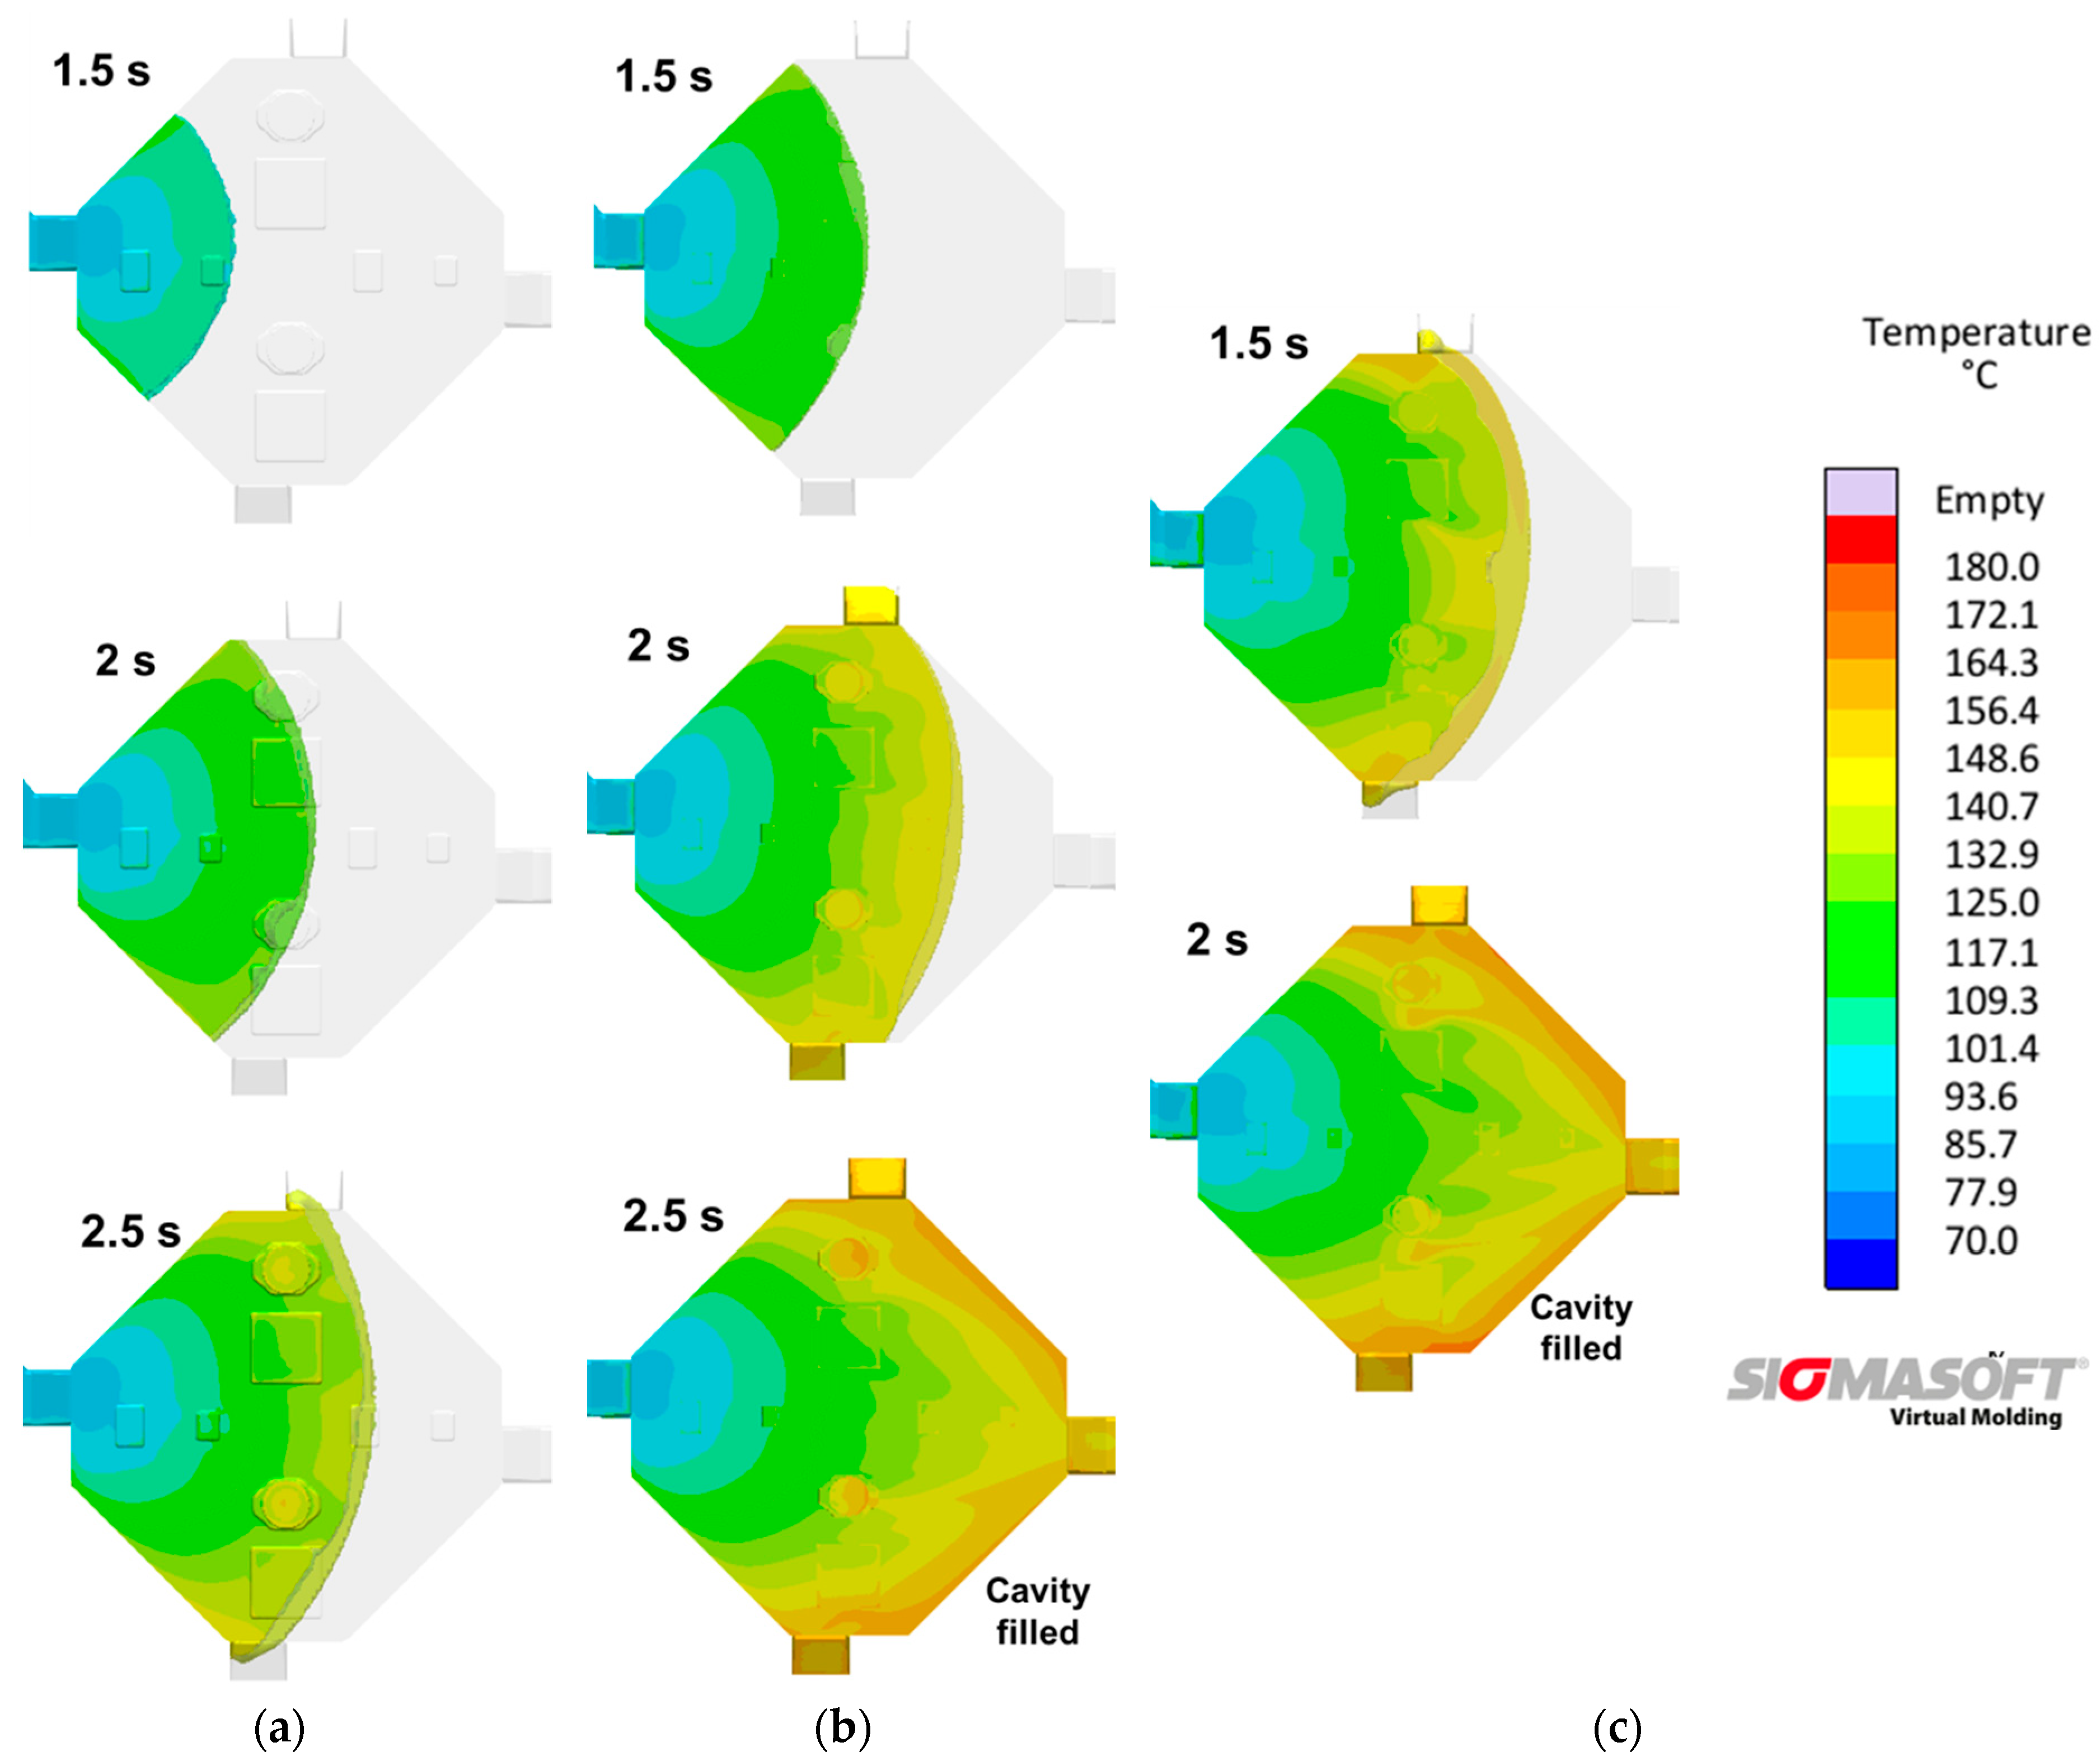
2.2. Process Simulation
3. Results
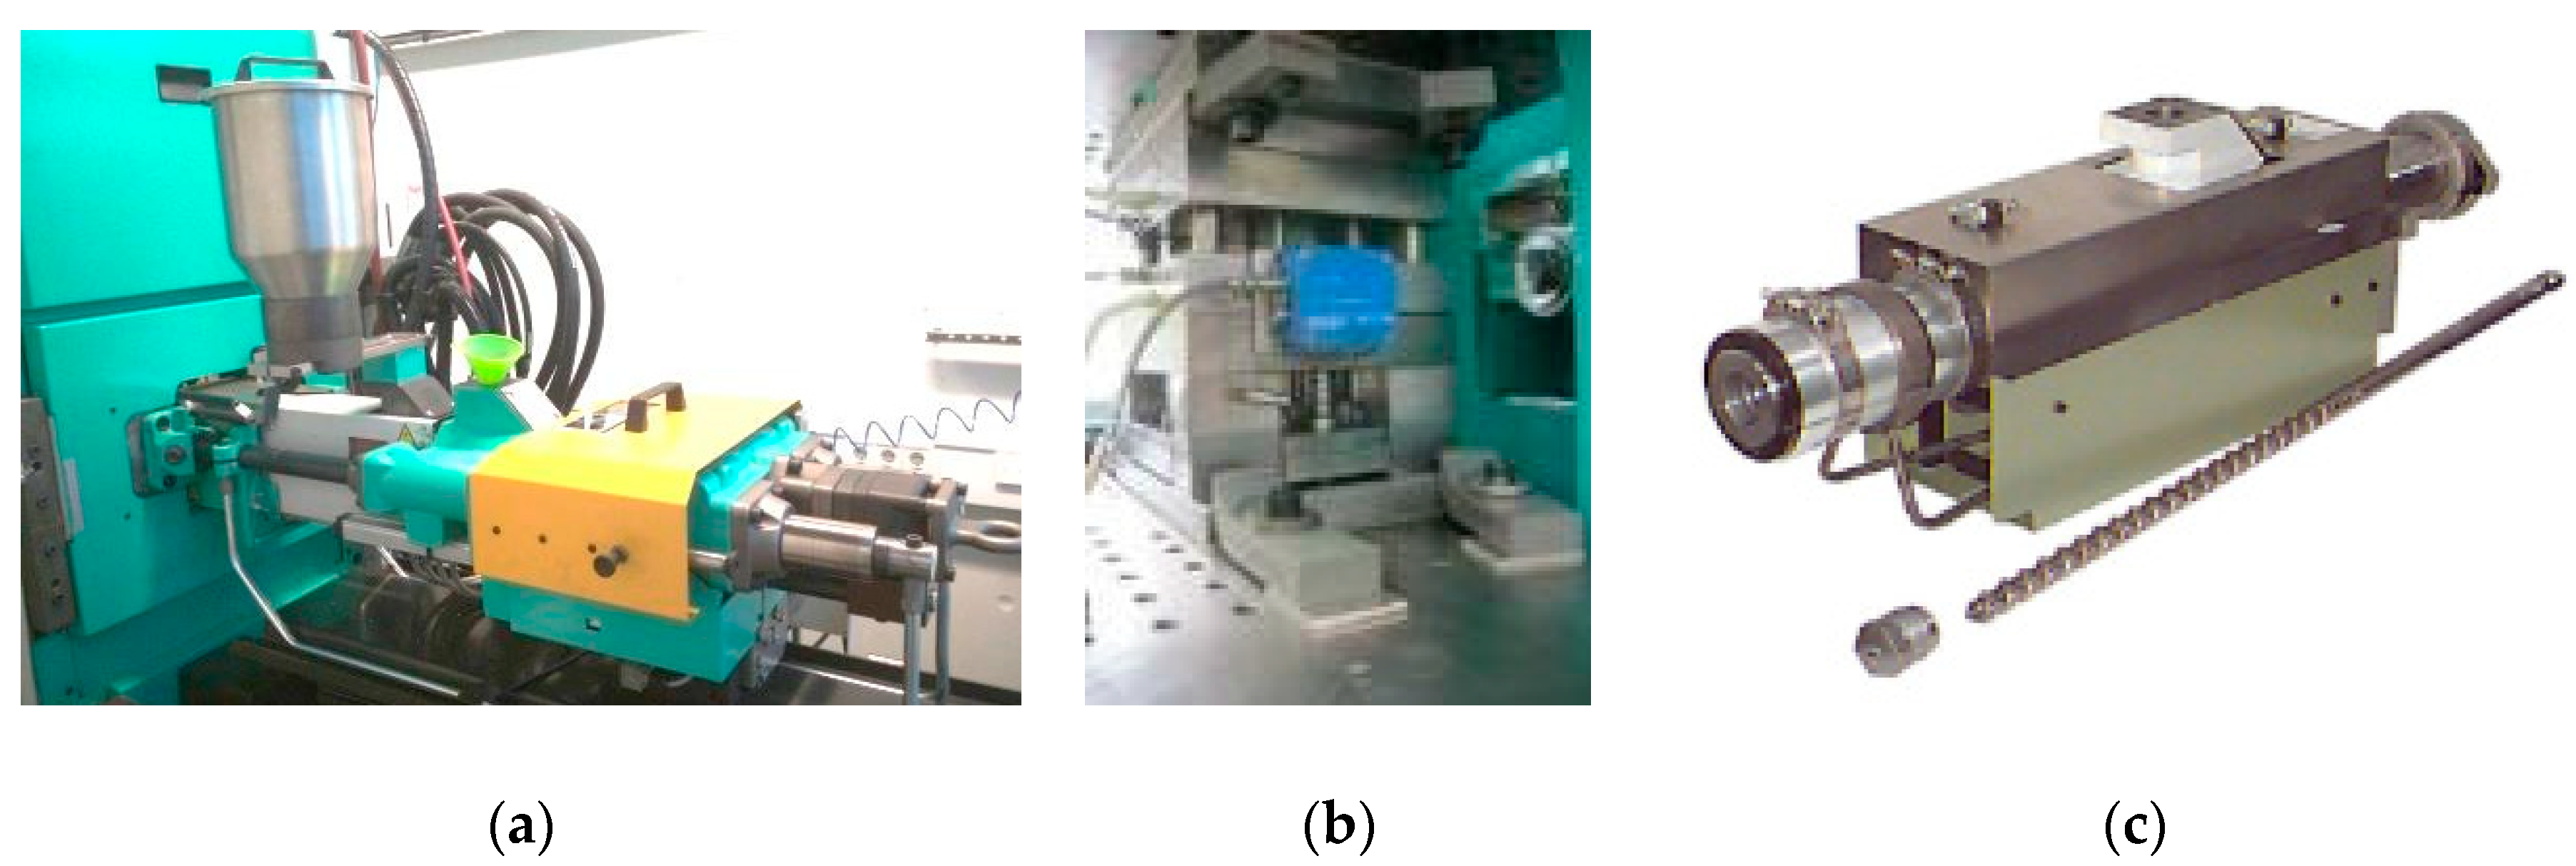
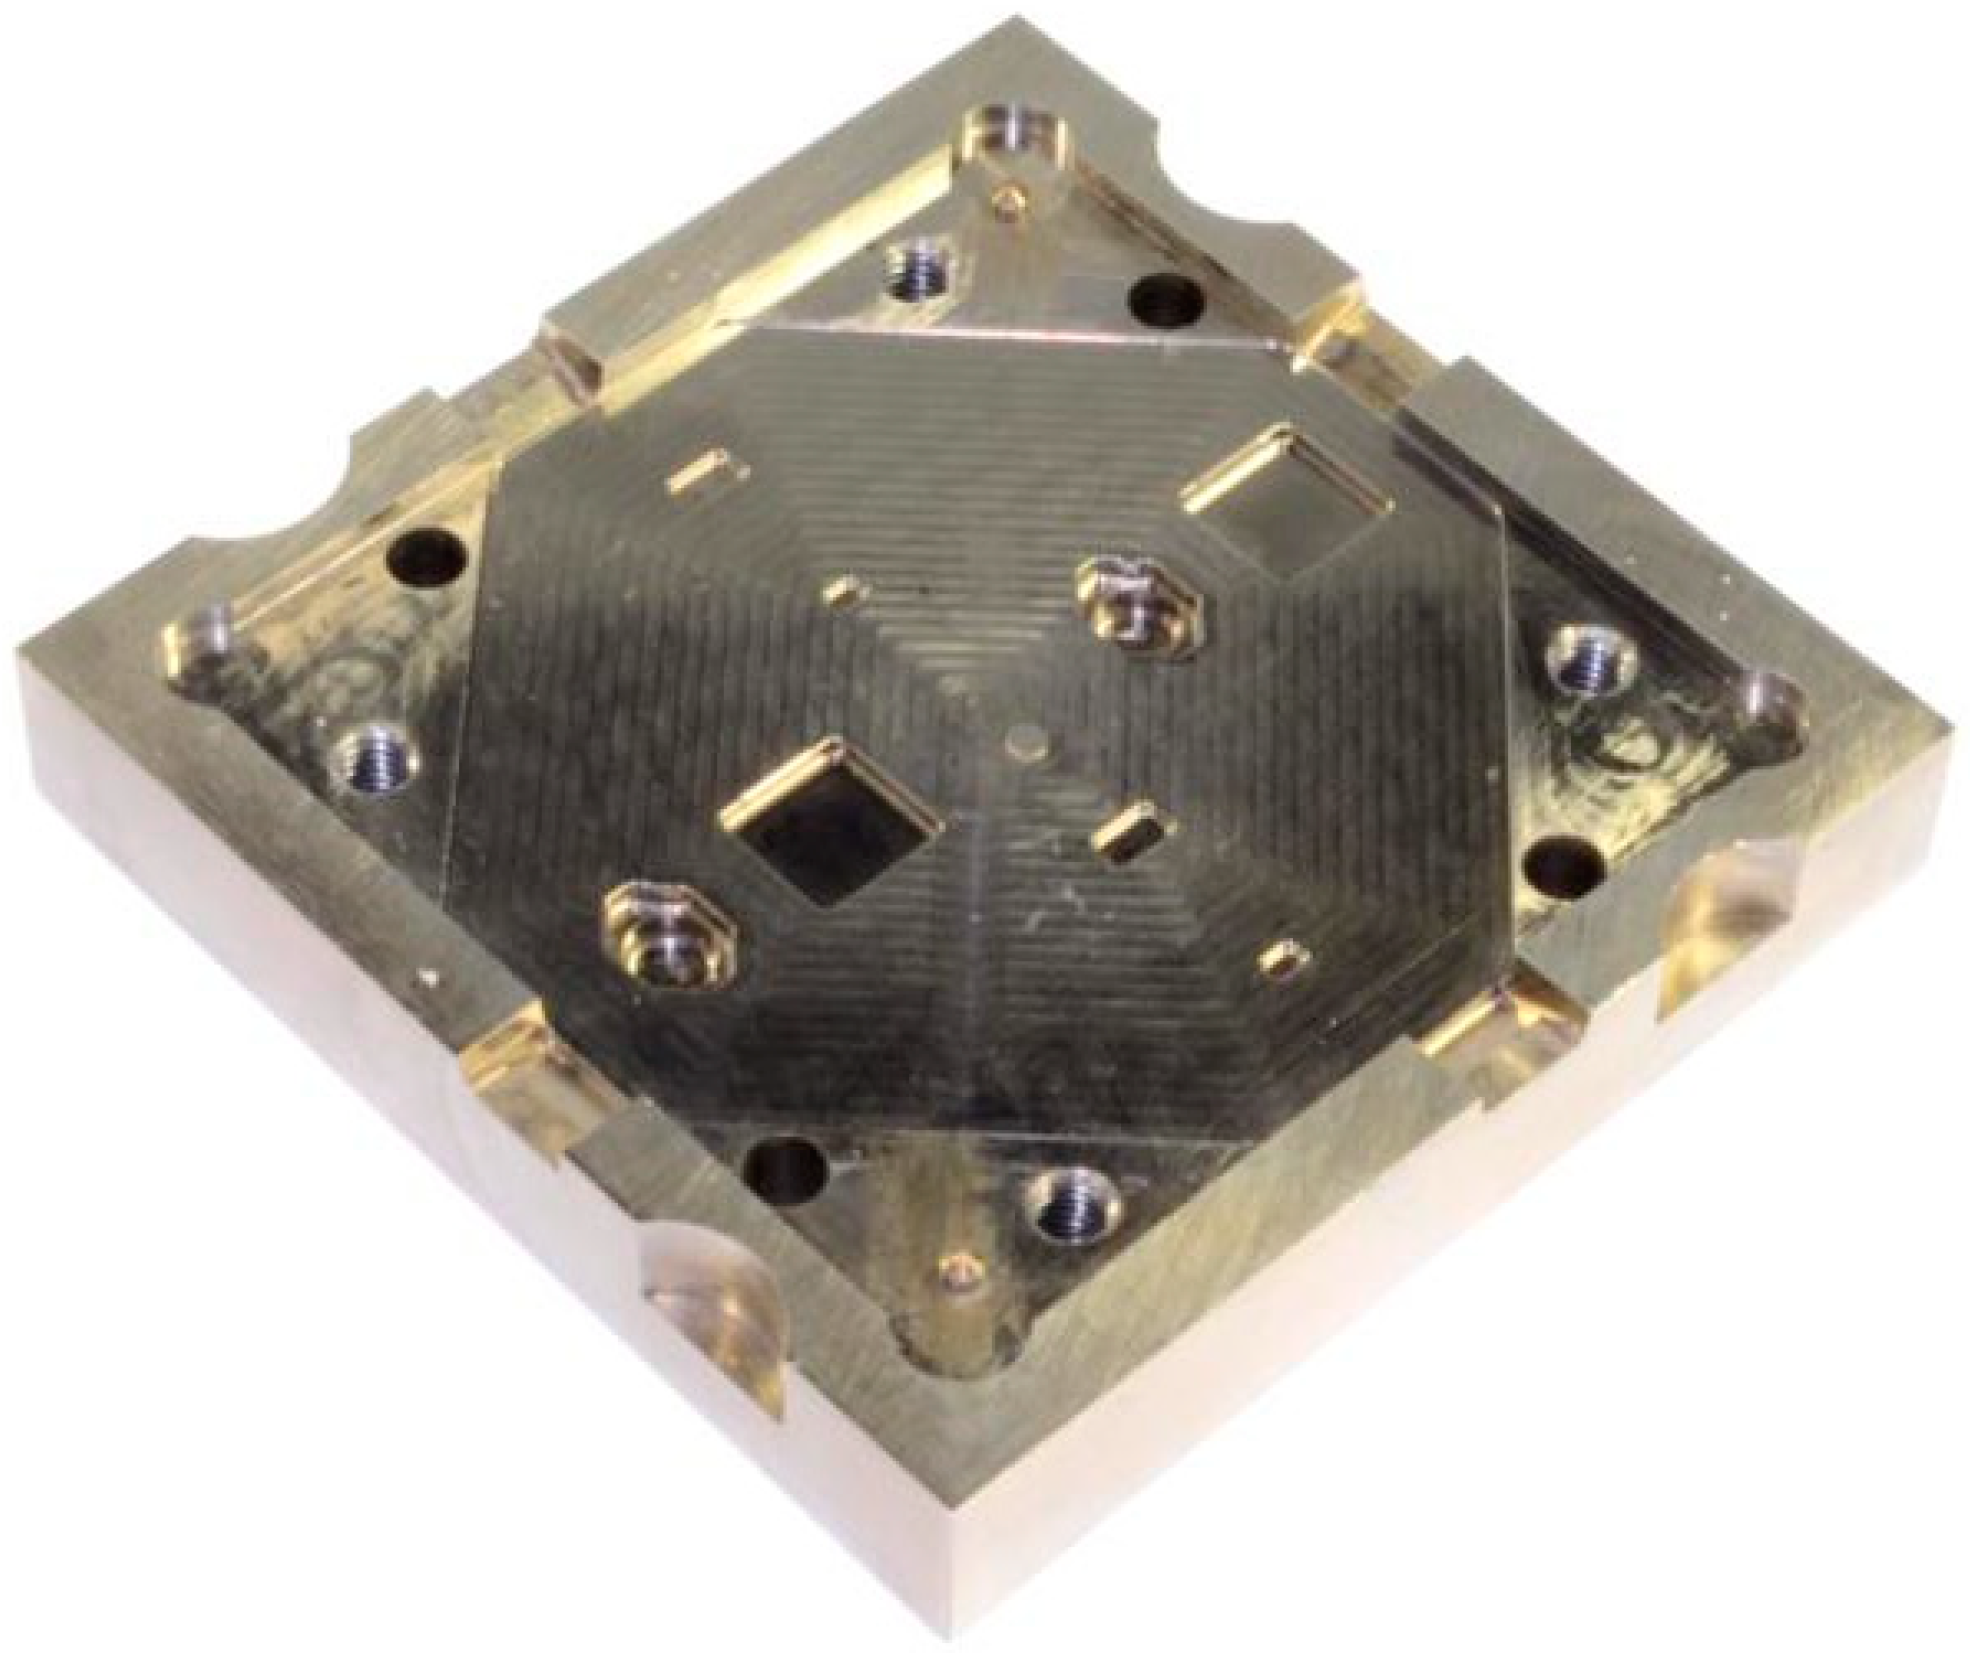
3.1. Experimental Molding Trials
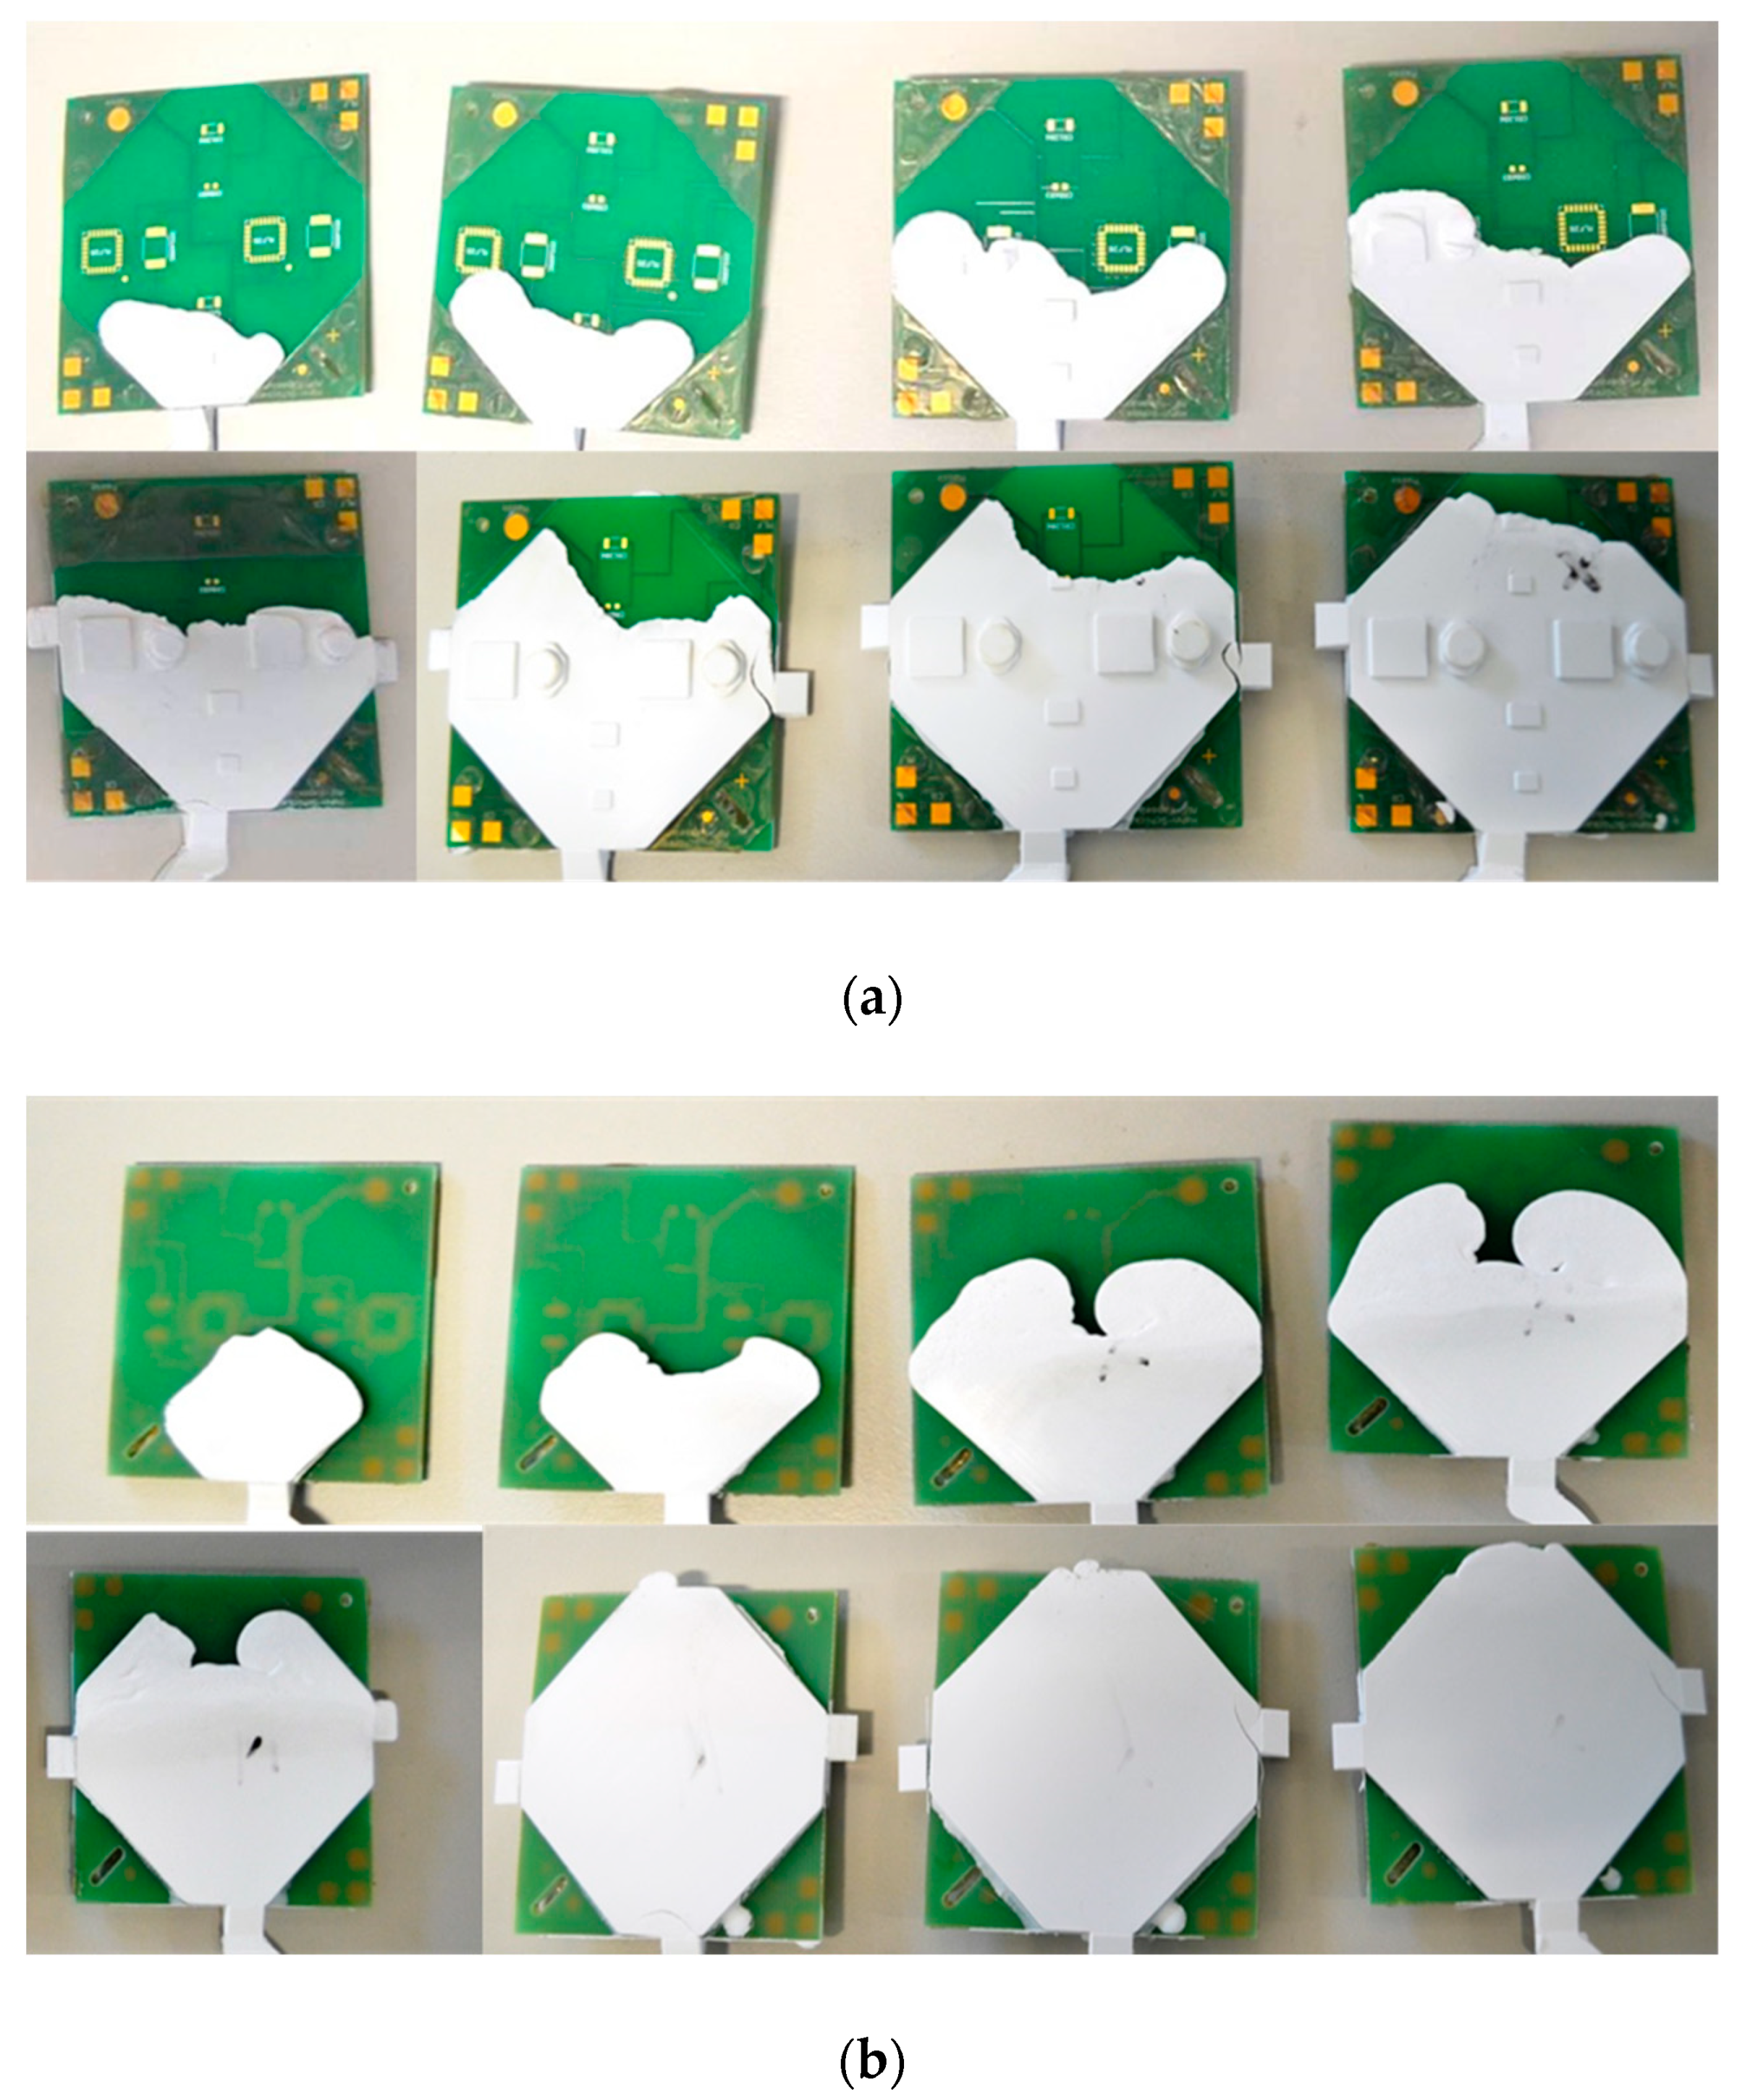
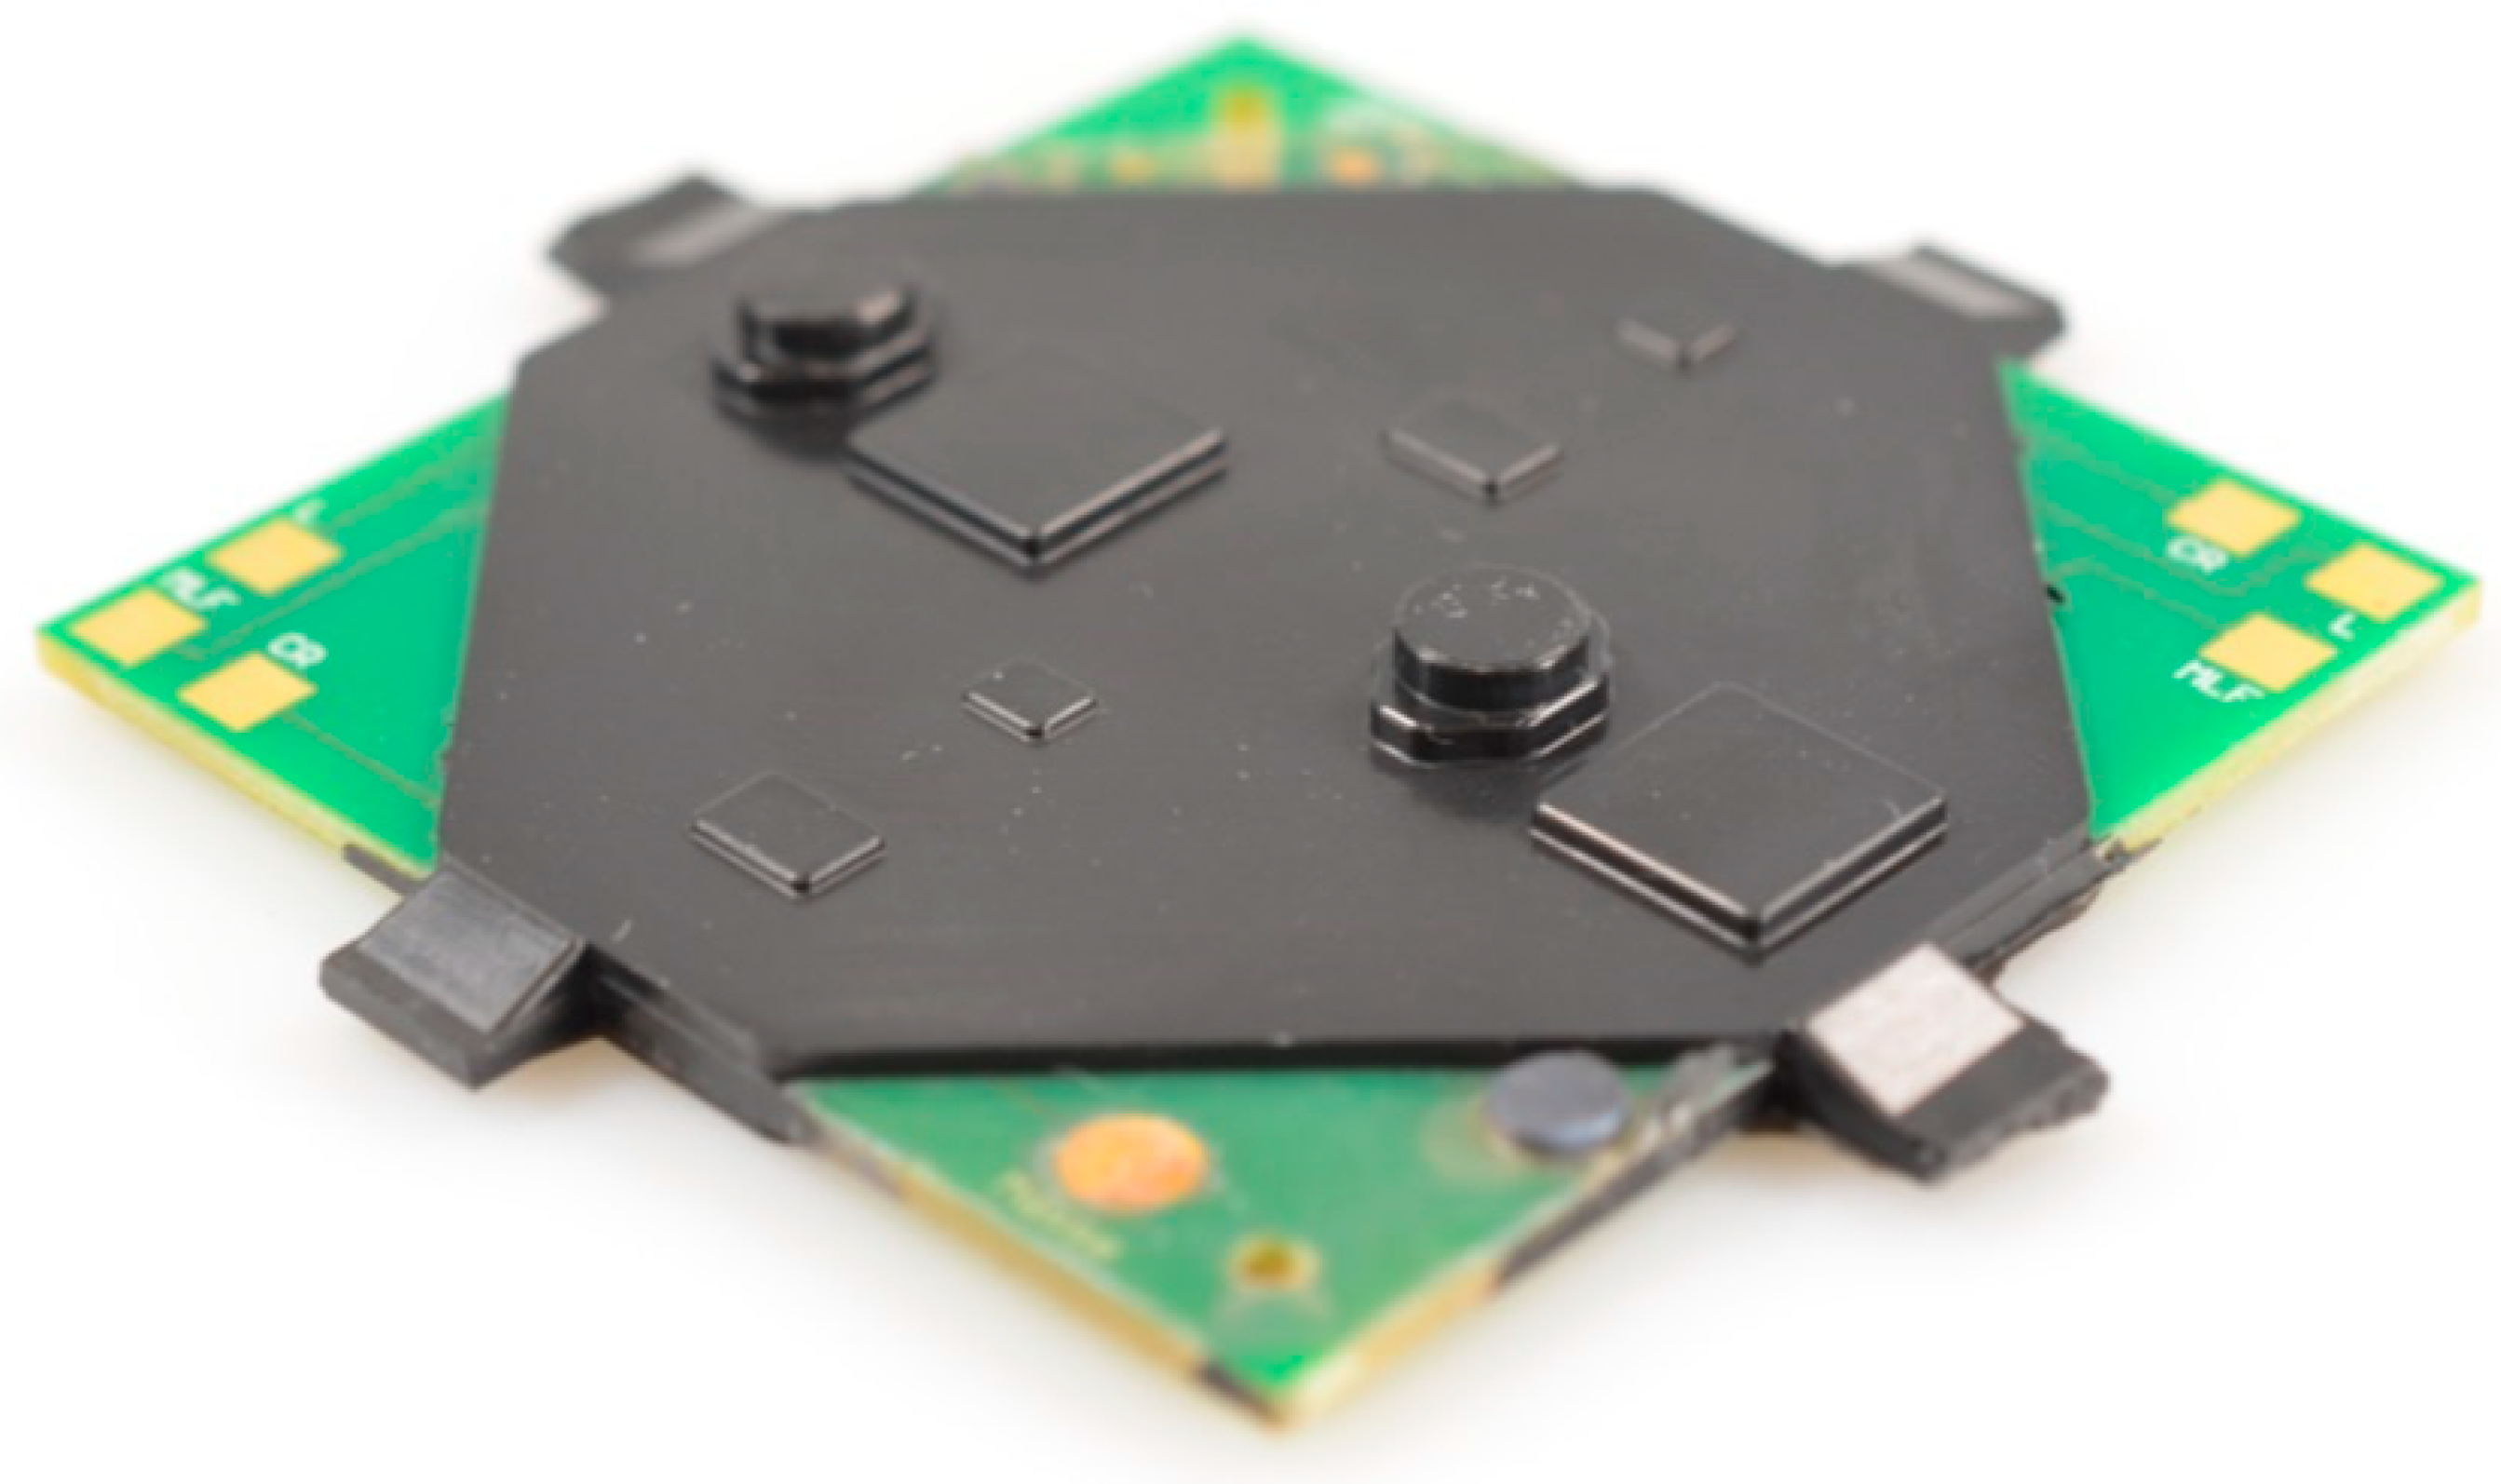
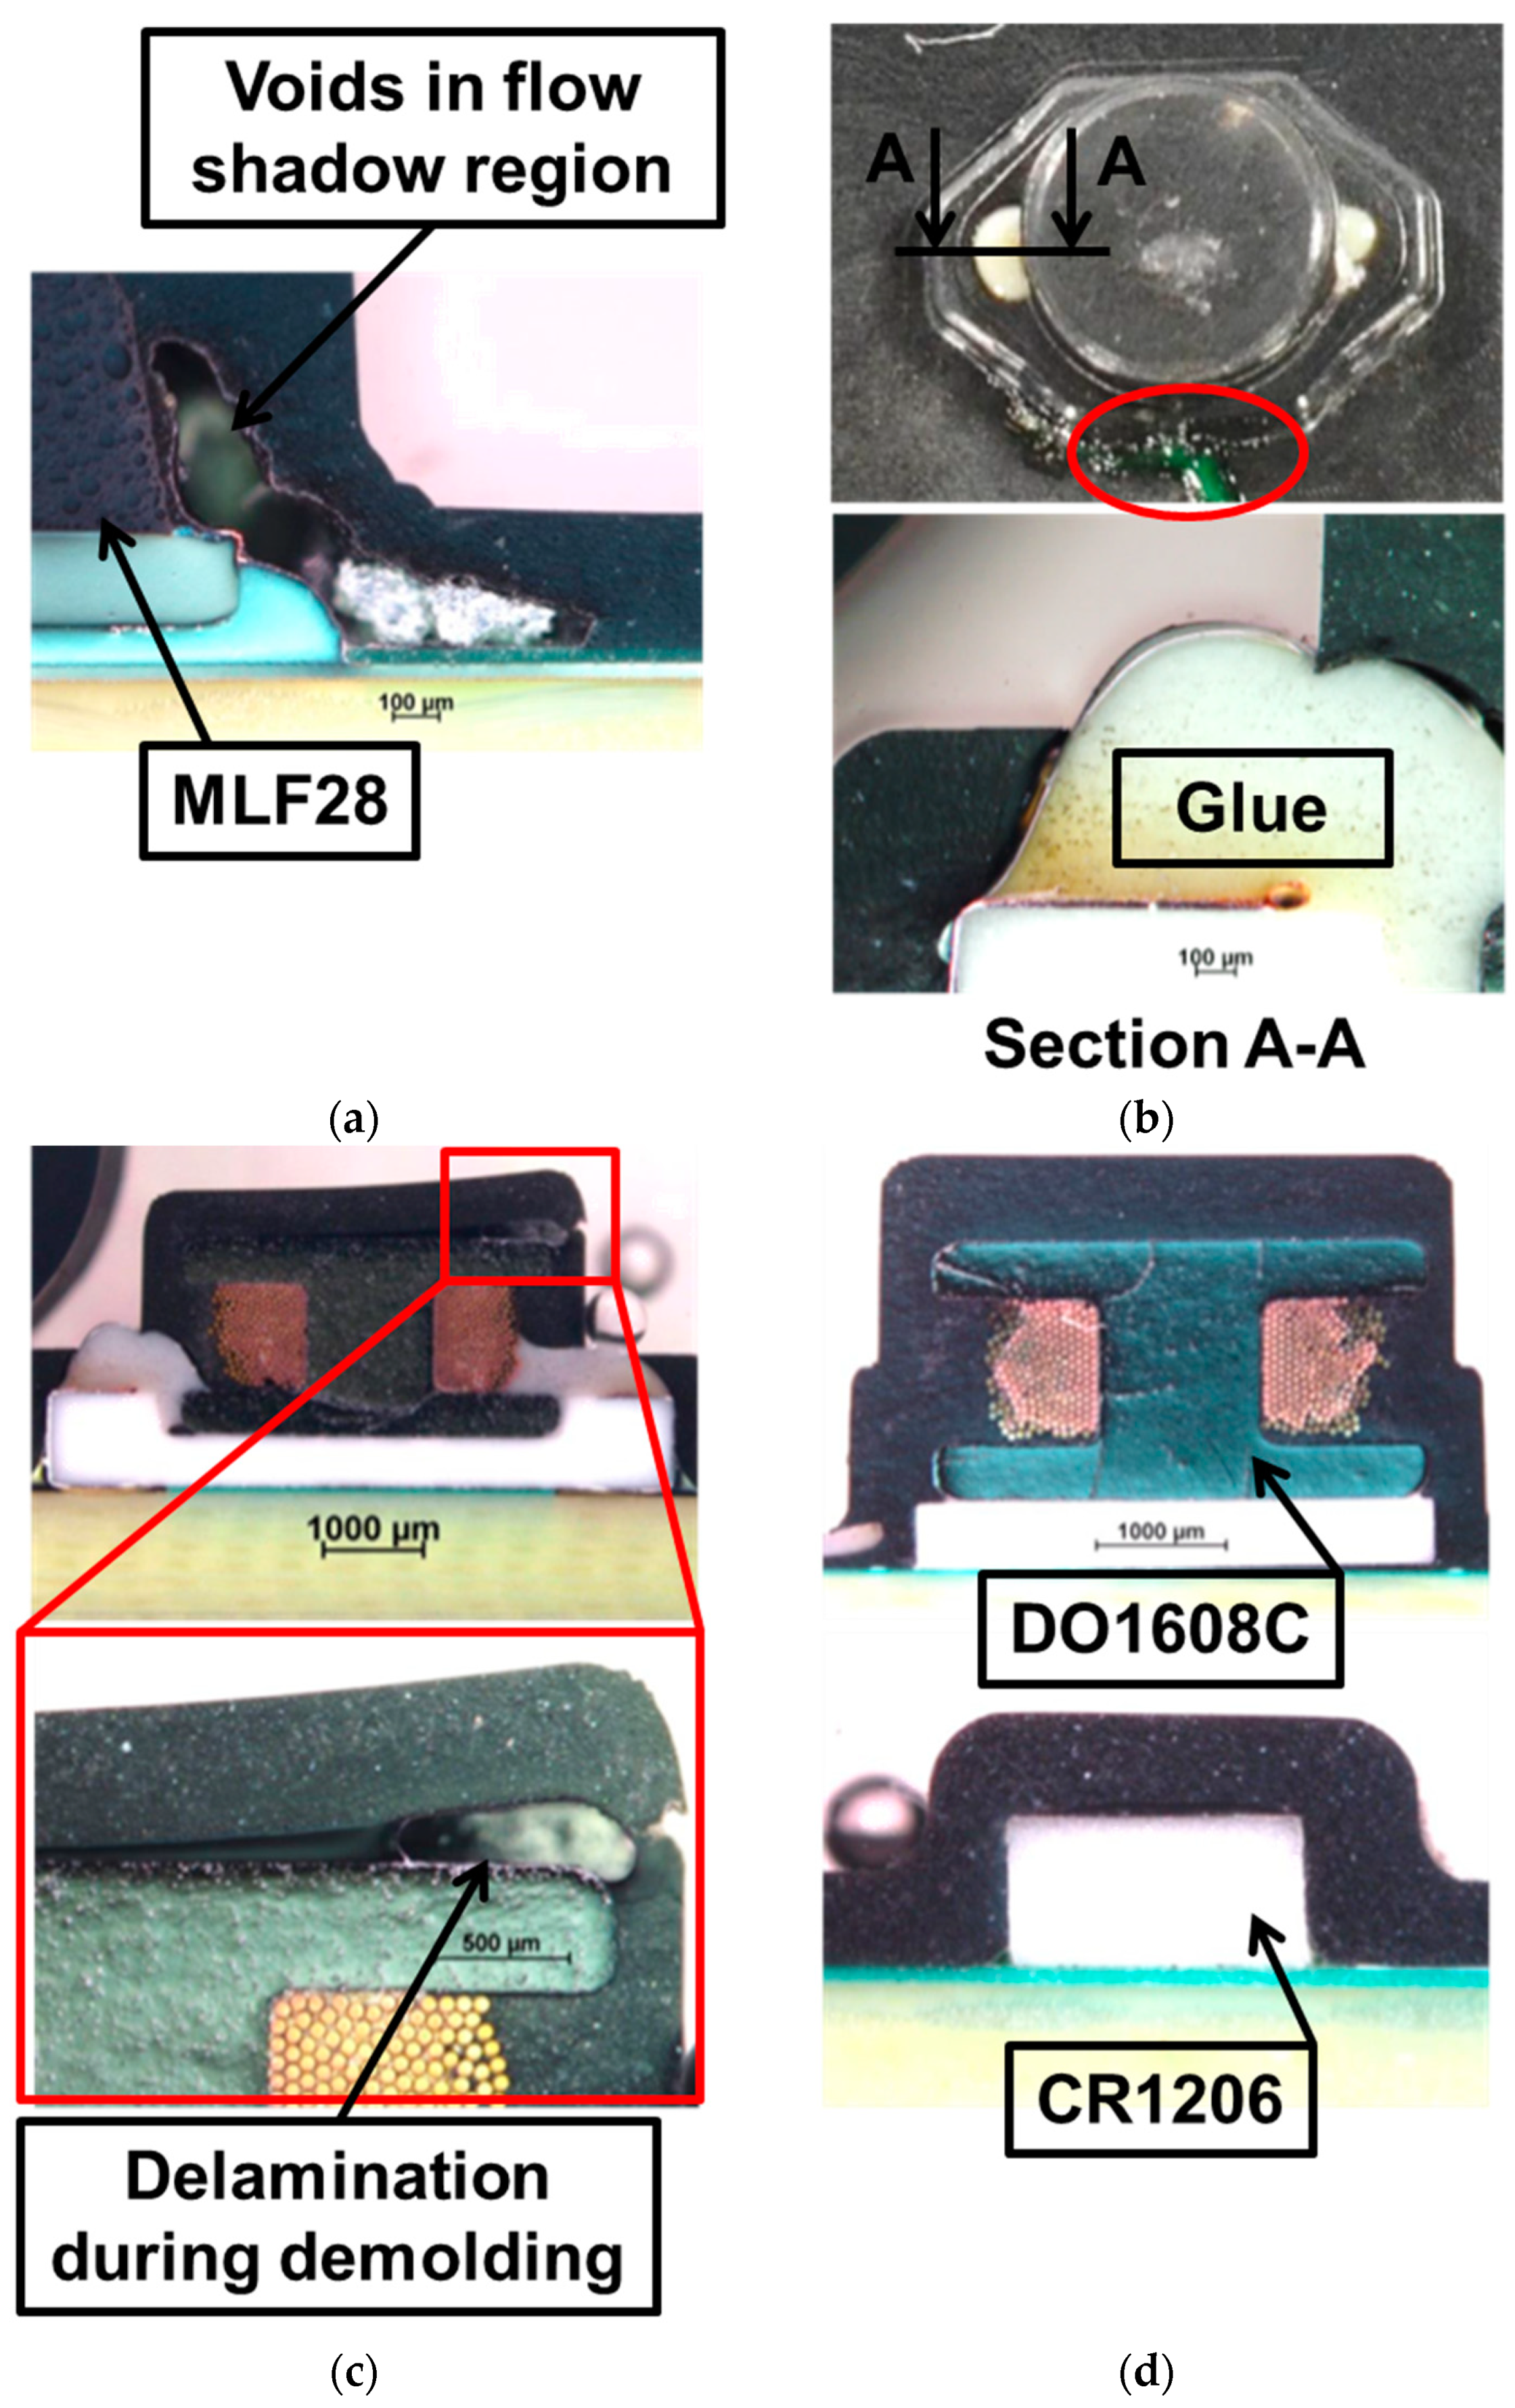
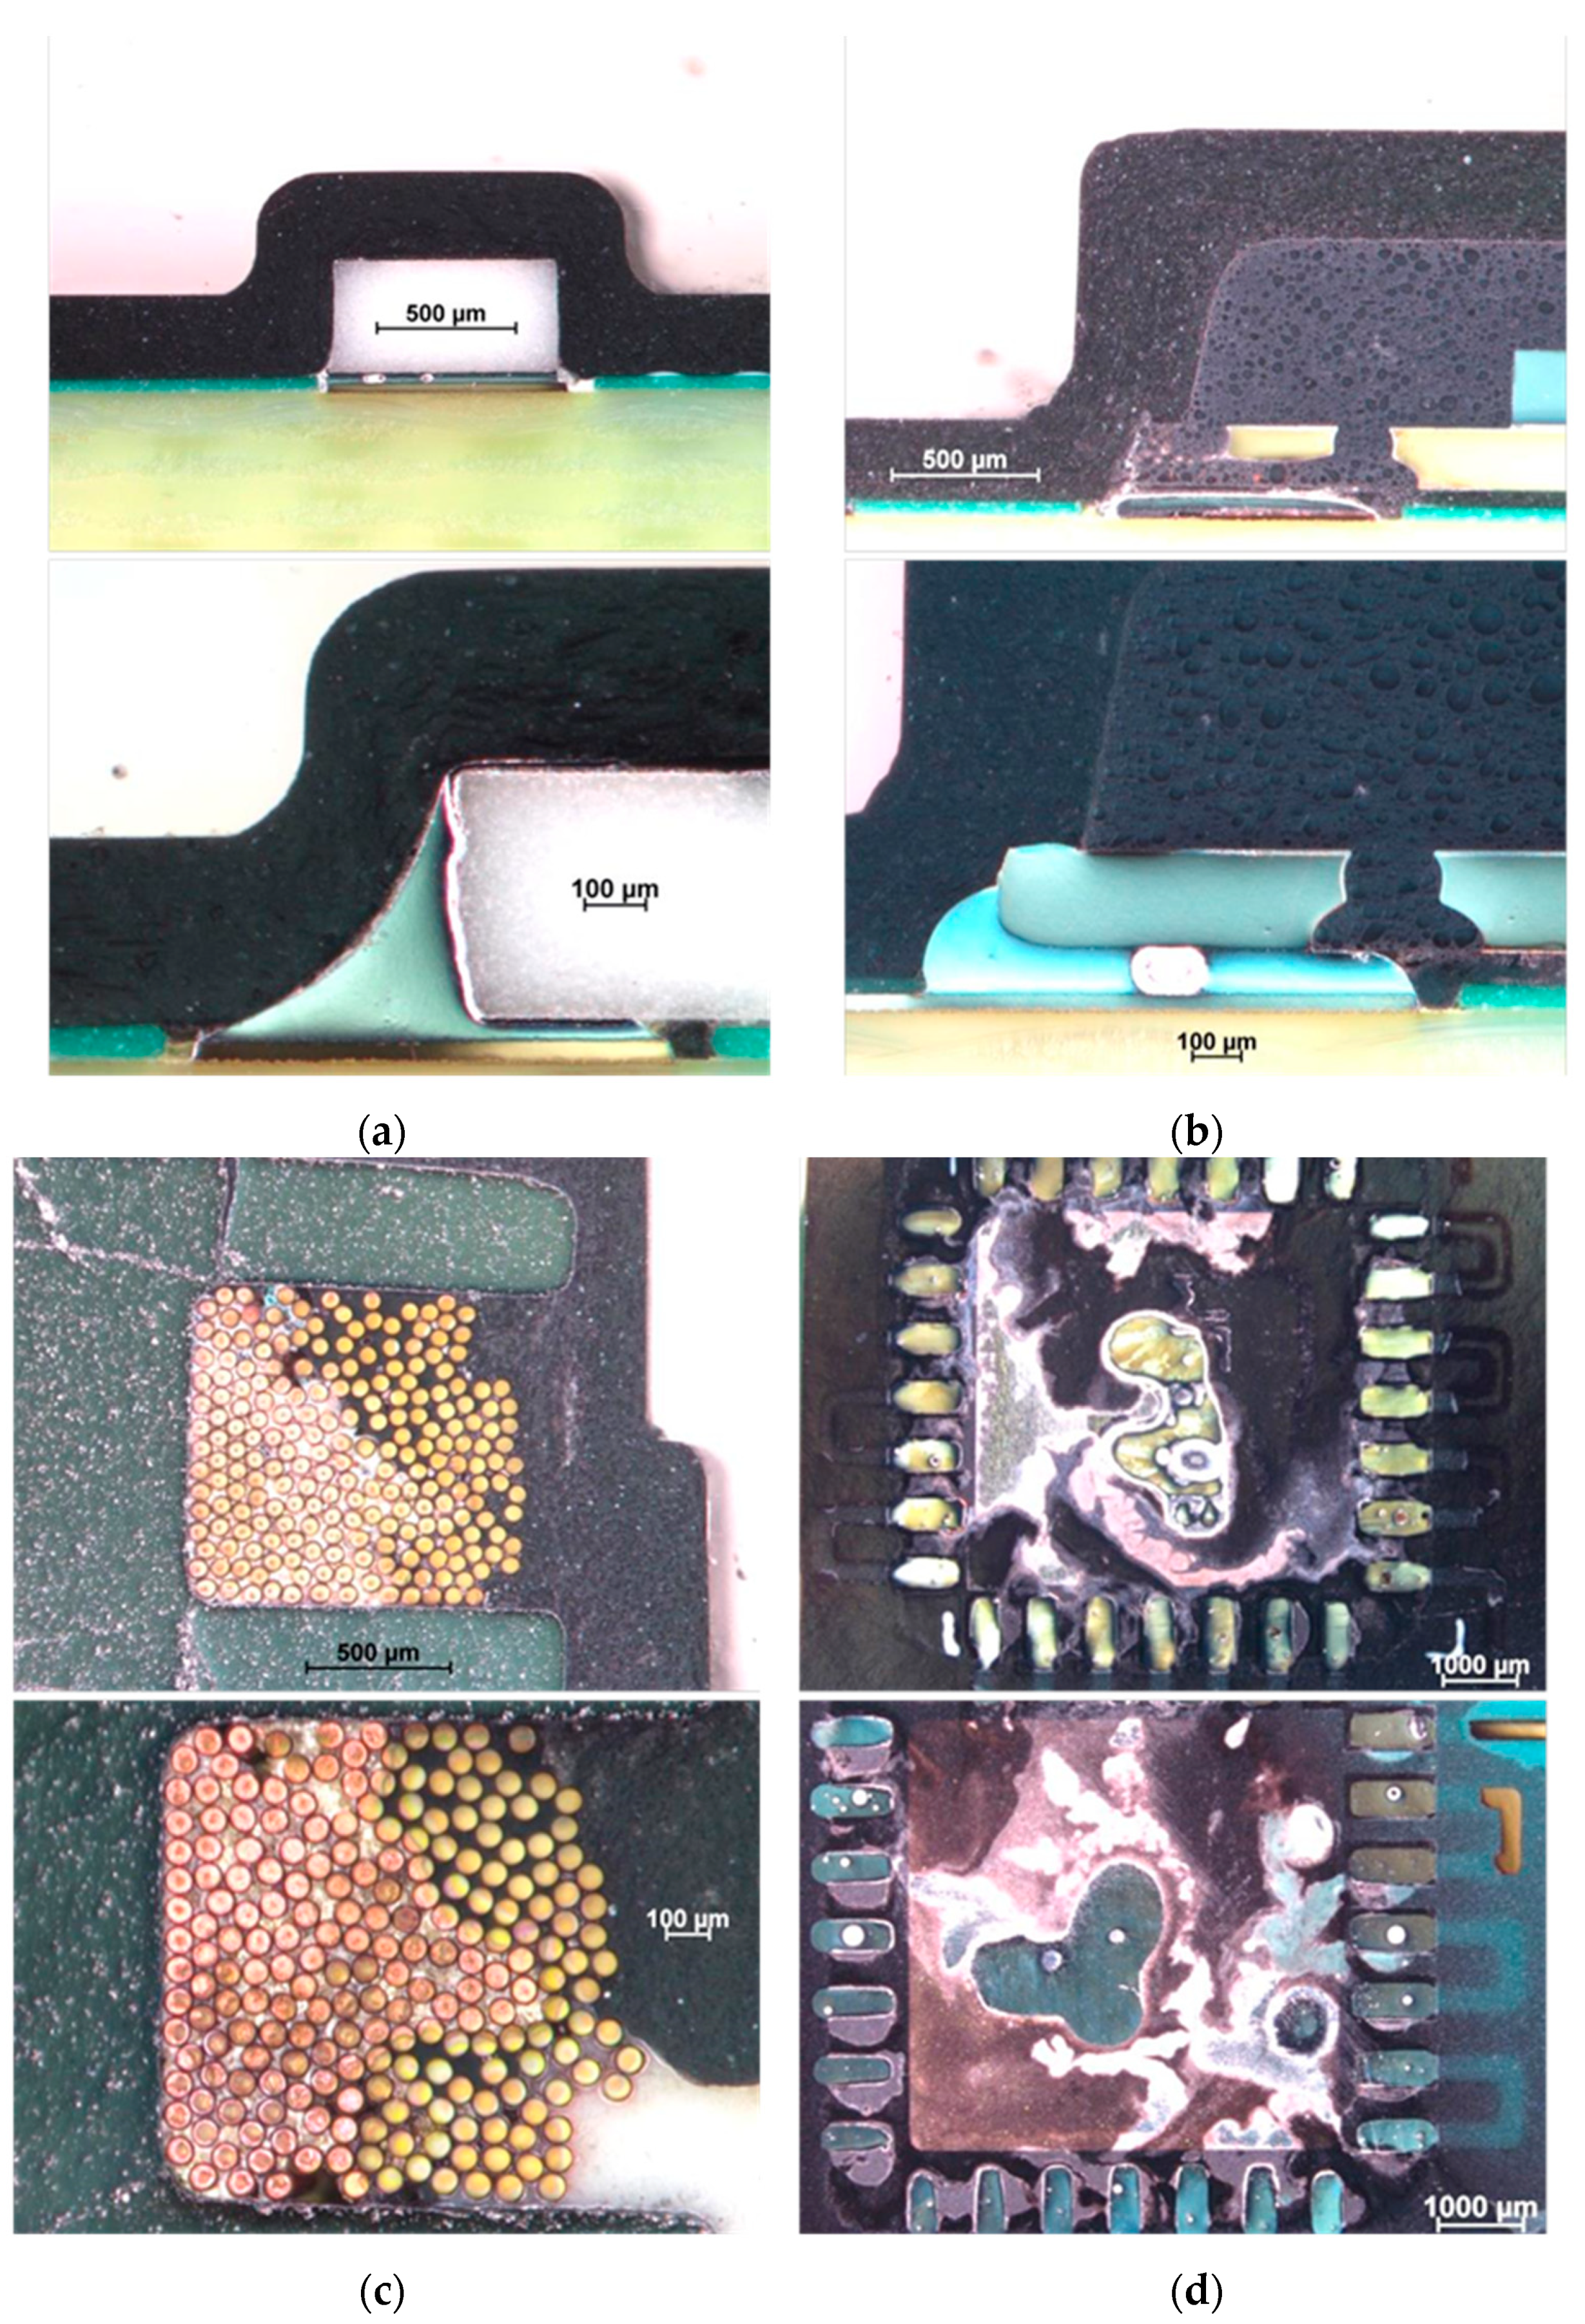
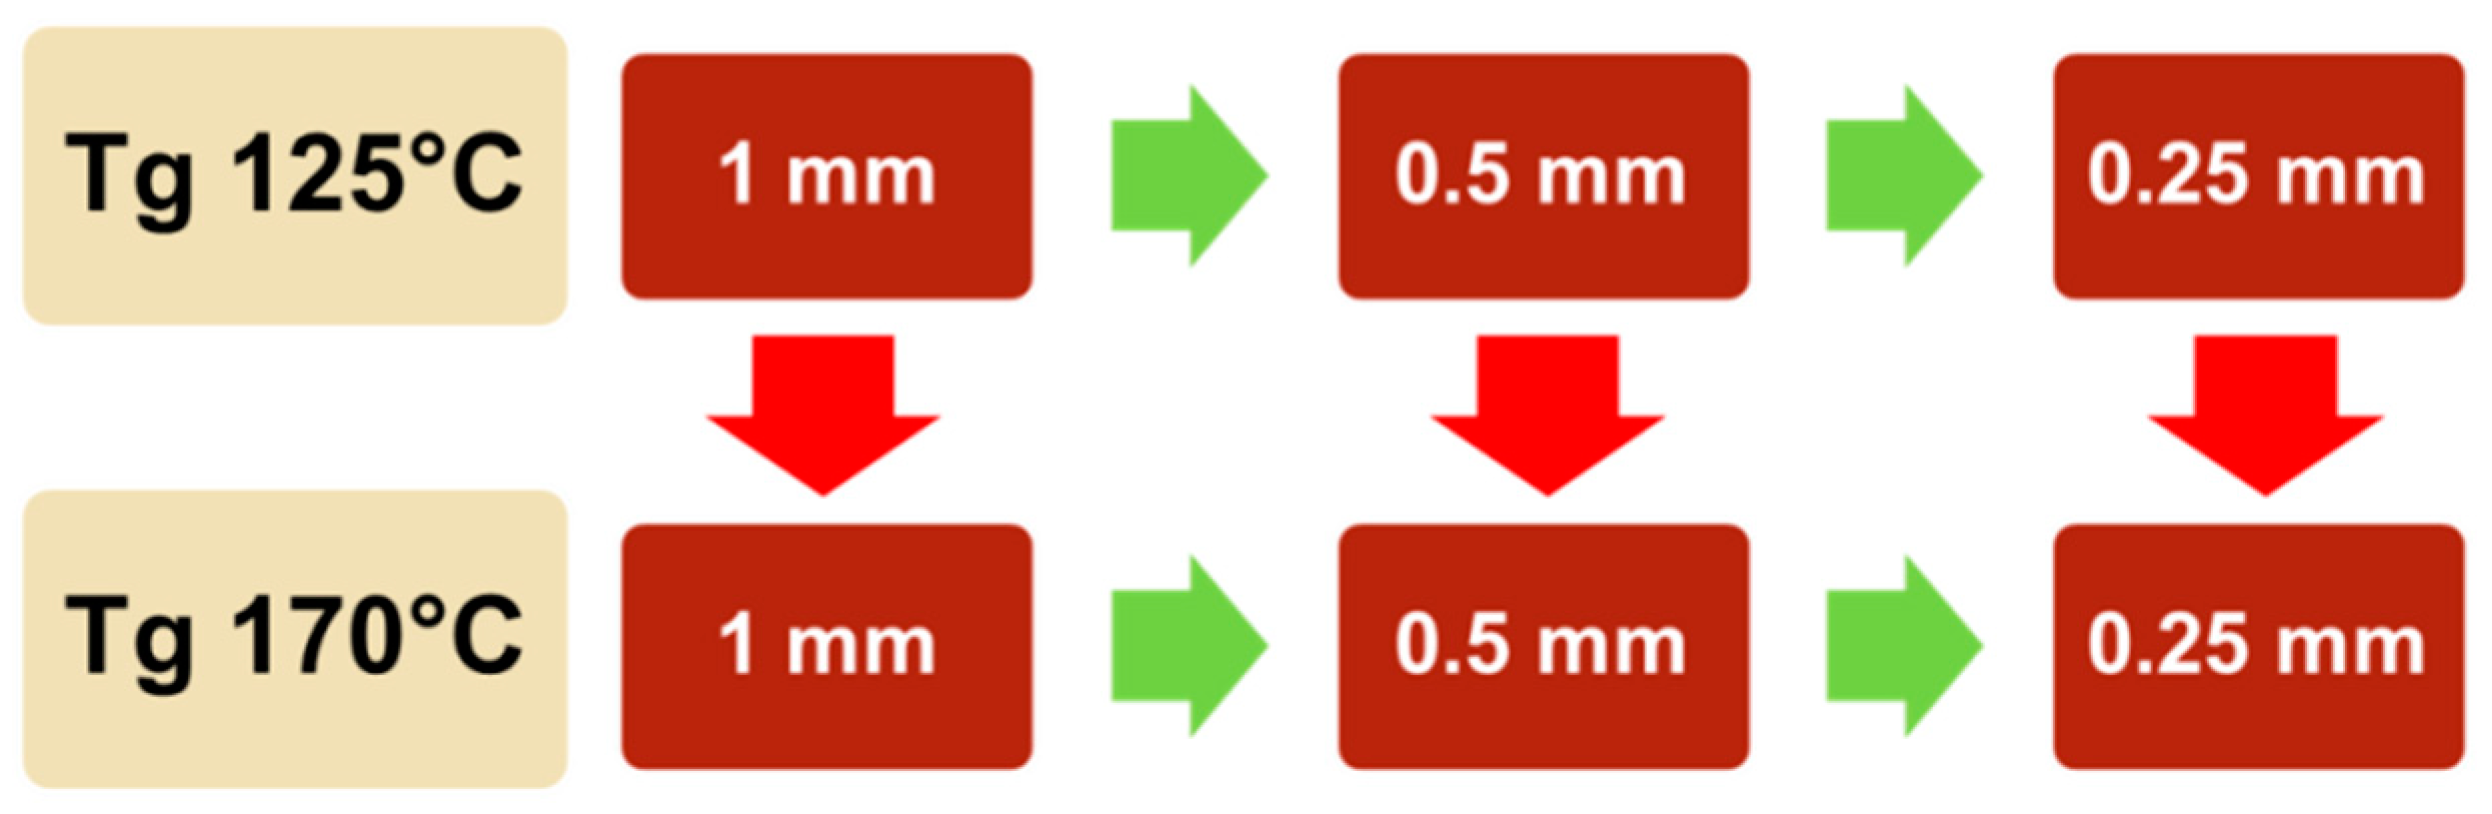
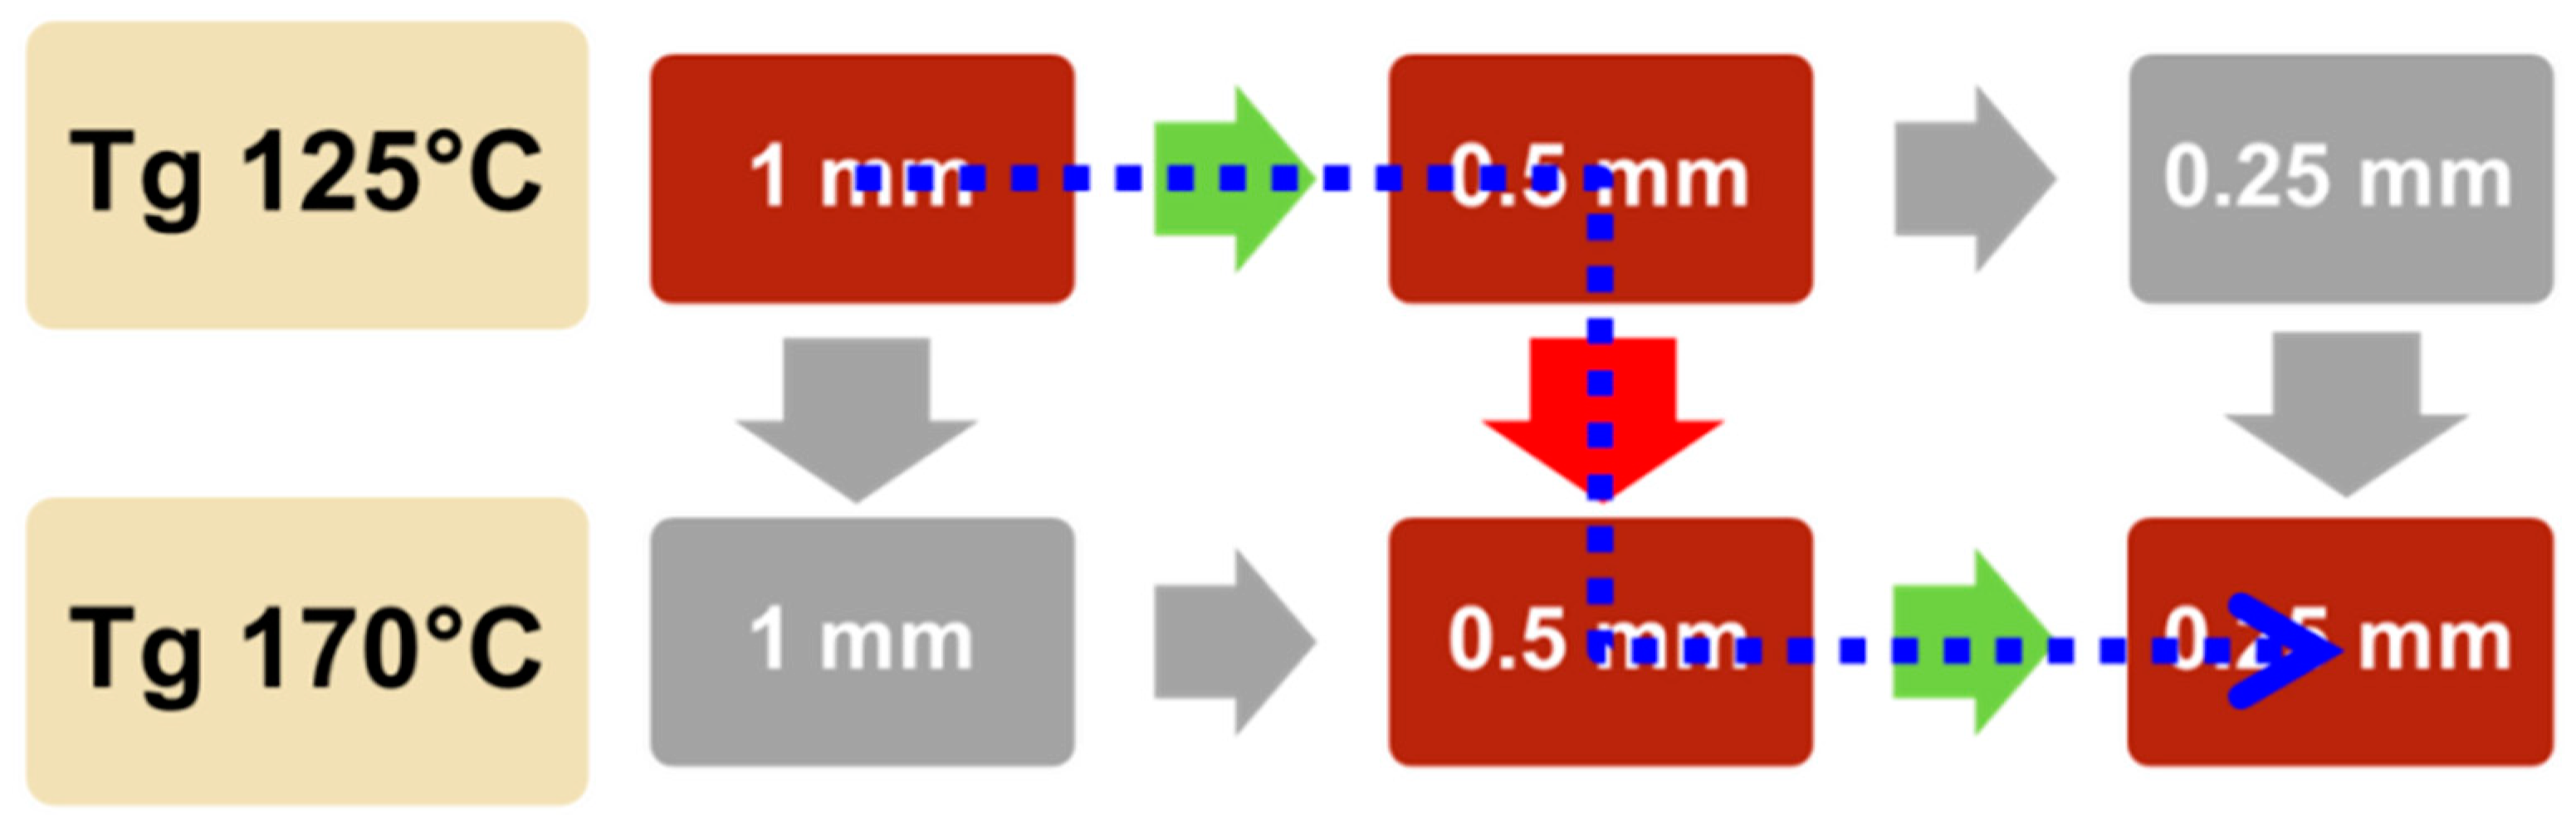
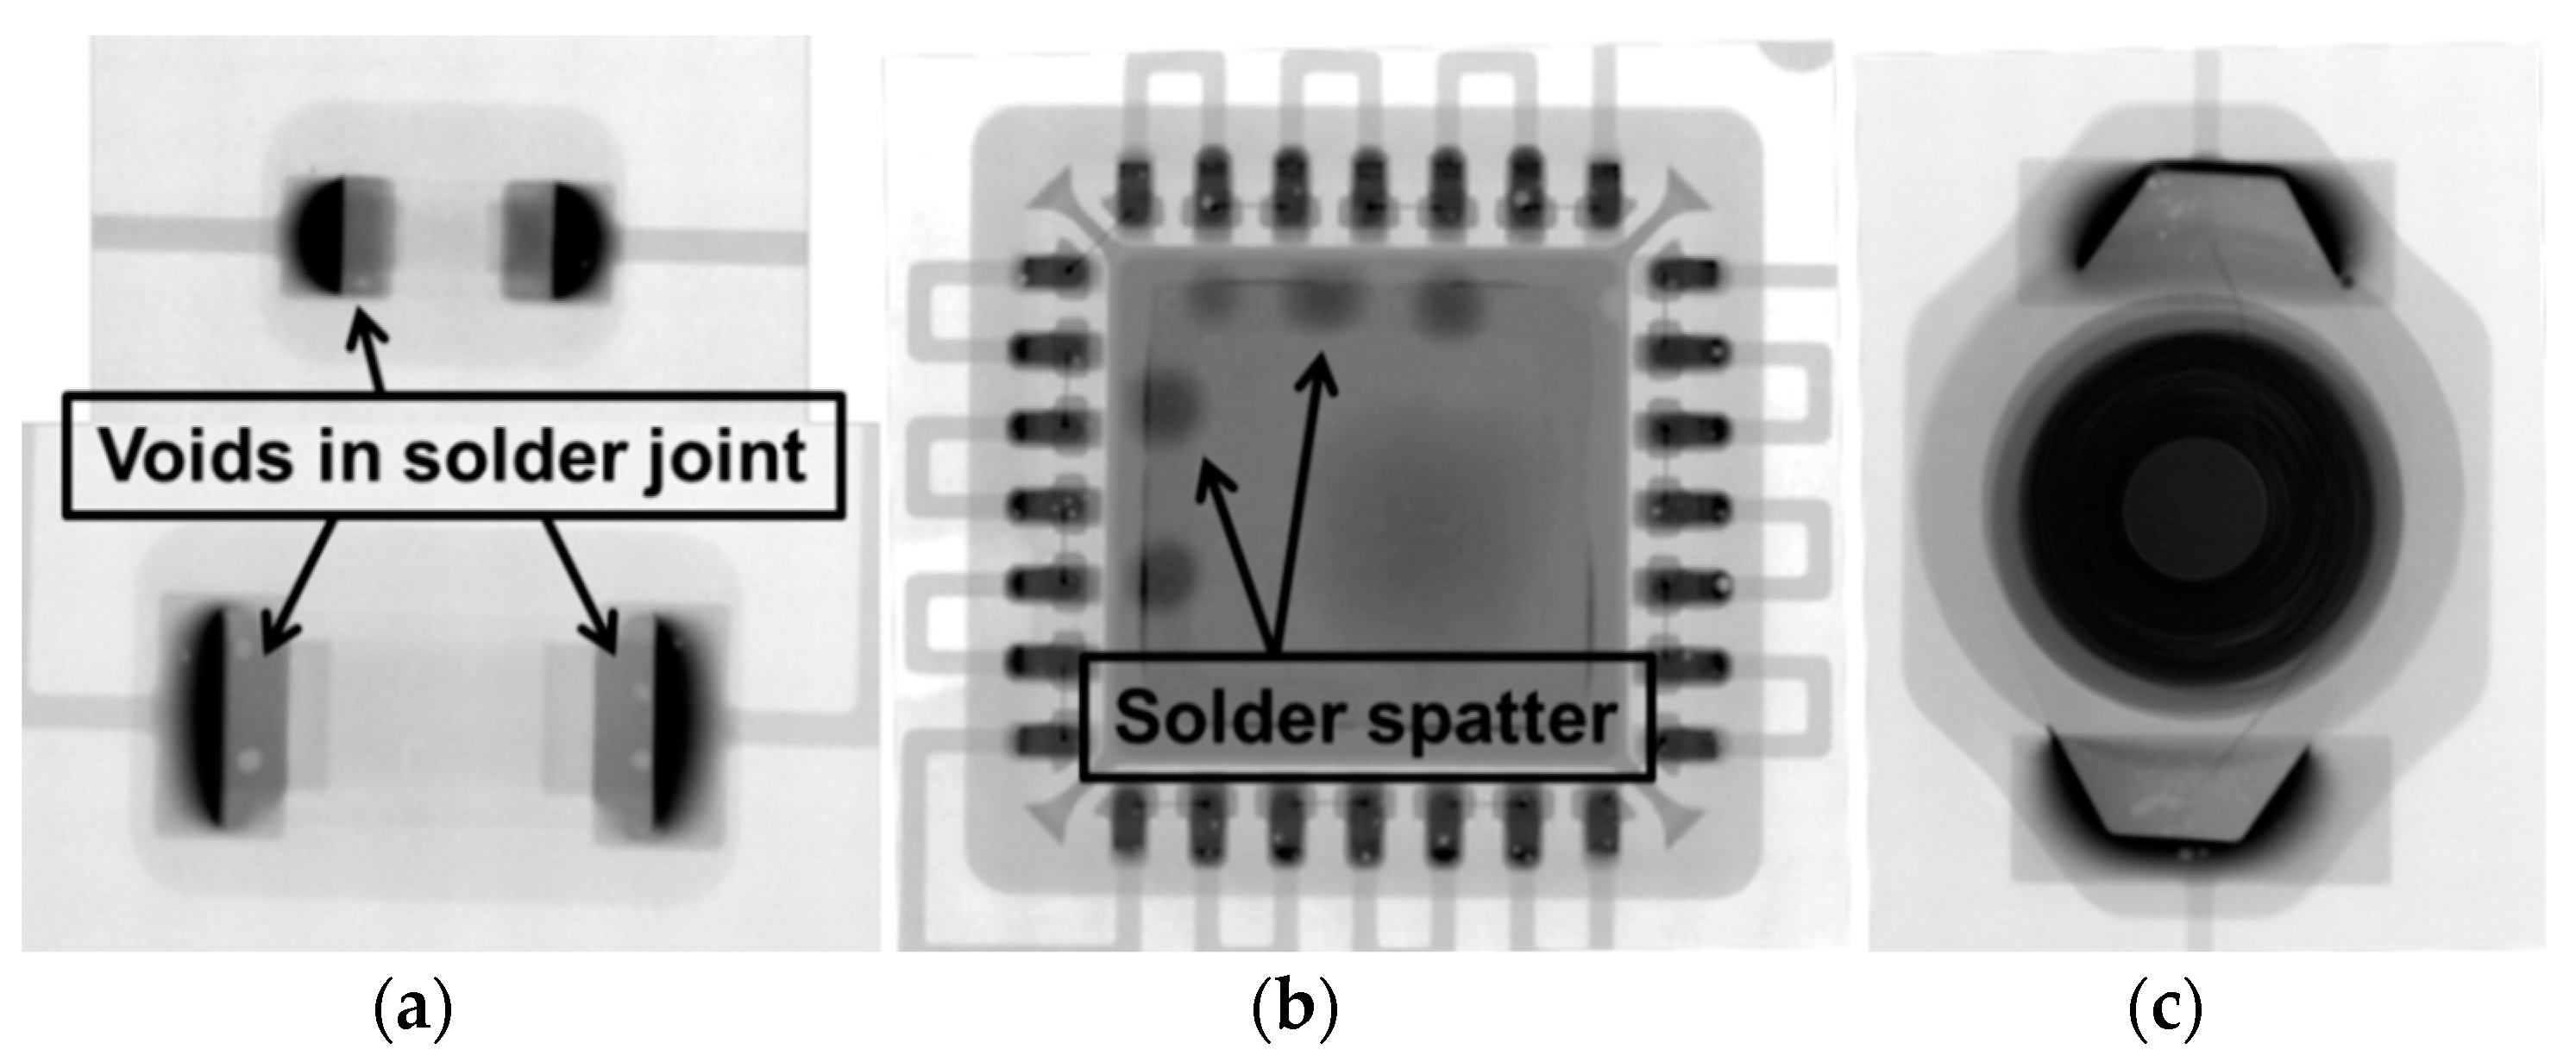
3.2. Characterization of the Encapsulation
- after mounting of the electronic devices,
- after the drying procedure/before injection molding,
- after the injection molding process, and
- after the accelerated curing at elevated temperatures.
4. Discussions and Conclusions
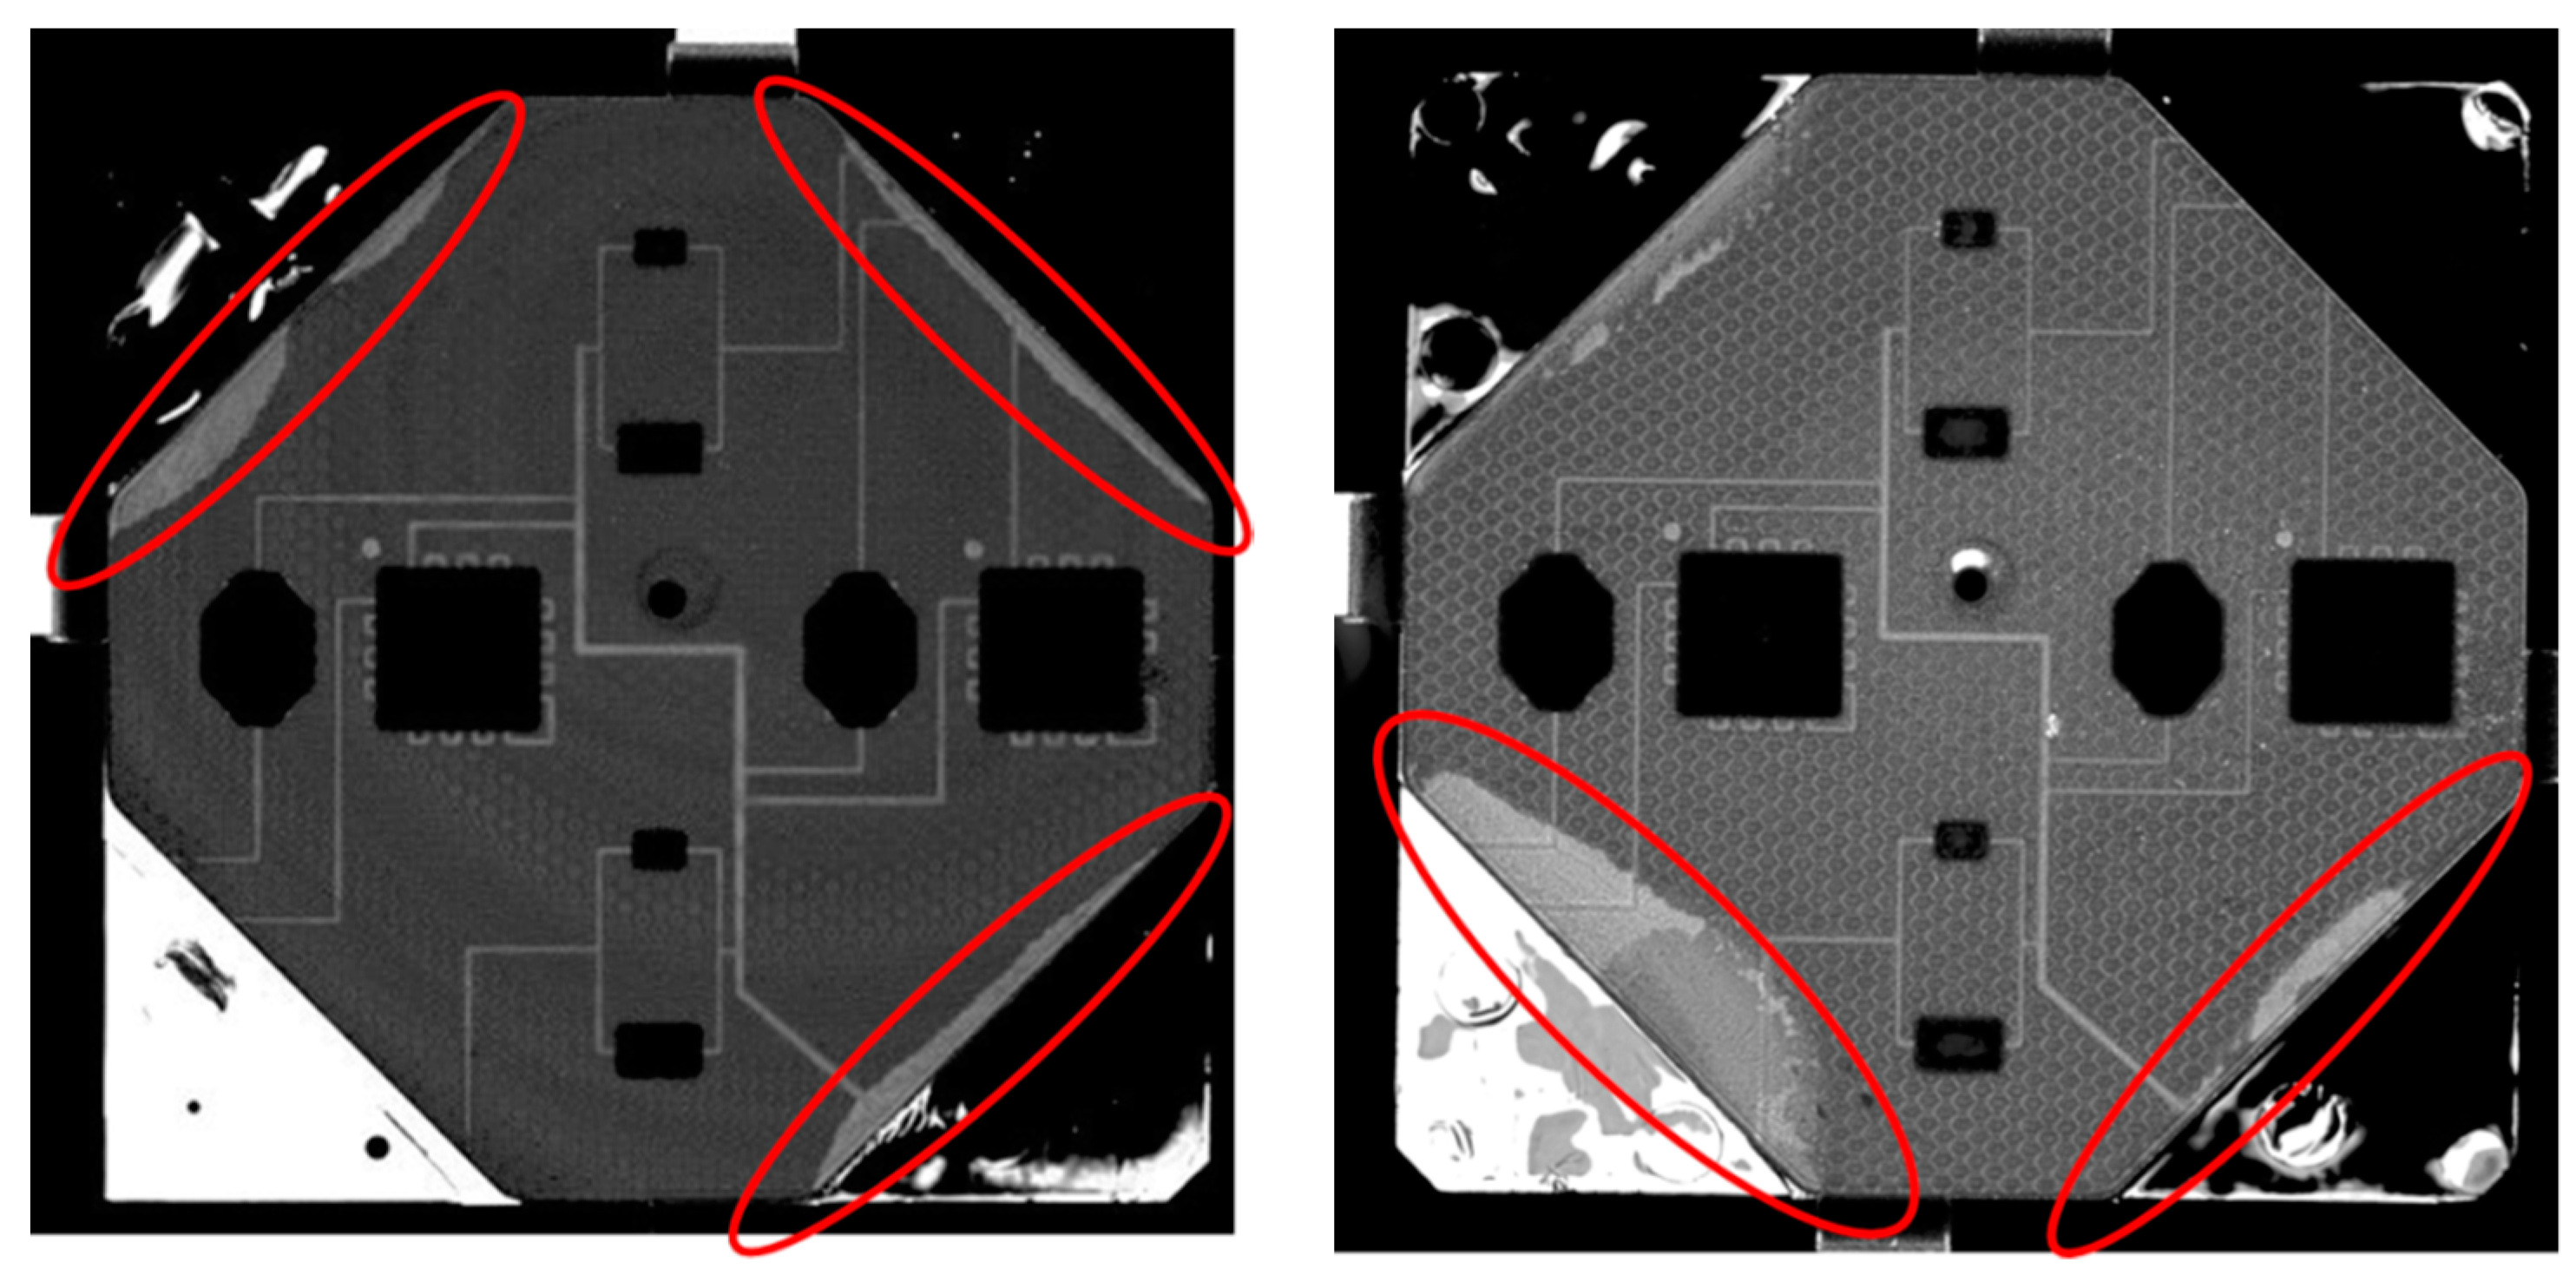
- Areas around tall devices, e.g., induction coils or electrolytic capacitors, should be provided with, first, ample draft angles for easier demolding and to avoid delamination of the encapsulation, and second, with ejector pins that provide an additional function of venting the trapped air.
- Ejector pins should also be placed in the sprue and melt overflow areas to avoid the material from staying behind in the cavity due to strong adhesion with metallic surfaces through curing and thereby blocking the way for further cycles and disrupting the repetitive process.
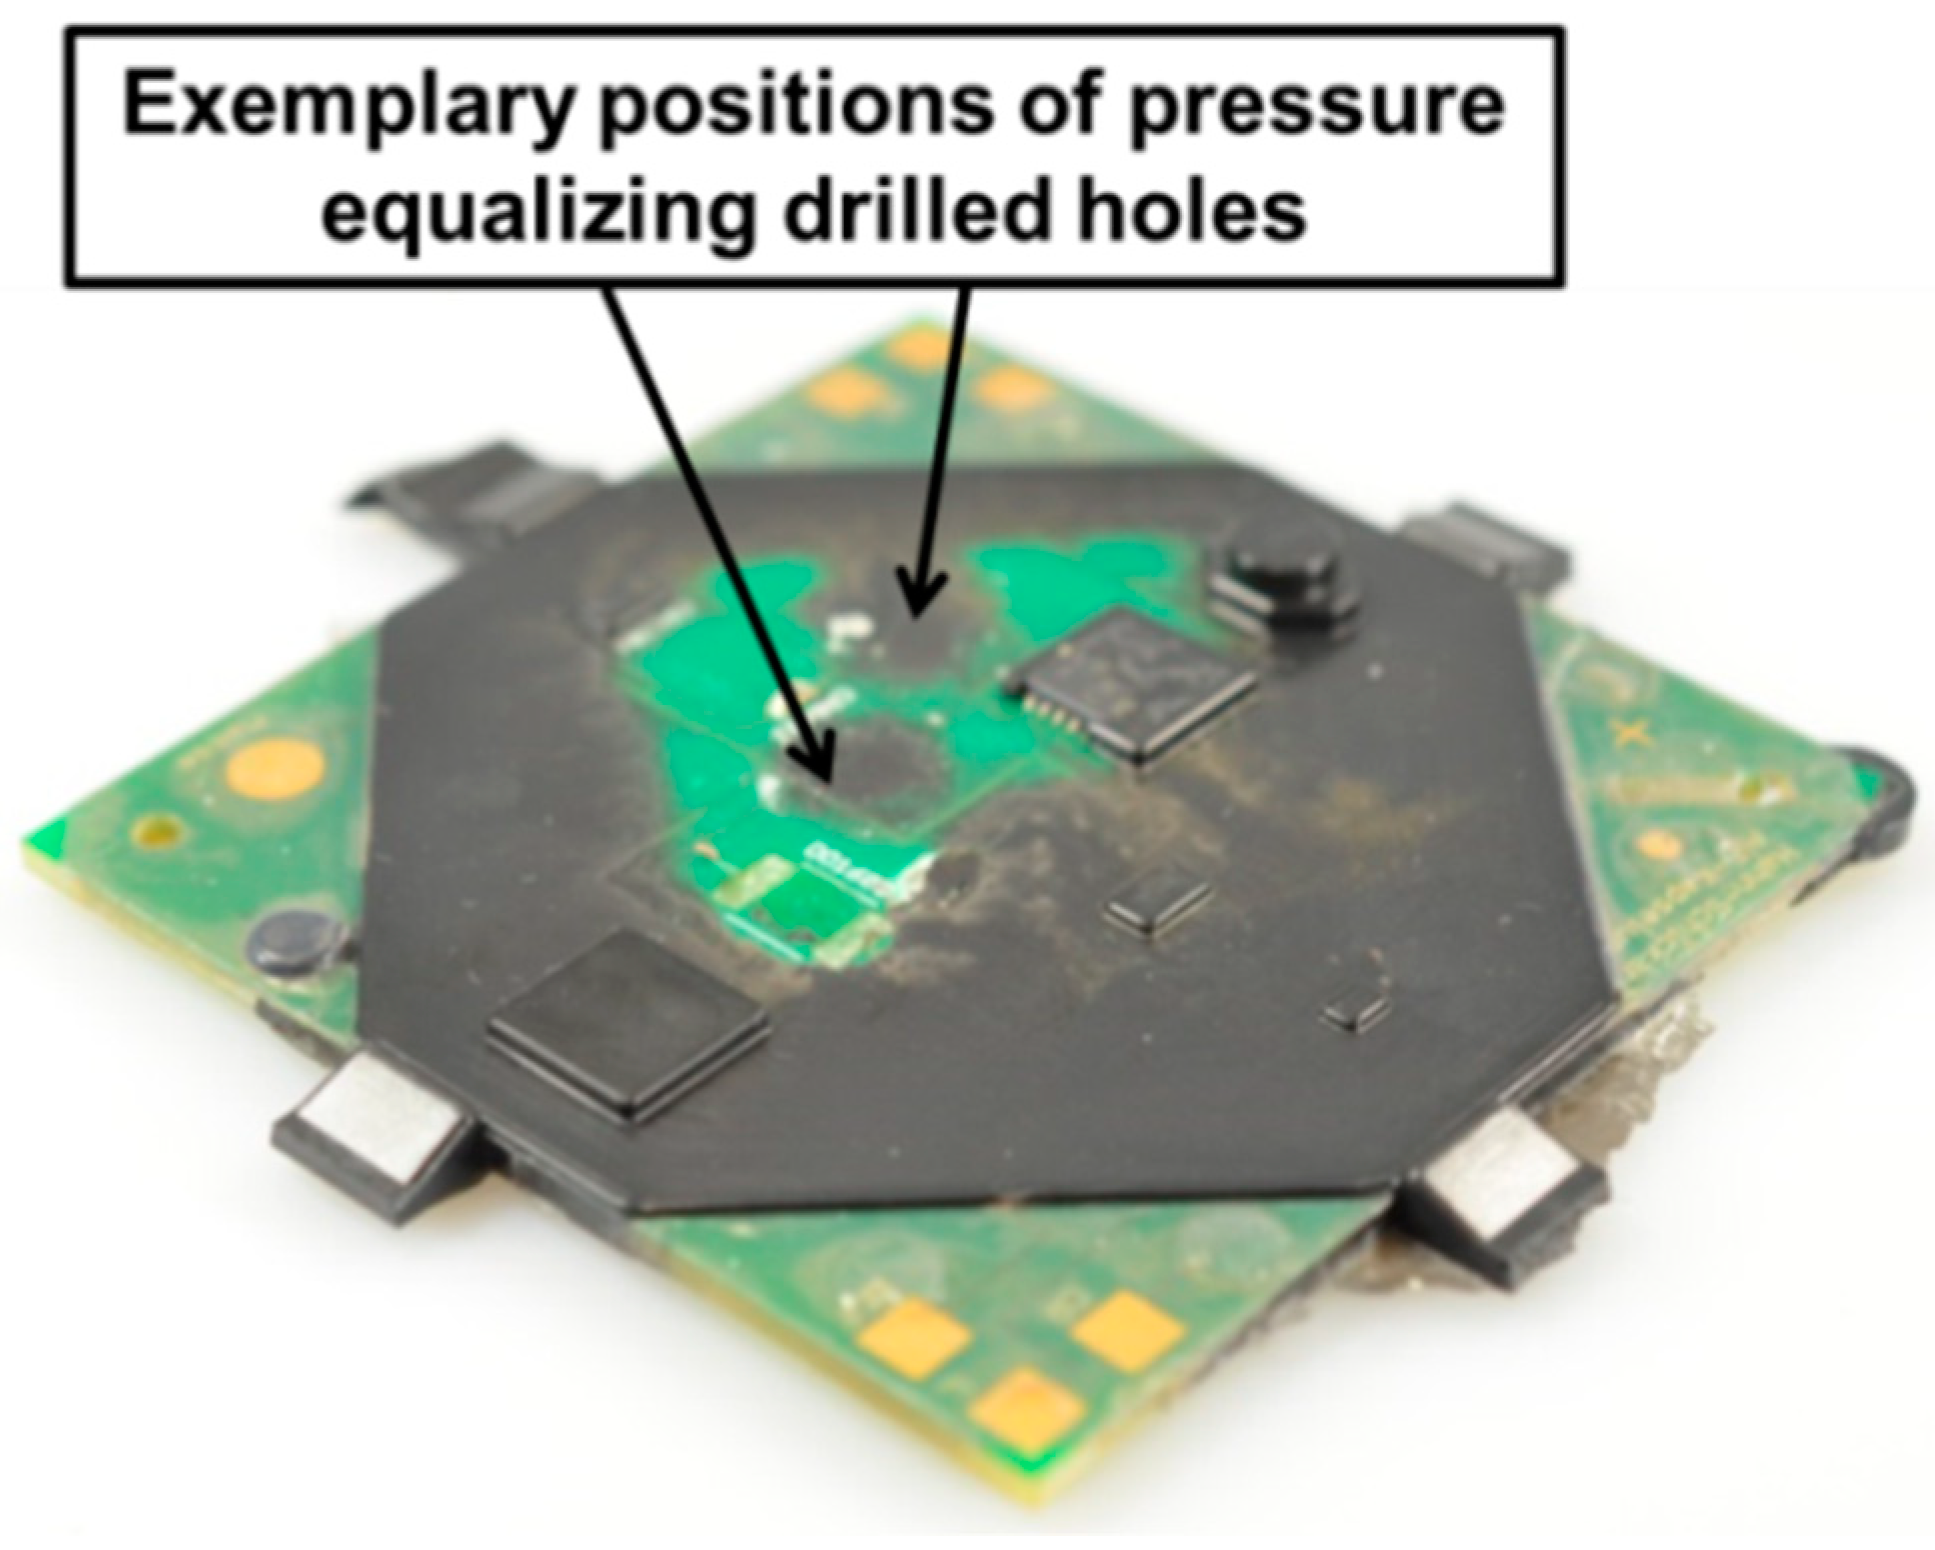
- Pressure equalizing holes on the PCB are highly recommended. They serve an additional purpose of increasing the mechanical stability of the encapsulation.
Author Contributions
Funding
Acknowledgments
Conflicts of Interest
References
- Ardebili, H.; Pecht, M. Encapsulation Technologies for Electronic Applications; William Andrew: Norwich, NY, USA, 2009; ISBN 978-0-8155-1970-6. [Google Scholar]
- Wilde, J. B4.1—Trends in Assembly and Packaging of Sensors. Proc. Sens. 2009, I, 205–210. [Google Scholar]
- Sensor-Trends 2014. Available online: https://www.ama-sensorik.de/fileadmin/Pubikationen/AMA_Trendbericht_Langfassung%5b1%5d.pdf (accessed on 30 January 2019).
- Manzione, L.T. Plastic Packaging of Microelectronic Devices; Van Nostrand Reinhold: New York, NY, USA, 1990. [Google Scholar]
- Kinjo, N.; Ogata, M.; Nishi, K.; Kaneda, A.; Dušek, K. Epoxy Molding Compounds as Encapsulation Materials for Microelectronic Devices. In Speciality Polymers/Polymer Physics; Advances in Polymer Science; Springer: Berlin/Heidelberg, Germany, 1989; pp. 1–48. ISBN 978-3-662-15081-8. [Google Scholar]
- Bonten, C. Kunststofftechnik: Einführung und Grundlagen; Carl Hanser Verlag GmbH Co KG: Munich, Germany, 2016. [Google Scholar]
- Beichter, S.; Weser, S.; Müller, H.; Petillon, S.; Haug, B.; Günther, T.; Eberhardt, W.; Zimmermann, A. Functionalized sensor packaging based on thermoset injection molding and selective metallization technology. In Proceedings of the 2015 European Microelectronics Packaging Conference (EMPC), Friedrichshafen, Germany, 14–16 September 2015. [Google Scholar]
- Kulkarni, R.; Hera, D.; Soltani, M.; Günther, T.; Grözinger, T.; Zimmermann, A. Feasibility of Manufacturing Packaged Electronic Systems by Thermoset Injection Molding. In Proceedings of the 11th Smart Systems Integration Conference 2017, Cork, Ireland, 8–9 March 2017. [Google Scholar]
- Kamal, M.R.; Ryan, M.E. The behavior of thermosetting compounds in injection molding cavities. Polym. Eng. Sci. 1980, 20, 859–867. [Google Scholar] [CrossRef]
- Turng, L.S.; Wang, V.W. On the Simulation of Microelectronic Encapsulation with Epoxy Molding Compound. J. Reinf. Plast. Compos. 1993, 12, 506–519. [Google Scholar] [CrossRef]
- Grözinger, T. Untersuchungen zu Zuverlässigkeit und Lebensdauermodellen für gelötete SMD auf spritzgegossenen Schaltungsträgern; Universität Stuttgart: Stuttgart, Germany, 2015. [Google Scholar]
- Wild, P.; Grözinger, T.; Lorenz, D.; Zimmermann, A. Void Formation and Their Effect on Reliability of Lead-Free Solder Joints on MID and PCB Substrates. IEEE Trans. Reliab. 2017, 66, 1229–1237. [Google Scholar] [CrossRef]
- Soltani, M.; Freyburger, M.; Kulkarni, R.; Mohr, R.; Groezinger, T.; Zimmermann, A. Development and Validation of a Novel Setup for LEDs Lifetime Estimation on Molded Interconnect Devices. Instruments 2018, 2, 28. [Google Scholar] [CrossRef]
- Soltani, M.; Freyburger, M.; Kulkarni, R.; Mohr, R.; Groezinger, T.; Zimmermann, A. Reliability Study and Thermal Performance of LEDs on Molded Interconnect Devices (MID) and PCB. IEEE Access 2018, 6, 51669–51679. [Google Scholar] [CrossRef]
- Technical Datasheet NU 6110V. Available online: https://yellowcards.ulprospector.com/certificate/e171477/duresco-nu-6110-v-nu-6110-t (accessed on 30 January 2019).
- Flexibles Packaging von Mikrosystemtechnischen Bauelementen Basierend auf Leiterplattenträgern mittels Film-Assisted-Molding. Available online: https://docplayer.org/9434933-Flexibles-packaging-von-mikrosystemtechnischen-bauelementen-basierend-auf-leiterplattentraegern-mittels-film-assisted-molding.html (accessed on 30 January 2019).
- Hera, D.; Berndt, A.; Günther, T.; Schmiel, S.; Harendt, C.; Zimmermann, A. Flexible Packaging by Film-Assisted Molding for Microintegration of Inertia Sensors. Sensors 2017, 17, 1511. [Google Scholar] [CrossRef] [PubMed]
- Technical Datasheet NU 5680. Available online: https://yellowcards.ulprospector.com/certificate/e195551/duresco-nu-5680-v (accessed on 30 January 2019).
- Deringer, T.; Gröschel, C.; Drummer, D. Influence of mold temperature and process time on the degree of cure of epoxy-based materials for thermoset injection molding and prepreg compression molding. J. Polym. Eng. 2018, 38, 73–81. [Google Scholar] [CrossRef]
- Technical Datasheet MELOPAS® MF 152. Available online: https://plastics.ulprospector.com/datasheet/e129510/melopas-mf-152 (accessed on 30 January 2019).


| Level | Stage |
|---|---|
| 0 | IC chip |
| 1 | Encapsulated microelectronic package |
| 2 | Printed circuit board with various mounted devices |
| 3 | Multiple PCBs (e.g., RAM) integrated on a mother board |
| 4 | Housed electronics system (e.g., laptop computer) |
| Material Property | Value |
|---|---|
| Density | 2.0 g/cm3 |
| Glass transition temperature | 160 °C |
| Thermal conductivity | 0.85 W/mK |
| Coefficient of thermal expansion (20–105 °C) | 18 ppm/K |
| Young’s modulus (flexural test) | 18 GPa |
| Material | NU 6110 V |
|---|---|
| Melt injection temperature | 70 °C |
| Mold tempering | 180 °C |
| Flow control (flux) | 2 cm3/s |
| Direction | Tg = 125 °C | Tg = 170 °C |
|---|---|---|
| X | 12.8 | 13.5 |
| Y | 13.2 | 15.6 |
| Z (below Tg) | 43 | 55 |
| Z (above Tg) | 242 | 234 |
© 2019 by the authors. Licensee MDPI, Basel, Switzerland. This article is an open access article distributed under the terms and conditions of the Creative Commons Attribution (CC BY) license (http://creativecommons.org/licenses/by/4.0/).
Share and Cite
Kulkarni, R.; Wappler, P.; Soltani, M.; Haybat, M.; Guenther, T.; Groezinger, T.; Zimmermann, A. An Assessment of Thermoset Injection Molding for Thin-Walled Conformal Encapsulation of Board-Level Electronic Packages. J. Manuf. Mater. Process. 2019, 3, 18. https://doi.org/10.3390/jmmp3010018
Kulkarni R, Wappler P, Soltani M, Haybat M, Guenther T, Groezinger T, Zimmermann A. An Assessment of Thermoset Injection Molding for Thin-Walled Conformal Encapsulation of Board-Level Electronic Packages. Journal of Manufacturing and Materials Processing. 2019; 3(1):18. https://doi.org/10.3390/jmmp3010018
Chicago/Turabian StyleKulkarni, Romit, Peter Wappler, Mahdi Soltani, Mehmet Haybat, Thomas Guenther, Tobias Groezinger, and André Zimmermann. 2019. "An Assessment of Thermoset Injection Molding for Thin-Walled Conformal Encapsulation of Board-Level Electronic Packages" Journal of Manufacturing and Materials Processing 3, no. 1: 18. https://doi.org/10.3390/jmmp3010018
APA StyleKulkarni, R., Wappler, P., Soltani, M., Haybat, M., Guenther, T., Groezinger, T., & Zimmermann, A. (2019). An Assessment of Thermoset Injection Molding for Thin-Walled Conformal Encapsulation of Board-Level Electronic Packages. Journal of Manufacturing and Materials Processing, 3(1), 18. https://doi.org/10.3390/jmmp3010018