Article

Metallurgical Analysis of Chip Forming Process when Machining High Strength Bainitic Steels

by
Fares Haddad
1,*,
Christophe Lescalier
1,
Jean-Edouard Desaigues
2,
Anne Bomont-Arzur
2 and
Olivier Bomont
1
1
Laboratoire d’Etudes des Microstructures et de Mécanique des Matériaux, Ecole Nationale Supérieure d’Arts et Métiers Campus de Metz, Metz Technopôle, 4 rue Augustin Fresnel, 57078 Metz, France
2
ArcelorMittal Global R&D, Centre R&D Bars & Wires, Voie Romaine, BP 30320, 57283 Metz, France
*
Author to whom correspondence should be addressed.
J. Manuf. Mater. Process. 2019, 3(1), 10; https://doi.org/10.3390/jmmp3010010
Submission received: 18 December 2018 / Revised: 16 January 2019 / Accepted: 17 January 2019 / Published: 19 January 2019
(This article belongs to the Special Issue New Findings and Approaches in Machining Processes)

Abstract

:
In the following work, we propose a metallurgical approach to the chip formation process. We focus on a turning application of high strength steel in which chips are produced by adiabatic shear bands that generate cutting force signals with high frequency components. A spectral analysis of these signals is applied and highlights peaks above 4 kHz depending on the cutting conditions. A microscopic analysis on the chip sections provided data on chip breaking and serration mechanisms. Shear band spacing and excitation frequency of the whole cutting system were calculated and gave a good correlation with cutting forces spectra.

1. Introduction

Companies involved in powertrain applications are increasingly relying on bainitic steels due to their opportune correlation between high mechanical resistance and ductility [1]. This structure can plainly be obtained by air cooling after hot forming processes such as forging or rolling, providing a major economic advantage in manufacturing process of the automotive parts. However, it is obvious that the harder the material, and therefore the higher the tensile strength, the more challenging it becomes to achieve stable and profitable machining conditions [2]. Since bainite presents similar mechanical properties to martensitic structures, its machinability is still problematic, and high tool-wear rates are often encountered. This is the outcome of several microstructural characteristics. Ductility strongly expands the tool-chip contact zone, thus increasing cutting forces. On the other hand, in contrast to martensite, bainite sub-units grow to a limited size, giving bainite a finer microstructure and an advantage in wear resistance [3]. In the case of lower bainite, fine carbides inside ferrite laths strengthen the material. Finally, the high mechanical properties required are not compatible with current machinability enhancement treatments based on non-metallic inclusions [4]. The aim of this study is to compare the behaviors of martensite and bainite structures during a high-speed turning process on both macroscopic and microscopic scales.
Steel machinability has been widely investigated and still represents a subject of interest, even in recent decades. Numerous European research projects focused on understanding the relations between machinability and steel properties such as chemical composition, microstructure and inclusions [5,6]. Researchers propose empirical approaches: they are currently based on cutting tests, in which cutting forces are measured for various cutting conditions, chip breakability is investigated, tool life models are presented based on tool wear tests and the classical Taylor model can be replaced by advanced and more accurate ones [7]. More advanced works relied on temperature measurements focusing on the tool and/or the workmaterial: some authors propose to measure temperature using the so-called tool/work thermocouple to rank workmaterials [8]. However, this technique “only” gives a mean temperature at the tool-chip interface, and requires a very meticulous calibration. Other researchers tend to privilege thermographic techniques which provide a temperature distribution at the tool-chip interface as well as in the tool [9]. Some authors investigate the influence of coolant or coolant supply techniques on machinability: HP lubrication has tremendous impact on tool wear and cutting forces and even chip morphology like Polvorosa et al. [10] and Lopez de Lacalle et al. [11]. Polvorasa et al. also shows the influence of the microstructure (i.e., grain diameter) on both forces and tool wear. Hartmann has proposed an extensive analysis of machinability in both turning and drilling for high strength steels with various chemical composition and microstructures (mainly bainite and tempered martensite) [12]. Rm are about 1000–1300 MPa. Hartmann has investigated the influence of the microstructure for one particular chemical composition (i.e., 34CrNiMo6). It appears that, for turning applications using emulsion as coolant, cutting forces, tool wear pattern and tool life are similar, the bainitic structure tend to lower the ductility inducing a better chip breakability. However, these specific results should be regarded with care, since mechanical properties after heat treatment vary widely (difference in Rp0.2 for the same steel grade was about 400 MPa, difference in Z% was about 27%). Thus, microstructure was not the only variable. Montero et al. have investigated the influence of both non-metallic inclusions and microstructure on the machinability of medium carbon steels [5]. Rm are about 900–1000 MPa. Microstructure are pearlitic-ferritic or bainitic or martensitic. Experiments do not show a significant influence of microstructure on cutting forces or chip breakability, but enable us to rank microstructures based on cutting temperature: pearlitic-ferritic induces lower cutting temperatures than bainitic and martensitic. Regarding tool wear for turning applications through the so-called V15 criterion, the authors observed that the best performances are obtained for pearlitic-ferritic or bainitic microstructures with V15 values 10–30% higher than those obtained for martensitic grades. Results are debatable: these two studies show at the same time similar and contradictory results, requiring deeper investigations. Some more theoretical approaches are recently proposed including cutting simulation [13]. New material constitutive models replace the Johnson Cook classical one, and then take into account the coupling between strain, strain-rate and temperature [14] and/or the recrystallisation, which currently appears to be due to the large deformation induced by the intense shearing of the machining process [15,16]. Those theoretical approaches also focus on reliable models for friction as well as the thermal aspect at the tool-chip interface [17].
Only a few works have been carried out to show the influence of the steel microstructure on the chip formation process. Papers usually present the contribution of the workmaterial composition and mechanical properties on machining. Other studies focus on vibrations: the usually undesirable vibrations largely influence chip formation and surface integrity, which has led to three main types of studies, i.e., on the role of the workpiece and cutting conditions in the occurrence of such phenomena (ex: flexible workpiece used by Urbikain et al. [18]), on the influence of chip serration on the occurrence of chatter vibrations [19] and finally, studies that used this vibration to improve chip serration and breakability by inducing forced and controlled vibrations on the cutting tool [20] (vibration-assisted machining).
The present study compares different machining aspects while turning two types of microstructures (bainite and tempered martensite). It focuses on chip morphologies as well as cutting and feed specific forces. Experiments are designed in a way that microstructures are the only variables, thereby avoiding the influences of parameters such as coolant, tool geometry or mechanical properties (a particular attention is paid to the heat treatment).

2. Materials and Methods

2.1. Work Material Characterization

Two types of 42CrMo4 steel bars were chosen each with different heat treatment to avoid any possible influence a chemical composition may have on turning process. Table 1 shows the main alloying elements as well as the mechanical properties of both steel products when subjected to hardness testing and tensile testing. Sample SB represents the bainitic structure obtained after an isothermal transformation using a salt-bath and sample QT represents the martensitic quenched and tempered bar. As intended, both samples showed similar mechanical properties. By having the same chemical composition and close mechanical behavior, we are limiting the number of variables to the microstructure only, and thus emphasizing its impact during high-speed turning. In addition to the chemical and mechanical aspects, characterizing the samples included measurements of the retained austenite. Many authors have studied its influence on machinability through its TRIP effect, so one cannot neglect the presence of an FCC phase when comparing samples. X-ray diffraction showed no presence of an FCC phase in either sample. The values %RA are presented in the table below.
To characterize the work material on microscopic level samples are cut in the rolling direction of bars. The surface is polished by abrasive paper up to P1200 (FEPA P standards ≈ 15.3 μm average grain size) and then by diamond particles at 6 μm, 3 μm and 1 μm. Finally, chemical etching was applied with 4% nital solution for 5 s and with 8% sodium metabisulfite solution for 40 s. The goal is to distinguish the bainitic phase from martensite. The result of this preparation is a light brown background corresponding to martensite and a blue background, often dark or blackened for bainite [21,22,23].
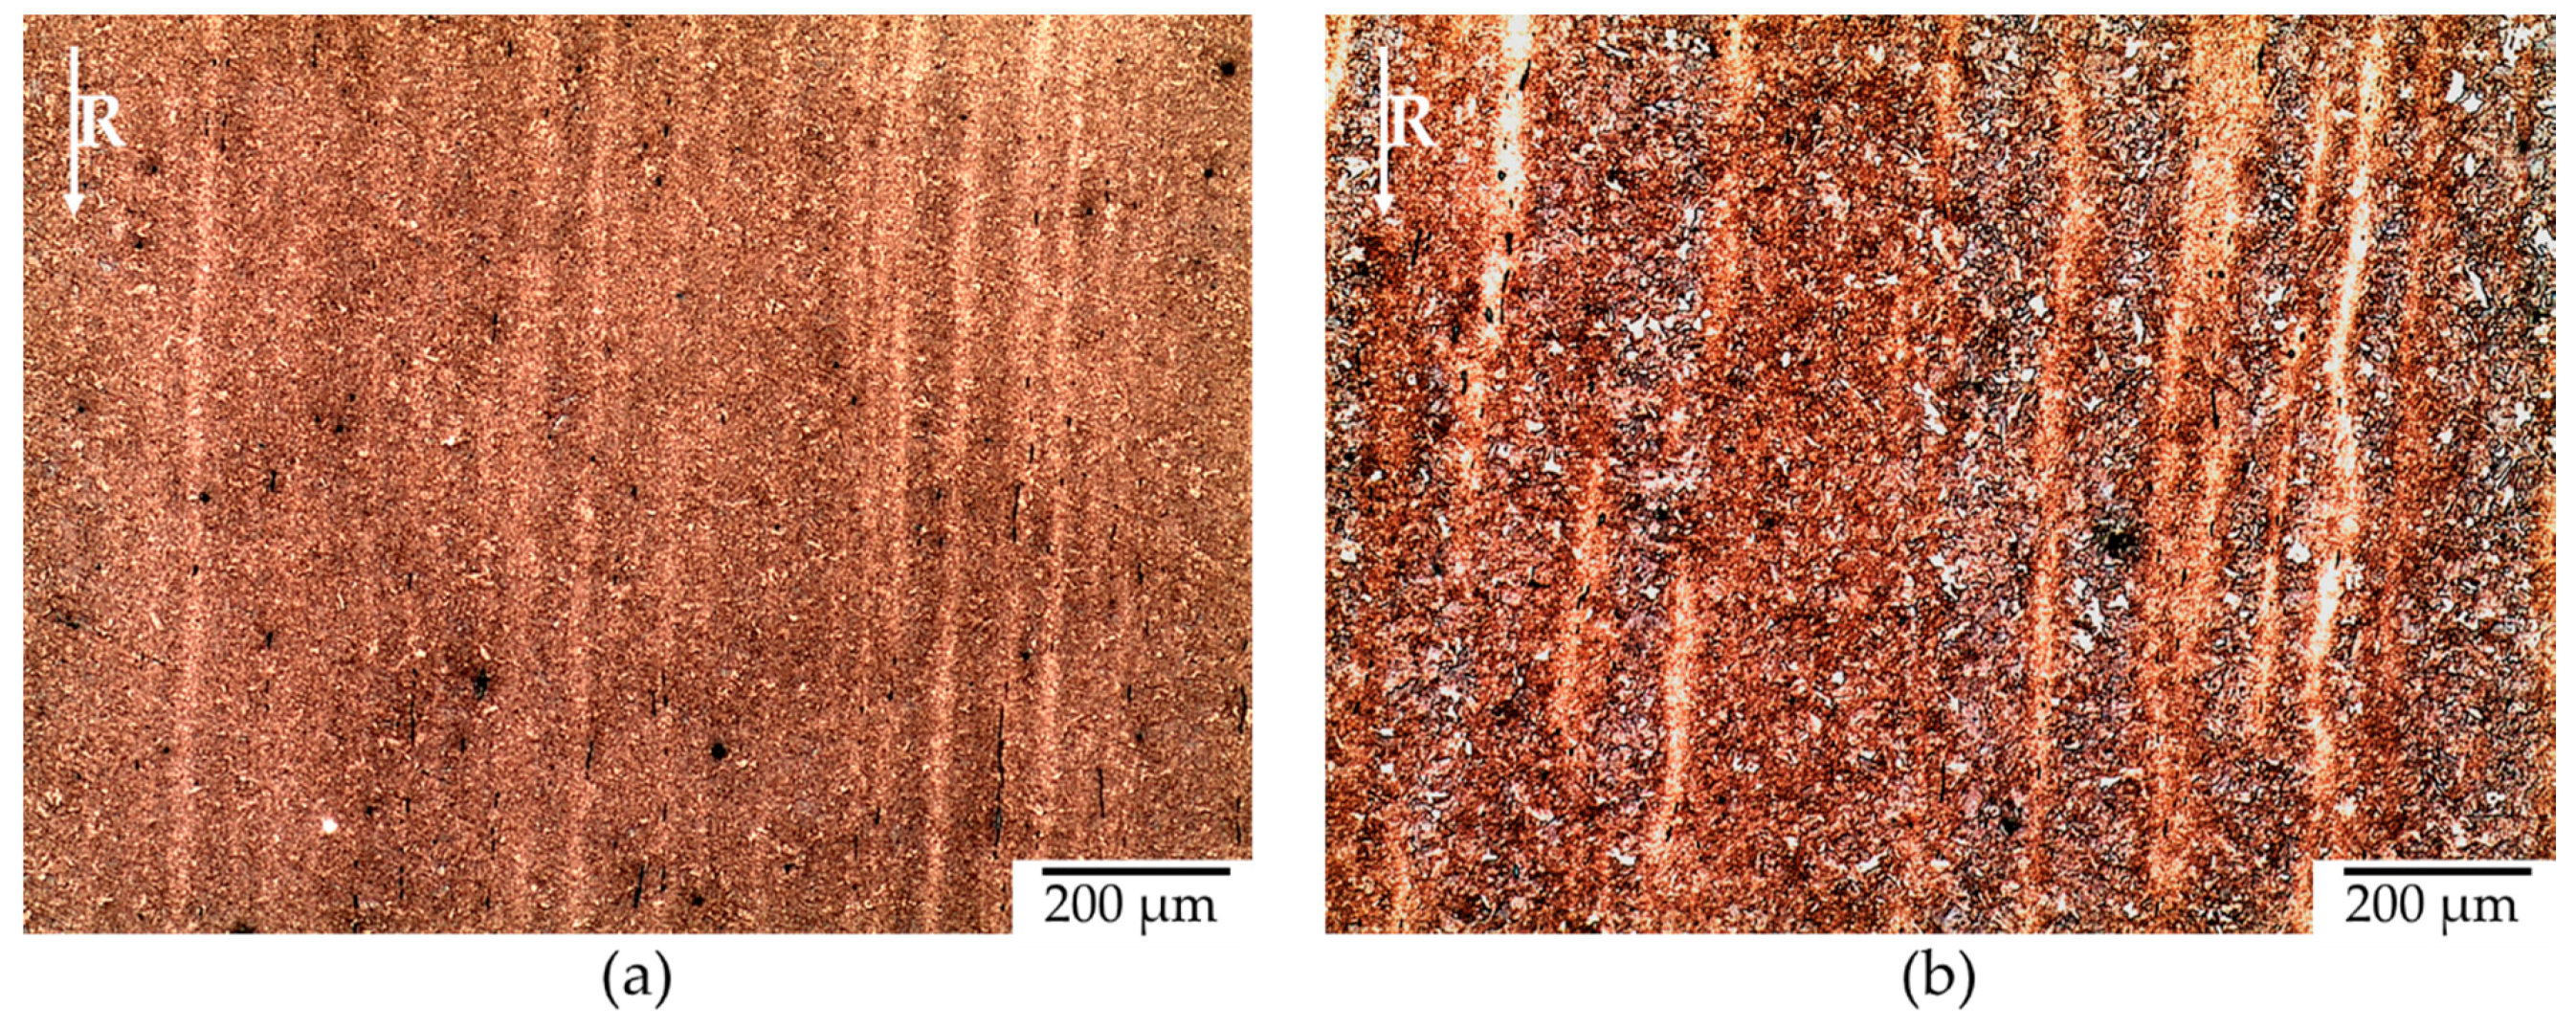
Results are shown in Figure 1. Both images are taken with the same magnification (×5) and 3 mm from the edge of the bar that represents the machined area. As anticipated, we find a very fine structure and difficult to discern at this scale; however there is some difference to extract. The TR sample gave a very fine structure of brown color indicating that the structure is predominantly martensitic. The BS sample gives a very dark background accompanied by brown areas, indicating a dual phase structure which is primarily bainitic with some martensitic islands.
It should be noted that these images give a general idea on the structures present in the steels but do not provide the exact percentages of the phases present in the samples. The proportions of the phases vary enormously, in particular when one moves from the edge of the bar towards its center. Figure 2 shows two images of the same QT sample. That means the two areas have undergone similar polishing and the same etching procedure. Comparing the two pictures, the proportion of bainitic (bluish black) is much higher in the center of the bar than at the edge. Obviously, a similar result is predicted, since the quenching is more severe at the edge than at the center, which will cool more slowly.
In order to minimize the effect of this change, during turning tests we will limit the machining to the area near the edge: For each cutting condition corresponds a small bar (one QT and one SB) that will be cut from a diameter of 45 mm to 41 mm. A decrease of only 2 mm in radius allows us to neglect the change of properties on the outside and inside of the workpiece material.
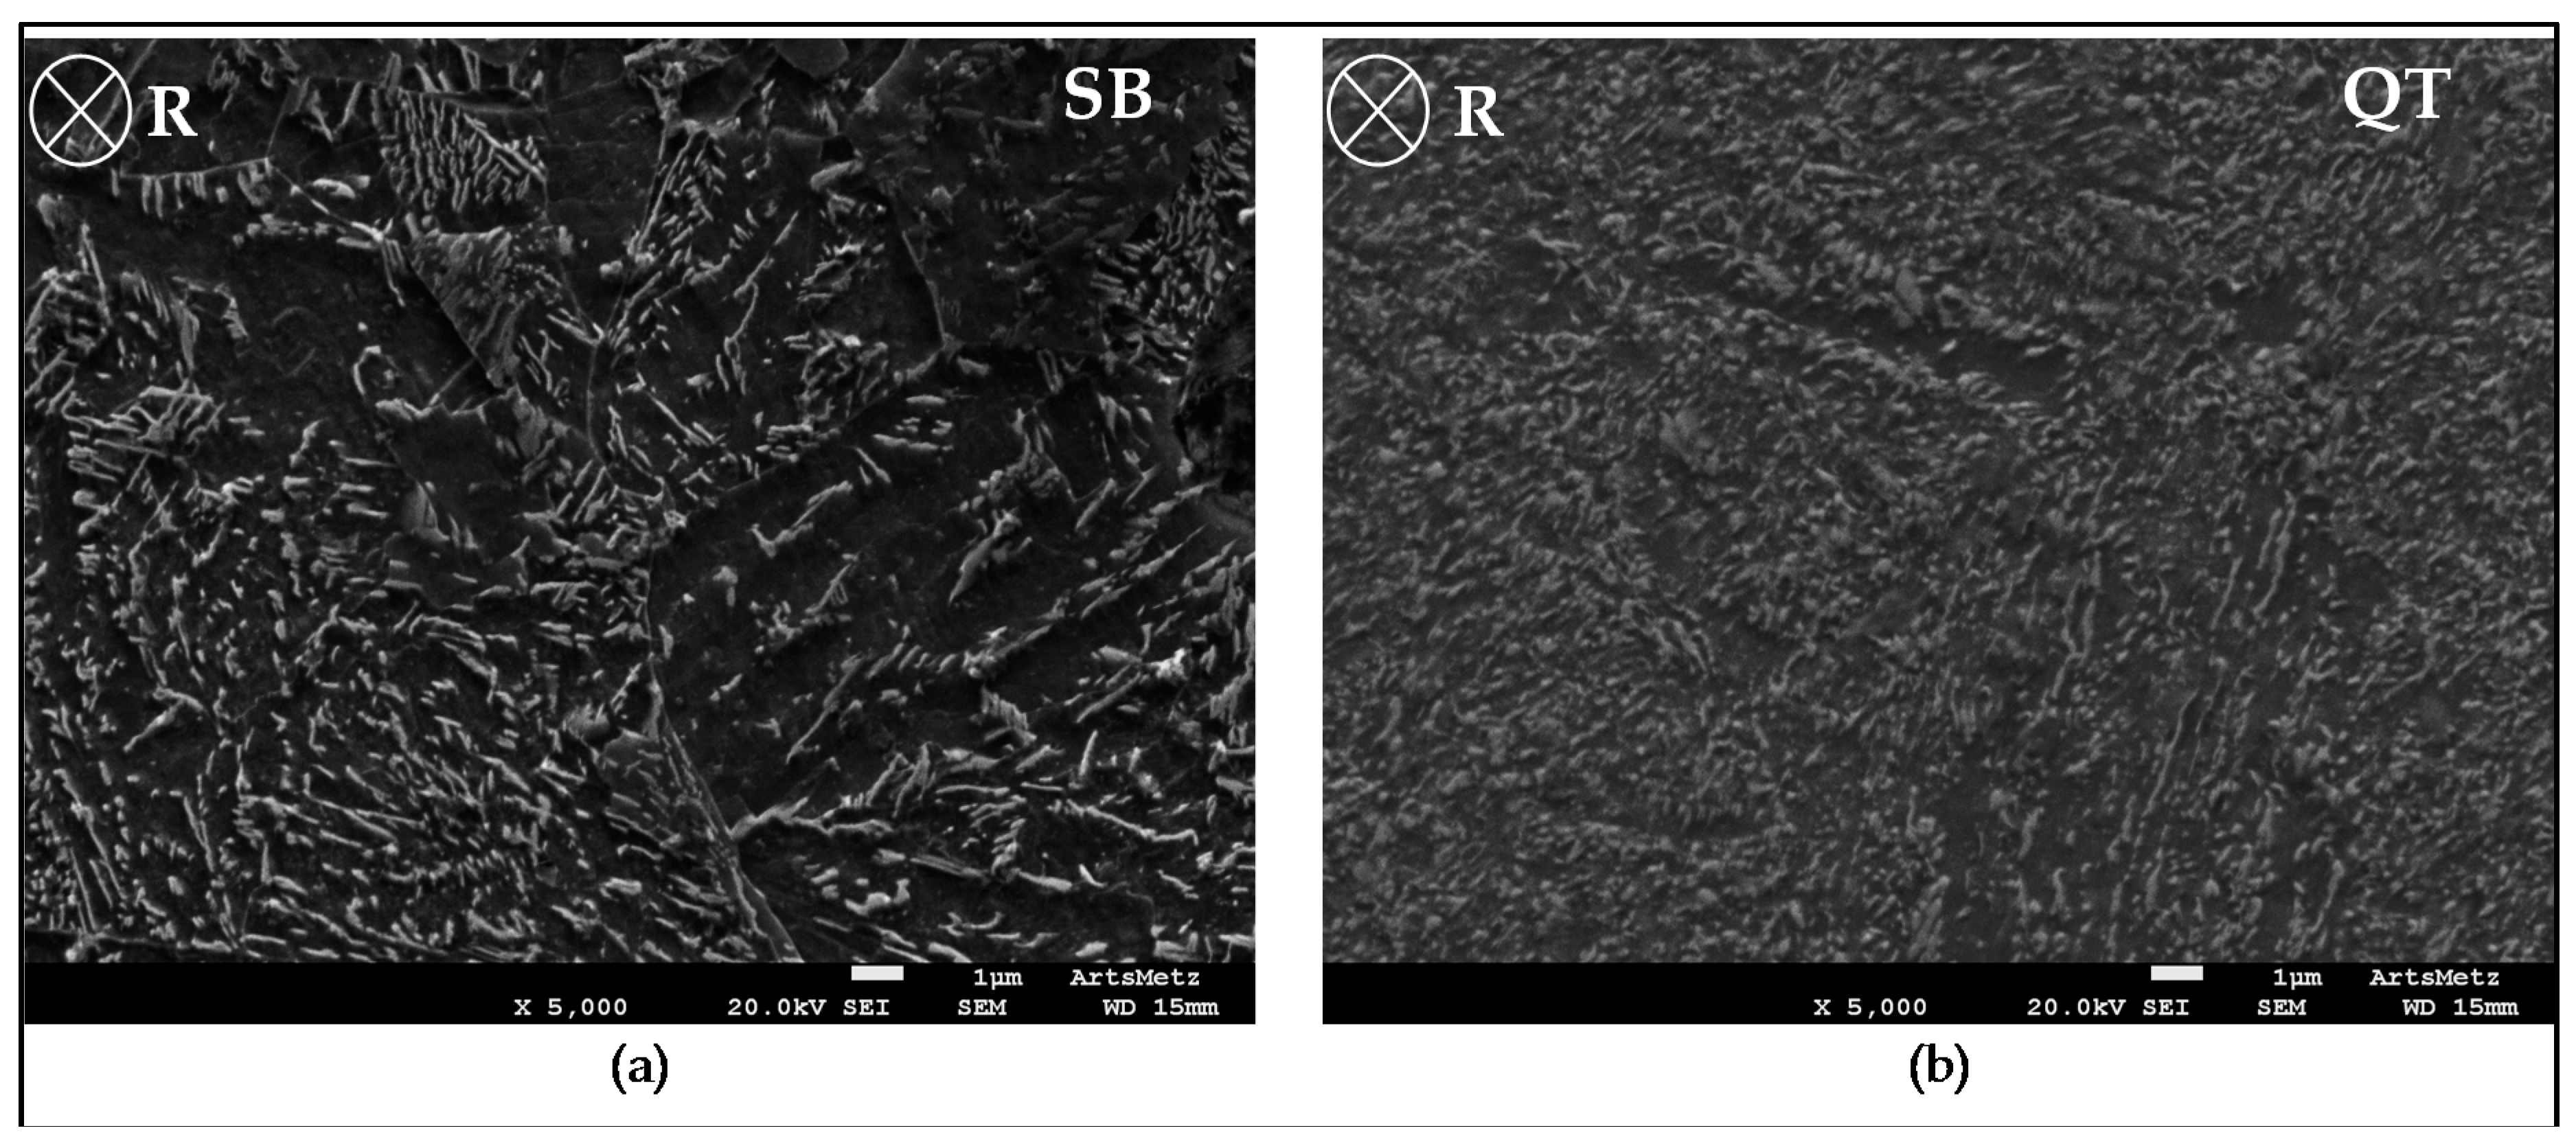
Optical microscopy is insufficient to show a difference between the steel grades investigated. Electron microscopy is therefore used by MEB JEOL 7001 FLV. The surfaces studied in this part represent the section of the bar (rolling direction perpendicular to the plane of the sheet). The samples undergo the same preparation as in the preceding paragraph but without the attack of the solution of sodium metabisulphite (abrasive polishing up to 1 μm diamond + 5 s of 4% nital solution). The micrographs are shown in Figure 3. These images are taken under the same magnification. The studied areas are once again located around 3 mm from the edge of the bars.
SEM shows that the difference between bainitic and martensitic 42CrMo4 is primarily in the size of precipitations. They both have a dark colored matrix (which represents martensitic or bainitic ferrite latts) with white carbides. In the case of quenched and tempered sample, precipitations are very fine (nanometric scale) and abundant. This induces high strength and hardness accompanied by a drop in ductility. This may explain the slight difference seen in the tensile tests. On the other hand, this abundance of carbides normally leads to a drop in toughness: the crack propagates easily because of the notch effect of precipitation [24], and, as far as machining is concerned, can help in the formation of adiabatic shear bands.
The following problems were encountered when characterizing microstructures:
  • The fine microstructure cannot be studied with optical micrographs: trials of indexing the colors and estimating the phases quantities failed.
  • No M/A islands were found in SEM imaging for SB contrary to the optic approach that showed small brown areas.
  • Microstructural features (i.e., ferrite morphologies) cannot be identified similarly to the methods used in the works of Navarro-López et al. [25]. An EBSD mapping is necessary and will take place in the next stages of the study but will not be part of this document.

2.2. Tool Material Couple

The “tool-material couple” method is a standardized experimental protocol which serves to characterize machinability. Experiments are done with the same cutting tool but under varying cutting conditions. The result is an operating range of acceptable machining conditions for each association. A machining condition is considered adequate when specific energy values are reasonable, chips are regular and fragmented, tool wear is controllable, and its rate gives a reasonable tool life, and finally, when surface roughness and quality are compatible with other, similar machining applications. Note that saying “controllable tool wear” refers to the process in which the cutting tool decay: i.e., thermal cracks, edge chipping or massive crater wear are regarded as inacceptable tool wear forms, whereas flank wear with stable width values along the active cutting edge is the only wear process that leads to a predictable tool life. The cutting tool used is a PSBNL 2020K12 tool holder and a SNMG 120408-PM GC4215 insert, both provided by Sandvik Coromant. GC4215 is equivalent to P15 carbide grade. The insert is coated with Al2O3 and TiCN layers. The main cutting edge direction angle κr is 95°. The tool inclination angle λs is −6°. The nose radius rε is 0.8 mm. The main rake angle γn should be −6° (if the insert rake face was flat). The insert rake face presents a chip breaker designed for steel medium machining. To avoid the influence of tool wear on the chip shape as noticed by Fernández-Valdivielso et al. [26], each test is performed with a brand new insert.
All the cutting tests are carried out on a horizontal lathe (SOMAB TRANSMAB 450). The maximal rotating speed and spindle power are about 8000 rpm. And 30 kW respectively. All the tests are performed dry. Cutting forces are measured using a Kistler 9129A dynamometric table. The steel bar has an initial diameter of about 47 mm. It is held in a three-jaw concentric chuck. The bar was first downsized to 45 mm with a specific tool to eliminate run-out (this machining operation is regarded as a preparatory operation, and should not be considered for machinability purposes). All the cutting experiments were carried out with the same depth of cut: ap = 2 mm. The influence of the nose radius is avoided.

2.3. Operating Range

The Tool-material couple’s standard purpose is to measure both the cutting and feed forces (Fc and Ff) and to determine their variations in an operating range by either varying the cutting speed Vc (m/min) or the feed f (mm/rev). In this study, simple turning tests are performed (thus neglecting the radial force) at constant chip width ap = 2 mm and with the same cutting tool geometry. Each test is performed using a new insert to avoid tool wear effect. Thus, the two variables are:
  • At feed rate f = 0.25 mm/rev, the cutting speeds ranged from 50 m/min to 650 m/min.
  • At cutting speed Vc = 200 m/min, the feed varied from 0.05 to 0.4 mm/rev
The cutting tool is mounted on a Kistler piezoelectric dynamometer. The chosen sampling frequency is about 20 kHz. The forces signals collected showed a significant dynamic component. Using a lowpass filter, the value of the force at any given time is decomposed into a low frequency part F ¯ , and a high frequency part F′. After processing the signal, the operating range is determined not from the global specific energy, but from the specific pressures kc and kf calculated from low frequency range values F ¯ and Equations (1) and (2).
k c = F c ¯ A D   or   k c = F c ( t = 1   s ) A D
k f = F f ¯ A D   or   k f = F f ( t = 1   s ) A D
where AD is the chip surface area.
Figure 4 shows two types of filtered signal found. Either the forces were constant during the cutting process (Figure 4a) or a positive slope was encountered showing a continuous increase in pressure (Figure 4b). The later was observed at very high cutting speeds (around 450 m/min), so it is safe to assume that this is due to accelerating tool wear. In this particular case, the specific feed and cutting pressures were not measured by the mean values F c ¯ and F f ¯ , but by the forces registered at the moment of the tool-material contact at t = 1 s, when the tool wear was negligible. These values of both cutting and feed forces at t = 1 s were not instantaneous experimental values, but were calculated through a linear regression of the low-pass filtered force signal. The confidence interval of the force value at t = 1 s is then lower than 1% of the nominal value.
The magnitude of this increase, i.e., the slope, is computed for each operation, and its variation with respect to cutting speeds is examined. The following equations presents respectively the variation of the force DFi (in N/s) and the specific pressure Dki (in MPa/s) with i being the cutting (c), feed (f) or radial (r) component:
D F i = F i t w i t h i { c , f , r }
D k i = 1 A D × F i t w i t h i { c , f , r }

2.4. Signal Processing and Correlation

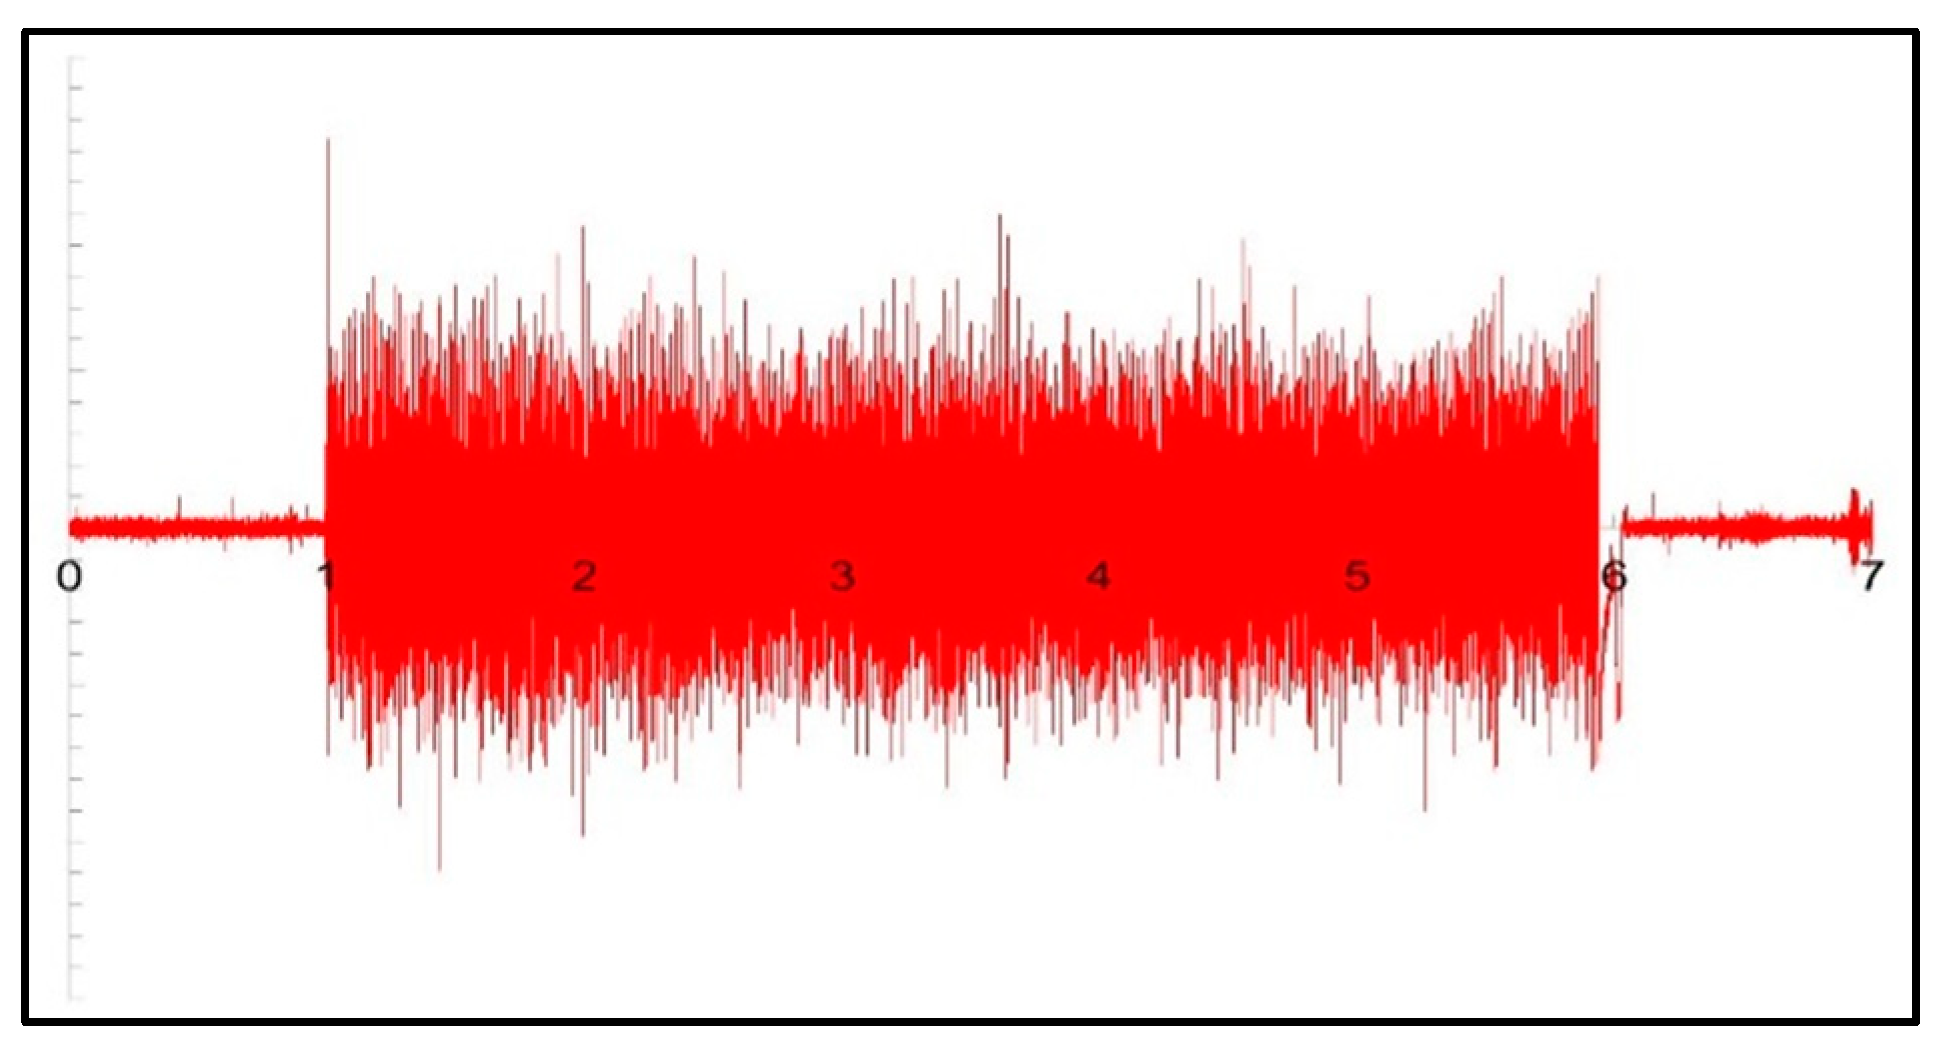
The high frequency (HF) component F’ is obtained by subtracting the low frequency signal from the main one. In this section, we only examined the effect of cutting speeds. The influence of feed rate was not studied. Figure 5 shows an example for SB at Vc = 350 m/min and f = 0.25 mm/rev. HF spectra were first inspected using basic statistical parameters: In most cases, the mean value was around zero, and distribution was symmetrical; however, standard deviations varied widely. Later, they were subjected to Fourier transform to display the system’s vibrations, serration and segmentation frequencies. The frequencies obtained are then compared with the data collected from chip micrography, which consisted of a simple observation of several chips gathered after each operation using a Leica MZ12 stereomicroscope then measuring characteristics like chip length, chip thickness and width of serrated teeth on CATIA V5.

3. Results

3.1. Chip Analysis

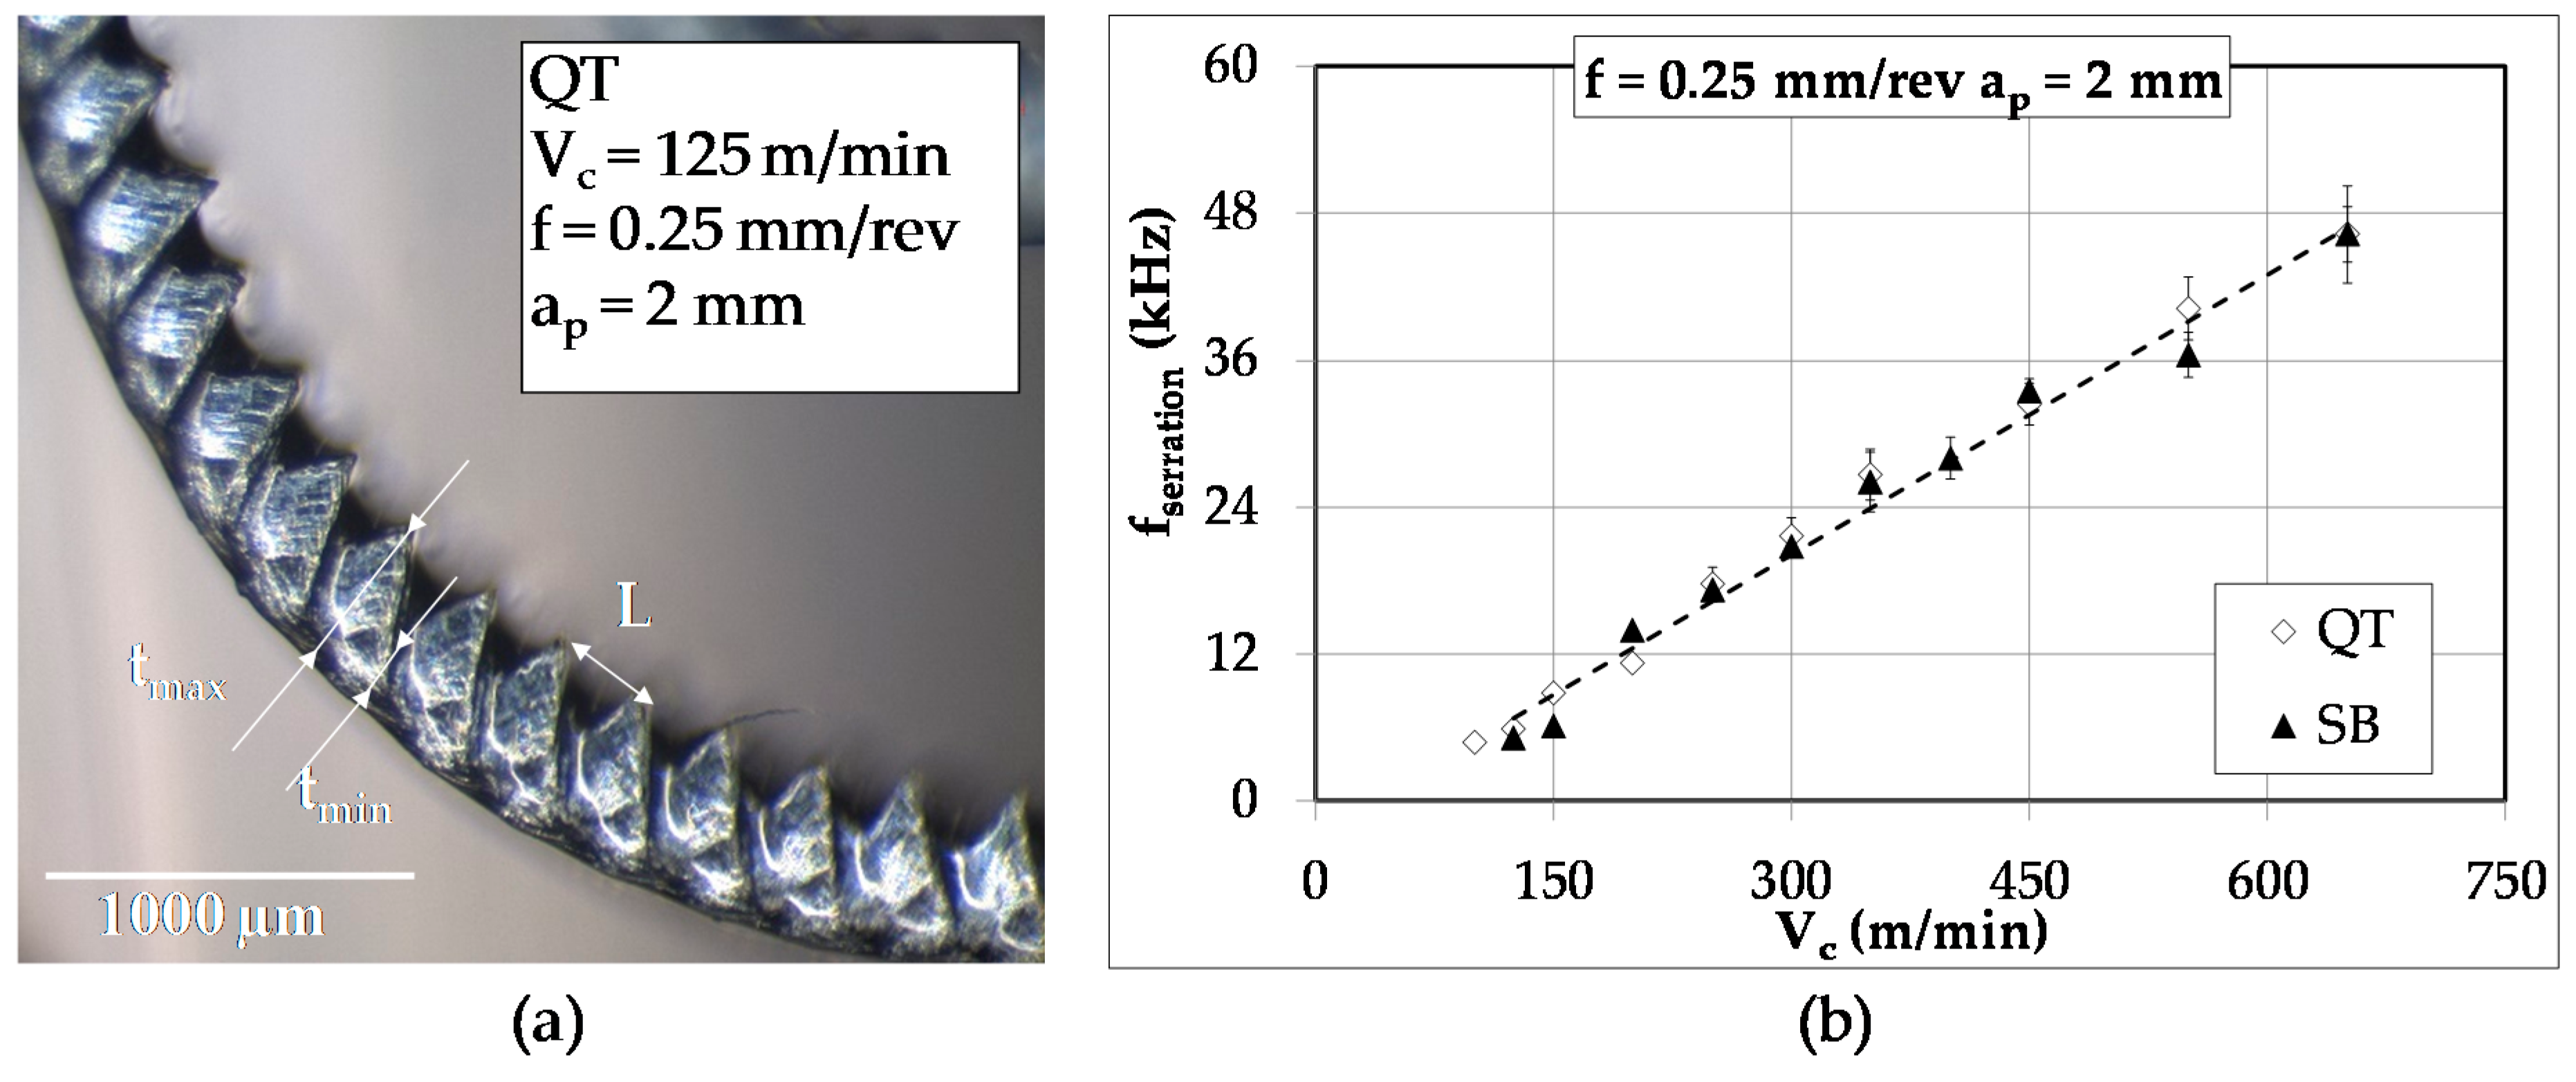
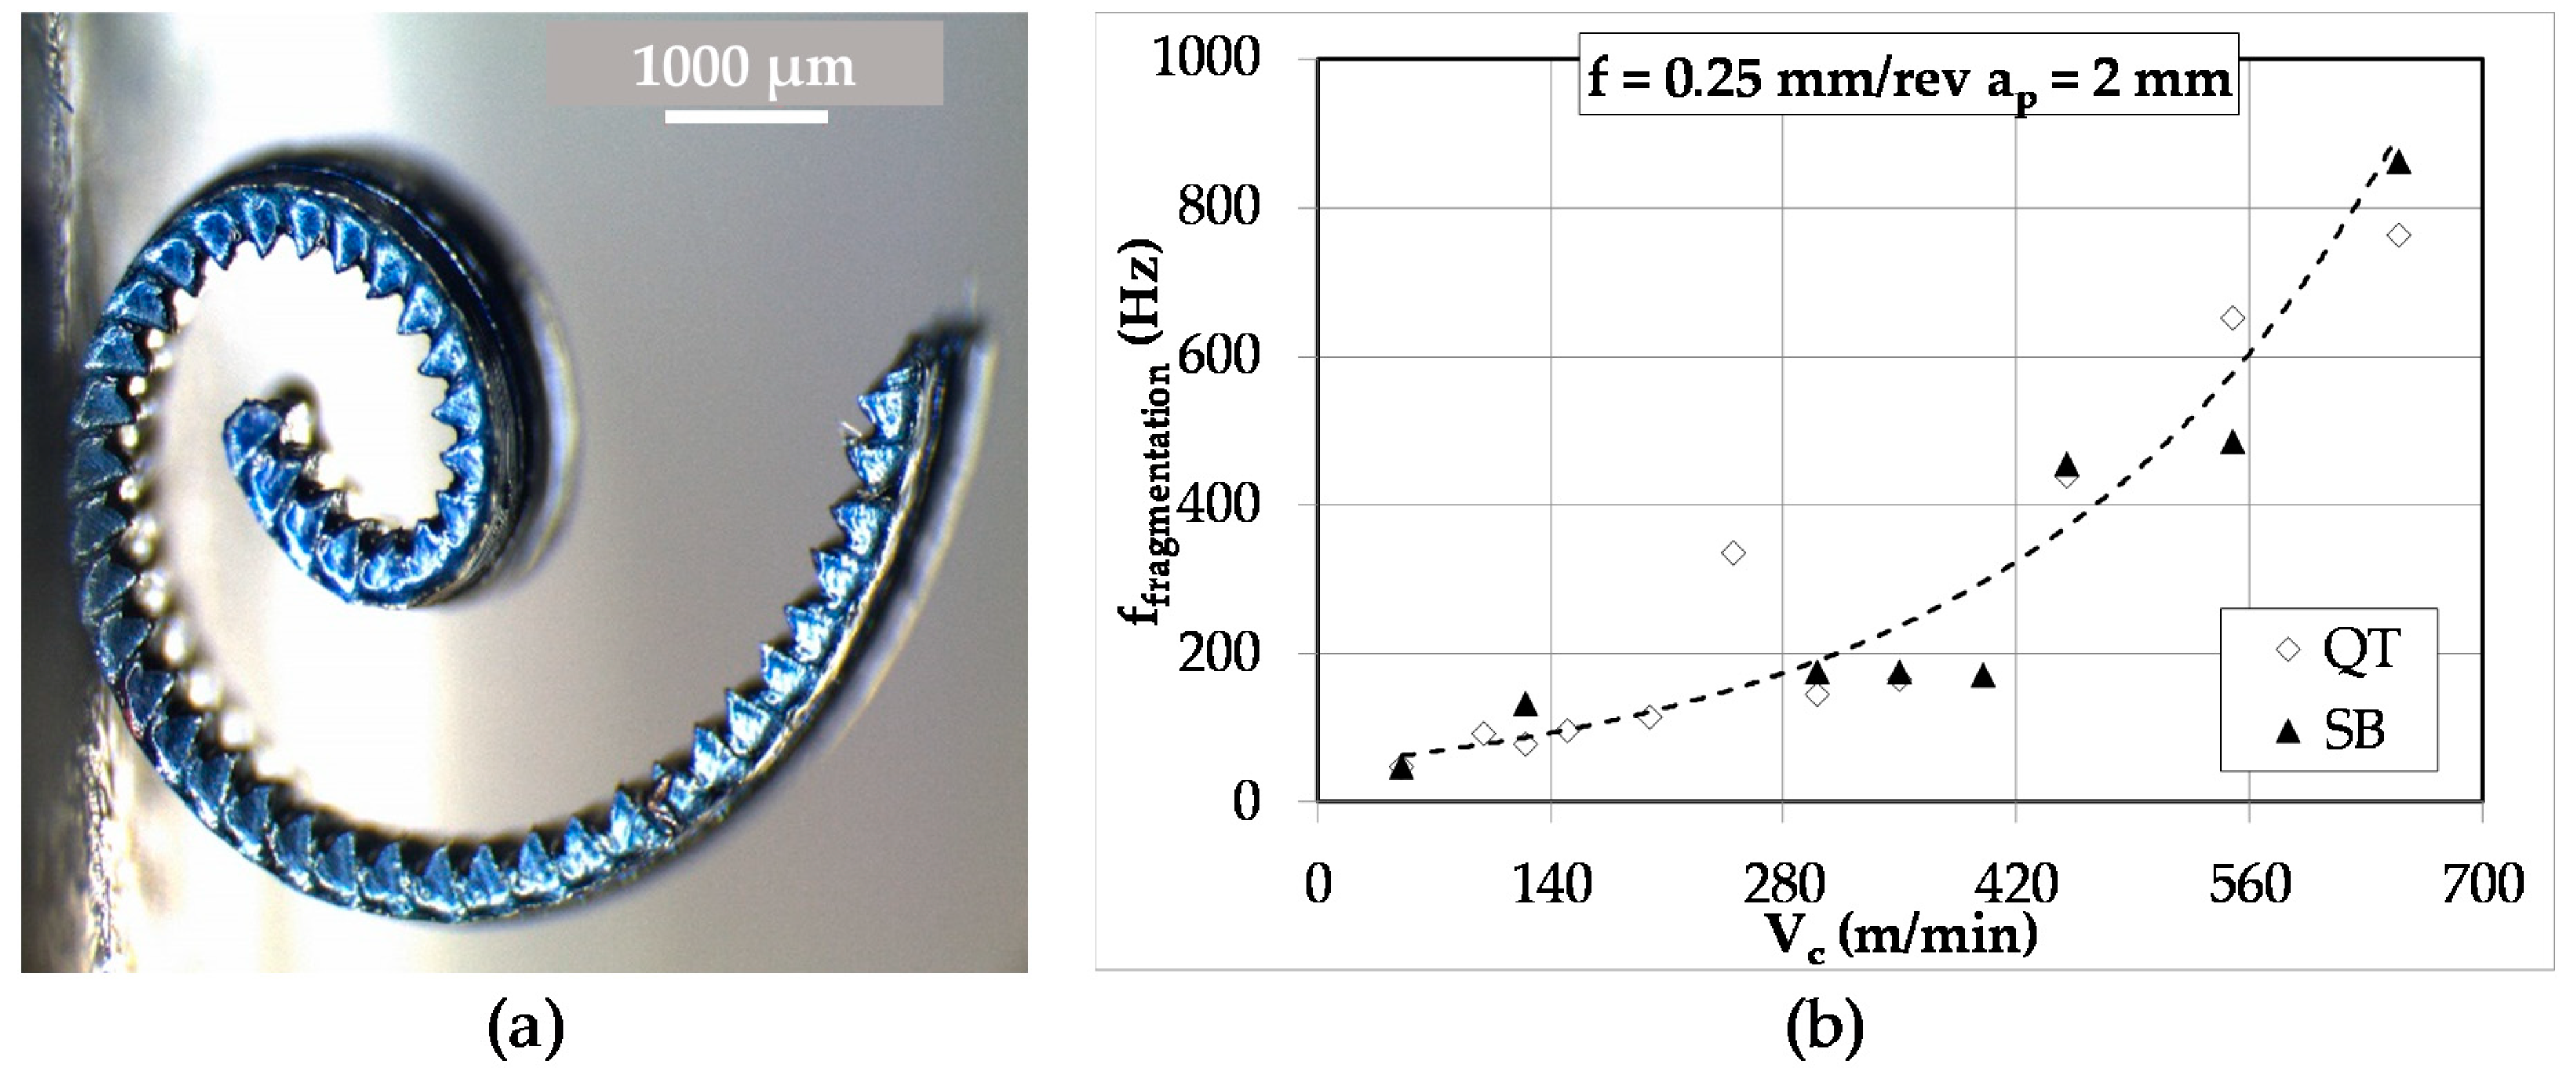
Figure 6a presents a chip micrograph obtained after cutting a QT bar at Vc = 125 m/min. Three dimensions were measured, L: the width of the serrated teeth, tmax and tmin: respectively maximum and minimum chip thickness. The average chip thickness is then computed using:
t ¯ = t max + t min 2
assuming constant material removal rate during cutting:
V c h i p × t = V c × t 1 = V c × f × sin κ r
where Vchip is the chip velocity, t1 the uncut chip thickness, f the feed, and κr the entering angle. Finally, the serration frequency may be estimated using:
f s e r r a t i o n = V c × f × sin κ r L × t ¯
Figure 6b shows results attained after applying Equation (7) for both microstructures. The bars appear to have the same behavior and very close results concerning serration frequency. Additionally, this result showed a complication in this approach: at cutting speeds exceeding 300 m/min, serration frequencies became higher than the sampling rate used for cutting force measurements, i.e., 20 kHz (see Section 3.2).
The same results are encountered for fragmentation frequency, i.e., the difference was imperceptible. Figure 7b shows the exponential variation of fragmentation frequency for both bainitic and martensitic structures. It was expected that for cutting speeds above 300 m/min, QT samples showed higher frequencies than SB samples. This difference highlights the minor ductility advantage of bainite; the more ductile the material, the more it can deform against the tool, and thus, form longer chips before breaking [27]. However, no important difference was found, and for the same cutting conditions, chip length varied widely. The only difference found in chip micrographs was the transition from continuous to serrated chips: for QT it occurred at cutting speeds between 75 and 100 m/min where SB chips were still continuous.

3.2. Cutting Forces Analysis

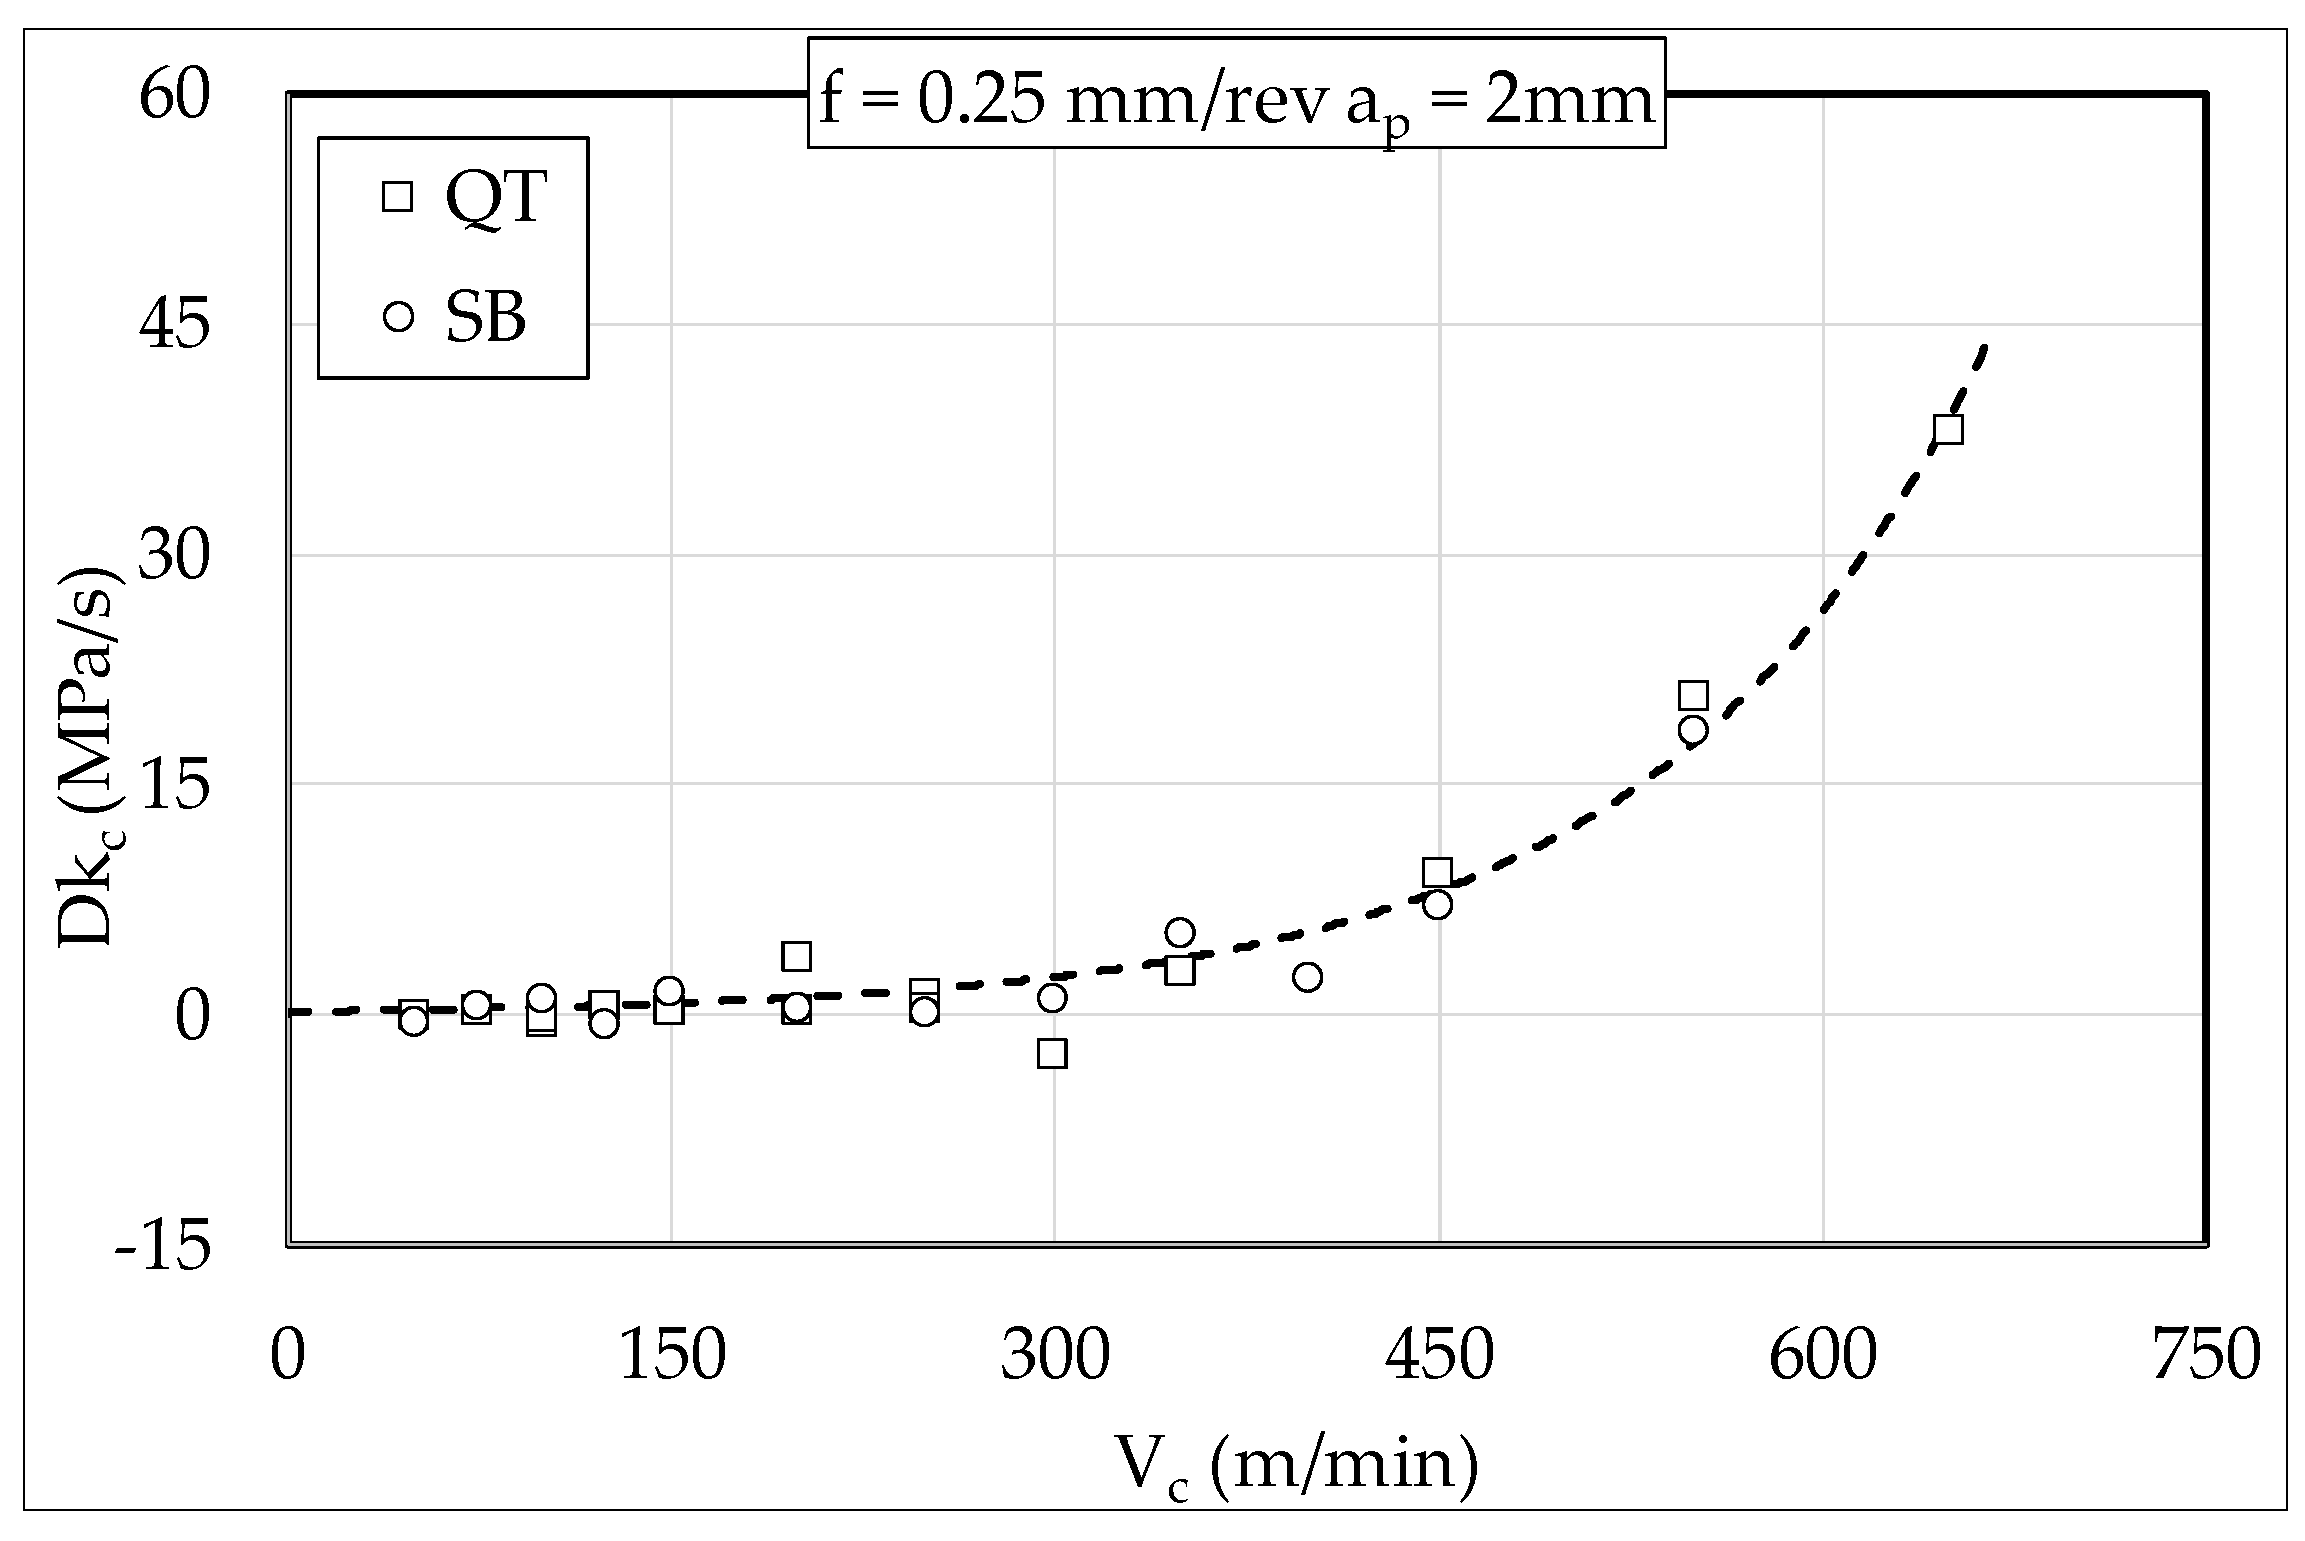
Results for the cutting component are shown in Figure 8. Both experiments exhibit the same behavior, i.e., the rate of the specific cutting pressure variation increased exponentially, and low cutting speeds show an insignificant rate of change. That means that the same cutting force was used during the whole process, in contrast to high cutting speeds, where it increases rapidly after Vc around 300 m/min. Furthermore, values were really close for both samples, even at high cutting speed ex: at 550 m/min the specific cutting pressure increased about 20 MPa/s during the turning of bainite and martensite.
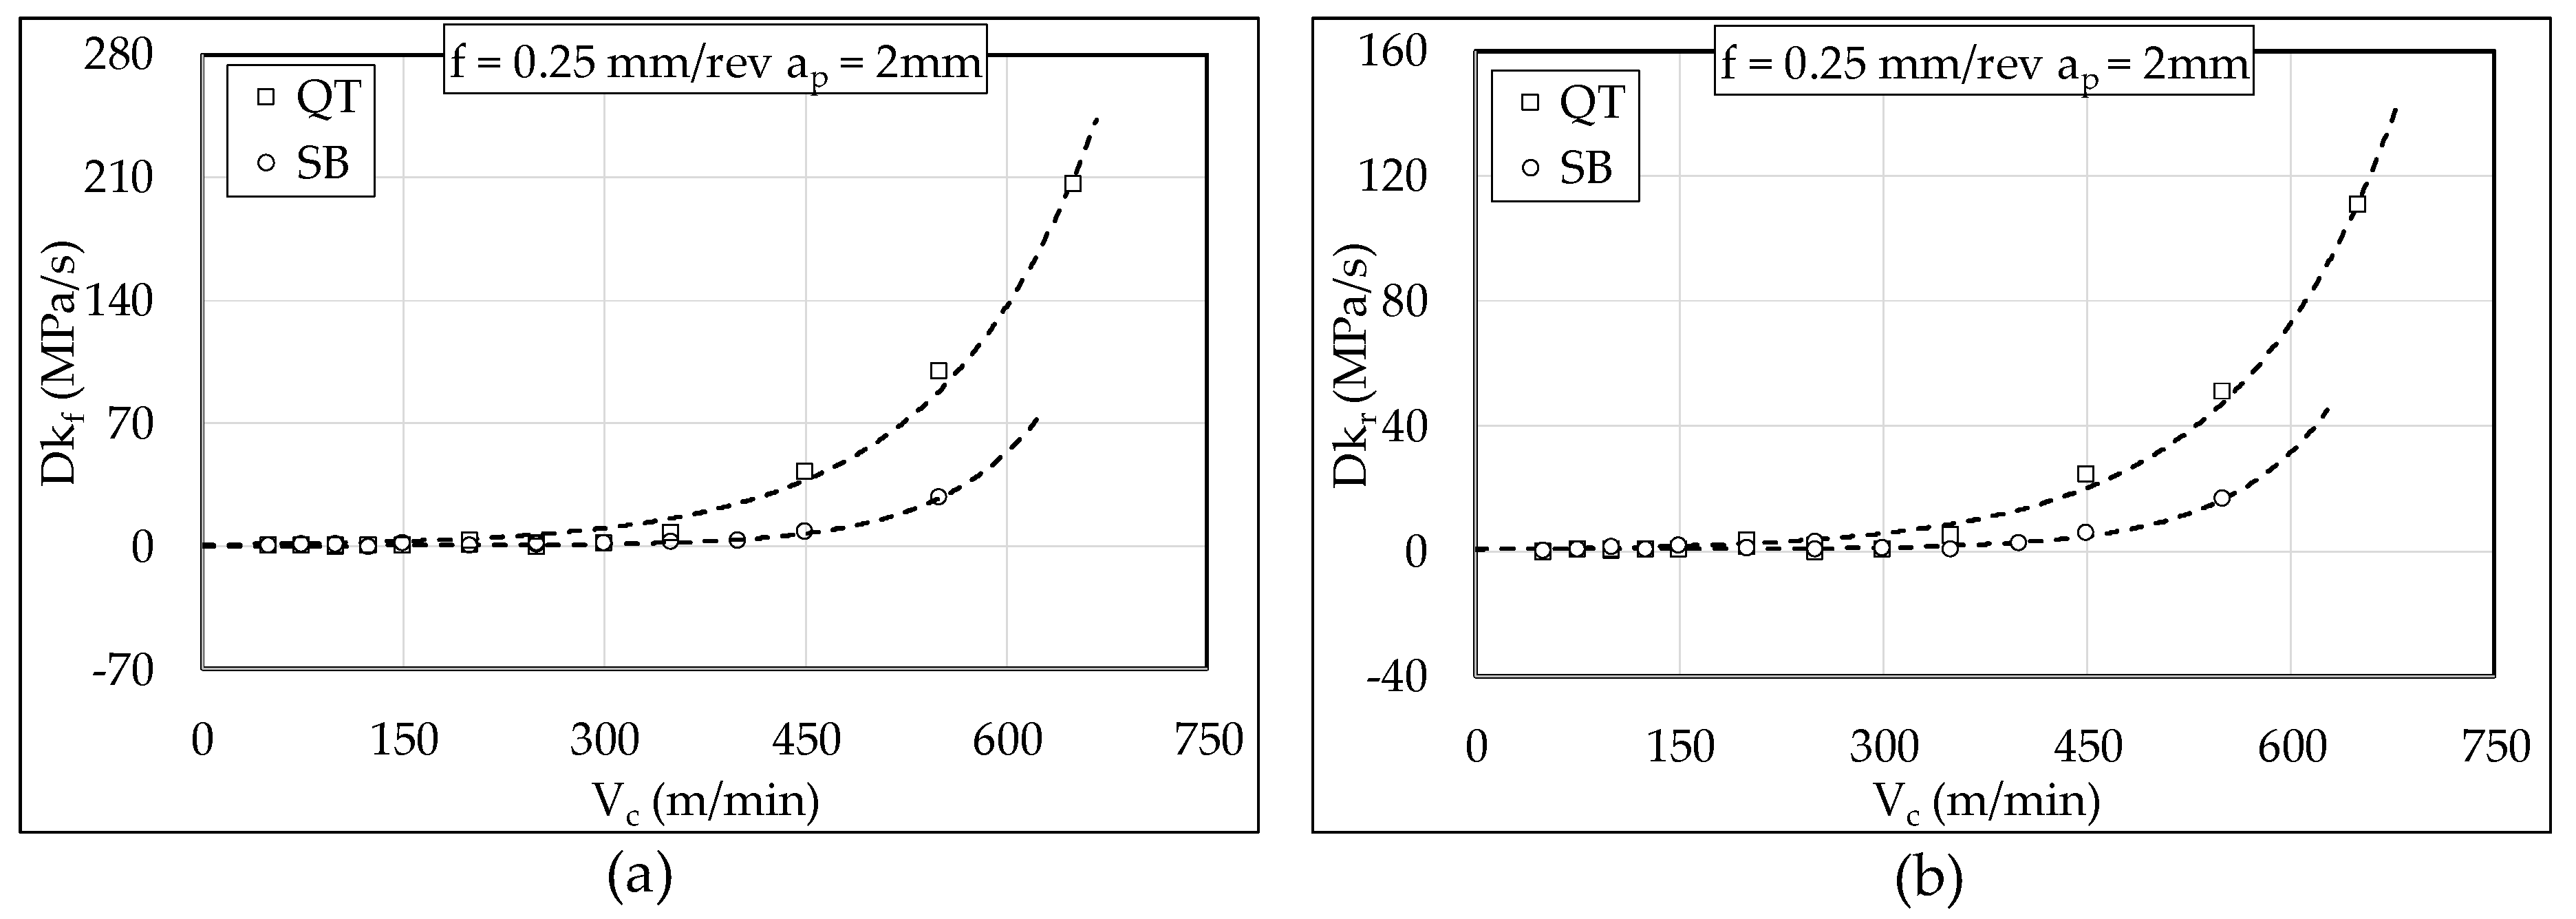
Other force components showed similar results, the feed and radial specific force changing rates also showed exponential trends, but the influence of the microstructure seems more evident (Figure 9a,b). Below a cutting speed of 250 m/min, the rate of change was insignificant; after that, the values diverged, and martensite started showing higher rates of pressure variation. At 550 m/min a difference of 70 MPa/s was measured for Dkf and 35 MPa/s for Dkr between QT and SB. This phenomenon can be explained by an accelerating tool wear process. Cutting speed reached higher values than those currently used for industrial applications (i.e., between 120 and 280 m/min).
This result agrees with the works of Biermann and Hartmann [28]. When comparing samples, they found constant cutting and feed forces at 200 m/min, but continuously increasing ones at higher speeds notably for martensite. Thus, to neglect the effect of tool wear on specific forces when comparing specimens later, the pressures were calculated based on the forces measured at the exact moment the tool engaged the workpiece, i.e., before introducing any damage to the insert.
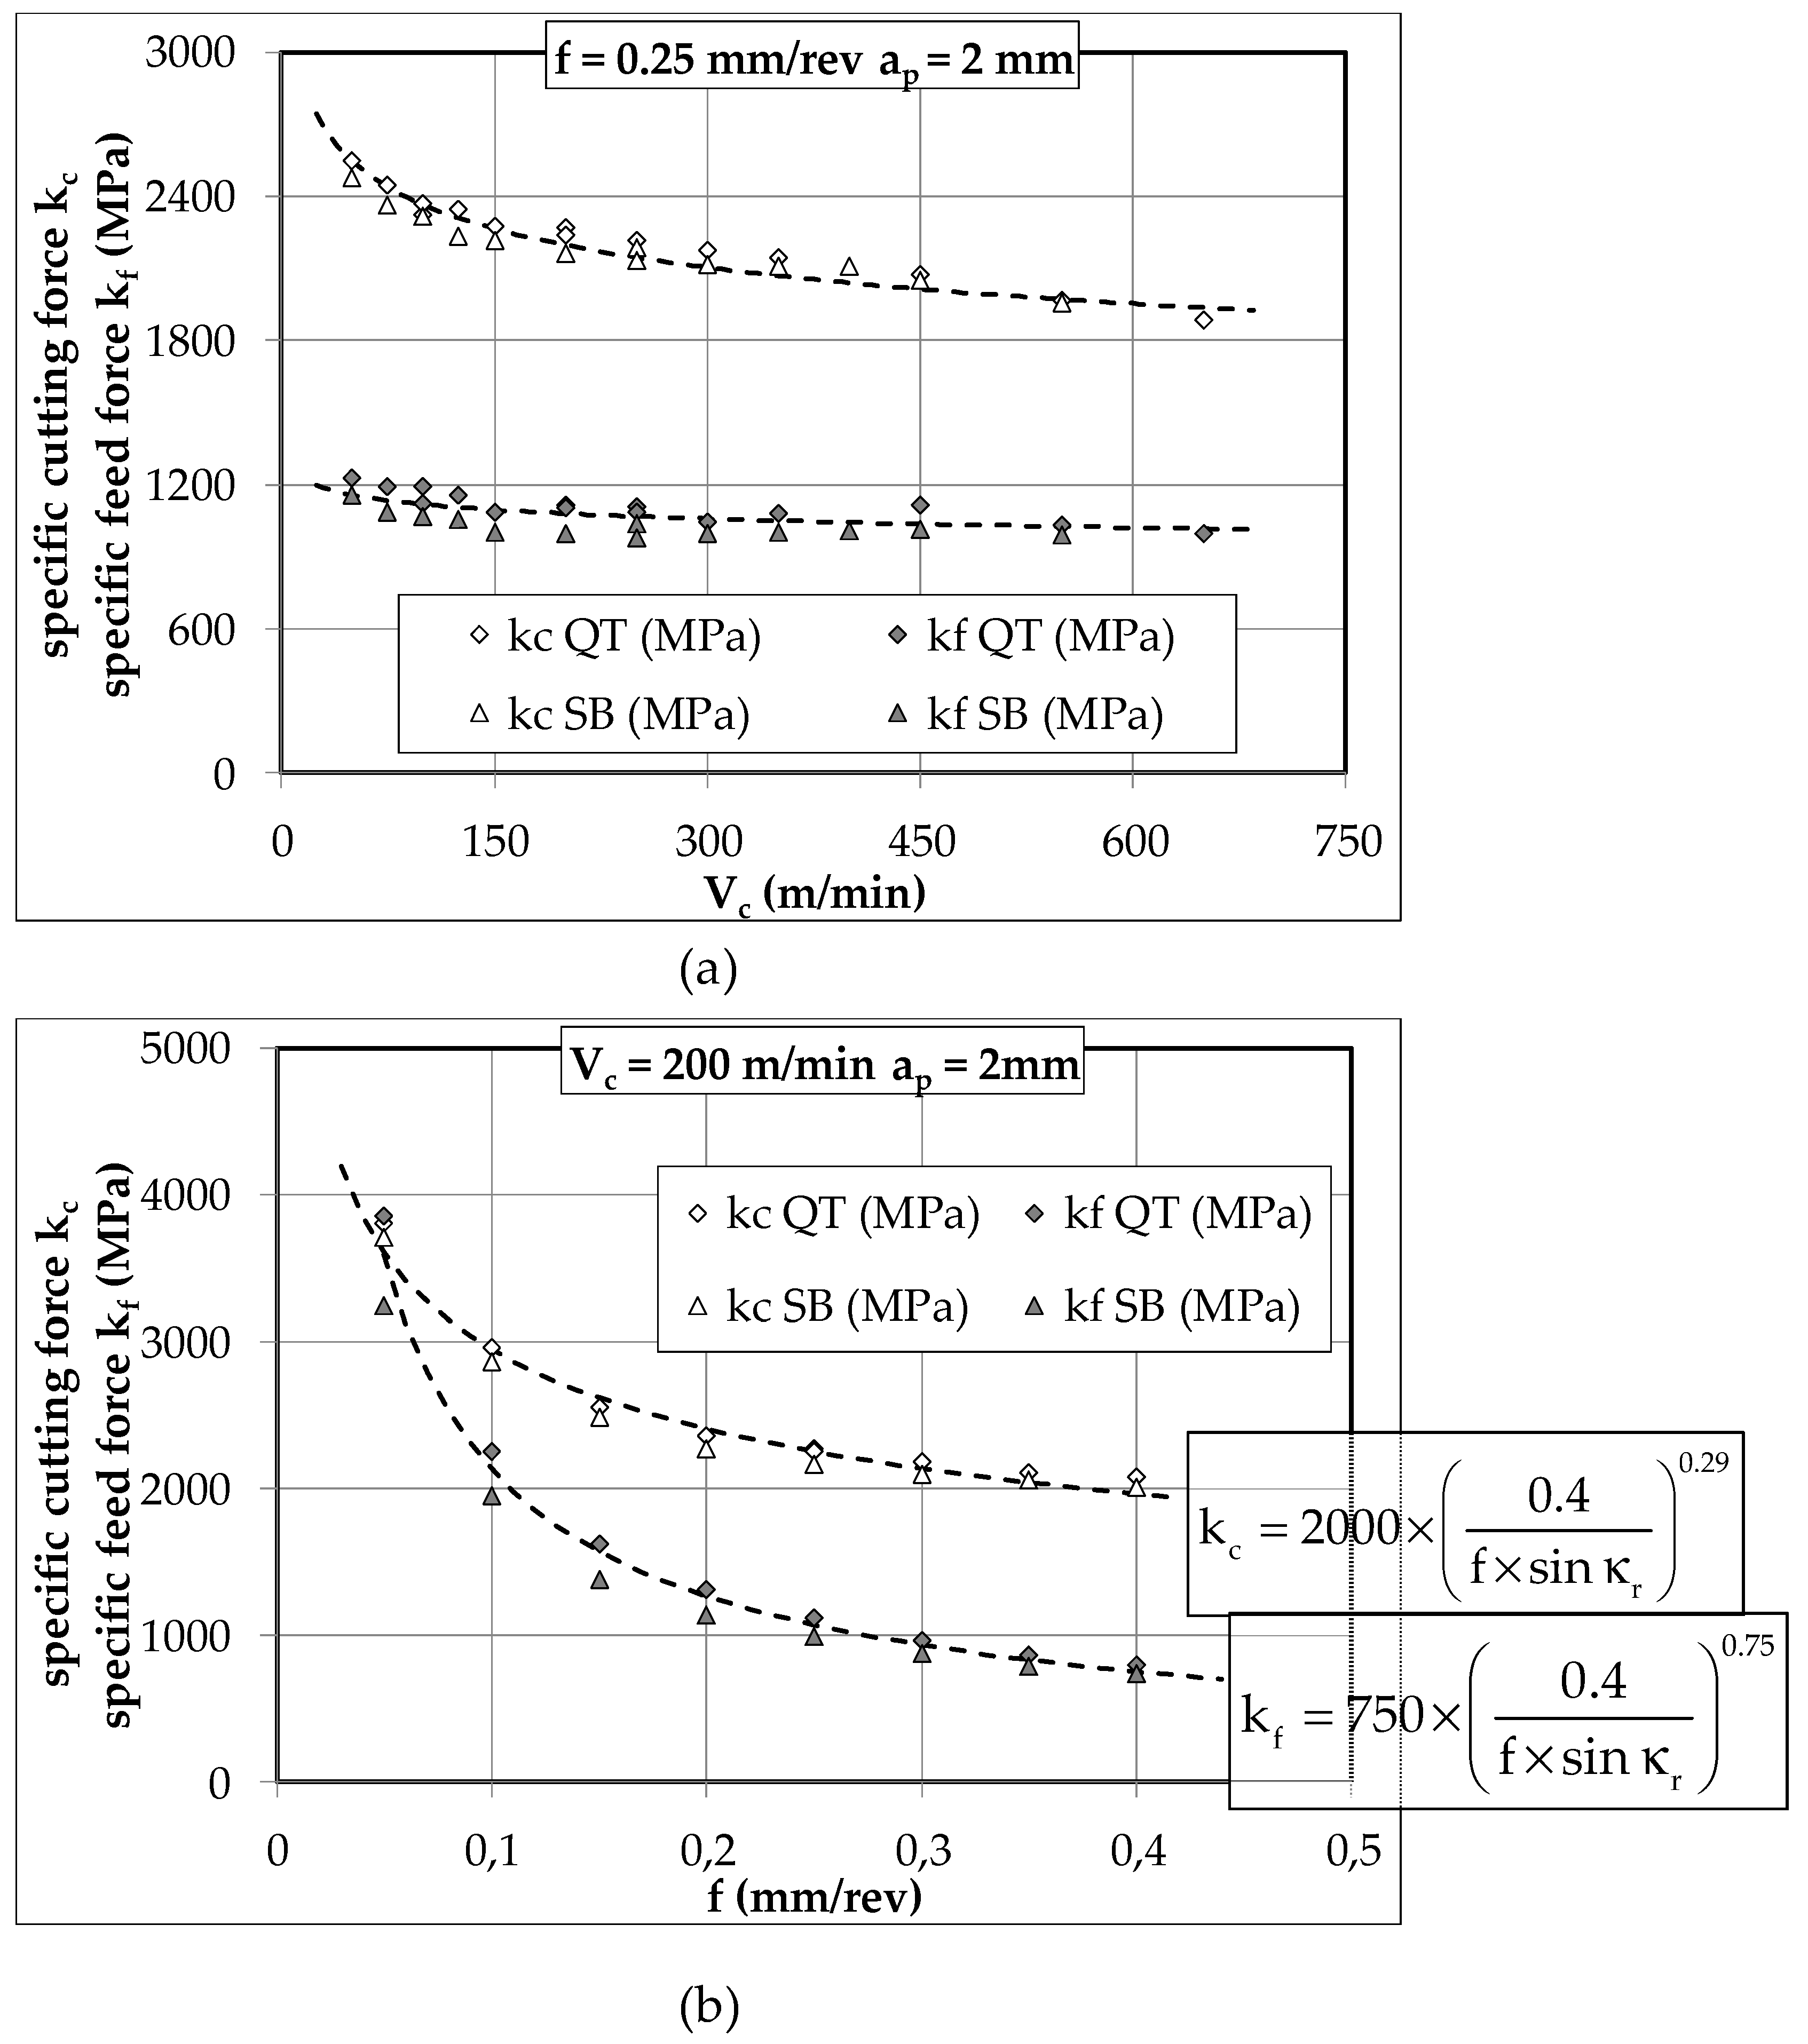
The variation of specific cutting pressure and feed with respect to cutting speed for the two materials in the study shows no significant difference (Figure 10a). There is a marked decrease in the specific cutting force when cutting speed increases, while the specific feed force remains constant. kc does not show an asymptotic tendency; it kept decreasing, even at cutting speeds as high as 650 m/min. The Tool-Material couple approach recommends setting a specific cutting force value beyond which an operator should not work. In this case, the minimum cutting speed Vc min is identical for all materials. The curves kc = f(f) and kf = f(f) are plotted for both materials (Figure 10b). The same results were encountered for a given set of operating conditions, i.e., the materials of the study showed imperceptible differences between the measurements. A single trend curve gives an account of the evolution of the specific forces: the correlation coefficients are high, 0.97 for the specific cutting forces, 0.98 for the specific feed forces. As a result, the maximum deviations between measured and theoretical values are small: they are less than 6% for kc and 13% for kf.
Low frequency spectrum analysis is insufficient to differentiate the study materials. In the current range of cutting speeds where tool wear rate is moderate, the same forces were necessary to machine bainite or martensite. However, martensite seems to induce higher tool wear rates, especially at high cutting speeds. Our comparative study should be further developed to include tool wear tests and complementary metallurgical characterization tests for the QT and SB steels.

3.3. High Frequency Analysis

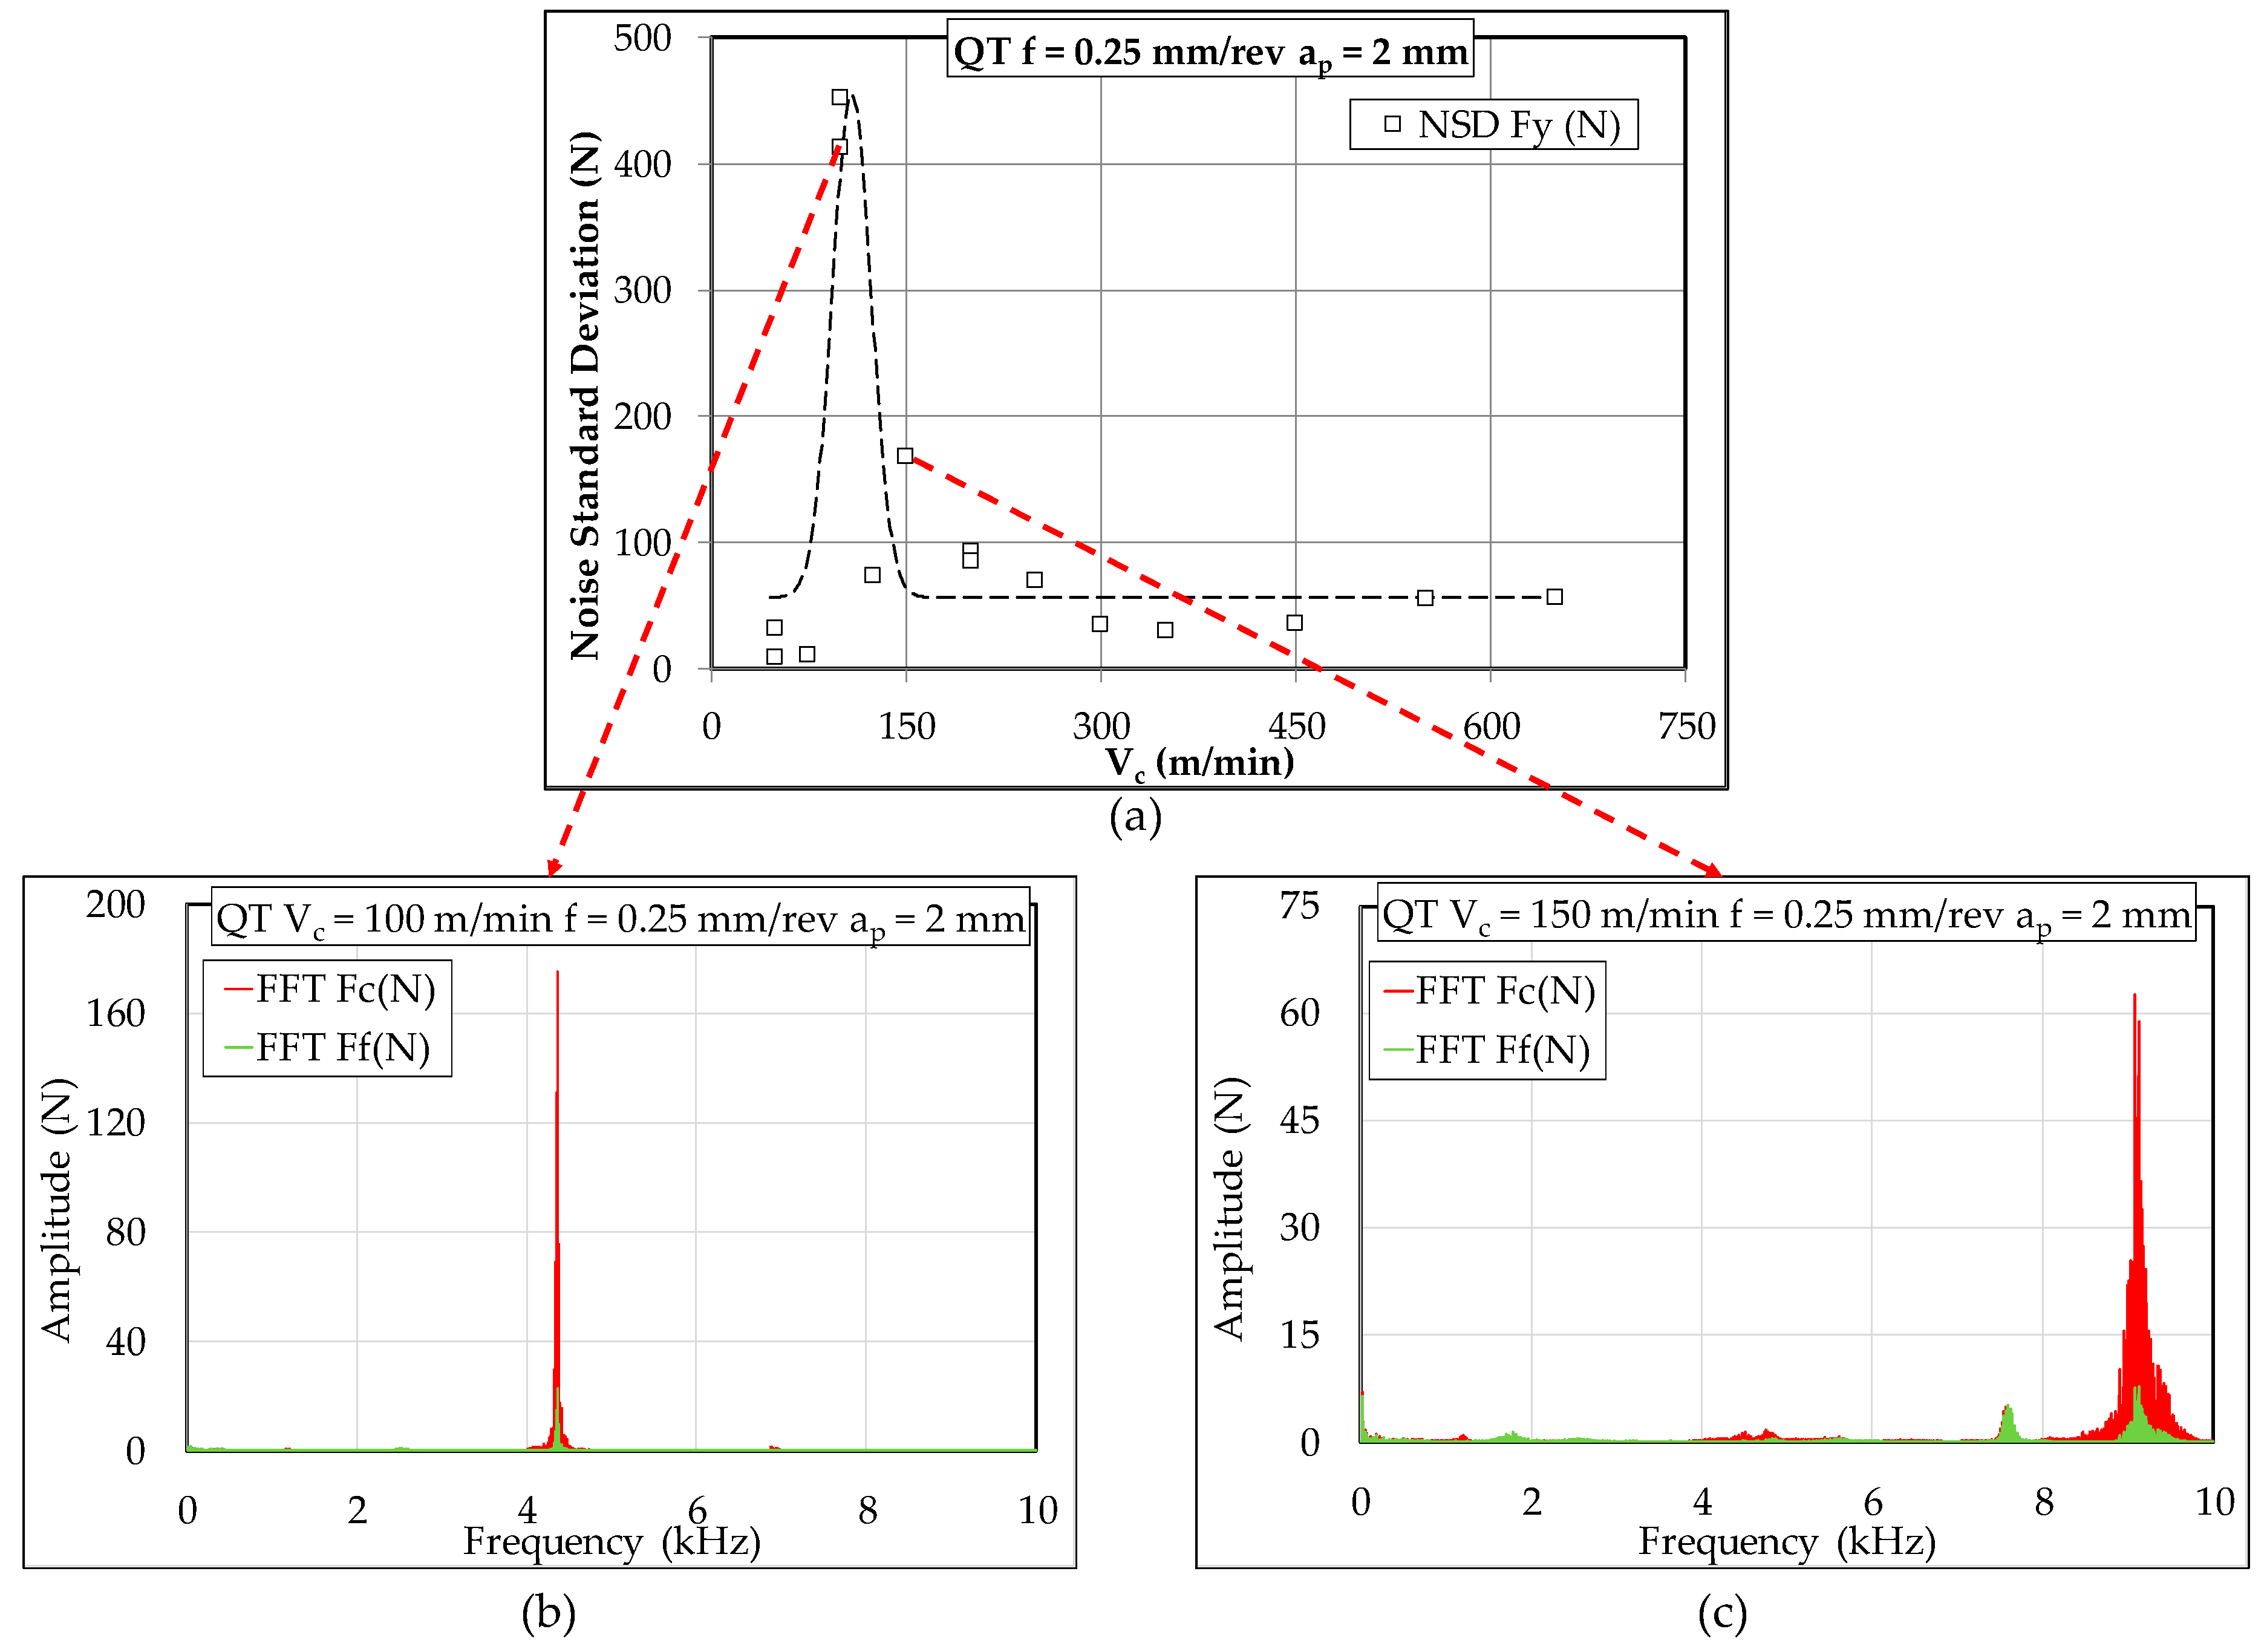
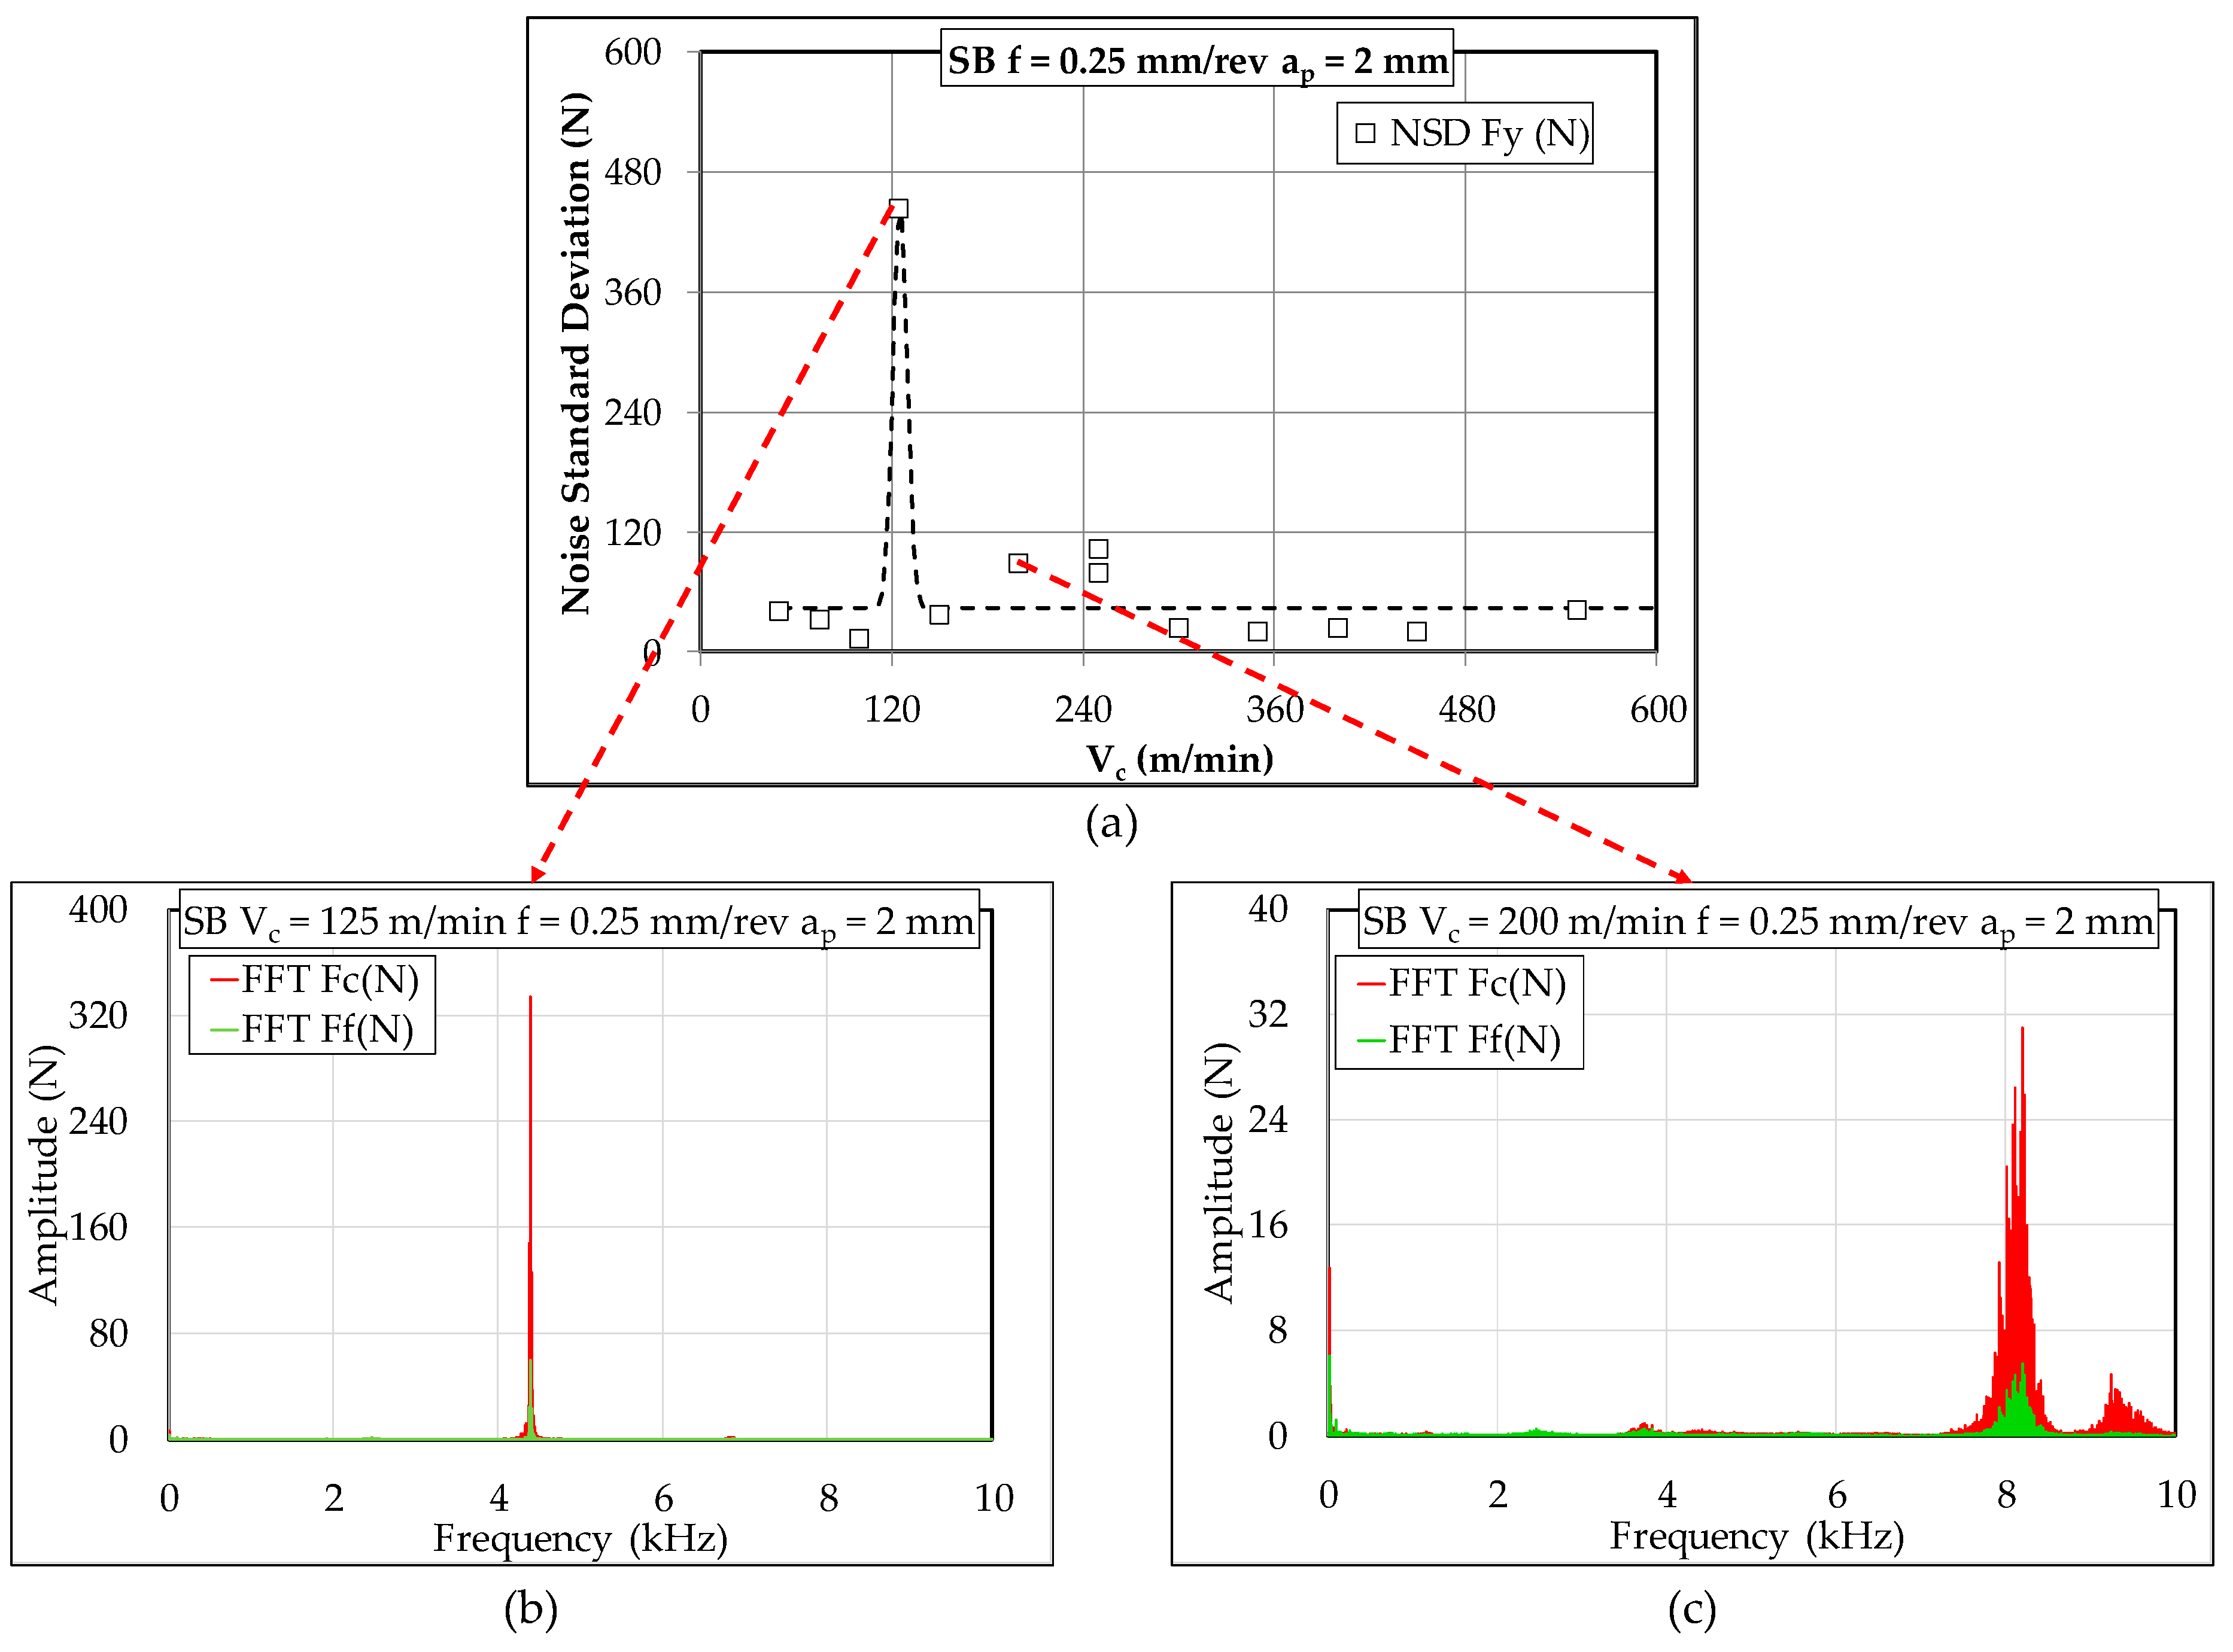
Regarding signal processing, it has already been stated that the high frequency spectra were analyzed using standard statistical parameters. In most cases, mean values were around zero, and noise was symmetrical. At variable cutting speeds, the standard deviation can vary greatly depending on the cutting conditions. The values show a very sharp peak at a cutting speed of 125 m/min in the case of SB and at cutting speed of 100 m/min for QT. This peak is visible on both cutting and radial force components. The standard deviation reaches several hundred Newtons. Figure 11a and Figure 12a show the standard deviation of the high frequency spectrum on the cutting component respectively for QT and SB. This corresponds to up to 30% of the effort values measured on the low frequency signal. These vibrations have a significant impact the quality of the surface produced. The distribution of these deviation is analyzed. For each component, around 200,000 values were collected before they were partitioned into classes. The middle class is centered on the average value, namely 0. We find a distribution centered on this average with a decrease almost symmetrical on both of its sides. Overall, the deviations have a distribution close to the normal distribution with typical deviations strongly variable, admitting a peak around 100 to 120 m/min for both types of steel. The next step now is spectral analysis in effort to identify if particular frequencies appear in the high frequency signals.
By uncovering the signals hidden in the high frequency spectrum, we aim to find serration frequency, its variation with cutting speeds, and corelate the result with the values measured in Figure 6b. The idea is to understand the influence of the serration phenomena on the cutting forces, the newly machined surface state and its relationship to the turning process in general. To do so, we calculated the Discrete Fourier Transform. First, it should be noted that the experiments were carried out with a dynamometer input frequency of 20 kHz. Since the frequency range for which we evaluate the spectral components depends on the sampling frequency, we are able to specify the amplitudes of the frequencies present in the signal from 0 to 10 kHz (half of the sampling rate). Discrete Fourier transform are symmetric with respect to this value. In summary:
  • Frequencies below 10 kHz will appear normally on the FFT spectrum
  • Frequencies between 10 and 20 kHz will figure on their symmetric value with respect to 10 kHz (ex: a frequency of 17 kHz will show its peak on 3 kHz)
  • Frequencies above 20 kHz exceed our sampling rate and cannot be properly identified
Unfortunately, that limits our investigation into cutting speeds below 250 m/min, since the serration frequency measured on the chips reached our sampling frequency around this value (based on results in Figure 6).
In Figure 11 and Figure 12b,c the FFT spectra at speeds when high standard deviation was encountered are presented respectively for QT and SB. The remaining results are summarized in Table 2 where the amplitude spectra resulting from the discrete Fourier transform are reported for each material of the study and then compared with the measured serration frequency.
For martensite, at 100 m/min, the chips were already serrated, and the FFT spectrum corresponding to this condition showed an important peak of 180 N around 4.3 kHz. When cutting at 125 m/min the calculated frequency approached 6 kHz and a small peak of 9 N amplitude signal was found. At Vc = 150 m/min the standard deviation increased again, and the FFT spectrum at that speed confirmed the result with a peak of 60 N around 9 kHz. For bainite, at 100 m/min the chips were continuous, i.e., no serration is found, and the FFT spectrum corresponding to this state showed a negligible peak of 2 N around 4.3 kHz. When cutting at 125 m/min the calculated frequency approached 5 kHz, and a remarkable 430 N amplitude signal was found at 4.3 kHz. At 150 m/min fserration rose to 6.1 kHz, Fourier spectrum shows a peak of 5 N around that same value.
A similar approach was taken to find the fragmentation frequency. Based on the high frequency spectrum and Fourier transform, we tried to find the peak corresponding to this phenomenon. However, for all cutting conditions, such a peak could not be identified. Thus, it can be assumed that the impact of chip breaking on signal registration is insignificant.
To summarize, the serration frequency was found again on the FFT spectra. High frequency signal analysis showed that the amplitudes of the serration signal varied widely, i.e., from 5 N to several hundred newtons. These large amplitudes may be the result of resonance phenomena [19]. Anayet Ullah Patwari et al. observed that with the increase of the cutting speed, the natural frequency of the spindle is excited, and the amplitude is going to increase up to the resonance cutting speed before decreasing again. This resonance impacts the machined surface quality, energy consumption and tool wear rate, and thus, should be avoided. Although the same behavior was encountered with SB and QT, a few differences should be highlighted. Serration began before 100 m/min for QT where SB bars were still producing continuous chips. Furthermore, frequencies registered for SB were always 25 m/min behind those found for QT ex: resonance speed for SB was 125 m/min where QT resonated at 100 m/min, 6 kHz frequency was found for QT at 125 m/min the same value emerged again with SB but at 150 m/min.

4. Discussion

The observation of the chips at the mesoscopic scale led to a new analysis protocol. It provides access to chip fragmentation and serration frequencies. This protocol shows the evolution of those frequencies. It also shows their relative stability. The serrated teeth may have variable widths resulting in a slight variation of the frequency calculated which are found by comparing them with the results of the spectral analysis of efforts.
The efforts identified during the characterization of the machinability in turning have been treated according to a specifically developed protocol separating low and high frequency components. It is thus possible, with the study of the low frequency component, to find the usual trends and to propose adequate operating conditions. The study of the high frequency component makes it possible to highlight the process of chip formation with localization of the deformation within shear bands (serration), but also the dynamic response of the structure to the variations of stress.
The following conclusions may be drawn from the present work:
  • Results concerning chip fragmentation are quite different of those proposed by Hartmann [12]. The steels investigated have a huge difference in ductility (i.e., Z% was about 28.5% for the bainitic grade and 55.9% for the martensitic grade). The experiments performed in the current study seem to show that microstructure has no influence on the chip length when steel ductility (estimated through Z%) is similar. Further investigation should be performed to enhance the quantitative description of the metallurgy of steels being machined. Knowledge of the overall microstructure (martensite or bainite) or the mechanical performances is unsatisfactory.
  • Investigations involving workmaterial characterization observations in the rolling plane and direction using X-ray diffraction, SEM and optical microscope showed that difference between SB and QT is primarily due to carbide precipitations. This inspection should be further developed to include image analysis like in the works of Abbaszadeh et al. [29] or manual point count and microindentation hardness measurements [30]. Eventually, an EBSD analysis will take place. It is crucial in comparing samples, as it provides important data ranging from grains and subgrains misorientations (mainly to differentiate lower and upper bainite) to the shapes of ferrite lattes and M/A constituents [31,32,33].
  • The chips produced during turning of 42CrMo4 exhibit regularly spaced serrated teeth above certain cutting speeds. The values of these Vc depended on the microstructure. These teeth are formed due to the adiabatic nature of the shear process. The frequency of these serrated teeth increases with cutting speed and each time their values approached the value of natural frequency of the system chatter occur and high forces were registered.
  • In the present study, bainite and martensite behaviors were similar, but this macroscopic approach was crucial to the rest of the work. Cutting force signals clearly demonstrate the necessity of further tool life studies based on the approaches found in the literature [27,34,35].

Author Contributions

Conceptualization, A.B.-A.; Methodology, C.L.; Validation, J.-E.D. and A.B.-A.; Formal Analysis, O.B.; Investigation, F.H. and J.-E.D.; Data Curation, F.H.; Writing-Original Draft Preparation, F.H.; Writing-Review & Editing, C.L.; Project Administration, A.B.-A.

Funding

This research was funded by ArcelorMittal.

Acknowledgments

The authors would like to thank Christian Bobadilla and Pascal Buessler for their trust and confidence. The authors would like to thank Olivier Pinoli and Louis Schneider for their involvement in this study.

Conflicts of Interest

The authors declare no conflict of interest. The funders had no role in the design of the study; in the collection, analyses, or interpretation of data; in the writing of the manuscript, and in the decision to publish the results.

References

  1. Buchmayr, B. Critical Assessment 18: Bainitic forging steels. Mater. Sci. Technol. 2016, 32, 517–522. [Google Scholar] [CrossRef]
  2. Hartmann, H.; Biermann, D.; Engineer, S.; Merkel, C. Investigations on machining of high strength bainitic steels. In Proceedings of the Future Trends in Steel Development, Processing Technologies and Applications, Braunschweig, Germany, 15–19 June 2014; pp. 149–156. [Google Scholar]
  3. Bhadeshia, H.K.D.H. Bainite in Steels Transformations, Microstructure, 2nd ed.; IOM Communications: Cambridge, UK, 2001; ISBN 1-86125-112-2. [Google Scholar]
  4. Desaigues, J.-E. Contribution à L’étude de L’amélioration de L’usinabilité des Aciers Analyse des Couches de Transferts Sélectifs (CTS) et Caractérisation des Conditions D’apparition; Arts et Metiers: Metz, Germany, 2015. [Google Scholar]
  5. Montero, M.C.; Albarran, J.; D’Eramo, E.; Juvonen, P.; Vogtel, P.; Lung, D.; Björk, T.; Persson, H.; Garay, A.; Arrazola, P.J.; et al. Innovative Approach for Steel Design Procedures Tailored Component Machining; European Commission: Brussels, Belgium, 2012; p. 168. [Google Scholar]
  6. Björk, T.; Perez-Alonso, M.; Albarran, J.; Moorthy, V.; Shaw, B.; Vogtel, P.; Lung, D. Automated Material Characterisation for Machinability Prediction (CHARMA); Directorate-General for Research and Innovation Directorate D—Key Enabling Technologies Unit D.4—Coal and Steel; European Commission: Brussels, Belgium, 2015; p. 134. [Google Scholar]
  7. Johansson, D.; Hägglund, S.; Bushlya, V.; Ståhl, J.-E. Assessment of Commonly used Tool Life Models in Metal Cutting. Procedia Manuf. 2017, 11, 602–609. [Google Scholar] [CrossRef]
  8. Kamruzzaman, M.; Rahman, S.S.; Ashraf, M.Z.I.; Dhar, N.R. Modeling of chip–tool interface temperature using response surface methodology and artificial neural network in HPC-assisted turning and tool life investigation. Int. J. Adv. Manuf. Technol. 2017, 90, 1547–1568. [Google Scholar] [CrossRef]
  9. Saez-de-Buruaga, M.; Soler, D.; Aristimuño, P.X.; Esnaola, J.A.; Arrazola, P.J. Determining tool/chip temperatures from thermography measurements in metal cutting. Appl. Therm. Eng. 2018, 145, 305–314. [Google Scholar] [CrossRef]
  10. Polvorosa, R.; Suárez, A.; López de Lacalle, L.N.; Cerrillo, I.; Wretland, A.; Veiga, F. Tool wear on nickel alloys with different coolant pressures: Comparison of Alloy 718 and Waspaloy. J. Manuf. Process. 2017, 26, 44–56. [Google Scholar] [CrossRef]
  11. López de Lacalle, L.N.; Pérez-Bilbatua, J.; Sánchez, J.A.; Llorente, J.I.; Gutiérrez, A.; Albóniga, J. Using High Pressure Coolant in the Drilling and Turning of Low Machinability Alloys. Int. J. Adv. Manuf. Technol. 2000, 16, 85–91. [Google Scholar] [CrossRef]
  12. Hartmann, H. Analyse der Aussenlängsdreh- und Einlippentiefbohrbearbeitung Hochfester Bainitischer und Vergüteter Stähle; Technische Universität Dortmund: Dortmund, Germany, 2016. [Google Scholar]
  13. Arrazola, P.J.; Özel, T.; Umbrello, D.; Davies, M.; Jawahir, I.S. Recent advances in modelling of metal machining processes. CIRP Ann. Manuf. Technol. 2013, 62, 695–718. [Google Scholar] [CrossRef]
  14. Courbon, C. Vers une Modélisation Physique de la coupe des Aciers Spéciaux: Intégration du Comportement Métallurgique et des Phénomènes Tribologiques et Thermiques aux Interfaces; Université Lyon: Lyon, France, 2011. [Google Scholar]
  15. Lurdos, O. Lois de Comportement et Recristallisation Dynamique: Approches Empirique et Physique; Ecole Nationale Supérieure des Mines de Saint Etienne: Saint Etienne, France, 2008. [Google Scholar]
  16. Calamaz, M.; Coupard, D.; Girot, F. A new material model for 2D numerical simulation of serrated chip formation when machining titanium alloy Ti–6Al–4V. Int. J. Mach. Tools Manuf. 2008, 48, 275–288. [Google Scholar] [CrossRef] [Green Version]
  17. Zemzemi, F.; Rech, J.; Bensalem, W.; Dogui, A.; Kapsa, P. Identification of a friction model at tool/chip/workpiece interfaces in dry machining of AISI4142 treated steels. J. Mater. Process. Technol. 2009, 209, 3978–3990. [Google Scholar] [CrossRef]
  18. Urbikain, G.; López de Lacalle, L.N.; Campa, F.J.; Fernández, A.; Elías, A. Stability prediction in straight turning of a flexible workpiece by collocation method. Int. J. Mach. Tools Manuf. 2012, 54, 73–81. [Google Scholar] [CrossRef]
  19. Patwari, M.A.U.; Amin, A.K.M.N.; Faris, W.F. Influence of Chip Serration Frequency on Chatter Formation During End Milling of Ti6Al4V. J. Manuf. Sci. Eng. 2011, 133, 011013. [Google Scholar] [CrossRef]
  20. Wang, B.; Liu, Z. Acoustic emission signal analysis during chip formation process in high speed machining of 7050-T7451 aluminum alloy and Inconel 718 superalloy. J. Manuf. Process. 2017, 27, 114–125. [Google Scholar] [CrossRef]
  21. Walker, P.; Tarn, W.H. (Eds.) CRC Handbook of Metal Etchants; CRC Press: Boca Raton, FL, USA, 1991; ISBN 978-0-8493-3623-2. [Google Scholar]
  22. Feng, J.; Frankenbach, T.; Wettlaufer, M. Strengthening 42CrMo4 steel by isothermal transformation below martensite start temperature. Mater. Sci. Eng. A 2017, 683, 110–115. [Google Scholar] [CrossRef]
  23. Metallography and Microstructures; Metals Handbook, New Edition; American Society for Metals: Metals Park, OH, USA, 2004; ISBN 978-0-87170-706-2.
  24. Bhadeshia, H.K.D.H. Bainite in Steels: Theory and Practic, 3rd ed.; Maney Publishing: Leeds, UK, 2015; ISBN 978-1-909662-74-2. [Google Scholar]
  25. Navarro-López, A.; Hidalgo, J.; Sietsma, J.; Santofimia, M.J. Characterization of bainitic/martensitic structures formed in isothermal treatments below the Ms temperature. Mater. Charact. 2017, 128, 248–256. [Google Scholar] [CrossRef]
  26. Fernández-Valdivielso, A.; López de Lacalle, L.; Urbikain, G.; Rodriguez, A. Detecting the key geometrical features and grades of carbide inserts for the turning of nickel-based alloys concerning surface integrity. Proc. Inst. Mech. Eng. Part C J. Mech. Eng. Sci. 2016, 230, 3725–3742. [Google Scholar] [CrossRef]
  27. Stahl, J.-E. Metal Cutting Theories and Models, 1st ed.; Division of Production and Materials Engineering: Lund, Sweden, 2012. [Google Scholar]
  28. Biermann, D.; Hartmann, H.; Terwey, I.; Merkel, C.; Kehl, D. Turning of High-strength Bainitic and Quenched and Tempered Steels. Procedia CIRP 2013, 7, 276–281. [Google Scholar] [CrossRef] [Green Version]
  29. Abbaszadeh, K.; Saghafian, H.; Kheirandish, S. Effect of bainite morphology on mechanical properties of the mixed bainite-martensite microstructure in D6AC steel. J. Mater. Sci. Technol. 2012, 28, 336–342. [Google Scholar] [CrossRef]
  30. Schade, C.; Murphy, T.; Alan Lawley, A.; Doherty, R. Microstructure and mechanical properties of a bainitic PM Steel. Int. J. Powder Metall. 2016, 52, 35–76. [Google Scholar]
  31. Hofer, C.; Leitner, H.; Winkelhofer, F.; Clemens, H.; Primig, S. Structural characterization of “carbide-free” bainite in a Fe–0.2 C–1.5 Si–2.5 Mn steel. Mater. Charact. 2015, 102, 85–91. [Google Scholar] [CrossRef]
  32. Zajac, S.; Schwinn, V.; Tacke, K.H. Characterisation and Quantification of Complex Bainitic Microstructures in High and Ultra-High Strength Linepipe Steels. Mater. Sci. Forum 2005, 500–501, 387–394. [Google Scholar] [CrossRef]
  33. Zaefferer, S.; Ohlert, J.; Bleck, W. A study of microstructure, transformation mechanisms and correlation between microstructure and mechanical properties of a low alloyed TRIP steel. Acta Mater. 2004, 52, 2765–2778. [Google Scholar] [CrossRef]
  34. Bomont-Arzur, A.; Cenfente, M.; Bomont, O.; Schneider, E.; Lescalier, C. Influence of material structure on deep hole machinability of super high strengh steels-application to crankshaft manufacturing methodology, results and analysis. In Proceedings of the Fifth International Conference on High Speed Machining, Metz, France, 27–29 October 2006. [Google Scholar]
  35. Johansson, D.; Schultheiss, F.; Bushlya, V.; Zhou, J.; Stahl, J.-E. Tool life and wear model in metal cutting. Part 1—Influence of varying flank wear criterion on Colding’s tool life equation. In Proceedings of the 6th Swedish Production Symposium, Gothenburg, Sweden, 16–18 September 2014. [Google Scholar]
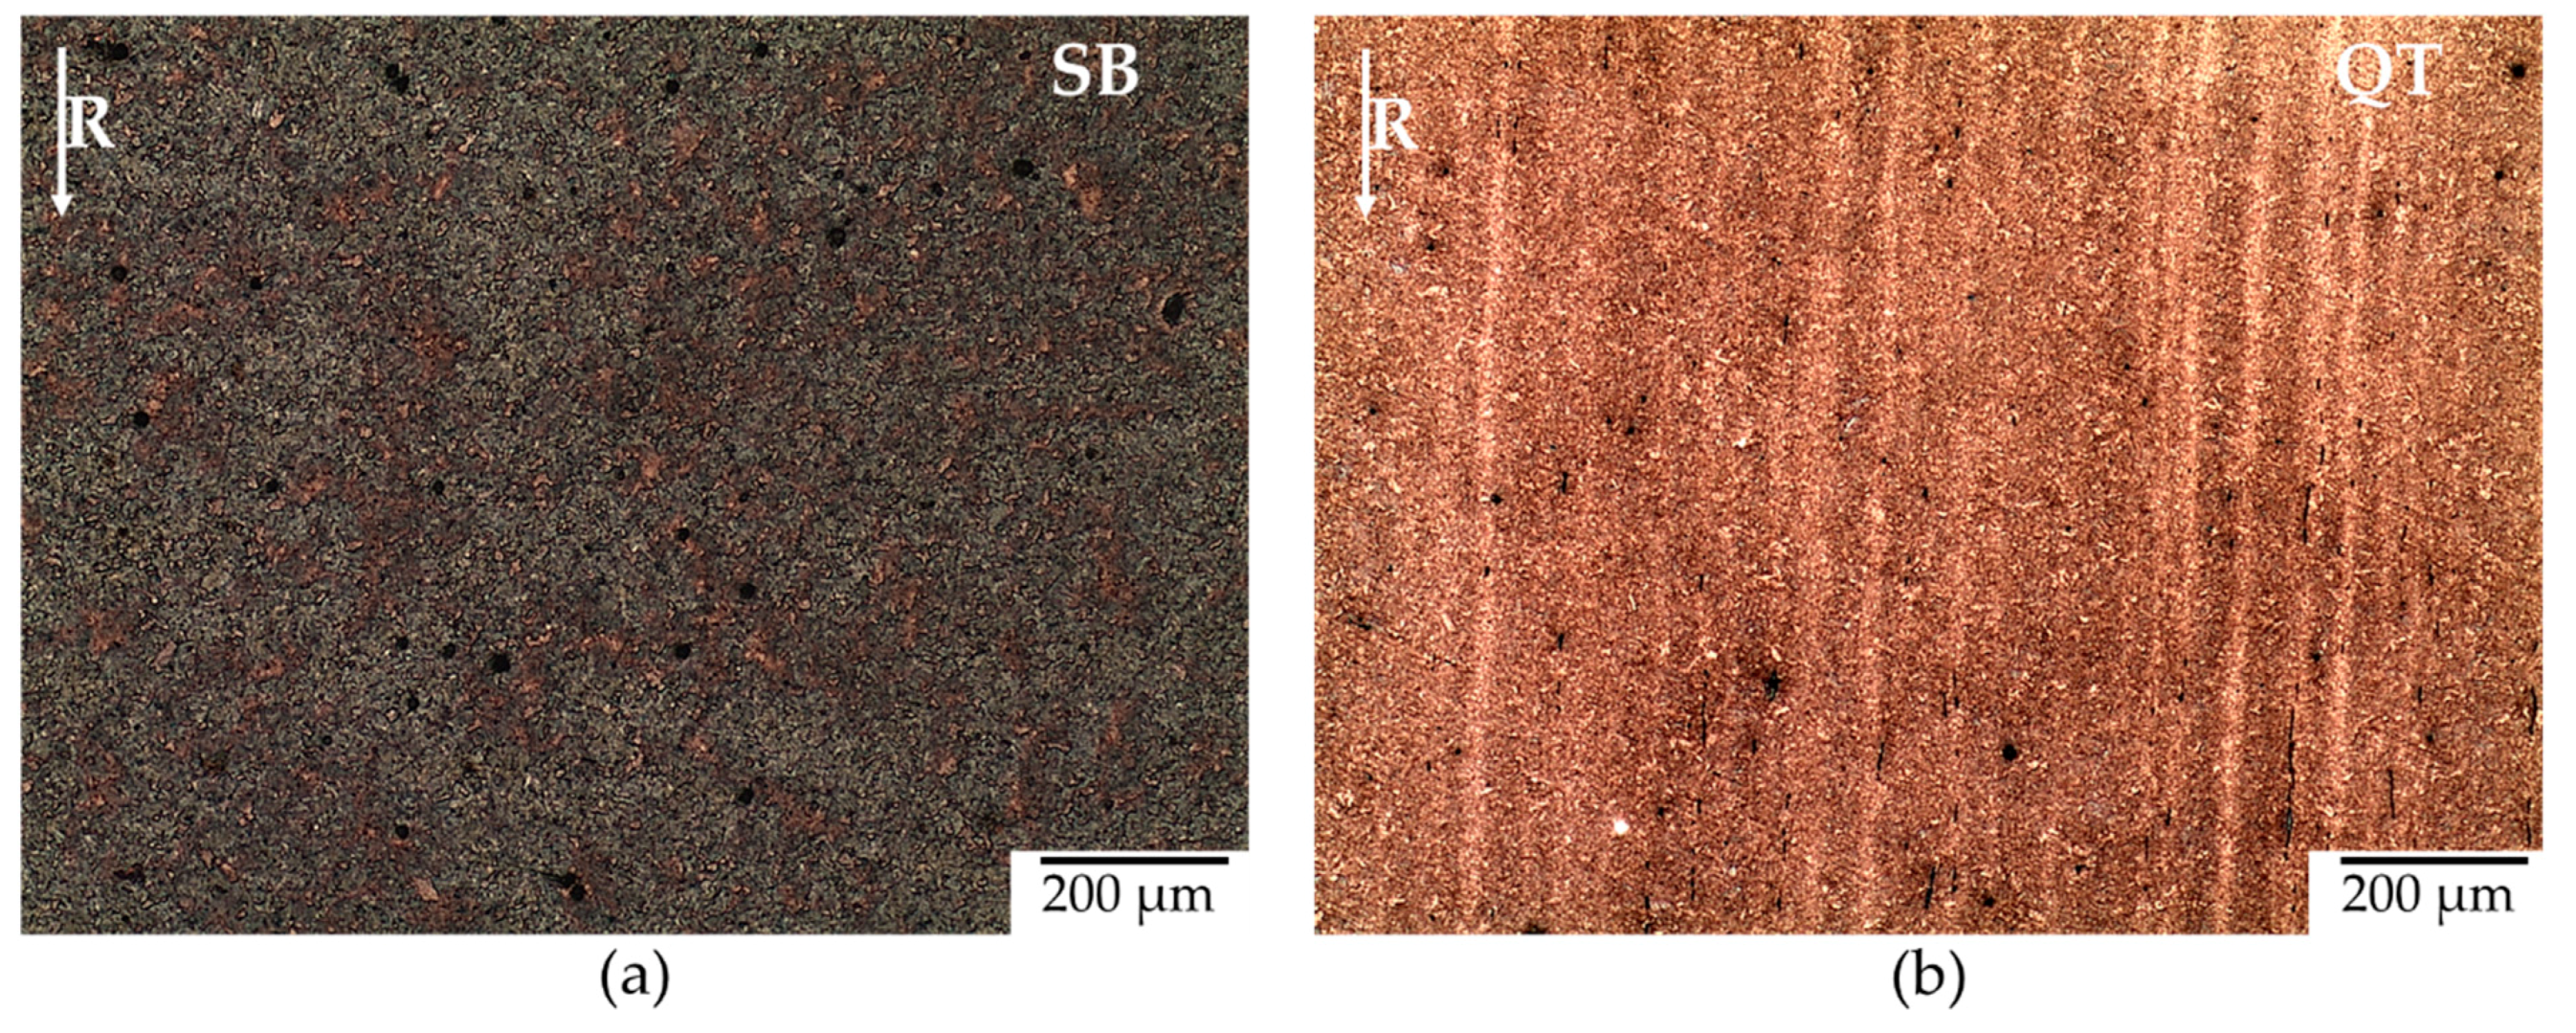
Figure 1. Optic microscopy for pre-machined bars (×5) (a) SB and (b) QT.
Jmmp 03 00010 g001
Figure 2. Optical micrography for QT bar (a) 3 mm from the edge and (b) center of the bar.
Jmmp 03 00010 g002
Figure 3. SEM microscopy for pre-machined bars (×5000) (a) SB and (b) QT.
Jmmp 03 00010 g003
Figure 4. In red the forces signals collected showing a significant dynamic component and in blue the filtered signal F ¯ (a) SB Vc = 350 m/min f = 0.25 mm/rev showing constant cutting force during the whole operation and (b) SB Vc = 550 m/min f = 0.25 mm/rev showing accelerated tool wear.
Jmmp 03 00010 g004
Figure 5. High frequency component F’ for SB at Vc = 350 m/min and f = 0.25 mm/rev.
Jmmp 03 00010 g005
Figure 6. (a) Micrograph of a QT chip, (b) computed serration frequency with respect to cutting speed.
Jmmp 03 00010 g006
Figure 7. (a) Micrograph of a SB chip at Vc = 125 m/min, low magnification images are used to measure length of fragmented chip (b) evolution of the computed fragmentation frequency with respect to cutting speeds.
Jmmp 03 00010 g007
Figure 8. Rate of the specific cutting pressure variation DKc.
Jmmp 03 00010 g008
Figure 9. Rate of the specific pressure variation (a) feed component Dkf (b) radial component Dkr.
Jmmp 03 00010 g009
Figure 10. Variation of the specific pressures kc and kf with respect to cutting speed Vc (a) and to feed f (b).
Jmmp 03 00010 g010
Figure 11. QT samples: (a) variation of the noise standard deviation (b) FFT at 100 m/minand (c) FFT at 150 m/min.
Jmmp 03 00010 g011
Figure 12. SB samples: (a) variation of the noise standard deviation (b) FFT at 125 m/minand (c) FFT at 200 m/min.
Jmmp 03 00010 g012
Table 1. Chemical composition and some mechanical properties of the work material.
SampleRm(MPa)Rp0.2(MPa)HV30A%Z%%RAChemical Composition (%wt)
CCrMnMoSi
SB103978334014.1560.010.410.750.220.4
QT110897335515.9540.16
Table 2. Amplitudes and frequencies found after FFT transform and correlation with the calculated fserration.
SampleCutting Velocity (m/min)
100125150200
SBcontinuous chips
fserration = N/A
serrated chips
fserration = 5 kHz
serrated chips
fserration = 6.3 kHz
serrated chips
fserration = 13.9 kHz
FFT: 4.3 kHz–2 NFFT: 4.3 kHz–420 NFFT:4.3 kHz–4 N
6.3 kHz–5 N
FFT: 12 kH–32 N
QTserrated chips
fserration = 4.8 kHz
serrated chips
fserration = 6.0 kHz
serrated chips
fserration = 8.7 kHz
serrated chips
fserration = 11 kHz
FFT: 4.3 kHz–180 NFFT:4.3 kHz–3 N
6.3 kHz–9N
FFT: 9 kHz–60 NFFT: 13.7 kHz–14 N