Article

High-Throughput Fused Filament Fabrication of PLA: Effects of Melting Zone Length and Filament Diameter on Extrusion Force and Volumetric Flow Rate


1
Institute of Printing Science and Technology, Technical University of Darmstadt, Magdalenenstr. 2, 64289 Darmstadt, Germany
2
Institut für Kunststofftechnik, University of Stuttgart, Pfaffenwaldring 32, 70569 Stuttgart, Germany
*
Author to whom correspondence should be addressed.
J. Manuf. Mater. Process. 2026, 10(7), 233; https://doi.org/10.3390/jmmp10070233
Submission received: 29 May 2026 / Revised: 26 June 2026 / Accepted: 29 June 2026 / Published: 1 July 2026
(This article belongs to the Special Issue Recent Advances in Optimization of Additive Manufacturing Processes)

Abstract

Fused filament fabrication (FFF) is a widely used additive manufacturing method in which the process forces within the hotend play an important role in terms of print quality and speed, particularly in high-throughput applications. This work reports on the influence of filament diameter, melting zone length, and nozzle set temperature on the process forces and the maximum achievable volumetric flow rate. Experimental measurements were carried out using a test rig that integrates a load cell to capture the resulting forces, complemented by non-isothermal numerical simulations. The results show that increasing the melting zone length reduces process forces and increases the attainable volumetric flow rate at high feed rates, as the filament has more time to melt. However, the effect depends strongly on filament diameter. For a diameter of 2.85 mm, extending the melting zone leads to a monotonic increase in the maximum achievable flow rate across the entire investigated range. For a diameter of 1.75 mm, an optimum is observed at an intermediate melting zone length, beyond which additional flow resistance outweighs the benefit of improved melting and thus reduces the attainable flow rate. When normalizing for the maximum transferable extruder force, the smaller filament diameter consistently yields superior throughput performance. The simulations reproduce the experimentally observed trends well and support the interpretation that throughput is limited by the competition between heat-transfer-controlled melting and viscous pressure losses.

1. Introduction

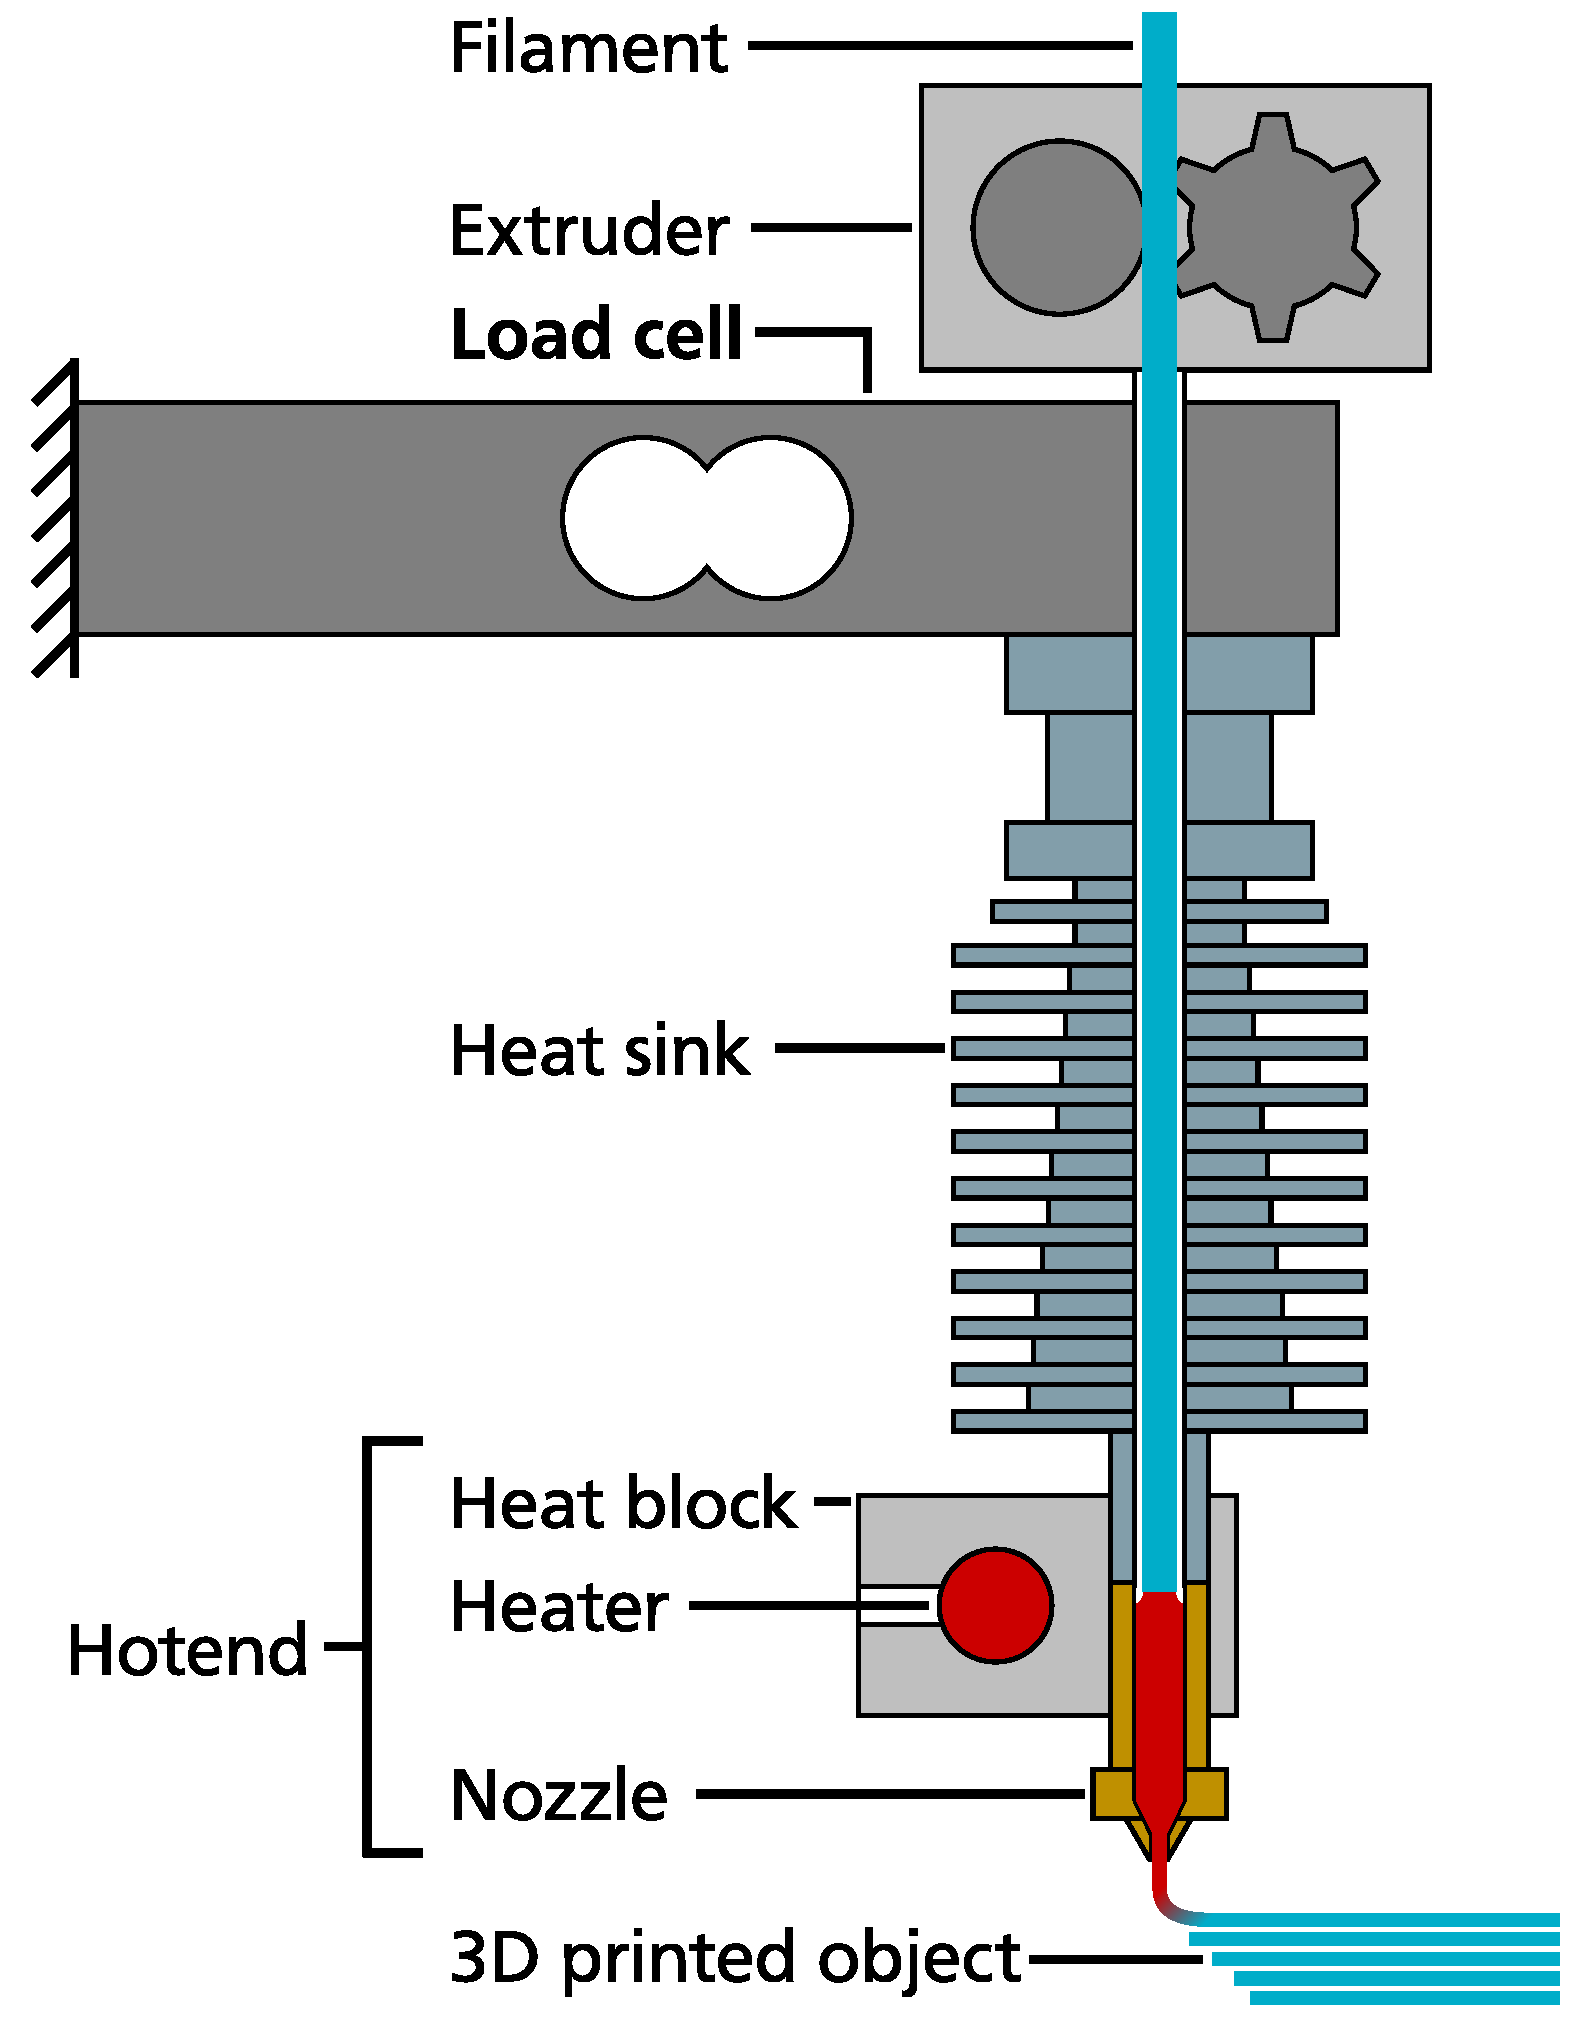
3D printing using material extrusion (MEX) is a widely used manufacturing process due to its typically low cost and simple operation [1]. Fused filament fabrication (FFF) in particular, in which a thermoplastic filament is used as a feedstock, is considered the most widely used 3D printing process—in both industrial and consumer environments—even if the exact sales figures are unclear due to the low machine costs and widespread availability [1,2]. In FFF, this thermoplastic filament is transported by a feeding mechanism (extruder), usually via drive rollers, into a heated zone (hotend) and melted. The molten material leaves the nozzle and is deposited in a defined manner and built up in layers to form a three-dimensional object (see Figure 1a).
A high volumetric throughput is crucial, particularly due to the trend and need towards faster printing [3] and larger systems [4]. The extrusion system is considered the limiting factor in FFF 3D printing [5]. The maximum achievable volumetric flow is limited on the one hand by the extruder and on the other hand by the hotend. In the extruder, the maximum force that can be applied to the filament is limited by the force between the driving rollers and the filament. The maximum attainable value strongly depends on the extruder design, in particular on the driving rollers and their arrangement, as well as on the manufacturer. Studies have determined a wide range of 62 to 172 N as the maximum force that can be applied [3,6,7]. In the hotend, which consists of the heater and nozzle, the material is brought from a solid to a liquid state and is then forced through a nozzle of reduced diameter. Consequently, the forces required by the extrusion system are largely determined by process parameters, such as the heater temperature and feed rate, as well as by the nozzle’s geometric characteristics. Due to the large open-source community in 3D printing [1], the maximum volumetric flow and its influencing factors have also been discussed in the community in addition to peer-reviewed publications [8]. In 2004, Bellini et al. [9] proposed an analytical model for low filament feed rates, dividing the melting zone into three distinct regions (see Figure 1b): a cylindrical region with approximately the same diameter as the filament, a conical transition region tapering toward the nozzle capillary, and the capillary itself. The model assumes an isothermal, pressure-driven flow in the nozzle, generated by the solid filament, which is already completely molten in the first region and therefore acts as a plunger pushing the melt through the nozzle [9]. This assumption has been widely adopted in the literature [10]. However, Osswald et al. [11] argued that this model is only valid at low filament feed rates. At higher, more realistic feed rates, their model predicts delayed melting and the formation of a thin melt film in the conical section of the nozzle, resulting in a conical transition zone along the nozzle wall (see Figure 1c). While this model provides a more realistic description of the melting process for high filament feed rates, it has so far only been validated for extrusion forces up to 40 N [11]. However, in practice, the forces may be higher, especially at high printing speeds. Due to limited experimental validation, the range of applicability of each model remains unclear. The actual melting mechanism is likely intermediate between the idealized low- and high-speed scenarios for a wide range of filament feed rates, as suggested by recent experimental studies employing in-situ X-ray computed tomography [12]. In particular, these studies show that with increasing filament feed rate, the flow profile within the melting channel becomes increasingly plug-flow-like. This behavior is attributed to pronounced non-isothermal effects, which become the limiting factor. Overall, the experiments identify heat transfer as the limiting factor, as a restricted thermal energy supply impedes complete melting and induces pressure losses that exceed the capability of the filament-feeding mechanism. Consistent with this interpretation, experimental studies report two characteristic regimes during material extrusion [13,14]. In the linear regime, the extrusion force increases approximately proportionally with the filament feed rate. Beyond a critical feed rate, a non-linear regime emerges, characterized by unstable force evolution. It is therefore plausible that the transition to the non-linear regime indicates the onset of heat-transfer-limited melting.
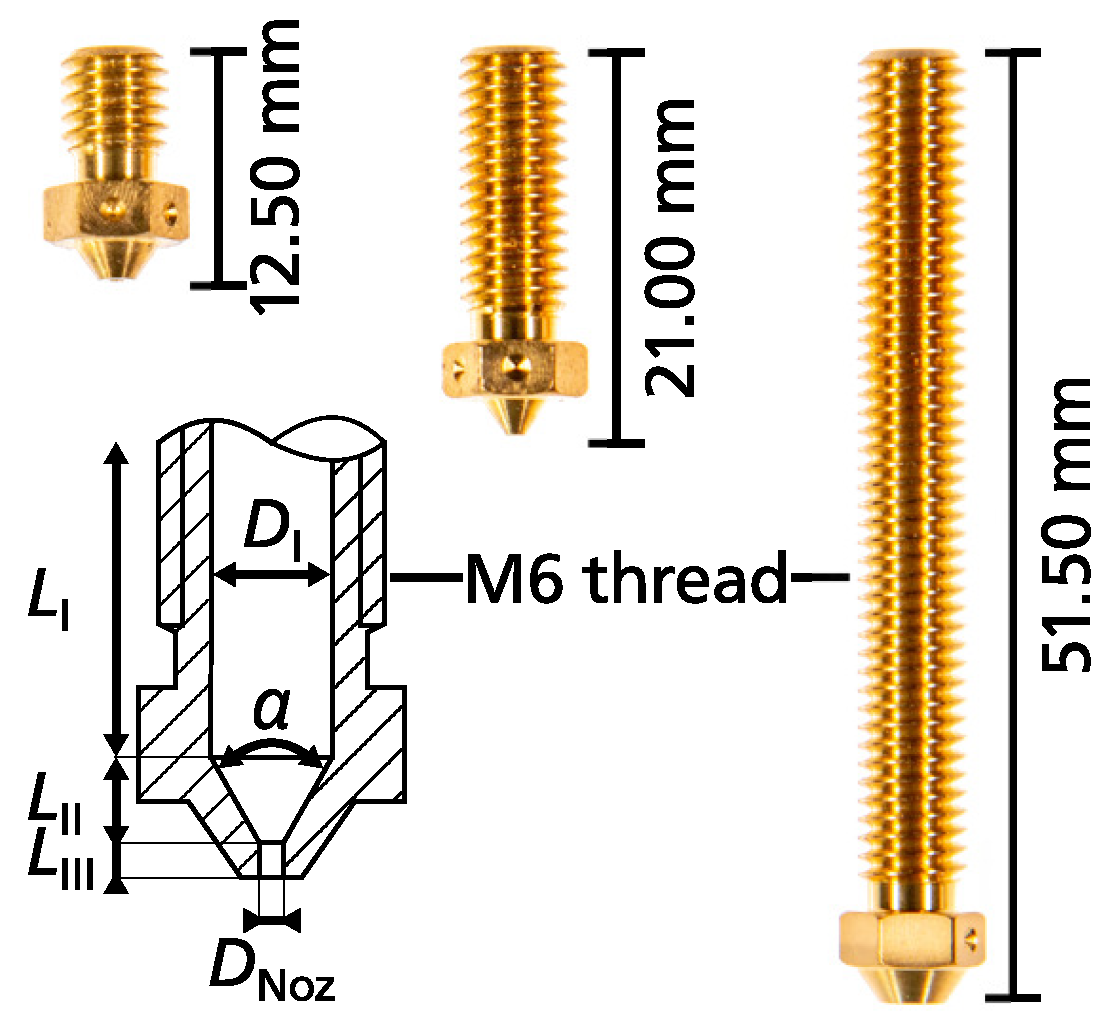
To increase volumetric flow rates, nozzle designs with varying melting zone lengths have been developed (Zone I in Figure 1b). Examples include variants of the widely used v6 nozzle (E3D, Chalgrove, United Kingdom) (see Figure 2). Values for maximum volumetric flow rates from various sources are summarized in Table 1. Recent work has demonstrated that nozzle concepts beyond the conventional single-channel design, such as multi-channel splitting geometries, can substantially reduce the pressure drop and thus enable higher volumetric throughput [15]. In the present study, however, the analysis is deliberately restricted to conventional, axisymmetric nozzle geometries, as they provide a well-established and widely comparable baseline for extrusion-force characterization and model validation [13,16].
For applications requiring high volumetric flow rates, a filament diameter of 1.75   mm is commonly recommended, as a smaller diameter is expected to lead to faster radial heating across the cross-section. In transient radial heating, the time to reach a given core temperature is given by
t = F o · r 2 α ,
where t is time; F o is the Fourier number determined by the target centerline temperature; r is the filament radius; and α is the thermal diffusivity. Consequently, the characteristic melting time increases with the square of the filament radius [21]. At the same time, specialized high-flow extruders, such as the Dyze Design Typhoon (LeMoyne, Canada), rely on filaments with a diameter of 2.85   m m . Thus, the optimal filament diameter for high volumetric throughput remains unclear. As 1.75   m m and 2.85   m m are the two diameters in widespread industrial use, both established standards are covered in this study.
Although melting in FFF nozzles has been studied extensively, the melting zone length L is rarely treated as an explicit design parameter. Here, the melting zone is defined as the nominal axial extent of the heated melt path inside the hotend and nozzle, measured along the filament flow direction from the upstream entrance of the heated region to the nozzle exit. In this work, L is systematically varied as an operational descriptor that captures the combined effects of heating residence time and wall-contact-induced viscous resistance. Extrusion-force measurements are combined with numerical simulations of conventional cylindrical nozzle geometries to quantify how filament diameter, nozzle set temperature, and L jointly govern the relation between feed rate and extrusion force, as well as the attainable maximum volumetric flow rate [13,14]—with the aim of providing design guidance for high-throughput FFF hotends.

2. Materials and Methods

2.1. Experimental Setup

The experimental setup, including the test-rig design and load-cell integration, has been described in detail previously [13,22] and is only briefly summarized here. It comprised a calibrated load cell (measuring range 0–200 N , measuring accuracy 2 σ = 1 N ) mounted between the extruder and the hotend, which was used to measure the process forces F acting on the filament (see Figure 3). Data acquisition was performed using a cRIO 9074 system in combination with a PC running LabVIEW (National Instruments, Austin, TX, USA). Compared to earlier studies [13], several modifications were implemented. Different extruders were employed for the two filament diameters: an E3D Titan extruder (Chalgrove, United Kingdom) for 1.75   m m filament and a Bondtech DDG extruder (Värnamo, Sweden) for 2.85   m m filament. Because the load cell measured the force acting directly on the filament, the specific extruder design did not affect the force-throughput characterization. However, as different extruder designs exhibit different maximum transferable forces [7], preliminary tests were conducted to determine F max for each configuration, yielding approximately 60 N for the E3D Titan and 70 N for the Bondtech DDG. Above these force levels, excessive slipping of the driving rollers occurred, leading to unreliable force measurements. Consequently, experiments were terminated when this threshold was exceeded. Data above this limit were truncated for the evaluation. Q Fil refers to the nominal feed rate commanded at the extruder, mirroring the open-loop operation of conventional FFF systems. Any residual slip at the driving rollers is inherent to the extruder hardware and likewise present in production use [7]. The reported maximum Q Fil values therefore characterize the practically attainable throughput under realistic operating conditions, bounded by the configuration-specific force threshold (60 N /70 N ) above which slip becomes excessive.
To facilitate comparison across cases, the measured forces are additionally reported in normalized form using F max (see Section 4.2).

2.2. Investigated Nozzle Geometries and Process Parameters

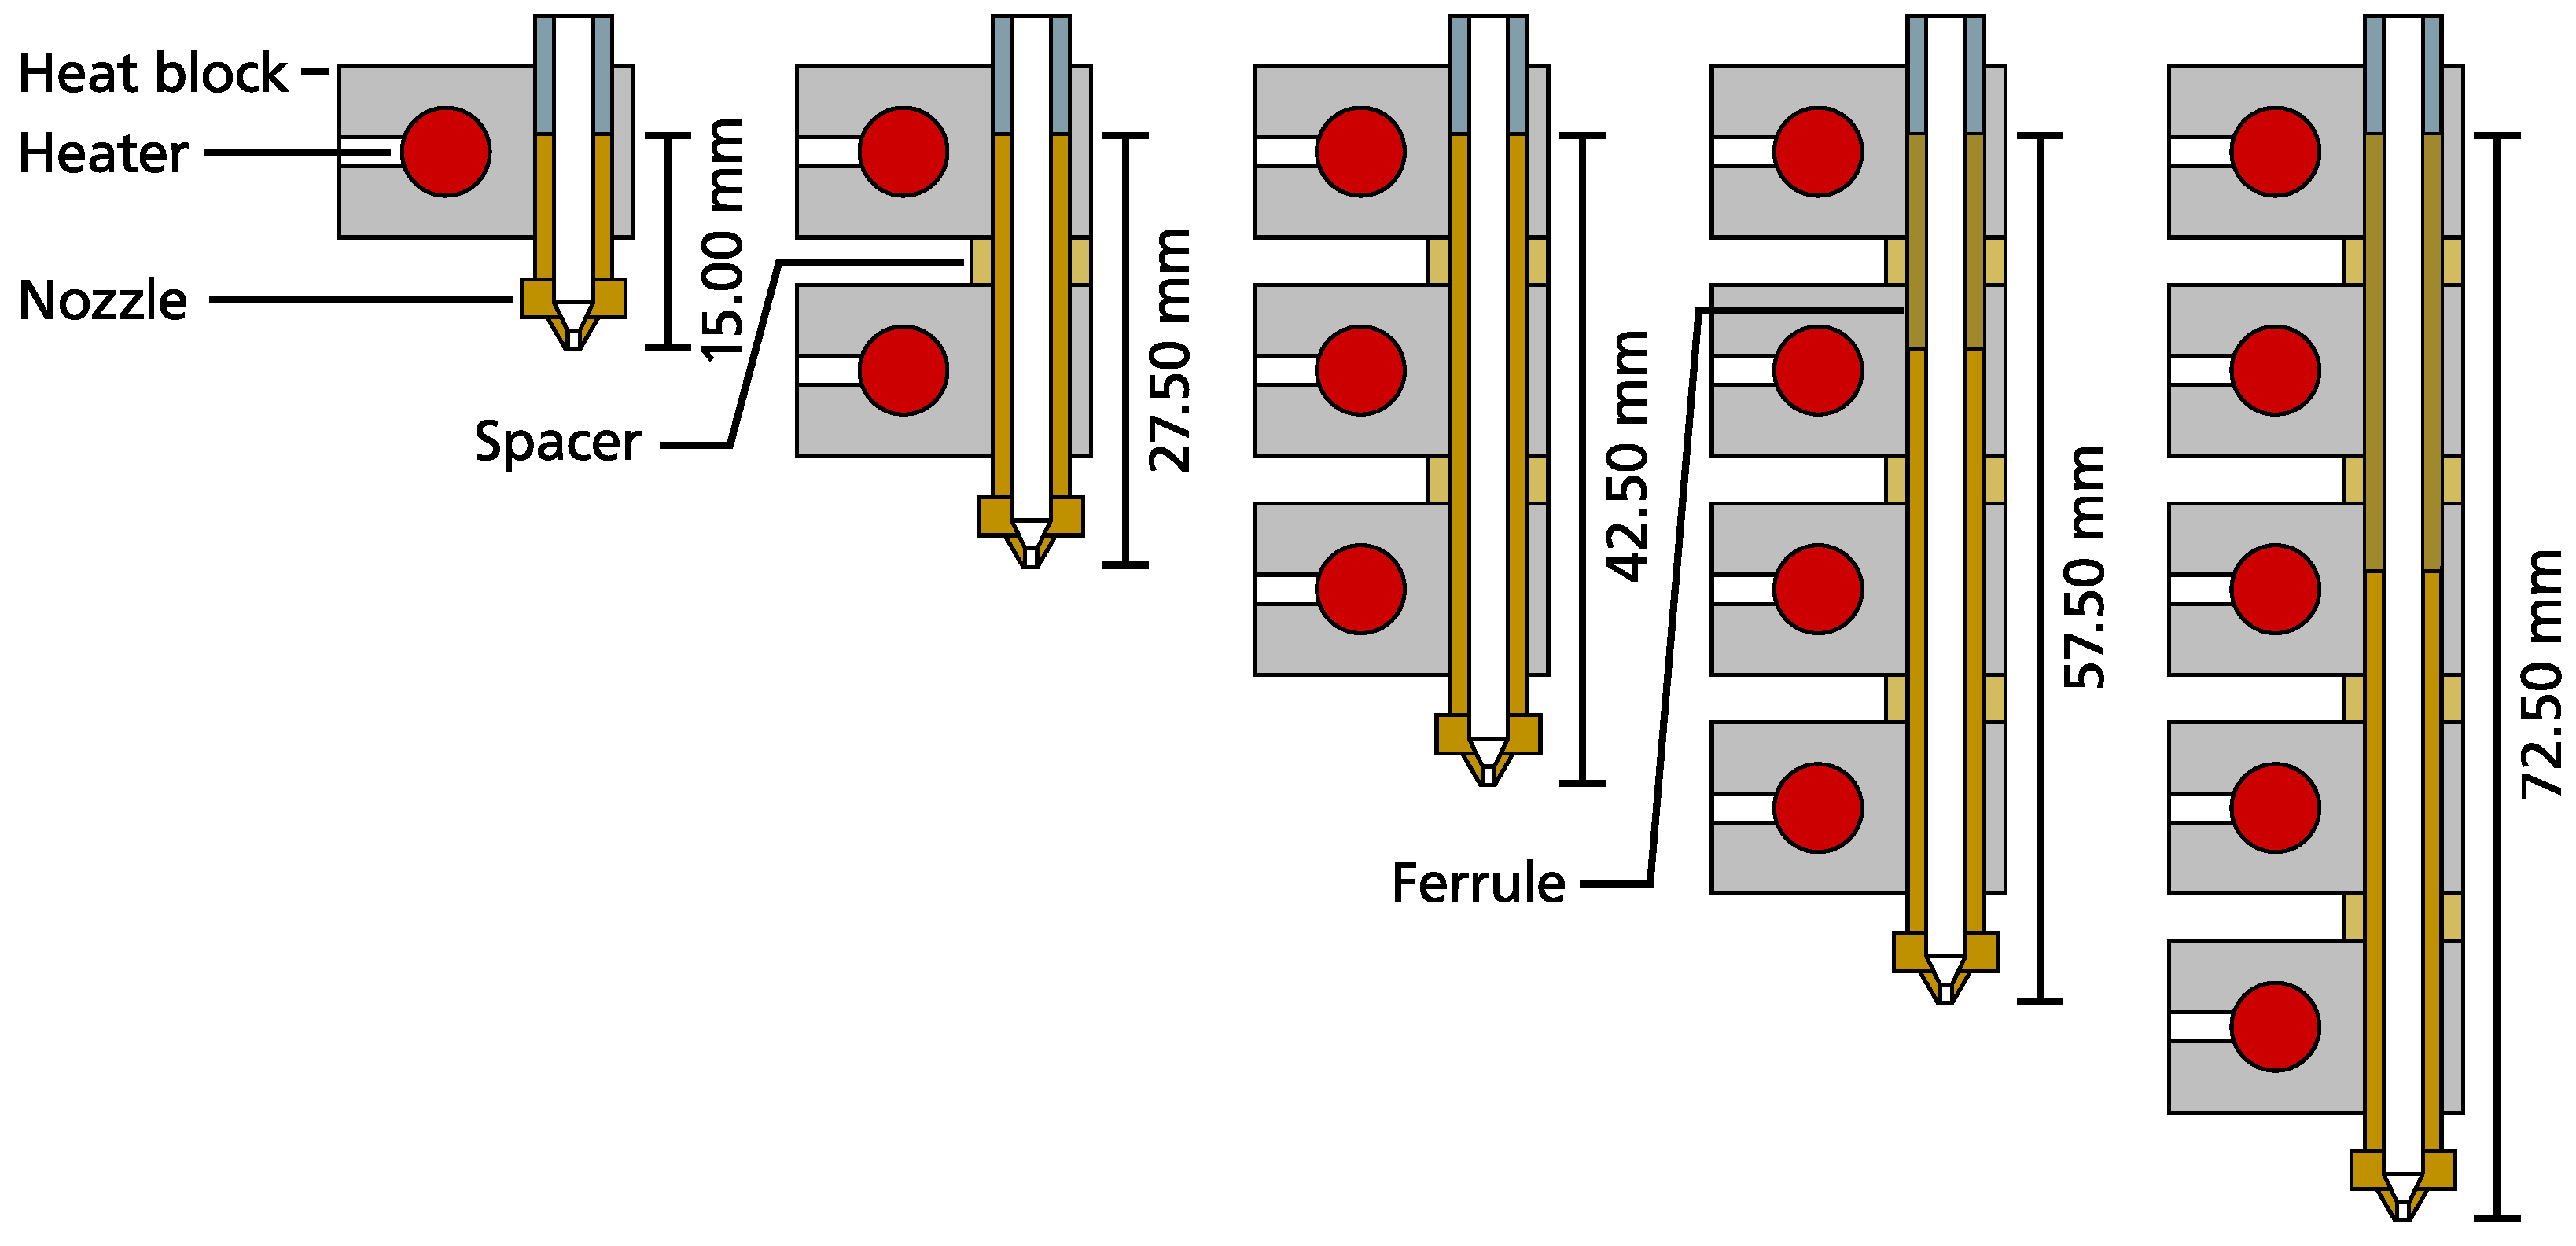
To investigate the influence of melting zones with different axial lengths, E3D v6 nozzles were machined to various lengths. Nozzles with nominal lengths L of 15 m m , 27.5   m m , 42.5   m m , 57.5   m m , and 72.5   m m were examined. The configurations with lengths of 57.5   m m and 72.5   m m were realized by extending the machined nozzles using ferrules with lengths of 15 m m and 30 m m , respectively. In the present work, L denotes the nominal geometric axial length of the heated melt path formed (based on the E3D v6 nozzle geometry) by the machined nozzle, as illustrated in Figure 4. Due to axial temperature gradients and material-dependent heat transfer effects, the effective axial length over which the filament is fully molten may deviate from L. Nevertheless, L represents a consistent and practically relevant design parameter for the comparison of force and throughput behavior across different configurations. The increased melting zone lengths required additional heating elements. This was achieved by integrating multiple E3D v6 heating blocks, each equipped with a 40 W heater cartridge (E3D, Chalgrove, United Kingdom), which were separated by 3.5   m m thick spacers. The use of 40 W heater cartridges was considered adequate, as the performance limit of a conventional FFF hotend is typically determined not primarily by the nominal heater power but by heat input into the filament core or melting zone [3]. Temperature control was realized using an ATR 121 controller (Pixsys, Pianiga, Italy) in combination with a two-wire PT1000 temperature sensor (Meltbro, Bonn, Germany). All nozzles, ferrules, and spacers were manufactured from brass. The different configurations are shown in Figure 4. In all experiments, the nozzle outlet diameter D Noz was kept constant at 1.2   m m . This diameter was selected to reflect high-throughput printing conditions, where large nozzle diameters are commonly used to maximize volumetric deposition rates, as evidenced by the commercial configurations listed in Table 1. Since the capillary pressure drop, and therefore the extrusion force, rise as the nozzle diameter decreases, smaller diameters restrict the achievable flow rate. The comparatively large diameter of 1.2   m m was therefore deliberately chosen and held constant, both to match the high-throughput focus of this work and to isolate the influence of the melting zone length L.
In addition to variations in the barrel section length L, volumetric flow rates Q Fil were increased stepwise until the maximum achievable throughput was reached. Experiments were conducted at nozzle temperatures T from 190 to 230 °C, where T denotes the heater block temperature setpoint in accordance with common FFF terminology. For each test condition, extrusion was maintained for 60 s to reach a stationary operating state, after which 300 data points were acquired over 30 s and averaged. The standard deviation across these samples was computed for each parameter combination. The individual values are provided in Table S3 in the Supplementary Materials.

2.3. Material

In all tests, polylactic acid (PLA) NX2 black (Extrudr, Lauterach, Austria) was used as the filament material. Prior to use, the filament was dried for 24 h at 50 °C. The rheological behavior of the material was characterized using a Discovery HR-3 rotational rheometer (TA Instruments, Inc., New Castle, DE, USA). Measurements were performed with a parallel-plate geometry of 25 m m diameter and a fixed gap of 1 m m . Oscillatory shear experiments were carried out at a constant strain amplitude of 5%, which was confirmed to lie within the linear viscoelastic regime. The angular frequency was varied between 0.01 and 628 rad / s . Measurements were conducted at three temperatures, namely 180 °C, 200 °C, and 220 °C.
A master curve was constructed at a chosen reference temperature by applying time-temperature superposition. The temperature-dependent shift factors were described using the Williams–Landel–Ferry model,
log a T = C 1 T T 0 C 2 + T T 0 ,
where a T denotes the shift factor, T 0 is the reference temperature, and C 1 and C 2 are material parameters.
The complex viscosity obtained from the oscillatory measurements was transformed into an equivalent steady-state shear viscosity by applying the Cox–Merz relationship [23]. The resulting shear-rate-dependent viscosity was subsequently described using the Carreau–Yasuda model,
η η 0 = 1 + λ γ ˙ a n 1 a ,
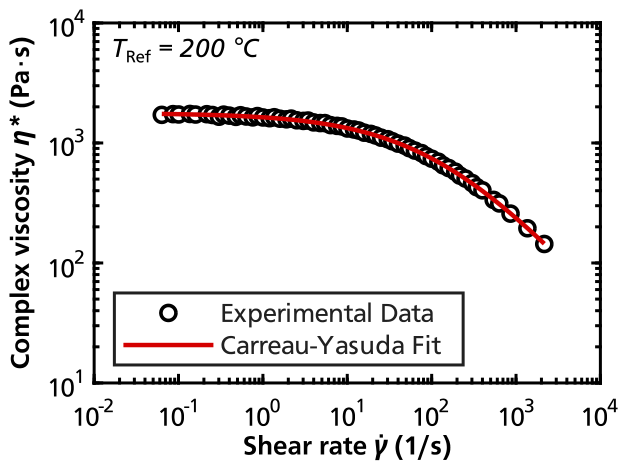
where η 0 denotes the zero-shear viscosity, λ represents a characteristic relaxation time, n is the power law index, a controls the transition between Newtonian and shear-thinning behavior, and γ ˙ is the shear rate magnitude. The resulting master curve is shown in Figure 5. The fitted WLF parameters at T R e f = 200 °C are C 1 = 3.58 and C 2 = 77.6   K . Fitting the Carreau–Yasuda model yields η 0 = 1776   Pa s , λ = 0.0084   s , n = 0.22 , and a = 0.58 .

3. Numerical Model

Numerical simulations are employed to complement the experimental investigations and to resolve the thermo-mechanical processes governing filament melting and flow inside the nozzle. The numerical model used in this work builds on the framework introduced in [16] and describes filament melting using a single-phase continuum formulation. This approximation is supported by in-situ observations of comparable hotend flows, which indicate that the polymer melt predominantly remains in contact with the nozzle wall in the relevant melting and flow region [12]. Solid and molten material states are differentiated using a temperature-dependent melt-fraction model, enabling a smooth and continuous transition. The temperature dependence is incorporated via a modified Williams–Landel–Ferry shift function, while shear-thinning behavior is described using a Carreau–Yasuda formulation. Accordingly, the model adopts a generalized-Newtonian formulation and does not explicitly resolve viscoelastic stresses, as their treatment over the large temperature range from room temperature to nozzle temperature would involve strongly temperature-dependent relaxation times and numerical challenges associated with the high-Weissenberg-number problem [24]. Although non-isothermal viscoelastic printing nozzle simulations have been reported in the literature [25], such approaches have so far been facilitated by material parameterizations with comparatively short relaxation times, which limits their direct transferability to the estimated strongly temperature-dependent relaxation dynamics considered here. The parameters defining the temperature-dependent melt fraction model, as well as further modeling details—including mesh, boundary conditions, and the complete material-parameter set, with the temperature-dependent specific heat capacity in Table S1 and the Tait equation-of-state parameters in Table S2—are provided in the Supplementary Materials S1. The thermal conductivity was assumed constant, consistent with values reported for PLA in the literature [26,27], and the Tait equation-of-state parameters were adopted from [28]. The melt-fraction weighting function used to distinguish solid- and melt-dominated material behavior follows the formulation proposed by [29].
Thermal effects are captured by solving the energy equation with temperature-dependent material properties, assuming continuous wall contact between the filament and the nozzle in the relevant melting zone, and prescribing a constant wall temperature. Density variations with pressure and temperature are described using a Tait equation of state. The governing equations are solved under steady-state conditions for a two-dimensional axisymmetric nozzle geometry with a prescribed filament feed rate and atmospheric pressure at the outlet, while inertial and gravitational effects are neglected. The model is implemented in the open-source CFD framework OpenFOAM (v11) using a modified compressible steady-state solver (rhoSimpleFoam).

4. Results and Discussion

4.1. Temperature Dependence

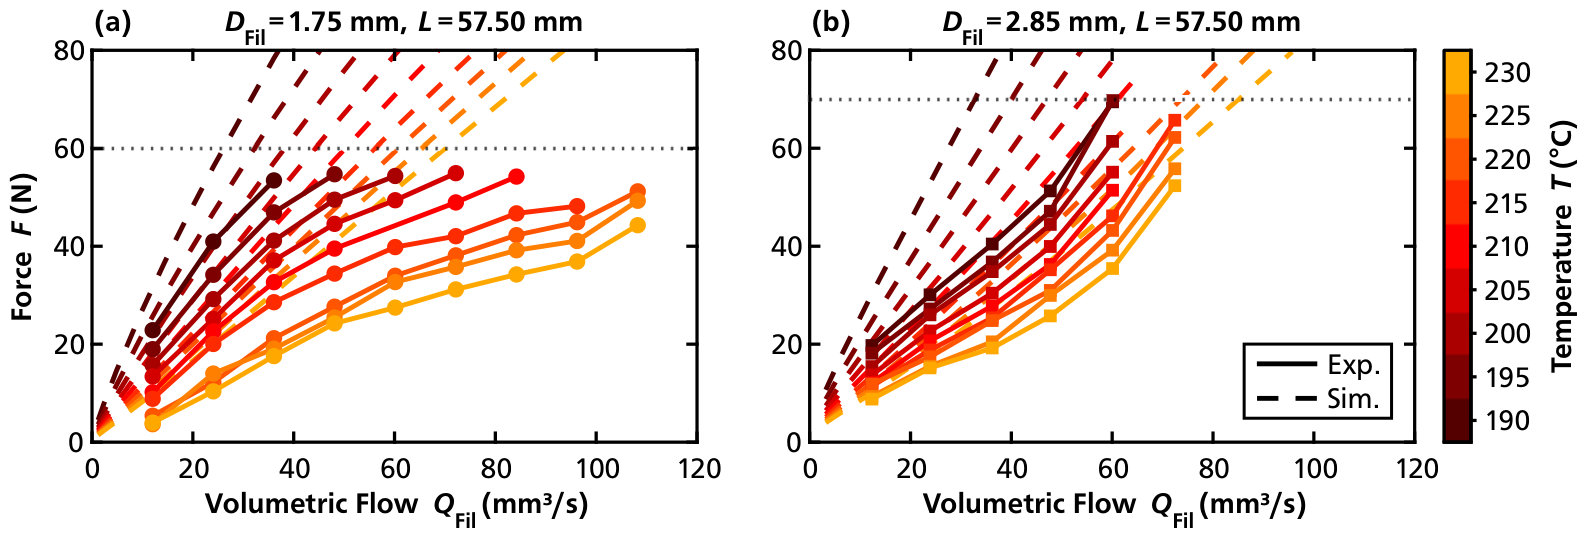
First, nozzle temperature was varied from 190 to 230 °C in increments of 5 °C. The process force curves shown in Figure 6 for a melting zone length of 57.50   m m indicate that the extrusion force F decreased with increasing nozzle temperature T, while the maximum achievable volumetric flow rate Q Fil increased. This behavior was observed for all investigated melting zone lengths and is consistent with experimental results reported in the literature by Nienhaus et al. [13] and Kattinger et al. [16].
From a processing perspective, this indicates that higher nozzle temperatures are beneficial for achieving high extrusion rates, provided that thermal degradation of the polymer is avoided. For the PLA material used in this study, degradation is reported to start at temperatures of approximately 240 °C. Consequently, no significant material degradation is expected within the temperature range considered here [30,31].
Beyond this general temperature effect, comparing the extreme values of nozzle temperature T and melting zone length L revealed pronounced differences in the achievable volumetric flow rate. For 1.75   m m filament, the maximum volumetric flow rate increased by 450% when comparing the most favorable parameter combination ( L = 57.50   m m , T = 230 °C) with the least favorable one ( L = 15.00   m m , T = 190 °C). For 2.85   m m filament, an even stronger increase of 780% was observed when comparing L = 72.50   m m and T = 230 °C with L = 15.00   m m and T = 190 °C, as summarized in Table 2. These results already indicate a pronounced influence of the melting zone length on the maximum achievable volumetric flow rate, which is examined in more detail in the following section.
The numerical simulations reproduced the experimentally observed trends well; however, they quantitatively overpredicted the extrusion force. The underlying thermal mechanism is further illustrated in the Supplementary Materials by the temperature fields. Figures S4 and S5 show that the unmelted filament core penetrates deeper into the nozzle as the feed rate increases, reflecting the reduced thermal residence time at higher throughput. Increasing the nozzle temperature shifts the melt front upstream, so that the unmelted core extends less far into the nozzle. The temperature effect is, however, markedly smaller than the effect of feed rate over the investigated range. In particular, the simulations predict an almost linear increase in extrusion force with increasing filament feed rate for each temperature level, while capturing the overall reduction in force and the shift toward higher achievable flow rates at elevated nozzle temperatures.

4.2. Interplay Between Melting Zone Length and Filament Diameter

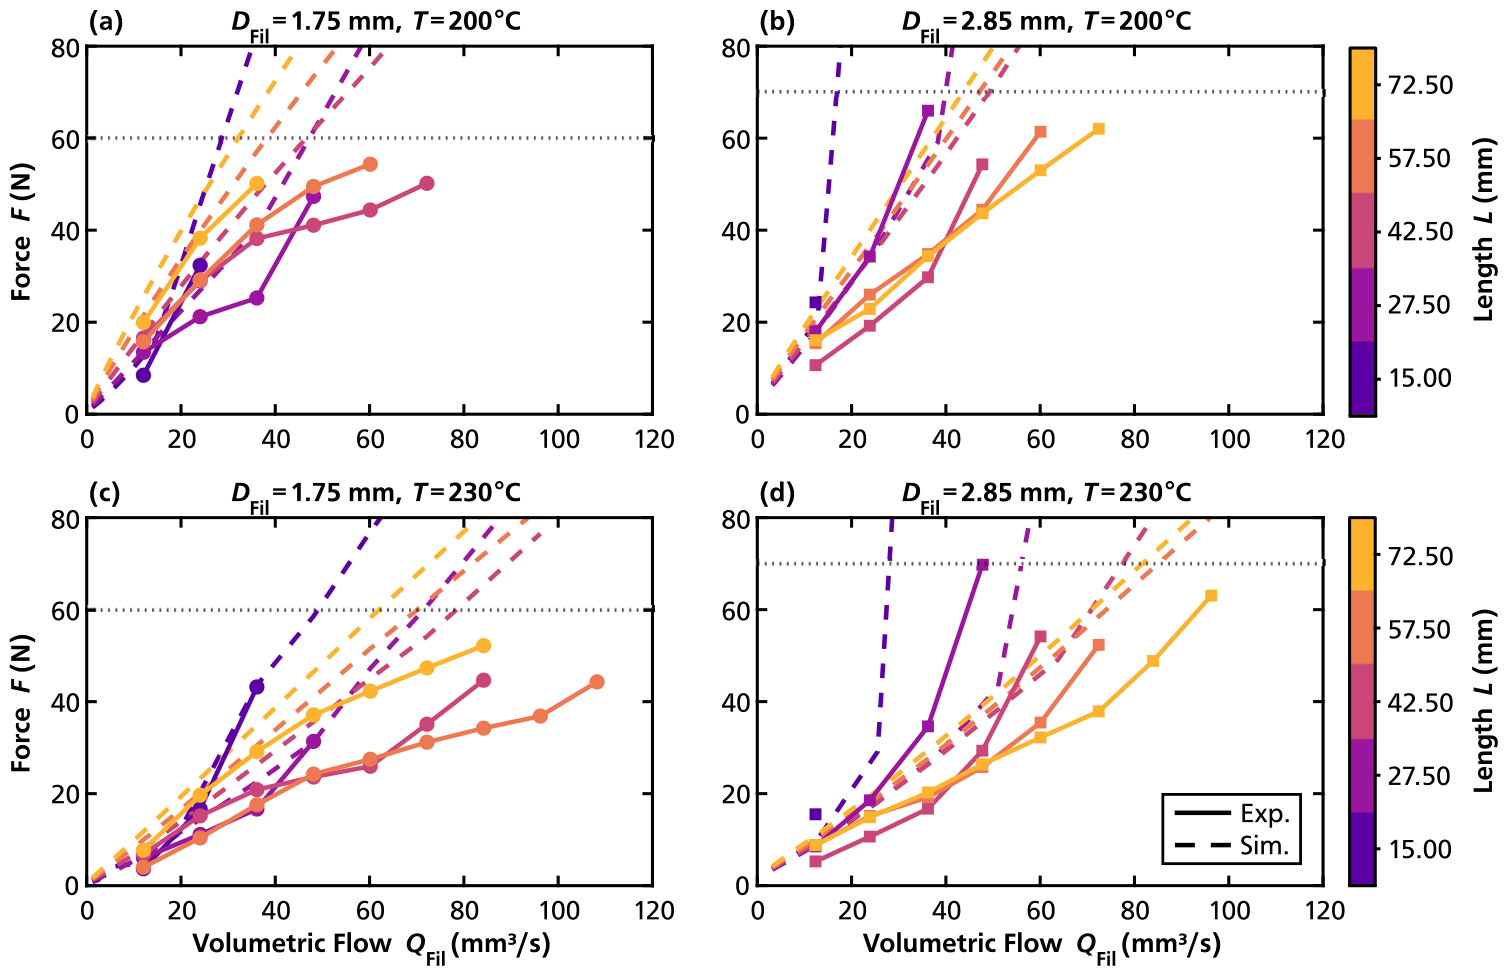
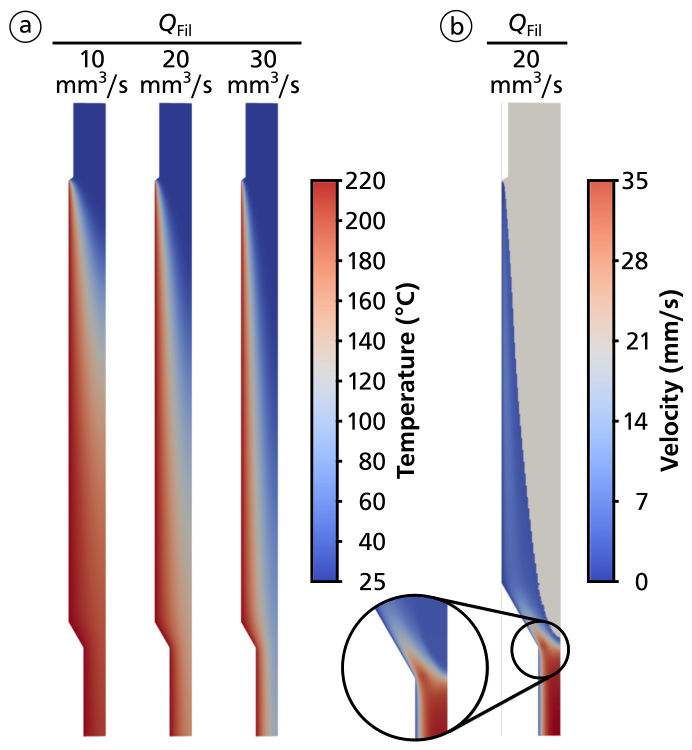
The results show that the influence of melting zone length was not uniform across the investigated conditions but depended strongly on filament diameter, as illustrated in Figure 7 (all maximum values are provided in Supplementary Materials S3). For a filament diameter of 2.85   m m , a clear monotonic trend was observed, with increasing melting zone length leading to higher achievable volumetric flow rates over the entire investigated range. Increasing the melting zone length from L = 15.00   m m to L = 72.50   m m resulted in a continuous increase in the maximum volumetric flow rate, reaching up to 96.28   m m 3/ s at nozzle temperatures of 215 to 230 °C. In contrast, no such monotonic behavior was observed for the 1.75   m m filament. Here, the maximum attainable volumetric flow rate initially increases with melting zone length and reaches 108.24   m m 3/ s at an intermediate value of L = 57.5   m m . For longer melting zone lengths, the required extrusion force increases again, leading to a reduced maximum attainable volumetric flow rate. Notably, for the 1.75   m m filament, the shortest melting zone ( L = 15.00   m m ) yields the lowest process force at low flow rates ( Q Fil < 20   m m 3 / s ), but the force rises sharply with increasing filament feed rate. The simulations reproduced this characteristic behavior well and show that increasing the feed rate results in steeper temperature gradients (see Figure 8a). Consistent with the experiments, the simulations predicted that extending L increases the attainable maximum volumetric flow rate for the 2.85   m m filament.
This behavior can be explained by the interplay between residence-time-controlled melting and viscous flow resistance in the nozzle. Increasing the filament feed rate reduces the residence time of the material in the heated zone, and shortening the melting zone length reduces it as well. A longer melting zone increases the available residence time and therefore improves heat transfer to the filament, promoting more homogeneous and complete melting. As long as the residence time is sufficient to fully melt the filament, the melt viscosity is primarily set by the temperature level, and the force-throughput relation is largely governed by viscous pressure losses in the flow channel. In this fully melted regime, further increasing the melting zone length mainly increases the viscous pressure drop along the nozzle, and therefore raises the required extrusion force. These flow-resistance-dominated effects are consistent with experimental findings reported by Nienhaus et al. [13] and Kattinger et al. [16].
At higher feed rates, however, the reduced residence time can become insufficient for complete melting. In this case, the simulations predict (see Supplementary Materials S2) that stronger temperature gradients and partially melted regions persist, increasing the effective flow resistance and causing the extrusion force to rise sharply with throughput. This onset of the steep force increase occurs at lower feed rates for shorter melting zones, because the available residence time becomes limiting earlier. The simulations reflect this competition by predicting nearly homogeneous melt temperatures at low feed rates, even for short melting zones, whereas at high feed rates, the temperature gradients steepen and the force response becomes increasingly dominated by incomplete melting and the associated pressure losses.
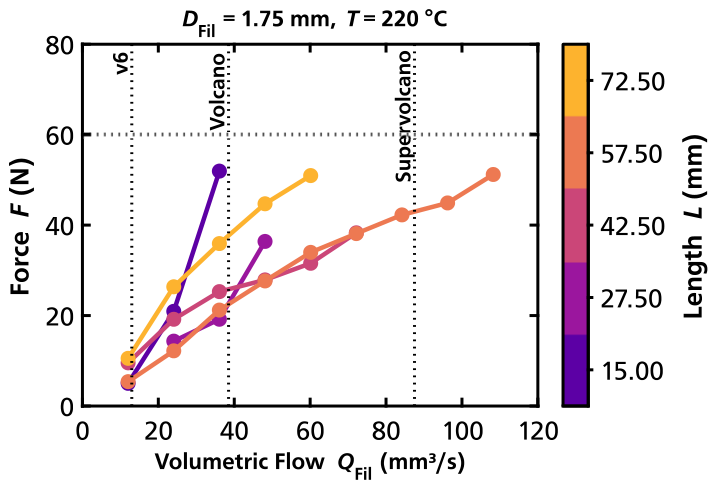
To assess the practical relevance of the observed trends, the achievable volumetric flow rates are compared with literature data and commercially available nozzle designs from Table 1. The comparison is deliberately drawn at the level of the extruder–hotend combination, not of complete printers, since these are additionally governed by machine kinematics, axis speeds, and part cooling. As shown in Figure 9, extending the melting zone length beyond current commercial configurations allows substantially higher volumetric flow rates while remaining below the maximum transferable force of the feeding system.
The different trends observed for the two filament diameters can be attributed to their distinct thermal and geometrical characteristics. Since the filament diameter directly determines the surface-to-volume ratio, a strong influence on the melting behavior is expected. For the 2.85   m m filament, the lower surface-to-volume ratio requires longer melting zone lengths to achieve sufficient and homogeneous melting. At the shortest melting zone length of L = 15.00   m m , no volumetric flow above 12.34   m m 3/ s was achievable without exceeding the force limit, regardless of the applied temperature. As a result, the beneficial effect of extending the melting zone dominated over the additional viscous losses across the entire investigated range. This is consistent with the simulations, which predicted a systematic shift toward higher achievable flow rates with increasing L (the slope of the respective curves flattens out, see Figure 7).
In contrast, the 1.75   m m filament heats up and melts more rapidly due to its smaller diameter and higher surface-to-volume ratio, such that the positive effect of increased melting zone length saturates at shorter lengths. Consequently, further increases in the melting zone length primarily result in additional viscous pressure losses rather than improved melting, which explains the observed optimum and the reduced attainable flow rates at longer melting zones.
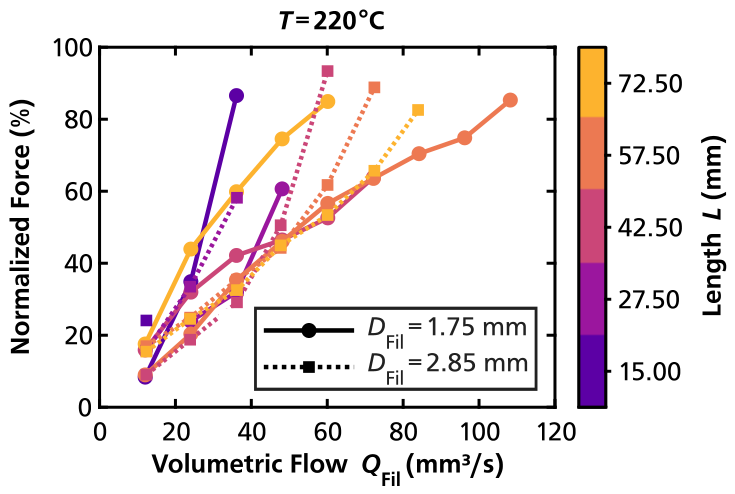
Regardless of temperature, the absolute extrusion forces are consistently higher for the larger filament diameter, which can be attributed to the higher thermal mass per unit length. While the use of 2.85   m m filament offers design advantages, such as a larger engagement surface between the extruder gear and the filament and thus higher transmittable forces, the smaller filament diameter proves more favorable for achieving maximum volumetric flow rates. This is confirmed not only by the higher absolute flow rates achieved in this study but also when normalizing the extrusion force by the maximum transferable force of the respective feeding system to assess the available performance margin of the extruder, where the 1.75   m m filament exhibits superior performance except for the longest nozzle as discussed above (see Figure 10).
The simulation results further allow a qualitative assessment of the melting models discussed in the introduction. For the 2.85   m m filament, the molten region is largely confined to a thin melt film along the nozzle wall (see Figure 8b), which is characteristic of the high-speed melting model proposed by Osswald et al. [11]. In contrast, for the 1.75   m m filament at moderate feed rates, more homogeneous melting across the cross-section is observed, which is more consistent with the low-speed assumptions of the Bellini model [9]. This suggests that the two models describe limiting cases that are each realized in practice, depending on filament diameter and feed rate.

5. Conclusions

This study quantified the effect of melting zone length on extrusion force and throughput in FFF of PLA by combining extrusion-force measurements with non-isothermal simulations of conventional axisymmetric nozzles. Increasing nozzle set temperature reduced extrusion forces and enabled higher attainable volumetric flow rates. The effect of melting zone length depended strongly on filament diameter. For D Fil = 2.85   m m , extending L increased the maximum attainable flow rate monotonically, indicating that improved melting dominates over additional viscous losses. For D Fil = 1.75   m m , an optimum at intermediate L was observed, beyond which extra flow resistance reduced the attainable flow rate. The simulations reproduced these trends and predicted approximately linear increases in force with feed rate at each temperature, supporting the interpretation that throughput limits arise from the competition between heat-transfer-controlled melting and viscous pressure losses.
While the simulations capture the experimental trends, quantitative deviations remain in parts of the parameter space. These deviations may arise from elastic effects of the polymer melt that were not included in the present simulations. Further uncertainty may also arise from neglecting the interface between the polymer and the surrounding air, as well as from the simplifying assumption of continuous contact between the filament and the nozzle wall.
Overall, the results identify L as a relevant design parameter for high-throughput hotends and provide guidance for selecting filament diameter, nozzle temperature, and melting zone length within the force limits of the feeding system. For high-throughput operation, it is recommended to use the highest nozzle temperature compatible with material stability. The melting zone length L should be selected according to filament diameter: longer melting zones for a 2.85   m m filament and intermediate lengths for a 1.75   m m filament, to balance melting efficiency and pressure loss.

Supplementary Materials

The following supporting information can be downloaded at: https://www.mdpi.com/article/10.3390/jmmp10070233/s1. Section S1: Numerical model details; Section S2: Simulation results; Section S3: Experimental data; Table S1: Tabulated values of specific heat c p as a function of temperature T; Table S2: Parameter of the Tait equation of state; Table S3: Influence of melt zone length L and temperature T on extrusion force F and maximum volumetric flow rate Q Fil for filament with a diameter D Fil of 1.75   m m and 2.85   m m as well as the respective standard deviation of the force s F ; Figure S1: Computational domain and boundary conditions of the two dimensional axisymmetric nozzle model; Figure S2: Derived melt fraction function MF(T) used to transition between solid-dominated and meltdominated material behavior; Figure S3: Zero-shear viscosity η 0 (T) as a function of temperature, comparing the original WLF expression with the modified formulation incorporating the melt-fraction-based maximum shift; Figure S4: Simulated temperature field and velocity magnitude at T = 200 °C for L = 57.5   m m and Q F i l = 25   m m 3 / s and Q F i l = 100   m m 3 / s . In the velocity representation, the solid region is shown in gray; Figure S5: Simulated temperature field and velocity magnitude at T = 230 °C for L = 57.5   m m and Q F i l = 25   m m 3 / s and Q F i l = 100   m m 3 / s . In the velocity representation, the solid region is shown in gray. Figure S6: Simulated temperature field and velocity magnitude for the short nozzle configuration with L = 15 mm at Q F i l = 25 mm3/s and Q F i l = 100 mm3/s. The figure is split into two panels, with results at T = 200 °C shown on top and T = 230 °C shown at the bottom. In the velocity representation, the solid region is shown in gray.

Author Contributions

Conceptualization, methodology, validation, visualization, supervision, writing—original draft, P.W.; methodology, software, formal analysis, writing—original draft, J.K.; investigation, F.D.; validation, writing—review and editing, D.S.; writing—review and editing, C.B.; writing—review and editing, project administration, A.B. All authors have read and agreed to the published version of the manuscript.

Funding

The numerical simulations were performed at the University of Stuttgart as part of a project funded by the Deutsche Forschungsgemeinschaft (DFG, German Research Foundation) under Grant No. 545960701.

Data Availability Statement

Data will be made available on request.

Conflicts of Interest

The authors declare no conflicts of interest.

References

  1. Wohlers, T.T.; Campbell, R.I.; Diegel, O.; Huff, R.; Kowen, J.; Newton, R.; Wohlers Associates; van Rensburg, J.; Scott, C.; ASTM International. Wohlers Report 2023: 3D Printing and Additive Manufacturing: Global State of the Industry; Wohlers Associates: Washington, DC, USA, 2023. [Google Scholar]
  2. Isi, C.; Gurley, M. 3D Printing Trend Report 2023: Market Insights and Forecasts in Additive Manufacturing; Technical Report; 3D Hubs B.V.: Amsterdam, The Netherlands, 2023. [Google Scholar]
  3. Go, J.; Schiffres, S.N.; Stevens, A.G.; Hart, A.J. Rate limits of additive manufacturing by fused filament fabrication and guidelines for high-throughput system design. Addit. Manuf. 2017, 16, 1–11. [Google Scholar] [CrossRef] [Scilit]
  4. Moreno Nieto, D.; Molina, S.I. Large-format fused deposition additive manufacturing: A review. Rapid Prototyp. J. 2020, 26, 793–799. [Google Scholar] [CrossRef] [Scilit]
  5. Gibson, I.; Rosen, D.; Stucker, B.; Khorasani, M. Additive Manufacturing Technologies; Springer International Publishing: Cham, Switzerland, 2021. [Google Scholar] [CrossRef] [Scilit]
  6. Hermann, S. Which Is the Strongest 3D Printing Extruder? CNC Kitchen (Blog). 2023. Available online: https://www.cnckitchen.com/blog/which-is-the-strongest-3d-printing-extruder (accessed on 19 February 2025).
  7. Nienhaus, V.; Spiehl, D.; Dörsam, E. Investigations on Roller-Based Filament Drives. J. Manuf. Mater. Process. 2021, 5, 53. [Google Scholar] [CrossRef] [Scilit]
  8. Hermann, S. DIY High Flow 3D Printing Nozzle. CNC Kitchen (Blog). 2021. Available online: https://www.cnckitchen.com/blog/diy-high-flow-3d-printing-nozzle (accessed on 19 February 2025).
  9. Bellini, A.; Güçeri, S.; Bertoldi, M. Liquefier Dynamics in Fused Deposition. J. Manuf. Sci. Eng. 2004, 126, 237–246. [Google Scholar] [CrossRef] [Scilit]
  10. Turner, B.N.; Strong, R.; Gold, S.A. A review of melt extrusion additive manufacturing processes: I. Process design and modeling. Rapid Prototyp. J. 2014, 20, 192–204. [Google Scholar] [CrossRef] [Scilit]
  11. Osswald, T.A.; Puentes, J.; Kattinger, J. Fused filament fabrication melting model. Addit. Manuf. 2018, 22, 51–59. [Google Scholar] [CrossRef] [Scilit]
  12. Kattinger, J.; Kornely, M.; Ehrler, J.; Bonten, C.; Kreutzbruck, M. Analysis of melting and flow in the hot-end of a material extrusion 3D printer using X-ray computed tomography. Addit. Manuf. 2023, 76, 103762. [Google Scholar] [CrossRef] [Scilit]
  13. Nienhaus, V.; Smith, K.; Spiehl, D.; Dörsam, E. Investigations on nozzle geometry in fused filament fabrication. Addit. Manuf. 2019, 28, 711–718. [Google Scholar] [CrossRef] [Scilit]
  14. Serdeczny, M.P.; Comminal, R.; Pedersen, D.B.; Spangenberg, J. Experimental and analytical study of the polymer melt flow through the hot-end in material extrusion additive manufacturing. Addit. Manuf. 2020, 32, 100997. [Google Scholar] [CrossRef] [Scilit]
  15. Christodoulou, I.; Karampasakis, E.; Karmiris-Obratański, P.; Markopoulos, A. Enhanced polymer melt flow control in material extrusion: Modified cross-WLF modeling and experimental validation of nozzle design for pressure reduction. Mater. Des. 2025, 259, 114884. [Google Scholar] [CrossRef] [Scilit]
  16. Kattinger, J.; Ebinger, T.; Kurz, R.; Bonten, C. Numerical simulation of the complex flow during material extrusion in fused filament fabrication. Addit. Manuf. 2022, 49, 102476. [Google Scholar] [CrossRef] [Scilit]
  17. E3D-Online. Finish Your Print Quicker Than Ever Before, the SuperVolcano Has Erupted. E3D News (Blog). 2019. Available online: https://e3d-online.com/blogs/news/finish-your-print-quicker-than-ever-before-the-supervolcano-has-erupted (accessed on 10 June 2025).
  18. E3D-Online. V6, Volcano, SuperVolcano Maximum Flow Rates. E3D Help Centre. 2025. Available online: https://e3d-online.zendesk.com/hc/en-us/articles/8960252072093-V6-Volcano-SuperVolcano-Maximum-flow-rates (accessed on 10 June 2025).
  19. E3D-Online. Revo Nozzle Maximum Flow Rates. E3D Help Centre. 2025. Available online: https://e3d-online.com/pages/revo-nozzle-maximum-flow-rates (accessed on 10 June 2025).
  20. Hermann, S. E3D Revo High Flow Review. CNC Kitchen (Blog). 2023. Available online: https://www.cnckitchen.com/blog/e3d-revo-high-flow-review (accessed on 10 June 2025).
  21. Incropera, F.P.; DeWitt, D.P.; Bergman, T.L.; Lavine, A.S. Fundamentals of Heat and Mass Transfer, 6th ed.; Wiley: Hoboken, NJ, USA, 2007. [Google Scholar]
  22. Nienhaus, V. Untersuchung und Modellierung von Kunststoffextrusionssystemen in der Fused Filament Fabrication. Ph.D. Thesis, Technical University of Darmstadt, Darmstadt, Germany, 2021. [Google Scholar] [CrossRef]
  23. Cox, W.P.; Merz, E.H. Correlation of dynamic and steady flow viscosities. J. Polym. Sci. 1958, 28, 619–622. [Google Scholar] [CrossRef] [Scilit]
  24. Meburger, S.; Niethammer, M.; Bothe, D.; Schäfer, M. Numerical simulation of non-isothermal viscoelastic flows at high Weissenberg numbers using a finite volume method on general unstructured meshes. J. Non-Newton. Fluid Mech. 2021, 287, 104451. [Google Scholar] [CrossRef] [Scilit]
  25. Xu, X.; Qiu, W.; Wan, D.; Wu, J.; Zhao, F.; Xiong, Y. Numerical modelling of the viscoelastic polymer melt flow in material extrusion additive manufacturing. Virtual Phys. Prototyp. 2024, 19, e2300666. [Google Scholar] [CrossRef] [Scilit]
  26. Mosanenzadeh, S.G.; Khalid, S.; Cui, Y.; Naguib, H.E. High thermally conductive PLA based composites with tailored hybrid network of hexagonal boron nitride and graphene nanoplatelets. Polym. Compos. 2016, 37, 2196–2205. [Google Scholar] [CrossRef] [Scilit]
  27. Blanco, I.; Cicala, G.; Recca, G.; Tosto, C. Specific Heat Capacity and Thermal Conductivity Measurements of PLA-Based 3D-Printed Parts with Milled Carbon Fiber Reinforcement. Entropy 2022, 24, 654. [Google Scholar] [CrossRef] [Scilit] [PubMed]
  28. Oliaei, E.; Heidari, B.S.; Davachi, S.M.; Bahrami, M.; Davoodi, S.; Hejazi, I.; Seyfi, J. Warpage and shrinkage optimization of injection-molded plastic spoon parts for biodegradable polymers using Taguchi, ANOVA and artificial neural network methods. J. Mater. Sci. Technol. 2016, 32, 710–720. [Google Scholar] [CrossRef] [Scilit]
  29. Karrenberg, G.; Wortberg, J. 3D-CFD-simulation of melting processes in a high-speed-extruder with solid-melt-separation. AIP Conf. Proc. 2014, 1593, 623–627. [Google Scholar] [CrossRef] [Scilit]
  30. Kervran, M.; Vagner, C.; Cochez, M.; Ponçot, M.; Saeb, M.R.; Vahabi, H. Thermal degradation of polylactic acid (PLA)/polyhydroxybutyrate (PHB) blends: A systematic review. Polym. Degrad. Stab. 2022, 201, 109995. [Google Scholar] [CrossRef] [Scilit]
  31. Matos, B.D.M.; Rocha, V.; Da Silva, E.J.; Moro, F.H.; Bottene, A.C.; Ribeiro, C.A.; dos Santos Dias, D.; Antonio, S.G.; do Amaral, A.C.; Cruz, S.A.; et al. Evaluation of commercially available polylactic acid (PLA) filaments for 3D printing applications. J. Therm. Anal. Calorim. 2019, 137, 555–562. [Google Scholar] [CrossRef] [Scilit]
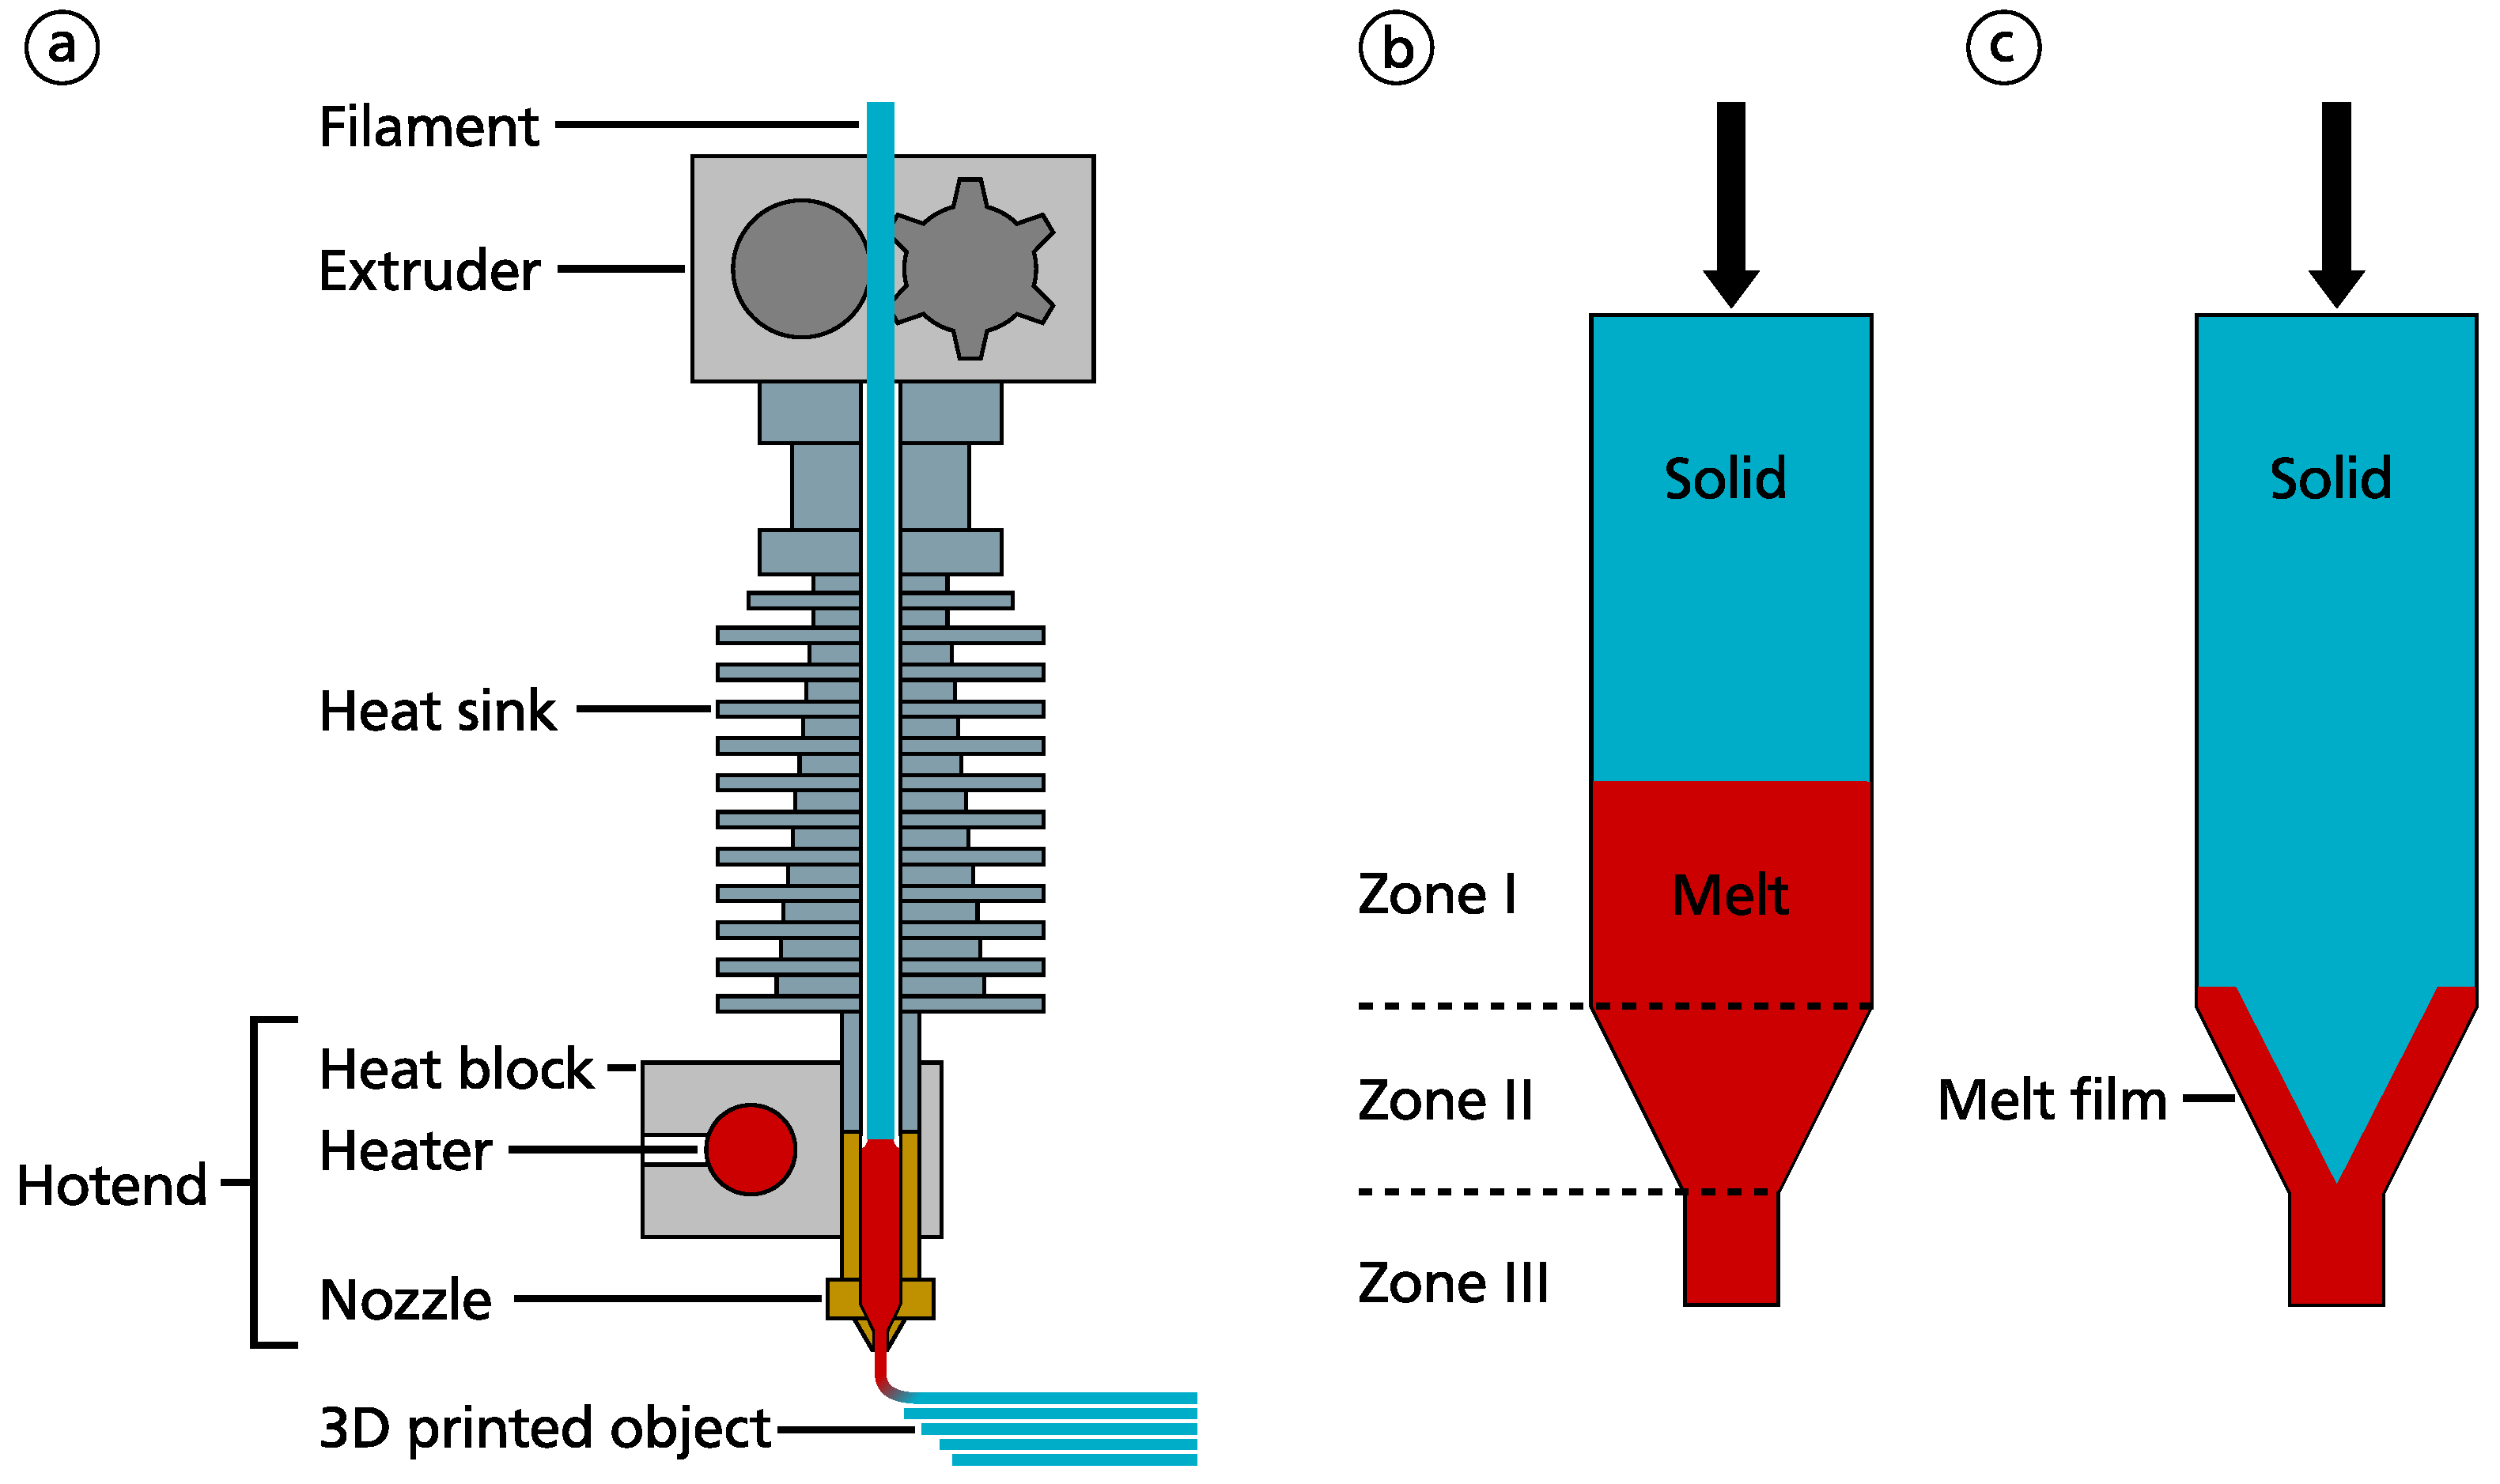
Figure 1. (a) Schematic setup of a FFF print head in which the filament is melted and deposited to form the 3D printed object; (b) Bellini model; (c) Osswald model.
Jmmp 10 00233 g001
Figure 2. Three different nozzles from the manufacturer E3D, from left to right: v6, Volcano, Supervolcano. Except for the length L I of the cylindrical zone I, these are identical in their internal geometry with α = 60 deg , D N o z = 1.2   m m , L I I I = 2.4   m m and D I = 2.0   m m or 3.2   m m , depending on the filament diameter D F i l .
Jmmp 10 00233 g002
Figure 3. Modified FFF print head (modification marked in bold): By adding a load cell between the extruder and the hotend (with an air gap in between for mechanical decoupling), the process forces can be determined.
Jmmp 10 00233 g003
Figure 4. Starting with a nozzle with a total length L of 15 mm (leftmost), where L denotes the axial length of the heated melt path, as defined in Section 2.2, the length of the cylindrical zone was increased to a maximum value of 72.5   mm (rightmost) by incrementally increasing the length by 12.5   mm and adding a heating block. Brass spacers were installed between the respective heating blocks for assembly. Brass ferrules were used to obtain nozzles with a length of 57.5   mm and 72.5   mm .
Jmmp 10 00233 g004
Figure 5. Master curve of shear rate versus complex viscosity.
Jmmp 10 00233 g005
Figure 6. Influence of nozzle temperature on the force–throughput behavior with varying T at constant L = 57.50   m m : (a) D Fil = 1.75   m m ; (b) D Fil = 2.85   m m . Shown is the extrusion force F versus volumetric flow Q Fil for each panel, with L held constant throughout. “Exp.” represents the values from the experiment, “Sim.” the values from the simulation. The measured forces have a mean standard deviation of 1.57   N , smaller than the marker size in this diagram. Individual values are tabulated in the Supplementary Material (Table S3). Error bars are therefore omitted for readability.
Jmmp 10 00233 g006
Figure 7. Effect of melting zone length L on the force–throughput relation: (a) T = 200 °C, D Fil = 1.75   m m ; (b) T = 200 °C, D Fil = 2.85   m m ; (c) T = 230 °C, D Fil = 1.75   m m ; (d) T = 230 °C, D Fil = 2.85   m m . Within each row, T is held constant; within each column, D Fil is held constant. The extrusion force F is plotted against volumetric flow Q Fil , with line color representing L. The dotted horizontal line denotes the maximum force that can be transmitted by the extruder. Again, due to the low standard deviation ( 1.57   N ), error bars are omitted for readability.
Jmmp 10 00233 g007
Figure 8. Simulation results illustrating filament melting and flow inside the nozzle with a length of L = 15.00   m m . (a) Melt fraction distribution at different feed rates for D Fil = 1.75   m m . (b) Velocity distribution for D Fil = 2.85   m m , highlighting the confinement of the molten region to a thin melt film along the nozzle wall.
Jmmp 10 00233 g008
Figure 9. Volumetric flow and force for different melting zone lengths at 220 °C compared to literature data and commonly available commercial nozzles of different lengths L (v6 12.5   m m , Volcano 21 m m , Supervolcano 51.5   m m , see Table 1 and Figure 2), shown as vertical dotted lines. The dotted horizontal line indicates the maximum transferable force of the feeding system.
Jmmp 10 00233 g009
Figure 10. Normalized extrusion force as a function of volumetric flow at T = 220 °C. The force is normalized by the maximum transferable extruder force ( F / F max · 100 % ) for D Fil = 1.75   m m (solid line) and D Fil = 2.85   m m (dashed line). Line color indicates the melting zone length L.
Jmmp 10 00233 g010
Table 1. Comparison of the maximum volumetric flow Q Max as dependent on different nozzle models and diameters D Noz on the example of manufacturer E3D. The lengths L for nozzles of type V6, Volcano, and Supervolcano correspond to the entire nozzle length; for Revo nozzles, it corresponds to the measured length between the end of the heatbreak and the nozzle tip, as the structurally integrated cold side needs to be subtracted. The abbreviation “n.s.” stands for “not specified”.
D Noz ( m m )L ( m m )NozzleHotendExtruderMaterialT (°C) Q Max ( m m 3 / s )Source
1.2051.50E3D SupervolcanoE3D SupervolcanoE3D Titan Aeron.s.n.s.76.50[17]
1.2051.50E3D SupervolcanoE3D SupervolcanoE3D Hemera XSPLA22087.50[18]
1.2021.00E3D VolcanoE3D VolcanoE3D Hemera XSPLA22038.50[18]
1.2019.60E3D Revo HFE3D Hemera XSE3D Hemera XSPLAn.s.37.00[19]
0.4012.50E3D v6E3D v6E3D Hemera XSPLA22013.00[18]
0.4019.60E3D Revo HFE3D Revo VoronVoron Clockwork 2PLA22024.00[20]
0.4019.60E3D RevoE3D Revo VoronVoron Clockwork 2PLA22016.00[20]
Table 2. Influence of melting zone length L and temperature T on maximum volumetric flow rate Q Fil and extrusion force F for filament with a diameter D F i l of 1.75   m m and 2.85   m m for chosen temperatures T of 190 °C and 230 °C.
D Fil = 1.75 mm D Fil = 2.85 mm
L
( m m )
T
(°C)
F
( N )
Q Fil
( m m 3 / s )
F
( N )
Q Fil
( m m 3 / s )
15.0019040.3024.0533.5812.34
23043.1936.0815.5112.34
27.5019031.0636.0841.8223.87
23031.3648.1169.7647.73
42.5019052.3360.1367.2947.73
23044.6684.1854.1760.07
57.5019053.4439.0869.4860.07
23044.30108.2452.3572.42
72.5019047.7424.0559.8260.07
23052.1884.1863.0596.28
max( Q Fil )/min( Q Fil ): 450% 780%
Disclaimer/Publisher’s Note: The statements, opinions and data contained in all publications are solely those of the individual author(s) and contributor(s) and not of MDPI and/or the editor(s). MDPI and/or the editor(s) disclaim responsibility for any injury to people or property resulting from any ideas, methods, instructions or products referred to in the content.