Abstract
In recent years, global agriculture has encountered several challenges exacerbated by the effects of changes in climate, such as extreme water shortages for irrigation and heat waves. Water-deficit stress adversely affects the morpho-physiology of numerous crops, including soybean (Glycine max L.), which is considered as promising crop in Bangladesh. Seaweed extract (SWE) has the potential to improve crop yield and alleviate the adverse effects of water-deficit stress. Remote and proximal sensing are also extensively utilized in estimating morpho-physiological traits owing to their cost-efficiency and non-destructive characteristics. The study was carried out to evaluate soybean morpho-physiological traits under the application of water extracts of Gracilaria tenuistipitata var. liui (red seaweed) with two varying irrigation water conditions (100% of total crop water requirement (TCWR) and 70% of TCWR). Principal component analysis (PCA) revealed that among the four treatments, the 70% irrigation + 5% (v/v) SWE and the 100% irrigation treatments overlapped, indicating that the application of SWE effectively mitigated water-deficit stress in soybeans. This result demonstrates that the foliar application of 5% SWE enabled soybeans to achieve morpho-physiological performance comparable to that of fully irrigated plants while reducing irrigation water use by 30%. Based on Pearson’s correlation matrix, a simple linear regression model was used to ascertain the relationship between unmanned aerial vehicle (UAV)-derived vegetation indices and the field-measured physiological characteristics of soybean. The Normalized Difference Red Edge (NDRE) strongly correlated with stomatal conductance (R2 = 0.76), photosystem II efficiency (R2 = 0.78), maximum fluorescence (R2 = 0.64), and apparent transpiration rate (R2 = 0.69). The Soil Adjusted Vegetation Index (SAVI) had the highest correlation with leaf relative water content (R2 = 0.87), the Blue Normalized Difference Vegetation Index (bNDVI) with steady-state fluorescence (R2 = 0.56) and vapor pressure deficit (R2 = 0.74), and the Green Normalized Difference Vegetation Index (gNDVI) with chlorophyll content (R2 = 0.73). Our results demonstrate how UAV and physiological data can be integrated to improve precision soybean farming and support sustainable soybean production under water-deficit stress.
1. Introduction
Soybeans (Glycine max L.), an important protein source, placed as the fourth most produced crop worldwide by volume [1]. In 2023–2024, the average production of soybeans was 394.97 million metric tons [2]. In 2024, Bangladesh produced 96,921 tons of soybeans from 62,870 hectares of land [3].
In tropical and subtropical regions with adequate irrigation, soybeans exhibit optimal growth and give the best possible yields [4]. Water-use efficiency (WUE) depends not only on total water consumption but also on its distribution across different growth stages. Soybean crops utilize approximately 7% of total irrigation water during the seedling stage, 36% during the vegetative stage, 24% during flowering, 25% during pod development, and 8% in maturity [5]. During the vegetative phase, drought stress decreases the soybean yield by 28% [6], highlighting the need to optimize water use during this stage, as the vegetative phase requires a significant portion of total irrigation water. In the context of Bangladesh, hundreds of thousands of farmers are struggling with a severe irrigation water crisis, exacerbated by dwindling river flows and unplanned groundwater extraction [7]. Consequently, the country faces acute surface water scarcity for irrigation, positioning it in the category of the most irrigation-water-scarce areas in the world [8].
Globally, several strategies have been explored to address the irrigation water crisis, such as the use of plastic mulch [9] to reduce evaporation, as well as exogenous hormones (abscisic and salicylic acid) and osmolytes (betaine and proline), which can mitigate the irrigation water deficit effect in crops [10]. However, these conventional methods have unintended consequences, such as affecting the soil properties due to plastic waste from mulching [9]. Furthermore, many osmolytes can alter soil microbial activity [11].
To protect the environment and manage the irrigation water crisis at the same time, the use of SWE biostimulant, a nature-based solution, could be a promising approach. Foliar application of SWE has been found to mitigate the drought-induced abiotic stress of plants by enhancing the moisture retention capacity in plant tissues and supplying the nutrients necessary for proper crop growth and development [12]. Furthermore, SWE contains growth-inducing chemicals, such as cytokinin, gibberellins, auxins, and abscisic acid [13], which help the plant reduce abiotic stress by enhancing WUE and yield [2]. However, very few studies have been conducted focusing on the application of SWE to mitigate water stress in soybean.
UAVs offer a powerful, non-destructive approach for detecting crop water stress [14] and monitoring physiological activity in the field [15]. Though monitoring crop morphology using UAVs is widely studied, research on physiological activity monitoring is little explored. Moreover, unlike traditional destructive sampling methods, such as the removal of plant tissue, which are time consuming and limited to small-scale, point-based measurements, UAV-based remote sensing enables rapid, repeated, and spatially comprehensive assessment of crop health across the entire canopy [16]. This canopy-scale monitoring captures the spatial variability of stress responses that destructive methods cannot, providing a more accurate representation of the field conditions [17]. Hence, estimating crop physiological traits using the vegetation indices derived from UAV-based multispectral imagery is promising.
Considering the impact of climate change on soybean cultivation and environmental conservation, along with leveraging UAV-based stress monitoring, the current study has two objectives. Firstly, to assess the role of Gracilaria tenuistipitata var. liui SWE in mitigating water stress in soybean by improving morpho-physiology during the vegetative phase. Secondly, to investigate whether UAV-derived multispectral imagery can serve as a non-destructive tool for approximating physiological traits in soybean.
To fulfill these objectives, we examined the growth of plants treated with SWE and correlated UAV-derived vegetation indices (VIs) with different fluorescence parameters, including stomatal conductance, transpiration rate, vapor pressure, chlorophyll content, and leaf-relative water-content-related physiological traits.
2. Materials and Methods
2.1. Explanation of the Experimental Site
We conducted this experiment at Gazipur Agricultural University, Gazipur (24.038° N, 90.397° E), situated in Bangladesh, during the soybean growing season (December–March). The experimental field (Figure 1) was situated in agroecological zone no. 28, commonly known as Madhupur tract, at an elevation of 8.4 m above sea level. The soils of the Madhupur tract are predominantly clay-rich and classified as inceptisols, based on the soil classification system of USDA. At the study location, the soil had sand, silt, and clay contents of 18%, 38.4%, and 43.6%, respectively, with a slightly acidic pH level of 6.2; a soil organic carbon level of 1.20% was found in the 5–15 cm depth range. The climatic condition of the study site is characterized by subtropical monsoon. Figure 2 illustrates the rainfall, sunshine hours, daily average temperature, and effective rainfall during the experimental period.
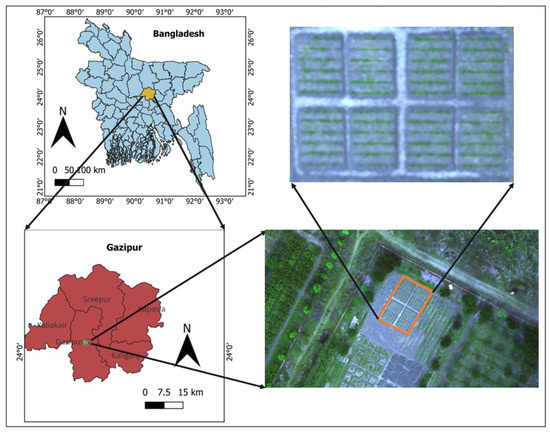
Figure 1.
Study site map.
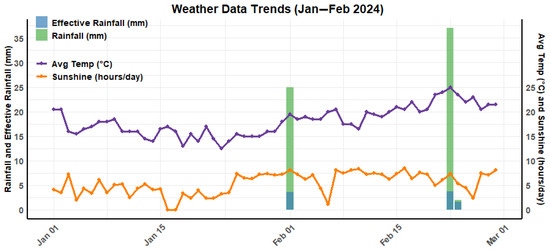
Figure 2.
The rainfall with effective rainfall, sunshine hours, and daily average temperature during the experimental period.
2.2. Design and Treatments of the Experiment
The experiment was conducted using a total of 48 plots that followed a split-plot RCBD design, four treatments, and 12 replicates per treatment. Hence, in this field trial, two irrigation treatments and two concentrations of SWE were used, as shown in Table 1.

Table 1.
Treatment setup of the experiment.
In this study, 70% of TCWR was selected as a deficit water treatment to observe the effect caused by reduced irrigation water in soybeans, as some studies observed a water deficit effect on crop physio-morphological traits [18,19].
2.3. Plant Material
The experiment utilized the BU soybean-4 variety (Glycine max L.). Seeds were sown using the broadcasting method on 31 December 2023; each plot dimension was 2.5 × 0.5 m2, and approximately 17–20 plants were allowed to grow in a plot up to the flower blooming stage.
The vegetative phase has historically been investigated since it is thought to be linked with an increase in reproductive ability [20]. Furthermore, plant vegetative growth can be enhanced by seaweed extract application [21]. Hence, the experiment was carried out to assess soybean physiology in the vegetative phase.
2.4. Irrigation Method and Estimation of Required Irrigation Water
The required water for soybean was calculated using the FAO-developed model known as CROPWAT 8.0, as in some established studies [22,23]. The model considers 15 years of climate-related data, crop factors, and soil characteristics in calculating the evapotranspiration of the respective crops. Soybean crop evapotranspiration and irrigation water requirements at different phenological stages were calculated based on acquired weather data from Dhaka station (nearest from the experimental site), as presented in Table 2.
Table 2.
Crop evapotranspiration and water requirements for irrigation during various phases of growth.
The actual crop water requirement was calculated, as presented in Table 3, by adjusting rainfall data acquired from a weather station situated in the experimental field. Irrigation was applied following the surface irrigation method, where irrigation efficiency was considered to be 60% [24,25]. Consequently, an extra 40% of irrigation water was added to the crop water requirement calculated from the model. From the actual rainfall, the amount of effective rainfall was calculated following the method called USDA S.C. However, effective rainfall was not considered in the current experiment, as the amount of effective rainfall was negligible (3.5 mm on 1 February, 3.7 mm on 22 February, and 1.6 mm on 23 February), as presented in Figure 2. In the 70%- and 100%-TCWR treatments, the same volume of water was applied during the first two stages (initial and development). Thus, the deficit irrigation treatment was imposed after 20 DAS (days after sowing). A measured volume of water was applied uniformly to the base of each plant using a plastic pot.
Table 3.
The actual amount of applied water per treatment.
2.5. Seaweed Extract Preparation, Chemical Composition, and Application Method
2.5.1. Preparation of Seaweed Extract
Seaweed, known as red algae (Gracilaria tenuistipitata var. liui), was obtained from the coastal region of Moheshkhali Channel in the Bay of Bengal (21°30′0″ N and 92°5′0″ E). Then, the SWE was prepared following the main procedures of [26], as explained by [3]. In brief, freshly collected algae were immediately washed with seawater, followed by tap water, to remove impurities and maintained in the laboratory at room temperature (15–20 °C). After the seaweeds were allowed to dry in the sun, the dried material was crushed at room temperature using a grinder fitted with stainless steel blades. To prepare a 5.0% seaweed extract solution, 50 g of seaweed powder and 1 L of distilled water were combined in separate beakers. A hot-plate-equipped magnetic stirrer was used to homogenize the solutions, which were maintained at 60 °C for 45 min to ensure proper mixing. After heating, the solutions were allowed to cool to room temperature and were preserved for one hour before application using plastic bottles. For uniform application to the plants, the required volume of the prepared solution was transferred into a hand sprayer.
2.5.2. The Chemical Composition of Gracilaria tenuistipitata var. liui
The chemical composition of this seaweed includes 24.46% crude protein, 5.05% crude fiber, 0.15% crude lipid, 48.45% carbohydrates, 10.22% ash, and 11.68% moisture. Its mineral content per 100 g dry weight comprises 580.65 mg phosphorus, 130.64 mg calcium, 3.40 mg magnesium, 76.58 mg iron, and 3.89 mg copper, highlighting its potential as a nutrient-rich resource for agricultural applications. In addition, 10.21 mg of β-carotene and 2.72 mg of Vitamin C were present in 100 g of seaweed. A negligible amount (0.041 mg/kg dry weight) of lead was present. The methods used for the determination of the composition of red seaweed are presented in Table 4.
Table 4.
Methods used to characterize seaweed extract.
2.5.3. Application Method
A total of 10 days after sowing, the first dose of seaweed extract was applied. In total, seaweed extracts were applied four times at 13-day intervals via a hand sprayer (GA-013, Seesa-Pump and Spray) equipped with a nozzle set (8 mm pipe, T joint). A total of approximately 370 mL of SWE was applied as a foliar spray in each plot containing 17–20 plants. Since treatments T1 and T3 did not include SWE applications, fresh water was not applied, as water was needed for SWE foliar spraying.
2.6. UAV Multispectral Data Acquisition
This study utilized a DJI Inspire 2 drone equipped with an Altum multispectral sensor. The sensor collected data from five spectral bands: blue, green, red, red edge, and near-infrared (NIR). From January to February 2024 (experimentation period), UAV flights were conducted to gather high-resolution (4.7 cm) multispectral data at soybean vegetative stages, as presented in Table 5.
Table 5.
UAV flight campaign details.
Across all missions, flight plans were prepared in advance using Pix4D Capture (version 4.6.4) software (accessed on 10 October 2024) following a double-grid flight pattern, ensuring consistent and standardized flight paths. To optimize image alignment and minimize data gaps, both front and side image overlaps were set to 80% with a 9.5 m/s speed and nadir camera orientation (±5° tolerance), a standard practice for accurate ortho mosaic generation and radiometric analysis in agricultural applications (Table 5) [35]. A ground reference panel was employed for radiometric calibration, ensuring accurate spectral data acquisition by normalizing reflectance measurements [36].
Drone missions were conducted during solar noon (11:50–12:30) to minimize shadow interference and ensure consistent spectral data quality [37]. This meticulous approach enabled accurate monitoring of crop development under varying environmental conditions.
2.7. UAV Image Processing
The imagery collected by the Altum sensor was saved in TIFF format, consisting of five single-band image sets corresponding to the sensor’s spectral bands. Pre-processing of these images was performed using Pix4Dmapper Educational 4.6.4 software. All captured imagery was uploaded to the Pix4Dmapper platform, where radiometric corrections were applied sequentially to each single-band image. This correction ensured the uniformity of global lighting conditions across the dataset, enhancing the reliability of the spectral analysis [38].
These preprocessing steps were essential in order to obtain images ready for subsequent analysis, ensuring consistency and accuracy in the spectral data used to monitor crop phenology and stress responses. Automatic Tie Points (ATPs) were used to create a densified point cloud, which facilitated accurate measurement of distances, surface areas, and volumes within the study area. In this study, Ground Control Points (GCPs) enabled centimeter-level accuracy by providing precisely surveyed real-world coordinates (X, Y, Z) using RTK-GNSS with 8 mm horizontal and 15 mm vertical precision. These fixed reference markers anchored the aerial imagery to the actual field layout, allowing Pix4D photogrammetry software (version 2.5) to accurately correct lens distortion, UAV GPS drift, and terrain elevation differences. Through bundle adjustment, reprojection errors were minimized to less than 1.5 cm, ensuring the high spatial accuracy essential for plot-level analysis. Plot-based data extraction was performed to calculate VIs by creating a consistent grid shapefile using the vector research tool in QGIS. Table 6 lists the five VIs utilized in this study, which were selected as promising for evaluating the physiological characteristics of plants documented in earlier research [39,40,41,42]. A grid shapefile was designed to align with the dimensions of all 48 plots, each measuring 2.5 × 0.5 m2. To ensure consistency in data extraction across several dates, the same grid structure was used for all GCP-corrected images.
Table 6.
Different vegetation indices utilized in the study.
2.8. Physiological Data Collection
Physiological data was collected at 60 DAS at the end of the vegetative phase. Changes in water potential, turgor, and stomatal conductance are commonly associated with physiological responses to water stress in plants. Plant growth is eventually slowed down by these alterations, which result in lower transpiration and photosynthetic rates [48]. Stable-state fluorescence (Fs), maximum fluorescence (Fm), quantum yield of photosystem II (PhiPS2), stomatal conductance (gsw), apparent transpiration rate (E apparent), vapor pressure deficit (VPDleaf), ambient light (Qamb), leaf relative water content (RWC), and chlorophyll content (Chl content) concentration were the physiological traits that were targeted in this study due to their correlation with stress responses related to water-deficit stress. Maximum physiological traits were measured using the LI-600 Porometer/Fluorometer [49]. For instance, Fs, Fm, and PhiPS2 are considered indicators of photosynthetic activity [50,51]. Moreover, effective quantum yield (PhiPS2) is one of the chlorophyll fluorescence properties that is frequently utilized in water-deficiency stress experiments to quantify photosystem II (PSII) activity and understand plant photosynthetic behavior [52,53,54].
A physiological property linked to the extent of stomatal opening and the rate at which CO2 enters or water vapor exits is called stomatal conductance (gsw). Moreover, gsw is directly related to photosynthesis [55]. The apparent transpiration rate (E apparent) and vapor pressure deficit (VPDleaf) are utilized to gain insight into the evaporation demand of the atmosphere, which impacts transpiration rates [56]. Lastly, ambient light (Qamb) measurement was taken to understand the amount of PAR available to the plant. The physiological data collection was performed on a sunny morning (9:00 a.m.–10:30 a.m.). Three fully expanded leaves were selected in a plot. The middle portion of each leaf was placed in the instrument’s chamber, and measurements were repeated three times per leaf to ensure accuracy and obtain the average value. The device’s stable readings enabled reliable capture of critical physiological parameters during the study.
Furthermore, plant height was measured as an indicator of overall growth and developmental progress. Additionally, the relative water content (RWC) of soybean leaves was ascertained. The fresh weight (FW) of freshly harvested, completely expanded topmost leaves was recorded immediately by weighing them. After that, the leaves were immersed in distilled water at 15–20 °C for a whole day in the dark. To determine the turgid weight (TW), extra water was gently wiped off using a paper towel after soaking. The leaves were then oven-dried for 48 h at 72 °C until their dry weight (DW) could be determined when they gained a consistent weight. The RWC was calculated using the formula provided by [57].
Lastly, an MC-100 Chlorophyll Concentration Meter (Apogee Instrument, Inc., Logan, UT, USA) was used to measure the amount of chlorophyll in soybean leaves. From the center of the plot, three fully developed leaves were chosen, and they were positioned between the sensor clamps so that they were flat and filled the measuring space. To improve accuracy, five readings were made for each leaf and averaged. In order to preserve consistency and reduce the variability brought on by external factors such temperature and light intensity, measurements were begun in the morning (9:00 a.m. to 10:30 a.m.).
2.9. Statistical Technique and Data Analysis
R version 4.4.2 (accessed on 10 November 2024) was used for all exploratory studies. For boxplots, several R packages were employed, including datasets, ggplot2, multcompView, dplyr, agricolae, multcomp, and gridExtra. Tukey’s Honestly Significant Difference (HSD) test was used to determine specific variations between treatments after two-way ANOVA was used to assess the statistical significance of the differences. Visualizations were created using ggplot2 to illustrate the results and highlight the distinct groupings based on their statistical significance. In the preparation of Pearson’s correlation map, several libraries such as readxl and metan were utilized to evaluated the correlations between key VIs (NDVI, NDRE, SAVI, gNDVI, bNDVI) and critical physiological traits, including different fluorescence parameters (PhiPS2, Fs, Fm), stomatal conductance (gsw), transpiration dynamics (E-apparent, VPDleaf), chlorophyll content (Chl content), and leaf water status (RWC). Pearson’s correlation analysis was used as an initial screening tool to identify the strength of associations between individual UAV-derived vegetation indices (VIs) and physiological traits. As most VIs are calculated from the same limited set of spectral bands, this resulted in mathematical redundancy and high inter-correlation among indices. Therefore, to avoid redundancy and ensure robust statistical interpretation, only the strongest VI–trait pairs identified through this process were selected for subsequent simple linear regression analysis. Then, based on Person’s correlation matrix, simple linear regression analysis was performed (with the exception of ambient light (Qamb), as no significant relationships were found between Qamb and any vegetation indices) to assess the relationships between variables. The equations of the fitted regression models and their R2 values were included in the plots to provide detailed insights. Using the MASS package, a principal component analysis (PCA) biplot was produced considering all the measured variables (multispectral and morpho-physiological traits) in this study. PCA analysis was performed to visualize how treatments cluster or separate in the study [58]. Furthermore, to support the results revealed by the PCA, we performed pairwise PERMANOVA analysis.
3. Results
3.1. Plant Height and the NIR Band at 20 and 60 DAS in Response to Various Treatments
The strong p-values and low F-values at 20 DAS showed that there were no significant differences in plant height or NIR reflectance across treatments (Table 7). Strong effects over time were indicated by the extremely significant effects of the treatments at 60 DAS (p < 0.001). Tukey’s test (Figure 3) grouped the treatments into distinct categories, showing that T2 performed better (9.13%) than T1 and T4 better (12.8%) than T3 at this later stage (60 DAS) in the case of NIR reflectance (Table 7). Furthermore, in plant height, T2 outperformed T1 by 21.37% and surpassed T3 by 29.76%.
Table 7.
Statistics of near-infrared (NIR) reflectance and plant height changes at 20 and 60 days after sowing (DAS).
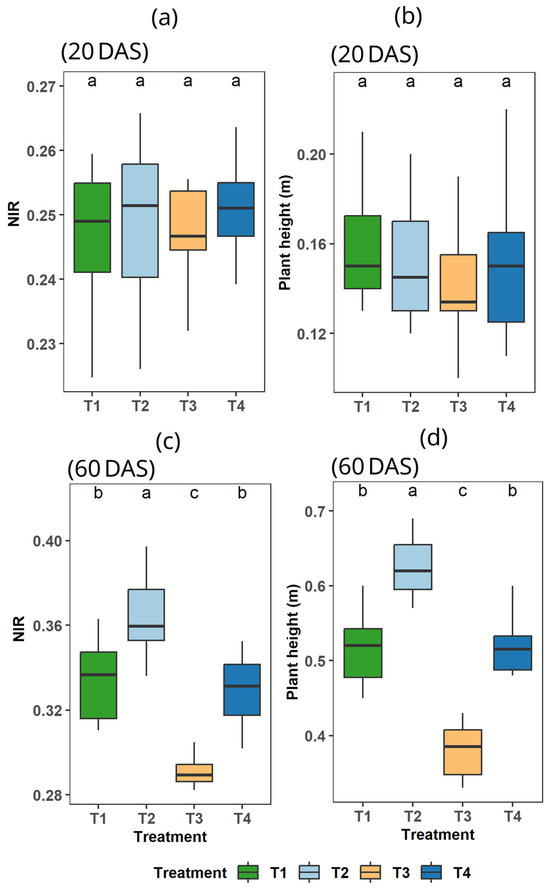
Figure 3.
Effect of seaweed extract and irrigation treatments (T1, T2, T3, and T4) on soybean NIR reflectance and plant height at 20 and 60 DAS. In this figure letter (a), (b), (c), (d) represents four parts where (a) NIR reflectance at 20 DAS; (b) Plant height at 20 DAS; (c) NIR reflectance at 60 DAS; (d) Plant height at 60 DAS. a,b,c is used to indicate particular section within the Figure 3.
3.2. Relationship Among UAV-Derived Vegetation Indices and Selected Physiological Parameters
Due to the high degree of correlation among the vegetation indices, regression analysis was performed exclusively for those VI–physiological trait pairs that exhibited the strongest associations based on the Pearson’s correlation matrix. This approach ensured that only the most correlated and non-redundant relationships were further evaluated for estimation capacity. Pearson’s correlation coefficients among the UAV-derived vegetation indices and measured physiological parameters are presented in Figure 4. At 60 DAS, the correlations among the plant physiological traits and UAV-derived variables have become stronger and more defined than they were at 20 DAS (as there was no significance difference among treatment in case of NIR reflectance and plant height), indicating that the VIs and physiological traits are more interrelated and established at this stage. Furthermore, based on these correlations, linear regression models were developed to estimate the measured physiological traits using VIs (Figure 5).
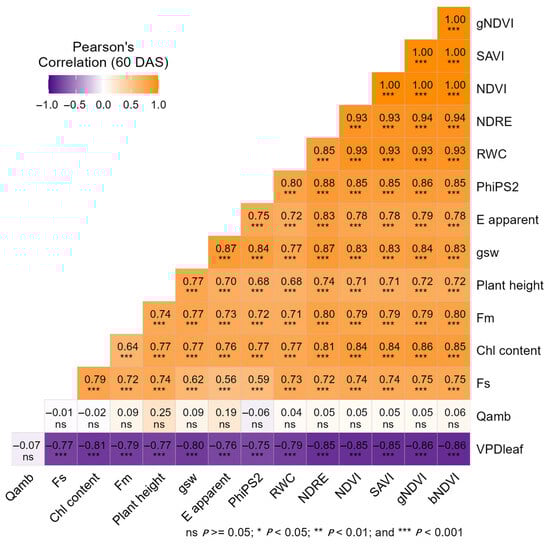
Figure 4.
Pearson’s correlation heatmap showing relationships between UAV-derived vegetation indices and physiological traits at 60 days after sowing (DAS). Here, white denotes no correlation, red denotes significant negative correlations, and green denotes strong positive correlations.
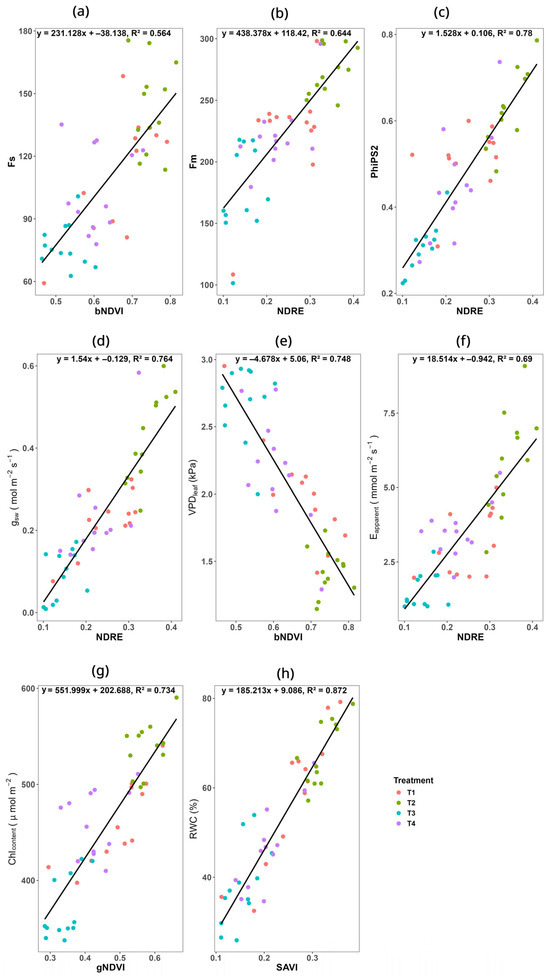
Figure 5.
Regression analysis of different physiological traits and vegetation indices. (a) Relationship between steady-state fluorescence (Fs) and bNDVI; (b) relationship between maximum fluorescence (Fm) and NDRE; (c) relationship between quantum efficiency of PSII (PhiPS2) and NDRE; (d) relationship between stomatal conductance (gsw) and NDRE; (e) relationship between VPDleaf and bNDVI; (f) relationship between apparent transpiration rate (E-apparent) and NDRE; (g) relationship between SAVI and relative water content (RWC); (h) relationship between gNDVI and chlorophyll (Chl) content.
3.3. Multivariate Differentiation of Treatments: PCA and PERMANOVA Results
3.3.1. Principal Component Analysis (PCA)
The PCA biplot (Figure 6a) represents a visual summary of how different plant metrics contribute to the principal components at 60 days after sowing (DAS). Principal component 1 (PC1) accounts for 76.5% of the variance in data, while PC2 adds additional insight but to a lesser extent (7%). Vectors representing variables derived from UAV and plant traits illustrate their contributions to the principal components. The contribution levels of these measures, which range from 3.5 to 5.0, are shown by a color gradient that ranges from blue to red. The relationships between the measured variables and how they affect the primary components are revealed by this visualization.
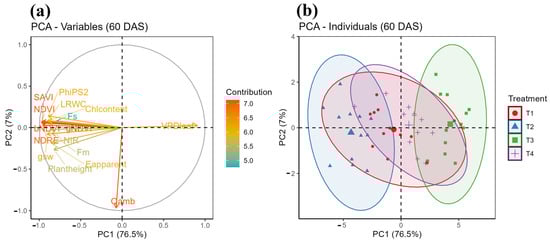
Figure 6.
Principal component analysis (PCA) of physiological traits and UAV-derived vegetation indices at 60 DAS. (a) PCA biplot showing the contributions of variables to principal components; (b) Overlap of treatments T1 and T4 in PCA space.
The overlap between treatments T1 and T4 in the PCA plot suggests that the individuals in these treatments exhibit similar distributions along the principal components PC1 and PC2 (Figure 6b). This indicates that the responses to treatments T1 and T4 are comparable, implying that the two treatments have similar effects on the measured multispectral and physiological traits. The shared variability explained by the principal components highlights common underlying factors or influences between the two treatments. Consequently, the overlap indicates that T1 and T4 are not significantly different in the context of the analyzed variables.
3.3.2. Pairwise PERMANOVA
To confirm the result revealed by PCA biplot that T1 and T4 are not significantly different based on all the measured variables, pairwise PERMANOVA (FDR-adjusted) was performed (Table 8). This statistical test further confirmed that T1 and T4 were not significantly different (p = 0.082 > 0.05), validating their overlap in PCA space. All other treatment pairs differed significantly (p < 0.01).
Table 8.
Pairwise PERMANOVA p-values (FDR-adjusted) for multivariate differences among treatments at 60 DAS.
4. Discussion
4.1. Integrating UAV-Based Vegetation Indices with Soybean Physiological Traits
Globally, soybean growth is severely affected by irrigation water deficit [59]. SWE is a nature-based solution found to be useful in mitigating water-deficit stress in soybean [3] by enhancing nutrient uptake [60], supplying cytokinins for cell division [61], and activating antioxidants [62]. Moreover, SWE provides vitamins and carotenoids, which improve plant vigor [63,64,65].
Our study revealed that SWE (Gracilaria tenuistipitata var. liui)-treated plants have robust growth, canopy height was specifically increased; additionally, these plants had higher NIR reflectance, which corresponds to healthier vegetation [66], in both water-stressed and well-watered environments. Another study on soybeans found similar results, i.e., soybean treated with SWE had robust growth and higher yield under well-watered and water-deficit conditions [3]. As the first dose of SWE was applied at 10 DAS, no significant differences were observed at 20 DAS (Figure 3a,b), likely due to the 10-day lag in SWE-induced metabolic adaptation, which is consistent with findings in sugarcane [67]. By 60 DAS, significant differences emerged (Figure 3c,d): T2 (100% irrigation + SWE) outperformed T1 (100% irrigation) and T4 (70% irrigation + SWE) surpassed T3 (70% irrigation).
Furthermore, ref. [68] also observed that SWE (A. nodosum) increases physiological traits such as stomatal conductance and antioxidant activities in water-deficit-stressed soybean, likely due to bioactive compounds modulating plant physiology or gene regulation. Thus, SWE enhances physiological traits, as seen in sugarcane, where it improves SPAD, photosynthesis, transpiration, and water-use efficiency [67].
A rising number of studies have discovered that single-band reflectance (NIR, Red, Red-edge, Green, Blue) or multiple-band-derived VIs (gNDVI, bNDVI, NDVI, NDRE, and SAVI) can be used to distinguish between stressed and healthy plants [69,70,71]. However, finding references for the methods of regression used to demonstrate a connection between VIs and particular morpho-physiological features is a significant challenge. Though some studies have been carried out on the utilization of VIs in predicting plant morpho-physiological traits, identifying the most appropriate and “generic” indices for assessing specific traits remains still limited, as it may vary due to several factors (such as crop type, crop growing stage, ground cover, etc.). For example, a study found NDVI as an effective vegetation index in predicting gsw in tomato [72], whereas a different study found NDRE better in predicting similar traits (gsw) in mungbean [73]. Moreover, ref. [42] found correlations between multiple VIs (gNDVI, NDVI, OSAVI) and gsw. Furthermore, ref. [74] reported that TDVI (Transformed Difference Vegetation Index) performed best as a proxy for leaf relative moisture content, whereas another remote-sensing-based vegetation index called WI (water index) was found to be best as proxy for similar traits by [75].
In this study, we observed, for the first time, that the NDRE is substantially correlated (R2 = 0.78) with PhiPS2 (Figure 5c) and Fm (R2 = 0.64), suggesting that higher NDRE values correspond to improved photochemical energy conversion. This might be caused by the NDRE’s sensitivity to changes in leaf pigment content and photosynthetic efficiency, as it effectively detects pigment alterations and moisture-induced variations in photosynthetic rates [76]. Moreover, NDRE showed a strong correlation (R2 = 0.76) with gsw in this study (Figure 5d), because stomatal conductance is associated with leaf photosynthetic activities [77]. Another study directly supports our findings, where the authors found NDRE effective in estimating gsw in mungbean [73].
The NDRE also correlated with the apparent transpiration rate (E apparent), with an R2 value of 0.69 (Figure 5e). A study also found the NDRE effective in monitoring the water potential status in vine, which directly supports our findings [78]. However, another study revealed that the transpiration rate is correlated with other vegetation indices, including the Optimized Soil-Adjusted Vegetation Index (OSAVI), Modified Chlorophyll Absorption Ratio Index (MCARI), and Photochemical Reflectance Index (PRI) [79].
Leaf chlorophyll concentration and the gNDVI showed a substantial positive correlation (R2 = 0.73) (Figure 5g), confirming its effectiveness in assessing photosynthetic pigment levels, because this index is very sensitive to a plant’s chlorophyll concentration [80]. Similar results were found in apple and pear trees, confirming the positive correlation of gNDVI with SPAD value (relative indication of leaf chlorophyll content) [81].
The SAVI demonstrated the highest correlation (R2 = 0.87) with RWC (Figure 5h) in this experiment, highlighting its potential as a predictor of leaf hydration and water retention in plant leaves. This might be because SAVI is sensitive to the soil moisture content [82], which is an important factor affecting the leaf water status [83].
Under plant stress conditions, the leaf vapor pressure deficit (VPDleaf) rises, inducing stomatal closure to mitigate water loss [83]. This restriction in CO2 uptake reduces photosystem efficiency, as evidenced by declining steady-state fluorescence (Fs) [84], and leads to a lower photosynthetic rate [85]. We observed that a vegetation index called bNDVI demonstrated a strong negative correlation (R2 = 0.75) with VPDleaf (Figure 5e), indicating that lower bNDVI values reflect higher VPDleaf values and greater plant stress. Furthermore, bNDVI showed a moderate positive correlation (R2 = 0.56) with stable-state fluorescence (Fs) (Figure 5a), suggesting its utility in assessing photosystem performance. According to another study, the bNDVI is sensitive to chlorophyll content—a key indicator of photosynthetic activity [86].
These findings collectively support that these results validate the effectiveness of UAV-based vegetation indices for the remote sensing of physiological stress responses. This helps precision agriculture strategies by allowing for near real-time monitoring of plant health and adaptation to water deficit stress in soybean cultivation.
A limitation of such a study is the inherent redundancy among vegetation indices, as most are derived from a small number of spectral bands available on UAV sensors. This can lead to inflated significance in correlation analyses. However, by focusing on the most informative individual VI–physiological trait relationships and restricting regression analysis to these pairs, we provide a more robust validation of UAV-based VIs as non-destructive proxies for physiological traits. Future studies may benefit from dimensionality reduction or feature selection techniques to further address redundancy issues.
4.2. Interpretation of Multivariate Treatment Differences: Insights from PCA and PERMANOVA
The PCA heatmap (Figure 6b) of the current study, which was based on measured morpho-physiological traits (Fs, Fm, PhiPS2, gsw, E apparent, VPDleaf, Qamb, RWC, Chl content, plant height) and multispectral VIs (bNDVI, gNDVI, NDVI, SAVI, NDRE), shows that T4 (70% irrigation + SWE) performed comparably to T1 (100% irrigation), as both treatments overlap within the PCA space, demonstrating SWE’s potential to reduce irrigation water applications by 30% without compromising morpho-physiological performance. In this study, we observed that SWE mitigates water-deficit stress in soybean, enabling a 30% reduction in irrigation needs. Furthermore, a pairwise PERMANOVA test confirmed the result revealed by PCA, i.e., 70% irrigation + SWE performed comparably to 100% irrigation, as there is no significant difference between the treatments. The study directly supports the United Nation’s Sustainability Development Goal (SDG) 2 (zero hunger) by improving crop resilience under water-limited conditions. By promoting efficient water use, it contributes to SDG 6 (clean water and sanitation), while the organic nature of SWE aligns with SDG 12 (responsible consumption and production) by reducing reliance on synthetic inputs. Additionally, SWE enhances plant vitality, supporting SDG 15 (life on land). These findings offer a scalable, nature-based solution to enhance food security and sustainable farming practices in climate-vulnerable regions.
However, this experiment also has some limitations. For instance, very few morpho-physiological characteristics of soybean, along with multispectral traits, were considered in this experiment. Furthermore, the experiment was conducted over a single growing season and focused exclusively on the vegetative phase; this may restrict the ability of the results to be applied generally. Additionally, the results are specific to the agroecological conditions of the Madhupur Tract, Bangladesh, and may not apply to other regions. Future research should include multi-season trials, assess the impact of SWE during the reproductive and maturity stages, and validate the findings across diverse environments and more morpho-physiological and multispectral variables. Precision agriculture crop monitoring may become even more accurate and useful with the use of machine learning algorithms for big datasets.
5. Conclusions
This study, for the first time, demonstrates that foliar application of SWE effectively mitigates water-deficit stress in soybeans, achieving physiological performance comparable to full irrigation. Moreover, UAV-derived vegetation indices correlated with key physiological traits, highlighting their potential for non-destructive crop monitoring. These findings offer a practical, cost-effective solution for farmers in water-scarce regions, particularly in Bangladesh, where sustainable agricultural practices are urgently needed. In order to support food security and agricultural productivity in water-scarce regions, this research helps develop sustainable farming practices that address both the problems of water scarcity and climate change by fusing biostimulants (such as SWE) with state-of-the-art remote-sensing technologies.
Author Contributions
Conceptualization: M.R.I. and H.M.A.; Methodology: M.R.I. and H.M.A.; Formal analysis: M.R.I., M.F.R., M.A. and K.S.I.; Resources: M.R.I., H.M.A., M.A. and M.I.; Writing—original draft: M.R.I. and A.K.T.; Writing—review and editing: H.M.A., D.G., A.K.T., K.S.I. and M.I.; Supervision: H.M.A., M.F.R. and D.G. All authors have read and agreed to the published version of the manuscript.
Funding
This research received no external funding.
Data Availability Statement
Dataset available upon request from the authors.
Acknowledgments
The research team recognizes Md. Shahinul Islam and Himadri Prosad Roy (both are PhD student at GIS and Proximal Sensing Lab, GAU) for their role in flight planning and helping in field data collection.
Conflicts of Interest
The authors declare that they have no known competing financial interests or personal relationships that could have appeared to influence the work reported in this paper.
References
- Maria, B.; Swearingen, B. Soybeans and Oil Crops—Oil Crops Sector at a Glance; U.S. Department of Agriculture: Washington, DC, USA, 2025. Available online: https://www.ers.usda.gov/topics/crops/soybeans-and-oil-crops/oil-crops-sector-at-a-glance (accessed on 22 February 2025).
- Sabatino, L.; Consentino, B.B.; Rouphael, Y.; Baldassano, S.; De Pasquale, C.; Ntatsi, G. Ecklonia Maxima-Derivate Seaweed Extract Supply as Mitigation Strategy to Alleviate Drought Stress in Chicory Plants. Sci. Hortic. 2023, 312, 111856. [Google Scholar] [CrossRef]
- Mannan, M.; Yasmin, A.; Sarker, U.; Bari, N.; Dola, D.; Higuchi, H.; Ali, D.; Alarifi, S. Biostimulant Red Seaweed (Gracilaria tenuistipitata Var. Liui) Extracts Spray Improves Yield and Drought Tolerance in Soybean. PeerJ 2023, 11, 15588. [Google Scholar] [CrossRef]
- Wu, Y.; Wang, E.; Gong, W.; Xu, L.; Zhao, Z.; He, D.; Yang, F.; Wang, X.; Yong, T.; Liu, J.; et al. Soybean Yield Variations and the Potential of Intercropping to Increase Production in China. Field Crops Res. 2023, 291, 108771. [Google Scholar] [CrossRef]
- Verma, I.; Das, H.; Jadhav, V. Water and Heat Unit Requirement in Different Growth Stages of Soybean (Glycine max L. Merrill) at Bhopal. Mausam 2007, 58, 537–542. [Google Scholar] [CrossRef]
- Jumrani, K.; Bhatia, V.S. Impact of Combined Stress of High Temperature and Water Deficit on Growth and Seed Yield of Soybean. Physiol. Mol. Biol. Plants 2017, 24, 37–50. [Google Scholar] [CrossRef]
- Mustafa, K. Why Is the Irrigation Water Crisis Not Getting Due Attention? The Daily Star. 13 March 2024. Available online: https://www.thedailystar.net/opinion/views/news/why-the-irrigation-water-crisis-not-getting-due-attention-3565171 (accessed on 19 April 2025).
- Khaled, S.M.S. Technology to Cope with Scarcity of Irrigation Water. The Financial Express. 18 June 2019. Available online: https://thefinancialexpress.com.bd/views/opinions/technology-to-cope-with-scarcity-of-irrigation-water-1560788040 (accessed on 19 April 2025).
- Islam, K.S.; Ali, M.M.; Shahrin, S.; Cheesman, S.; Alam, S.N.; Krupnik, T.J. Simple and Effective Management Methods That Can Improve Soybean Production in Bangladesh; CIMMYT: Texcoco, Mexico, 2022. [Google Scholar]
- Khan, T.; Hassan, H.; Wang, H.; Inzamamulhaq, M.; Ashraf, I.; LUO, F.; Khan, H.; Huang, G. How Does Jasmonic Acid Improve Drought Tolerance? Mechanisms and Future Prospects. Not. Bot. Horti Agrobot. Cluj-Napoca 2024, 52, 13604. [Google Scholar] [CrossRef]
- Karki, P.; Mohiuddin, S.G.; Kavousi, P.; Orman, M.A. Investigating the Effects of Osmolytes and Environmental pH on Bacterial Persisters. Antimicrob. Agents Chemother. 2020, 64, e02393-19. [Google Scholar] [CrossRef]
- Ali, O.; Ramsubhag, A.; Jayaraman, J. Biostimulant Properties of Seaweed Extracts in Plants: Implications towards Sustainable Crop Production. Plants 2021, 10, 531. [Google Scholar] [CrossRef] [PubMed]
- Mughunth, R.J.; Velmurugan, S.; Mohanalakshmi, M.; Vanitha, K. A Review of Seaweed Extract’s Potential as a Biostimulant to Enhance Growth and Mitigate Stress in Horticulture Crops. Sci. Hortic. 2024, 334, 113312. [Google Scholar] [CrossRef]
- Yang, N.; Zhang, Z.; Yang, X.; Dong, N.; Xu, Q.; Chen, J.; Sun, S.; Cui, N.; Ning, J. Evaluation of Crop Water Status Using UAV-Based Images Data with a Model Updating Strategy. Agric. Water Manag. 2025, 312, 109445. [Google Scholar] [CrossRef]
- Santos, W.M.d.; Martins, L.D.C.d.S.; Bezerra, A.C.; Souza, L.S.B.d.; Jardim, A.M.d.R.F.; Silva, M.V.d.; Souza, C.A.A.d.; Silva, T.G.F.d. Use of Unmanned Aerial Vehicles for Monitoring Pastures and Forages in Agricultural Sciences: A Systematic Review. Drones 2024, 8, 585. [Google Scholar] [CrossRef]
- Vélez, S.; Ariza-Sentís, M.; Panić, M.; Ivošević, B.; Stefanović, D.; Kaivosoja, J.; Valente, J. Speeding up UAV-Based Crop Variability Assessment through a Data Fusion Approach Using Spatial Interpolation for Site-Specific Management. Smart Agric. Technol. 2024, 8, 100488. [Google Scholar] [CrossRef]
- Hassan, M.A.; Chang, C.Y.-Y. PhenoGazer: A High-Throughput Phenotyping System to Track Plant Stress Responses Using Hyperspectral Reflectance, Nighttime Chlorophyll Fluorescence and RGB Imaging in Controlled Environments. Plant Phenomics 2025, 7, 100047. [Google Scholar] [CrossRef]
- Begg, J.; Turner, N. Crop Water Deficits. In Advances in Agronomy; Academic Press Inc.: Cambridge, MA, USA, 1976; Volume 28, pp. 161–217. [Google Scholar] [CrossRef]
- Bhattacharya, A. Effect of Soil Water Deficit on Growth and Development of Plants: A Review. In Soil Water Deficit and Physiological Issues in Plants; Bhattacharya, A., Ed.; Springer: Singapore, 2021; pp. 393–488. [Google Scholar] [CrossRef]
- Poethig, R.S.; Fouracre, J. Temporal Regulation of Vegetative Phase Change in Plants. Dev. Cell 2024, 59, 4–19. [Google Scholar] [CrossRef] [PubMed]
- do Rosário Rosa, V.; Farias dos Santos, A.L.; Alves da Silva, A.; Peduti Vicentini Sab, M.; Germino, G.H.; Barcellos Cardoso, F.; de Almeida Silva, M. Increased Soybean Tolerance to Water Deficiency through Biostimulant Based on Fulvic Acids and Ascophyllum nodosum (L.) Seaweed Extract. Plant Physiol. Biochem. 2021, 158, 228–243. [Google Scholar] [CrossRef]
- Abebe, A.; Genet, A.; Tiruye, A.; Worku, M. Determination of Crop Water Requirements and Irrigation Scheduling of Wheat Using CROPWAT at Koga and Rib Irrigation Scheme, Ethiopia. Indian J. Ecol. 2022, 2, 363–371. [Google Scholar] [CrossRef]
- Solangi, G.S.; Shah, S.A.; Alharbi, R.S.; Panhwar, S.; Keerio, H.A.; Kim, T.-W.; Memon, J.A.; Bughio, A.D. Investigation of Irrigation Water Requirements for Major Crops Using CROPWAT Model Based on Climate Data. Water 2022, 14, 2578. [Google Scholar] [CrossRef]
- Gilley, J.R.; Watts, D.G. Energy Reduction Through Improved Irrigation Practices. In Agriculture and Energy; Lockeretz, W., Ed.; Academic Press: Cambridge, MA, USA, 1977; pp. 187–203. [Google Scholar] [CrossRef]
- Taghvaeian, S. Surface Irrigation Systems—Oklahoma State University. Available online: https://extension.okstate.edu/fact-sheets/surface-irrigation-systems.html (accessed on 22 February 2025).
- Eswaran, K.; Ghosh, P.K.; Siddhanta, A.K.; Patolia, J.S.; Periyasamy, C.; Mehta, A.S.; Mody, K.H.; Ramavat, B.K.; Prasad, K.; Rajyaguru, M.R.; et al. Integrated Method for Production of Carrageenan and Liquid Fertilizer from Fresh Seaweeds. US6893479B2, 17 May 2005. Available online: https://patents.google.com/patent/US6893479B2/en (accessed on 23 February 2025).
- Guebel, D.V.; Nudel, B.C.; Giulietti, A.M. A Simple and Rapid Micro-Kjeldahl Method for Total Nitrogen Analysis. Biotechnol. Tech. 1991, 5, 427–430. [Google Scholar] [CrossRef]
- Sarker, U.; Iqbal, M.A.; Hossain, M.N.; Oba, S.; Ercisli, S.; Muresan, C.C.; Marc, R.A. Colorant Pigments, Nutrients, Bioactive Components, and Antiradical Potential of Danta Leaves (Amaranthus lividus). Antioxidants 2022, 11, 1206. [Google Scholar] [CrossRef]
- Mehlenbacher, V.C. The Analysis of Fats and Oils; Garrard Press: Champaign, IL, USA, 1960. [Google Scholar]
- Sarkiyayi, S.; Agar, T.M. Comparative Analysis on the Nutritional and Anti-Nutritional Contents of the Sweet and Bitter Cassava Varieties. Adv. J. Food Sci. Technol. 2010, 2, 328–334. [Google Scholar]
- AOAC International. AOAC: Official Methods of Analysis (Volume 1); AOAC International: Washington, DC, USA, 1990. [Google Scholar]
- Tariq, F.; Wang, X.; Saleem, M.H.; Khan, Z.I.; Ahmad, K.; Saleem Malik, I.; Munir, M.; Mahpara, S.; Mehmood, N.; Ahmad, T.; et al. Risk Assessment of Heavy Metals in Basmati Rice: Implications for Public Health. Sustainability 2021, 13, 8513. [Google Scholar] [CrossRef]
- Hassan, J.; Jahan, F.; Rajib, M.M.R.; Sarker, U.; Miyajima, I.; Ozaki, Y.; Ercisli, S.; Golokhvast, K.S.; Marc, R.A. Color and Physiochemical Attributes of Pointed Gourd (Trichosanthes dioica Roxb.) Influenced by Modified Atmosphere Packaging and Postharvest Treatment during Storage. Front. Plant Sci. 2022, 13, 173. [Google Scholar] [CrossRef] [PubMed]
- Sarker, U.; Hossain, M.N.; Oba, S.; Ercisli, S.; Marc, R.A.; Golokhvast, K.S. Salinity Stress Ameliorates Pigments, Minerals, Polyphenolic Profiles, and Antiradical Capacity in Lalshak. Antioxidants 2023, 12, 173. [Google Scholar] [CrossRef]
- Bupathy, P.; Sivanpillai, R.; Sajithvariyar, V.; Vishvanathan, S. Optimizing Low-Cost Uav Aerial Image Mosaicing For Crop Growth Monitoring. Int. Arch. Photogramm. Remote Sens. Spatial Inf. Sci. 2021, XLIV-M-3–2021, 12. [Google Scholar] [CrossRef]
- Shin, J.-I.; Cho, Y.-M.; Lim, P.-C.; Lee, H.-M.; Ahn, H.-Y.; Park, C.-W.; Kim, T. Relative Radiometric Calibration Using Tie Points and Optimal Path Selection for UAV Images. Remote Sens. 2020, 12, 1726. [Google Scholar] [CrossRef]
- Bazrafkan, A.; Delavarpour, N.; Oduor, P.G.; Bandillo, N.; Flores, P. An Overview of Using Unmanned Aerial System Mounted Sensors to Measure Plant Above-Ground Biomass. Remote Sens. 2023, 15, 3543. [Google Scholar] [CrossRef]
- Swaminathan, V.; Thomasson, J.A.; Hardin, R.G.; Rajan, N.; Raman, R. Radiometric Calibration of UAV Multispectral Images under Changing Illumination Conditions with a Downwelling Light Sensor. Plant Phenome J. 2024, 7, e70005. [Google Scholar] [CrossRef]
- Clevers, J.G.P.W.; Gitelson, A.A. Remote Estimation of Crop and Grass Chlorophyll and Nitrogen Content Using Red-Edge Bands on Sentinel-2 and -3. Int. J. Appl. Earth Obs. Geoinf. 2013, 23, 344–351. [Google Scholar] [CrossRef]
- Khuimphukhieo, I.; Bhandari, M.; Enciso, J.; Da Silva, J.A. Assessing Drought Stress of Sugarcane Cultivars Using Unmanned Vehicle System (UAS)-Based Vegetation Indices and Physiological Parameters. Remote Sens. 2024, 16, 1433. [Google Scholar] [CrossRef]
- Qi, H.; Wu, Z.; Zhang, L.; Li, J.; Zhou, J.; Jun, Z.; Zhu, B. Monitoring of Peanut Leaves Chlorophyll Content Based on Drone-Based Multispectral Image Feature Extraction. Comput. Electron. Agric. 2021, 187, 106292. [Google Scholar] [CrossRef]
- Zhang, L.; Han, W.; Niu, Y.; Chávez, J.L.; Shao, G.; Zhang, H. Evaluating the Sensitivity of Water Stressed Maize Chlorophyll and Structure Based on UAV Derived Vegetation Indices. Comput. Electron. Agric. 2021, 185, 106174. [Google Scholar] [CrossRef]
- Rouse, J.W.; Haas, R.H.; Schell, J.A.; Deering, D.W. Monitoring Vegetation Systems in the Great Plains with ERTS; NASA: Washington, DC, USA, 1974; Volume 1, pp. 309–317.
- Gitelson, A.; Merzlyak, M.; Zur, Y.; Stark, R.; Gritz, U. Non-Destructive and Remote Sensing Techniques for Estimation of Vegetation Status; University of Nebraska—Lincoln: Lincoln, NE, USA, 2001; Volume 1. [Google Scholar]
- Nagel, E.; Buschmann, C. In Vivo Spectroscopy and Internal Optics of Leaves as Basis for Remote Sensing of Vegetation. Int. J. Remote Sens. 1993, 25, 295–309. [Google Scholar] [CrossRef]
- Huete, A.R. A Soil-Adjusted Vegetation Index (SAVI). Remote Sens. Environ. 1988, 25, 295–309. [Google Scholar] [CrossRef]
- Wang, X.; Xie, H.; Guan, H.; Zhou, X. Different Responses of MODIS-Derived NDVI to Root-Zone Soil Moisture in Semi-Arid and Humid Regions. J. Hydrol. 2007, 340, 12–24. [Google Scholar] [CrossRef]
- Farooq, M.; Hussain, M.; Wahid, A.; Siddique, K.H.M. Drought Stress in Plants: An Overview. In Plant Responses to Drought Stress: From Morphological to Molecular Features; Aroca, R., Ed.; Springer: Berlin/Heidelberg, Germany, 2012; pp. 1–33. [Google Scholar] [CrossRef]
- LI-COR Environmental. Available online: https://www.licor.com/products/LI-600 (accessed on 23 February 2025).
- Bibi, A.C.; Oosterhuis, D.M.; Gonias, E.D. Photosynthesis, quantum yield of photosystem II and membrane leakage as affected by high temperatures in cotton genotypes. J. Cotton Sci. 2008, 12, 150–159. [Google Scholar]
- Flexas, J.; Escalona, J.; Evain, S.; Gul, J.; Moya, I.; Osmond, C.; Medrano, H. Steady-State Chlorophyll Fluorescence (Fs) as an Indicator of Leaf %photosynthesis and Stomatal Conductance under Drought Conditions. Physiol. Plant. 2002, 114, 231–240. [Google Scholar] [CrossRef]
- Ni, Z.; Liu, Z.; Huo, H.; Li, Z.-L.; Nerry, F.; Wang, Q.; Li, X. Early Water Stress Detection Using Leaf-Level Measurements of Chlorophyll Fluorescence and Temperature Data. Remote Sens. 2015, 7, 3232–3249. [Google Scholar] [CrossRef]
- Shahenshah; Isoda, A. Effects of Water Stress on Leaf Temperature and Chlorophyll Fluorescence Parameters in Cotton and Peanut. Plant Prod. Sci. 2010, 13, 269–278. [Google Scholar] [CrossRef]
- Yuan, X.K.; Yang, Z.Q.; Li, Y.X.; Liu, Q.; Han, W. Effects of Different Levels of Water Stress on Leaf Photosynthetic Characteristics and Antioxidant Enzyme Activities of Greenhouse Tomato. Photosynthetica 2016, 54, 28–39. [Google Scholar] [CrossRef]
- Li, D.; Li, X.; Xi, B.; Hernandez-Santana, V. Evaluation of Method to Model Stomatal Conductance and Its Use to Assess Biomass Increase in Poplar Trees. Agric. Water Manag. 2022, 259, 107228. [Google Scholar] [CrossRef]
- Cunningham, S. Stomatal Sensitivity to Vapour Pressure Deficit of Temperate and Tropical Evergreen Rainforest Trees of Australia. Trees 2004, 18, 399–407. [Google Scholar] [CrossRef]
- Schonfeld, M.A.; Johnson, R.C.; Carver, B.F.; Mornhinweg, D.W. Water Relations in Winter Wheat as Drought Resistance Indicators. Crop Sci. 1988, 28, 526–531. [Google Scholar] [CrossRef]
- Wang, S.; Chen, J.; Li, H.; Qi, X.; Liu, X.; Guo, X. Metabolomic Detection Between Pancreatic Cancer and Liver Metastasis Nude Mouse Models Constructed by Using the PANC1-KAI1/CD82 Cell Line. Technol. Cancer Res. Treat. 2021, 20, 15330338211045204. [Google Scholar] [CrossRef] [PubMed]
- Nadeem, M.; Li, J.; Yahya, M.; Sher, A.; Ma, C.; Wang, X.; Qiu, L. Research Progress and Perspective on Drought Stress in Legumes: A Review. Int. J. Mol. Sci. 2019, 20, 2541. [Google Scholar] [CrossRef]
- Hamouda, M.M.; Saad-Allah, K.M.; Gad, D. Potential of Seaweed Extract on Growth, Physiological, Cytological and Biochemical Parameters of Wheat (Triticum aestivum L.) Seedlings. J. Soil Sci. Plant Nutr. 2022, 22, 1818–1831. [Google Scholar] [CrossRef]
- Ghaderiardakani, F.; Collas, E.; Damiano, D.K.; Tagg, K.; Graham, N.S.; Coates, J.C. Effects of Green Seaweed Extract on Arabidopsis Early Development Suggest Roles for Hormone Signalling in Plant Responses to Algal Fertilisers. Sci. Rep. 2019, 9, 1983. [Google Scholar] [CrossRef]
- Mansori, M.; Chernane, H.; Latique, S.; Benaliat, A.; Hsissou, D.; Kaoua, E.M. Seaweed Extract Effect on Water Deficit and Antioxidative Mechanisms in Bean Plants (Phaseolus vulgaris L.). J. Appl. Phycol. 2014, 27, 1689–1698. [Google Scholar] [CrossRef]
- Kalaivanan, C.; Venkatesalu, V. Utilization of Seaweed Sargassum Myriocystum Extracts as a Stimulant of Seedlings of Vigna mungo (L.) Hepper. Span. J. Agric. Res. 2012, 10, 466–470. [Google Scholar] [CrossRef]
- Abeed, A.H.A.; Ali, M.; Ali, E.F.; Majrashi, A.; Eissa, M.A. Induction of Catharanthus Roseus Secondary Metabolites When Calotropis Procera Was Used as Bio-Stimulant. Plants 2021, 10, 1623. [Google Scholar] [CrossRef]
- Huda, M.N.; Mannan, M.A.; Bari, M.N.; Rafiquzzaman, S.M.; Higuchi, H. Red Seaweed Liquid Fertilizer Increases Growth, Chlorophyll and Yield of Mungbean (Vigna radiata). Agron. Res. 2023, 21, 291–305. [Google Scholar]
- Mandal, S.; Bhattacharya, S.; Paul, S. Assessing the Impact of Coal-Fired Thermal Power Plant Emissions on Surrounding Vegetation Health Using Geoinformatics: A Case Study. Saf. Extrem. Environ. 2022, 4, 81–100. [Google Scholar] [CrossRef]
- Chen, D.; Zhou, W.; Yang, J.; Ao, J.; Huang, Y.; Shen, D.; Jiang, Y.; Huang, Z.; Shen, H. Effects of Seaweed Extracts on the Growth, Physiological Activity, Cane Yield and Sucrose Content of Sugarcane in China. Front. Plant Sci. 2021, 12, 659130. [Google Scholar] [CrossRef]
- Arioli, T.; Mattner, S.W.; Winberg, P.C. Applications of Seaweed Extracts in Australian Agriculture: Past, Present and Future. J. Appl. Phycol. 2015, 27, 2007–2015. [Google Scholar] [CrossRef] [PubMed]
- Abdullah, H.M.; Mohana, N.T.; Khan, B.M.; Ahmed, S.M.; Hossain, M.; Islam, K.S.; Redoy, M.H.; Ferdush, J.; Bhuiyan, M.A.H.B.; Hossain, M.M.; et al. Present and Future Scopes and Challenges of Plant Pest and Disease (P&D) Monitoring: Remote Sensing, Image Processing, and Artificial Intelligence Perspectives. Remote Sens. Appl. Soc. Environ. 2023, 32, 100996. [Google Scholar] [CrossRef]
- Sarvakar, K.; Thakkar, M. Different Vegetation Indices Measurement Using Computer Vision. In Applications of Computer Vision and Drone Technology in Agriculture 4.0; Chouhan, S.S., Singh, U.P., Jain, S., Eds.; Springer Nature: Singapore, 2024; pp. 133–163. [Google Scholar] [CrossRef]
- Sellami, M.H.; Albrizio, R.; Čolović, M.; Hamze, M.; Cantore, V.; Todorovic, M.; Piscitelli, L.; Stellacci, A.M. Selection of Hyperspectral Vegetation Indices for Monitoring Yield and Physiological Response in Sweet Maize under Different Water and Nitrogen Availability. Agronomy 2022, 12, 489. [Google Scholar] [CrossRef]
- Fullana-Pericàs, M.; Conesa, M.À.; Gago, J.; Ribas-Carbó, M.; Galmés, J. High-Throughput Phenotyping of a Large Tomato Collection under Water Deficit: Combining UAVs’ Remote Sensing with Conventional Leaf-Level Physiologic and Agronomic Measurements. Agric. Water Manag. 2022, 260, 107283. [Google Scholar] [CrossRef]
- Van Haeften, S.; Smith, D.; Robinson, H.; Dudley, C.; Kang, Y.; Douglas, C.A.; Hickey, L.T.; Potgieter, A.; Chapman, S.; Smith, M.R. Unmanned Aerial Vehicle Phenotyping of Agronomic and Physiological Traits in Mungbean. Plant Phenome J. 2025, 8, e70016. [Google Scholar] [CrossRef]
- Mwinuka, P.R.; Mourice, S.K.; Mbungu, W.B.; Mbilinyi, B.P.; Tumbo, S.D.; Schmitter, P. UAV-Based Multispectral Vegetation Indices for Assessing the Interactive Effects of Water and Nitrogen in Irrigated Horticultural Crops Production under Tropical Sub-Humid Conditions: A Case of African Eggplant. Agric. Water Manag. 2022, 266, 107516. [Google Scholar] [CrossRef]
- Caturegli, L.; Matteoli, S.; Gaetani, M.; Grossi, N.; Magni, S.; Minelli, A.; Corsini, G.; Remorini, D. Effects of Water Stress on Spectral Reflectance of Bermudagrass. Sci. Rep. 2020, 10, 15055. [Google Scholar] [CrossRef]
- Sims, D.A.; Gamon, J.A. Relationships between Leaf Pigment Content and Spectral Reflectance across a Wide Range of Species, Leaf Structures and Developmental Stages. Remote Sens. Environ. 2002, 81, 337–354. [Google Scholar] [CrossRef]
- Ishihara, K.; Saitoh, K. Diurnal Courses of Photosynthesis, Transpiration, and Diffusive Conductance in the Single-Leaf of the Rice Plants Grown in the Paddy Field under Submerged Condition. Jpn. J. Crop Sci. 1987, 56, 8–17. [Google Scholar] [CrossRef]
- Tang, Z.; Jin, Y.; Alsina, M.; McElrone, A.; Bambach, N.; Kustas, W. Vine Water Status Mapping with Multispectral UAV Imagery and Machine Learning. Irrig. Sci. 2022, 40, 715–730. [Google Scholar] [CrossRef]
- El-Hendawy, S.; Al-Suhaibani, N.; Hassan, W.; Tahir, M.; Schmidhalter, U. Hyperspectral Reflectance Sensing to Assess the Growth and Photosynthetic Properties of Wheat Cultivars Exposed to Different Irrigation Rates in an Irrigated Arid Region. PLoS ONE 2017, 12, e0183262. [Google Scholar] [CrossRef] [PubMed]
- Hunt, E.; Hively, W.; Fujikawa, S.; Linden, D.; Daughtry, C.; McCarty, G. Acquisition of NIR-Green-Blue Digital Photographs from Unmanned Aircraft for Crop Monitoring. Remote Sens. 2010, 2, 290–305. [Google Scholar] [CrossRef]
- Huang, Y.; Li, D.; Liu, X.; Ren, Z. Monitoring Canopy SPAD Based on UAV and Multispectral Imaging over Fruit Tree Growth Stages and Species. Front. Plant Sci. 2024, 15, 1435613. [Google Scholar] [CrossRef]
- Xue, J.; Su, B. Significant Remote Sensing Vegetation Indices: A Review of Developments and Applications. J. Sens. 2017, 2017, 1353691. [Google Scholar] [CrossRef]
- Li, Q.; Wei, M.; Li, Y.; Feng, G.; Wang, Y.; Li, S.; Zhang, D. Effects of Soil Moisture on Water Transport, Photosynthetic Carbon Gain and Water Use Efficiency in Tomato Are Influenced by Evaporative Demand. Agric. Water Manag. 2019, 226, 105818. [Google Scholar] [CrossRef]
- Liu, N.-Y.; Yang, Q.-Y.; Wang, J.-H.; Zhang, S.-B.; Yang, Y.-J.; Huang, W. Differential Effects of Increasing Vapor Pressure Deficit on Photosynthesis at Steady State and Fluctuating Light. J. Plant Growth Regul. 2024, 43, 2329–2339. [Google Scholar] [CrossRef]
- Bunce, J.A. Does Transpiration Control Stomatal Responses to Water Vapour Pressure Deficit? Plant Cell Environ. 1997, 20, 131–135. [Google Scholar] [CrossRef]
- Vegetation Indices: A Key Tool in Precision Agriculture. Pix4D. Available online: https://www.pix4d.com/blog/pix4dfields-vegetation-indices-for-precision-agriculture (accessed on 21 February 2025).
Disclaimer/Publisher’s Note: The statements, opinions and data contained in all publications are solely those of the individual author(s) and contributor(s) and not of MDPI and/or the editor(s). MDPI and/or the editor(s) disclaim responsibility for any injury to people or property resulting from any ideas, methods, instructions or products referred to in the content. |
© 2025 by the authors. Licensee MDPI, Basel, Switzerland. This article is an open access article distributed under the terms and conditions of the Creative Commons Attribution (CC BY) license (https://creativecommons.org/licenses/by/4.0/).