1. Introduction
With continuous advancements in aviation technology and socioeconomic development, concerns over aircraft fuel consumption, noise, and environmental impact have grown significantly. Traditional fuel-powered aircraft can no longer meet the demands for efficient, low-consumption, and environmentally friendly flight. Additionally, under complex operational conditions, both takeoff distance and takeoff weight of fuel-powered aircraft are severely constrained. Collectively, due to inherent limitations in operational modes and efficiency, traditional aviation engines struggle to achieve breakthroughs in propulsion efficiency and low-carbon emissions. In contrast, distributed electric propulsion (DEP) technology offers multiple advantages, including environmental friendliness, high efficiency, low energy consumption, and reduced noise levels. Moreover, its power characteristics do not degrade with external factors such as atmospheric density, making DEP systems more suitable for extreme environments compared to conventional internal combustion engines. These attributes of the DEP system have significant application potential and research value.
Extensive research has been carried out on DEP aircraft. Take NASA’s X-57 experimental aircraft [
1,
2] as an example. It is powered by twelve small electric propellers placed on the leading edge of the wing and two large electric propellers at the wingtips. This configuration enables the wing area to be 2.5 times smaller than that of the original aircraft, leading to remarkable enhancements in lift, reductions in drag, and decreases in weight. MIT has developed a super-short takeoff and landing (STOL) scale model aircraft [
3] featuring eight propellers arranged along the wing leading edge. Under low-power blowing conditions, it successfully verified a lift coefficient exceeding 10, demonstrating its theoretical capability to achieve takeoff and landing on extremely short runways. The demonstrators of the X-57 and the MIT STOL UAV are shown in
Figure 1. Additionally, Germany’s Lilium Aviation’s Lilium Jet aircraft [
4] features 12 vertically deflectable flaps on its wings, with each flap integrating three electric ducted fans.
Regarding the key technologies of DEP aircraft, Kerho and Kramer [
5,
6] conducted research on the aerodynamic coupling characteristics between the propellers and the wings of small scale DEP aircraft using computational fluid dynamics (CFD) and wind tunnel test methods. Pieper [
7] developed a dynamic scaled technology demonstrator for DEP aircraft and employed the thrust line method to investigate propeller arrangement configurations. For DEP aircraft powered by propellers, Strash [
8] combined momentum theory with blade element theory to construct an equivalent disk model, which was used for numerical simulation of integrated components including propellers, nacelles, and wings. Xu D. and Xu X.P. [
9] conducted research on the aerodynamic–propulsion coupling characteristics and physical mechanisms of a 2D simplified model of distributed propulsion wings with high-lift flaps under vertical takeoff–transition–cruise flight conditions. Stoll [
10] performed numerical simulations on the LEAP-Tech configuration using an equivalent disk model, including steady-state slipstream simulations for its landing configuration, and ultimately derived the maximum lift coefficient of this configuration. Ma Y. [
11] proposed a weight analysis method applicable to distributed electric ducted fan aircraft, developed a 40 kg twin-body DEP aircraft, and conducted flight test validation. Qin J. developed a slipstream coupling model for tandem wing distributed propulsion UAVs, analyzed the dynamic characteristics of distributed propulsion aircraft under the influence of slipstream coupling, and validated its short takeoff capability through flight tests [
12]. Zong J. configured four forms of electric propulsion for vertical takeoff and landing (VTOL) UAVs and conducted a comparative evaluation of their performances [
13]. In summary, there exists a strong coupling effect between propulsion and aerodynamics in DEP aircraft, and considering DEP arrangement during conceptual design process is a key influencing factor determining aircraft performance.
Therefore, this paper developed a conceptual design method for DEP STOL UAVs that fully accounts for the propeller slipstream effect. Comparative analyses of aerodynamic characteristics under different propeller configurations were conducted, validating the feasibility and effectiveness of both the conceptual design method and considerations regarding DEP arrangements in STOL UAV design.
The structure of this paper is as follows. In
Section 2, a conceptual design method for the DEP STOL UAV is developed, which includes weight models for various components, an aerodynamic model considering the coupling effect of propeller slipstream, a rapid propeller design method, and performance constraints.
Section 3 presents a DEP STOL UAV design case study. In this case, the overall design parameters, the weights of various components, and three DEP configurations (single-propeller, dual-propeller, and eight-propeller) are compared. In
Section 4, the propulsive–aerodynamic coupling characteristics of the UAV are studied using momentum source method (MSM). Three DEP configurations described above are simulated and analyzed. Finally,
Section 5 provides a summary and discussion.
2. Conceptual Design Method of DEP STOL UAVs
Compared with a conventional UAV, the local wings of a DEP UAV are always affected by multiple propeller slipstream. Therefore, during the design phase, the influence of the slipstream needs to be considered when estimating the aerodynamic data. In addition, after the distributed arrangement of the propulsion power, the weight models of some components also have special characteristics.
In this section, a weight model and an aerodynamic model considering propulsive–aerodynamic coupling effects are developed.
2.1. Model of Total Mass
The total takeoff weight of the UAV consists of the airframe empty weight, propulsion system weight, avionics weight, energy weight (battery), and mission payload. It can be expressed as:
2.1.1. Empty Mass
The airframe empty weight refers to the total mass of the UAV excluding the engine and its ancillary components. Due to the difficulty in comprehensively modeling this weight characteristic, empirical methods based on statistical data are typically employed for estimation. In Ref. [
14], researchers developed an effective estimation equation through regression analysis using extensive statistical datasets, which is applicable to UAVs weighing from 20 kg to 1000 kg. According to this equation, the UAV’s airframe empty weight can be estimated using the following formula:
2.1.2. Mass of the Propulsion System
Prior to calculating the propulsion system weight, it is essential to determine the maximum power required for the propulsion system, which exhibits a directly proportional relationship with system mass. The maximum power can be derived from the UAV’s thrust-to-weight ratio during the design phase. As critical parameters in UAV design, optimal weight distribution and propulsion system integration significantly enhance flight performance.
For a STOL UAV, a higher thrust-to-weight ratio [
15] enables faster ground roll acceleration and shorter takeoff distances. This is particularly critical for DEP systems, as increased thrust-to-weight ratios often correspond to higher propeller slipstream velocities and stronger wing–slipstream interactions, thereby enhancing lift performance. However, such designs typically incur substantial increases in weight and power consumption.
The propulsion system of DEP UAVs primarily consists of motors, propellers, electronic speed controllers (ESCs), and power cables [
16,
17]. The mass composition of the propulsion system can be expressed as:
Among them, the mass of both the motor and the ESC is related to the maximum required power. According to the theorem of momentum, the required mechanical power can be obtained from the required thrust-to-weight ratio.
The mass of the motor can be calculated based on the maximum required power of the UAV and the power density of the motor, as shown in Equation (4):
where
Preq,max represents the UAV’s maximum required power,
nmotors denotes the number of motors, and
is the motor power density factor. Based on current industry standards, peak power densities of high-performance brushless motors can reach 5–8 kW/kg [
18]. With future breakthroughs in superconducting technology, power densities of high-power motors may exceed 10–15 kW/kg.
During the design stage, if the extension of the motor’s lifecycle is taken into consideration, the continuous output power of the motor will be less than the maximum output power, and a more conservative value should be adopted for the motor power density factor.
The weight of the ESCs is positively correlated with the motor’s maximum power and can be calculated using the following formula:
where
represents the ESC power density factor. With the adoption of new materials such as silicon carbide (SiC) and gallium nitride (GaN), switching losses and thermal management requirements can be reduced, enabling significant improvements in power density. Current SiC-based controller technology has already achieved power densities of 15 kW/kg. It is projected that within the next five years, widespread adoption of this technology will increase ESC power densities to 20–25 kW/kg.
For conventional electric UAVs, the propulsion system typically employs a centralized configuration where power cables only need to connect a single propulsion motor to the energy storage battery pack, resulting in short cable lengths. The mass of the conductors generally accounts for less than 1% of the total mass of the propulsion system.
DEP UAVs feature multiple power units symmetrically arranged along the wingspan, resulting in significantly increased wiring distances between propulsion units and battery packs. Total cable mass can reach 5–8% of the propulsion system’s total weight, making it a non-negligible factor. During the conceptual design phase, conductor lengths are preliminarily estimated based on UAV geometric dimensions. The power cables of the propulsion system can be estimated using linear density and conductor length, as expressed by:
Here,
Lwires represents the length of the wire, which is related to the layout of the power system and the relative position of the battery.
and
are the density of the internal conductor and the density of the external insulation layer of the cable, respectively. The conductor density is related to the wire material.
Scond and
Sinsul are the cross-sectional areas of the conductor layer and the insulation layer, respectively. The cross-sectional area of the conductor is related to the maximum carrying current required by the power system, and the relationship is as follows:
where
K is the comprehensive coefficient related to conductor material, ambient temperature, and installation method.
n represents the empirical parameter, typically ranging from 0.625 to 1.0.
2.1.3. Mass of Battery
Compared with traditional fixed-wing UAVs, a VTOL/STOL UAV exhibits significantly different energy demand characteristics during takeoff and landing phases [
19]. The peak power demand in the takeoff mode can reach 3–5 times that in the cruising state. The high-power demand during takeoff and landing requires the battery pack to have a higher discharge rate (10–15 C compared to the conventional 1–3 C). This high-rate discharge characteristic will lead to a significant decline in the battery’s energy density. Experimental data show that when the discharge rate increases from 1 C to 10 C, the effective energy density of lithium polymer batteries can decrease by 18–25%. Therefore, during the design phase of distributed-power drones, there is a trade-off between takeoff and landing performance and endurance performance.
The energy required for DEP STOL UAVs includes flight energy, avionics and payload energy, safety margin energy, and energy losses due to power system heat dissipation. The battery weight can be expressed as the relationship between total energy and energy density:
where
k represents the depth of discharge (DOD) factor. To protect battery life and flight safety, a reserved energy margin must be maintained, with the DOD typically set to 0.8.
ktemp denotes the temperature derating factor. Lithium-ion batteries operate optimally between 20 and 30 °C, where high temperatures accelerate aging and capacity fade, while low temperatures reduce discharge efficiency without direct damage. At optimal operating temperatures,
ktemp = 1. Experimental results show that at −10 °C operation [
20], the temperature derating factor can be adjusted to
ktemp = 0.7.
The energy required for flight includes takeoff, landing, and cruise energy, and can be expressed as follows:
The energy required for avionics includes power for the flight control system and servo actuators. Since avionics and mission payloads typically operate throughout the entire flight cycle, the energy demand for avionics and payloads can be calculated as:
High-voltage motors (>400 V) and compatible electronic speed controllers (ESCs) suitable for medium-to-small UAVs have limited market availability, with mainstream products still concentrated in the 48–96 V low-voltage range. This results in operating currents commonly reaching 100–300 A, leading to non-negligible energy losses in motors, ESCs, and power cables due to internal resistance. The energy loss can be expressed by:
Among them, I is the power supply current, Rmotor represents the resistance of the motor winding, RESC is the conduction resistance of the ESC, Rcable represents the resistance of the cable (which is positively correlated with the cable length), and Vdrop represents the switching voltage drop of the power device.
2.1.4. Mass of Payload
Missions for medium-to-small UAVs primarily involve four payload categories: 1. sensing payloads (optical/infrared cameras, LiDAR, etc.); 2. communication payloads (satellite relay modules, communication coverage base stations, etc.); 3. operational payloads (logistics cargo compartments, agricultural spraying systems, etc.); and 4. specialized payloads (electronic jamming equipment, weapon systems, etc.).
Payload types and related parameters must be determined during the initial design phase, exerting a decisive influence on UAV parameter selection and layout optimization. Conventional runway-takeoff UAVs achieve payload ratios of 10–35%, whereas STOL UAVs require compromised wing loading and redundant power design, resulting in payload capacities of only 50–60% of conventional models.
In conclusion, the takeoff weight of a DEP STOL UAV can be expressed as follows:
2.2. Aerodynamic Models and Constraints
In DEP STOL UAVs, multiple propellers are discretely arranged along the wingspan. There is a strong coupling relationship between the propeller slipstream and the aerodynamic forces of the wing. The slipstream generated by the distributed propellers can accelerate the airflow on the wing surface and suppress the span-wise flow of air along the wing, resulting in a significant lift-enhancement.
2.2.1. Stall Speed Constraint
Stall speed represents the lower bound of safe cruise speed and restricts wing loading selection. A higher maximum lift coefficient results in a lower stall speed, which translates to shorter takeoff distances for STOL UAVs.
where
CLmax_DEP represents the maximum lift coefficient of the wing under coupled slipstream effects, which requires additional aerodynamic modeling analysis.
2.2.2. Aerodynamic Modeling Considering Propulsive/Aerodynamic Coupling Effects
Unlike clean wings fully exposed to free stream, DEP UAV wings are partially located in free stream and partially in the combined flow of propeller slipstream and free stream. The airflow velocity over the upper surface of the wing under slipstream effects is shown in
Figure 2a.
The aerodynamic forces generated by the wing are divided into the slipstream-affected region and the free-stream region (
Figure 2b), where the airflow velocity, local angle of attack, and sideslip angle differ between these regions. The flow tube of the propeller slipstream initially undergoes contraction and subsequently attains a constant state. The distance between the propeller and the leading edge of the wing also affects the area of the slipstream region, as shown by the blue and red slipstream regions in
Figure 2b. To streamline the model’s complexity, this study posits an adequate distance between the propeller and the wing, thereby assuming that the slipstream region over the wing surface exhibits no contraction. The aerodynamic forces acting on DEP UAVs can be expressed by:
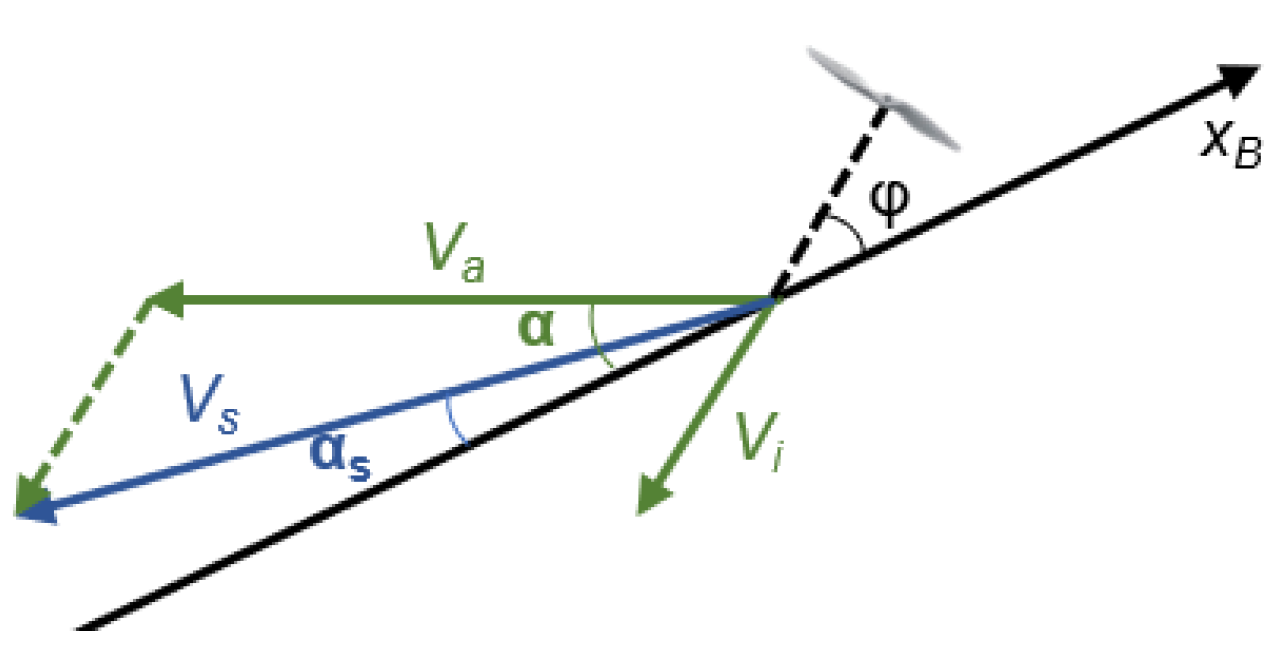
When considering the influence of propeller slipstream on UAV aerodynamics and moments, the free-stream velocity and propeller-induced velocity are vectorially superposed to obtain the flow velocity in the slipstream region [
21]. As shown in
Figure 3, the airflow velocity, local angle of attack, and local sideslip angle in the propeller slipstream region can be calculated using Equation (15).
where
Vs is the slipstream velocity,
αs is the slipstream angle of attack,
βs is the slipstream sideslip angle, and
is the propeller installation angle. Based on momentum theory, the relationships between the momentum-averaged induced velocity and slipstream radius as functions of the axial distance from the propeller plane can be derived as follows [
22]:
Here,
Vi0,avg represents the momentum-averaged induced velocity at the propeller plane,
Vi,avg represents momentum-averaged induced velocity,
Rs represents slipstream radius, and
x represents the axial distance. Thus, the slipstream area of a single propeller on the wing is given by:
where
xte is the axial distance from the leading edge of the wing to the propeller plane, and
xle is the axial distance from the trailing edge of the wing to the propeller plane.
Generally, the propeller slipstream influence region can be divided into the near-field region and far-field region [
23]. Using the wing chord length and Equation (16), the slipstream radius at different chord-wise positions along the wing can be calculated. For the UAV studied in this paper, due to the close proximity of the propellers to the wing, the wing sections behind each propeller are located within the contraction section of the slipstream region. Therefore, the slipstream regions behind individual propellers do not overlap, and mutual interactions between slipstreams are neglected.
Vs is the airflow velocity at the leading edge of the wing under the influence of the slipstream, and are the design drag coefficient and design lift coefficient of the UAV, respectively, and CY is the side-force coefficient. In the preliminary design process of this article, when calculating the lift force and drag force, it is simplified to consider that the propeller slipstream only affects the dynamic pressure within the slipstream area, and does not change the lift coefficient and drag coefficient. The lift and drag coefficients are given design values.
2.2.3. Aerodynamic Constraints
Endurance and range are critical performance metrics for UAVs, which are closely related to factors such as battery energy, propulsion efficiency, aerodynamic characteristics (lift-to-drag ratio), and takeoff weight. The range and endurance constraints for electric UAVs can be expressed as:
The core mission of DEP STOL UAVs is to overcome conventional runway constraints, with takeoff distance serving as the primary metric for evaluating their capability to operate in complex scenarios. According to the literature [
24], the ground roll distance of a UAV during takeoff can be expressed as:
where
VR represents the rotation speed, typically taken as 1.1 times the takeoff stall speed,
tR represents the nose-up taxiing time,
T represents the thrust provided by the distributed propulsion system,
is the ground rolling friction coefficient during takeoff, and
and
are the lift coefficient and drag coefficient of the UAV during takeoff with the distributed power effect.
2.3. Rapid Propeller Design Module
The DEP STOL UAV studied in this paper is driven by multiple propellers, and during the size design stage, propeller design needs to be carried out synchronously with the UAV design. In order to achieve the goal of rapid propeller design, this paper combines the blade element momentum theory (BEMT) and CFD verification for propeller design. BEMT offers strong derivability, facilitating the exploration of theoretical mechanisms and the introduction of non-linear effects (i.e., drag terms). Its interoperability between design and calculation makes it well-suited for theoretical research and rapid design analysis of propellers.
The design inputs of the design method are the size, rotational speed, incoming flow velocity, and density of the propeller. According to the thrust-to-weight ratio constraint, the maximum thrust required in the takeoff stage is determined, and the thrust required for cruise is determined according to the thrust–drag balance constraint in the cruise stage, meaning the geometry of the propeller must be designed to meet the requirements of the two working conditions. The design outputs are the airfoil, chord length, and twist angle (installation angle) of each section of the blade. Its main process can be divided into four parts. First, determine the number of propeller blades and the hub radius, and discretize the blade into N segments; then, calculate the induced pitch from the designed thrust; next, obtain the chord length and installation angle of each section; finally, conduct CFD verification on the design results. The rapid design process of the propeller is shown in the right part of
Figure 4. More details can be found in [
25] if necessary.
2.4. Framework of Conceptual Design
The basic design framework for dimensional parameters can be summarized as shown in
Figure 4. Using the weight models of each component constructed earlier, the takeoff weight that meets the constraints can be obtained through iterative calculations. The final takeoff weight is updated according to changes in the design variables, such as the thrust -to-weight ratio and the number of propellers.
Meanwhile, based on thrust requirements, the rapid design module can determine the propeller geometry that meets the thrust demands and the propeller slipstream velocity. The latter is critical for evaluating takeoff and landing performance under the influence of distributed propulsion slipstreams.
After obtaining the preliminary dimensional parameters, calculate whether the UAV performance meets the design requirements. If the determined conditions are not met, the dimensional parameters need to be iteratively adjusted until all constraints are satisfied. The main constraints of the performance module include endurance constraints, takeoff distance constraints, etc. The values of these constraints are usually determined by the mission indicators.
3. Design Case Study
The design method in this paper is applied to the development of a DEP STOL UAV. The preliminary overall design specifications are presented in
Table 1.
3.1. DEP STOL UAV Design Configuration
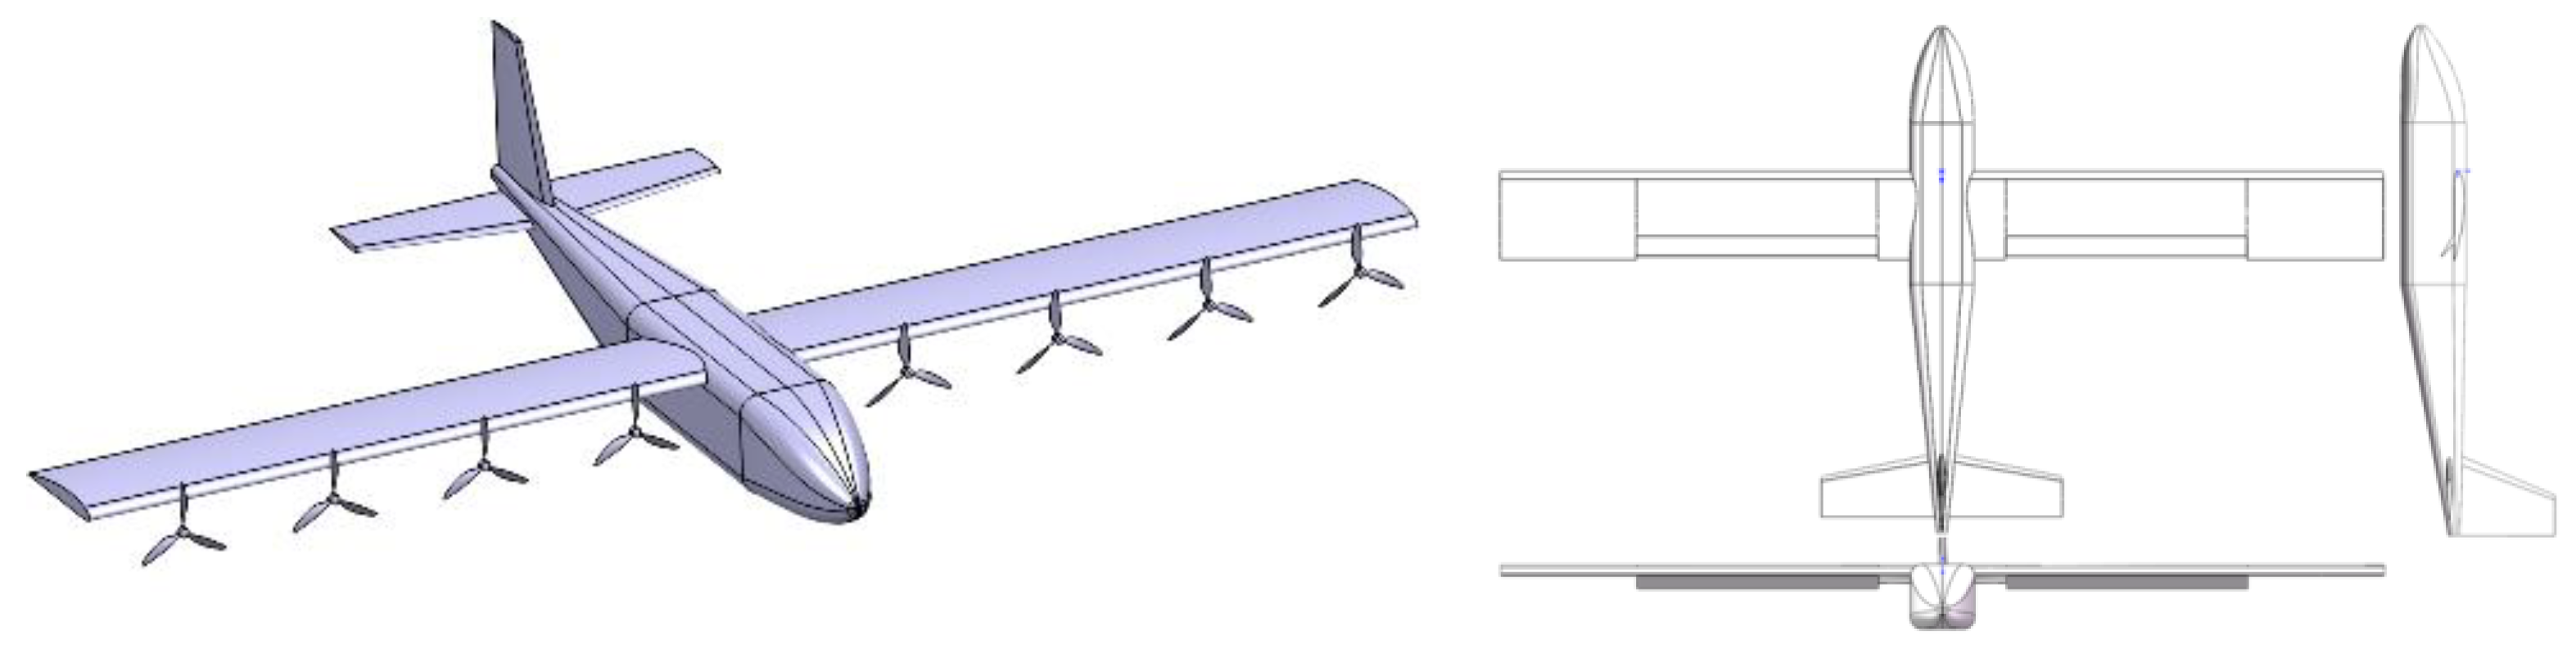
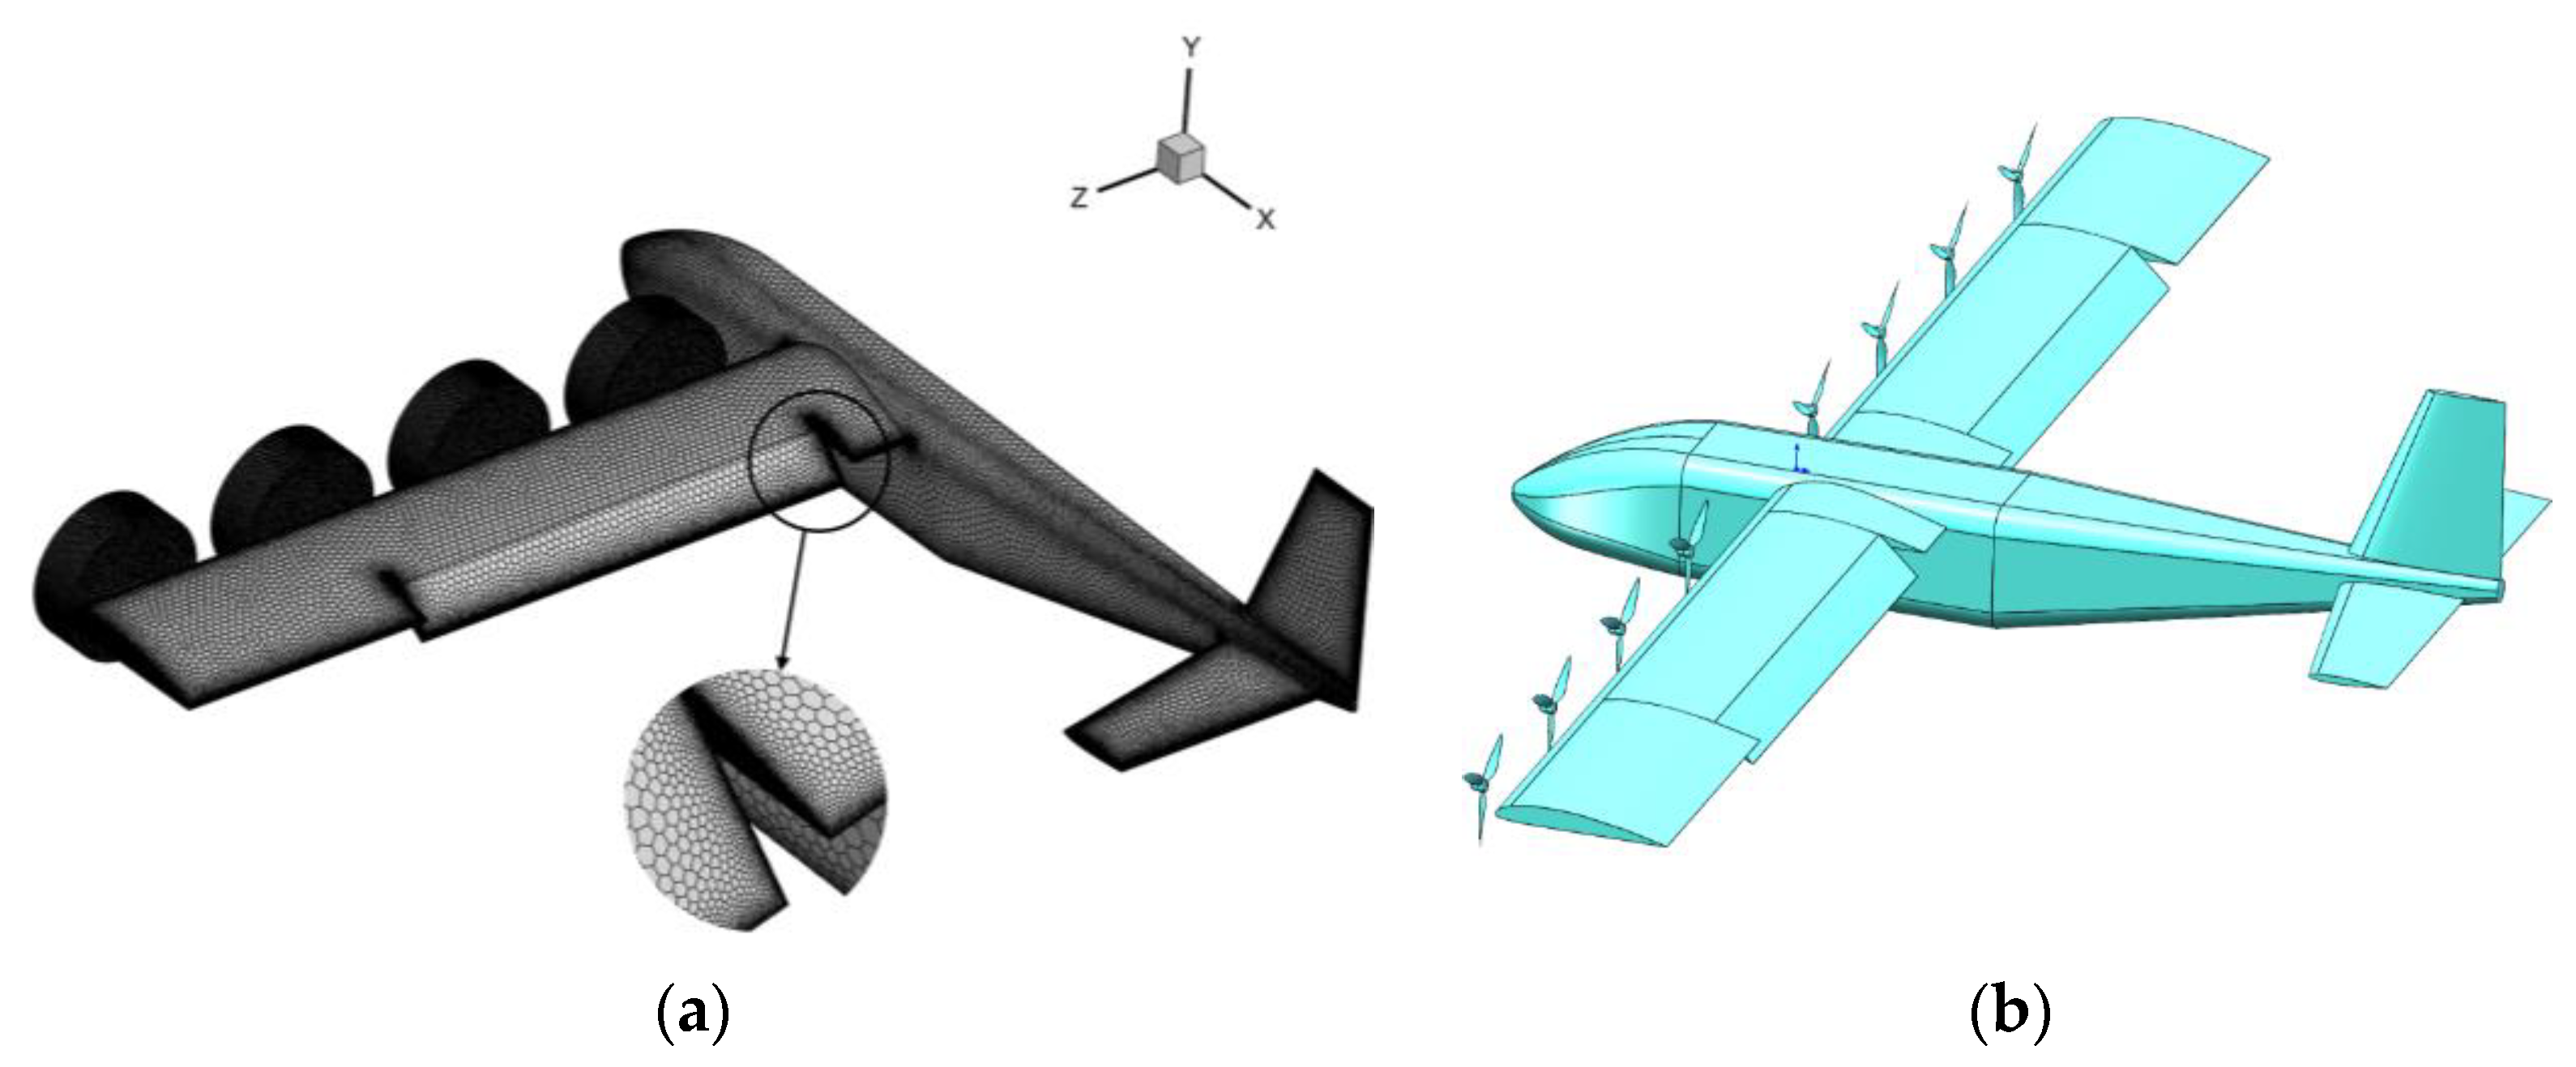
The DEP STOL UAV adopts a conventional layout, with the main wing featuring a straight rectangular shape and a high-wing configuration.
For the EDP STOL UAV, the speed is lower in the takeoff stage, and the aerodynamic force of the horizontal stabilizer is insufficient. The UAV in this case adopts a all-moving horizontal stabilizer, which can not only enhance the longitudinal maneuvering ability in the takeoff stage, but also achieve low trim drag in the cruise state. In the layout design stage, the geometry of the horizontal stabilizer also needs to be iteratively designed. First, the tail volume coefficient is determined empirically, and the area of the horizontal stabilizer is matched with the tail arm. Then the trim capacity of the cruise design point and the maneuvering efficiency in the takeoff state are calculated and verified. The iterative geometry shape is until the design requirements are met. The tail volume of the UAV in this case is 0.5, and the area is about 1.95 m2. The horizontal stabilizer deflection range is ±10°, and the handling efficiency is 0.0592/°
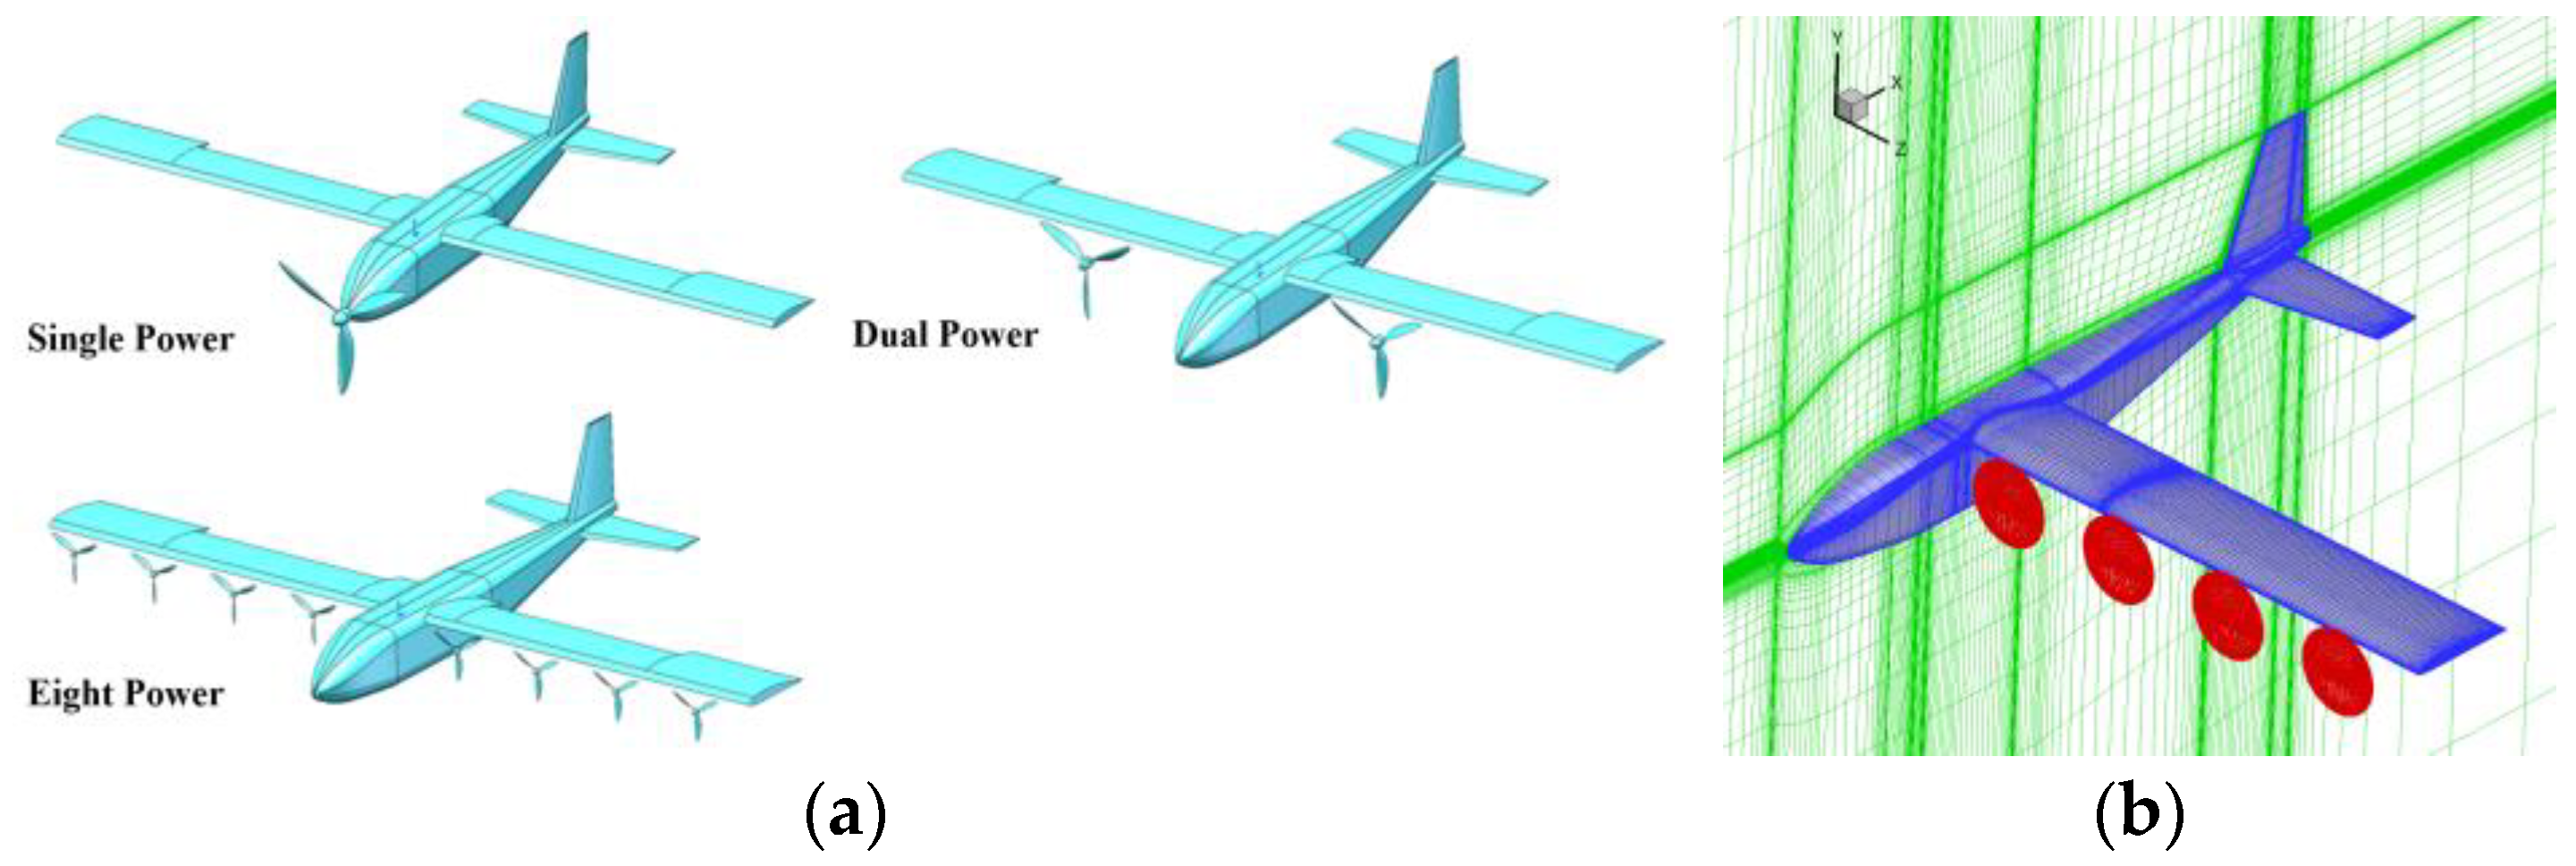
Eight propulsion units are arranged spanwise along the leading edge of the wing, with flaps and ailerons positioned on the trailing edge. Flap deflection under slipstream effects can further enhance takeoff and landing performance. During the cruise phase, the DEP configuration can effectively reduce the wing design area, thereby lowering the overall UAV weight and frictional drag. The configuration and external shape, along with the three-view drawing, are as shown in
Figure 5.
The main layout parameters of the UAV in the case of this paper are shown in
Table 2.
In
Table 2, the total mass, thrust-to-weight ratio, maximum thrust, and maximum power are obtained iteratively from the conceptual design framework, and the mission load, cruise speed, stall speed, lift coefficient, and lift-to-drag ratio are the constraint parameters of the design framework. Layout geometric parameters such as wing area, wingspan, and chord length are determined during the layout design stage.
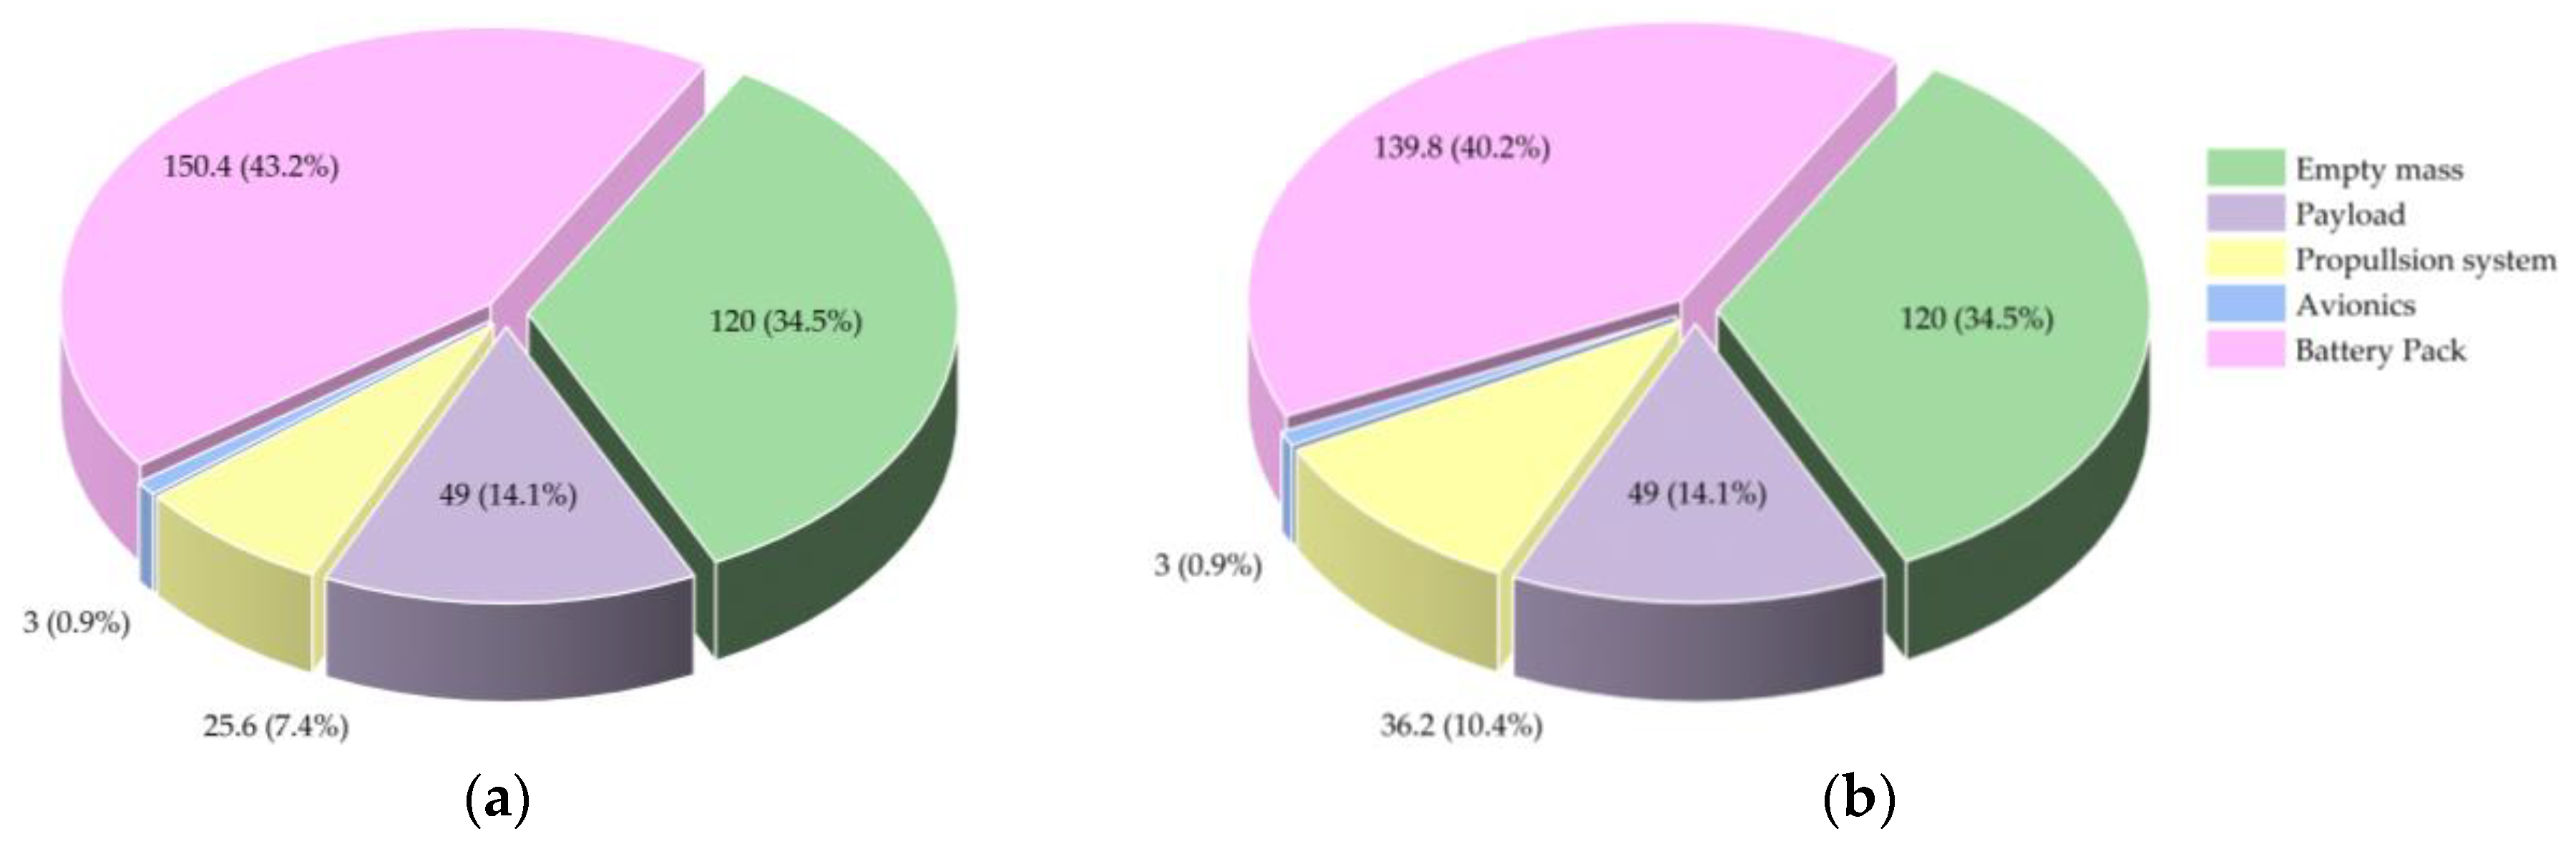
3.2. Component Weight Distribution
The EDP UAV’s weight can be divided into empty weight, propulsion system weight, battery weight, and payload. Based on the sizing method described earlier, the weight distribution is shown in
Figure 6a, in which the values corresponding to the sectors in the figure represent the component weight and weight percentage, respectively. For comparison, based on the same design requirement,
Figure 6b shows the component weight of a conventional single-power configuration STOL UAV.
The wings of the DEP configuration are in the slipstream of the propeller, which can provide more lift than the conventional configuration, so the maximum thrust-to-weight ratio required based on the takeoff distance constraints is smaller, which results in a smaller propulsion system weight. The propulsion system in the EDP configuration weighs about 25.6 kg, which is 29% smaller than the conventional configuration. Compared with the conventional configuration, the battery weight increases by 10.6 kg, which means that the endurance is increased by 7.5%.
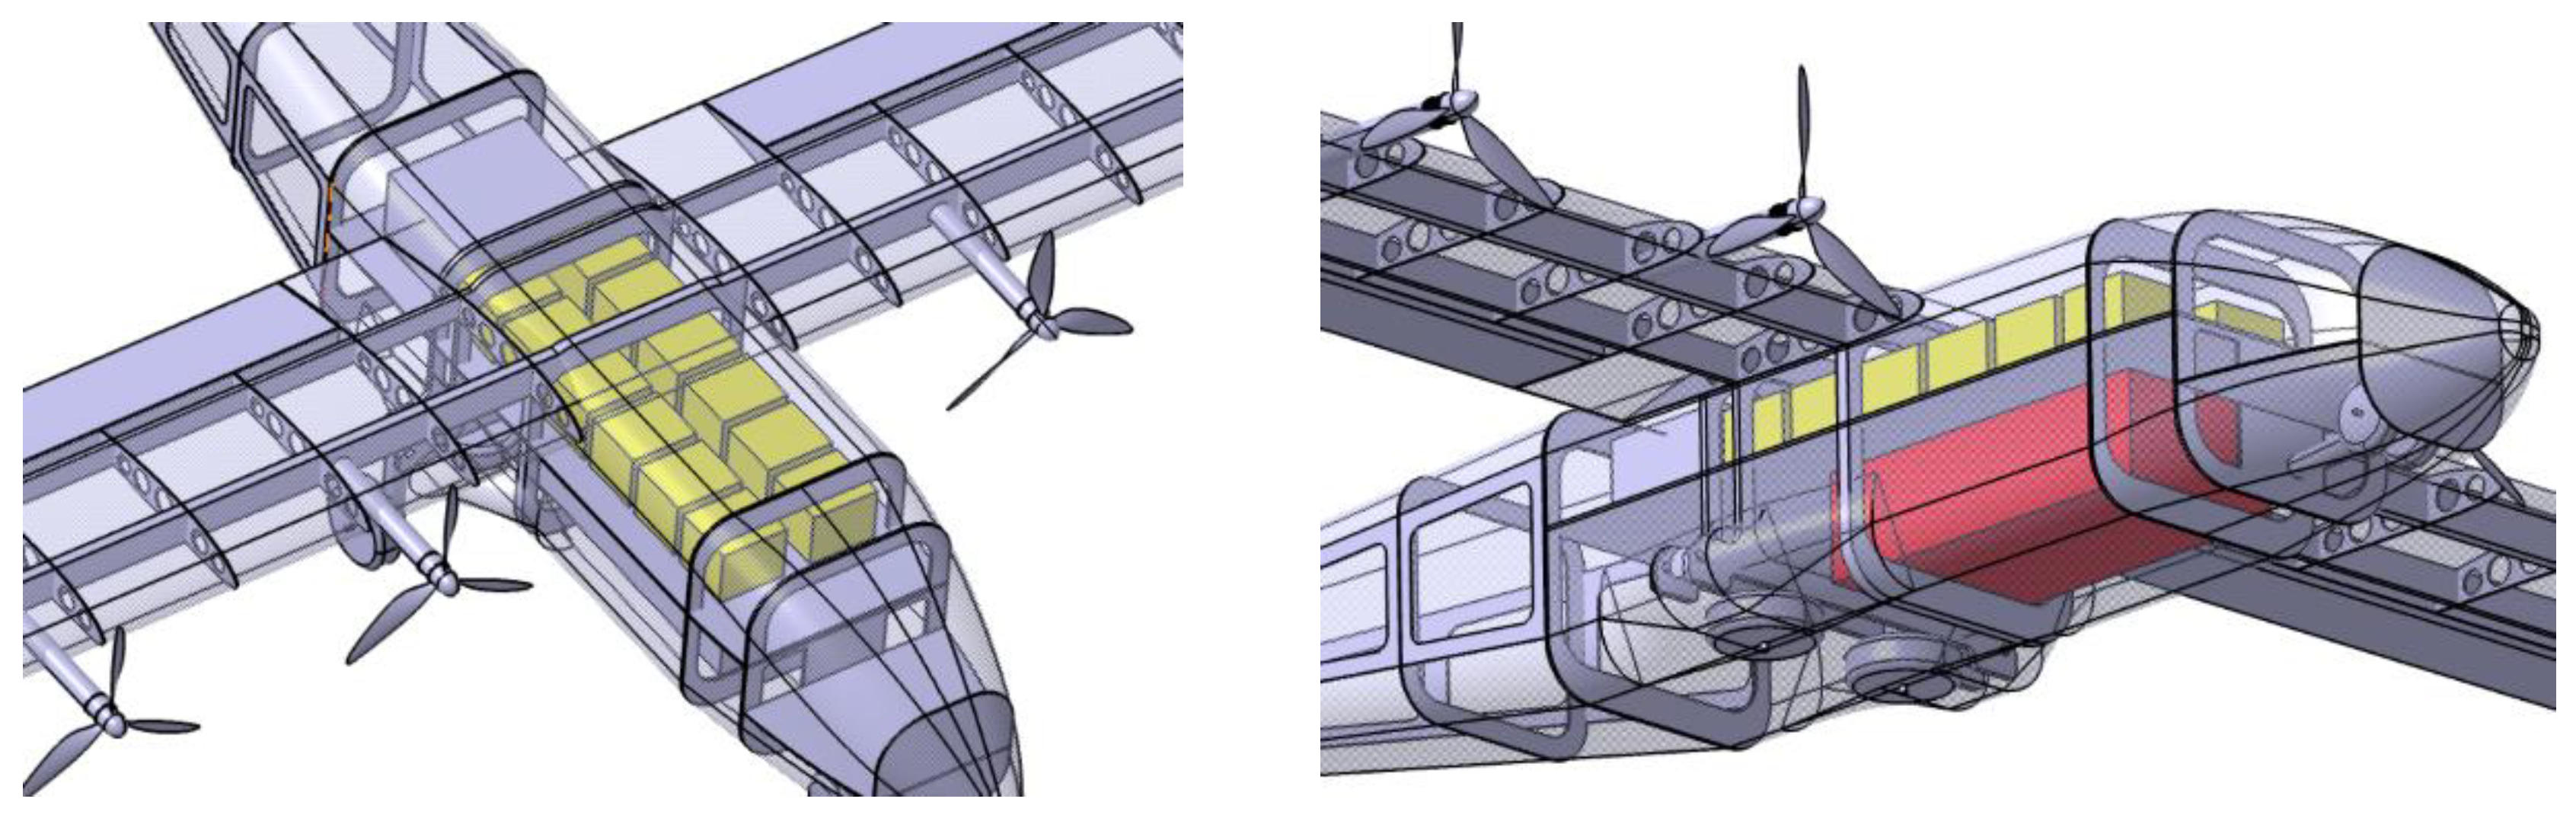
The DEP STOL UAV is powered by a battery pack with an energy density of 275 Wh/kg, a rated voltage of 355 V, a rated capacity of 116 Ah, total energy of 41,250 Wh, and weight of 150.4 kg. Each individual battery is a 24S50AH88.8V unit (24-series, 50 Ah, 88.8 V), and the battery pack is composed of four series-connected groups in parallel. The battery parameters are derived from Zhongyin brand products data. The UAV’s payload of 49 kg is placed in the lower front section of the fuselage, occupying a volume of 1.1 m in length, 0.5 m in width, and 0.3 m in height. The layout of the fuselage batteries and payload is shown in
Figure 7.
3.3. Propeller Design
This case requires meeting mission requirements such as short takeoff and landing (STOL), large payload capacity, and long endurance, while accommodating both cruise and STOL as primary flight modes. The propeller design conditions are 4 km altitude and 36 m/s cruise speed.
To compare the effects of propulsion unit quantity on UAV takeoff and landing performance, three configurations were designed: single-propulsion, dual-propulsion, and eight-propulsion systems. All three propulsion configurations use fixed-pitch propellers, that is, the propeller blades are fixedly connected to the propeller hub, and the propellers adopt rigid propeller blades.
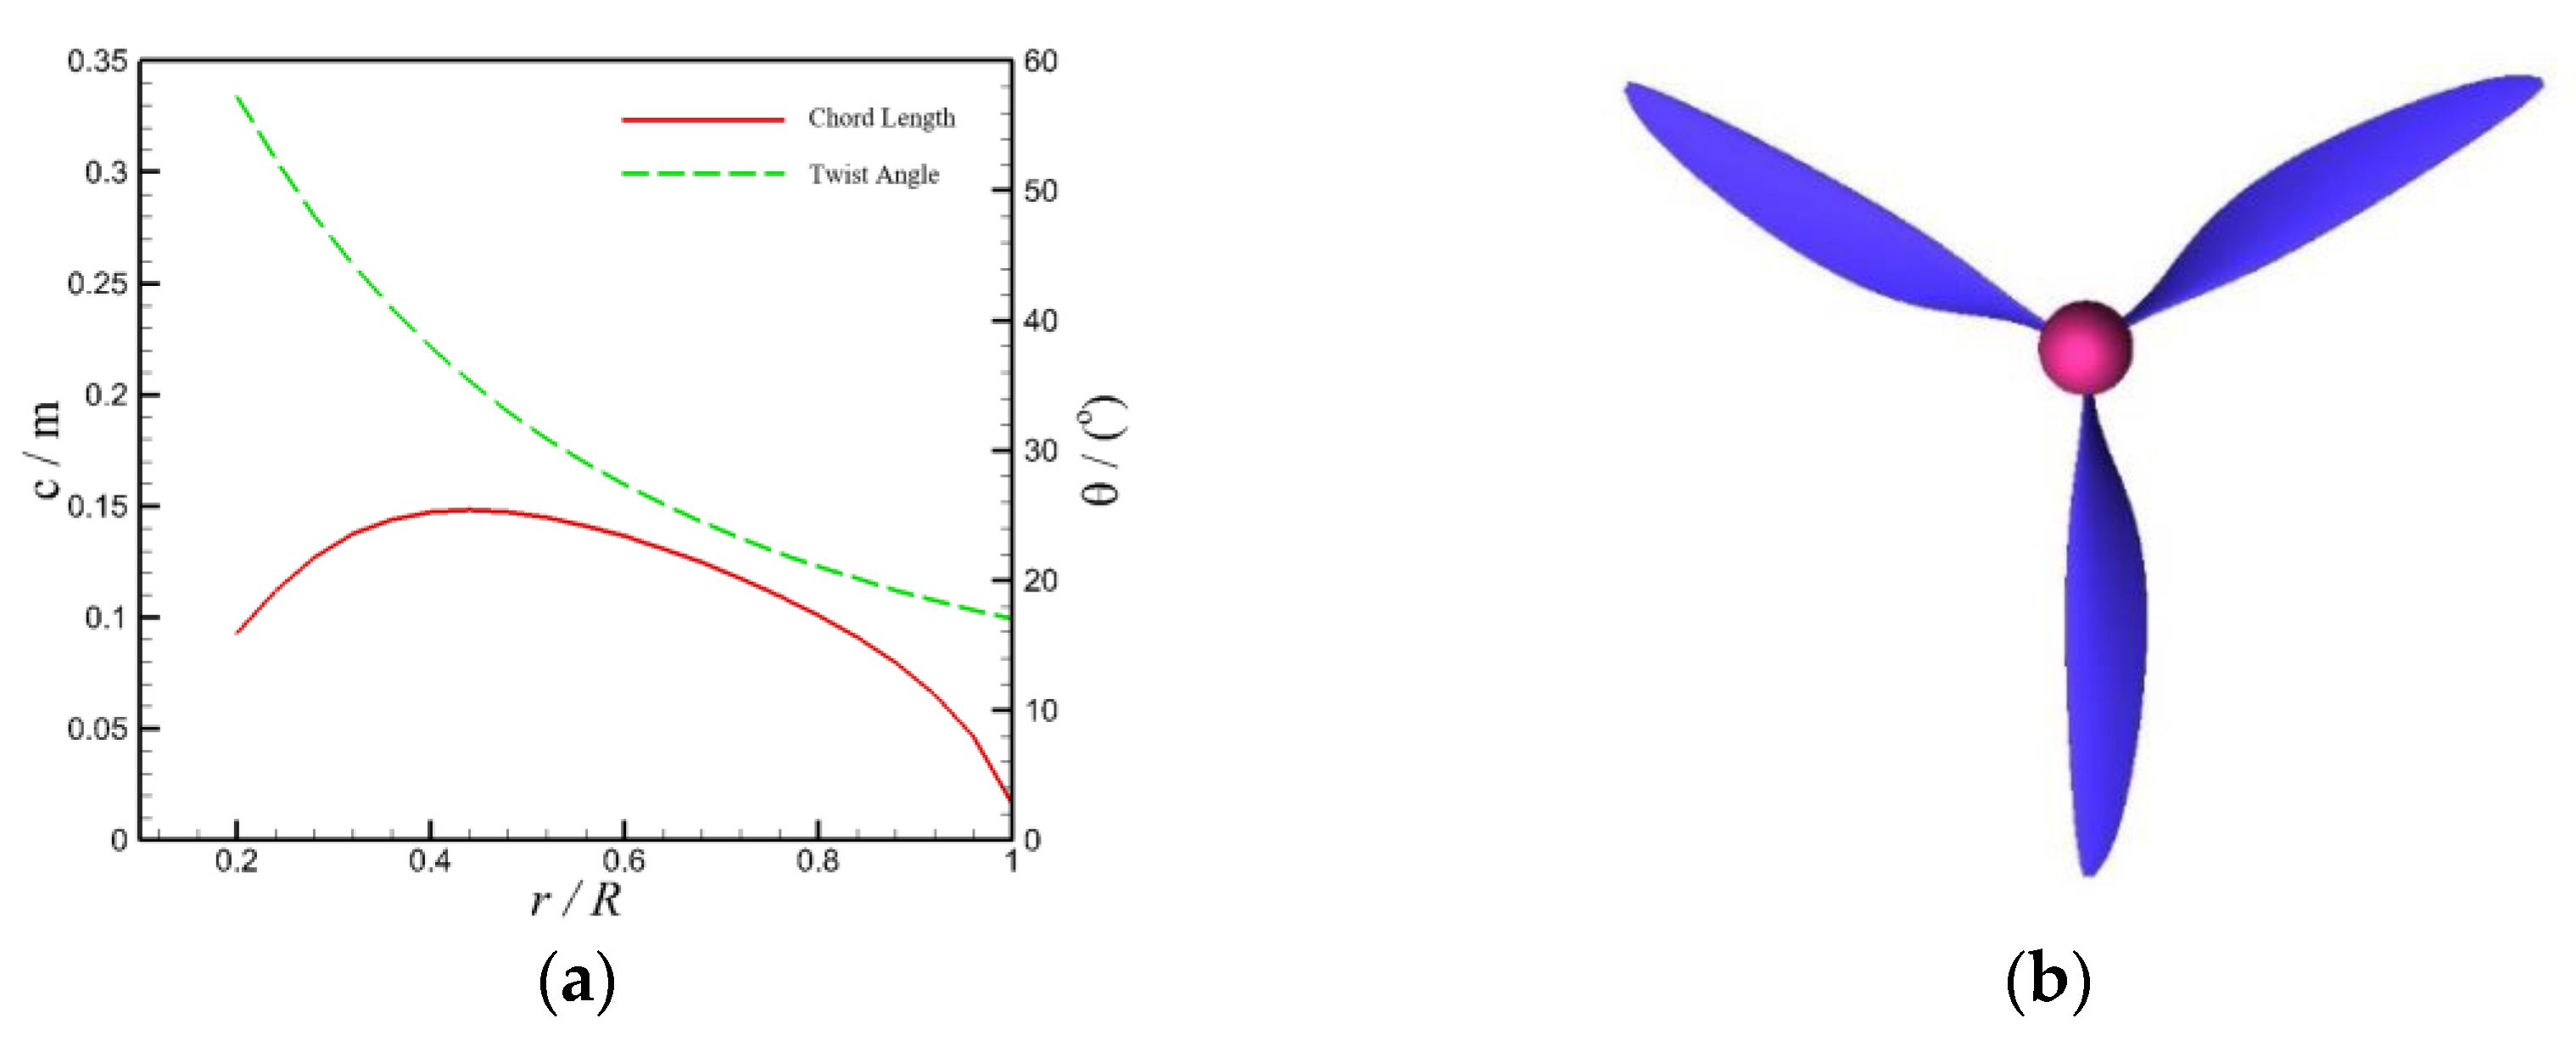
The initial number of propulsion units is two, with a single propeller design thrust of 135 N and maximum static thrust of 700 N. The propeller has a radius R = 0.78 m, three blades (N = 3), a design cruise rotational speed Ω = 1460 r/min, and a maximum static thrust rotational speed of Ω = 1625 r/min. The Clark Y airfoil is selected for the blade profile.
During propeller design, the blade is shaped from 0.2 R to the tip, while a transition section is applied between the hub and 0.2 R. The chord length and twist angle distributions of the designed propeller are shown in
Figure 8, with its geometric model as depicted.
According to the momentum theory, the power and thrust of the propeller are related to the disc loading. Taking the geometric shape of the propeller with the two-propulsion configuration designed above as the initial configuration, based on the principle of consistent disc loading, the geometric shapes of the eight-propulsion and single-propulsion configurations are scaled, with radii of R = 0.38 m and R = 1.11 m, respectively. Subsequently, the rotational speeds of the eight-propeller and single-propeller configurations are adjusted to meet the design requirements, that is, the total thrust remains the same as that of the two-propeller configuration. Then, the computational fluid dynamics (CFD) multi-reference frame (MRF) method is used to calculate and verify the total thrust and total shaft power of the three propellers with different radii under cruise and takeoff conditions. The number of single propeller grids is about 5 million, and the turbulence model is k-w SST. The calculation results of the three propeller configurations are shown in
Table 3. The total thrust and total power of all configurations are approximately the same, all meeting the design requirements.
4. Propulsive–Aerodynamic Coupling Characteristics Analysis
4.1. Cruise Performance Analysis Under Propeller Slipstream Effects
Based on the three propeller configurations designed in
Section 3.3 and combined with the clean configuration, three DEP STOL UAV layout configurations were developed, with their coupled configurations featuring different numbers of propulsion units shown in
Figure 9a.
Single and dual-propellers represent two typical conventional fixed-wing layouts, where single propeller represents a clean layout without slipstream coupling, and dual-propellers represent a conventional slipstream coupling layout. Eight-propeller selection is primarily based on wing geometry constraints and electric propulsion system weight constraints, representing a distributed propulsion layout.
DEP STOL UAV configurations contain multiple propellers. When conducting aerodynamic calculations, if real propeller models are used for all propulsion units, computational grid size and time consumption are significantly increased. Therefore, it is necessary to adopt simplified methods for propulsion unit modeling to improve the efficiency of aerodynamic simulations.
The momentum source method replaces solid propellers with a thin actuator disk, time-averaging the rotational effects of the blades onto the disk. Forces at each grid cell on the disk are calculated using BEM theory, and these forces are then converted into momentum source terms added to the Navier–Stokes equations for solution. The momentum source method improves numerical stability and computational efficiency without increasing computational cost.
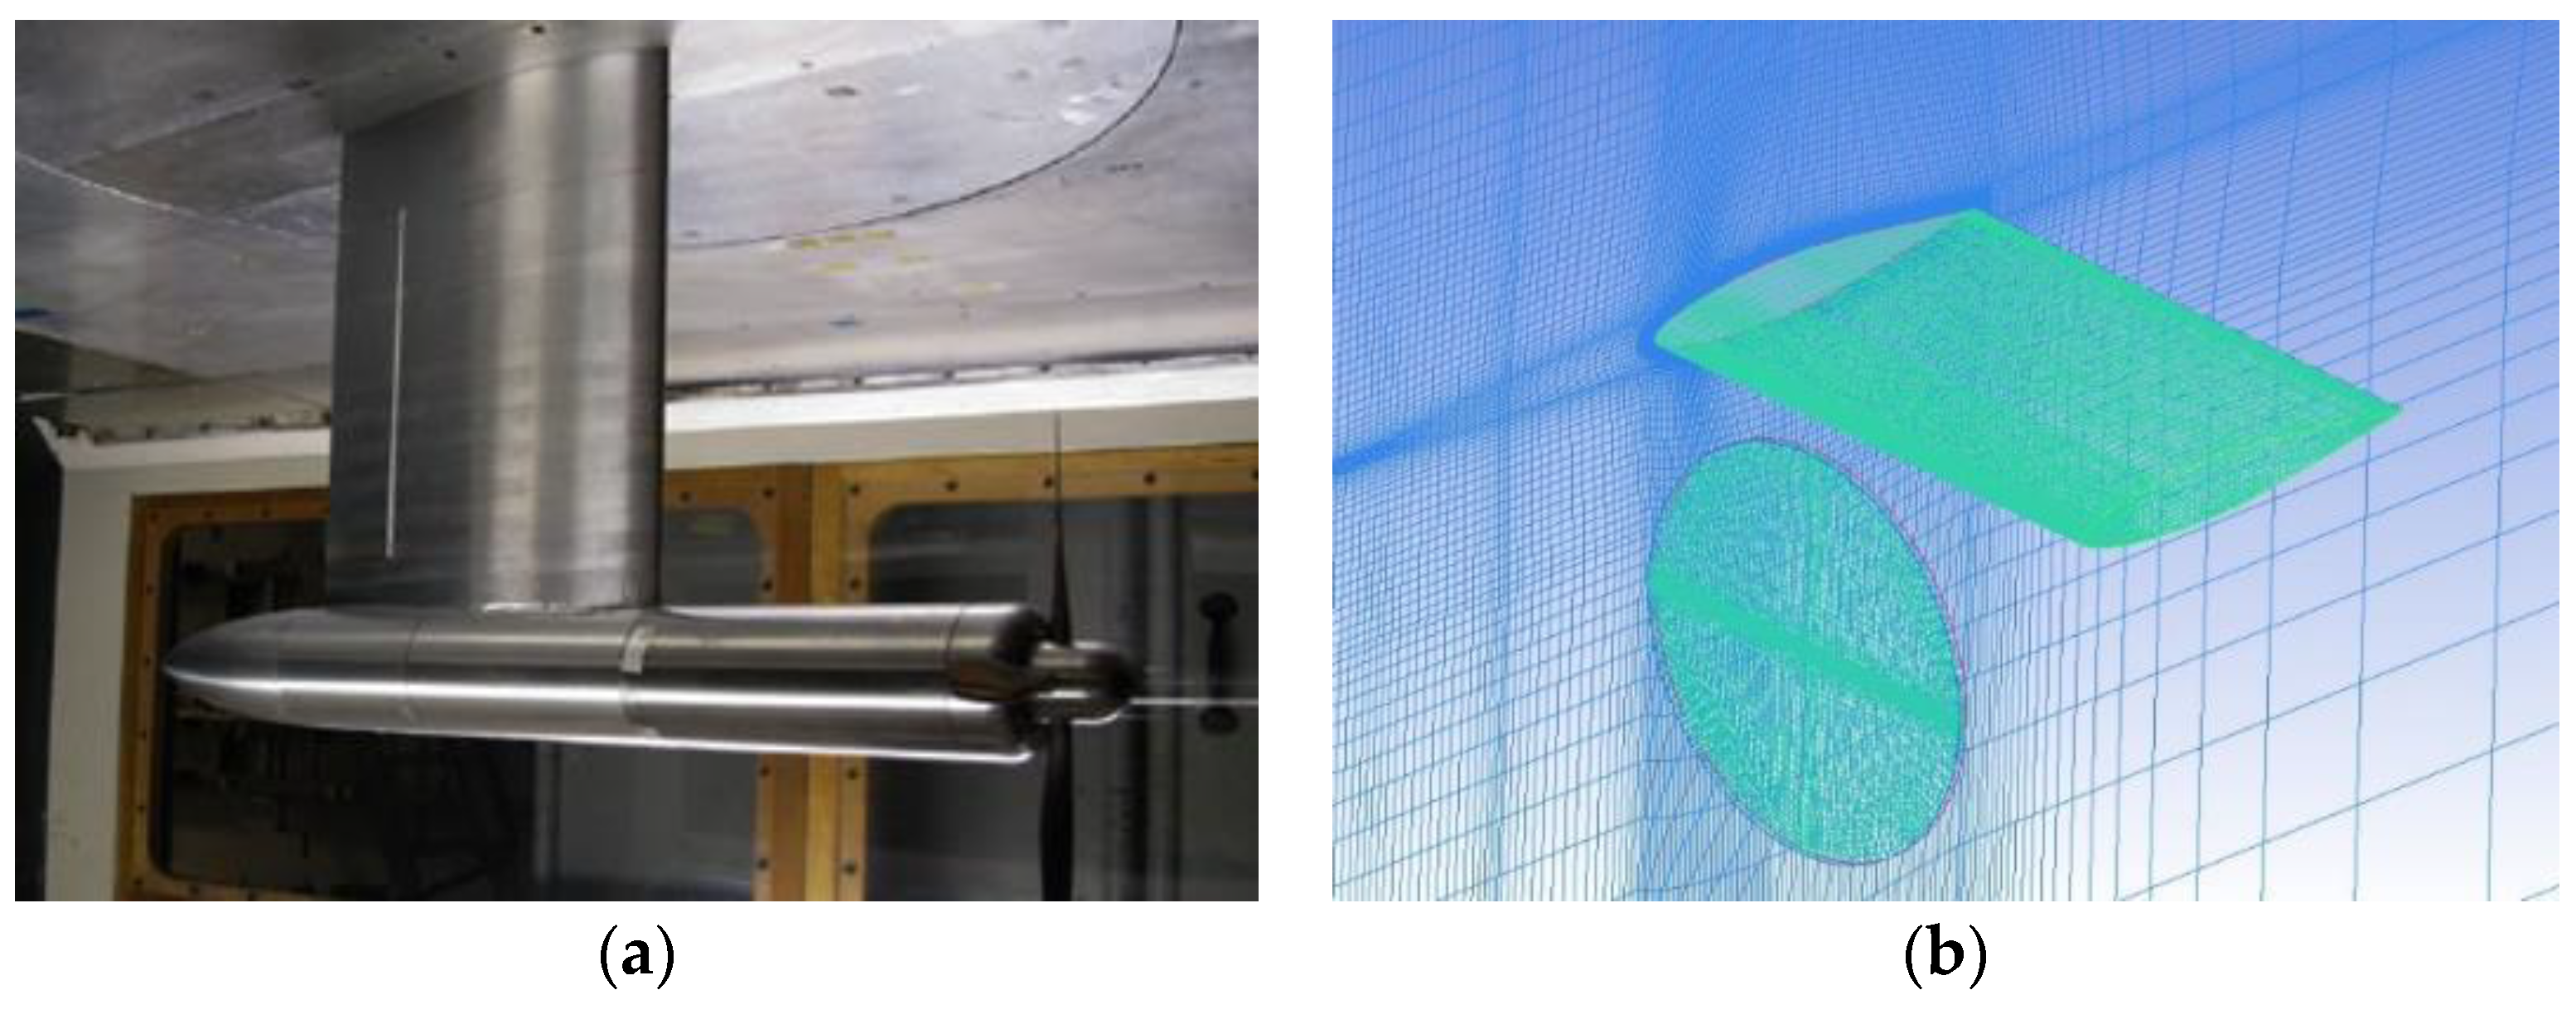
In order to verify the effectiveness of the momentum source method in the calculation of the propeller coupled configuration, the PROWIM-2.0 configuration was selected for verification calculation. The model originated from Delft University and was used to study the aerodynamic characteristics of the wing under the influence of slipstream. The experimental model and the calculation grid are shown in
Figure 10. The model consists of a propeller and a straight wing. The propeller is installed in front of the wingtip through the nacelle. The numerical calculation simplifies the model and ignores the influence of the nacelle. The momentum source method is used to calculate the aerodynamic characteristics of the coupled configuration.
The calculated flow velocity is 35 m/s, the advance ratio is J = 0.8, and the turbulence model is k-w SST. The lift coefficient of the coupled configuration at different angles of attack is calculated and compared with the experimental results as shown in
Figure 11.
It can be seen from the results that the CFD calculation results are in good agreement with the experimental values, so the momentum source method can be used to calculate and analyze the aerodynamic characteristics of the dynamic wing coupling configuration.
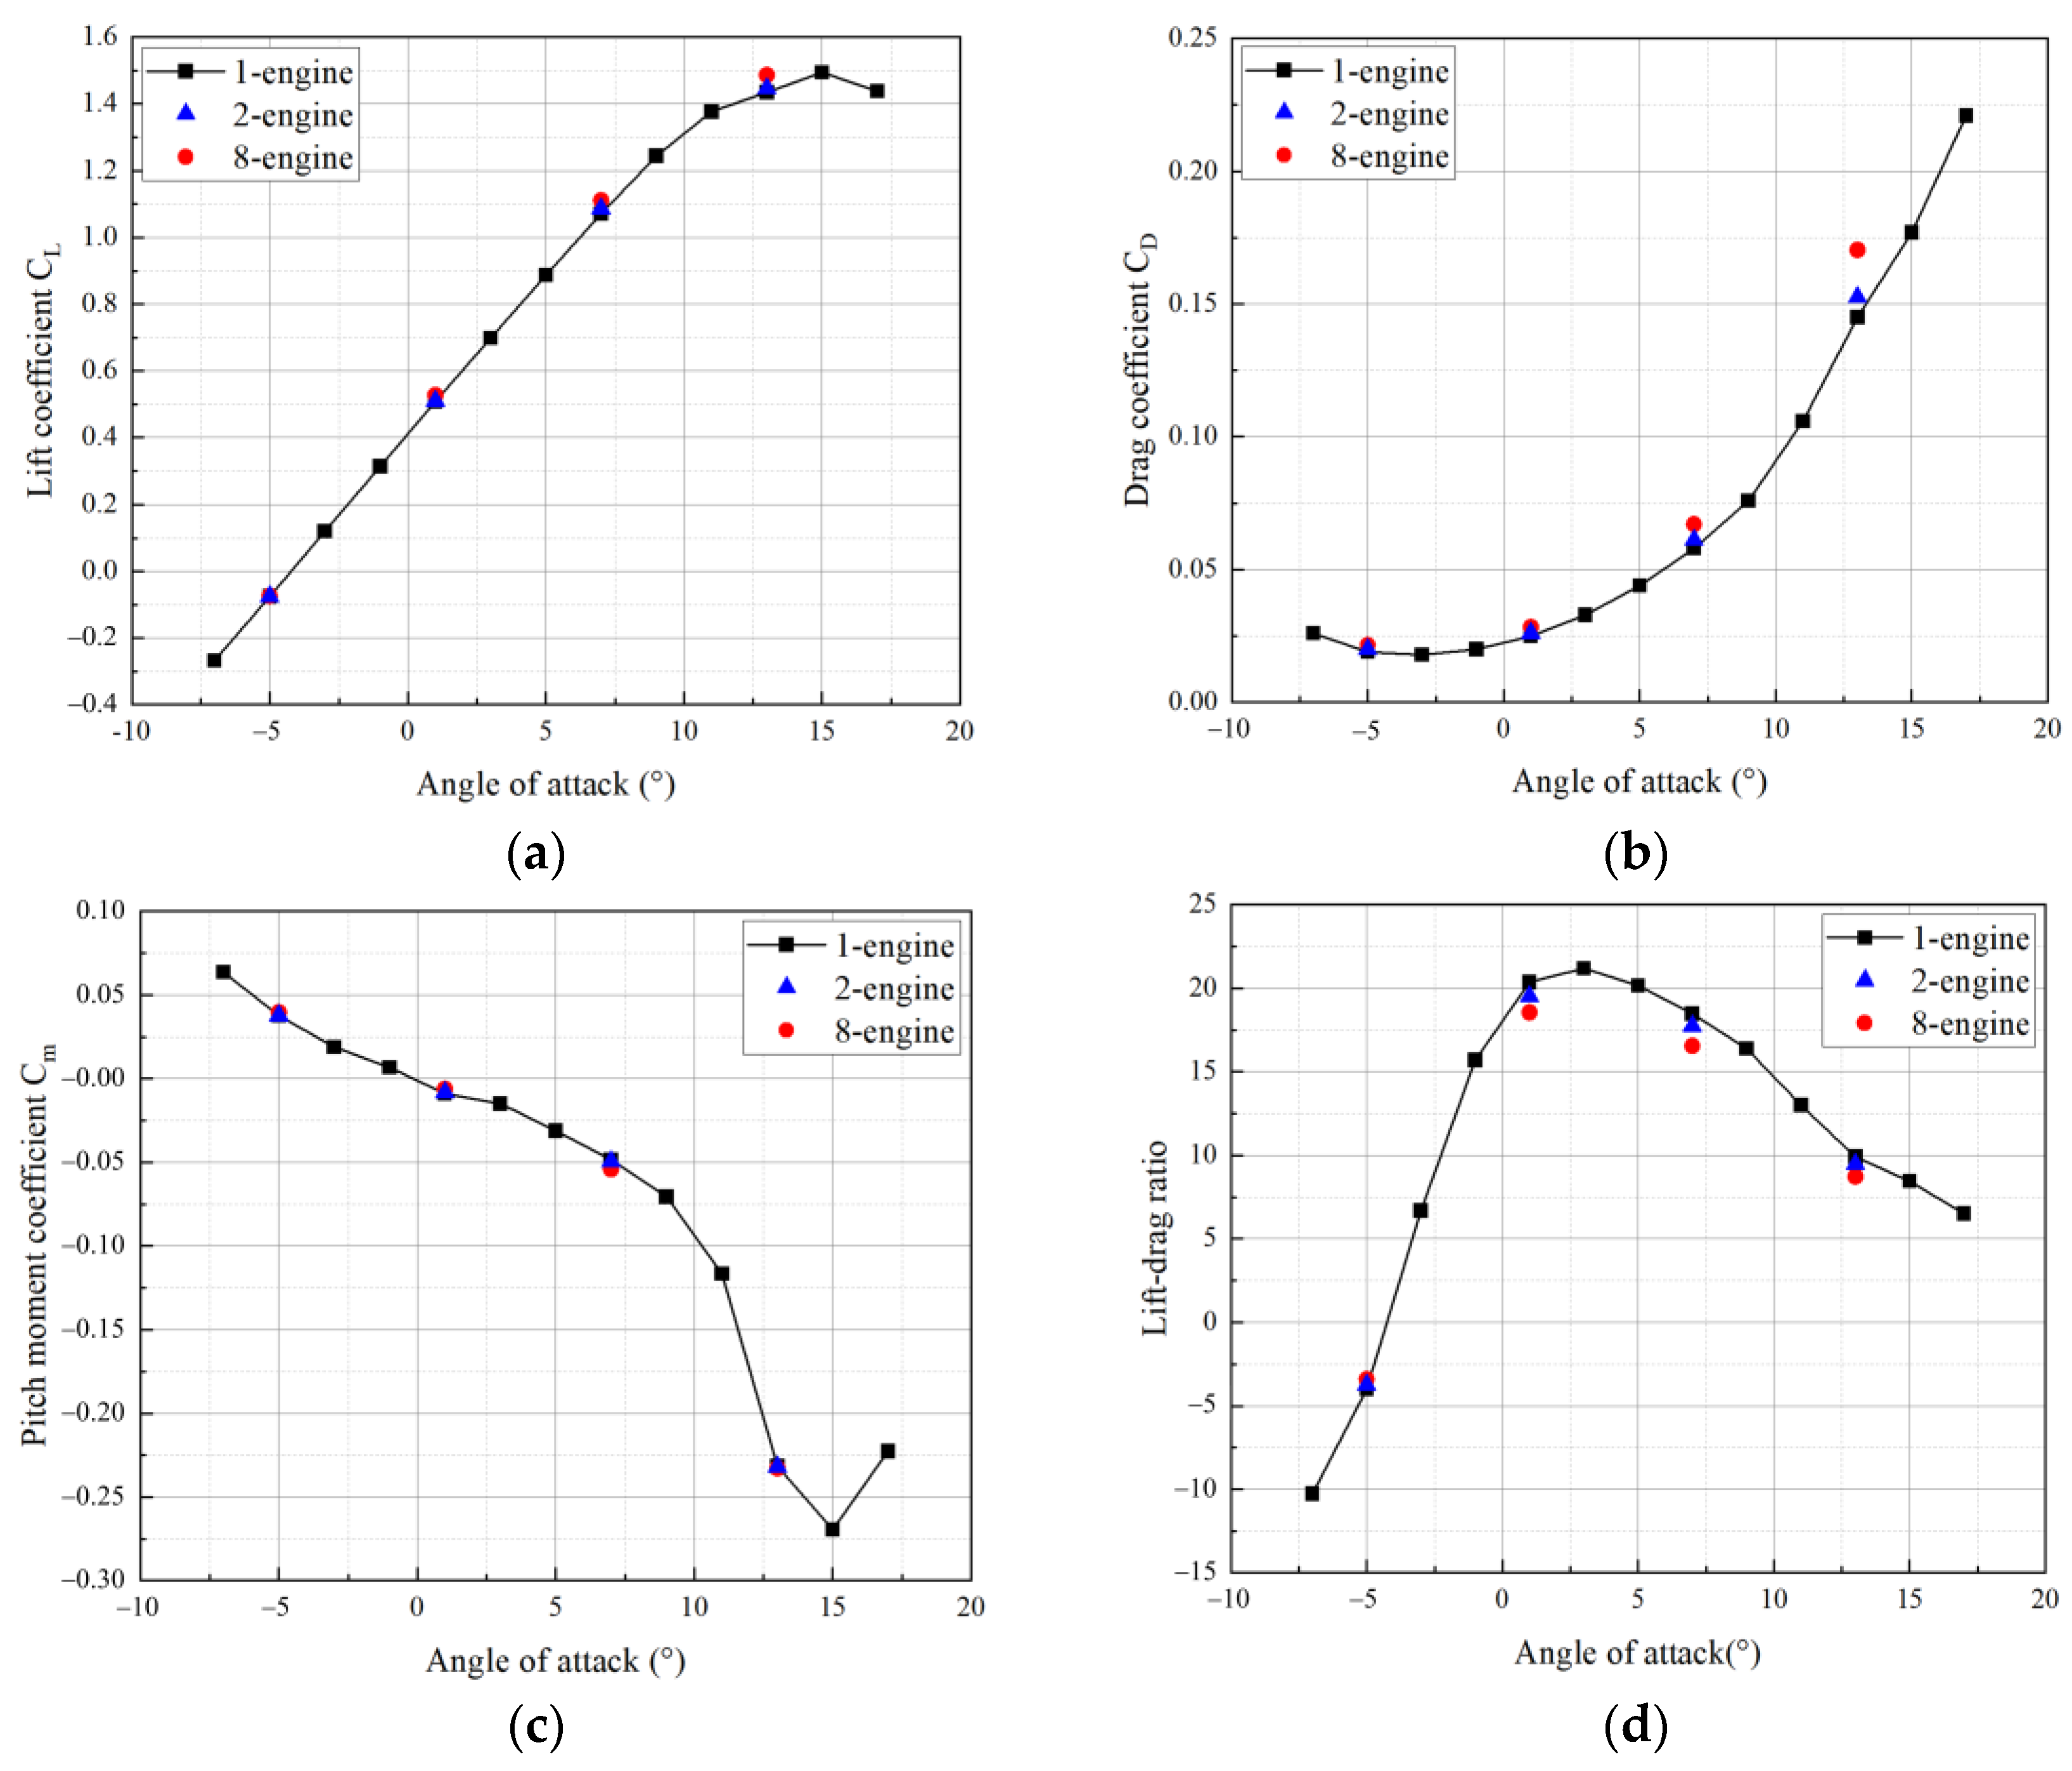
The UAV cruises at an altitude H = 4 km and velocity V = 36 m/s, with a trim angle of attack of 1°. To investigate the influence of propulsion units on the UAV’s aerodynamic characteristics under cruise conditions, different configurations with varying numbers of propulsion units were selected. The half-model mesh of the UAV is shown in
Figure 9b. The mesh number of the configuration half-mode is about 6.10 million CFD simulations conducted to compute and compare their aerodynamic performance, and the turbulence model is k-w SST, which is widely used in engineering and has been widely verified. The results are shown in
Figure 12.
From the computational results, at a cruise angle of attack of 1°, the lift coefficient (CL) and pitch moment coefficient (Cm) of the UAV remained nearly unchanged with increasing numbers of propulsion units. The drag coefficient (CD) showed a moderate increase as the number of propulsion units increased, while the lift-to-drag ratio (L/D) remained stable. As the trim angle of attack increased, both CL and CD experienced modest increases, leading to a slight decrease in L/D. For UAVs, the aerodynamic efficiency during the cruise phase is high, requiring minimal thrust, and the distributed slipstream had negligible effects on the wing aerodynamics.
4.2. STOL Performance Analysis Under Propeller Slipstream Effects with Flap Deflected
4.2.1. Lift Enhancement Induced by Flap Deflection
During takeoff and landing phases, the UAV propulsion system typically operates under maximum power conditions. The high-speed slipstream generated by distributed propulsion increases the dynamic pressure over the wing, augmenting lift. To further enhance STOL capabilities, high-lift flaps are installed on the wing trailing edge. During takeoff, as the flaps deflect downward, the propeller slipstream adheres to the flap surface due to the Coanda Effect [
26] (viscous interaction), altering the direction of the wing wake and delaying boundary layer separation, thereby further increasing wing lift. The arrangement location, geometry, and surface mesh of the flap are shown in
Figure 13.
To investigate the influence of flaps on the aerodynamic characteristics of the entire UAV, the eight-propulsion configuration was selected. The computed influence of high-lift flap deflection angles on its aerodynamic characteristics during takeoff is shown in
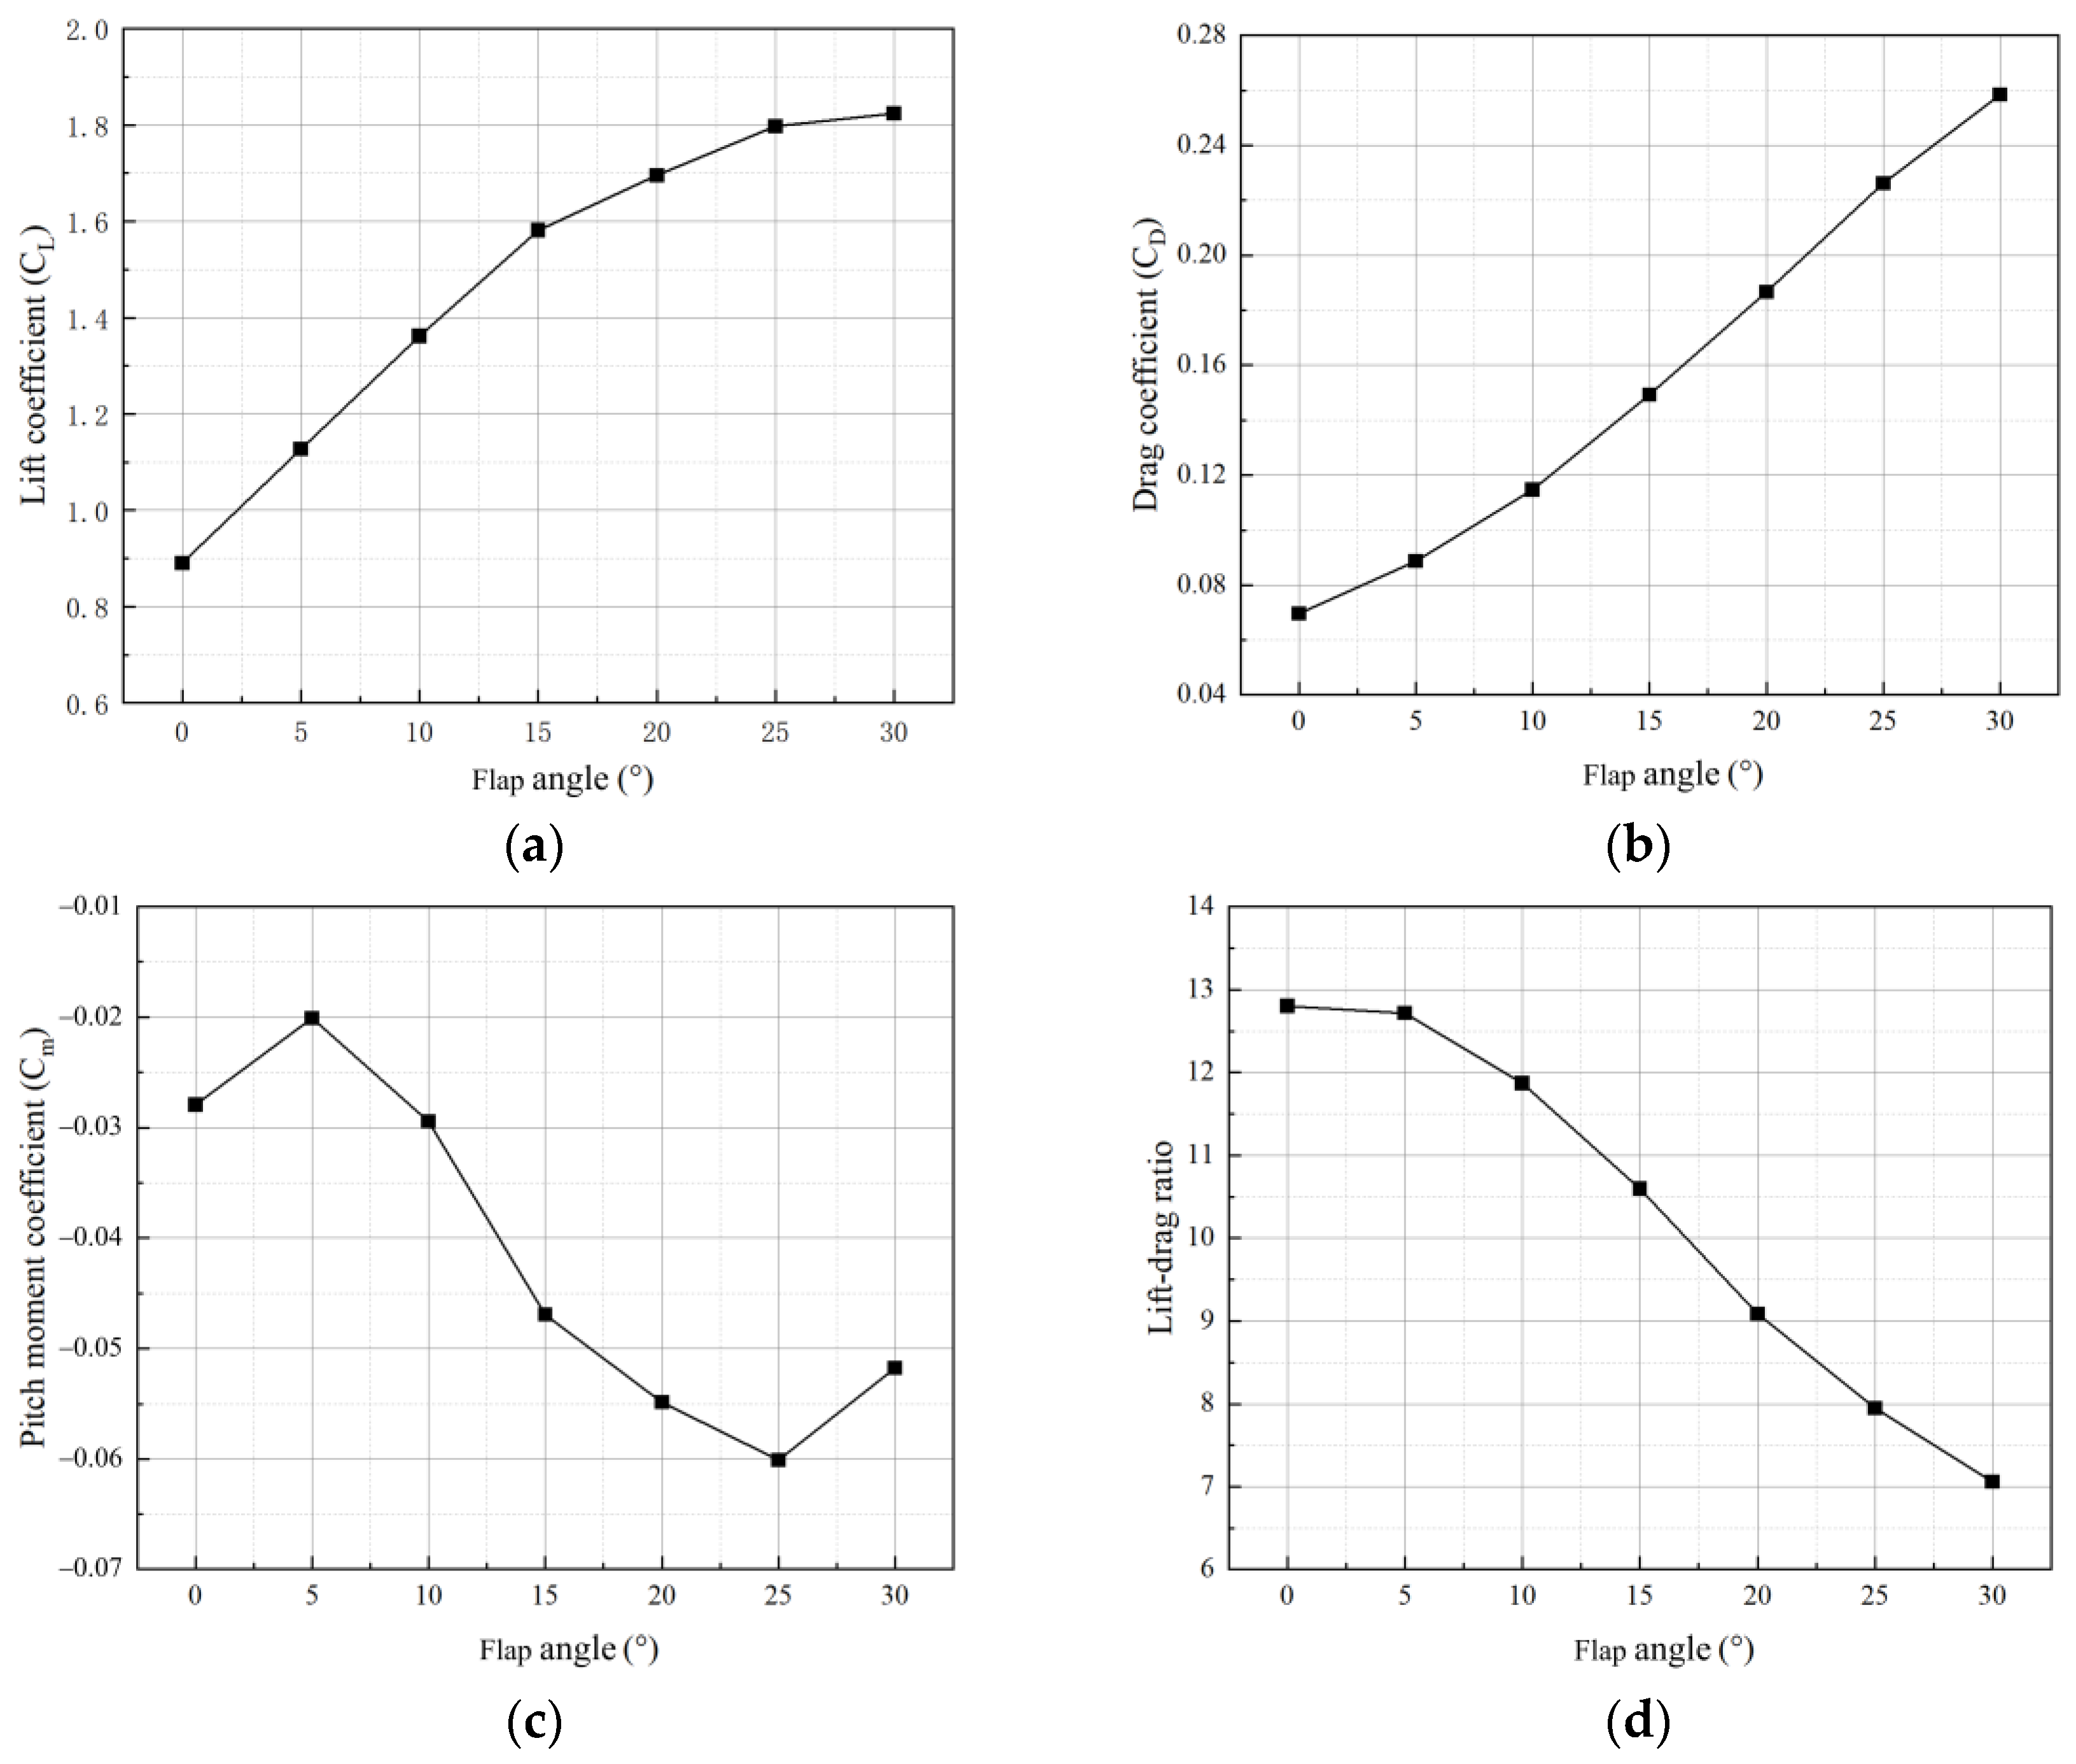
Figure 14. The computational free-stream velocity was 20 m/s, and the angle of attack was 3°.
From the computational results, as the high-lift flap deflection angle increases, both the lift coefficient and drag coefficient of the eight-propulsion configuration UAV continuously increase. At a flap deflection angle of 15°, CL increased by 77%, and CD increased by 1.14 times the original value. When the flap deflection angle reaches 30°, CL increased by nearly 100%, while CD increased by 2.71 times the original value.
As the flap deflection angle increases, the aerodynamic characteristics of the eight-propeller-powered UAV exhibit a simultaneous increase in both lift and drag. The lift augmentation effect begins to diminish after the flap deflection angle reaches 15°, while the drag increase effect starts to intensify. During the takeoff phase, the drag is countered by propeller thrust.
Overall, high-lift flaps coupled with distributed propulsion slipstream can significantly enhance the lift coefficient during the UAV takeoff phase, thereby improving its short takeoff and landing (STOL) capabilities.
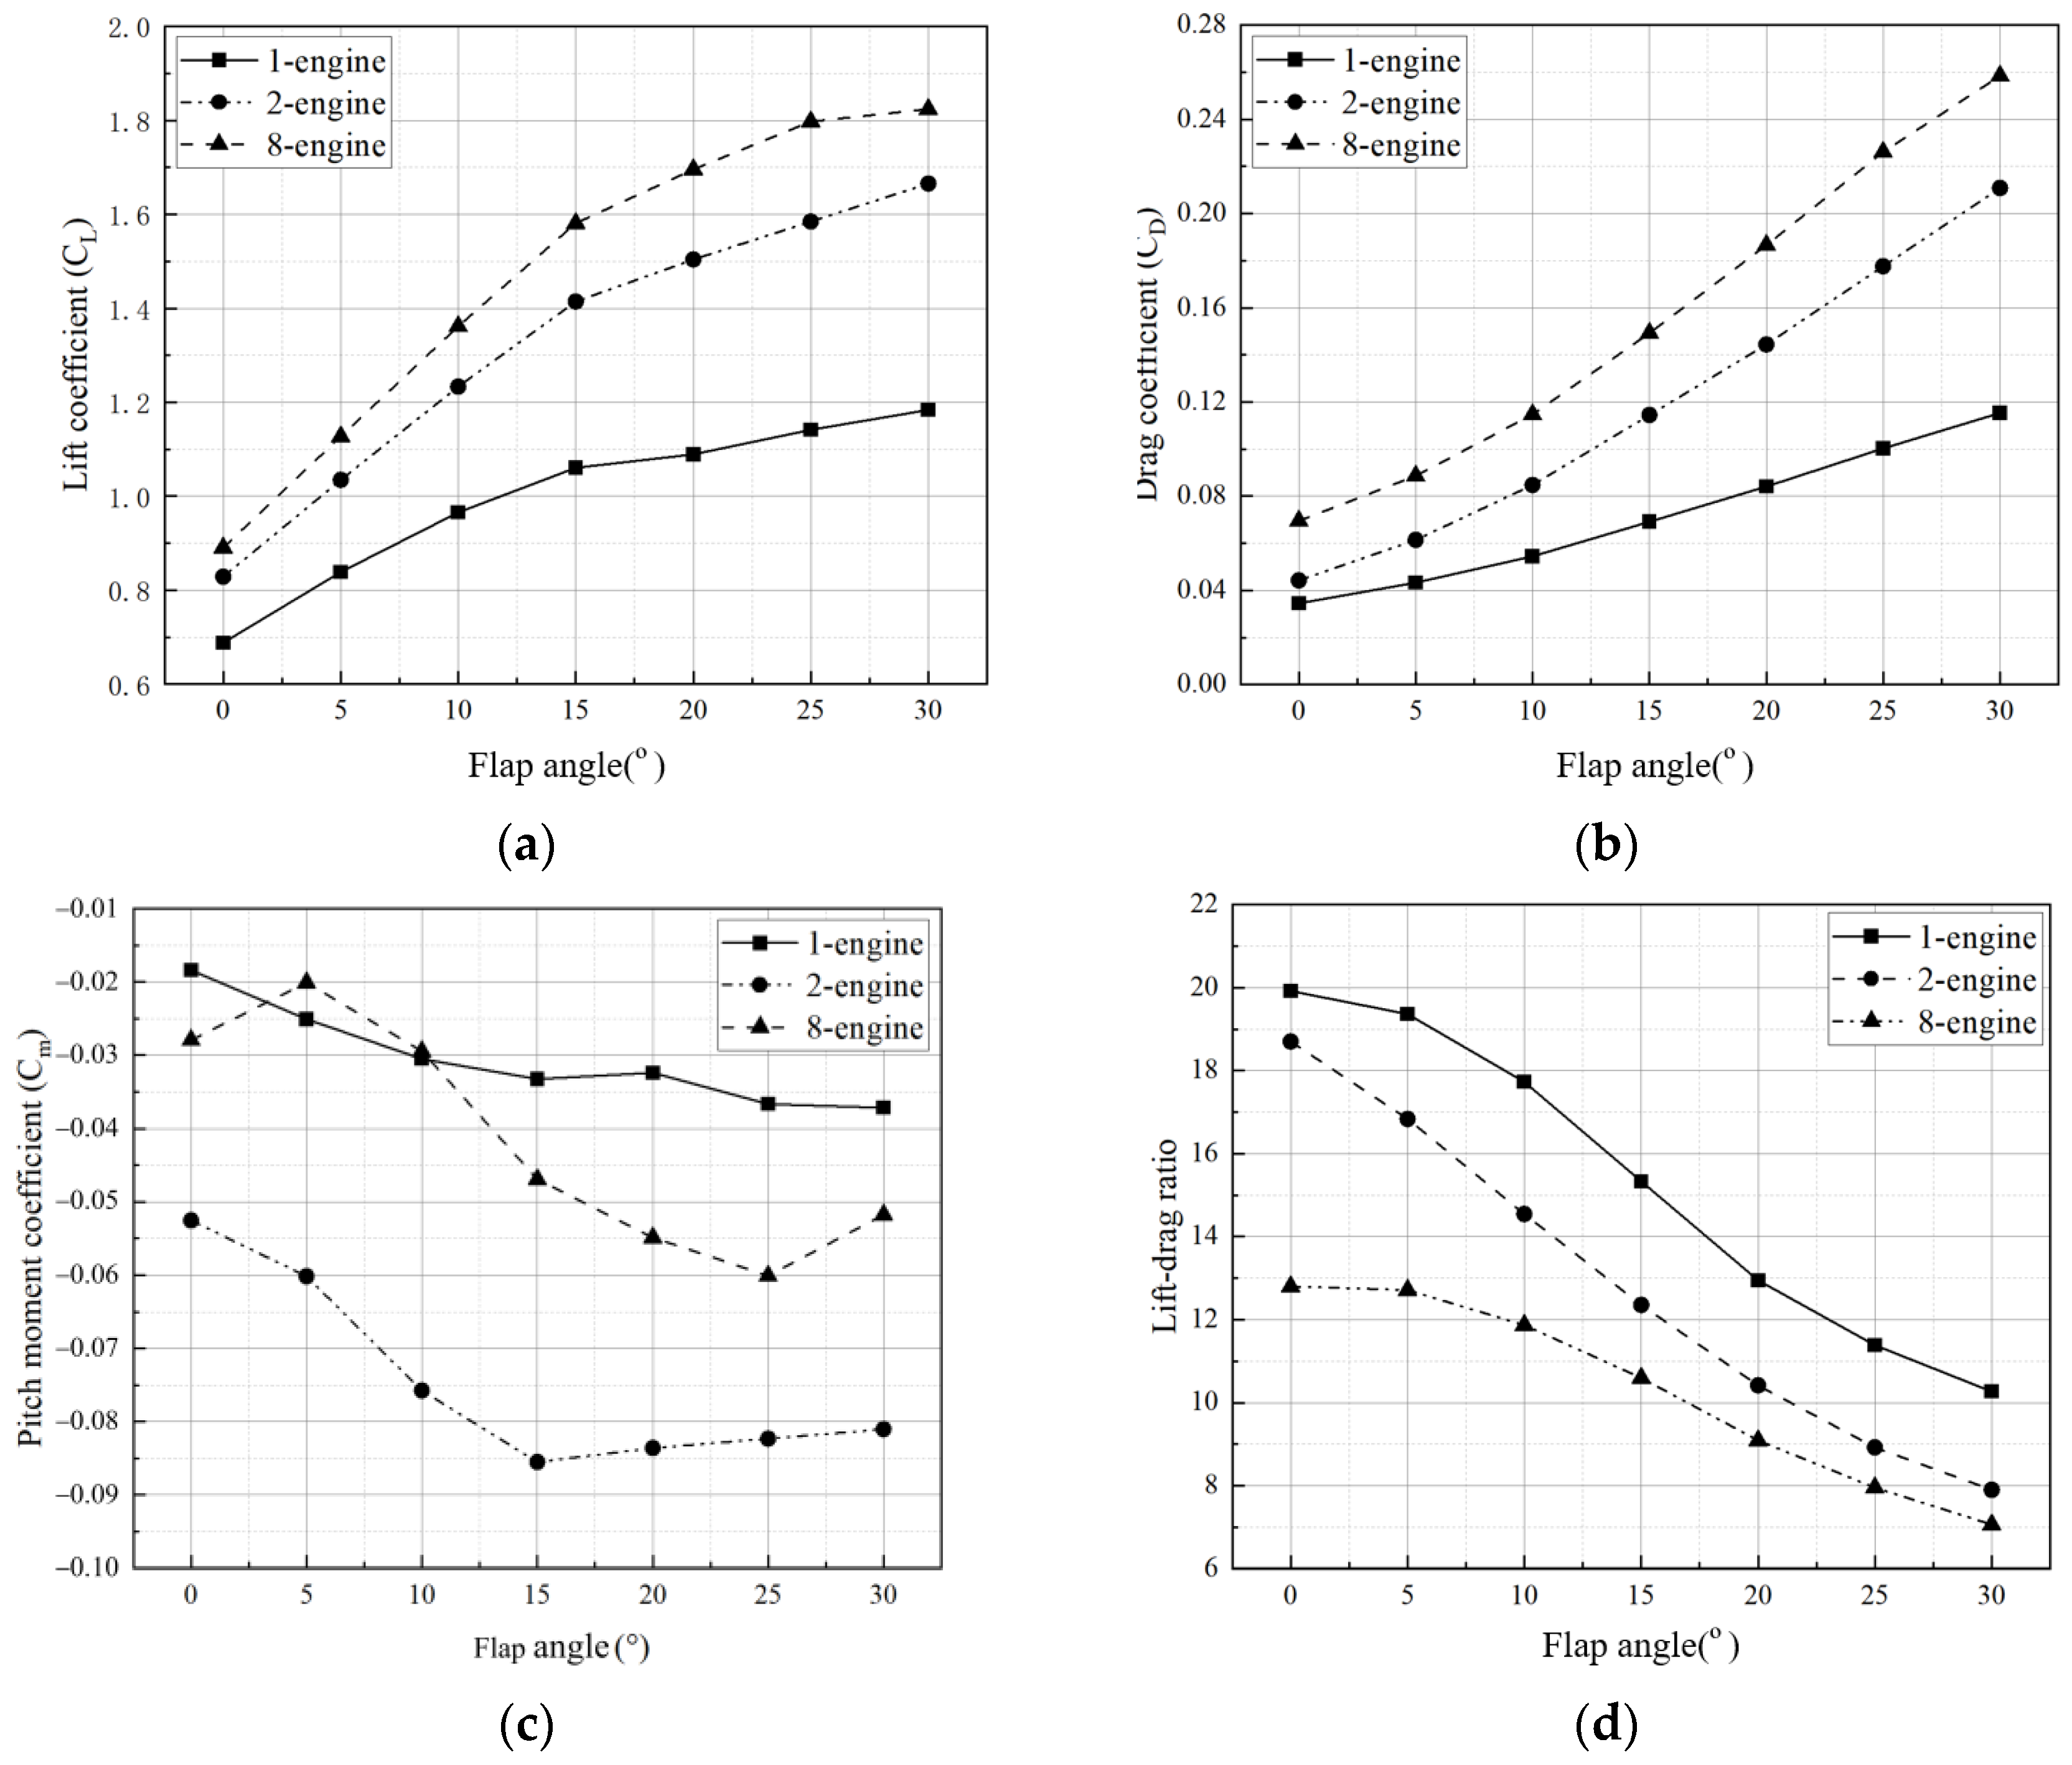
4.2.2. Lift Enhancement Influenced by DEP Arrangement
To investigate the influence of the number of propulsion units on the aerodynamic characteristics of the entire UAV, three propeller configurations of propulsion units were selected, with propulsion schematics shown in
Figure 9a. Under the principle of maintaining consistent total power output, computational conditions and parameters for different configurations were adjusted accordingly, with specific parameter values listed in
Table 4.
First, the variation characteristics of the total thrust and total power of the propulsion system with respect to the flap deflection angle for these three schemes are calculated, as shown in
Figure 15.
From the comparison results of the propulsion characteristics, as the flap deflection angle increases, the total thrust and total power of the three schemes with different numbers of propulsion units remain basically unchanged, and they meet the principle of consistent total thrust and total power.
Based on this, the computed results of the aerodynamic characteristics comparison of the UAV under different flap deflection angles for three propulsion configurations with varying numbers of units are shown in
Figure 16.
From the results, under the same flap deflection angle, the UAV’s
CL increases with the number of propulsion units. According to the data, at a 3° angle of attack and 25 flap deflection angle, the
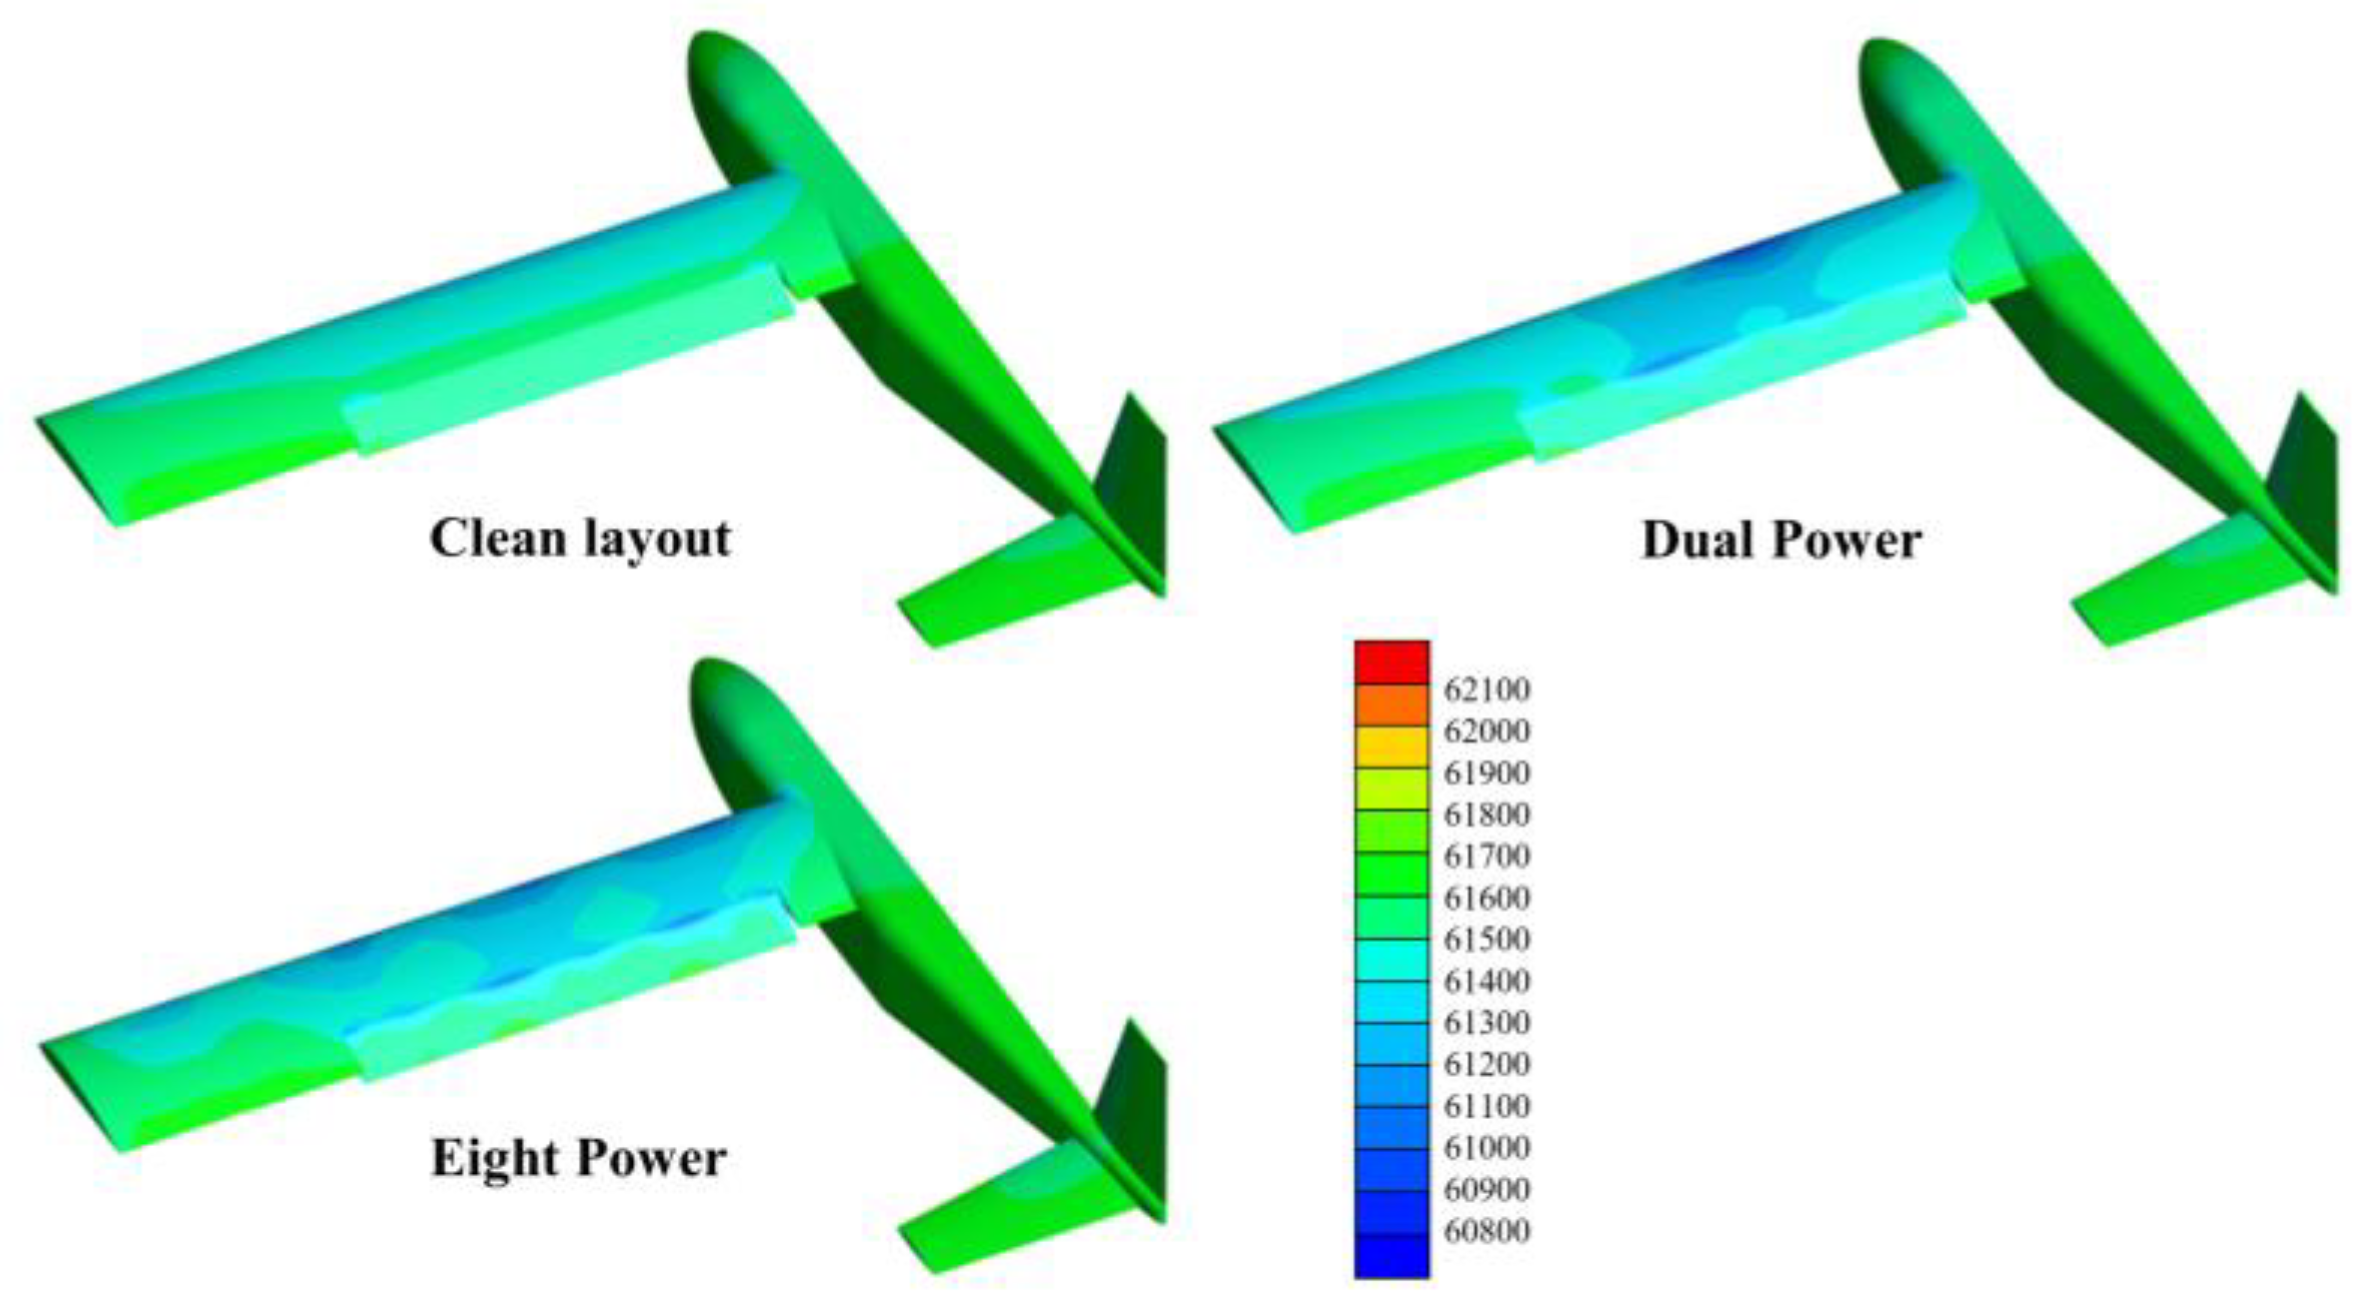
CL of the single-propeller configuration is less than 1.2, while the dual-propeller configuration reaches 1.6, and the eight-propeller configuration even achieves 1.8. This indicates that distributed propulsion significantly enhances lift. To analyze the underlying mechanism of this lift augmentation, a comparison of the wing surface pressure distributions for different configurations is provided in
Figure 17.
From the wing surface pressure distribution, it can be observed that due to the influence of distributed propulsion slipstream in the eight-propulsion configuration, propellers significantly increase the negative pressure intensity at the wing leading edge by augmenting local airflow velocity. The combined effect of multiple propeller slipstream bands creates a continuous spanwise distribution of low-pressure regions, with coverage area expanded by 42% compared to the two-propulsion layout.
Flap deflection extends the low-pressure region along the wing chord direction. Therefore, under the same flap deflection angle during takeoff, the distributed propulsion configuration exhibits higher lift, which is more favorable for the UAV’s short takeoff and landing capabilities.
In the case of the eight-propeller UAV studied in this paper, the influence range of the longitudinal moment coefficient is −0.052~−0.085. Overall, it shows a trend of increasing the head-down moment with the flap increase in the deflection angle.
The UAV adopts a all-moving horizontal stabilizer with a deflection angle range of ±10°, a control efficiency of 0.0592/°, and a maximum control moment coefficient of ±0.529. When the flap deflection angle is 15 degrees, it still has a residual control efficiency of 0.0447/°. Therefore, the variation in the pitch moment is kept within a controlled range.
However, the distributed propulsion configuration also has some disadvantages. Although it has a higher lift coefficient during the takeoff phase, it also increases drag significantly, ultimately resulting in higher power requirements during the takeoff phase. At the same time, during the cruise phase, the distributed propulsion configuration results in a lower lift-to-drag ratio. Compared with the single-propeller configuration, the maximum lift-to-drag ratio of the eight-propeller configuration is reduced by about 8%.


