Article

Preliminary Design and Optimization Approach of Electric FW-VTOL UAV Based on Cell Discharge Characteristics

1
Unmanned Aerial Vehicles Research Institute, Nanjing University of Aeronautics and Astronautics, Nanjing 210016, China
2
National Key Laboratory of Fundamental Algorithms and Models for Engineering Numerical Simulation, Sichuan University, Chengdu 610000, China
3
Aerospace System Engineering Shanghai, Shanghai Academy of Spaceflight Technology, Shanghai 201109, China
4
State Key Laboratory of Aerodynamics, China Aerodynamics Research and Development Center, Mianyang 621000, China
*
Author to whom correspondence should be addressed.
Drones 2025, 9(6), 415; https://doi.org/10.3390/drones9060415
Submission received: 11 April 2025 / Revised: 24 May 2025 / Accepted: 5 June 2025 / Published: 6 June 2025

Abstract

:
The electric vertical take-off and landing fixed-wing (FW-VTOL) unmanned aerial vehicle (UAV) combines the advantages of fixed-wing aircraft and multi-rotor aircraft. Based on the cell discharge characteristics and the power system features, this paper proposes a preliminary design and optimization method suitable for electric FW-VTOL UAVs. The purpose of this method is to improve the design accuracy of electric propulsion systems and overall parameters when dealing with the special power and energy requirements of this type of aircraft. The core of this method involves testing the performance data of the cell inside the battery pack, using small-capacity cells as the basic unit for battery sizing, thereby constructing a power battery performance model. Additionally, it establishes optimization design models for propellers and rotors and develops a brushless DC motor performance model based on a first-order motor model and statistical data, ultimately achieving optimized matching of the propulsion system and completing the preliminary design of the entire aircraft. Using a battery discharge model established based on real cell parameters and test data, the impact of the discharge process on battery performance is evaluated at the cell level, reducing the subjectivity of battery performance evaluation compared to the constant power/energy density method used in traditional battery sizing processes. Furthermore, matching the optimization design of power and propulsion systems effectively improves the accuracy of the preliminary design for FW-VTOL UAVs. A design case of a 30 kg electric FW-VTOL UAV is conducted, along with the completion of flight tests. The design parameters obtained using the proposed method show minimal discrepancies with the actual data from the actual aircraft, confirming the effectiveness of the proposed method.

1. Introduction

Combining the advantages of multi-rotor and fixed-wing (FW) unmanned aerial vehicles (UAVs), the vertical take-off and landing fixed-wing (FW-VTOL) UAV is receiving increasing attention due to its high cruising efficiency, fast cruising speed, and vertical take-off and landing (VTOL) capability [1]. Typical configurations of FW VTOL UAVs include tilt-rotor, tilt-wing, composite-wing, and tail-sitter configurations, etc. [2]. As a combination of relatively mature multi-rotor and FW technologies, while avoiding the severe aerodynamic interference and other shortcomings that exist in the tilt configuration, it makes the composite-wing VTOL UAV the most practical FW-VTOL solution at present.
Most existing FW-VTOL UAVs use lithium batteries as their only energy storage device. To obtain a long endurance, the mass of the onboard lithium battery usually accounts for a significant portion of the total takeoff mass. In the preliminary design stage, aircraft designers usually need to estimate the mass of the battery and propulsion system based on the given design requirements. High-confidence models of the battery performance and propulsion system are a guarantee of the effectiveness of the overall design, and also directly affect the flight safety and actual performance of the aircraft.
Most of the existing research on electric aircraft design estimates the battery weight based on battery energy constraints. The simplest and most common approach is to use a constant battery energy density method [3,4]. The method is particularly suitable for battery mass estimation in conceptual aircraft design using unknown future battery technologies [5], or for providing a rough battery mass estimate for traditional FW or multi-rotor aircraft [6,7]. The selected constant energy density value usually corresponds to a given discharge current [8]. Once the practical discharge current deviates too much from that current, the constant energy density method becomes less accurate. Some design processes have attempted to take into account the effect of discharge current on capacity, such as by adopting a constant or variable capacity offset [9,10,11] or using the Peukert equation [12,13,14,15]. However, the reliability of these methods is highly dependent on the selected empirical coefficients, and these empirical coefficients are also valid only over a limited working range with constant discharge current [16]. These drawbacks hinder their direct application in the design process of electric FW-VTOL UAVs since the battery discharge currents in FW and VTOL modes are significantly different.
Relative to the battery energy requirement, the maximum power requirement of the battery pack was neglected in most FW UAV design processes since the maximum power requirement of FW UAV is relatively limited. Even in the few studies considering the maximum power constraints, the maximum power constraint is only handled by a simple constant power density method [17,18]. In fact, as the discharge proceeds, the battery state of charge (SoC) keeps decreasing, and the battery power density decreases continuously [19]. The impact of battery SoC on the battery maximum discharge power is neglected in the FW UAV battery selection process since the high-power flight stage (e.g., takeoff) always occurs within the high battery SoC range, but for FW-VTOL UAVs, high maximum power discharges may occur in the low battery SoC range, where the battery’s maximum power discharging capability is relatively weak. Therefore, both the maximum power constraint and the SoC impact on battery maximum discharge power are not negligible.
In addition, the FW-VTOL UAV has two sets of power systems: a rotor and a propeller. The matching design and efficiency of the power components, such as the motor and propeller, also directly affect the flight efficiency. Currently, the efficiency of the propulsion system is mainly estimated by experience or analyzed on the basis of simplified models and empirical formulas [20]. The power requirements of the FW-VTOL UAV vary greatly in different modes, which may result in large errors. Thus, the design process must also comprehensively consider the impact of matching the propulsion system and battery performance.
In summary, although a large number of studies have considered battery performance in the overall design phase of electric aircraft, few of them have explored and investigated the impact of the specific power and energy requirements, and propulsion system efficiency of FW-VTOL UAV on battery performance to improve the effectiveness of the overall design. The main reason for this situation is that the limited battery information in the early design stage is only affordable to establish a rough battery performance evaluation method from a macro perspective (e.g., a constant power density or energy density). There are indeed some equivalent circuit battery models that can be applied to simulate the specific discharge process [21,22], but the parameters of the corresponding model cannot be given directly in the overall phase due to the undetermined battery pack.
To improve the accuracy of the preliminary design of the electric FW-VTOL UAV, the battery performance model is constructed directly using the small-capacity cell inside the battery pack as the basic unit. The impact of the discharge process on battery performance (e.g., power-energy effect and the SoC impact on maximum design power) is evaluated at the cell level using cell discharge models derived from real cell parameters and test data. Then, the propeller/rotor optimization design model is built and the brushless direct current (BLDC) motor performance model is established based on the first-order motor model and statistical data to complete the matching optimization of the electric propulsion system. And finally, the overall design framework applicable to electric FW-VTOL UAVs is established, which reduces the subjectivity of the overall design and improves the accuracy of the design results. A 30 kg electric FW-VTOL UAV was designed using the proposed method and compared with the actual manufactured aircraft data, which verified the method’s effectiveness.
This paper is organized as follows. In Section 2, power and energy demand analysis of electric FW-VTOL UAVs in different modes is performed. The battery performance model, considering discharge characteristics, is constructed based on the cell test data in Section 3. The BLDC motor performance and propeller/rotor optimization models are given in Section 4. In Section 5, the comprehensive preliminary design and optimization framework of the electric FW-VTOL UAV is established. The case study and result analysis are then shown in Section 6, in which the method is applied to the design of a 30 kg electric FW-VTOL UAV. Conclusions are given in Section 7.

2. Multimodal Power and Energy Demand Analysis

Hybrid FW-VTOL UAVs usually have two power systems responsible for vertical flight and horizontal flight, respectively, as shown in Figure 1. A typical flight profile of the FW-VTOL UAV contains vertical flight mode, transition mode, and horizontal flight mode. Battery power and energy demand analysis is mainly performed in these several modes.

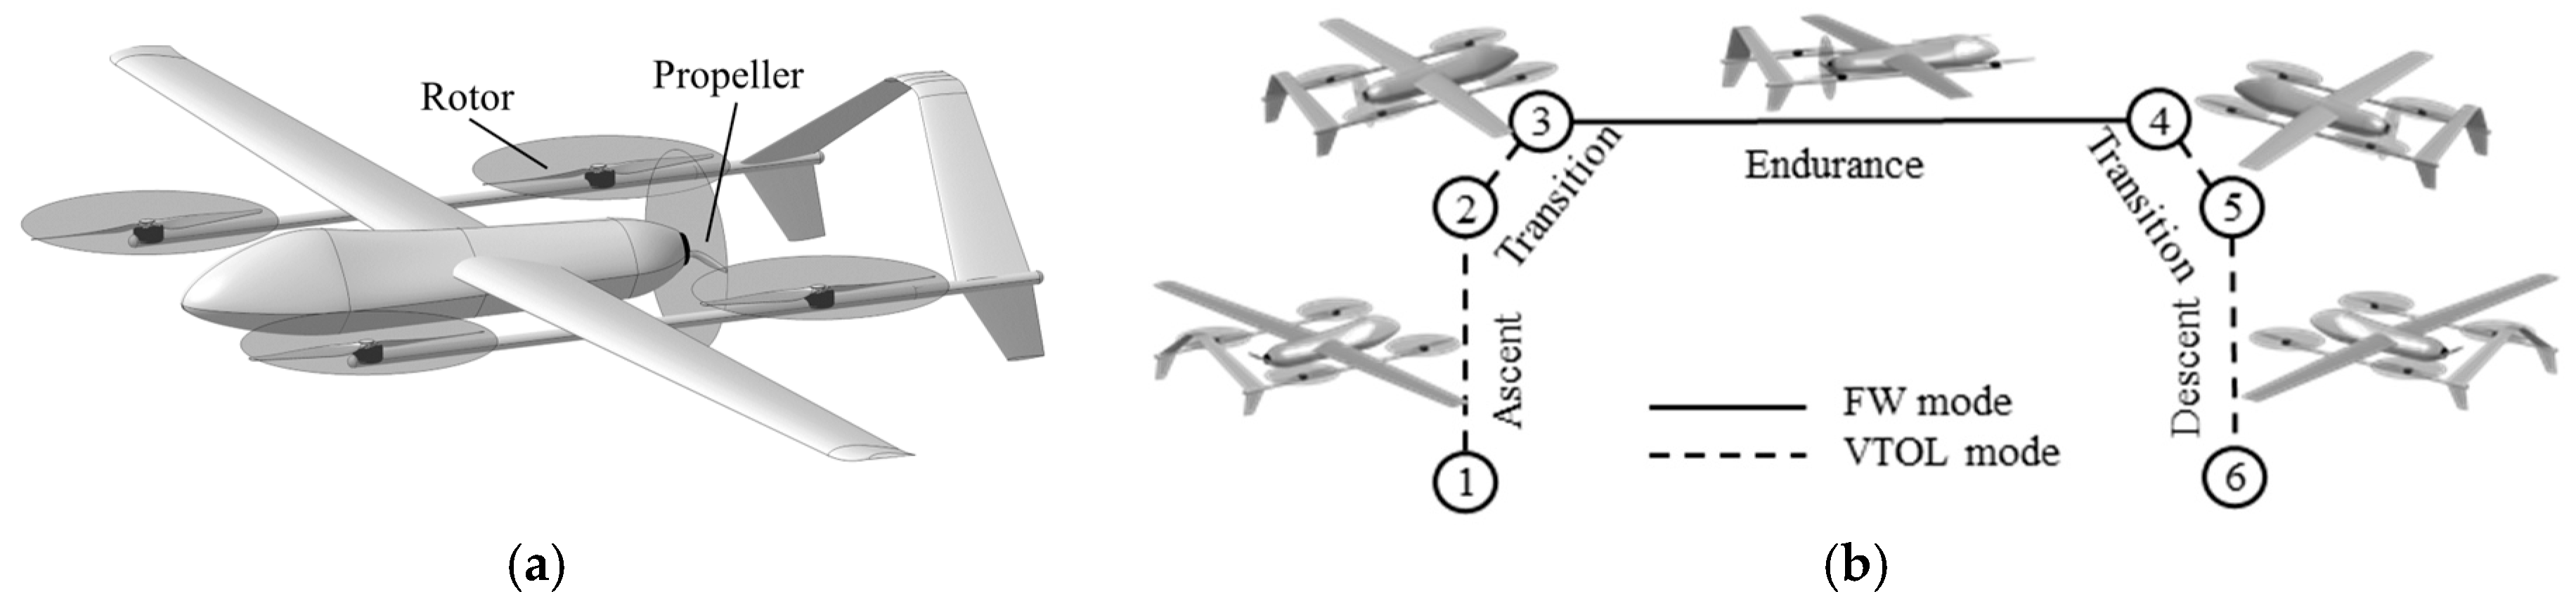
2.1. Power and Energy Requirements in FW Mode

The calculation of the power and energy requirements in FW mode borrowed some from the conventional constraint analysis method applied for FW UAV [19,23]. The aerodynamics in FW mode is estimated by the parabolic drag model. The main conditions to be considered are cruise, climb, ceil, and maximum speed. In this case, the battery power required for FW flights is calculated by
P FW , B = M TO η P η m V g q C D 0 W / S + κ q W S + d d t h + V 2 2 g
where PFW,B is the battery power requirement in FW mode, W/S is the wing loading, kg/(m·s2), CD0 is the zero-lift drag coefficient, h is the flight altitude; ηP is the propeller efficiency, ηm is the motor efficiency, V is the flight speed, q is the dynamic pressure, kg/(m·s2), g is the gravitational acceleration, and MTO is the total FW-VTOL UAV mass. κ is the lift-induced drag coefficient calculated using κ = 1/(πe·AR). Here, e is Oswald’s span efficiency factor, and AR is the wing aspect ratio [24]. dh/dt is the climb rate. During cruising and maximum speed flight, dh/dt = 0. The dh/dt during constant speed climb can be expressed as:
d h d t = η P η m P W 1.24 ρ 0.5 C L 1.5 / C D W S 0.5
where P/W is the power load, m/s, ρ is the air density, and CL, CD are the lift and drag coefficients, respectively. Benefiting from the VTOL power system, the FW-VTOL UAV is free from the limitations of takeoff distance and landing distance in the FW mode constraint analysis, but it still needs to take into account the stall speed limitation constraints since the stall speed determines the end-state speed in transition mode, which significantly affects the safety and power consumption. The stall speed limit for the wing load is W/S ≤ qstallCLmax, where qstall is the stall state dynamic pressure, CLmax is the maximum lift coefficient. Together, these flight constraints constitute the design feasible domain for FW-VTOL UAVs in FW mode, in which the design wing load W/S and power load P/W in FW mode can be selected by combining the size, weight, and power consumption requirements.
The battery energy requirement can be obtained by integrating the battery power over time. Thus, the battery energy requirement in FW mode EFW,B is
E FW , B = P FW , B t FW
where tFW is the FW flight time in design requirements.

2.2. Power and Energy Requirements in VTOL Mode

The VTOL mode includes hovering, vertical ascent, and descent conditions, and the calculation of battery power and energy requirement is based on the rotor momentum theory [24,25]. The battery power requirement for VTOL flights is calculated by
P VTOL , B = 1 η R η m T VTOL 2 F M d h d t 2 + 2 T VTOL ρ N R S R d h d t
where PVTOL,B is the battery power requirement in VTOL mode, ηR is the rotor efficiency, NR is the number of rotors. FM is the rotor utilization factor [19] estimated using FM = 0.4742 (TVTOL/NR) 0.0793. Here, SR is the rotor paddle disk area. TVTOL is the thrust requirement in VTOL mode, which can be obtained by
T VTOL = M T O g 1 + 1 2 W / S ρ d h d t 2 C D , VTOL
where CD, VTOL is the drag coefficient in VTOL mode. The VTOL mode consists mainly of ascent and descent phases, and the battery energy requirement in VTOL mode EVTOL,B is
E VTOL , B = δ s P VTOL , B Asc t Asc + P VTOL , B Desc t Desc
where P V T O L , B A s c and P V T O L , B D e s c are the battery power requirements for the vertical ascent and descent, respectively, which can be solved by Equation (4). tAsc and tDesc are the ascent and descent durations, respectively, which can be obtained based on the transition altitude and climb rate. δs is the safety margin coefficient assigned to VTOL ascent/descent. Based on the flying experience, a safety margin of 5 is selected during the energy-solving process in VTOL mode.

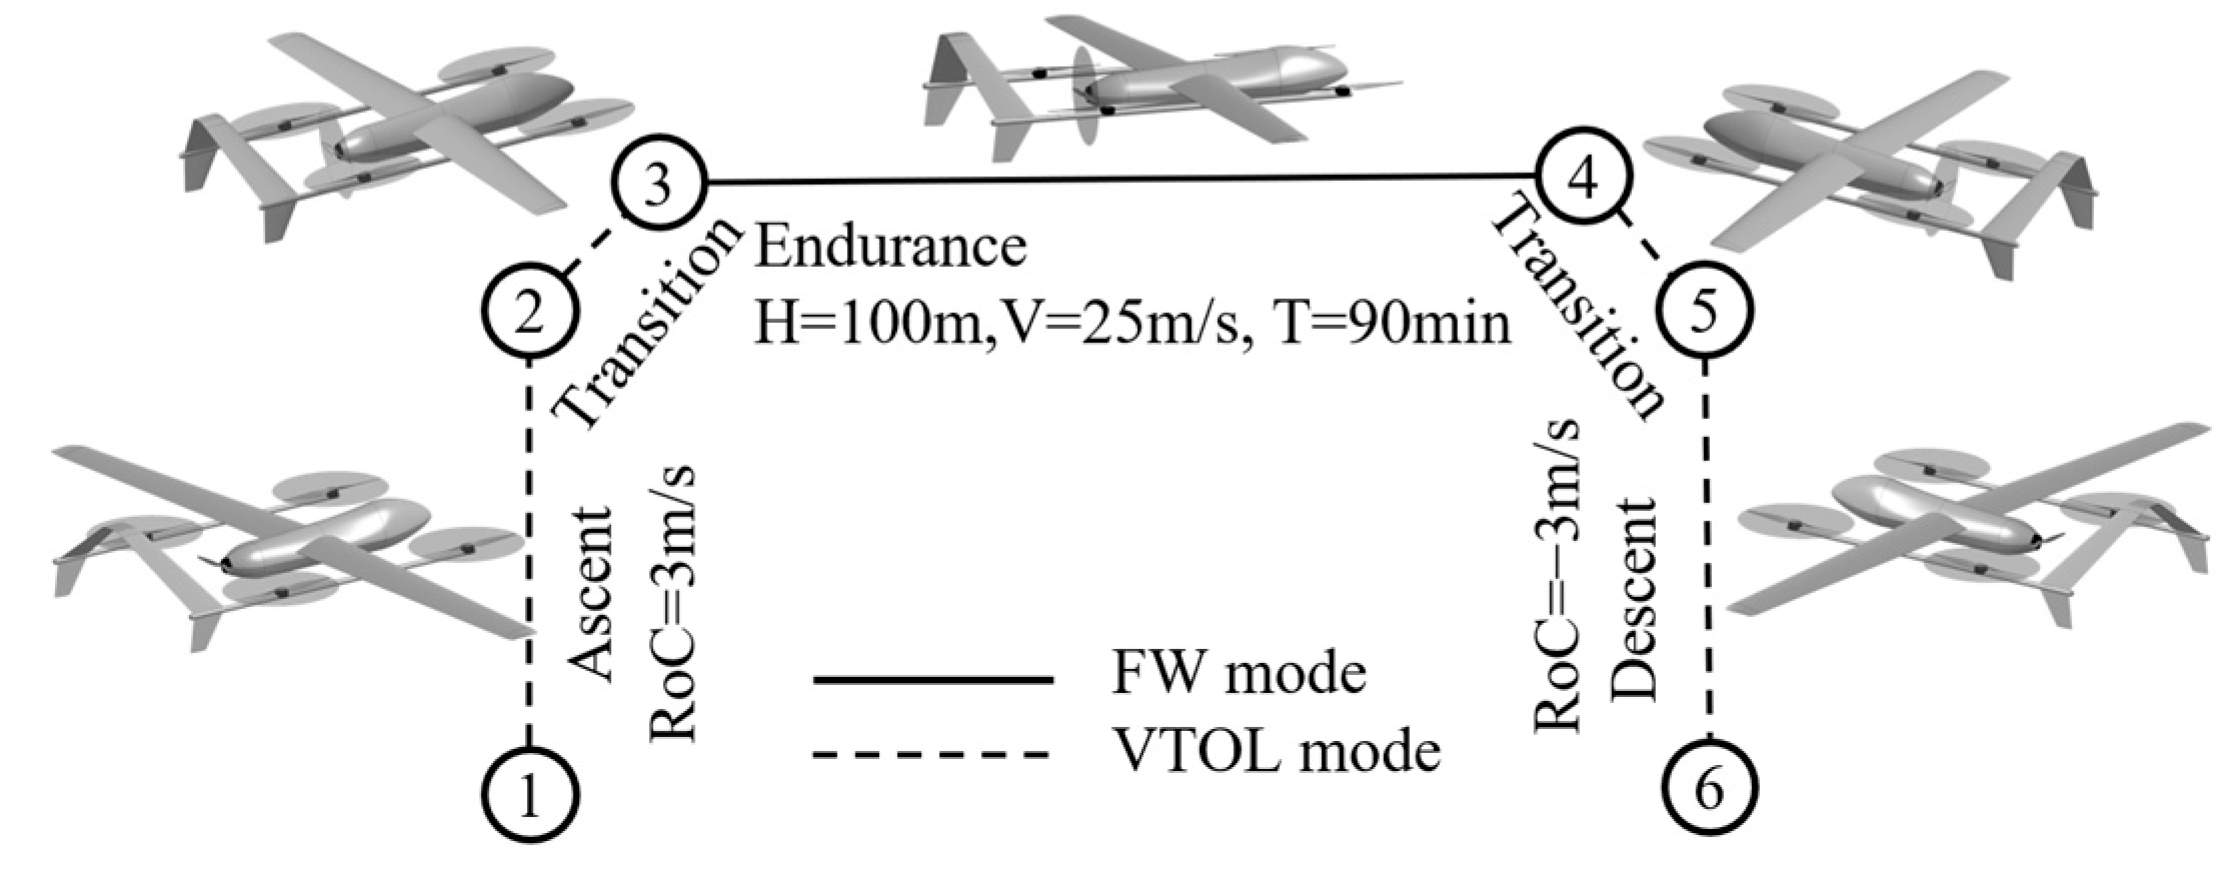
2.3. Power and Energy Requirements in Transition Mode

The calculation of battery power demand during transition flight is much more complicated, which not only depends on aircraft parameters but also on the transition strategy. The detailed calculation of the battery power required for the transition flight can be found in [26]. However, to provide a general description of transition power demand, this research adopts an approximate approach. This approach is based on the conclusion that the transition flight of FW-VTOL UAVs can be carried out safely with a maximum static thrust-to-weight ratio of 1.2–1.5 [27,28]. Thus, the power required for transition flight PTran,B is approximated by the power required to produce a static thrust of 1.2–1.5 times the total weight as follows:
P Tran , B = 1 2 δ T M TO g F M 2 δ T M TO g ρ N R S R 1 η R η m
where δT is the static thrust coefficient selected between 1.2 and 1.5, according to the design requirements. The transition mode consists of two phases: vertical to horizontal and horizontal to vertical. The total battery energy requirement in transition mode ETrans,B is
E Tran , B = 2 δ s P Tran , B t Tran
where tTran is the duration of the transition flight. In a typical flight mission of a FW-VTOL UAV, the transition flight lasts only a few seconds. The energy consumed during transition flight is rather limited compared to the energy consumed during VTOL ascent/descent.

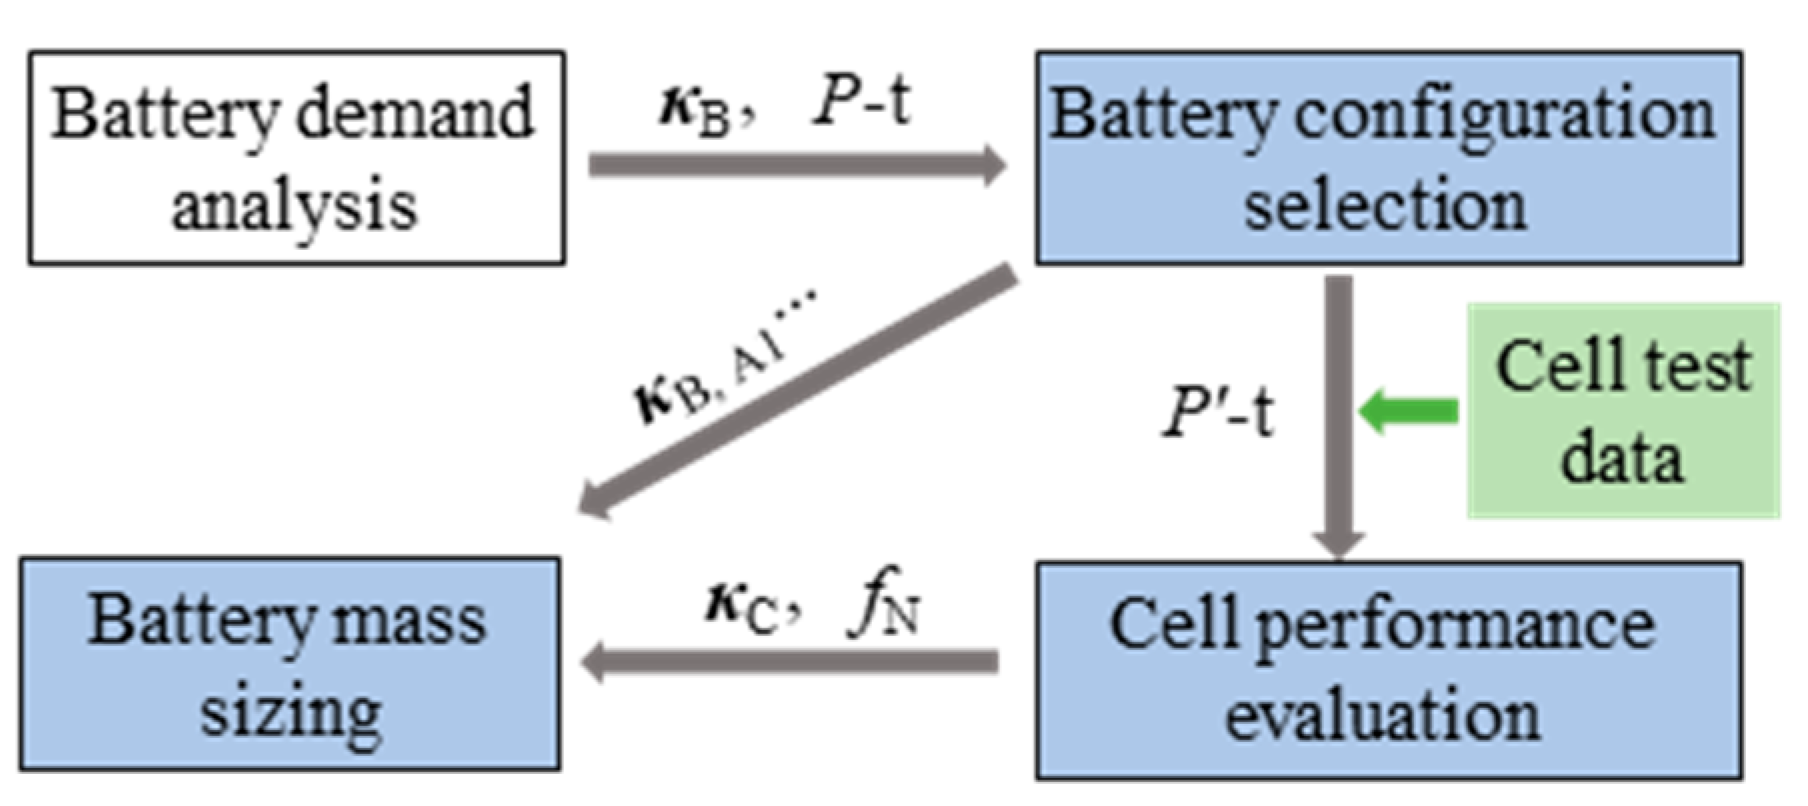
3. Power Battery Performance Model

FW-VTOL UAVs have high battery-sustained discharge power during the vertical and transition flight phases. In the battery sizing process, multiple limitations of power, energy, and rated voltage should be considered. Using the small-capacity cells inside the battery pack as the basic battery selection unit, the aircraft design requirements are first translated into the number of small-capacity cells during the analysis process, after which the total battery mass MB is obtained. The core equation of the cell-based battery sizing method is
M B = ξ M C f N κ B , κ C
where ξ is the mass increase coefficient due to battery interconnections, accessories, and battery packaging, and MC is the cell mass taken from the datasheet. The value of ξ varies slightly for batteries with different brands and capacities. Here, the weights of 10 different capacity batteries based on the Panasonic 18650 cell are calculated and fitted, and the final value is taken as 1.2. κB = [PB,max, EB, UB] is the battery demand collection, where PB,max, EB, and UB represent the maximum battery power, energy, and rated voltage demand, respectively. κC = [PC,max, EC,max, UC] is the cell performance collection, where PC,max, EC,max, and UC represent cell maximum design power, cell maximum available energy, and cell rated voltage, respectively. fN is the function that converts κB and κC into the total number of internal cells.
Therefore, the battery sizing process is to first solve battery demand κB according to aircraft design requirements and battery configuration. Next, evaluate the cell performance κC considering the discharge characteristics, solve the total cell number under the triple constraints of power, energy, and rated voltage, and finally obtain the total battery mass MB, as shown in Figure 2.

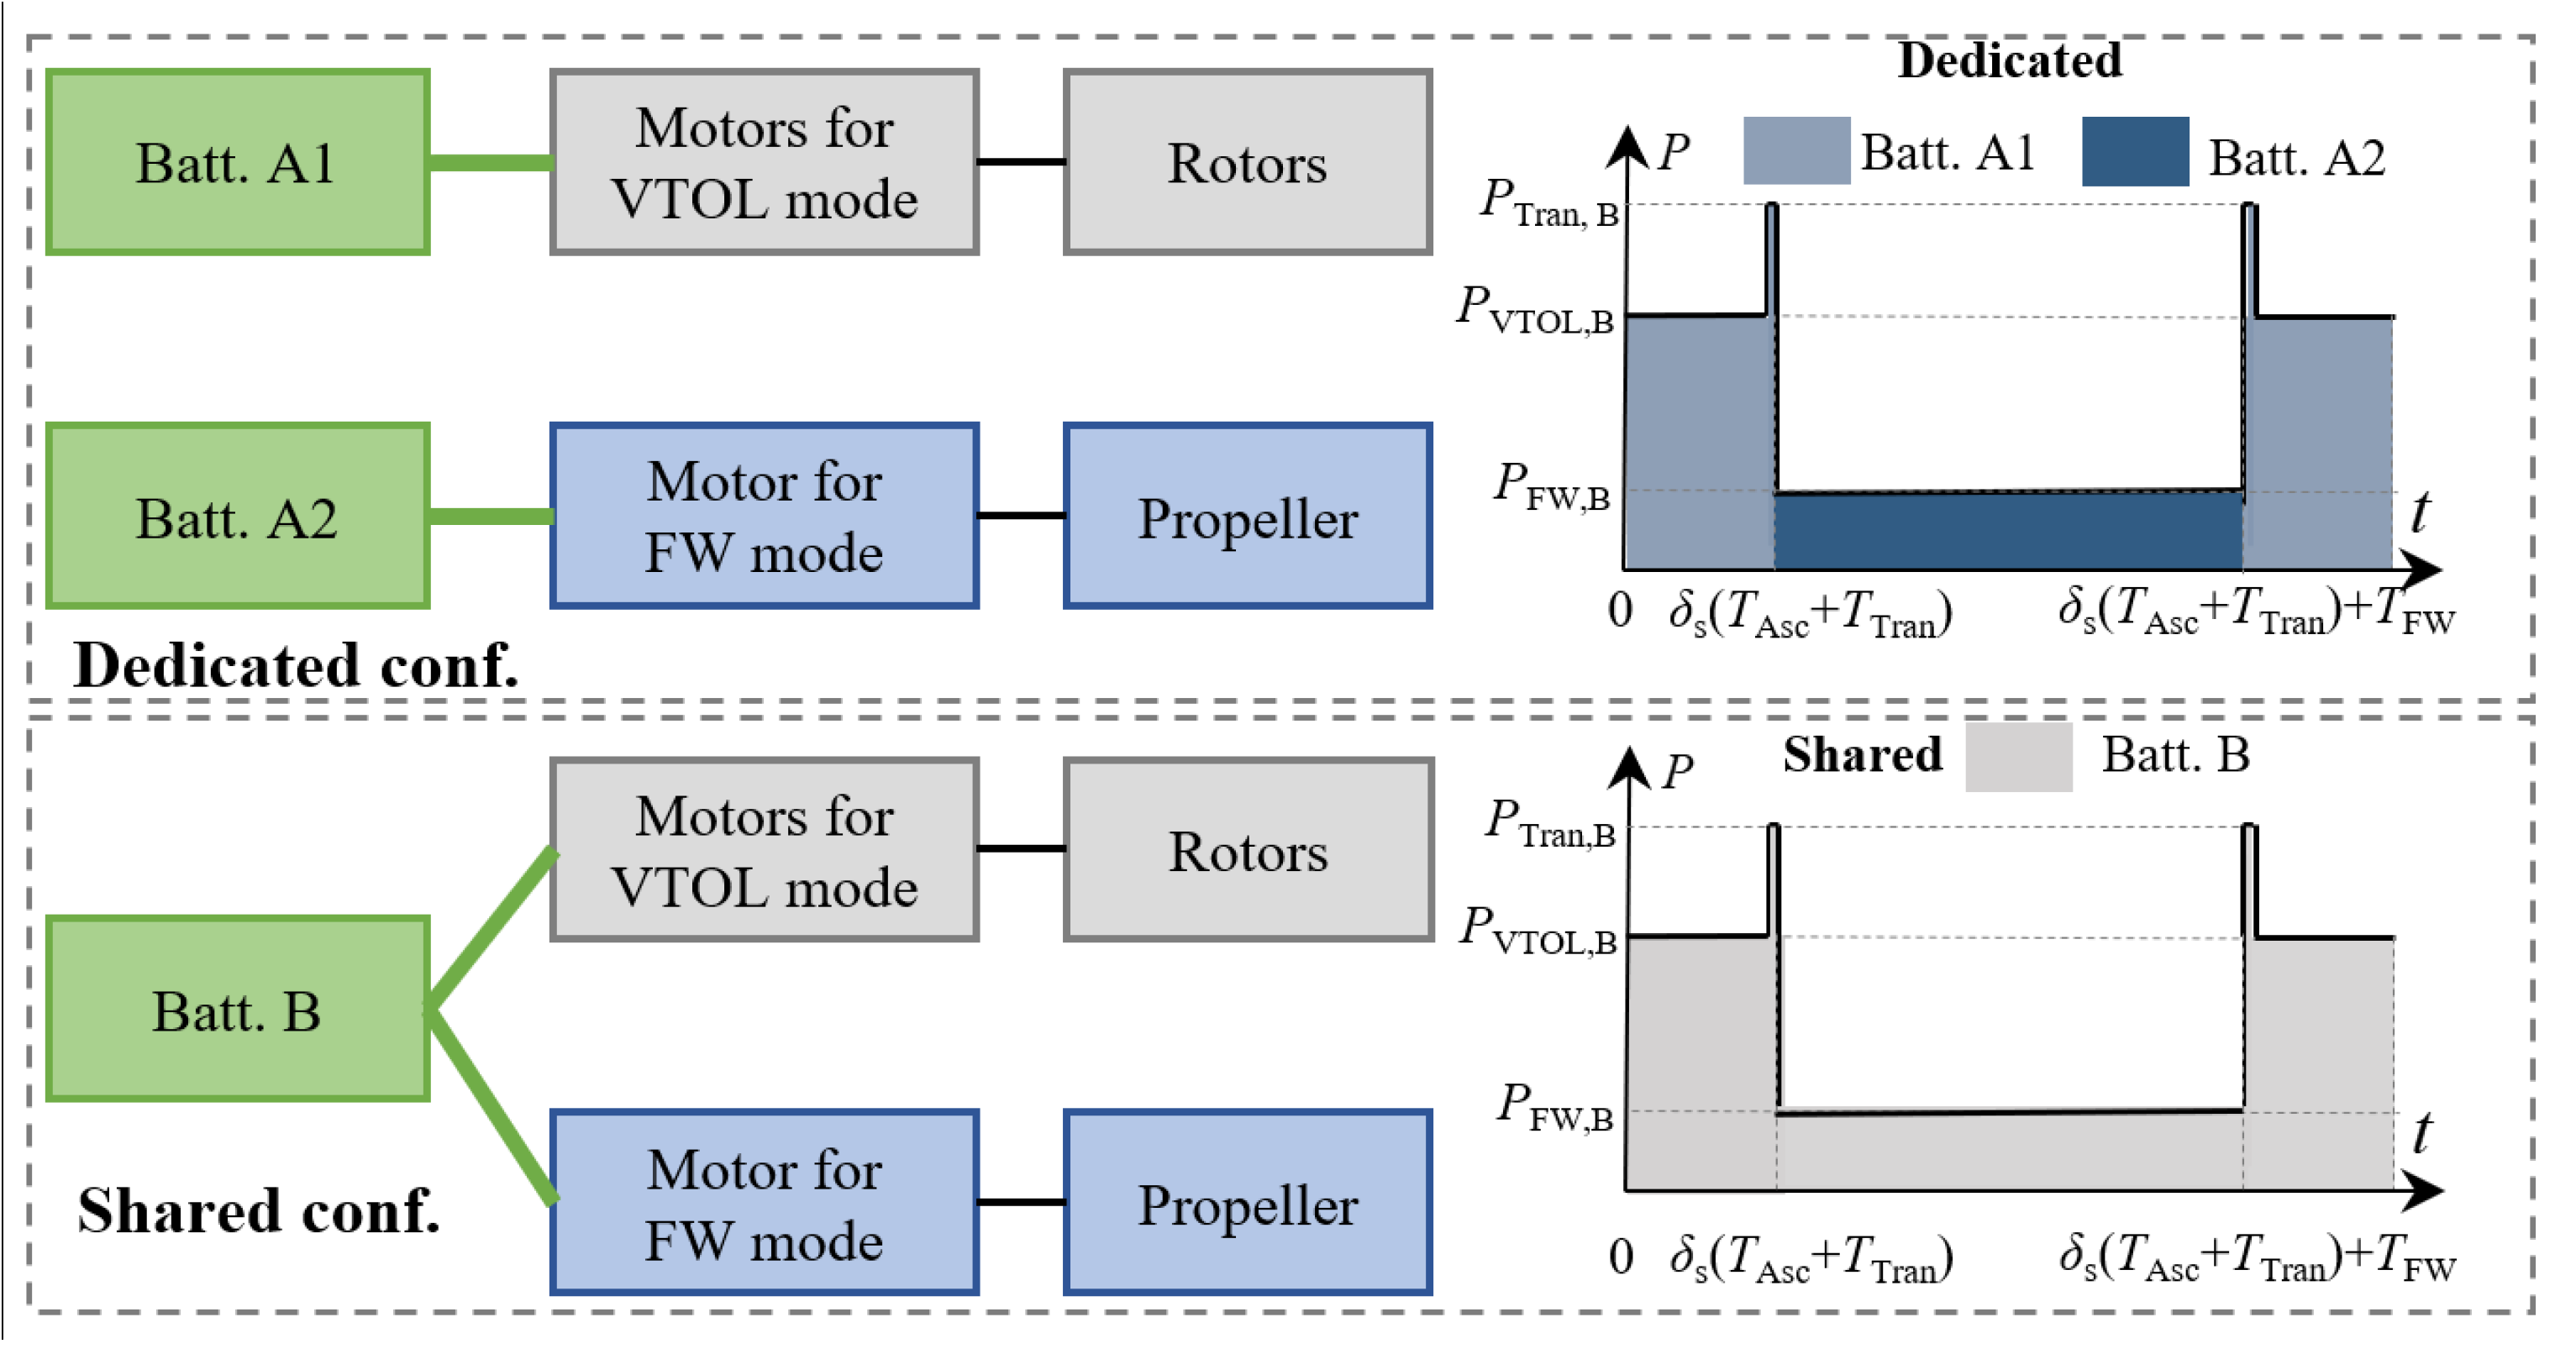
3.1. Battery Configuration Selection

The electric FW-VTOL UAV contains two power forms: rotors for VTOL and propellers for FW flights. Compared to the battery demand of traditional FW UAVs or multi-rotors, the electric FW-VTOL UAV shows some special characteristics: The battery power demand in FW mode and VTOL mode is significantly distinct, but the energy reserved for these two flight modes is of the same order of magnitude. Therefore, the battery performance of FW-VTOL UAVs cannot be approximated in a single flight state as in conventional FW UAV or multi-rotor battery sizing processes. Instead, it should consider the different power supply modes in the different modes. The battery packs equipped with electric FW-VTOL UAVs can be constructed in two configurations: dedicated configuration and shared configuration. The dedicated configuration uses one battery pack (Battery Pack A1) to drive the rotors and another (Battery Pack A2) to drive the propeller, while the shared configuration uses a single battery pack (Battery Pack B) to operate throughout the flight. The two battery configurations have significantly different discharge processes throughout the mission, as shown in Figure 3, which may have a significant impact on the actual battery performance.
Different battery configurations have different requirements, the battery demand collection of dedicated battery pack A1 κB,A1 = [PTran,B, EVTOL,B + ETran,B, UB], the battery demand collection of dedicated battery pack A2 κB,A2 = [PFW,B, EFW,B, UB], and the battery demand collection of shared battery pack B κB,B = [PTran,B, EVTOL,B + ETrans,B + EFW,B, UB].

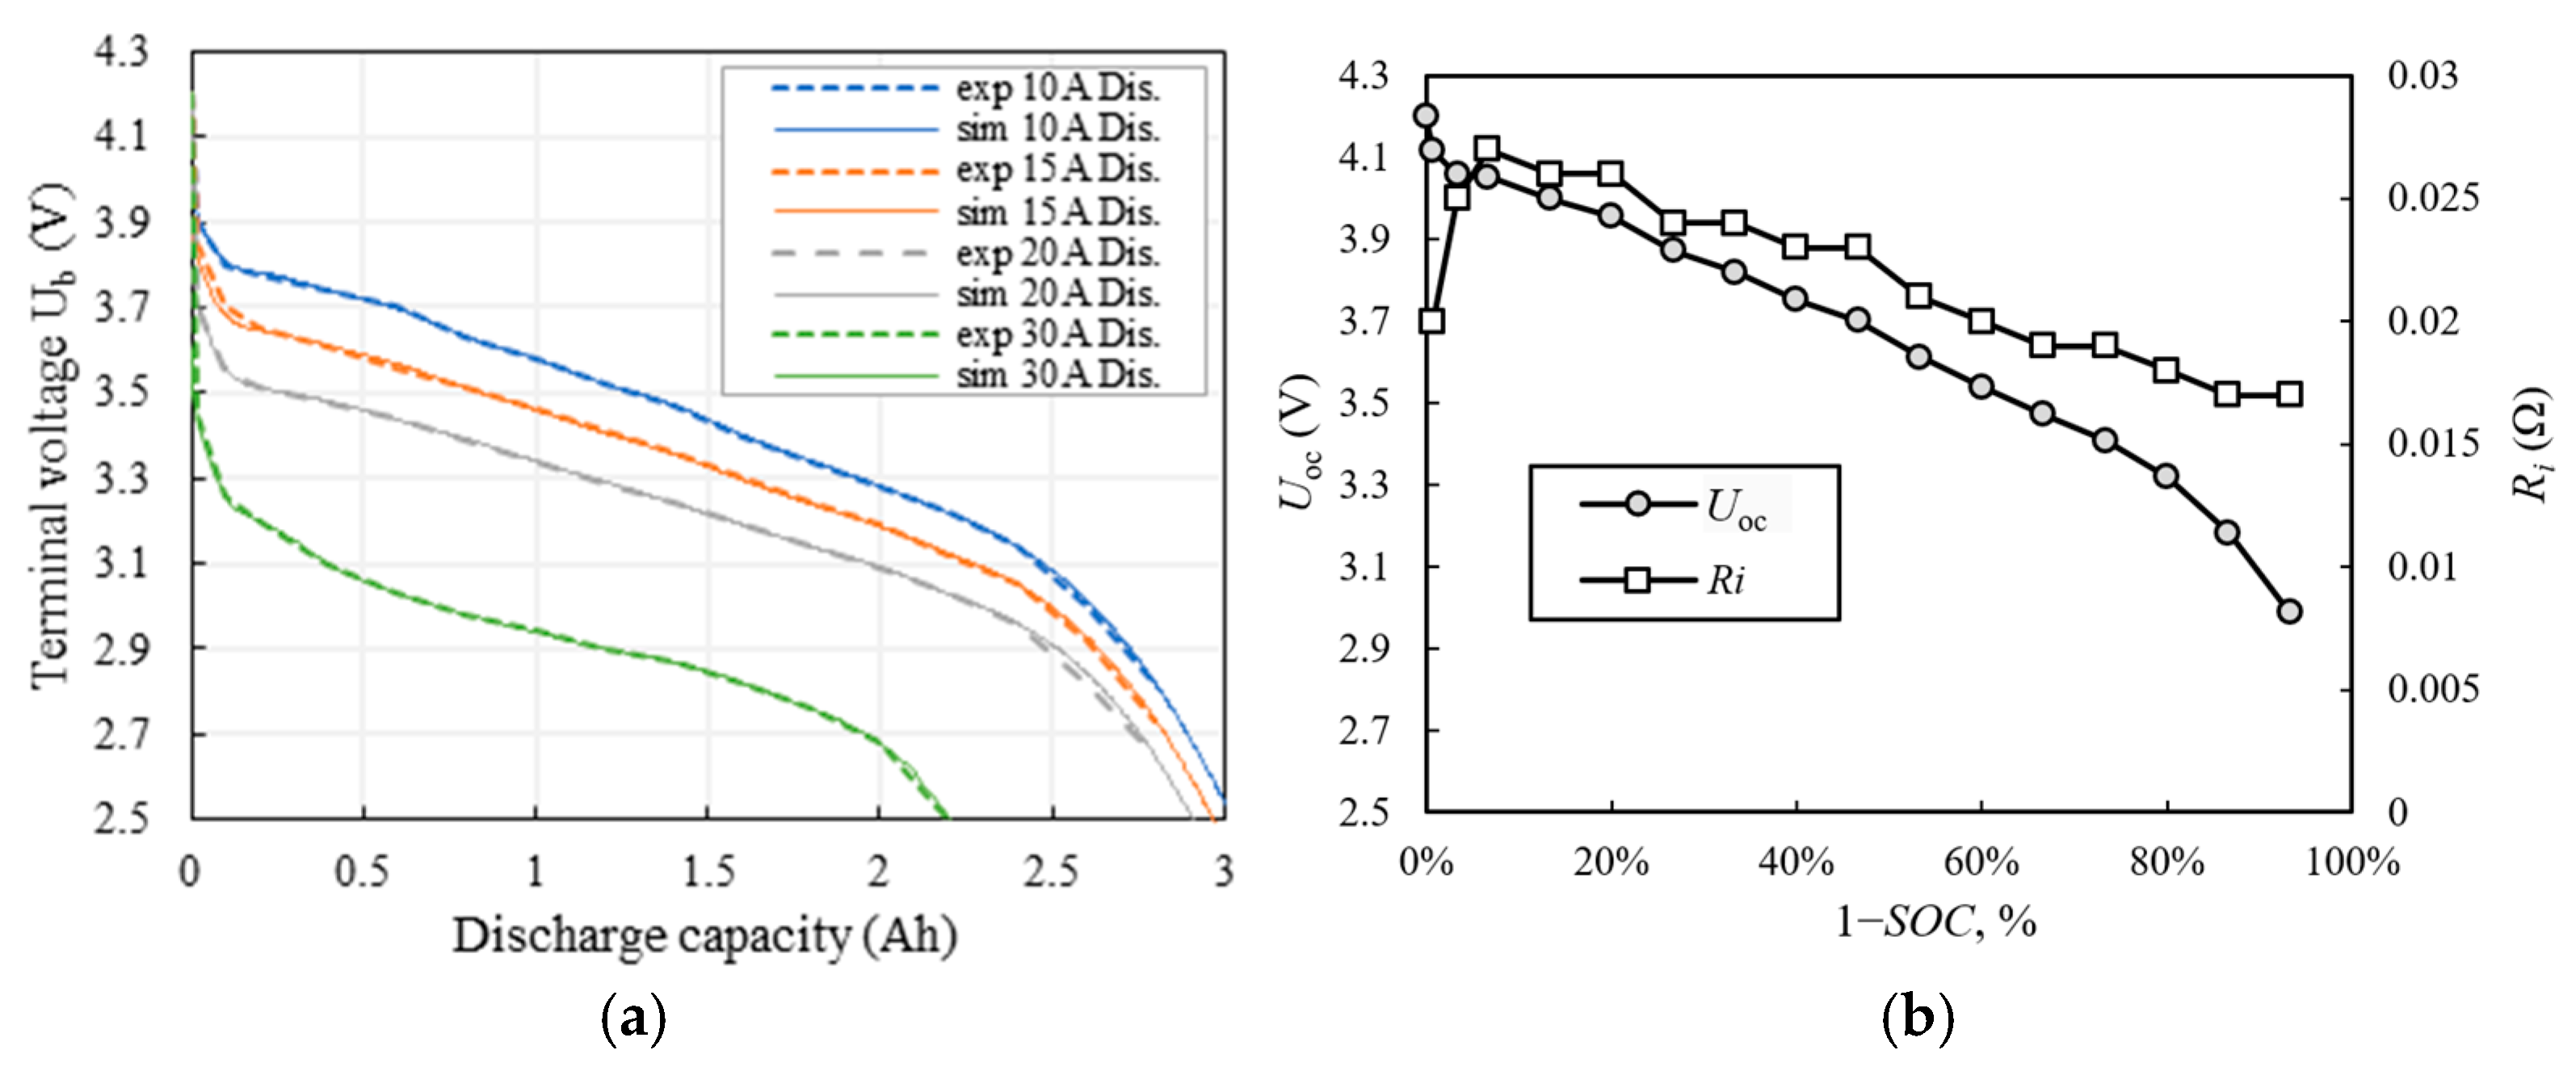
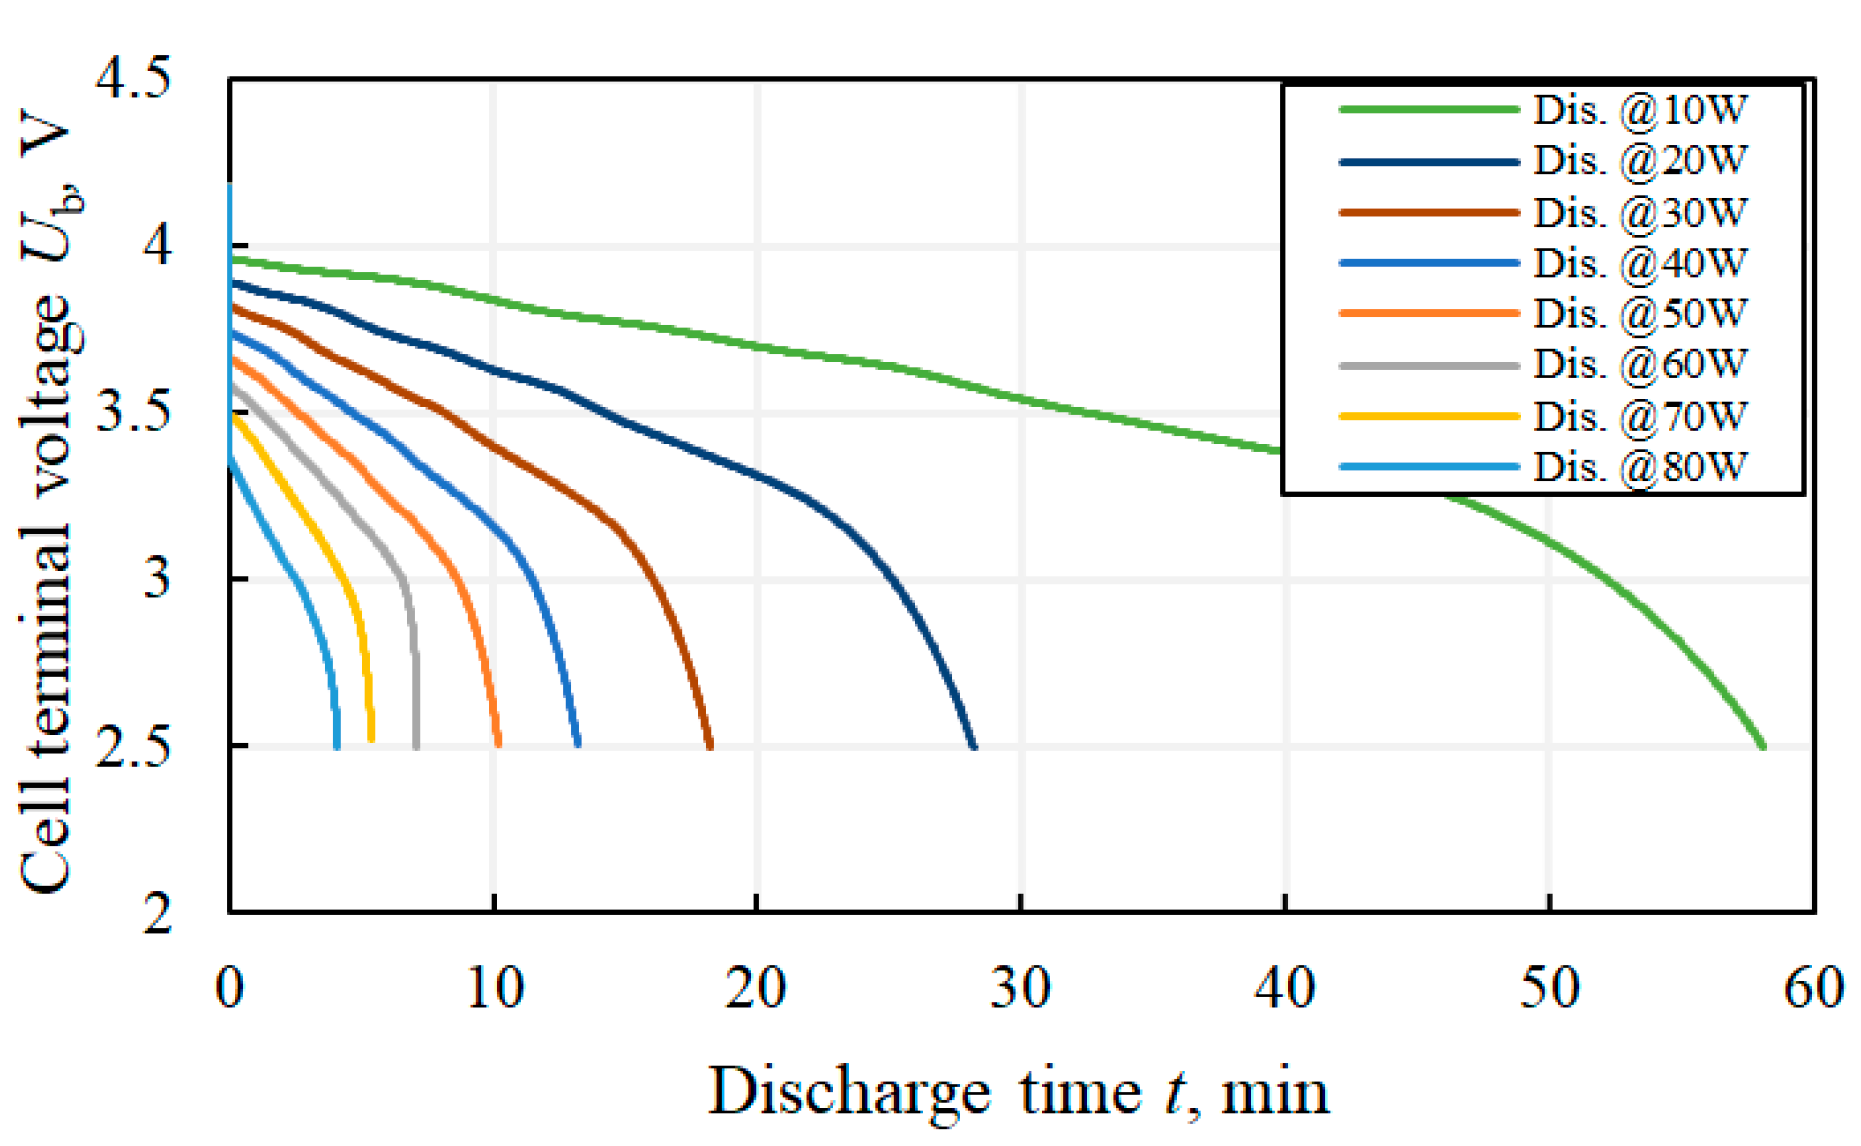
3.2. Cell Performance Assessment

UAV batteries usually require a higher discharge rate, so lithium polymer (LiPo) is often used. The performance of the small-capacity cell inside the battery pack is estimated by the cell performance assessment approach described in this section according to the practical discharge process. The rated voltage of the small-capacity cell is determined by the electrode material, so the cell performance assessment only focuses on solving the cell maximum design power PC,max and cell maximum available energy EC,max in the cell performance collection κC.
To perform the cell performance analysis, the practical discharge process of the cell needs to be simulated to obtain the necessary runtime data, such as cell SoC and terminal voltage. The variation in cell SoC is calculated by the Coulomb counting method [29]:
S O C = S O C 0 0 t i t Q C d t
where SOC0 is the initial SoC, i is the discharge current, and QC is the cell-rated capacity. The terminal voltage Ub is calculated by the simplified equivalent circuit model [30]:
U b t = U oc S O C R i S O C i t
where Uoc is the open-circuit voltage and Ri is the internal resistance. Both Uoc and Ri vary with cell SOC, which can be estimated by linearly fitting the test data of terminal voltage Ub and current i under each SOC. To ensure the validity of the cell discharging model, the test data of a certain 18650 cell (parameters shown in Table 1) are compared with the model. By fully discharging charged cells at constant currents (10 A, 15 A, 20 A, 30 A), recording the changes in terminal voltage at different times, and stopping at a cut-off voltage of 2.5 V, the curves of terminal voltage changes are fitted with discharge capacity at different discharge rates. The results and the variation in open-circuit voltage Uoc and internal resistance Ri with the remaining SOC value are shown in Figure 4. It can be observed that between the battery discharge–charge below 5% and between about 80% and 100%, the voltage variation amplitude is large, and the discharge curve shows strong nonlinearity.
In practical use, the discharge at a given power is more common than the discharge at a given current. The discharge current i can be obtained from the discharge power PC:
i t = U oc ( S O C ) 2 R i ( S O C ) U oc ( S O C ) 2 4 R i ( S O C ) 2 P C t R i ( S O C )

3.2.1. Cell Maximum Available Energy Assessment

The discharge process of the internal small-capacity cells is synchronized with the discharge process of the battery packs. The maximum available energy of cells in each battery pack is evaluated according to these discharge processes. The energy output from the cell is equal to the integral of the cell’s continuous discharge power over time, as follows:
E C = 0 t P C t d t
Combining with the cell discharge power demand during flight, the output energy of cells in battery packs A1, A2, and B are respectively
E C , A 1 Max = P C , A 1 δ s ( t Asc + t Desc + 2 t Tran )
E C , A 2 Max = P C , A 2 t FW
E C , B Max = ζ P C , B δ s ( t Asc + t Desc + 2 t Tran ) + P C , B t FW
where ζ indicates the ratio of the battery power demand during VTOL ascent/descent to the battery power demand during FW flight. The discharge durations are determined by design requirements. Therefore, to maximize the cell available energy, the values of PC,A1, PC,A2, and PC,B are required to be as large as possible. However, excessive discharge power should be avoided, as it may cause the cell to over-discharge and be permanently damaged. The boundary between allowable power and excessive power is controlled by the relationship between the cutoff voltage Ub,cut and the terminal voltage at the end of the discharge Ub,end. The cell’s maximum available energy is reached when the cell is completely discharged. Thus, the problem of searching for the cell’s maximum available energy is equivalent to
find   P CA 1 , P C , A 2 , P C , B s . t . U b , end U b , cut ε
There are two cases of cell discharging, one is discharging at a constant power, and the other is discharging at a variable power. The discharge duration of the cell at different powers is different, as shown in Figure 5. For the cells in the dedicated battery packs A1 and A2, which operate in the VTOL and FW flight phases, respectively, the battery packs can be assumed to be discharged at a constant power. No matter what value the constant power is taken, there is always a discharge duration that satisfies the terminal voltage constraint. This duration is called the maximum discharge duration corresponding to the given constant power PC,cont, and represented as tdis,max. Therefore, the optimal PC,A1, and PC,A2 can be obtained based on VTOL and FW flight duration, respectively.
However, the discharging process of the cells in the shared battery pack B during the flight varies the power demand in segments. To find the optimal PC,B, the corresponding relationship between PC and Ub,end can be directly established by fixing the discharge duration (i.e., the total flight duration), and the time-stepping process is shown in Figure 6. For an arbitrary PC,B input, the terminal voltage at the time-of-flight completion is recorded as the corresponding Ub,end. The correspondence between PC,B and Ub,end established during this process is used to estimate the value of PC,B for a given Ub,end. The optimal PCell,B is obtained by interpolation with Ub,end = Ub,cut.

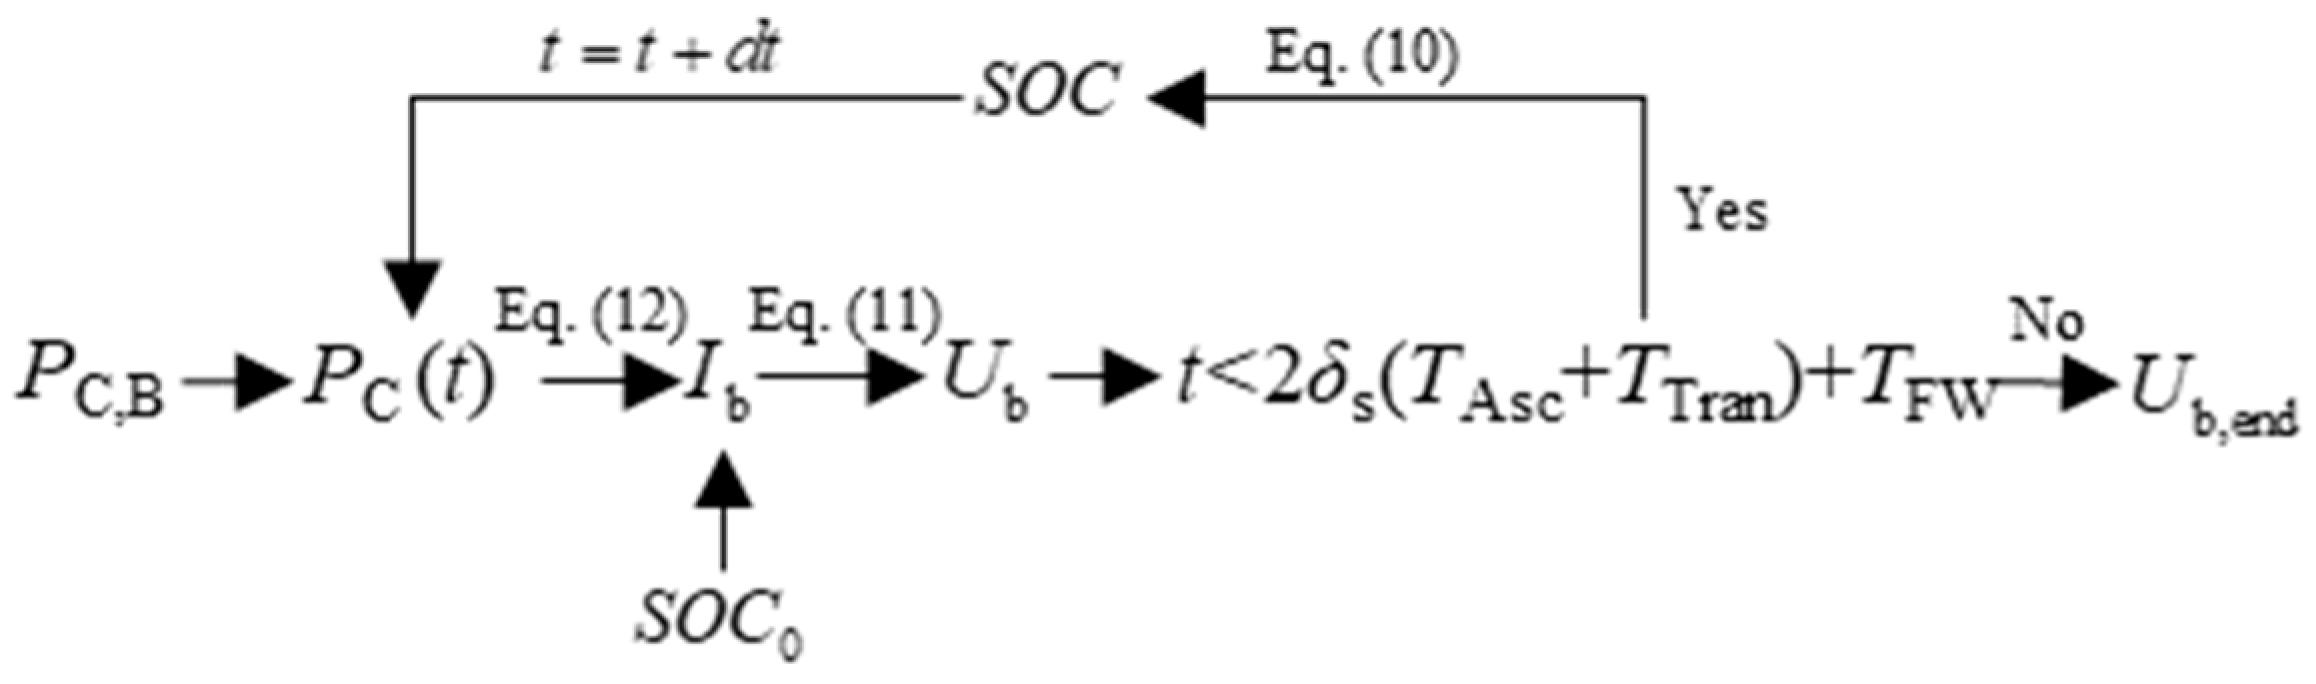
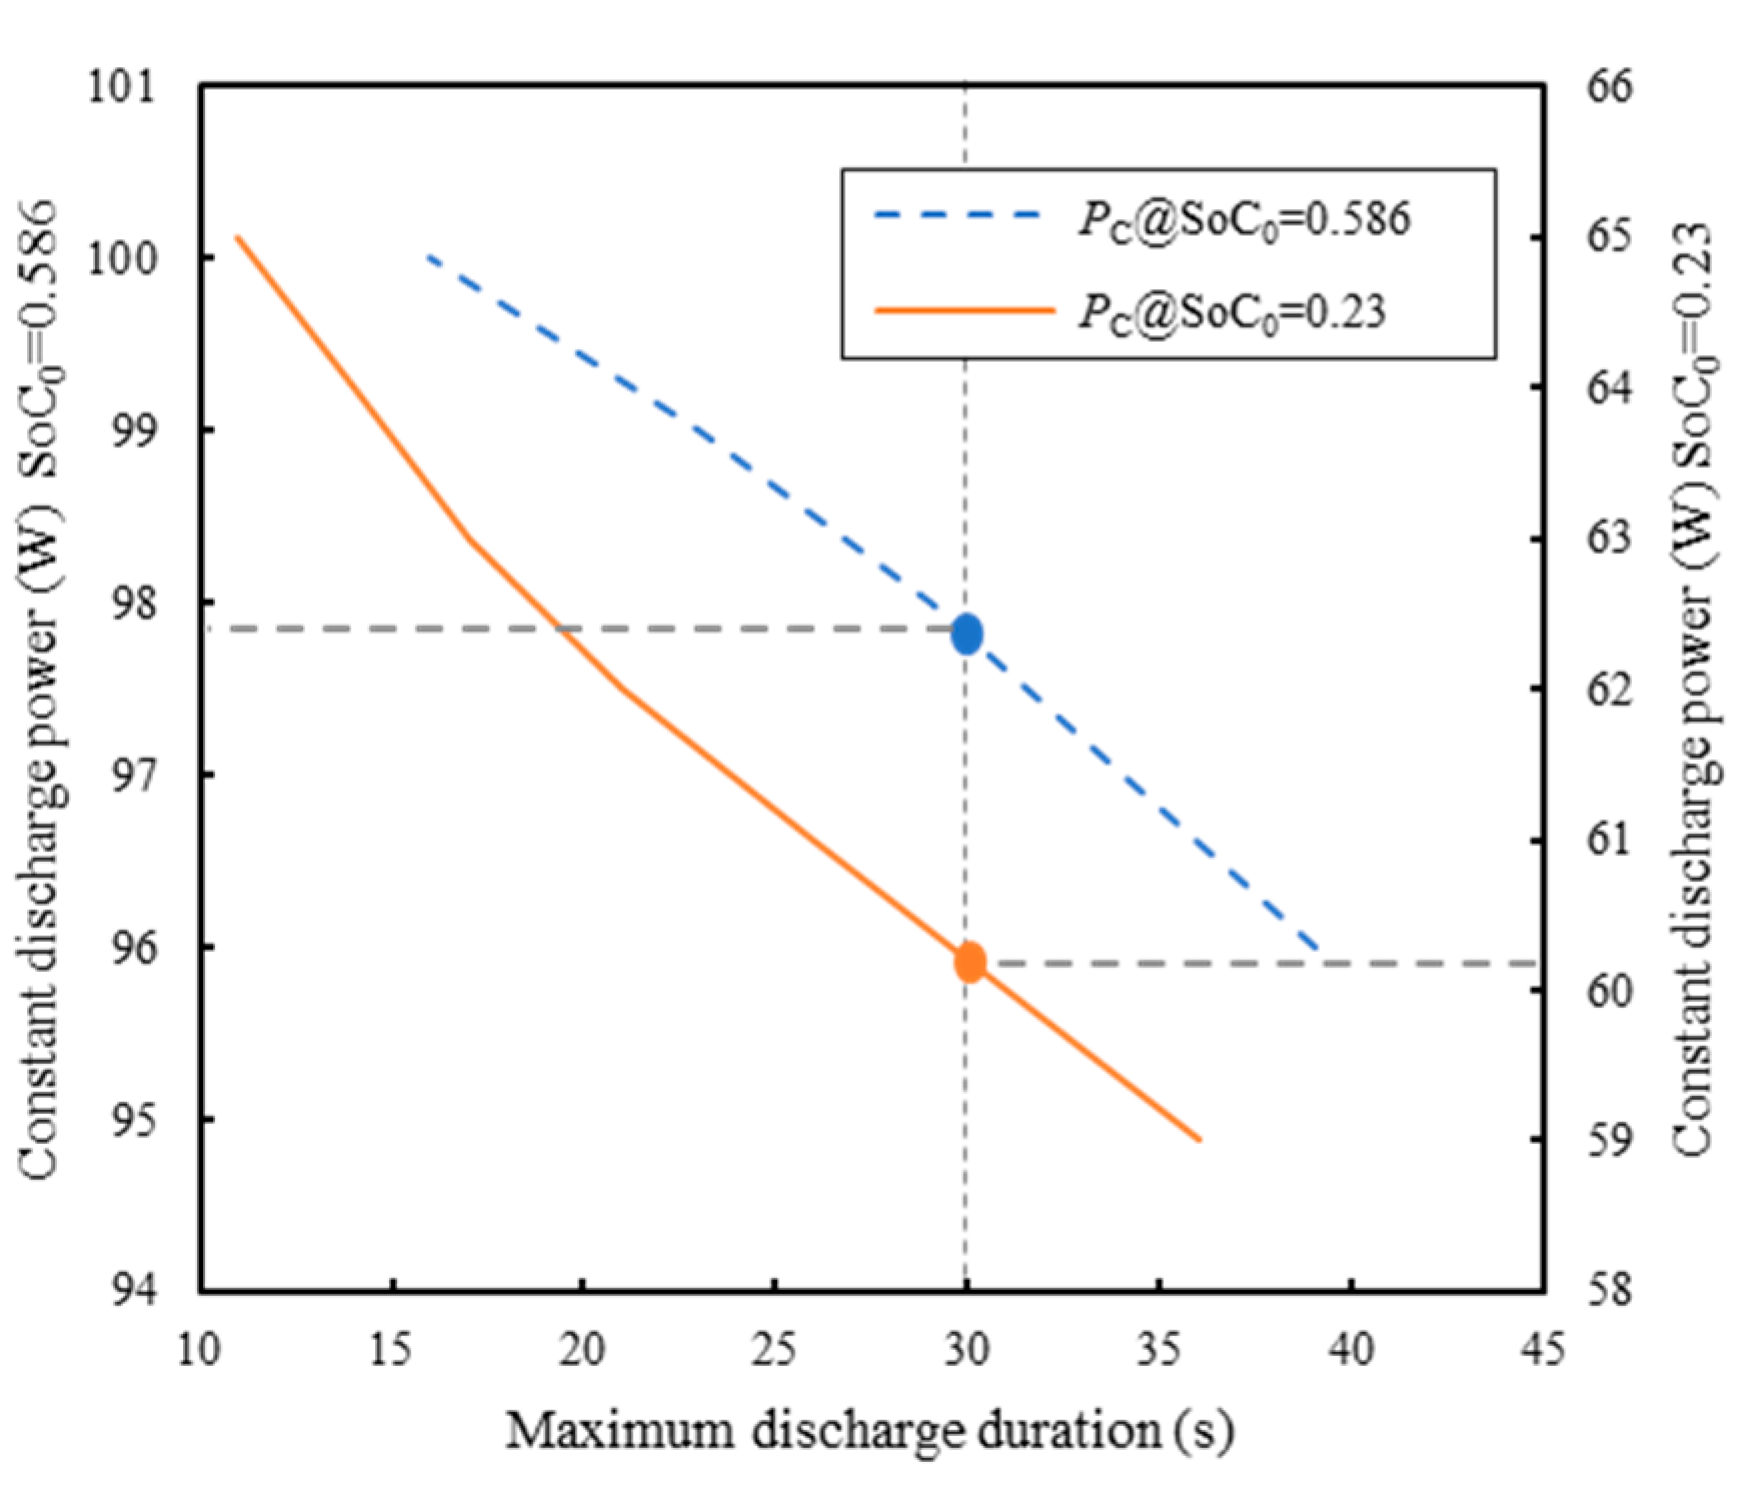
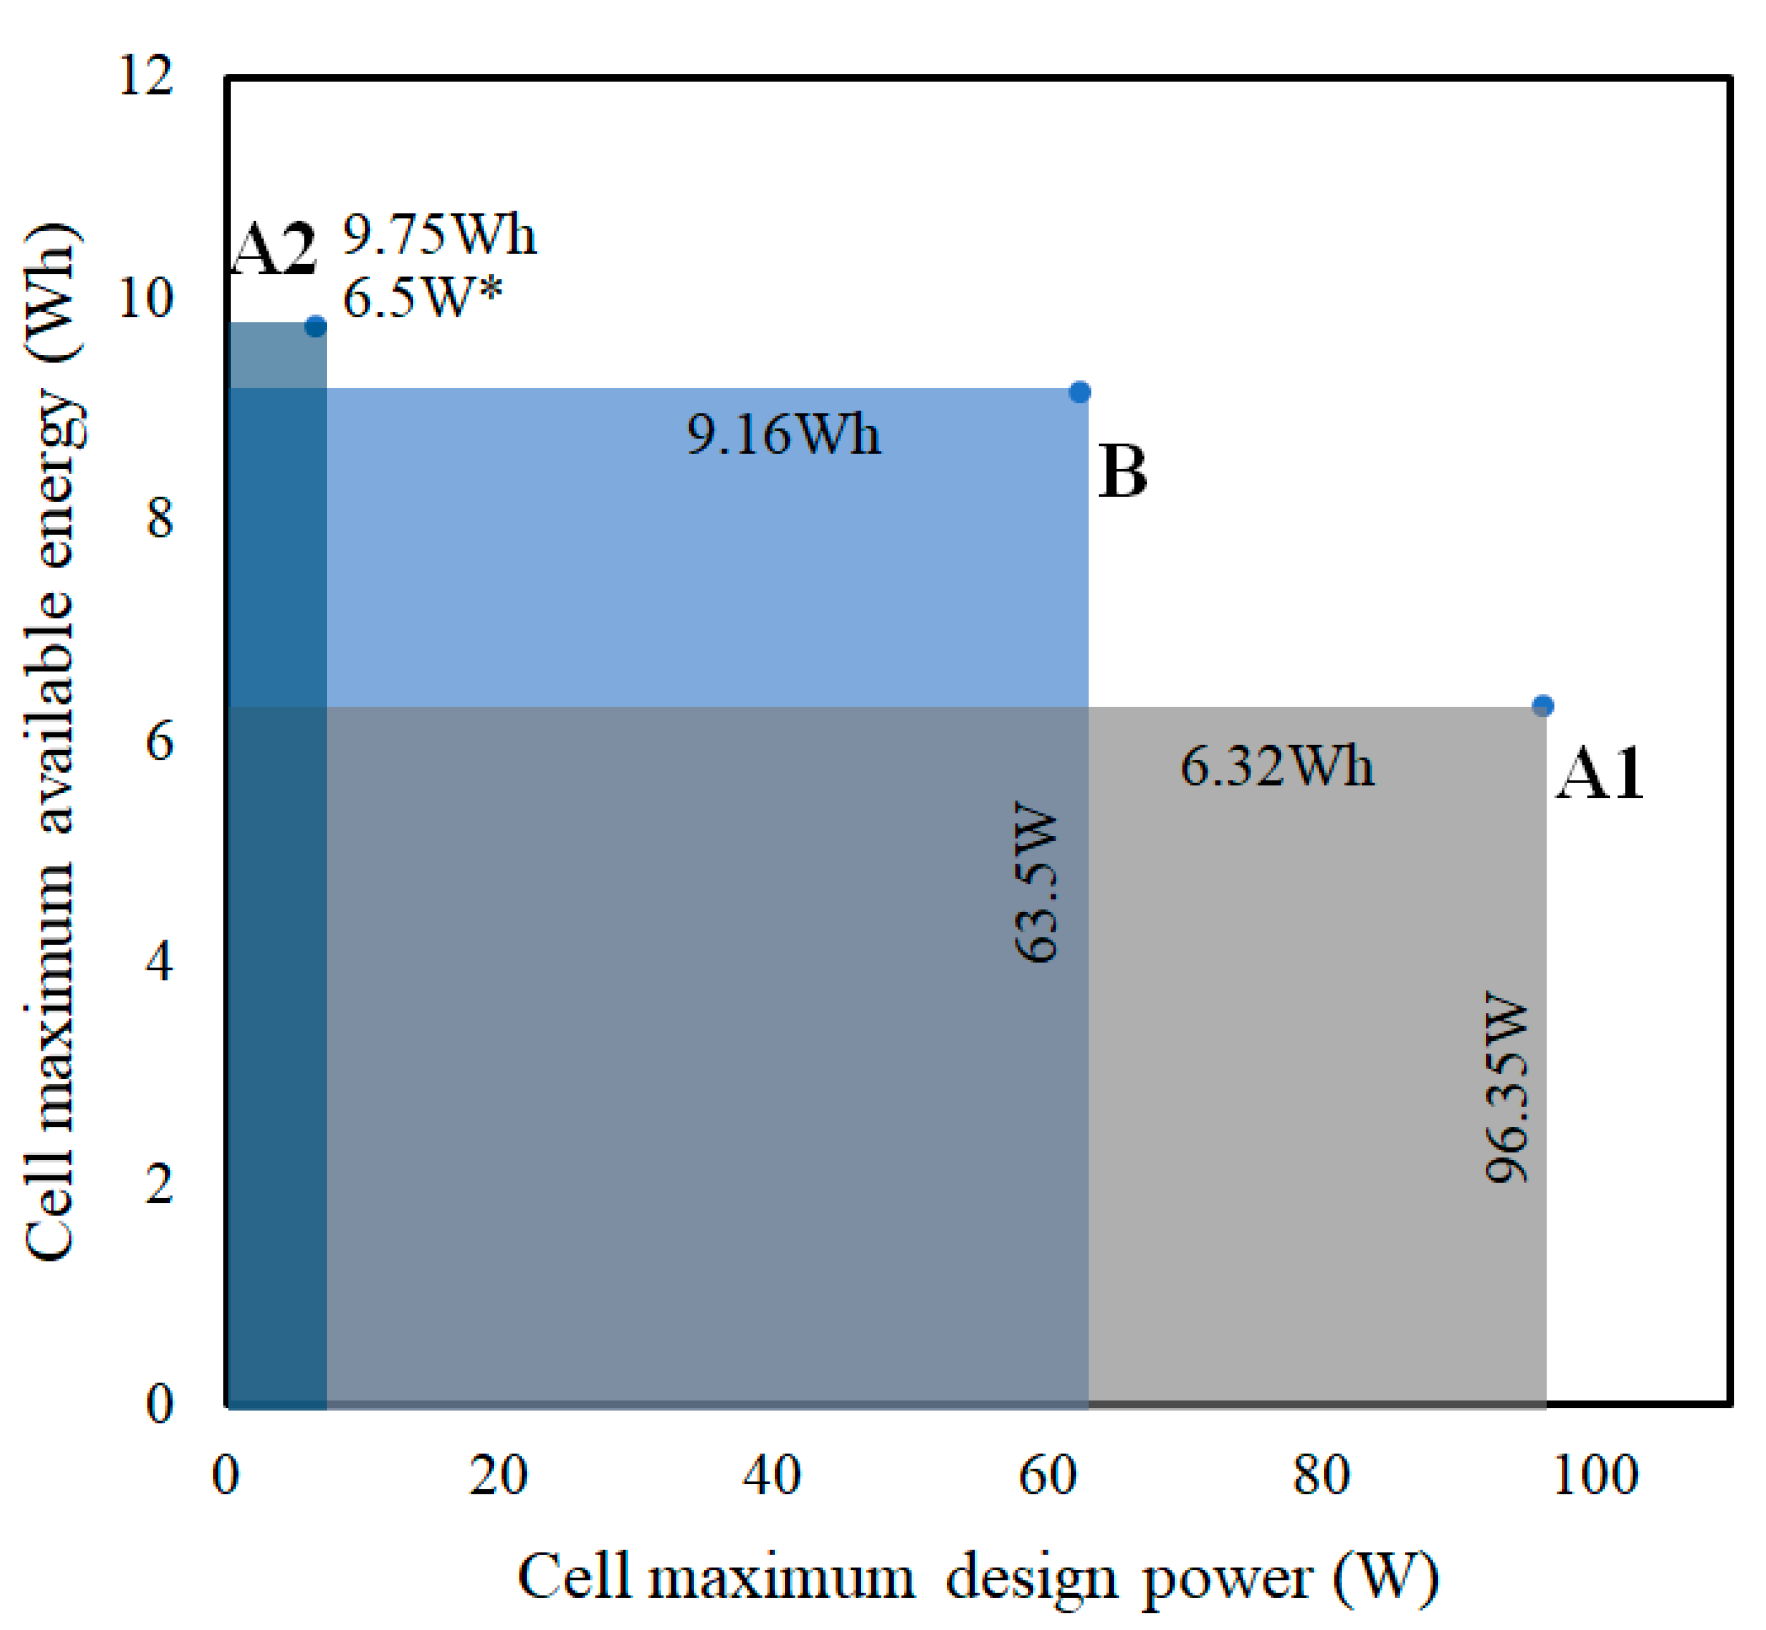
3.2.2. Cell Maximum Design Power Assessment

Cell maximum design power assessment is mainly for the cells in dedicated battery pack A1 and shared battery pack B that participate in the power supply during the transition flight. SOC is the main factor affecting the maximum discharge power. In the practical application, the transition flight is required to be completed before SOC reaches a specified lower limit S O C 0 * and the energy available in the battery pack when SOC = S O C 0 * is required to be exactly sufficient for VTOL descent and landing with sufficient safety margin. The value of the SOC lower limit is obtained by simulating the discharge process at the discharge power described in Equations (18) and (19) using the cell discharge model. The maximum discharge power corresponding to the SOC lower limit ( S O C 0 * ) is regarded as the maximum design power.
P C t = P C ,   A 1 ,   t [ 0 ,   δ s t Acs + δ s t Tran ] ( Batt .   A 1 )
P C t = ζ P C , B FW ,   t [ 0 , δ s t Acs + δ s t Tran ) P C , B FW , t [ δ s t Acs + δ s t Tran , δ s t Acs + δ s t Tran + t FW ) ,   ( Batt .   B )
The maximum discharge power corresponding to the SOC lower limit is regarded as the maximum design power, which can be obtained by [30]:
P C , max S O C = U oc S O C U b , cut U b , cut 2 R i S O C
However, when the battery is discharged at that power, the terminal voltage will reach the cutoff value immediately if the ion diffusion rate limit is not considered. This instantaneous discharge cannot meet the actual demand since although the transition is completed in a short time, it still lasts for a few seconds. Therefore, to provide enough safety margin for the transition flight process, it is necessary to ensure that the cells continuously discharge at the maximum design power PC,max for a sufficient duration (such as 30 s). The PC,cont value corresponding to the desired continuous discharge duration tdis,max (e.g., 30 s) can be obtained by interpolation according to Figure 6, which is equal to the maximum design power of the cells in dedicated battery pack A1 and shared battery pack B, i.e., P C , A 1 Max and P C , B Max . The cell in dedicated battery pack A2 does not operate during transition flight, so its maximum design power P C , A 2 Max is assumed to be equal to its continuous discharge power PC,A2.

3.3. Battery Mass Sizing

The battery pack is mainly obtained by connecting small-capacity cells in series and parallel. The series cell number NS is controlled by the voltage constraint, which is determined based on the battery-rated voltage UB and the cell-rated voltage UC in the form of Ns = ⌈UB/UC⌉. The parallel cell number NP is required to satisfy power and energy requirements.
N P = max P B , max P C , max N S , E B E C N S
The complete expression of the cell-based battery sizing equation is then obtained. If the dedicated battery configuration is adopted, the expression is:
M B Dedicated = ξ M C U B U C max P Tran , B P C , A 1 Max U B / U C , E VTOL , B + E Tran , B E C , A 1 Max U B / U C + max P FW , B P C , A 2 Max U B / U C , E FW , B E C , A 2 Max U B / U C
If the shared battery configuration is adopted, the expression is:
M B Shared = ξ M C U B U C max P Tran , B P C , B Max U B / U C , E VTOL , B + E Tran , B + E FW , B E C , B Max U B / U C
Substituting the power and energy requirements into the corresponding cell-based battery sizing equation yields the total mass of the battery equipped on an electric FW-VTOL UAV.

4. Propulsion System Performance Analysis and Optimization Model

The propulsion system of a composite electric FW-VTOL UAV mainly contains the rotor for VTOL and the propeller for FW flight, as well as the drive motor and electronic speed controller (ESC). The performance of the rotor, propeller, and motor directly affects flight efficiency. To further optimize the design space and improve the design effectiveness, the propulsion system is modeled and optimized in this section.

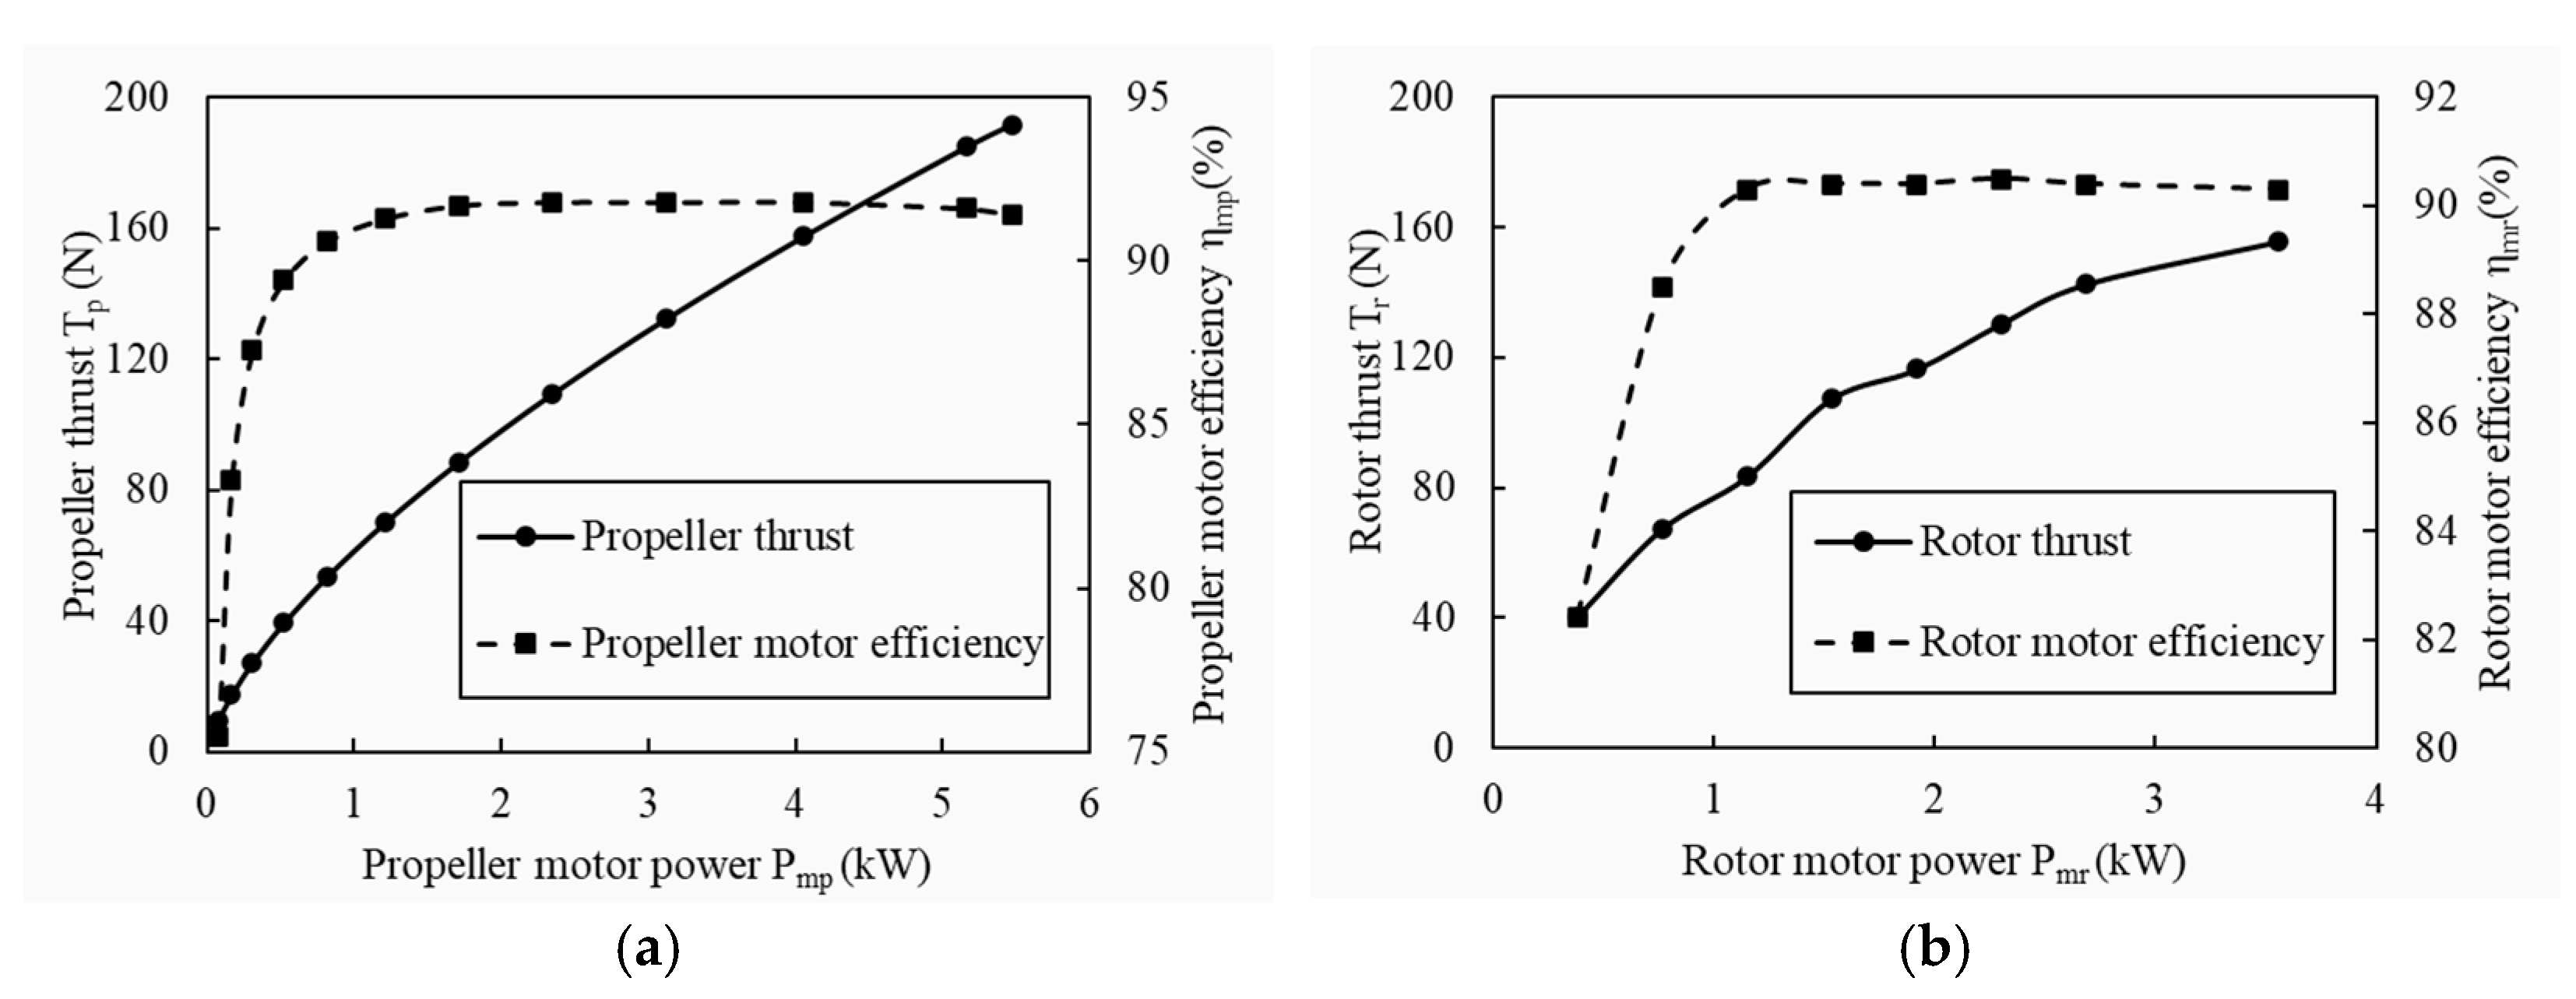
4.1. Motor Performance Model

The main concerns during the aircraft design process are the weight, maximum power, and efficiency of the motor. BLCD motors are most widely used in electric aircraft due to their high efficiency and large torque, and their performance can be evaluated using a first-order motor model. The motor voltage Um, torque Qm, and efficiency ηm can be expressed as [31,32]
U m = I m R 0 + 30 n m π K V
Q m = 30 π K V ( I m I 0 )
η m = Q m n m U m I m = ( 1 I 0 I m ) ( 1 I m R 0 U m )
where Im is the motor current, Kv is the speed constant, I0 is the no-load current, and R0 is the internal resistance. It can be observed from Equation (26) that an operating current exists to make the motor at the optimum efficiency point when the motor voltage is constant, mainly determined by the load such as the propeller/rotor. Therefore, it is necessary to match the motor with the propeller/rotor to ensure that the motor operates near the optimal efficiency point. To effectively estimate motor performance, the main technical parameters of commonly used BLDCs are statistically analyzed [31]. As shown in Figure 7a, the motor maximum power Pm,max is approximately proportional to the motor mass Mm, and the relationship can be written as
M m = 0.175 P m , max + 1.267
The motor speed constant is inversely related to the torque constant, and usually the larger the motor, the larger the magnetic chain and torque constants [32]. Consequently, the value of motor KV decreases with increasing mass, and this trend is also presented in Figure 7b, where the relation can be written as
K V = 19545 M m 0.72
The variations between the motor internal resistance R0 and the maximum power Pm,max, as well as the no-load current I0, are presented in Figure 7c,d. The statistical relationship can be approximated as
R 0 = 2120.4 P m , max 0.56
I 0 = 14.5 R 0 0.68

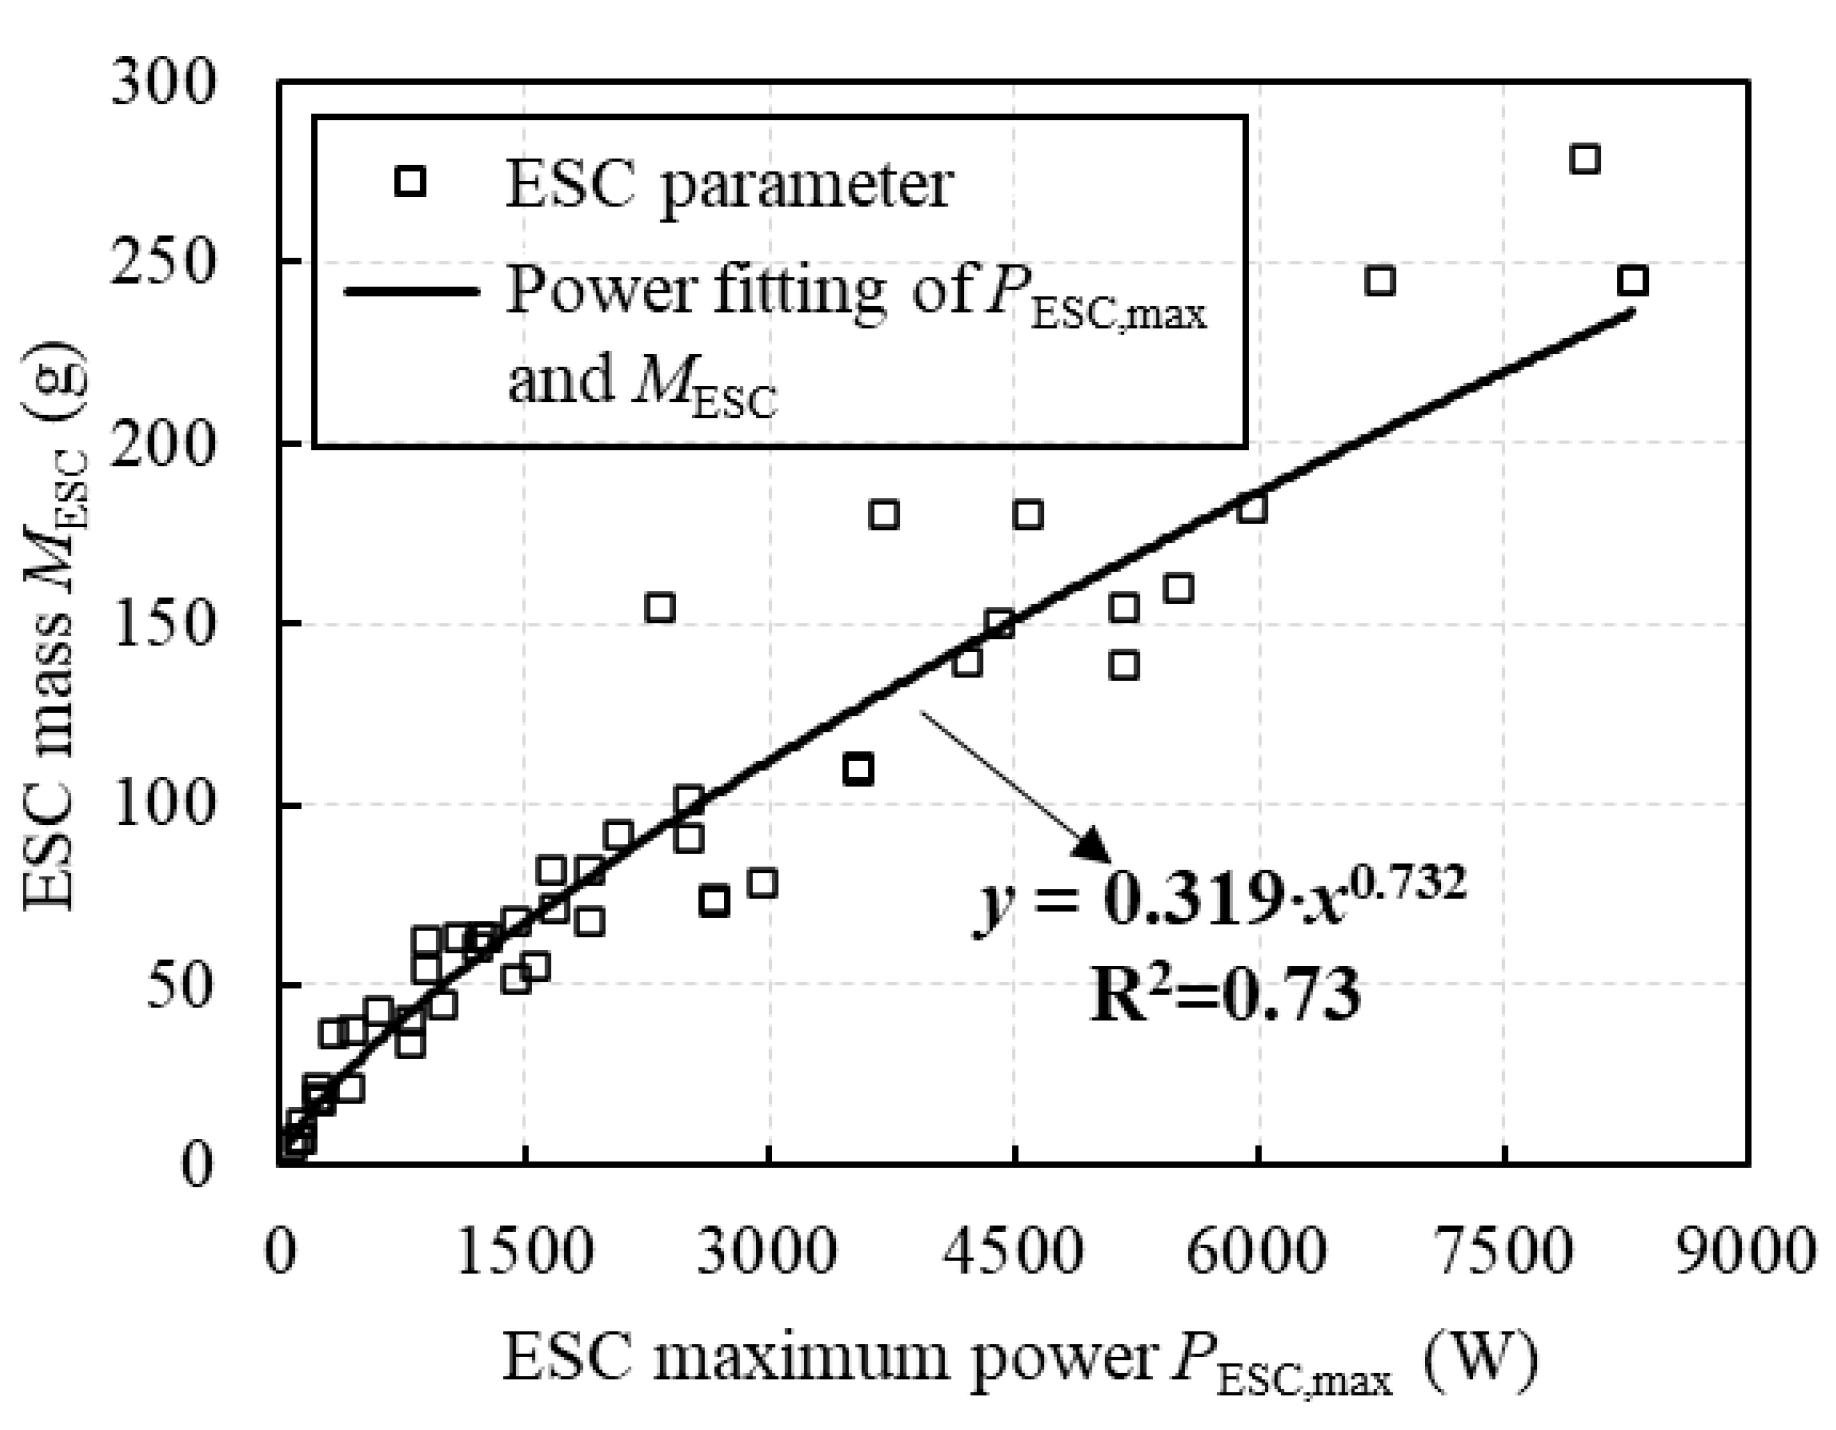
4.2. ESC Performance Model

ESC compatibility is usually excellent. It is only necessary to ensure that the ESC maximum allowable current is not less than the motor’s maximum operating current to achieve a favorable match. When the voltages are consistent, only the maximum power match needs to be ensured. The parameters of commonly used ESCs are statistically analyzed. Figure 8 shows the trend of ESC mass MESC and ESC maximum power PESC,max, and the relationship can be expressed as
M ESC = 0.319 P ESC , max 0.732

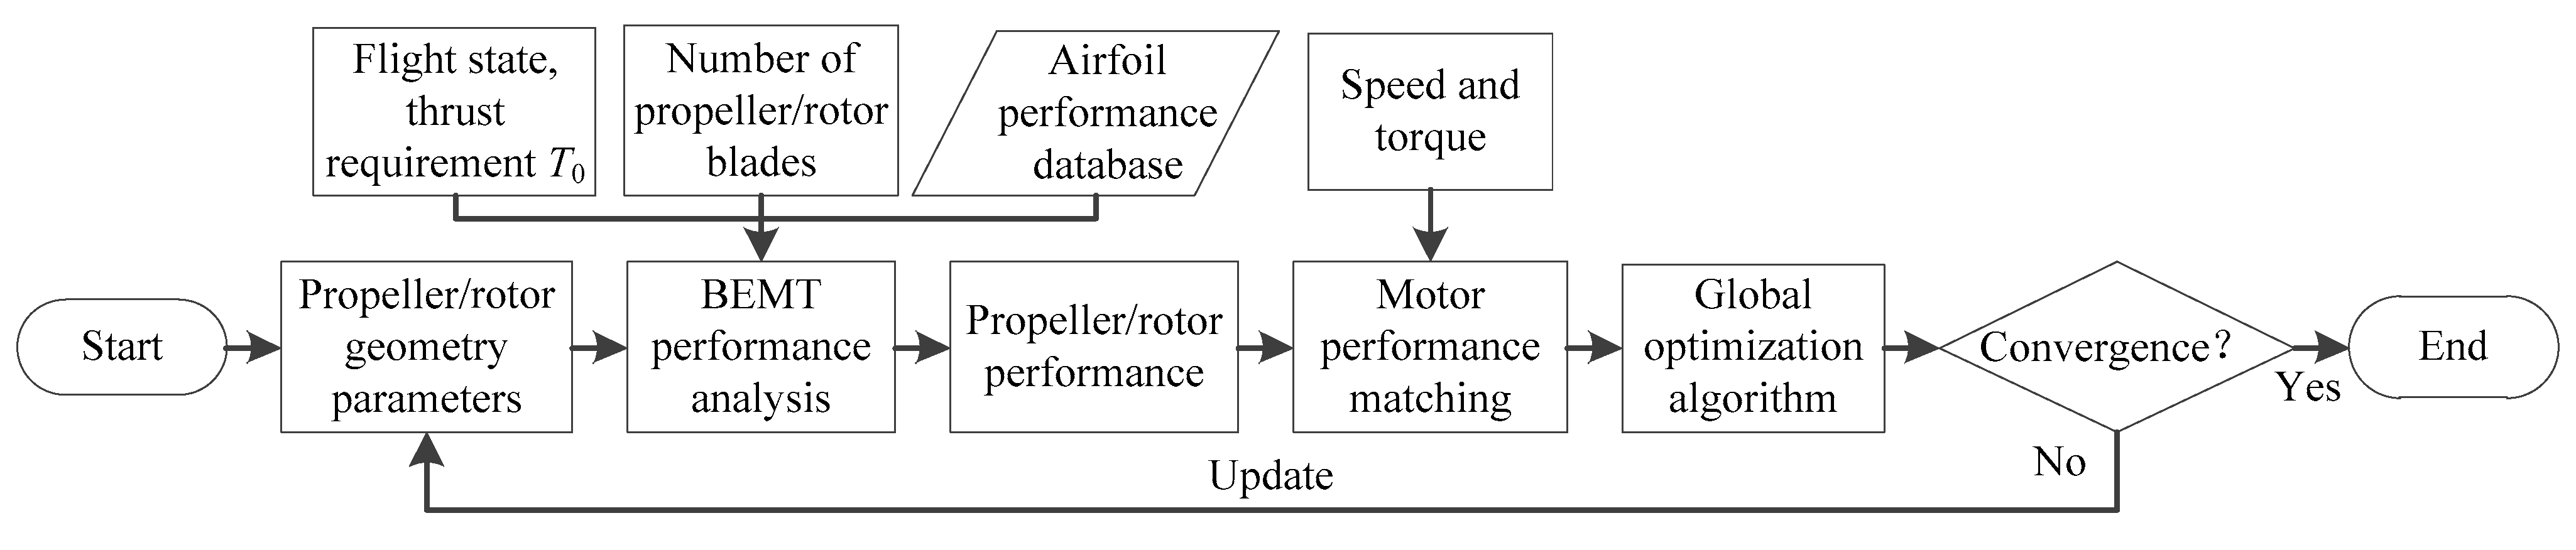
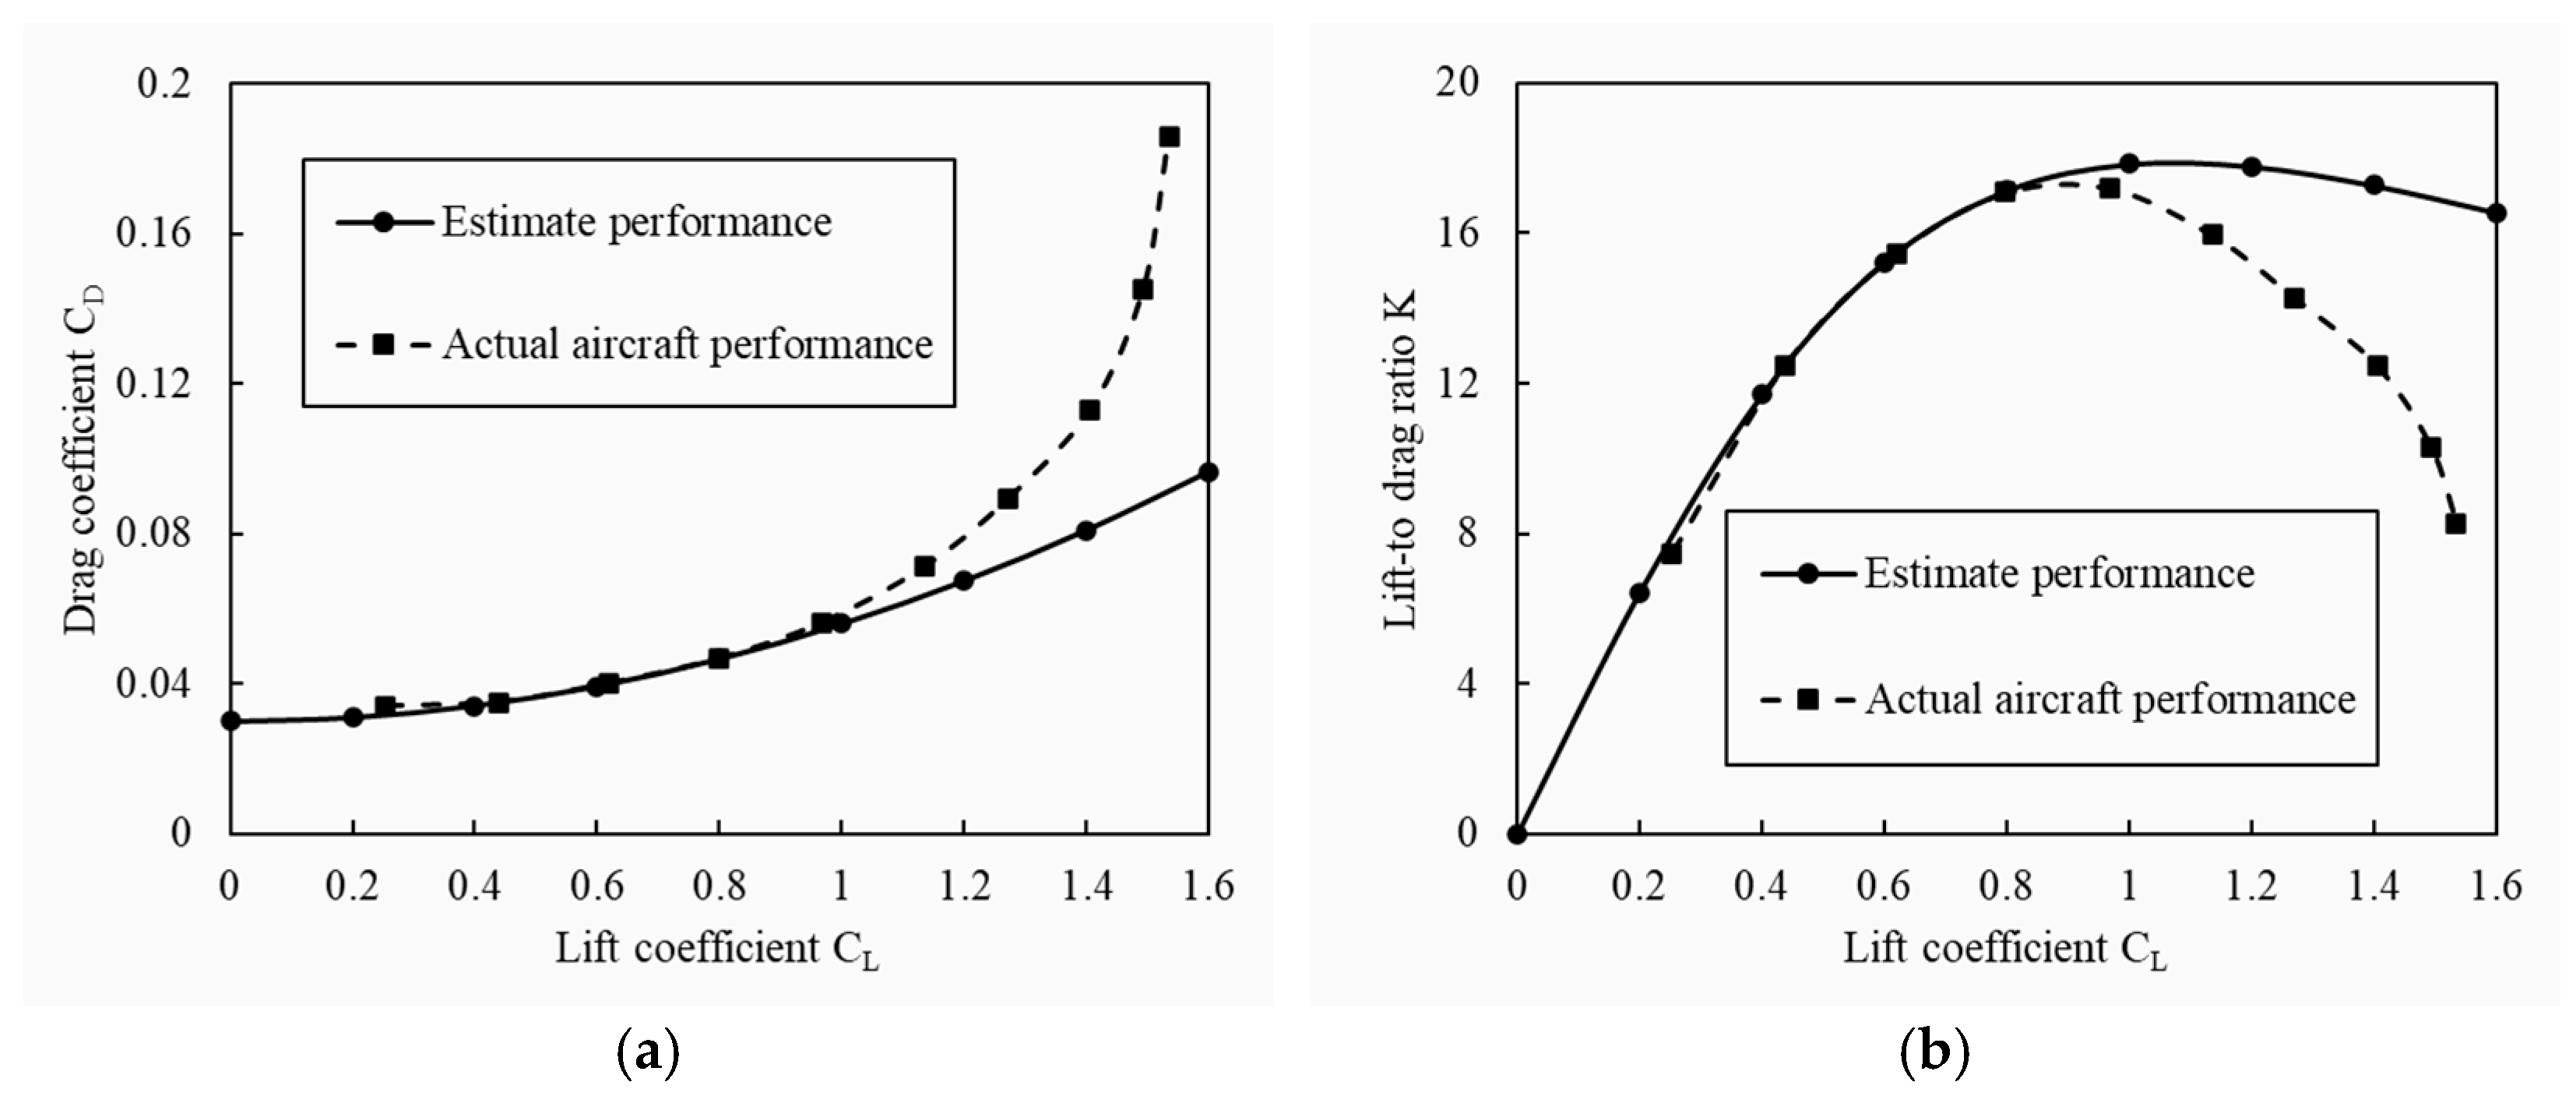
4.3. Propeller/Rotor Optimization Model

To improve the aerodynamic efficiency of the propeller/rotor, preliminary shape optimization of the propeller/rotor blade at the design point needs to be performed. The propeller/rotor shape parameters mainly include the airfoil profile and the shape parameters [33]. The airfoil profile from tip to root is often not a single airfoil but exists in the form of an airfoil family, and the airfoil thickness gradually increases toward the root. The commonly used Clark-Y series airfoil family is used in this study. The shape parameters are mainly chord length c(r) and torsion angle θ(r) distributions, which can be described by cubic Bessel curves:
c r = 1 r 3 c 0 + 3 r 1 r 2 c 1 + 3 r 2 1 r c 2 + r 3 c 3
θ r = 1 r 3 θ 0 + 3 r 1 r 2 θ 1 + 3 r 2 1 r θ 2 + r 3 θ 3
where the chord length distribution parameter c = [c0, c1, c2, c3], the torsion angle distribution parameter θ = [θ0, θ1, θ2, θ3]. Since the computational fluid dynamics (CFD) method is too time-consuming, this research performs the propeller/rotor optimization design based on the blade element momentum theory (BEMT). The momentum loss from the radial flow is evaluated by the Prandtl equation. Numerous studies have been conducted to show that this theory has high accuracy in calculating propellers. Numerous studies have shown that the theory has high accuracy in analyzing propeller performance [32,34].
The predicted accuracy of the BEMT method is closely related to the accuracy of airfoil family aerodynamic input. In the pre-processing of the aerodynamic characteristics of the propeller/rotor airfoil family, a high-confidence two-dimensional CFD solver is used to generate the airfoil aerodynamic characteristics in different Reynolds numbers and angles of attack sequences. Here, the governing equations used are the Reynolds averaged Navier–Stokes equations, and the turbulence model is the k-ω SST model. A large amount of literature is available to verify the accuracy and validity of the model [35]. On this basis, the aerodynamic database of the Clark-Y airfoil family is established by interpolation calculation with the airfoil thickness, the operating Reynolds number, and the angle of attack as the input, and the lift and drag coefficient as the output.
Based on the airfoil family aerodynamic database, each blade element of the propeller/rotor blade along the span direction is analyzed, and the blade lift and drag are decomposed into thrust and moment with the inflow angle φ. The thrust dTP and torque dQP on a single blade element can be solved by using the effective angle of attack and the airfoil aerodynamic database, and the total thrust TP and total torque QP are obtained by integrating the dTP and dQP along the span direction of the blade:
T P = 0 D / 2 1 2 N ρ c ( u t 2 + u p 2 ) ( C l cos φ C d sin φ ) d r
Q P = 0 D / 2 1 2 N ρ c ( u t 2 + u p 2 ) ( C l sin φ + C d cos φ ) r d r
where N is the number of blades, D is the propeller/rotor diameter, Cl and Cd are the blade-element lift and drag coefficients corresponding to the local inflow velocity, respectively. ut and up are the axial and circumferential resultant velocities at the blade element, respectively. Thus, the propeller/rotor efficiency ηP is
η P = V T P 2 π n s Q P
The number of propeller/rotor blades is taken as 2 in the optimization to reduce the optimization scale. At this time, the propeller/rotor optimization design variables x are mainly the propeller/rotor diameter D, chord length distribution parameter c, and twist angle distribution parameter θ. To ensure flight safety, the propeller/rotor needs to meet the thrust requirements in the forward flight state and the hovering state. In addition, to ensure the efficient operation of the motor, the torque of the motor and propeller needs to be matched, and the speed should be within a specified design range. The optimization objective is the propeller/rotor efficiency ηP. Thus, the propeller/rotor optimization mathematical model is as follows:
m a x η P = f ( x ) s . t . T P T P , min , Q P Q P , max , n min n s n max x = D , c , θ
The propeller/rotor optimization design process is shown in Figure 9. According to the parameterized shape, the propeller/rotor performance is evaluated based on the BEMT method to obtain the speed and torque under the working conditions. Then, the matching with the motor performance is completed and the global optimization algorithm is used to complete the iterative optimization. The sequential quadratic programming optimization algorithm is used to complete the iterative optimization. The method does not need more adjustment parameters and has good convergence in propeller/rotor aerodynamic optimization.
Based on the optimized propeller/rotor shape, the total mass of the propeller/rotor can be estimated as
M P / R = ρ P V P + 4 ρ R V R
where MP/R is the total mass of the propeller/rotor, and ρP, ρR are the material densities of the propeller and rotor, respectively. VP and VR are the volumes of the propeller and rotor, respectively.

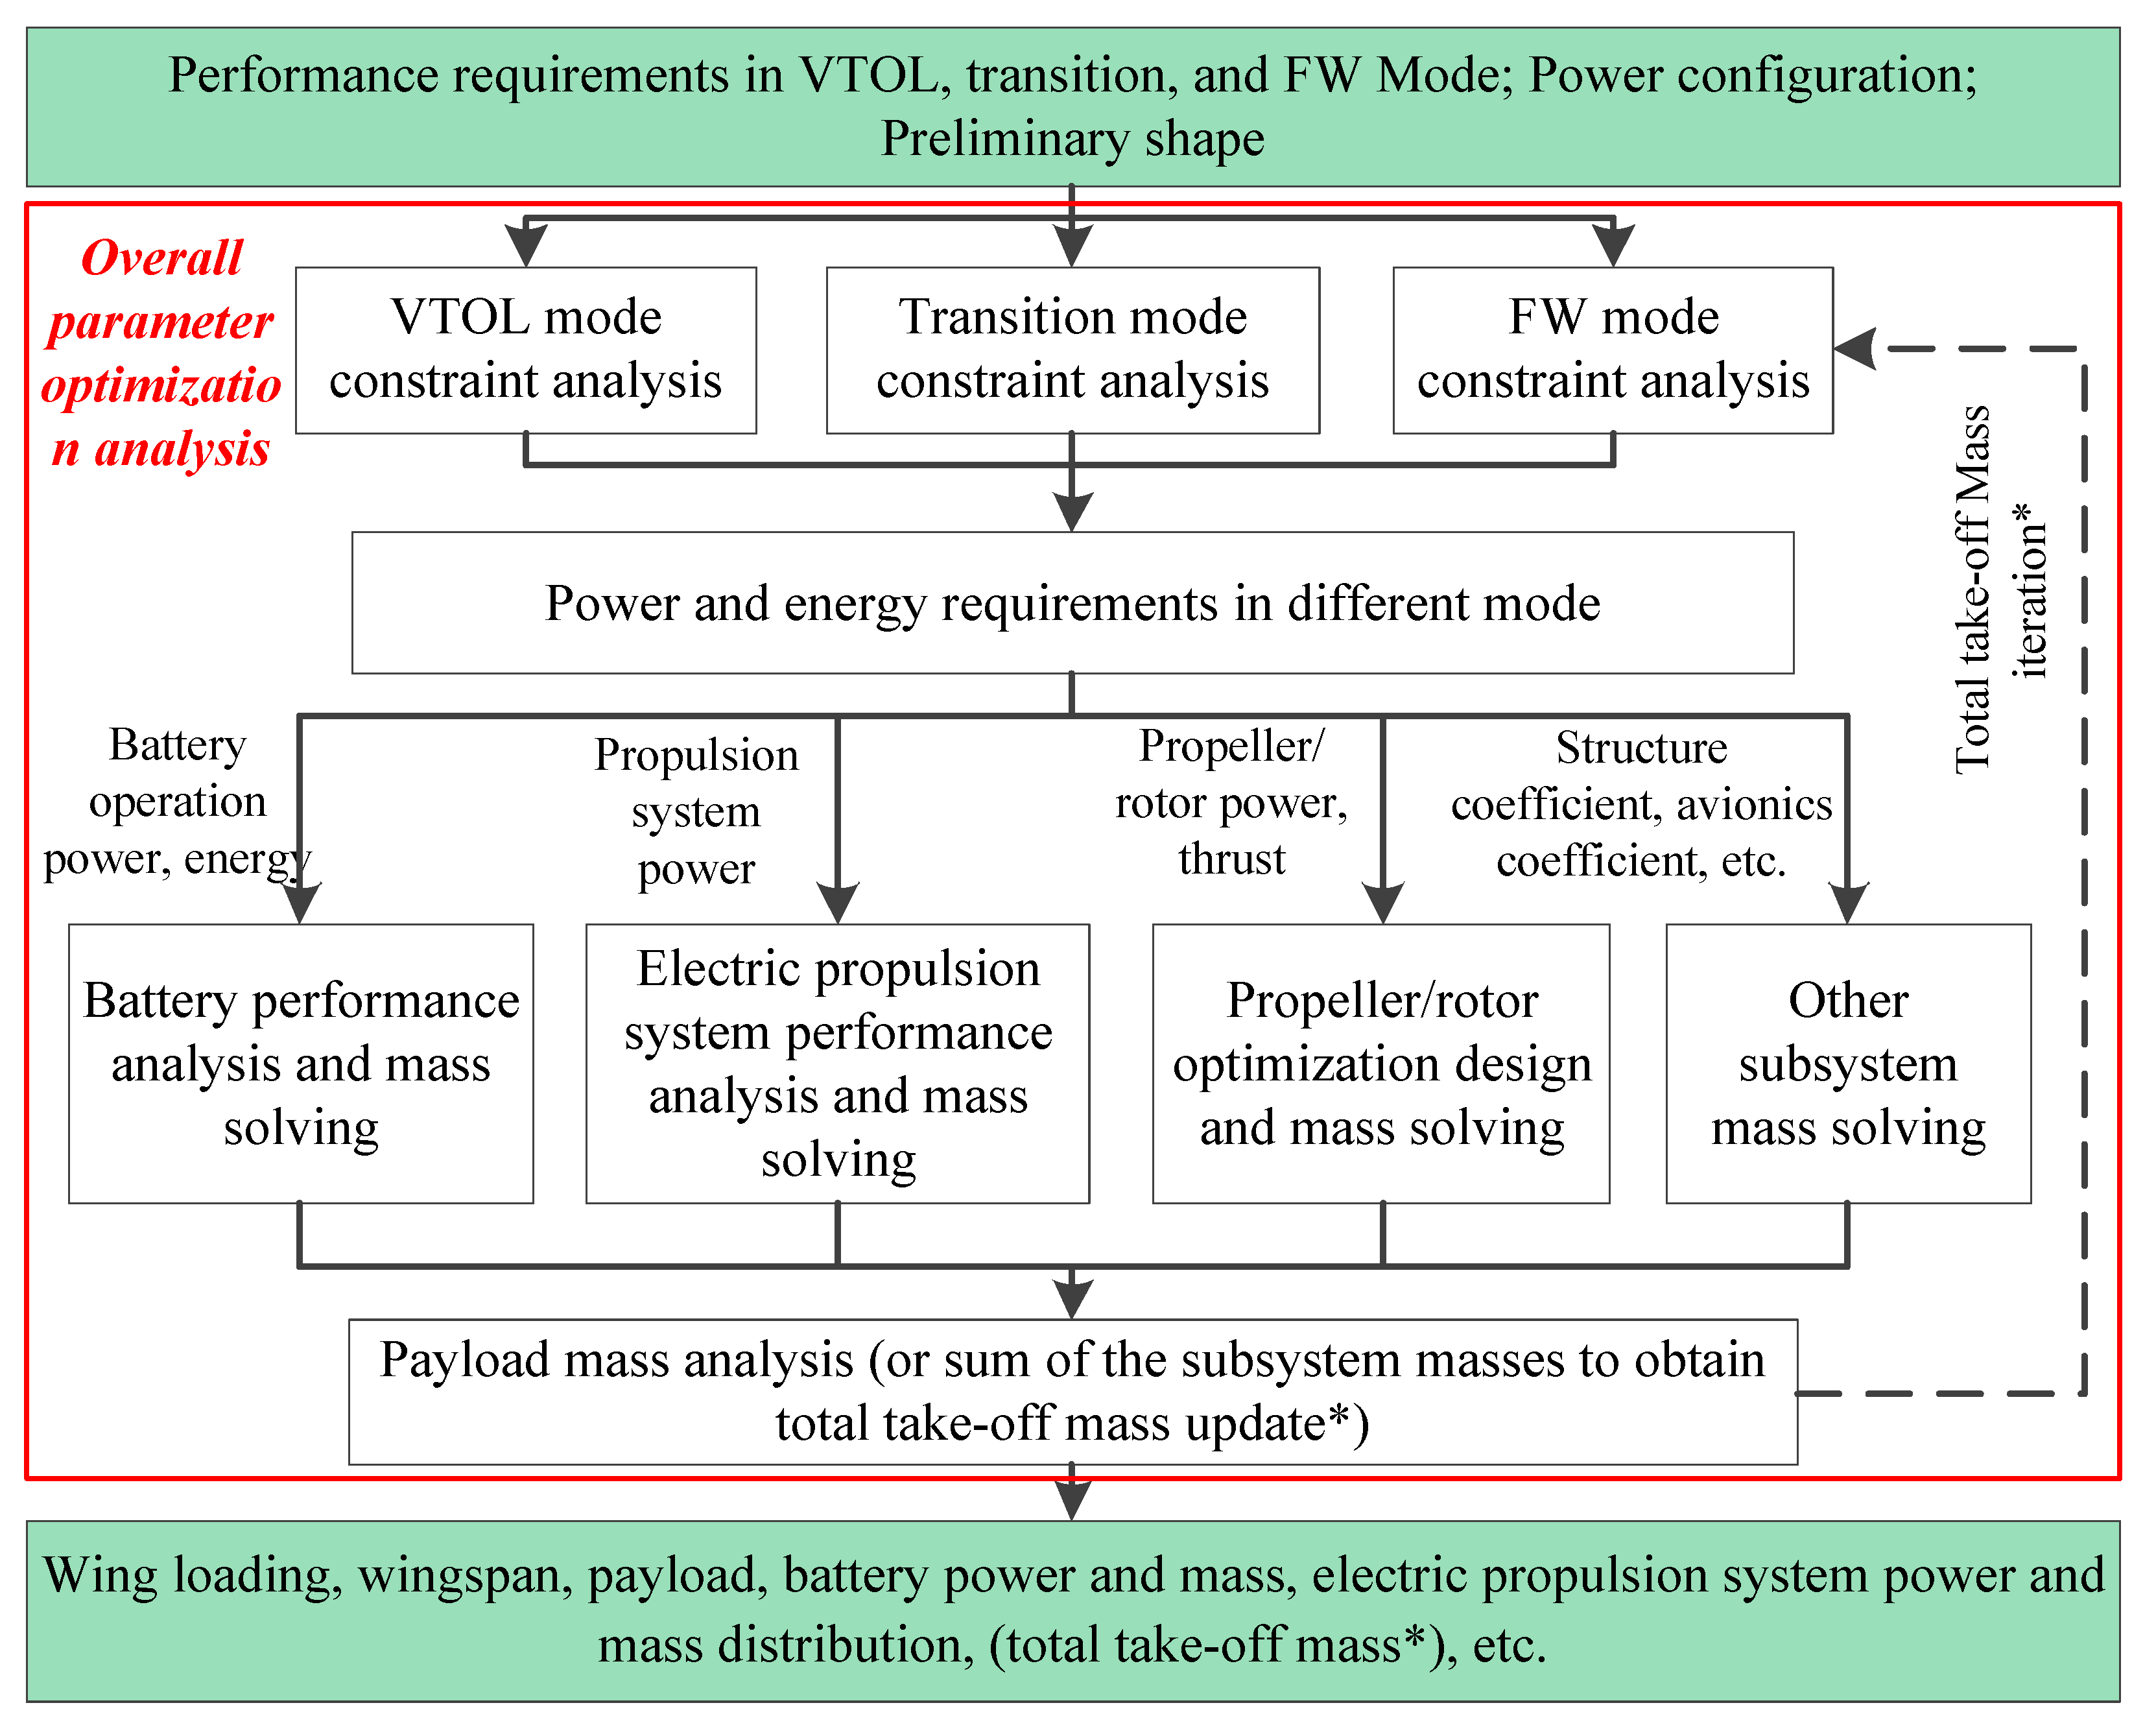
5. Preliminary Design and Optimization Process

The objective of the preliminary design and optimization is to determine the main parameters of the aircraft, such as weight and geometry, based on a set of design requirements, and to refine them using information about the exact components of the propulsion system and batteries. Figure 10 shows the main flow of the preliminary design and optimization of the electric FW-VTOL UAV.
The overall process can be divided into two parts: mass iteration calculation and preliminary optimization matching. The mass iteration calculations are performed to analyze the weight of each subsystem and design the main shape parameters according to the given design requirements and powertrain scheme. This part is carried out according to the following steps. Firstly, the electric VTOL FW UAV multimodal constraint analysis is performed to convert the design requirements into the overall wing loading and the power demand for the power system. Next, the power of the propulsion system such as battery, motor, and propeller is solved. After that, the battery pack is sized under multiple constraints of architecture, energy, power, and rated voltage based on the battery sizing method. And motor performance and weight estimation are performed based on a large number of data statistics and first-order motor modeling. The size and shape of the propeller and rotor blades are then obtained based on the optimization method. Finally, the takeoff mass is updated, and the above process is repeated until the results converge. Preliminary optimization matching is mainly considered as the degrees of freedom brought about by the optimal matching of the battery configuration and propulsion system. By updating the battery architecture and powertrain scheme and starting a new round of iterative mass calculations, the design point with the lightest takeoff mass is finally determined. The power, mass, and shape parameters are considered as the final output of the preliminary design and optimization process.

6. Case Study

The proposed method was applied to the design of a 30 kg composite wing electric FW-VTOL UAV (Figure 1), which is a test prototype of a large, high-payload 300 kg electric VTOL UAV that is currently under development. The flight profile of this aircraft is illustrated in Figure 11. The design requirements and some parameters are listed in Table 2.

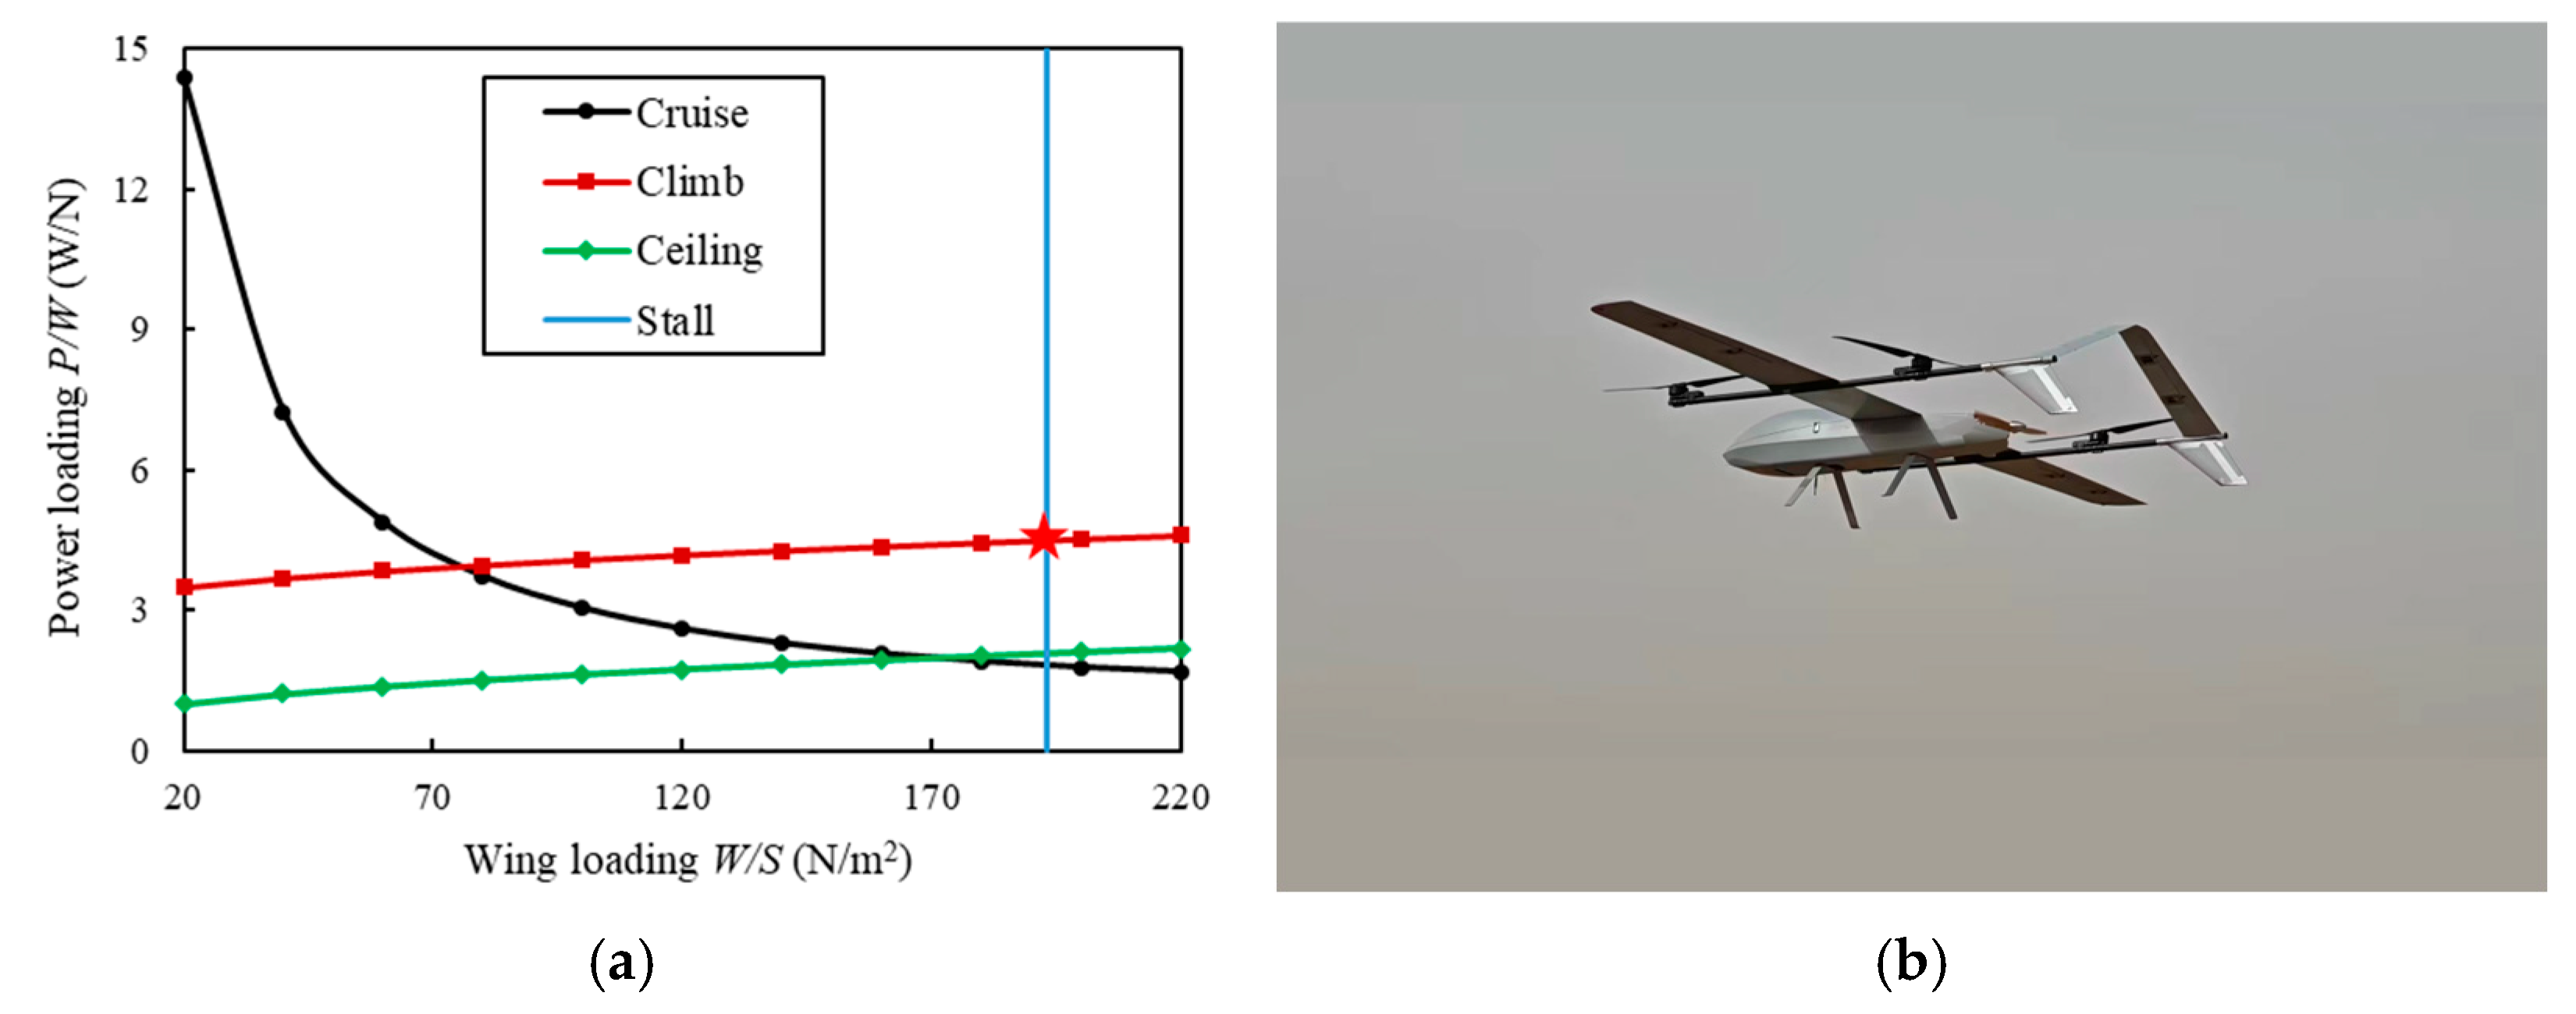
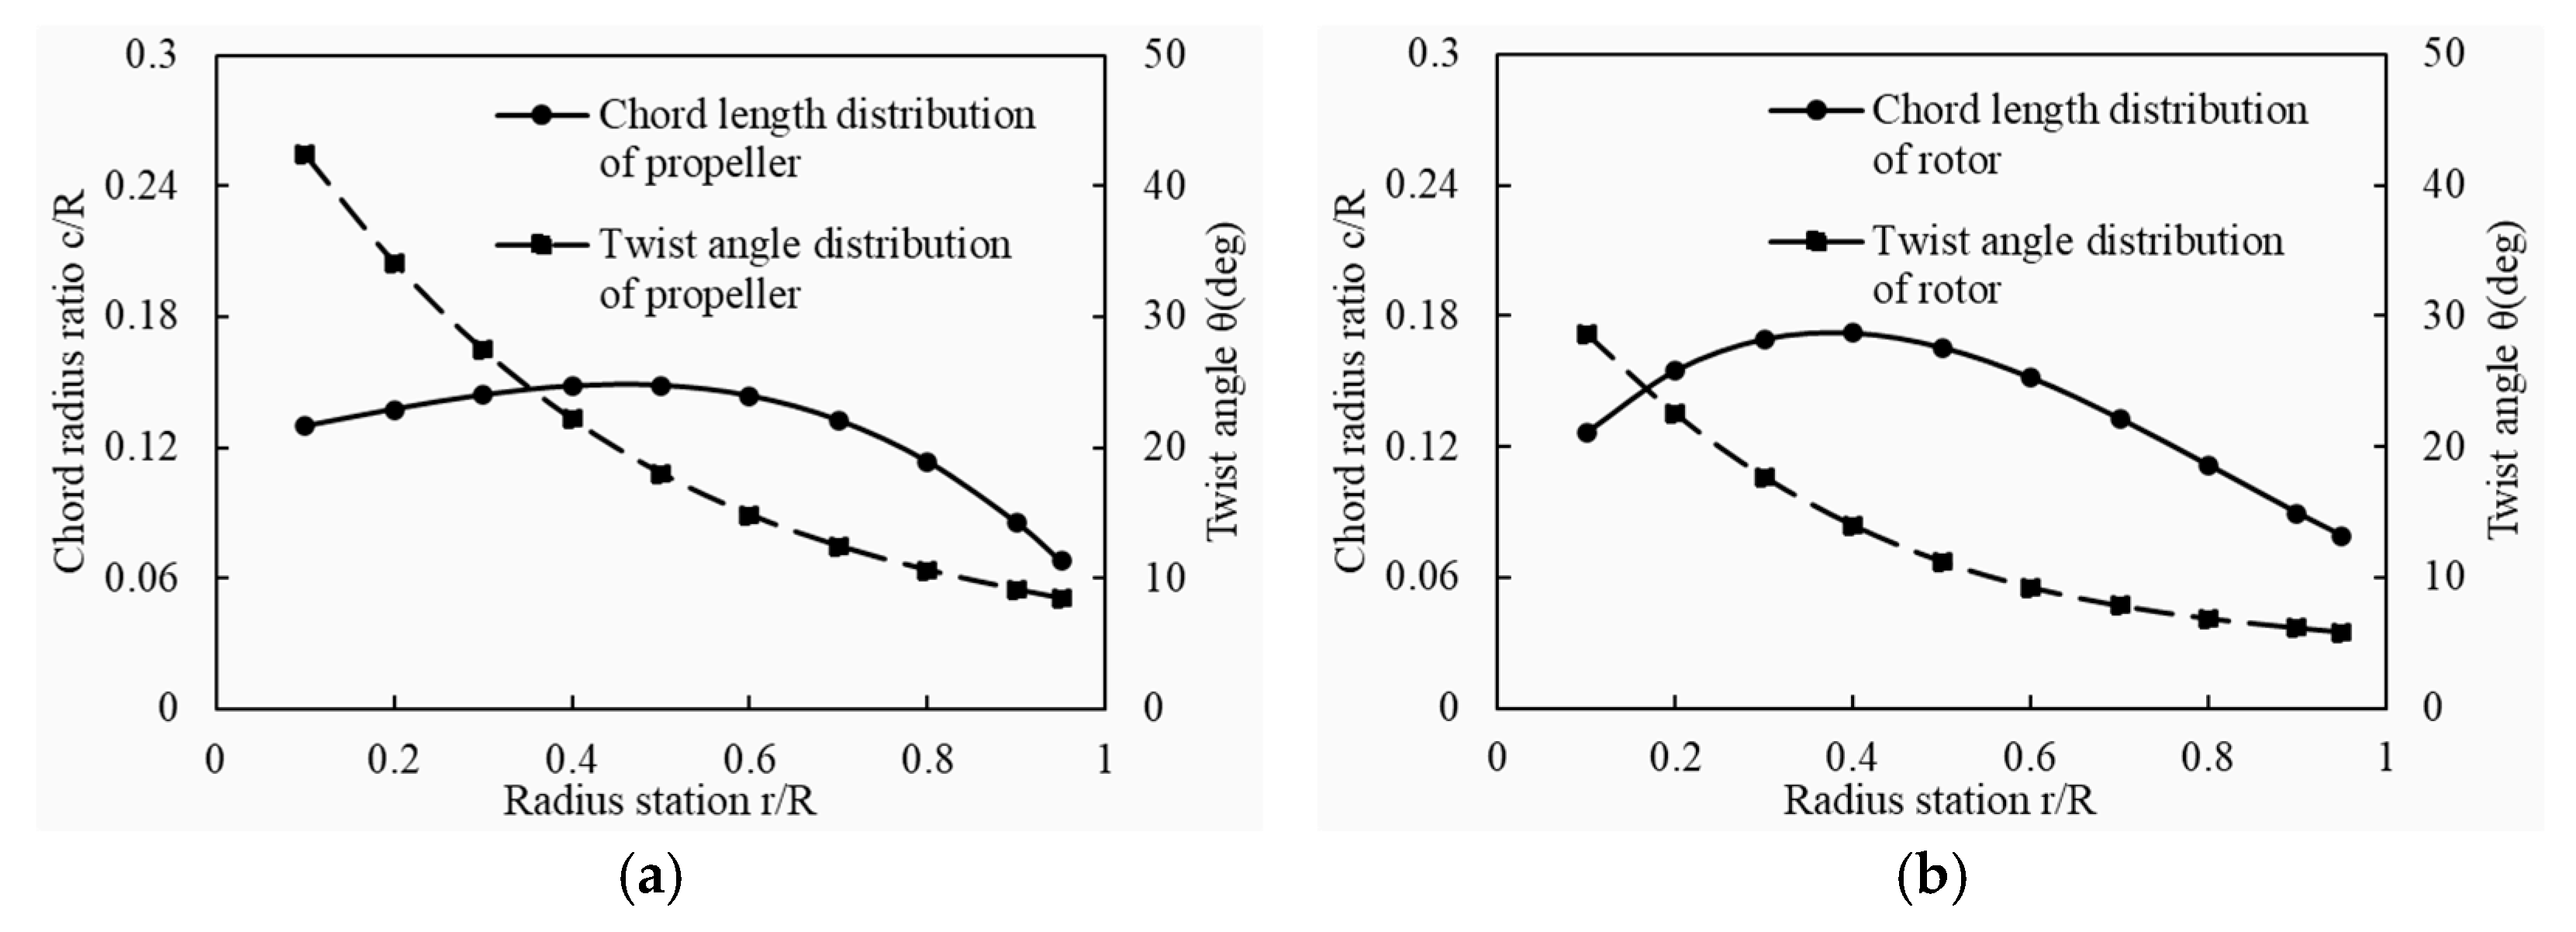
6.1. Design and Optimization Result

Battery configurations were considered for dedicated and shared battery configurations to analyze the impact of battery configurations on battery selection and overall design results. The overall parameters of the electric FW-VTOL UAV with the proposed preliminary design and optimization are presented in Table 3. The data for actual aircraft was obtained from measurements taken during the UAV manufacturing process. The design space under performance constraint analysis and test flight are shown in Figure 12. The relationship between the variation in the power loading and wing loading can be obtained based on Equation (1). Cruise, climb rate, ceiling, and stall speed constraints are considered comprehensively. The structural mass and avionics mass are estimated as 35% and 5% of the total mass. The flight test of this UAV is mainly conducted for power, avionics, and flight duration tests. During the flight test, the UAV flew vertically to an altitude of 100 m, then circled for 30 min, and then landed. By testing the remaining battery capacity and conversion, the endurance is able to reach 95.8 min, which met the requirements.
Comparing the masses with the different battery configurations, it can be seen that the dedicated battery packs A1 and A2 are the lightest battery packs dedicated to VTOL mode and FW mode, respectively, but a simple combination of these two dedicated battery packs did not yield the lightest configuration for the batteries on board. Instead, the total mass of dedicated battery packs is 18.6 percent greater than the mass of the shared battery pack (dedicated:12 kg; shared: 10.2 kg). This result is mainly caused by the difference in the design idea of the two battery configurations when coping with the FW-VTOL UAV special battery demand. From the perspective of aircraft design, the lighter the battery pack, the greater the mass assigned to the payload. Thus, the shared configuration was selected to construct the battery pack on board.
In the process of manufacturing the actual aircraft, the battery mass increases by 4.6% compared to the estimated mass due to factors such as wiring and packaging. The components of the propulsion system, including the ESC, motor, and propeller/rotor, were mainly selected based on the design results. Due to the use of existing finished products, there may be slight differences in the mass of each component. The error of the motor mass is 6.42%, and the propeller and rotor base mass is smaller, so the error reaches 15.2%. However, the results show that the total mass error of the propulsion system is only 5.13%, which is within an acceptable range. This also indicates the effectiveness of the preliminary design and optimization method for electric FW-VTOL UAVs presented in this paper.
Considering that ξ directly affects the battery mass, an error analysis of this parameter is performed. The cell architecture (NL × NS) of shared battery configurations is 17 × 10, with a single cell mass of 50 g, leading to a total cell mass of 8.5 kg, whereas the actual battery mass is 10.7 kg. When ξ = 1, the battery mass is 8.5 kg with an error of 20.56%; when ξ = 1.4, the battery mass is 11.9 kg with an error of 11.2%. It can be observed that the variation in this value has a significant impact on the battery mass. Therefore, various influencing factors should be comprehensively considered to reduce the error during the selection process of this value. Here, the value is set to 1.2, the battery mass is 10.2 kg with an error of 4.6%. Due to some parameters, such as the length of the output cable, being unpredictable in the initial design process, this error may be unavoidable. However, since the error is relatively small, it is deemed acceptable in the preliminary design phase.
At the same time, based on the requirements for hover and cruise states, a preliminary optimization design for the propeller/rotor was conducted. The variation in the optimized propeller/rotor geometry parameters is presented in Figure 13. In the cruise state, a single propeller is used, and the optimized propeller diameter DP is 0.61 m, the chord length distribution parameter cP = [0.0373, 0.0444, 0.0589, 0.0145], the twist angle distribution parameter θP = [52.37, 15.78, 12.17, 7.8]. In the vertical takeoff state, four rotors provide thrust, with each rotor having a diameter DR of 0.76 m, the chord length distribution parameter cR = [0.0309, 0.099, 0.0497, 0.0263], the twist angle distribution parameter θR = [36.19, 8.83, 7.67, 5.5].
Performance analysis of the propeller/rotor was conducted based on the BEMT method, as illustrated in Figure 14. Under the cruise state (with an inflow speed of 25 m/s), the propeller efficiency ηP is 78.6%, and the efficiency of the propeller’s forward flight motor ηmP is 91.3%. In the vertical takeoff state (with an inflow speed of 3 m/s), the efficiency of the rotor ηR is 82.4%, and the efficiency of the rotor’s vertical takeoff motor ηmR is 91.6%.

6.2. Cell Energy for Different Battery Configurations

Based on the design requirements for the FW-VTOL UAV in different modes, the power and energy demands of the battery, as well as the discharge duration, can be determined for each mode, as presented in Table 4. The maximum discharge duration in the VTOL ascent (2.75 min) is calculated by δSHtrans/(dh/dt). The transition flight lasts only a few seconds; for safety considerations, it is taken as 0.5 min. From Table 4, it is evident that the battery power requirements for FW mode and VTOL mode differ by several tens of times, but the energy reserves for both flight modes are of the same order of magnitude. Therefore, the battery performance of FW-VTOL UAVs cannot be approximated in a single flight state as in traditional FW UAV or multi-rotor battery sizing processes. This also highlights the necessity of considering the actual discharge process comprehensively during the design of electric FW-VTOL UAVs.
According to the energy supply process of different battery configurations, the small-capacity cells in dedicated battery packs A1 and A2 are required to be continuously discharged at their respective constant discharge power for 6 min and 90 min, respectively. With an initial SOC of 0.9 and a cutoff voltage of 2.5 V, the maximum discharge duration Tdis,max at different constant discharge power PC,cont can be analyzed, and the maximum available energy EC,max can be obtained by multiplying PC,cont by Tdis,max, as shown in Figure 15. When the cells need to maintain a constant discharge duration of 6 min, the maximum allowable constant discharge power for the cells should not exceed 69.6 W, corresponding to a maximum available energy of 6.32 Wh. On the other hand, maintaining a discharge time of 90 min requires a discharge power not exceeding 6.5 W, corresponding to a maximum available energy of 9.75 Wh. This also demonstrates a discharge phenomenon consistent with Peukert’s effect: the increase in discharge power brings a significant decrease in the cell’s maximum available energy. The cell’s maximum available energy corresponding to the higher discharge power (69.6 W) is only 64.8% of the maximum available energy corresponding to the lower discharge power value of 6.5 W.
Cell energy in the shared battery pack B is consumed during continuous discharge, with segmented discharge power in both FW and VTOL modes. The evaluation of the maximum available energy of the battery is conducted using the process illustrated in Figure 4, requiring a total discharge time of 96 min. Figure 16 illustrates the relationship between the terminal voltage at the end of discharge Ub,end and the cell discharge power PC,B. The optimal PC,B corresponding to the cutoff voltage of 2.5 V is approximately 3.62 W. Based on the discharge process, the cell’s maximum available energy of battery pack B can be determined to be 9.16 Wh.

6.3. Cell Power for Different Battery Configurations

According to the power requirements of FW-VTOL UAV in different modes, the cell discharge power reaches its maximum during the transition mode. Considering that the cell’s available power decreases as the available energy drops, it is only necessary to ensure that the battery can meet the required power during the transition phase from FW flight to VTOL flight. Based on the discharge process of different battery configurations shown in Figure 3, the SOC lower limit where the transition flight possible occurs ( S O C 0 * ) is reached at t = 3 min for cells in battery pack A1 and t = 93 min for cells in battery pack B. The value of S O C 0 * is obtained from discharge simulation, which is 58.6% for the cell in battery pack A1 and 23% for the cell in battery pack B, as shown in Figure 17. These S O C 0 * values can be taken as the initial SOC in the maximum design power evaluation process to calculate the correspondence between the constant discharge power and maximum discharge duration, and the results are presented in Figure 18. It indicates that the ability to discharge at maximum power at a high SOC is significantly stronger than that at a low SOC: the maximum design power corresponding to a maximum discharge duration of 30 s is 96.35 W for cells in battery pack A1 ( S O C 0 * = 58.6%), but only 62.5 W for cells in battery pack B ( S O C 0 * = 23%).
Figure 19 summarizes the cell performance for the dedicated battery packs A1 and A2 and the shared battery pack B calculated according to the practical discharge process. It indicates that although the same cell is employed for the three battery packs equipped on FW-VTOL UAV, the cell performance varies greatly due to the power-energy effect and the impact of SOC on maximum power discharge capability in the practical discharge processes of the battery packs equipped on FW-VTOL UAV.
The dedicated battery configuration increases cell maximum design power by raising the SOC lower limit, but the increase in discharge power also results in a reduction in cell available energy. The shared battery configuration improves battery energy efficiency by reducing the power load of each cell inside. Although the cell’s maximum design power of the shared battery pack is only 66% of that of dedicated battery pack A1, it reduces the attenuation of the cell’s available energy to the greatest extent. When the disadvantages of energy degradation in the dedicated battery configuration outweigh its advantages in maximum power, it leads to an inferior battery sizing result compared to the more balanced shared battery pack. Therefore, the study ultimately selects the shared battery pack solution.
According to the performance of cells in different battery configurations, the number of cells in series and parallel, as well as the battery mass, can be determined, as listed in Table 5. Two additional battery sizing results obtained using constant power/energy density methods are also listed in the table. The comparison shows that the cell-based battery sizing method eliminates the subjectivity of battery power/energy density selection in traditional battery sizing processes and provides more accurate battery sizing results than the conventional constant power/energy density method. The error between the battery mass predicted by the cell-based battery sizing method and the battery mass derived from actual manufactured aircraft data is only 4.7%, which is mainly due to factors such as wires, packaging, etc. Despite this, it is completely acceptable at the preliminary design and optimization stage.
The selection process of real equipment (e.g., motor, rotor, propeller, etc.) may inevitably cause the actual performance to be different from the design value, which directly affects the battery mass and endurance. Thus, the difference between the design value and the actual value is necessary here. The fixed-wing propeller power combination is a GA6000 motor of Shanghai Dualsky Model Co., Ltd., Shanghai, China with a matching 24in-propeller, and the rotor power is an X100 motor with a 30in-rotor of Zhongshan Xiaoying Power Technology Co., Ltd., Zhongshan, China. The comparison of the motor design parameters with the real parameters is shown in Table 6. Compared to the design values, the mass of the real-life rotor motor increased by 8.47%, and the fixed-wing motor increased by 3%. The efficiency of the real motor and the variation in the thrust after matching the propeller/rotor are shown in Figure 20.
In the cruise state, the efficiency of the real-life fixed-wing motor is 90.4%, and the propeller efficiency is 76.4%, thus, the efficiency of the fixed-wing propeller power combination equipped on the actual aircraft is 69.1%. In the rotor mode, the efficiency of the real-life rotor motor is 90.2%, and the rotor efficiency is 80.5%; thus, the efficiency of the rotor power combination equipped on the actual aircraft is 72.5%. On the other hand, the theoretical analysis and optimization results show that the efficiency of the fixed-wing power combination is 70.7%, and the efficiency of the rotor power combination is 74.6%. Comparing the above results, it can be found that the real and theoretical analyses of the efficiency values are similar; the power error brought by the propulsion system in the cruise state is 1.6%, which is only converted into a duration of 2 min, and the error in the rotor state is also only 2.1%. Thus, the effect of the propulsion system can be ignored in the analysis process.
Additionally, differences in aerodynamic characteristics may also influence endurance. The aspect ratio AR is equal to 18 and the zero-lift drag coefficient CD0 is 0.03 in the theoretical analysis process. Then, the comparisons between the estimated aerodynamic characteristics and the actual aircraft are shown in Figure 21. It can be observed that the drag of the actual aircraft is larger than the estimated value, especially at large angles of attack, which is mainly because the aerodynamic separation cannot be considered in the theoretical analysis process. However, the aerodynamic estimation value is within the acceptable range at a small angle of attack, such as in the cruise state. The theoretical estimation of the lift-to-drag ratio is 17.15, while the corresponding lift-to-drag ratio of actual aircraft is 16.73 at a 4° angle of attack, which is reduced by 0.42 relative to the theoretical value. This difference brings about a 2.5% increase in cruise power and a 2.26 min drop in duration in the ideal case, both within acceptable limits for the preliminary design results.

7. Conclusions

This paper proposes a preliminary design and optimization approach for electric FW-VTOL UAVs based on the cell discharge characteristics and power system features. Through multimodal constraint analysis of electric FW-VTOL UAVs, design requirements are converted into shape and power demands. By testing the performance of small-capacity cells inside the battery pack, a battery performance model is constructed using small-capacity battery cells as the basic unit for battery sizing. Additionally, optimization design models for propellers and rotors are established, and a BLDC motor performance model is developed based on a first-order motor model and statistical data, completing the optimization matching of the electric propulsion system. And finally, the preliminary design and optimization method for electric FW-VTOL UAVs, which takes into account battery discharge characteristics, is established.
Benefiting from the cell discharge model established on the real cell parameters and performance test data, the cell-based battery performance model is capable of capturing some discharge characteristics important for the batteries equipped on electric FW-VTOL UAVs, such as the power-energy effect in two distinct flight modes and the impact of SOC on the cell’s maximum design power. Thus, the proposed method eliminates the subjectivity of battery power/energy density selection in traditional battery sizing processes and provides more accurate battery sizing results than the conventional constant power/energy density method. Furthermore, by comparing the advantages and disadvantages of different battery configurations, the dedicated battery configuration can increase cell maximum design power by raising the SOC lower limit, but the increase in discharge power also will lead to a reduction in cell available energy. The shared battery configuration can improve the battery energy efficiency by reducing the power load on each cell inside. During the design process, it is necessary to balance the disadvantages brought by energy attenuation with the advantages of maximum power to select the optimal battery configuration. Additionally, the BLDC motor performance model based on statistical data and the optimization matching design of propellers/rotors also effectively enhance the accuracy of the design results. The results show that the total mass error of the propulsion system is only 6.98%, which is within an acceptable range.
A real 30 kg electric FW-VTOL UAV design case study is presented, and flight tests have been completed. The results highlight the specificity of the performance requirements of the battery equipped on FW-VTOL UAV and also illustrate the strong impact of the discharge process on the performance of small-capacity cells inside the battery packs. Based on the design results, the optimal power system combination is selected, and a comparison is made between the actual aircraft data and the design results, demonstrating the accuracy and feasibility of the proposed method. This method can either be used for resizing an existing FW-VTOL UAV or play a role in the preliminary design process of a new electric FW-VTOL UAV project, both providing a useful tool for aircraft designers.

Supplementary Materials

The following supporting information can be downloaded at: https://www.mdpi.com/article/10.3390/drones9060415/s1.

Author Contributions

Conceptualization, C.H. and Y.T.; methodology, C.H. and D.L.; validation, S.Y.; formal analysis, F.Z.; investigation, C.H.; resources, D.L.; data curation, C.H.; writing—original draft preparation, C.H. and Y.T.; writing—review and editing, C.H. and D.L.; visualization, C.H.; supervision, F.Z.; project administration, C.H.; funding acquisition, S.Y. All authors have read and agreed to the published version of the manuscript.

Funding

This research was funded by the National Key Laboratory of Fundamental Algorithms and Models for Engineering Numerical Simulation, the Open Project of the State Key Laborator of Aerodynamics under Grant RAL202401-2, and the National Natural Science Foundation of China (No. 62427801).

Data Availability Statement

The data presented in this study are available on request from the corresponding author.

Conflicts of Interest

The authors declare no conflicts of interest.

References

  1. Cong, K.; Ma, D.; Xia, X.; Cheng, Y.; Guan, H.; Zhao, B. A Novel Sizing Methodology for Fixed-Wing VTOL UAVs Considering Constraint on Minimum Transition Time. Aerosp. Sci. Technol. 2025, 157, 109838. [Google Scholar] [CrossRef]
  2. Saeed, A.S.; Younes, A.B.; Islam, S.; Dias, J.; Seneviratne, L.; Cai, G. A Review on the Platform Design, Dynamic Modeling and Control of Hybrid UAVs. In Proceedings of the 2015 International Conference on Unmanned Aircraft Systems (ICUAS), Denver, CO, USA, 9–12 June 2015; pp. 806–815. [Google Scholar] [CrossRef]
  3. Ozdemir, U.; Aktas, Y.O.; Vuruskan, A.; Dereli, Y.; Tarhan, A.F.; Demirbag, K.; Erdem, A.; Kalaycioglu, G.D.; Ozkol, I.; Inalhan, G. Design of a Commercial Hybrid VTOL UAV System. J. Intell. Robot. Syst. Theory Appl. 2014, 74, 371–393. [Google Scholar] [CrossRef]
  4. Tyan, M.; Van Nguyen, N.; Kim, S.; Lee, J.W. Comprehensive Preliminary Sizing/Resizing Method for a Fixed Wing—VTOL Electric UAV. Aerosp. Sci. Technol. 2017, 71, 30–41. [Google Scholar] [CrossRef]
  5. Pornet, C.; Isikveren, A.T. Conceptual Design of Hybrid-Electric Transport Aircraft. Prog. Aerosp. Sci. 2015, 79, 114–135. [Google Scholar] [CrossRef]
  6. Frosina, E.; Caputo, C.; Marinaro, G.; Senatore, A.; Pascarella, C.; Di Lorenzo, G. Modelling of a Hybrid-Electric Light Aircraft. Energy Procedia 2017, 126, 1155–1162. [Google Scholar] [CrossRef]
  7. Mazzeo, F.; de Angelis, E.L.; Giulietti, F.; Talamelli, A.; Leali, F. Performance Analysis and Conceptual Design of Lightweight UAV for Urban Air Mobility. Drones 2024, 8, 507. [Google Scholar] [CrossRef]
  8. Sliwinski, J.; Gardi, A.; Marino, M.; Sabatini, R. Hybrid-Electric Propulsion Integration in Unmanned Aircraft. Energy 2017, 140, 1407–1416. [Google Scholar] [CrossRef]
  9. Abdilla, A.; Richards, A.; Burrow, S. Power and Endurance Modelling of Battery-Powered Rotorcraft. In Proceedings of the 2015 IEEE/RSJ International Conference on Intelligent Robots and Systems (IROS), Hamburg, Germany, 28 September–2 October 2015; pp. 675–680. [Google Scholar] [CrossRef]
  10. Mulgaonkar, Y.; Kumar, V. Autonomous Charging to Enable Long-Endurance Missions for Small Aerial Robots. Micro-Nanotechnol. Sens. Syst. Appl. VI 2014, 9083, 90831S. [Google Scholar] [CrossRef]
  11. Abu Salem, K.; Palaia, G.; Quarta, A.A. Review of Hybrid-Electric Aircraft Technologies and Designs: Critical Analysis and Novel Solutions. Prog. Aerosp. Sci. 2023, 141, 100924. [Google Scholar] [CrossRef]
  12. Chang, T.; Yu, H. Improving Electric Powered UAVs’ Endurance by Incorporating Battery Dumping Concept. Procedia Eng. 2015, 99, 168–179. [Google Scholar] [CrossRef]
  13. Gatti, M.; Giulietti, F.; Turci, M. Maximum endurance for battery-powered rotary-wing aircraft. Aerosp. Sci. Technol. 2015, 45, 174–179. [Google Scholar] [CrossRef]
  14. Traub, L.W. Optimal Battery Weight Fraction for Maximum Aircraft Range and Endurance. J. Aircr. 2016, 53, 1176–1178. [Google Scholar] [CrossRef]
  15. Asli, M.; König, P.; Sharma, D.; Pontika, E.; Huete, J.; Konda, K.R.; Mathiazhagan, A.; Xie, T.; Höschler, K.; Laskaridis, P. Thermal Management Challenges in Hybrid-Electric Propulsion Aircraft. Prog. Aerosp. Sci. 2024, 144, 100967. [Google Scholar] [CrossRef]
  16. Omar, N.; Van den Bossche, P.; Coosemans, T.; Van Mierlo, J. Peukert Revisited-Critical Appraisal and Need for Modification for Lithium-Ion Batteries. Energies 2013, 6, 5625–5641. [Google Scholar] [CrossRef]
  17. Riboldi, C.E.D.; Gualdoni, F.; Trainelli, L. Preliminary weight sizing of light pure-electric and hybrid-electric aircraft. Transp. Res. Procedia 2018, 29, 376–389. [Google Scholar] [CrossRef]
  18. Riboldi, C.E.D.; Gualdoni, F. An Integrated Approach to the Preliminary Weight Sizing of Small Electric Aircraft. Aerosp. Sci. Technol. 2016, 58, 134–149. [Google Scholar] [CrossRef]
  19. Chen, G.; Ma, D.; Jia, Y.; Xia, X.; He, C. Comprehensive Sizing and Optimization Method for Series-Hybrid Unmanned Convertiplane. Chin. J. Aeronaut. 2021, 34, 387–402. [Google Scholar] [CrossRef]
  20. Magnussen, Ø.; Hovland, G.; Ottestad, M. Multicopter UAV Design Optimization. In Proceedings of the 2014 IEEE/ASME 10th International Conference on Mechatronic and Embedded Systems and Applications (MESA), Senigallia, Italy, 10–12 September 2014; pp. 1–6. [Google Scholar] [CrossRef]
  21. Fuller, M.E. A Battery Model for Constant-Power Discharge Including Rate Effects. Energy Convers. Manag. 2014, 88, 199–205. [Google Scholar] [CrossRef]
  22. Hu, X.; Li, S.; Peng, H. A Comparative Study of Equivalent Circuit Models for Li-Ion Batteries. J. Power Sources 2012, 198, 359–367. [Google Scholar] [CrossRef]
  23. He, C.; Zhan, F.; Ma, L.; Chen, G.; Ma, J. Aero-Structural Design of Joined-Wing Aircraft Based on High-Fidelity Model. Chin. J. Aeronaut. 2024, 37, 363–377. [Google Scholar] [CrossRef]
  24. Serrano, A.R. Design Methodology for Hybrid (VTOL + Fixed Wing) Unmanned Aerial Vehicles. Aeronaut. Aerosp. Open Access J. 2018, 2, 165–176. [Google Scholar] [CrossRef]
  25. Zhao, W.; Wang, Y.; Li, L.; Huang, F.; Zhan, H.; Fu, Y.; Song, Y. Design and Flight Simulation Verification of the Dragonfly EVTOL Aircraft. Drones 2024, 8, 311. [Google Scholar] [CrossRef]
  26. He, C.; Jia, Y.; Ma, D. Optimization and Analysis of Hybrid Electric System for Distributed Propulsion Tilt-Wing UAV. IEEE Access 2020, 8, 224654–224667. [Google Scholar] [CrossRef]
  27. Bodlak, E. The Design Space Exploration and Preliminary Testing of a New Class of Tailsitting Quadrotor Aircraft. Ph.D. Thesis, University of Kansas, Lawrence, KS, USA, 2016. [Google Scholar]
  28. Donateo, T.; Spedicato, L. Fuel Economy of Hybrid Electric Flight. Appl. Energy 2017, 206, 723–738. [Google Scholar] [CrossRef]
  29. Plett, G.L. Extended Kalman Filtering for Battery Management Systems of LiPB-Based HEV Battery Packs—Part 1. Background. J. Power Sources 2004, 134, 252–261. [Google Scholar] [CrossRef]
  30. Guzzella, L.; Sciarretta, A. Vehicle Propulsion Systems: Introduction to Modeling and Optimization, 3rd ed.; Springer: Berlin, Germany, 2013; p. 96. [Google Scholar]
  31. Bershadsky, D.; Haviland, S.; Johnson, E.N. Electric Multirotor Propulsion System Sizing for Performance Prediction and Design Optimization. In Proceedings of the 57th AIAA/ASCE/AHS/ASC Structures, Structural Dynamics, and Materials Conference, San Diego, CA, USA, 4–8 January 2016; pp. 1–22. [Google Scholar] [CrossRef]
  32. Xia, X.; Ma, D.; Zhang, L.; Liu, X.; Cong, K. Blade Shape Optimization and Analysis of a Propeller for VTOL Based on an Inverse Method. Appl. Sci. 2022, 12, 3694. [Google Scholar] [CrossRef]
  33. Wang, H.; Li, G.; Li, J.; Zhuang, J. Aerodynamic Investigation for a Propeller-Induced Lift-Enhancing Vertical Take-Off and Landing (VTOL) Configuration. Drones 2025, 9, 20. [Google Scholar] [CrossRef]
  34. He, C.; Chen, G.; Sun, X.; Li, S.; Li, Y. Geometrically Compatible Integrated Design Method for Conformal Rotor and Nacelle of Distributed Propulsion Tilt-Wing UAV. Chin. J. Aeronaut. 2023, 36, 229–245. [Google Scholar] [CrossRef]
  35. Hicks, R.M.; Cliff, S.E. An Evaluation of Three Two-Dimensional Computational Fluid Dynamics Codes Including Low Reynolds Numbers and Transonic Mach Numbers; NASA: Washington, DC, USA, 1991. [Google Scholar]
Figure 1. Composite electric FW-VTOL UAV configuration and typical flight profile. (a) FW-VTOL UAV configuration; (b) Typical flight profile.
Drones 09 00415 g001
Figure 2. Flowchart of the cell-based battery sizing methodology.
Drones 09 00415 g002
Figure 3. Operating modes and discharge processes for dedicated and shared battery configurations.
Drones 09 00415 g003
Figure 4. A total of 18650 cell constant current discharge data. (a) Comparison of 18650 cell constant current discharge test results with simulation results (See Table S1 for data); (b) The variation of Uoc and Ri with 1-SOC.
Drones 09 00415 g004
Figure 5. Constant power discharge simulation of an 18650-cell obtained by using the cell discharge model.
Drones 09 00415 g005
Figure 6. Time-stepping process for calculating Ub,end for a given PC,B.
Drones 09 00415 g006
Figure 7. Motor parameters and performance statistics. (a) Statistical relationship between motor mass and maximum power; (b) Statistical relationship between motor speed constant and mass; (c) Statistical relationship between motor internal resistance and maximum power; (d) Statistical relationship between motor no-load current and internal resistance (Data can be found in Table S2).
Drones 09 00415 g007
Figure 8. Statistical relationship between ESC mass and maximum power.
Drones 09 00415 g008
Figure 9. Propeller/rotor optimization design process.
Drones 09 00415 g009
Figure 10. The main flow of the preliminary design and optimization of the electric FW-VTOL UAV (* represents the process of optimizing the total take-off mass).
Drones 09 00415 g010
Figure 11. Flight profile of the 30 kg composite wing electric FW-VTOL UAV.
Drones 09 00415 g011
Figure 12. The design space under performance constraint analysis and test flight of the 30 kg composite wing electric FW-VTOL UAV. (a) The design space (★ is the optimal point); (b) flight test.
Drones 09 00415 g012
Figure 13. The variation in the optimized propeller/rotor geometry parameters. (a) propeller geometry parameters; (b) rotor geometry parameters.
Drones 09 00415 g013
Figure 14. Performance of the optimized propeller/rotor. (a) optimized propeller performance; (b) optimized rotor performance.
Drones 09 00415 g014
Figure 15. Cell maximum discharge duration and cell maximum available energy, both as functions of the cell’s constant discharge power (Red ▲ represents the discharge duration of the cell at 6.5W, red ★ represents the corresponding maximum available energy. Blue ▲ represents the discharge duration of the cell at 69.6W, blue ★ represents the corresponding maximum available energy).
Drones 09 00415 g015
Figure 16. Cell terminal voltage at the end of discharge as a function of cell discharge power of battery pack B PC,B (red ● represents the cutoff voltage of 2.5V).
Drones 09 00415 g016
Figure 17. Discharge simulation of the continuous discharge process from the initial SOC to the SOC lower limit. (a) Discharge simulation of cells in battery pack A1 from t = 0 to t = 3 min; (b) Discharge simulation of cells in battery pack B from t = 0 to t = 93 min.
Drones 09 00415 g017
Figure 18. Maximum design power evaluation for the cells in battery packs A1 and B (blue ● represents the discharging power of battery pack A1 for a duration of 30s, orange ● represents the discharging power of battery pack B for a duration of 30s).
Drones 09 00415 g018
Figure 19. Comparison of cell performance of the three battery packs. * note that cells in battery pack A2 are only constrained by energy demand, so the 6.5 W drawn in this figure is actually the continuous discharge power (A1, A2, B represent battery pack A1, A2, B).
Drones 09 00415 g019
Figure 20. The efficiency of the real motor and the variation in the thrust after matching the propeller/rotor. (a) The real propeller motor; (b) The real rotor motor.
Drones 09 00415 g020
Figure 21. Comparisons between the estimated aerodynamic characteristics and the actual aircraft. (a) Variation in CD with CL; (b) Variation in K with CL.
Drones 09 00415 g021
Table 1. Parameters of the selected 18650 lithium-ion cell.
ParameterValue
Rated capacity3 Ah
Mass50 g
Maximum discharge voltage4.2 V
Cut off voltage2.5 V
Rated voltage3.6 V
Table 2. Design requirements and parameters of a 30 kg electric FW-VTOL UAV.
Design RequirementValueParameterValue
Rate of climb dh/dt (m/s)3Aspect ratio AR18
Transition altitude Htrans (m)100Zero-lift drag coefficient CD00.03
Safety margin coefficient δS5Oswald’s span efficiency factor e0.68
Static thrust coefficient δT1.3Drag coefficient (VTOL) CD,VTOL0.6
Cruise speed V (m/s)25Battery-rated voltage UBatt (V)36
Endurance in FW mode te (min)90
Table 3. Parameters of the final result of the preliminary design and optimization.
ItemsDedicated ConfigurationShared ConfigurationActual Aircraft (Shared Configuration)
Takeoff mass (kg)303030
Wing loading (N/m2)192.5192.5196
Wing area (m2)1.531.531.5
Wing span (m)5.255.255
Structural mass (kg)10.510.59.7
Avionics mass (kg)1.51.51.25
Payload mass (kg)1.563.363.67
Battery mass (kg)1210.210.7
ESC mass (kg)0.560.560.64
Motor mass (kg)3.353.353.58
Propeller/rotor mass (kg)0.530.530.46
Table 4. The battery power and energy demands and the discharge duration in different modes.
Flight StageVTOL Ascent/DescentVTOL TransitionFW Cruise
Power value (kW)6.3510.030.57
Energy value (Wh)58283 855
Duration (min)5.50.590
Table 5. Battery mass sizing results for dedicated and shared battery configurations. Typical values of constant power/energy density were employed in the latter two methods, which are: (1) 150 Wh/kg [4]; (2) 140 Wh/kg, 850 W/kg [17].
ItemDedicated ConfigurationShared ConfigurationConstant Power/Energy Density 1 [4]Constant Power/Energy Density 2 [17]Actual (Shared Configuration)
A1A2B
NL × NS11 × 109 × 1017 × 10--17 × 10
MBatt, kg6.65.410.29.5811.810.7
Error12.1%4.6%10.5%10.3%-
Table 6. Comparison of motor parameters.
Motor TypeParameterSpeed Constant KVInternal Resistance R0 (mΩ)No-Load Current I0 (A)Mass Mm (kg)
Rotor motorDesign result1190.0221.350.59
Real-life rotor motor1150.0371.30.64
Fix-wing motorDesign result1650.0162.140.99
Real-life fixed-wing motor1600.0171.81.02
Disclaimer/Publisher’s Note: The statements, opinions and data contained in all publications are solely those of the individual author(s) and contributor(s) and not of MDPI and/or the editor(s). MDPI and/or the editor(s) disclaim responsibility for any injury to people or property resulting from any ideas, methods, instructions or products referred to in the content.

