Article

A Cooperative Longitudinal-Lateral Platoon Control Framework with Dynamic Lane Management for Unmanned Ground Vehicles Based on A Dual-Stage Multi-Objective MPC Approach

1
Jiangsu Province Collaborative Innovation Center of Modern Urban Traffic Technologies, Southeast University, Nanjing 210096, China
2
Guangdong Provincial Key Laboratory of Intelligent Transportation Systems, Sun Yat-Sen University, Shenzhen 518107, China
*
Author to whom correspondence should be addressed.
Drones 2025, 9(10), 711; https://doi.org/10.3390/drones9100711 (registering DOI)
Submission received: 20 August 2025 / Revised: 7 October 2025 / Accepted: 12 October 2025 / Published: 14 October 2025
(This article belongs to the Section Innovative Urban Mobility)

Abstract

Highlights

What are the main findings?
  • A cooperative longitudinal–lateral platoon control framework using a dual-stage multi-objective MPC with adaptive weighting is proposed.
  • A dynamic lane management mechanism enabling adaptive opening of UGV-dedicated lanes to improve platoon formation and stability is developed.
What is the implication of the main finding?
  • The adaptive MPC strategy reduces the platoon formation time by 41.6% with negligible traffic speed reductions in mixed UGV–HDV traffic.
  • Dynamic lane management yields longer, more stable platoons under varying penetration levels, especially in high-flow environments.

Abstract

Cooperative longitudinal–lateral trajectory optimization is essential for unmanned ground vehicle (UGV) platoons to improve safety, capacity, and efficiency. However, existing approaches often face unstable formation under low penetration rates and rely on fragmented control strategies. This study develops a cooperative longitudinal–lateral trajectory tracking framework tailored for UGV platooning, embedded in a hierarchical control architecture. Dual-stage multi-objective Model Predictive Control (MPC) is proposed, decomposing trajectory planning into pursuit and platooning phases. Each stage employs adaptive weighting to balance platoon efficiency and traffic performance across varying operating conditions. Furthermore, a traffic-aware organizational module is designed to enable the dynamic opening of UGV-dedicated lanes, ensuring that platoon formation remains compatible with overall traffic flow. Simulation results demonstrate that the adaptive weighting strategy reduces the platoon formation time by 41.6% with only a 1.29% reduction in the average traffic speed. In addition, the dynamic lane management mechanism yields longer and more stable UGV platoons under different penetration levels, particularly in high-flow environments. The proposed cooperative framework provides a scalable solution for advancing UGV platoon control and demonstrates the potential of unmanned systems in future intelligent transportation applications.

1. Introduction

With the rapid development of unmanned systems and intelligent transportation technologies, unmanned ground vehicles (UGVs) have emerged as a key enabler of next-generation mobility solutions [1,2,3,4]. UGVs are defined as autonomous ground-based vehicles equipped with onboard perception, decision-making, and communication capabilities, which enable them to operate without direct human control and to cooperate with other vehicles and infrastructure in intelligent transportation systems. Platooning, defined as a group of vehicles traveling with uniform headways and speeds [5], has long been envisioned as a promising solution to improve roadway efficiency and safety. By reducing aerodynamic drag, platooning can significantly lower fuel consumption, particularly for heavy-duty vehicles [6,7,8]. The concept dates back more than sixty years [9,10,11], yet practical implementation with human-driven vehicles (HDVs) remains difficult due to inconsistent driving behaviors. The rapid advancement of UGV technologies has greatly facilitated platoon development [12,13,14]. Through automation and connectivity, UGVs enable precise trajectory tracking and efficient information exchange via vehicle-to-vehicle (V2V) and vehicle-to-infrastructure (V2I) communication [15]. These capabilities allow UGV platoons to operate with short inter-vehicle distances and synchronized maneuvers, improving throughput and traffic stability. Consequently, UGV platooning delivers multiple system benefits—smoother traffic flow, congestion mitigation, fuel efficiency, and enhanced safety—that have attracted substantial scholarly and industrial attention [16,17,18,19].
Extensive field trials have validated platooning feasibility, with truck platoons representing one of the earliest commercial applications. Large-scale initiatives, including Chauffeur, California PATH, KONVOI, and Energy ITS, confirmed both technical viability and fuel-saving potential [20,21,22,23]. In mixed UGV–HDV traffic, however, stochastic HDV behaviors pose challenges for platoon initiation and stability. To address this, three main platoon formation strategies have emerged [24]. Ad hoc Platoon Formation (APF) assumes stochastic arrivals, with performance highly sensitive to UGV penetration; studies highlight its impact on capacity and stability, as well as the benefits of dedicated UGV lanes [25,26,27,28,29]. Locally coordinated Platoon Formation (LPF) enhances robustness by enabling UGVs to merge via communication and lane changes, supported by strategies balancing safety, efficiency, and external impacts [30,31,32,33]. Globally coordinated Platoon Formation (GPF) instead relies on system-wide scheduling to assemble vehicles with similar destinations, improving logistics and reducing emissions [34,35].
At the vehicle-control level, translating theoretical platoon trajectories into real-world maneuvers requires effective disturbance handling. Most studies design separate controllers for longitudinal and lateral dynamics [36], while some integrate both into unified frameworks [37]. Existing approaches are largely dominated by single-input single-output (SISO) methods, such as PID control, which regulate motion based on instantaneous errors. Although simple and widely adopted, SISO controllers lack predictive capability. By contrast, multi-input multi-output (MIMO) approaches, particularly Model Predictive Control (MPC), optimize trajectories over short horizons using predictive models, offering higher precision and coordination. Nevertheless, their adoption in UGV platooning remains limited due to the difficulty of obtaining reliable future trajectory data and balancing platoon-level objectives with overall traffic performance [38]. These methodological contrasts underscore the need for integrated and adaptive control architectures capable of jointly managing longitudinal–lateral dynamics in dynamic mixed traffic.
Despite extensive research, several critical gaps remain in platoon formation and control studies:
(1)
Limited platoon initiation: Sparse UGV distribution at early deployment stages reduces immediate platoon formation probability, constraining system efficiency gains.
(2)
Fragmented control architecture: Separate longitudinal or lateral control lacks an integrated system architecture to jointly optimize both trajectory dimensions in real time.
(3)
Rigid infrastructure usage: Incongruent lane use in high traffic flow impairs system adaptability, as dynamic management of UGV-dedicated lanes is rarely considered.
To address the above limitations, this study proposes a hierarchical cooperative control architecture for UGV platooning in mixed traffic. The framework incorporates dual-stage multi-objective MPC that separates trajectory planning into pursuit and platooning phases, with adaptive weights adjusting system objectives under varying traffic states. This design ensures coordinated longitudinal–lateral trajectory tracking and improves formation stability, particularly under low UGV penetration. In addition, a traffic-aware management module is introduced to dynamically regulate access to UGV-dedicated lanes, aligning platoon organization with overall traffic demand. Together, these components target the critical challenges of fragmented control and rigid lane use, providing a structured pathway for advancing cooperative UGV platoon formation.
To overcome these limitations, this study makes the following contributions:
(1)
Adaptive platoon control: A cooperative trajectory-tracking strategy is developed for UGVs, structured into pursuit and platoon stages. This hierarchical control approach ensures coordinated tracking and robust platoon formation even under low UGV penetration.
(2)
Dual-stage MPC method: A novel dual-stage multi-objective MPC algorithm is developed with stage-specific objectives to coordinate longitudinal and lateral control. The adaptive weighting scheme dynamically adjusts control actions to traffic conditions, improving platoon stability and responsiveness.
(3)
Dynamic lane management: A traffic-aware platoon organization mechanism is proposed, allowing adaptive opening of UGV-dedicated lanes. This strategy accelerates platoon formation, sustains longer and more stable platoons, and improves traffic efficiency under congestion.
The remainder of this paper is organized as follows. Section 2 reviews the related literature. Section 3 introduces the problem description. Section 4 presents the vehicle dynamics modeling. Section 5 develops a cooperative platoon trajectory control and organization strategies. Section 6 conducts numerical experiments and discusses the results. Section 7 concludes the study.

2. Literature Review

(1) Definition and Potential of Platooning
A platoon is defined as a group of vehicles traveling closely in the same lane with uniform headways and speeds [5]. Platooning can increase road capacity while reducing aerodynamic drag and fuel consumption, particularly for heavy-duty vehicles [6,7,8]. Although the concept of platooning can be traced back more than 60 years [9,10,11], achieving compact and stable formations with traditional human-driven vehicles (HDVs) has remained difficult. The advent of unmanned ground vehicle (UGV) technologies has substantially advanced platoon implementation [12,13]. Vehicle automation reduces human errors and enables precise trajectory control [14], while connectivity through vehicle-to-vehicle (V2V) and vehicle-to-infrastructure (V2I) communication ensures rapid and reliable information exchange [15]. As a result, UGVs can maintain short inter-vehicle distances and synchronized movements, improving traffic throughput and stability [16]. These benefits—including smoother trajectories, energy savings, congestion mitigation, and enhanced safety—have motivated extensive research and applications in platoon systems [17,18,19,20].
(2) Field Experiments and Early Applications
Since the 1990s, large-scale field experiments have been conducted to evaluate the feasibility of platooning, with truck platooning receiving particular attention due to its substantial fuel-saving potential. Truck platoons are often regarded as one of the earliest commercial applications of road automation. Representative projects include Chauffeur [21], California PATH [22], KONVOI [23], and Energy ITS [24]. These pioneering trials have demonstrated not only the technical feasibility but also the practical value of platooning in logistics and freight transport.
(3) Platoon Formation Strategies in Mixed Traffic
In mixed UGV–HDV traffic environments, the uncertainty and randomness of HDV behavior present significant challenges for platoon formation and stability. To address this, three categories of formation strategies have been proposed [25]:
  • Ad hoc Platoon Formation (APF)
APF assumes stochastic arrivals and formations, with performance highly dependent on the market penetration rate (MPR). Although platoons may easily dissolve under dynamic conditions, APF has been extensively studied. Jiang et al. [39] and Chang et al. [40] examined its influence on capacity and stability, while Zhou et al. [28] showed that higher UGV penetration can increase overall flow but amplify randomness due to HDV interference. Lane-based simulations [29] further revealed that UGV-dedicated lanes can outperform APF, improving capacity by up to 25%.
  • Locally coordinated Platoon Formation (LPF)
LPF leverages local communication and lane-changing maneuvers to facilitate faster platoon integration and enhance robustness. Songchitruksa et al. [30], Wang et al. [31], and Papadoulis et al. [32] developed strategies to ensure safe and efficient lane-changing during platoon merging. Lee et al. [33] further highlighted the trade-offs between platoon efficiency and the impact on surrounding non-platooning vehicles.
  • Globally coordinated Platoon Formation (GPF)
GPF adopts a system-level perspective, scheduling vehicles with similar routes or destinations into prearranged platoons. Besselink et al. [34] proposed a global optimization framework supported by V2V communication, while Shao et al. [35] investigated truck platoon scheduling at critical junctions to enhance logistics efficiency and reduce emissions.
(4) Vehicle Control for Platoon Implementation
Beyond formation strategies, platooning ultimately requires theoretical trajectories to be mapped into executable vehicle maneuvers under real-world disturbances. Most studies adopt separate controllers for longitudinal and lateral dynamics [36], though some propose integrated frameworks [37]. Traditional approaches predominantly rely on single-input single-output (SISO) controllers (e.g., PID), which adjust based on instantaneous error signals. More advanced multi-input multi-output (MIMO) approaches, such as MPC, can optimize control over short horizons using trajectory predictions, offering greater accuracy and stability. However, their application in UGV platooning remains limited due to the scarcity of reliable future trajectory data [38]. Consequently, SISO controllers still dominate practical implementations [39,40].

3. Problem Description

This study addresses the cooperative platoon formation task of two connected and automated vehicles (UGVs) in mixed traffic consisting of both human-driven vehicles (HDVs) and UGVs, as illustrated in Figure 1. The scenario considers a highway segment between two ramps or intersections where HDVs follow human driving behavior and UGVs are constrained by the longitudinal trajectory-tracking model. Once two UGVs enter each other’s communication range, the rear UGV (follower) must approach the leading UGV through a sequence of longitudinal car-following and lateral lane-changing maneuvers to eventually form a platoon. This task requires a control strategy that synchronizes the trajectories of both UGVs while minimizing adverse impacts on the surrounding traffic efficiency and safety.
A major challenge lies in the dynamic and uncertain nature of mixed traffic, where interactions with HDVs cannot be fully controlled. Therefore, to capture realistic impacts, the following assumptions are introduced: (1) the microscopic behavior of HDVs on the studied segment can be predicted; (2) macroscopic traffic parameters can be estimated and propagated. Based on these assumptions, MPC is employed to generate optimal discrete control actions that combine longitudinal and lateral trajectories, enabling efficient and stable platoon formation.
MPC, also known as receding horizon or dynamic matrix control, is a model-based optimization framework particularly suitable for systems with predictable dynamics and observable disturbances. In each control horizon, MPC solves an online optimization problem using real-time data to obtain a sequence of control actions, applies the first element to the system, and then repeats the process at the next step. With rich microscopic and macroscopic traffic models available, MPC provides a powerful tool for active platoon control in highway environments.
To mathematically formalize the problem, consider a straight highway with N lanes and discrete time steps t { 0,1 , 2 , } of length δ > 0 . Two UGVs, indexed by i I = { 1,2 } , are considered, where i = 1 is the leader and i = 2 is the follower. At time t , UGV i has position w i t = [ x i t , y i t ] T , velocity v i t = [ v x i t , v y i t ] T , and control input a i t = [ a x i t , a y i t ] T . Each UGV can perceive the states of surrounding vehicles ψ O = O c , O h , including positions w ^ ψ ( t ) , velocities v ^ ψ ( t ) , and accelerations a ^ ψ ( t ) , where O c denotes non-task UGVs and O h denotes HDVs. The set of all vehicles on the road is J = I O . To distinguish between them, task UGVs are denoted as s-UGVs, while other UGVs are denoted as n-UGVs.
Since the follower s-UGV may perform lane changes during pursuit, the car-following relationship of the surrounding vehicles is altered. To model this, binary variables β j n ( t ) , ϖ j , j n ( t ) , and ζ j , j n ( t ) are introduced. Specifically, β j n ( t ) indicates whether vehicle j is in lane n , ϖ j , j n ( t ) indicates whether vehicle j is downstream of vehicle j , and ζ j , j n ( t ) indicates whether vehicle j is following vehicle j . For example, β j n ( t ) can be derived directly from the lateral position y j ( t ) :
β j n t = 1 Vehicle   j   is   running   in   lane   n   at   time   t 0 o t h e r w i s e , ;
ϖ j , j n t = 1 Vehicle   j   is   located   downstream   of   vehicle   j   in   lane   n   at   time   t 0 o t h e r w i s e , ;
ζ j , j n t = 1 Vehicle   j   follows   vehicle   j   in   lane   n   at   time   t 0 o t h e r w i s e , ;
β j n t = y _ n < y j t y n
where y _ n , y n represents the horizontal coordinate boundary of lane n .

4. Vehicle Dynamics Modeling

4.1. Microscopic Dynamics Modeling of UGVs

The motion of a UGV is modeled through longitudinal and lateral dynamics subject to physical and safety constraints. To capture the interactions between vehicle motion and safety in cooperative platooning, this study adopts a discrete-time double integrator as the dynamic backbone and integrates three key elements: (i) physical and comfort bounds, which restrict control inputs and velocities to reflect propulsion and braking limits, posted speeds, and ride comfort; (ii) a braking-based conservative safety headway, defining the minimum longitudinal spacing required during car following and accounting for vehicle length, driver (or system) reaction time, and braking capacity to guarantee collision-free operation; and (iii) discrete switching logic to represent the effects of heterogeneous leaders (s-UGV, n-UGV, or HDV) and lane-change maneuvers on safety constraints. Together, these elements provide a systematic integration of vehicle dynamics, operational limits, and safety interactions for cooperative UGV control.
The vehicle dynamics are represented using a double-integrator model [41]:
w i t + 1 = w i t + δ v i t + δ 2 2 u i t
v i t + 1 = v i t + δ u i t
where w i ( t ) , v i ( t ) , and u i ( t ) denote the position, velocity, and control input of UGV i at time t . Within each interval [ t , t + 1 ) , control input u i ( t ) and velocity v i ( t ) remain constant. To respect comfort and vehicle dynamics, control inputs and velocities are bounded as follows:
a _ u i t a
v _ v i t v
where a _ =   −4 m/s2, a   = 2 m/s2, v _ = 0 m/s, and v = 30 m/s [42].
From a microscopic perspective, each s-UGV must also satisfy longitudinal safety constraints with respect to its predecessor. A conservative safe distance is defined as follows:
x j t x i t L i + ς i v i x t v i x t v x _ 2 2 a x _
where x j t is the position of the preceding vehicle j , L i is the vehicle length, and ς i denotes a constant reaction time. This constraint ensures collision-free operation [43].
Since the preceding vehicle of an s-UGV may dynamically change (it could be another s-UGV, an n-UGV, or an HDV) due to lane-changing maneuvers, the binary variables β i n t and ϖ i , j n ( t ) are introduced to capture lane assignment and downstream relationships. Thus, the safety constraint is reformulated into two cases:
  • Case 1: Following another s-UGV
x j t x i t L i + ς i v i x t v i x t v x _ 2 2 a x _ 3 β i n t β i n t ϖ i , i n t
  • Case 2: Following an n-UGV or HDV
x j t x i t L i + ς i v i x t v i x t v x _ 2 2 a x _ 2 β i n t ϖ i , ψ n t
where x ^ ψ ( t ) is the position of neighboring vehicle ψ . Constraint (10) is activated when β i n t = β i n t = ϖ i , i n t = 1 , indicating that s-UGV i follows another s-UGV i . Constraint (11) is activated when β i n t = ϖ i , ψ n t = 1 , indicating that s-UGV i follows an n-UGV or HDV. Otherwise, both constraints remain inactive.

4.2. Microscopic Dynamics Modeling of HDVs

The development of connected vehicle technologies enables accurate perception and reliable prediction of driving behaviors. Accordingly, this study assumes that HDV behavior can be accurately sensed and predicted. To capture the natural variability of human driving behavior in mixed traffic, the Newell car-following model [44] is employed. This model is widely recognized for its simple mathematical form, ability to replicate real traffic flow, and adaptability, making it suitable for predicting the motion of HDVs without direct control. The model estimates future velocity as follows:
v ^ ψ t + k = δ τ ψ s ψ , j t δ d ψ τ ψ
where s ψ , j ( t ) = x j ( t ) x ^ ψ ( t ) is the spacing between HDV ψ and its leader j , τ ψ is the reaction time, and d ψ is the minimum stopping distance. Both parameters can be adaptively updated through online learning [43]. To ensure consistency with the MPC framework, τ ψ is rounded to an integer multiple of the control step δ .
Because lane-changing maneuvers of s-UGVs can alter the leader–follower relationship, the spacing definition is extended:
s ψ , j t = x j t x ^ ψ t ϖ ψ , j n t = 1 E ϖ ψ , j n t = 0
where E is a large constant. The effective spacing is then defined by the minimum distance to other vehicles, including two s-UGVs:
s ψ , j t = m i n s ψ , ψ t , s ψ , 1 t , s ψ , 2 t
With this formulation, the Newell model is extended to estimate HDV trajectory while considering free-flow conditions:
v ^ ψ t + k = m i n δ τ ψ s ψ , j t δ d ψ τ ψ , v x ¯
x ^ ψ t + k = x ^ ψ t + τ ψ δ v ^ ψ t
where v x ¯ denotes the maximum free-flow velocity.
To evaluate the effect of s-UGV lane-changing maneuvers on HDVs, additional safety constraints are introduced. Following Chen et al. [45], when s-UGV iii inserts itself ahead of HDV ψ at time t ( ζ ψ , i n ( t ) = 1 ; ζ ψ , i n ( t 1 ) = 0 ), the following conditions must hold:
x i t x ^ ψ t d ψ + τ ψ δ v ^ ψ t M 1 ζ ψ , i n t + ζ ψ , i n t 1
v i t v ^ ψ t M 1 ζ ψ , i n t + ζ ψ , i n t 1
where M is a sufficiently large constant. These constraints ensure that the insertion maneuver remains collision-free and consistent with human drivers’ reactions.

4.3. Macroscopic Traffic-Flow Dynamics Modeling

To characterize the aggregate impact of s-UGV platooning on upstream traffic, the cell transmission model (CTM) [46] is adopted. CTM is a discrete approximation of the LWR hydrodynamic model and updates vehicle densities and flows across road segments through a conservation law. The cell length L and time step δ are chosen to satisfy the Courant–Friedrichs–Lewy (CFL) condition Δ L δ v f [47], ensuring stable propagation of traffic flow. We partition the road segment into a series of equal-length cells (indexed by c ) along each lane n . For each cell c and lane n at time t , the standard CTM equations govern the vehicle count dynamics: the number of vehicles in cell c is increased by the inflow from its immediate upstream cell and decreased by the outflow to its downstream cell over T . Specifically, the CTM update Equations (19)–(22) in the manuscript enforce flow conservation and capacity constraints: the upstream inflow to a cell is limited by the downstream cell’s remaining capacity (receiving flow) as well as the upstream supply, and no cell can send out more vehicles than its own content or capacity allows:
ϑ c n t + 1 = ϑ c n t + χ c n t χ c + 1 n t
χ c n t = m i n ξ c 1 n t , r c n t
ξ c n t = m i n ϑ c n t , q c n , max
r c n t = m i n z c n k c n , max k c n t , q c n , m a x
where ϑ c n t is the density, χ c n t is the inflow from cell c 1 , ξ c n t is the outflow to cell c + 1 , r c n t is the receiving flow from cell c 1 , q c n , max is the capacity, z c n is the congestion wave speed, k c n t is the density of cell c in lane n at time t , and k c n , max is the congestion density.
During platoon formation, the s-UGV may accelerate, decelerate, or change lanes to meet the cooperative driving objectives. These maneuvers influence not only the s-UGV’s trajectory but also the surrounding HDVs and n-UGVs in the traffic stream. Such localized disturbances can propagate upstream as congestion waves through the accumulation of vehicle density in certain cells. For instance, if an s-UGV reduces its speed, the density ϑ c n t in its current cell (lane n , cell c ) will increase due to the reduced outflow and potential additional vehicles clustering behind it. By Equation (22), this higher density lowers the cell’s receiving flow r c n t (since a cell closer to jam density can accept fewer incoming vehicles). Consequently, according to Equation (20), the inflow χ c n t from the upstream cell c 1 must decrease (it cannot exceed the reduced receiving flow of cell c ). In summary, the s-UGV’s deceleration leads to a smaller inflow from cell c 1 into cell c in the next time step, effectively propagating a congestion effect upstream. This example illustrates how a microscopic vehicle action (speed change) triggers a macroscopic response (density increase and flow reduction) in the CTM framework.
To explicitly capture the coupling between microscopic vehicle states and the macroscopic traffic evolution, the binary indicators are introduced for vehicle–cell occupancy. The diagonal coordinates of each cell are determined as w c n = x c n , y c n and w _ c n = x _ c n , y _ c n . Based on this, the identification criteria for s-CAVs and the neighboring vehicles are specified in Equations (23) and (24). Specifically, when position w i t of s-CAV i at time t falls within cell c of lane n , the binary variable φ i , c n ( t ) is set to 1; otherwise, it is 0. Similarly, when the position x ^ ψ ( t ) of a neighboring vehicle ψ lies within cell c of lane n , φ ψ , c n ( t ) equals 1; otherwise, 0. The traffic density within each cell, k c n ( t ) , is then calculated using Equation (25):
φ i , c n t = 1 w i t w _ c n , w c n ) 0 otherwise
φ ψ , c n t = 1 x ^ ψ t x _ c n , x c n ) 0 otherwise
k c n t = ϑ c n t δ + j J     ϕ j , c n t Δ L
By combining the macroscopic CTM Equations (19)–(22) with the microscopic occupancy identification (23)–(24) in this hybrid formulation, the model captures the dynamic interaction between individual vehicle maneuvers and the aggregate traffic flow. The micro-to-macro coupling is preserved at each time step: for every action that a vehicle takes, there is a corresponding and quantifiable reaction in the cell-level traffic metrics. This structure enables consistent and traceable updates to the cell density and flow. In practical terms, the evolution of macroscopic traffic parameters (like density) in this model is predictable because it is explicitly driven by the sum of binary contributions from vehicles, underpinned by the deterministic CTM flow conservation logic. The result is a unified framework that can analyze and predict how individual vehicle behaviors (e.g., joining a platoon, slowing down, or changing lanes) ripple through and influence the overall traffic stream. This hybrid CTM framework ensures that the interplay between microscopic vehicle maneuvers and macroscopic traffic evolution during platoon formation is faithfully represented, allowing congestion formation and propagation to be traced back to specific vehicle actions in a rigorous way.

5. Hybrid MPC-Based UGV Platoon Organization Framework

5.1. Generation of Reference Trajectories for UGVs

The Bézier curve enables flexible trajectory shaping through the selection of control points. It offers several advantages, including continuous and differentiable curvature, ease of tracking, compliance with vehicle dynamics constraints, and the ability to generate trajectories with only a few control points. Following the approach in [48,49], this study employs a third-order Bézier curve to construct the reference trajectory for UGV lane changes. The formulation is given as follows:
The parametric equation of the third-order Bézier curve is
B t = 1 t 3 P 0 + 3 1 t 2 t P 1 + 3 1 t t 2 P 2 + t 3 P 3 , 0 t 1
where the lane change decision point is P 0 and the estimated lane change endpoint is P 3 . P 1 and P 2 are derived from vehicle dynamics constraints.
The midpoint of the UGV’s rear axle satisfies the following curvature constraints:
k m a x = 1 r m i n
where r m i n is the minimum turning radius.
The coordinates of control points P 1 and P 2 are
P 1 = d 0
P 2 = L x dcos ω L y dsin ω
where L x and L y are the components of the vehicle wheelbase in the x and y directions, respectively; d is a parameter to be determined.
The slope of a point on a third-order Bézier curve is as follows:
k t = x t y t y t x t x ( t ) 2 + y ( t ) 2 3 2
After determining the control points following [49] and applying the above formulation, the coordinates of any point on the third-order Bézier curve can be expressed as follows:
x t = 3 d + 3 d cos ω 2 L x t 3 3 2 d + dcos ω L x t 2 + 3 d t y t = 3 d sin ω 2 L y t 3 3 dsin ω L y t 2

5.2. Formulation of a Multi-Objective MPC-Based Catch-Up Strategy

According to the control theory proposed by Rawlings et al. [50], MPC is an iterative, finite-horizon optimization method for dynamic systems. At each control instant, the current state is measured, and an optimal sequence of control actions over the horizon [ t , t + T ] is computed to minimize a given cost function. Only the first control input is implemented, after which the state is updated and the optimization is repeated. This receding-horizon process corrects prediction errors and accounts for traffic uncertainties, making it well-suited for platooning control.
In this study, the MPC framework takes as input the states of two s-UGVs and the surrounding/upstream traffic, predicts future trajectories over T steps using vehicle and traffic dynamics, and generates optimal control sequences for both longitudinal car-following and lateral lane-changing maneuvers. To balance platooning efficiency and traffic efficiency, the control problem is decomposed into two sequential MPCs, enhanced with an adaptive weighting strategy.
The platooning process is divided into two stages:
  • Catching-up phase ( q 1 ): Two s-UGVs in different lanes attempt to approach each other to establish a following relationship.
  • Formation phase ( q 2 ): The two s-UGVs stabilize their spacing and relative velocity within the same lane, thereby forming a platoon.
During the catching-up phase, the following s-UGV must accelerate, decelerate, or change lanes to approach the leading vehicle. However, frequent maneuvers may disturb the surrounding traffic. Therefore, traffic efficiency is considered from three perspectives: (i) avoiding excessive acceleration/deceleration and lane changes; (ii) maintaining a speed not lower than the average of the surrounding vehicles; and (iii) ensuring minimal disruption to the upstream flow. Meanwhile, platooning efficiency depends on (i) successful lane changes to establish car following; (ii) coordination of relative speeds to avoid large discrepancies; and (iii) stabilization of spacing at a desired value.
Accordingly, the following multi-objective cost function is formulated:
J u t = m i n t = 0 T 1   u t T Q u u t J u w t T Q w w t J w χ t T Q χ χ t J χ ζ t T Q ζ ζ t J ζ + v t T Q v v t J v + q z z T J z
where u t = u f ( t ) , u l c ( t ) T denotes the acceleration/deceleration and lane-change commands of the two s-UGVs at time t , covering all control actions during the catching-up and formation process.; w t = Δ v 1 ( t ) , Δ v 2 ( t ) T , where Δ v i ( t ) is the deviation of s-UGV i = 1   o r   2 from the minimum speed v _ of the surrounding vehicles; χ t represents traffic-flow propagation at time t , as defined in Equation (20); ζ t denotes the car-following relationship, as defined in Equation (3); v t indicates the relative velocity between the two s-UGVs; z = Δ x ( t ) = x 1 ( t ) x 2 ( t ) d ˜ t = 1 T is the deviation of inter-vehicle spacing from the desired distance d ˜ , and the absolute deviation is applied in the subsequent dynamic weight adjustment to mitigate the potential impact of non-negative penalty values; Q u , Q w , Q χ , Q ζ , and Q v are 2 × 2 diagonal weighting matrices; and q z is the weighting vector. For example, Q w = 1 v x ¯ v x _ 2 q 1 , w q 2 , w , where q i , w is an adjustable weight parameter, and the normalization is based on the maximum possible velocity deviation.
Here, J u penalizes aggressive acceleration/deceleration and lane changing; J w maintains acceptable s-UGV speeds; J χ maximizes upstream traffic throughput; J ζ rewards successful car following; J v penalizes relative speed differences; and J z penalizes spacing deviations. Table 1 summarizes these objectives and their corresponding weights.
Notably, the objectives related to traffic and platooning efficiency are interdependent and sometimes conflicting. For instance, minimizing spacing deviation ( J z ) may encourage the leader to decelerate, which accelerates platoon formation but reduces traffic efficiency. Conversely, overemphasizing J z while neglecting J ζ may lead two s-UGVs to approach quickly in different lanes without successfully merging into a platoon. Hence, careful weight design is crucial.
To reduce complexity, the multi-objective MPC in Equation (32) is decomposed into two phase-specific formulations:
  • MPC-I (Catching-up phase q 1 ): emphasizes minimizing spacing deviation ( J z ) and establishing car following ( J ζ ) while ignoring speed coordination ( J v The objective is the following:
i n Λ 1 u t = t = 0 T 1   u t T Q u u t J u w t T Q w w t J w χ t T Q χ χ t J χ ζ t T Q ζ ξ t J ζ + q z z T J z
  • MPC-II (Formation phase q 2 ): once the two s-UGVs achieve a car-following mode in the same lane, the objective excludes J ζ but adds the constraint n N   ζ i , i n ( t ) = 1 to ensure lane consistency:
M i n Λ 2 u t = t = 0 T 1   u t T Q u u t J u w t T Q w w t J w χ t T Q χ χ t J χ + v t T Q v v t J v + q z z T J z
Through this hybrid MPC design, platooning efficiency and traffic efficiency are systematically balanced, yielding an integrated microscopic–macroscopic control framework for cooperative UGV platooning.

5.3. Adaptive Weight Adjustment Strategy for the Hybrid MPC

Although the hybrid MPC framework reduces the complexity of weighting by decomposing the objectives in Equation (32) into two separate MPCs, each MPC remains a multi-objective optimizer that balances traffic efficiency and platooning efficiency under different states. Moreover, the control priorities may vary depending on the initial traffic conditions. This can be illustrated by two extreme cases during the catching-up phase q 1 , governed by MPC-I (Equation (33)). In this phase, both longitudinal and lateral convergence dominate, emphasizing J u (means) and J z (ends).
  • Case 1 (Congested State): Two s-UGVs travel slowly in adjacent lanes under congested traffic conditions. In this case, the control should minimize J u to reduce unnecessary maneuvers while still maintaining spacing via J z
  • Case 2 (Free-flow State): Two s-UGVs travel at normal speed in adjacent lanes under free-flow conditions. Here, greater emphasis should be given to J u to encourage accelerations and lane changes, thereby reducing the time to complete platoon formation.
Thus, the weights of J u and J z in MPC-I should be adjusted according to the initial conditions, while J w , J χ , and J ζ remain consistently considered. Similarly, in the platooning phase q 2 (MPC-II, Equation (34)), weights for J w and J z must be adapted to maintain both vehicle speed and spacing, while J u , J χ , and J v remain active throughout:
Δ J u t = x i t x i t 1 2 + y i t y i t 1 2 δ v x t 1 + v x t / 2 x i t x i t 1 2 + y i t y i t 1 2
where x i t x i t 1 2 + y i t y i t 1 2 is the displacement of the s-UGV over [ t 1 , t ] , δ v x t 1 + v x t / 2 is the longitudinal displacement of background traffic over [ t 1 , t ] , and Δ J u t denotes the optimality loss of J u . A larger value indicates excessive overtaking/lane changing, thereby reducing traffic efficiency:
Δ J z t = x 2 t x 1 t d ˜ d ˜
where x 2 ( t ) x 1 ( t ) d ˜ is the deviation in inter-vehicle distance from the desired spacing d ˜ and Δ J z t is the normalized spacing deviation; larger values indicate greater deviation and thus higher priority on J z .
Based on these measurements, the weighting strategy in Equation (37) is developed for MPC-I to adaptively adjust the weights of J u and J z , ensuring that the following s-UGV rapidly closes the gap to the leading s-UGV:
q z = i I q u μ i , t I , μ i , t I = Δ J z Δ J u
where q u and q z are the weights assigned to J u and J z , respectively, and μ i , t I is a scaling factor. When the s-UGVs are far apart under free-flow conditions, μ i , t I prioritizes J z to shrink spacing. Under congested conditions, it lowers J u priority to protect traffic efficiency.
For MPC-II, a weighting strategy requires definition of the optimality loss of J w , which penalizes deviations in the s-UGV speed from the average traffic speed v x :
Δ J w t = x i t v x t δ x i ( t )
where v x t δ is the maximum longitudinal distance reachable at time t if traveling at the minimum speed of the surrounding vehicles, x i ( t ) is the actual longitudinal position of s-UGV i , and Δ J w ( t ) represents the optimality loss of J w ; smaller values indicate less deviation, and hence, lower weight is required.
Finally, by combining Δ J w ( t ) and Δ J z t , Equation (39) defines the adaptive weighting strategy for MPC-II, balancing spacing maintenance and traffic efficiency in the platooning phase:
q w = i I   q z μ i , t I I , μ i , t I I = Δ J w Δ J z
where q w and q z are the weights assigned to J w and J z , respectively, and μ i , t I I is a scaling factor. When platooned s-UGVs travel slowly (large Δ J w ( t ) ), higher weight is assigned to J w to adjust speed and avoid traffic obstruction. When spacing deviation is large ( Δ J z t ), higher weight is given to J z to reduce inter-vehicle gaps and prevent cut-ins.

5.4. Flow-Aware Platoon Organization Strategy for Dedicated UGV Lanes

Dedicated UGV lanes provide a more structured and controllable environment for cooperative maneuvers, enabling UGVs to perform catching-up and platooning operations more efficiently. However, under low UGV penetration rates and high traffic demand, dedicated UGV lanes are often under-saturated, resulting in wasted road capacity. Therefore, before initiating platoon formation, a lane organization strategy is required to prevent insufficient lane utilization, which typically occurs in UGV-dedicated lanes at low penetration levels. A similar improvement has been proposed in [51], where both UGVs and non-UGVs are permitted to share the lane.
Figure 2 compares the dedicated and improved UGV lane designs. The upper panel shows the conventional UGV-dedicated lane, where only UGVs are permitted. At low penetration levels, the lane may remain underutilized, reducing overall capacity. The lower panel depicts the improved strategy, where UGVs are encouraged to maneuver into the lane for platoon organization, but non-UGVs are also allowed to enter. Since UGVs have stronger incentives to use this lane for platoon formation, they are expected to occupy it more than regular lanes, while non-UGVs occupy it less. Consequently, this strategy mitigates the underutilization problem in low penetration scenarios.
After addressing the resource inefficiency of dedicated lanes, the next challenge lies in mitigating the negative impacts of platoon control under high traffic demand. Although the hybrid MPC framework in Section 5.1 considered traffic interactions during the catching-up process, traffic disturbances under heavy demand cannot be absorbed by the flow and instead propagate system-wide, leading to reduced network efficiency. In such cases, the benefits of UGV platooning may be outweighed by its negative effects. Thus, an organization strategy is required to balance platoon benefits and traffic efficiency, ensuring the formation of longer platoons in the dedicated lane while minimizing traffic disruption.
To this end, sensitivity analysis is conducted to examine the impacts of platoon organization under different traffic demand levels. Using the test segment illustrated in Figure 2b, one-hour simulations are performed with the leftmost lane designated as the improved UGV lane. The UGV penetration rate is fixed at 50%, and traffic demands are set at 1000, 1500, 2000, and 2500 veh/h/lane. The first 20 min serves as the loading period without platoon control, followed by 40 min of platoon organization in the improved lane with longitudinal and lateral control. Performance indicators include the average number of lane changes, the average platoon length, platoon formation probability, and output flow. The average lane changes are defined as the ratio of total lane changes to the total number of vehicles, while the output flow is measured by a downstream detector.
The average platoon length L i ( τ ) is defined as
L = i = 1 N U G V     m a x t   L i t N U G V
where N U G V is the total number of UGVs in the network and L i t is the platoon size of the i -th UGV at time t ; if a UGV does not join a platoon at time t , then L i t = 1 .
The platoon formation probability P P is defined as
P P = P m a x t   L i t > 1
Based on the above indicators, a flow-aware adaptive platoon organization strategy is proposed, aiming to form longer platoons while maximizing network throughput. UGVs conditionally use the dedicated lane for platoon formation depending on the prevailing traffic state. Since real-time demand cannot be directly measured, traffic states are estimated using detectors that capture flow and speed. Specifically, traffic organization is determined by setting a flow threshold ϱ q and a speed threshold ϱ v . Flow and speed are chosen because (1) they can be directly measured by detectors and (2) although density is a more intuitive congestion indicator, detectors typically approximate it via occupancy, requiring vehicle length calibration.
Under this strategy, UGVs obtain real-time average flow q and speed v from detectors and determine whether platoon organization is allowed based on the following:
q < ϱ q v > ϱ v
where q is the measured lane flow, v is the measured lane speed, and ϱ q and ϱ v are the calibrated thresholds for flow and speed, respectively.
If the condition is satisfied, the traffic system is assumed to be able to absorb the disturbances caused by platoon control, allowing UGVs to use the dedicated lane for organization. With increasing UGV penetration, ϱ q can be raised, as higher UGV shares enhance road capacity and allow more lane-changing disturbances to be absorbed.
The calibration process follows these steps:
Establish a baseline without platoon organization at a given penetration rate to determine the maximum capacity and generate speed contour plots.
Initialize ϱ q at 80% of capacity and ϱ v at 22.22 m/s. For example, if the capacity at 50% UGV penetration is 2200 veh/h/lane, then ϱ q = 1760 veh/h/lane.
Simulate traffic with platoon organization under the same demand.
If the speed contour shows a substantial reduction compared to the baseline, update the thresholds: reduce ϱ q by 5% if the last update was on ϱ v ; otherwise, increase ϱ v by 1.39 m/s.
Repeat Steps 3–4 until the speed contours under platoon organization closely match the baseline, indicating acceptable traffic efficiency.

6. Numerical Experiments and Results

To evaluate the effectiveness of the proposed control method, simulation experiments are conducted under different scenarios. All experiments are implemented on a workstation equipped with an Intel Core i7-8650U CPU @ 1.90 GHz, 16 GB RAM, a 512 GB SSD, running Windows 10, and integrated Intel UHD Graphics 620.

6.1. Analysis of Platoon Control Performance

This section evaluates the performance of platoon control, with a particular focus on the advantages of the adaptive weighting strategy. The online controller runs at Δt = 0.1 s with a prediction horizon of N = 20 steps (2.0 s). Due to a small set of binary decisions for lane assignment and leader–follower switching, the resulting online problem is a convex MIQP, solved by Gurobi via the MATLAB/Simulink interface. When binaries are fixed, the problem reduces to a convex QP handled by Gurobi automatically. We warm-start both the continuous trajectory (shifted previous optimum) and the integer part (MIP starts). In the MPC formulation of Equation (32), traffic performance is assessed from three perspectives: (1) traffic smoothness, (2) speed maintenance of s-UGVs, and (3) upstream traffic throughput.
Accordingly, simulation experiments collect the following indicators: (1) fluctuations in s-UGV control inputs (acceleration/deceleration or lane change), reflecting traffic smoothness—the smoother the s-UGV trajectories are, the lower the induced traffic disturbances; (2) the speed of vehicles adjacent to the s-UGVs, reflecting speed maintenance; and (3) the average upstream speed, reflecting throughput.
The efficiency of platoon formation under Equation (32) is evaluated through the following:
The time required for s-UGVs to complete lane changes and enter car-following mode;
Speed coordination between s-UGVs;
The time required to stabilize inter-vehicle spacing.
Platoon efficiency (1) and (3) are measured by the total time required to complete platoon formation, while (2) is evaluated by the relative velocity between the two s-UGVs.
In the hybrid MPC framework, multi-objective function weights must be properly determined. According to Equations (37) and (39), the weights q z in MPC-I or q w in MPC-II are adaptively adjusted, while the upstream throughput weight q χ and s-UGV speed coordination weight q v remain fixed throughout the platoon control process. Therefore, simulation experiments are first conducted to determine the values of q χ and q v . Using a step size of 0.1, different candidate values of q χ (or q v ) are tested while adaptively adjusting the other weights according to Table 2.
The simulation environment comprises a three-lane, 3 km roadway segment with inflows randomly generated between 1000 and 2000 veh/h/lane. Initial vehicle speeds are uniformly distributed between 20.83 and 23.61 m/s. The fixed weights are set to q u = q z = 0.30 and q w = q z = 0.35 . After vehicle distribution, two s-UGVs are randomly selected from the first 1 km to initiate platoon control. Each experiment terminates upon platoon formation or when the leading s-UGV exits the segment, with 200 replications conducted in total.
Figure 3 shows the average traffic speed and the relative velocity between the s-UGVs under different weight settings. As shown in Figure 3a, an appropriate value for q χ is 0.2. Compared with q χ = 0 or q χ = 0.1 , this setting improves upstream throughput (measured by the average traffic speed). Increasing q χ to 0.3, however, yields no further throughput improvement while extending the platoon formation time, indicating that q χ = 0.2 is the optimal choice. Figure 3b shows that under MPC-II control, when q v = 0.2 , the relative velocity between the two s-UGVs remains small, indicating good speed coordination. Increasing q v to 0.3 does not improve coordination; thus, q v = 0.2 is adopted.
Based on q χ = 0.2 and q v = 0.2 , the effectiveness of the adaptive weighting strategy is further examined. Four weighting strategies are compared:
Balanced strategy: assigns equal weights to platoon efficiency and traffic efficiency (i.e., q z = q u in MPC-I or q z = q w in MPC-II);
Platoon-efficiency-first strategy: prioritizes formation efficiency by setting q z > q u (or q z > q w );
Traffic-efficiency-first strategy: prioritizes traffic efficiency by setting q z < q u (or q z < q w );
Adaptive strategy: dynamically adjusts weights according to Equations (37) and (39).
The detailed weight configurations are summarized in Table 2.
Figure 4 compares the platoon formation time, s-UGV speed, and average traffic speed across the four strategies. The platoon-efficiency-first strategy achieves the shortest formation time (40.23 s) but significantly reduces the s-UGV speed (17.23 m/s) and the overall traffic speed (20.83 m/s). The traffic-efficiency-first strategy yields the highest speeds (25.11 m/s for s-UGVs and 22.24 m/s for traffic flow) but requires the longest formation time (121.24 s).
The balanced strategy achieves a compromise: it reduces the formation time compared with the traffic-efficiency-first strategy (85.71 s vs. 121.24 s, a 29.3% reduction) while only slightly lowering the average traffic speed (21.70 m/s vs. 22.24 m/s, a 2.43% reduction). However, compared with the platoon-efficiency-first strategy, the balanced approach considerably increases the formation time (85.71 s vs. 40.23 s).
In contrast, the adaptive strategy significantly improves performance by reducing the platoon formation time with minimal compromise in traffic efficiency. Specifically, compared with the balanced strategy, it reduces the formation time by 41.6% (from 85.71 s to 50.02 s) while sacrificing only 1.29% of the average speed (from 21.70 m/s to 21.42 m/s). These results demonstrate that the adaptive weighting strategy outperforms all fixed-weight alternatives. This is because the adaptive scheme dynamically rebalances its priorities between platoon formation and traffic flow in response to conditions: it gives more weight to closing inter-vehicle gaps when platoons need to form quickly and shifts weight toward maintaining traffic speed once the platoon is nearly formed or under heavy traffic conditions. By adjusting in real time, the adaptive strategy achieves rapid platoon formation with minimal impact on overall traffic performance.
We report the per-step computational time for each weighting strategy in Figure 4d. The mean time is 61.2 ms for the balanced strategy, 59.1 ms for the platooning-first strategy, 57.8 ms for the traffic-first strategy, and 62.4 ms for the adaptive strategy. The maximum computational times are 91.4 ms, 90.3 ms, 92.0 ms, and 93.1 ms, respectively. All values remain within the 0.1 s control interval at 10 Hz, confirming real-time feasibility across all weighting configurations.
To further assess robustness, three additional disturbance scenarios were simulated:
  • Sensing noise: random deviations of 5%, 10%, and 15% were injected into vehicle perception.
  • V2X latency: following existing studies [52,53], communication delays of 50 ms, 100 ms, and 150 ms were imposed.
  • HDV cut-in: unexpected cut-in maneuvers of HDVs were introduced during the two-s-UGV platoon formation process, with the re-formation performance evaluated after disruption.
Each scenario was repeated ten times, and the disturbance effects are illustrated in Table 3. The results indicate that sensing noise, V2X latency, and HDV cut-ins cause non-negligible perturbations to platoon trajectories. Performance is degraded with increasing sensing noise and latency. For instance, when sensing noise reached 15%, the mean violation rate of headway and recovery time were 2.5% and 48.4 s, respectively; when V2X latency was 150 ms, the corresponding values were 4.1% and 39.7 s. Similarly, HDV cut-ins reduced platooning success rates and increased re-formation time. Nevertheless, the minimum Time-to-Collision (TTC) remained above 2.0 s in all experiments, suggesting that the proposed control method consistently maintained the platoon formation and ensured safety [54]. Overall, the results demonstrate that the proposed strategy is feasible and robust under random HDV cut-ins, sensing noise of up to 15%, and V2X latency of up to 150 ms.
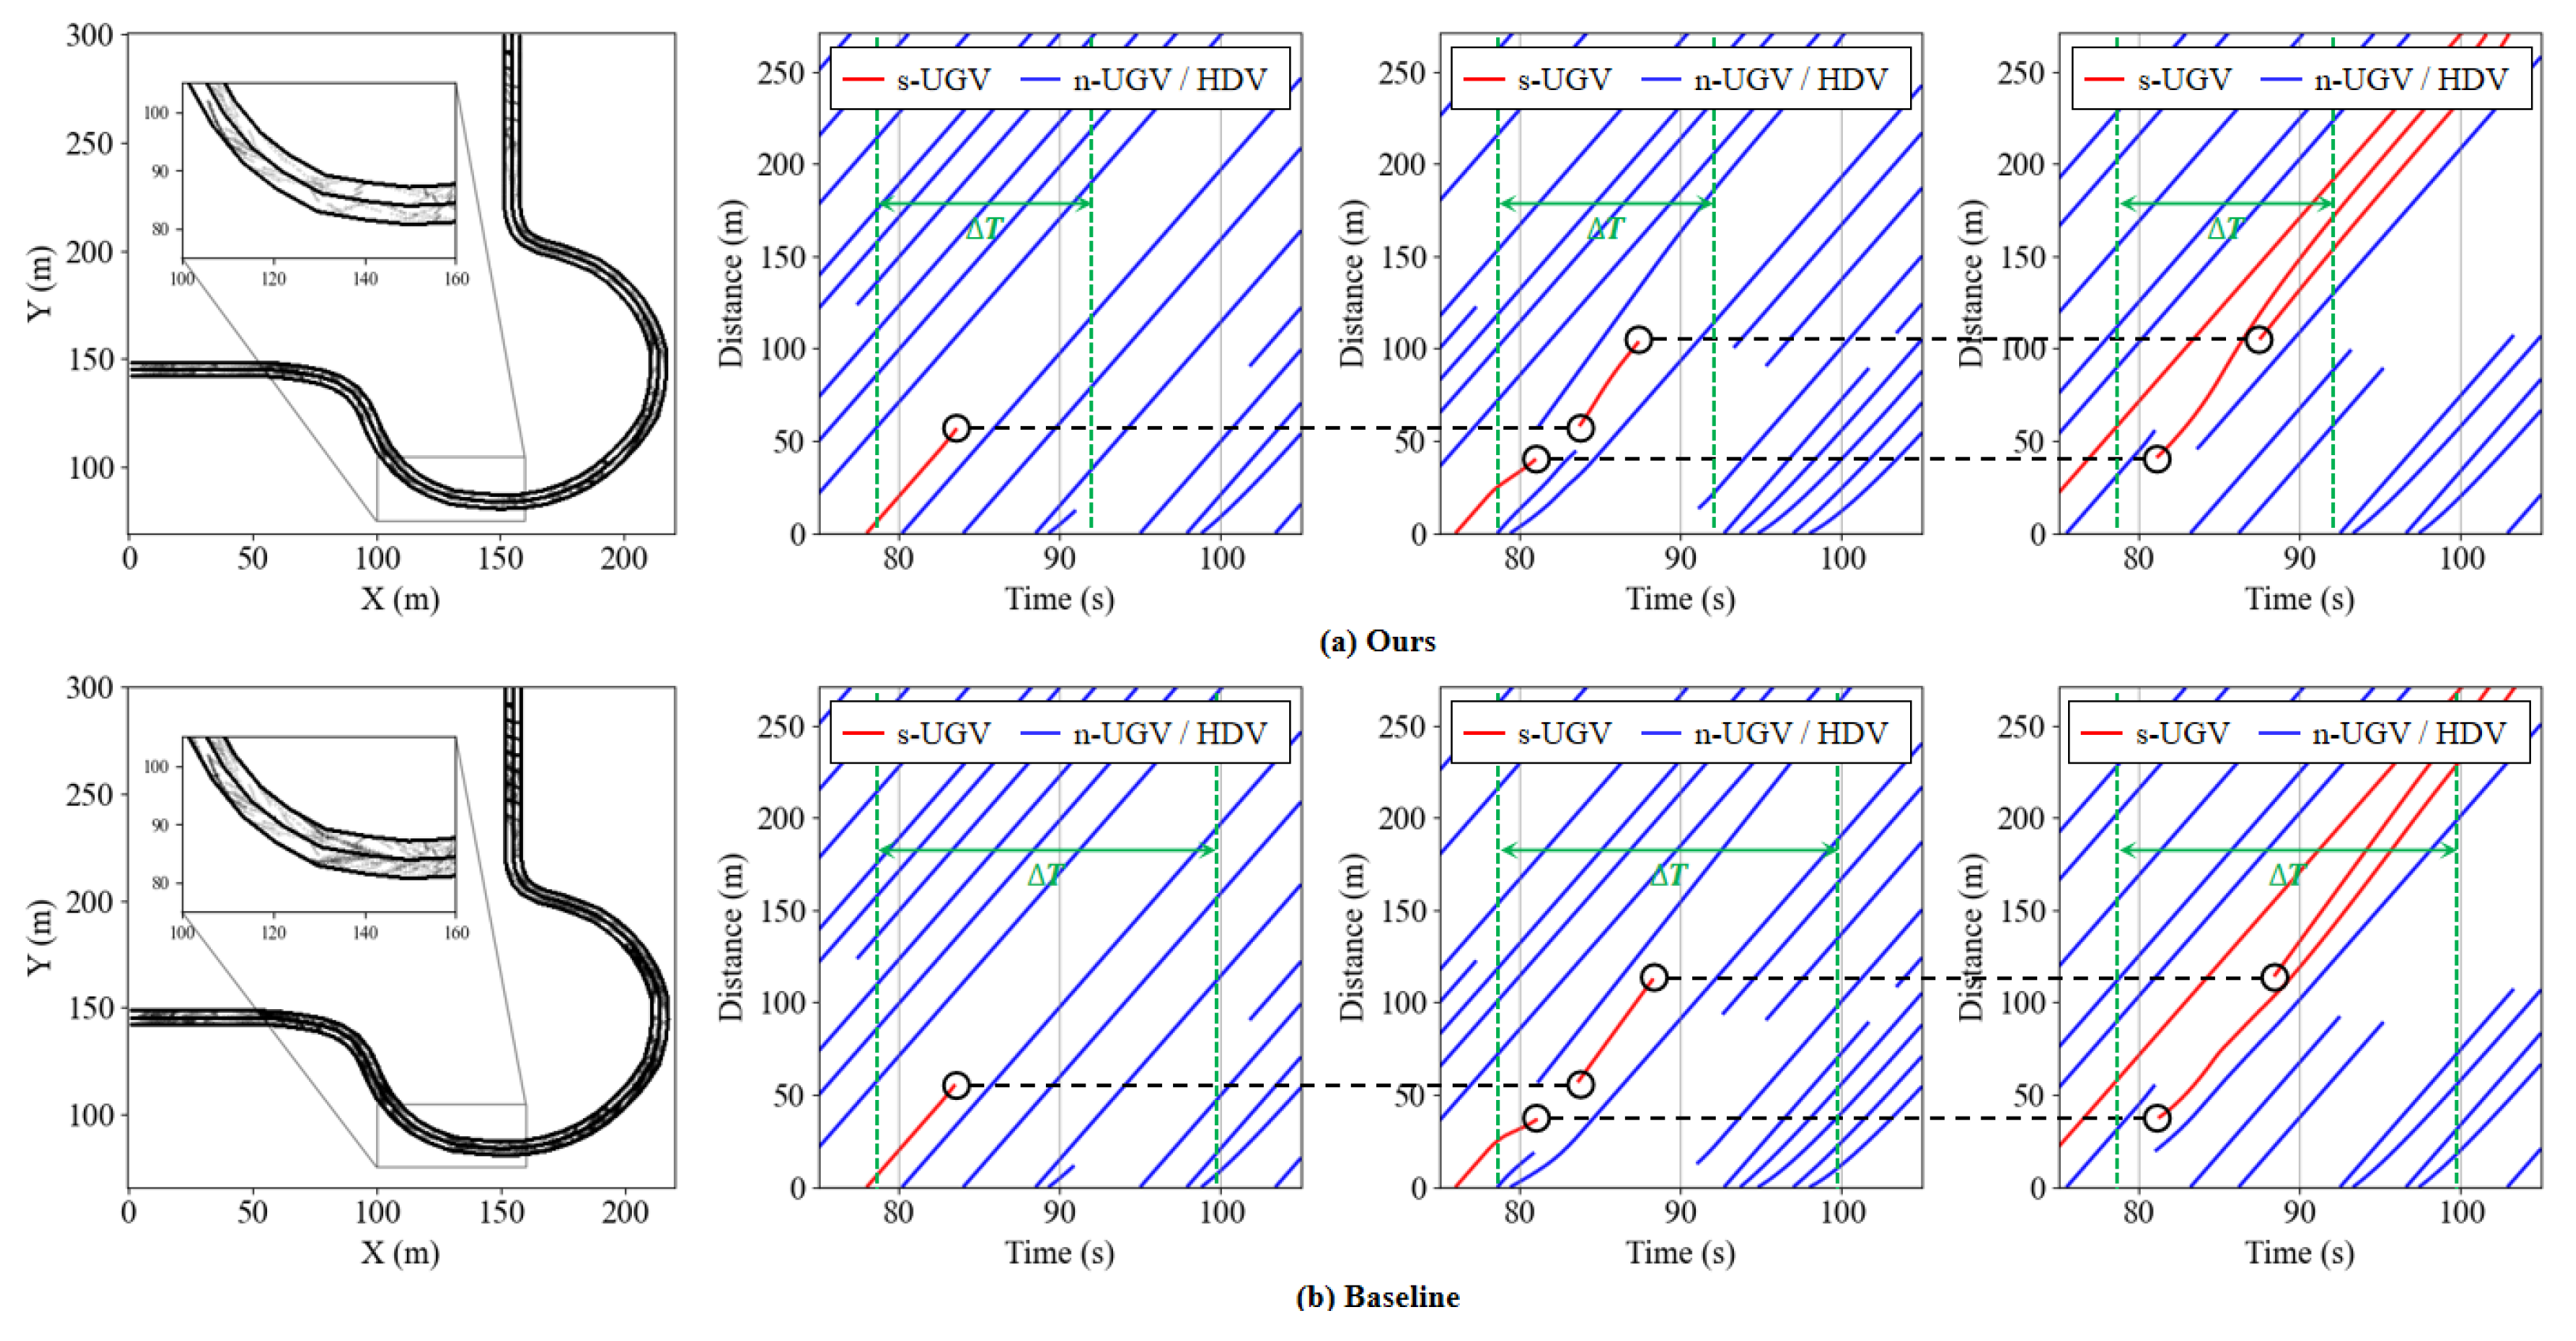
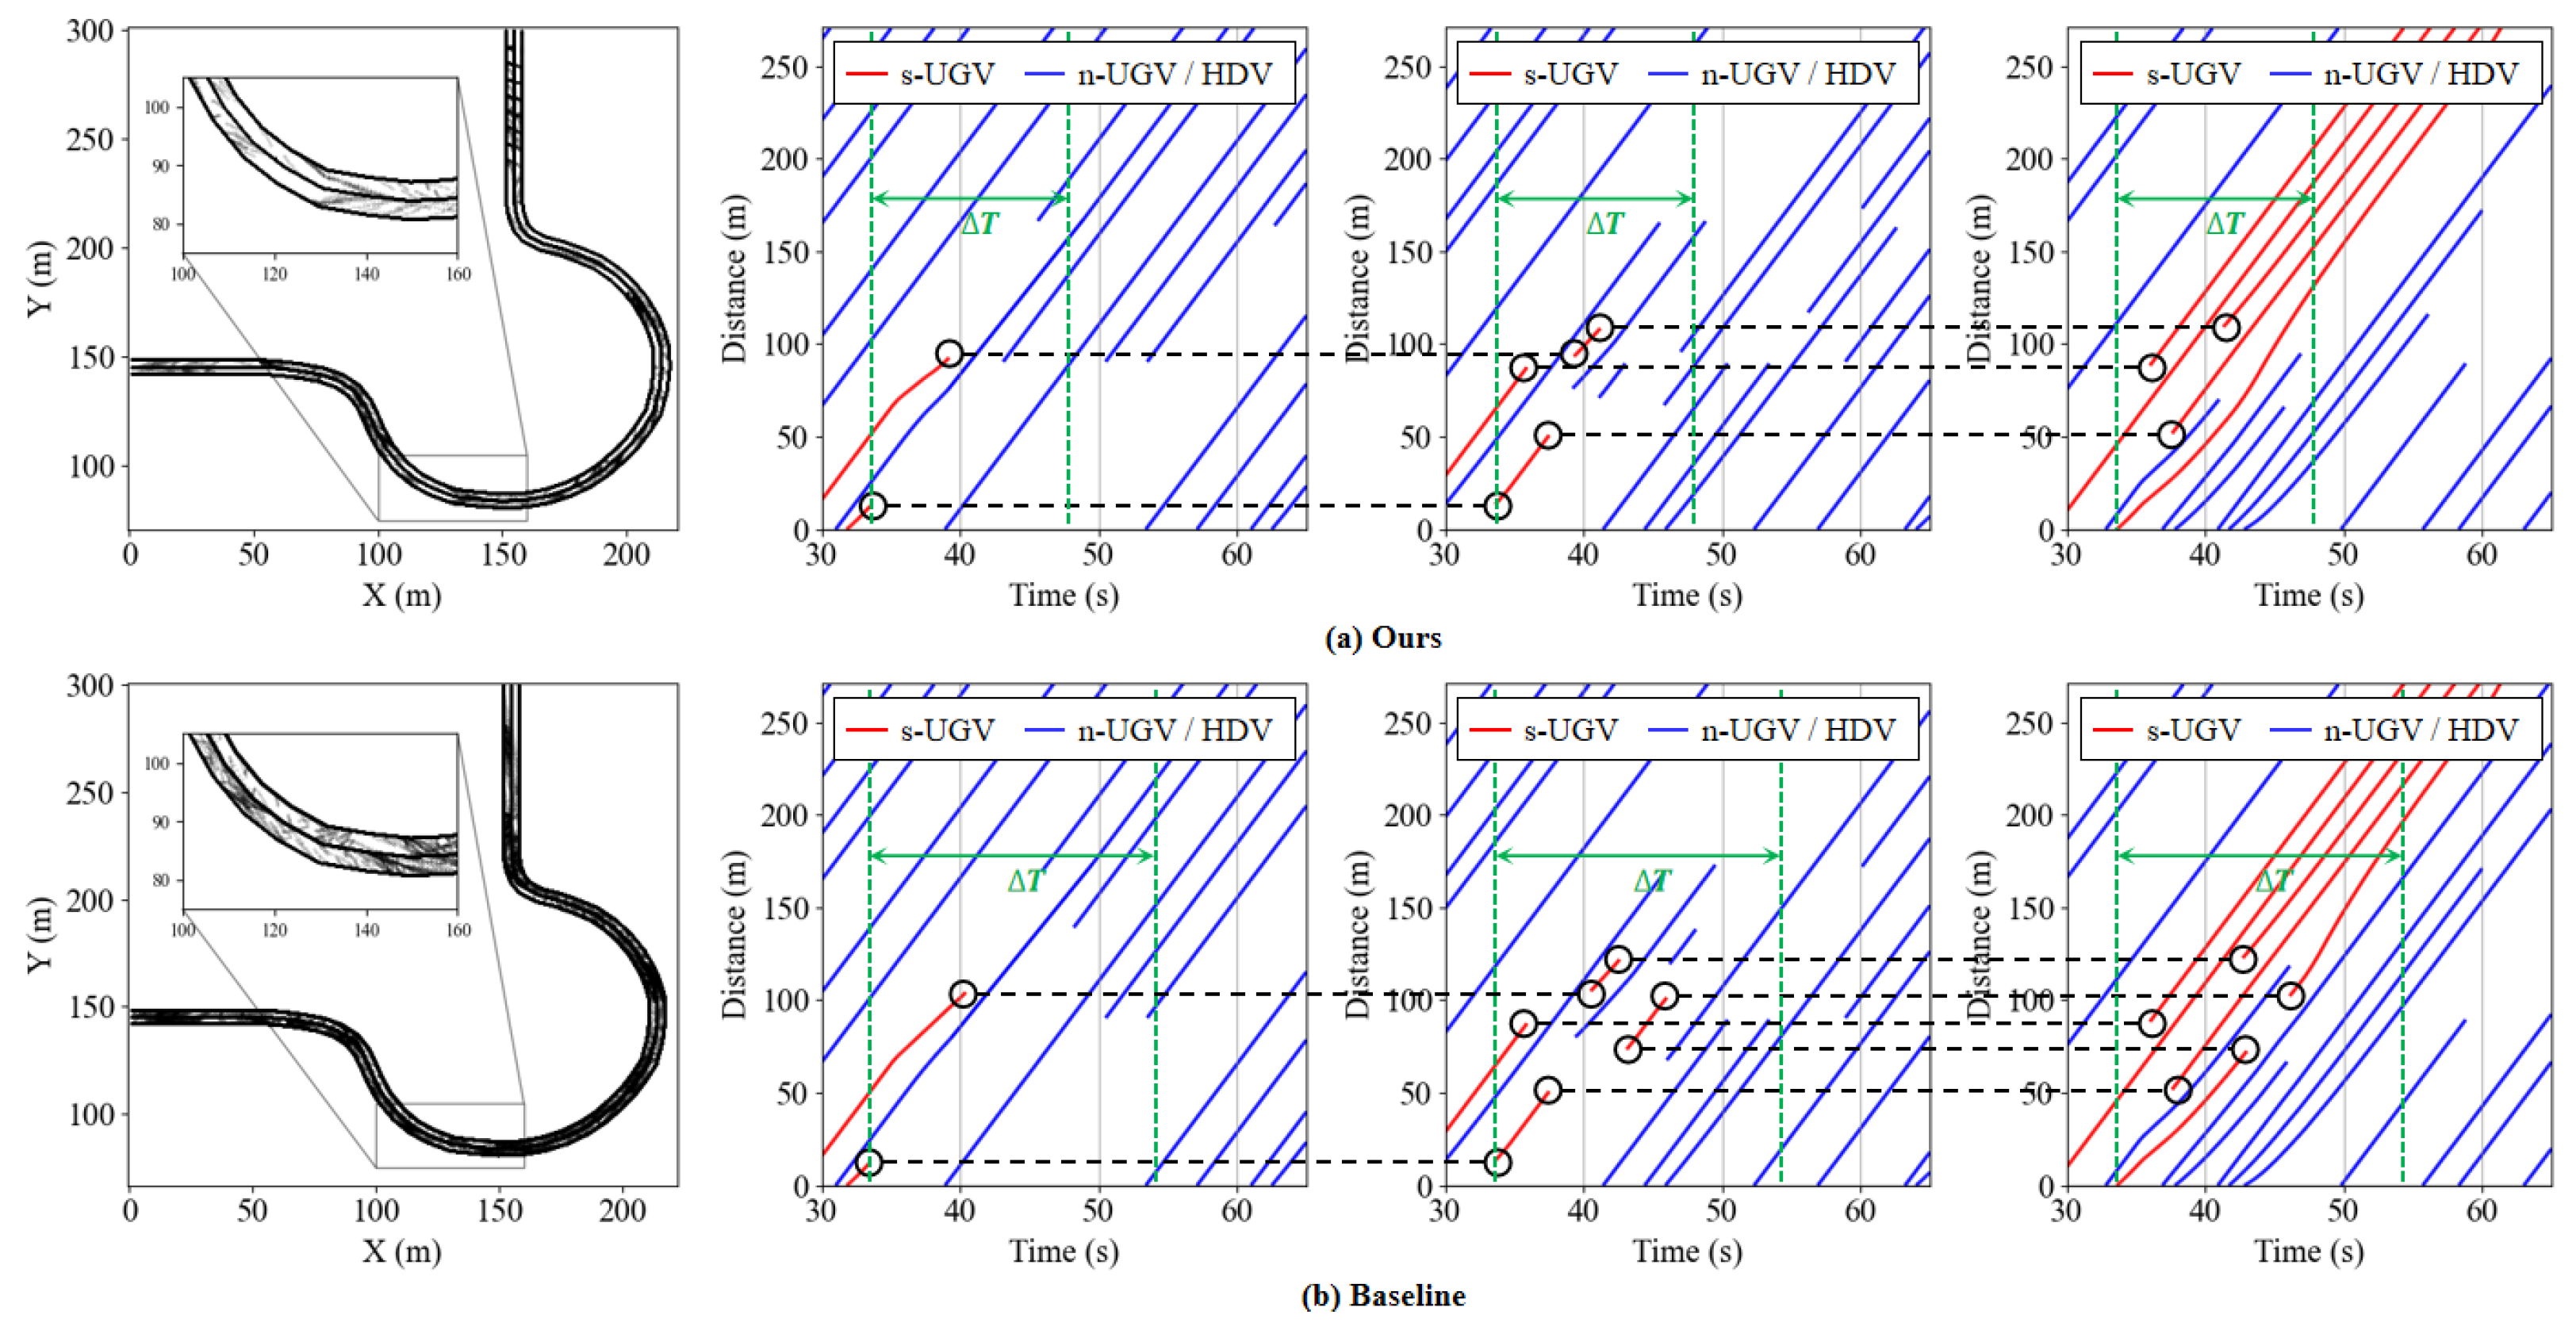
We further evaluate the proposed method on a curved-road scenario. The size of the platoon is increased to three and five vehicles to examine scalability. The experiment is conducted at a 50% UGV penetration rate with V/C = 0.55. Due to the speed limit on the curve, the desired speed of all vehicles is set to 10 m/s. We compare the proposed controller against a baseline in which UGVs and HDVs follow CACC and IDM, respectively, with a rule-based lane-changing module (MOBIL) [55,56]. Spatio-temporal trajectories for the three- and five-vehicle platoons are shown in Figure 5 and Figure 6. The proposed controller forms and maintains both platoons stably on the curve. Note that curve negotiation shares the same lateral decision logic as lane changing. As the platoon size increases, the formation time rises from 13.3 s to 14.8 s, and lane-change activity becomes more intense because each additional vehicle introduces extra longitudinal–lateral tracking actions. With 50% penetration, the discrete distribution of UGVs also increases the interaction overhead during merging. Compared with the baseline, the proposed method achieves platoon formation with fewer lateral switches and a shorter formation time by 28.85–37.26%. The gains stem from the adaptive weight adjustment: when the headway is small, the controller balances safety enforcement with the control effort to avoid efficiency loss from abrupt braking. When the headway is large, the controller encourages speed adaptation or lane change to close gaps and shorten the formation. In addition, the method re-selects the target predecessor online based on the local traffic state, enabling responsive cooperation. Overall, the adaptive strategy delivers more flexible and efficient platooning on curved roads across different platoon sizes.

6.2. Sensitivity Analysis of Platoon Control

This section examines how traffic congestion and UGV penetration rates affect the proposed platoon control strategy. Congestion is quantified by the demand-to-capacity ratio (V/C), ranging from 0.35 to 0.85, with capacity fixed at 2500 veh/h/lane. UGV penetration varies from 0% to 100% in 10% increments. For each combination of congestion level and penetration rate, multiple simulations are performed with randomized initial positions of the two s-UGVs. The results are discussed below.
(1) Impact of congestion levels
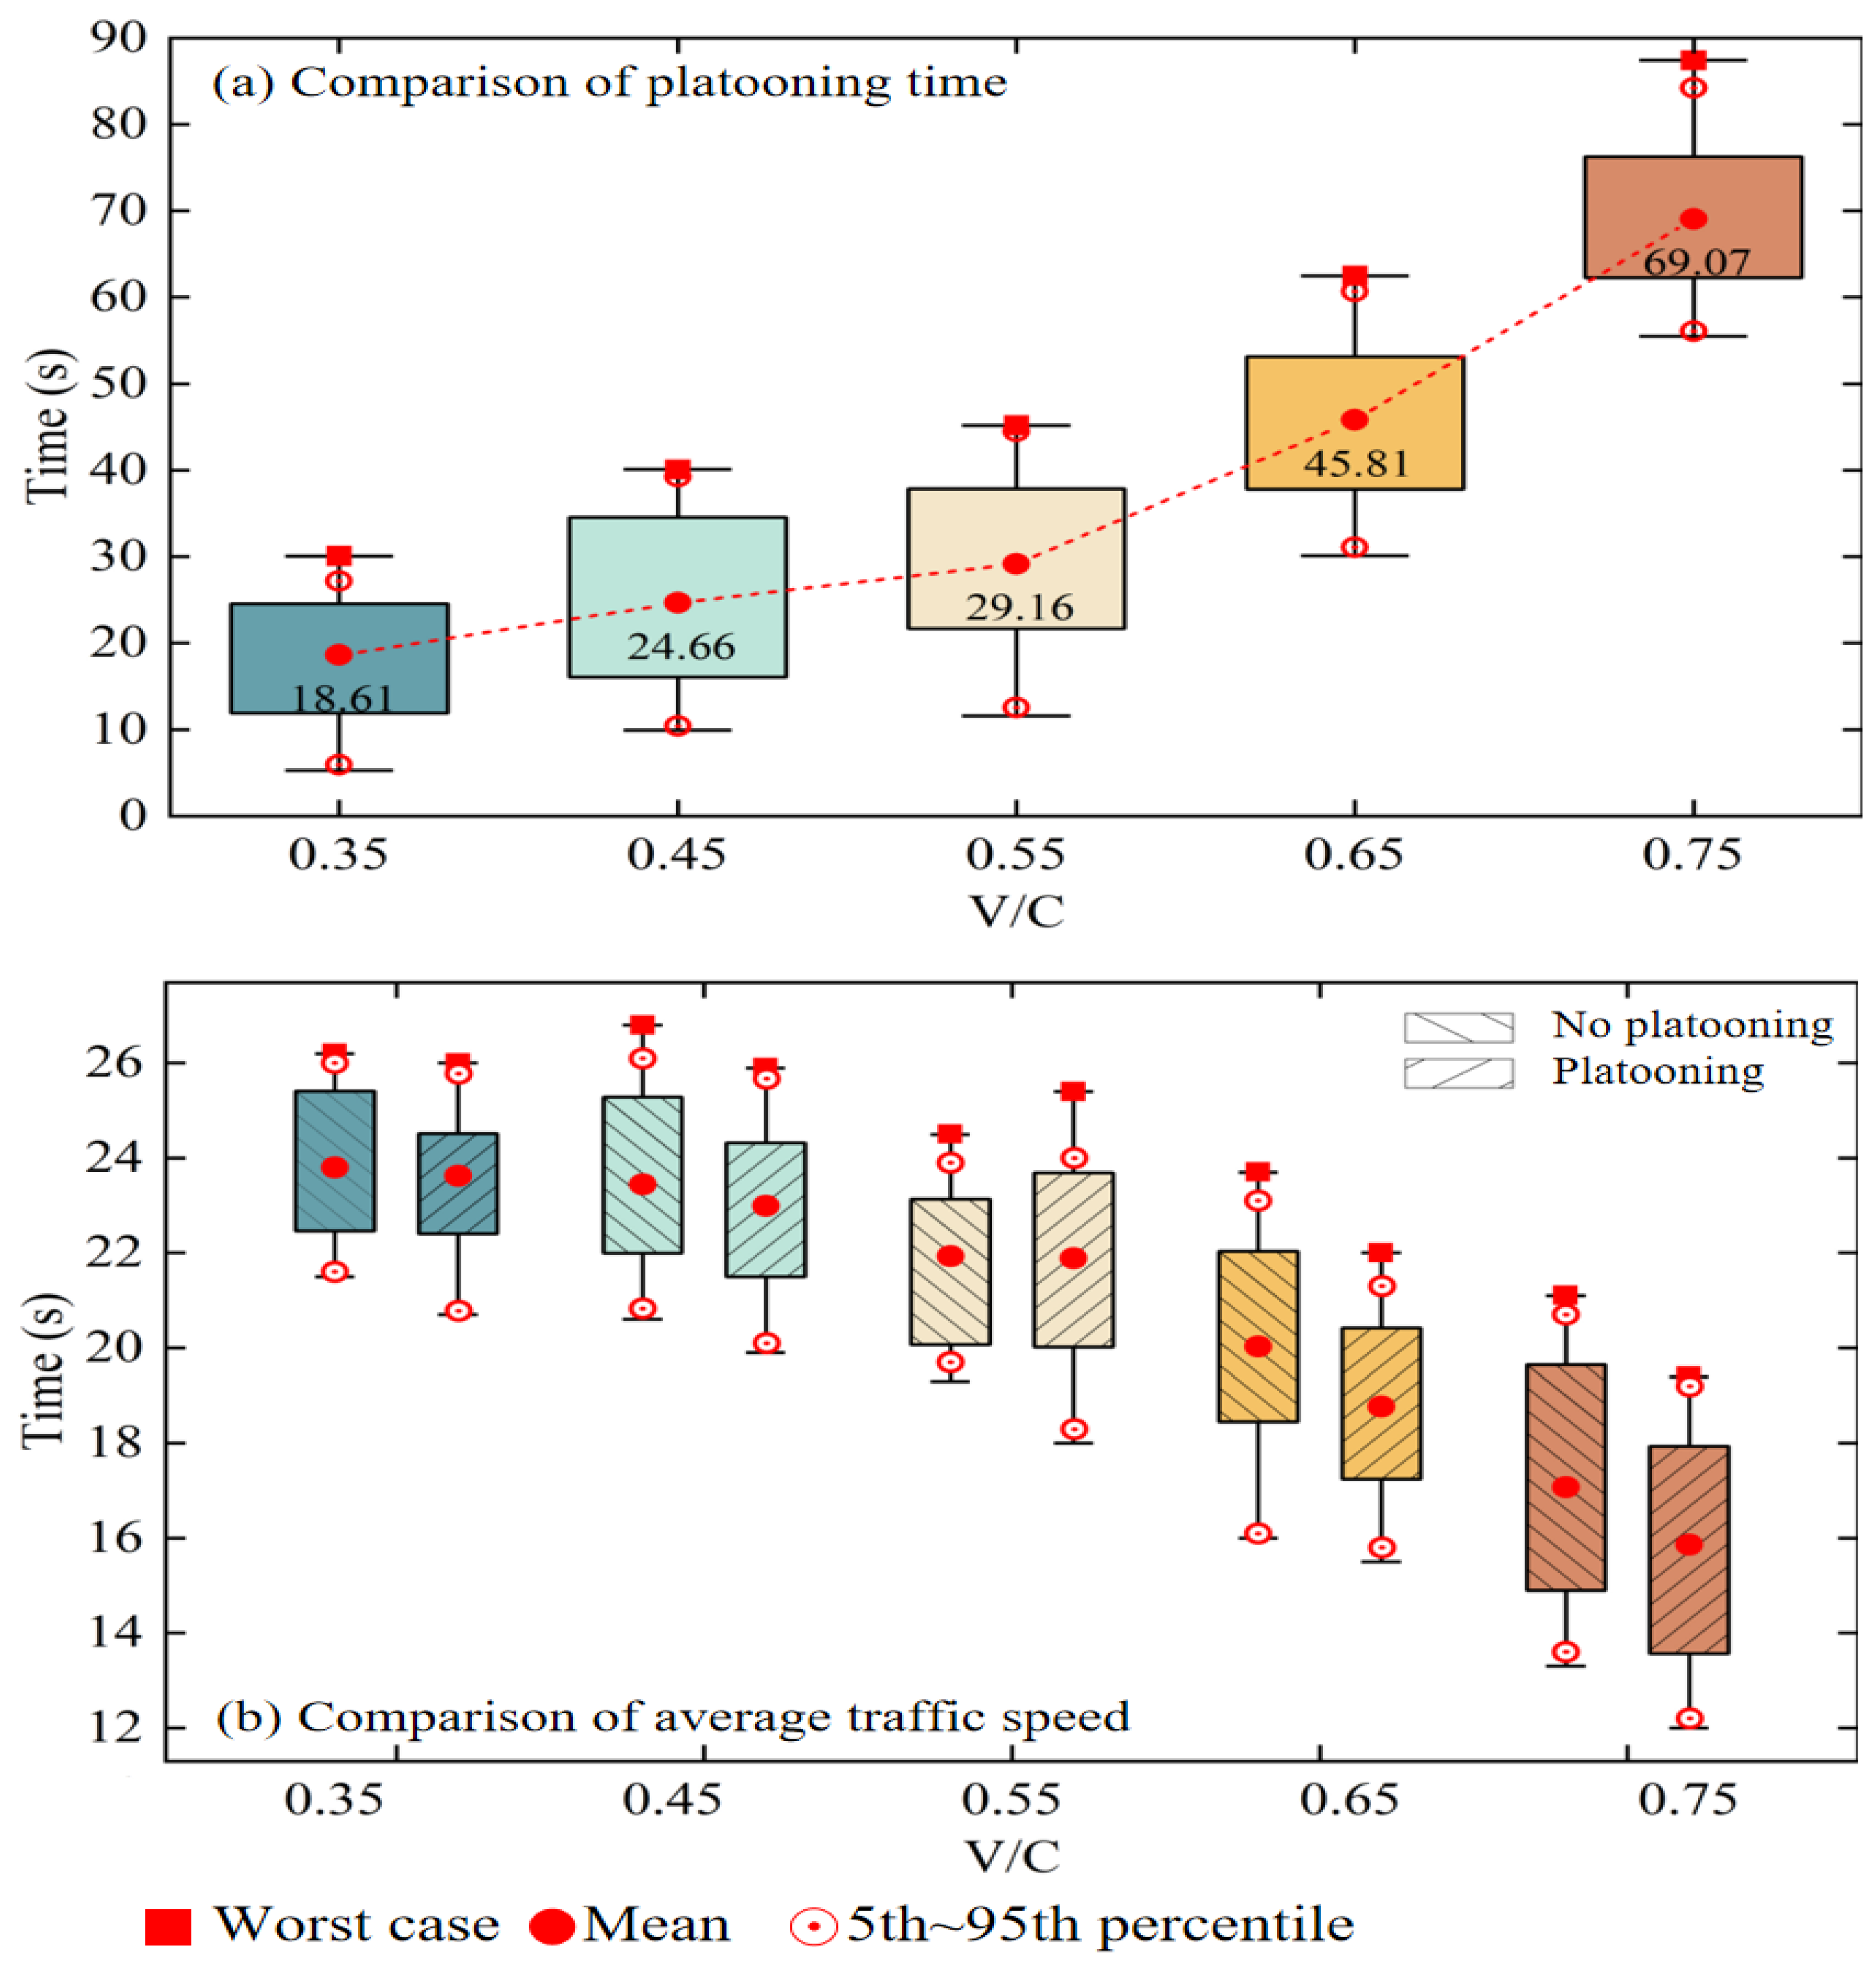
Simulation results show that increasing the UGV penetration rate generally enhances platoon control performance; however, the marginal benefits diminish beyond 50%, eventually becoming insensitive. To isolate the effect of congestion, the analysis fixes the UGV penetration rate at 50%. Figure 7 presents the required platoon formation time and average traffic speed under different V/C levels.
As shown in Figure 7a, when V/C is below 0.55, the platoon formation time increases only slightly with congestion. Once V/C exceeds 0.55, however, the formation time rises sharply. This is because, under higher congestion, the surrounding vehicles move more slowly, forcing s-UGVs to spend more time accelerating, decelerating, and changing lanes, which prolongs platoon formation. Figure 7b further shows that the traffic performance of platoon control (blue curve) and the no-platoon-control baseline (red curve) are similar at low congestion levels, but platoon control imposes noticeable negative impacts when V/C > 0.75. Overall, the sensitivity analysis suggests that congestion delays platoon formation, and platoon control maintains satisfactory traffic efficiency at moderate congestion but degrades performance under high demand.
(2) Impact of UGV penetration rates
The previous analysis indicates that higher congestion reduces platoon efficiency, particularly when V/C exceeds 0.55. To highlight the influence of penetration rates, Figure 5 examines scenarios where V/C ranges from 0.45 to 0.55.
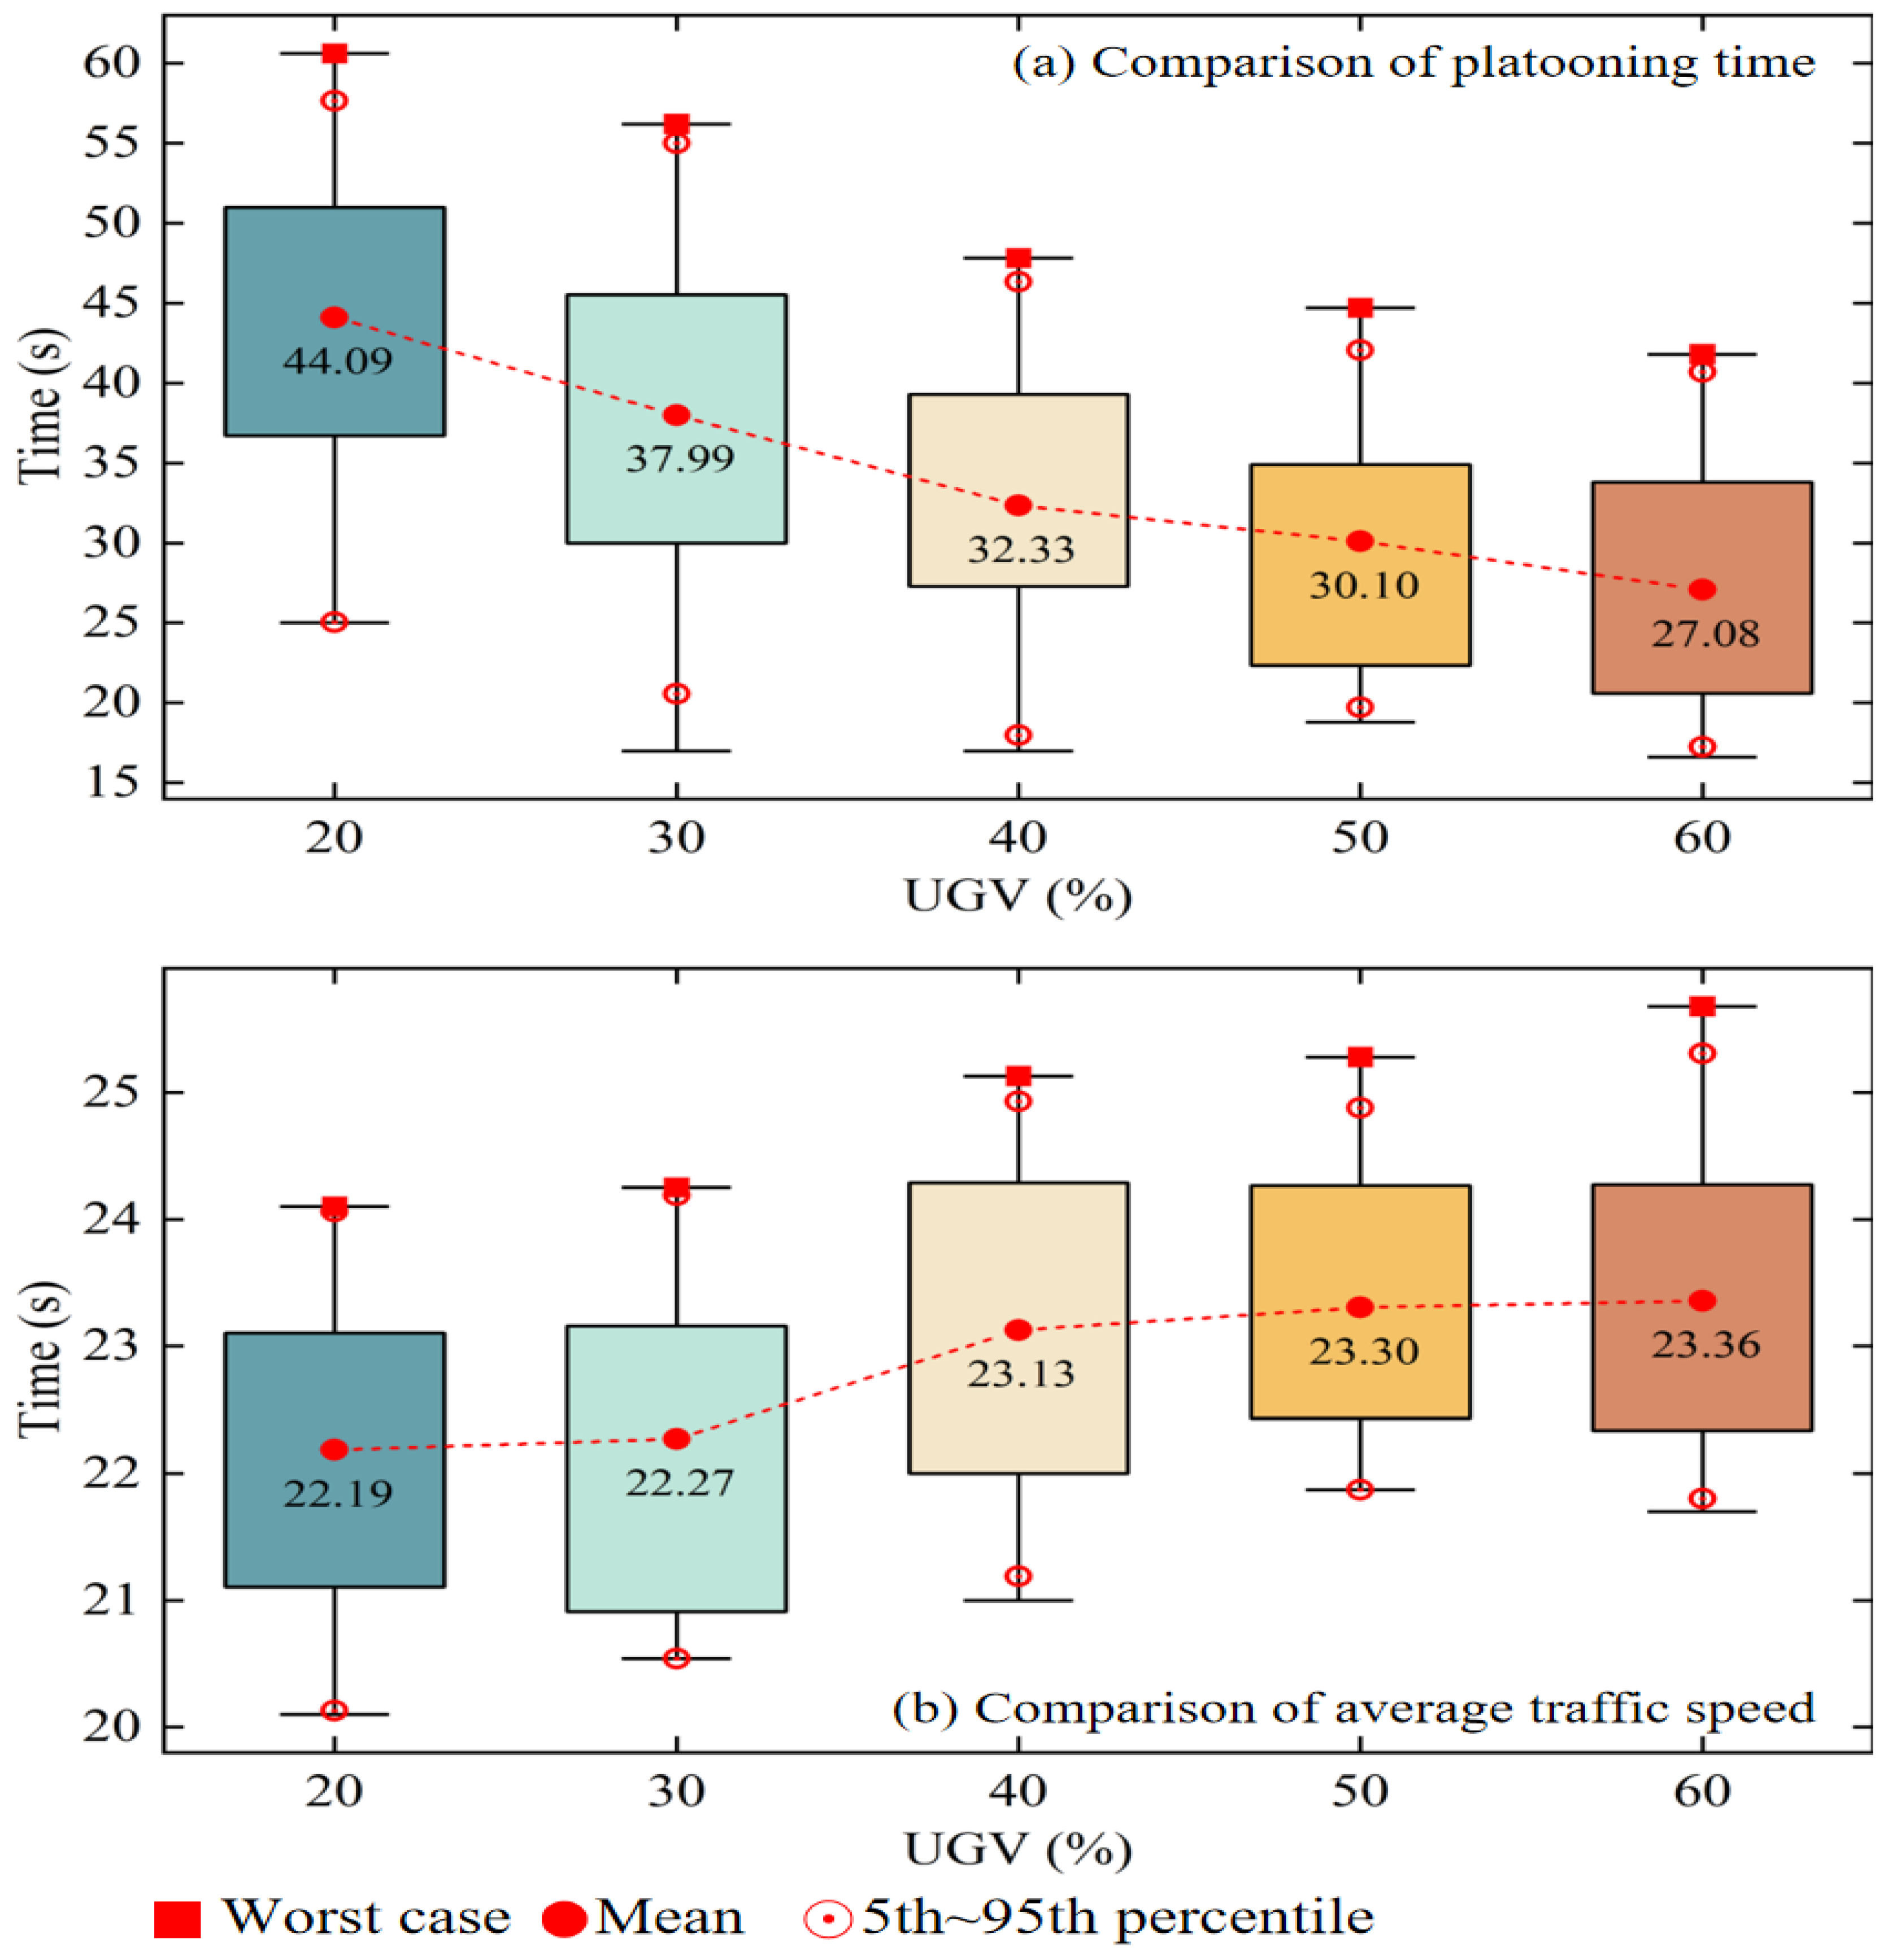
Figure 8a demonstrates that even at the same penetration level, the time required for platoon formation varies significantly across different initial positions of s-UGVs, reflecting variability in platoon difficulty. In general, the formation time decreases with increasing penetration, but the positive effect diminishes gradually. For example, when the penetration rate increases from 20% to 40%, the average platoon formation time decreases markedly by 24.6% (from 44.09 s to 33.23 s). However, increasing penetration from 40% to 60% reduces the formation time by only 18.5% (from 33.23 s to 27.08 s).
Figure 8b shows that as penetration increases from 20% to 60%, the average traffic speed improves from 22.19 m/s to 23.36 m/s, representing a 5.3% increase. These findings indicate that UGVs, due to their faster response to s-UGV maneuvers, facilitate platoon control more effectively than HDVs. Consequently, higher UGV penetration in the background traffic improves both platoon formation and overall traffic performance.
Complementing the above trends, Figure 5 and Figure 6 show that the controller remains effective even in the worst-case realizations. Along the V/C sweep (see Figure 7), the dispersion band (5th–95th percentile) widens as congestion grows, reflecting tighter gaps and more merge interactions. Yet worst-case platooning still completes and follows the same monotonic pattern: the formation time increases while the average traffic speed decreases with V/C. Along the penetration sweep (see Figure 8), higher UGV shares shrink the dispersion band and shift the tail toward better outcomes: the worst-case formation time drops and the worst-case traffic speed rises as penetration increases. Overall, across both axes, the median, spread, and worst-case metrics change systematically and predictably with V/C and penetration, indicating that the proposed controller delivers stable platooning performance not only on average but also under adverse realizations.

6.3. Performance Analysis of UGV Platoon Organization Strategies

Under low traffic demand, implementing catch-up platoon control on a dedicated UGV lane can form longer platoons without reducing roadway throughput. Therefore, platoon organization must be applied selectively, ensuring that induced lane changes during catch-up maneuvers do not compromise overall flow efficiency. We simulate a three-lane freeway segment to evaluate the performance of UGV platoon organization strategies. The probability of successful platoon formation is defined as the likelihood that the preceding or following vehicle of a controlled UGV is also a UGV. For example, under a 50% penetration rate, this probability is calculated as P = 1 1 P C A V 2 0.75 , which is consistent with the simulation outcomes.
(1) Sensitivity to traffic demand.
Four fixed traffic demands (1000, 1500, 2000, and 2500 veh/h/lane) are specified to evaluate the control performance of the proposed method. At 50% UGV penetration, sensitivity analyses of traffic demand are conducted across different lane strategies. Table 4 reports the average number of lane changes, the average platoon length, formation probability, and traffic throughput. The results indicate that platoon organization consistently increases lane changes, extends the average platoon length, and raises platoon formation probability. However, its impact on roadway throughput varies with traffic demand. Specifically, under low demand (1000–1500 veh/h/lane), catch-up maneuvers do not significantly alter throughput. At moderate demand (2000 veh/h/lane), throughput decreases by 3.90%, while at high demand (2500 veh/h/lane), throughput drops substantially by 11.54%. These findings suggest that low demand allows traffic to absorb fluctuations induced by lane changes, whereas moderate demand introduces bottlenecks and high demand renders platoon organization unsuitable. Consequently, a flow-aware adaptive platoon organization strategy is proposed, enabling longer platoons without compromising throughput by activating or deactivating control based on real-time traffic states.
(2) Validation of flow-aware adaptive platoon organization.
To validate the strategy, a freeway scenario is simulated with a 40% UGV penetration rate over 120 min. The free-flow speed is 33.33 m/s. Traffic demand increases from 0 to 3000 veh/h/lane during the first 60 min and then decreases to 0 over the next 60 min, with stochastic fluctuations of ±5%. Three experimental settings are compared:
  • Baseline: No platoon control. To emulate real freeway conditions, HDVs follow the aggressive lane-changing rule 2, executing single discretionary lane changes.
  • Dedicated UGV lane without any adaptive restriction: Based on the baseline experiment setting, the outermost lane is reserved for UGV platoon organization without any adaptive restriction.
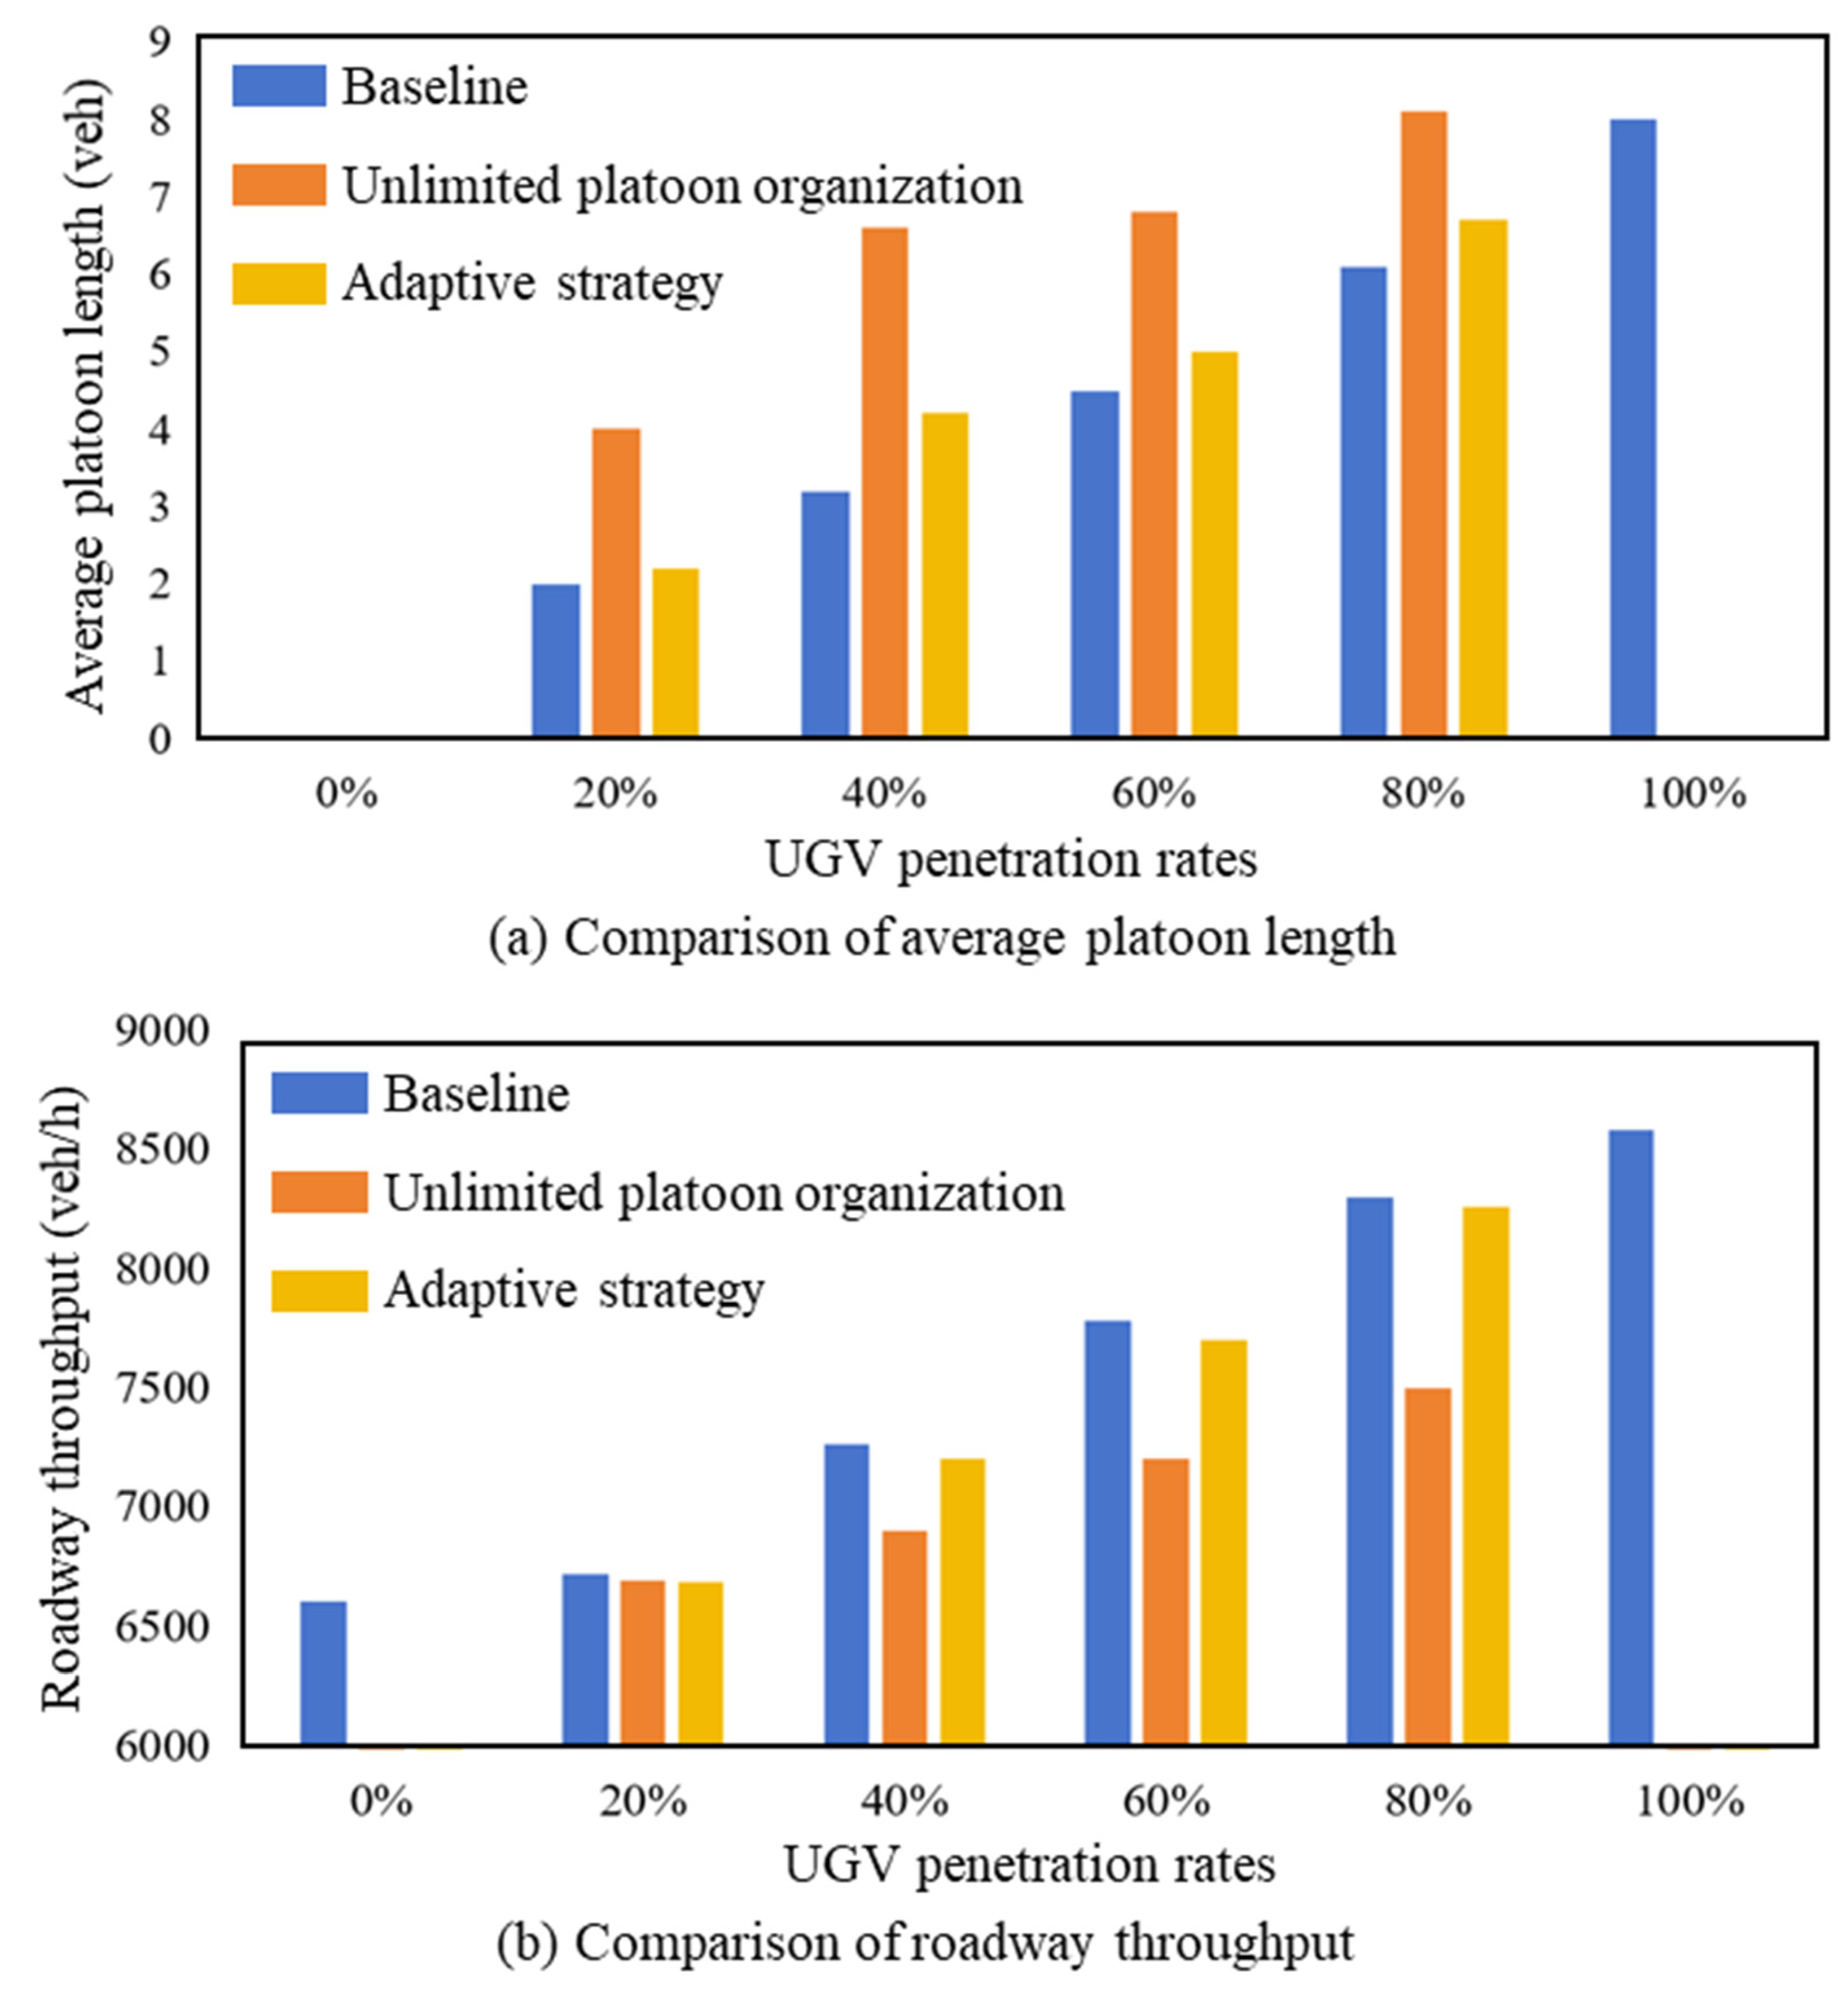
  • Dedicated UGV lane with adaptive strategy: Based on the second experiment setting, the same dedicated lane is used, but platoon organization is enabled or disabled according to the flow-aware adaptive strategy.
Figure 9 presents the speed heatmaps. Comparison of Figure 9a,b shows that unrestricted platoon organization leads UGVs to initiate catch-up maneuvers regardless of traffic conditions, significantly reducing speeds relative to the baseline. By contrast, comparison of Figure 9a,c reveals that the adaptive strategy produces a heatmap nearly identical to that of the baseline, confirming that selectively enabling platoon control according to traffic states avoids adverse impacts on traffic performance.
(3) Comparative performance under different penetration rates.
Further comparisons across UGV penetration levels focus on the average platoon length and roadway throughput. Figure 10a shows that, overall, the average platoon length increases with the penetration rate. Unrestricted platoon organization produces the longest platoons, while adaptive organization yields slightly longer platoons than the baseline. Figure 10b compares roadway throughput: unrestricted platoon organization significantly reduces throughput, whereas the adaptive strategy achieves performance comparable to that at the baseline.
In summary, flow-aware adaptive platoon organization allows UGVs to form longer platoons in dedicated lanes without incurring substantial throughput losses, thus balancing platoon efficiency with network-level traffic performance.

7. Conclusions

This study develops a cooperative longitudinal–lateral platoon control approach for UGVs in mixed traffic environments. A hierarchical framework is established by integrating microscopic motion rules for UGVs and HDVs with macroscopic traffic dynamics through a cell transmission model. A dual-stage MPC scheme is designed, separating the pursuit and platooning phases to reduce computational complexity, while adaptive weighting enables stage-specific optimization. Furthermore, a dynamic lane management strategy is introduced to regulate UGV-dedicated lane access under high-flow conditions, thereby enhancing platoon formation and overall traffic coordination.
Simulation experiments validate the effectiveness of the proposed methods under various penetration levels and traffic demands. The adaptive weighting strategy significantly accelerates platoon initiation, reducing the formation time by 41.6% while causing only a 1.29% decrease in the average traffic speed. Sensitivity analyses further reveal that traffic congestion reduces platoon efficiency and magnifies control impacts on system performance. As UGV penetration increases, both platoon stability and traffic speed improve. Moreover, the dynamic lane-opening mechanism allows the formation of longer and more stable platoons in high-flow environments without substantial efficiency losses, confirming its scalability and robustness for large-scale deployment.
While promising, this research opens several directions for future work. First, integrating heterogeneous unmanned systems, such as UAV–UGV coordination, could extend platooning control beyond ground-based applications [57]. Second, real-world field experiments should be conducted to validate the robustness of the dual-stage MPC and lane management strategy under sensor, communication, and human interaction uncertainties. Third, the incorporation of learning-based adaptive controllers may further enhance scalability, enabling platoons to self-adjust under rapidly changing environments [58]. Moreover, the development of trajectory planning models tailored to non-fully connected environments can help enhance vehicle robustness under random HDV state variations. These extensions will strengthen the applicability of cooperative platoon control in next-generation unmanned transportation systems.

Author Contributions

Conceptualization, S.W. and Z.W.; methodology, Z.W. and Y.S.; software, Z.W. and Y.S.; validation, S.W.; formal analysis, S.W. and Z.W.; investigation, Z.W. and Y.S.; resources, S.W.; data curation, Y.S.; writing—original draft preparation, S.W. and Z.W.; writing—review and editing, S.W. and Z.W.; visualization, S.W. and Y.S.; supervision, S.W.; project administration, S.W.; funding acquisition, S.W. All authors have read and agreed to the published version of the manuscript.

Funding

The work was supported by the National Natural Science Foundation of China (No. 52402401), the China Postdoctoral Science Foundation (No. 2024M750440), and the Jiangsu Funding Program for Excellent Postdoctoral Talent (No. 2024ZB073).

Institutional Review Board Statement

Not applicable.

Informed Consent Statement

Not applicable.

Data Availability Statement

Data will be made available on request.

Conflicts of Interest

The authors declare no conflicts of interest.

References

  1. Lee, S.; Hwang, S.; Kim, H.S. T–S Fuzzy Observer-Based Output Feedback Lateral Control of UGVs Using a Disturbance Observer. Drones 2024, 8, 685. [Google Scholar] [CrossRef]
  2. Li, M.; Liu, H.; Xie, F. Robust Formation Control for Unmanned Ground Vehicles Using Onboard Visual Sensors and Machine Learning. Drones 2024, 8, 787. [Google Scholar] [CrossRef]
  3. Ramezani, M.; Amiri Atashgah, M.A.; Rezaee, A. A Fault-Tolerant Multi-Agent Reinforcement Learning Framework for Unmanned Aerial Vehicles–Unmanned Ground Vehicle Coverage Path Planning. Drones 2024, 8, 537. [Google Scholar] [CrossRef]
  4. Sui, Y.; Yang, Z.; Zhuo, H.; You, Y.; Que, W.; He, N. A Fuzzy Pure Pursuit for Autonomous UGVs Based on Model Predictive Control and Whole-Body Motion Control. Drones 2024, 8, 554. [Google Scholar] [CrossRef]
  5. Wang, Z.; Bian, Y.; Shladover, S.E.; Wu, G.; Li, S.E.; Barth, M.J. A survey on cooperative longitudinal motion control of multiple connected and automated vehicles. IEEE Intell. Transp. Syst. Mag. 2019, 12, 4–24. [Google Scholar] [CrossRef]
  6. Hu, M.; Zhao, X.; Hui, F.; Tian, B.; Xu, Z.; Zhang, X. Modeling and analysis on minimum safe distance for platooning vehicles based on field test of communication delay. J. Adv. Transp. 2021, 2021, 5543114. [Google Scholar] [CrossRef]
  7. Wu, J.; Ahn, S.; Zhou, Y.; Liu, P.; Qu, X. The cooperative sorting strategy for connected and automated vehicle platoons. Transp. Res. Part C Emerg. Technol. 2021, 123, 102986. [Google Scholar] [CrossRef]
  8. Cao, D.; Wu, J.; Wu, J.; Kulcsár, B.; Qu, X. A platoon regulation algorithm to improve the traffic performance of highway work zones. Comput.-Aided Civ. Infrastruct. Eng. 2021, 36, 941–956. [Google Scholar] [CrossRef]
  9. Chandler, R.E.; Herman, R.; Montroll, E.W. Traffic dynamics: Studies in car following. Oper. Res. 1958, 6, 165–184. [Google Scholar] [CrossRef]
  10. Helly, W. Simulation of bottlenecks in single-lane traffic flow. In Proceedings of the Symposium on Theory of Traffic Flow, Research Laboratories, General Motors; Herman, R., Ed.; General Motors: New York, NY, USA, 1959; pp. 207–238. [Google Scholar]
  11. Schuhl, A. The probability theory applied to distribution of vehicles on two-lane highways. In Eno Found; Technical Report; Highway Traffic Control: Washington, DC, USA, 1955; pp. 59–75. [Google Scholar]
  12. Yao, H.; Li, Q.; Li, X. A study of relationships in traffic oscillation features based on field experiments. Transp. Res. Part A Policy Pract. 2020, 141, 339–355. [Google Scholar] [CrossRef]
  13. Zhou, F.; Li, X.; Ma, J. Parsimonious shooting heuristic for trajectory design of connected automated traffic part I: Theoretical analysis with generalized time geography. Transp. Res. Part B Methodol. 2017, 95, 394–420. [Google Scholar] [CrossRef]
  14. Li, Q.; Li, X.; Huang, Z.; Halkias, J.; McHale, G.; James, R. Simulation of mixed traffic with cooperative lane changes. Comput.-Aided Civ. Infrastruct. Eng. 2022, 37, 1978–1996. [Google Scholar] [CrossRef]
  15. Guo, G.; Yue, W. Autonomous platoon control allowing range-limited sensors. IEEE Trans. Veh. Technol. 2012, 61, 2901–2912. [Google Scholar] [CrossRef]
  16. Maiti, S.; Winter, S.; Kulik, L. A conceptualization of vehicle platoons and platoon operations. Transp. Res. Part C Emerg. Technol. 2017, 80, 1–19. [Google Scholar] [CrossRef]
  17. Liang, K.Y.; Mårtensson, J.; Johansson, K.H. Heavy-duty vehicle platoon formation for fuel efficiency. IEEE Trans. Intell. Transp. Syst. 2015, 17, 1051–1061. [Google Scholar] [CrossRef]
  18. Tuchner, A.; Haddad, J. Vehicle platoon formation using interpolating control: A laboratory experimental analysis. Transp. Res. Part C Emerg. Technol. 2017, 84, 21–47. [Google Scholar] [CrossRef]
  19. Stankovic, S.S.; Stanojevic, M.J.; Siljak, D.D. Decentralized overlapping control of a platoon of vehicles. IEEE Trans. Control Syst. Technol. 2000, 8, 816–832. [Google Scholar] [CrossRef]
  20. Gehring, O.; Fritz, H. Practical results of a longitudinal control concept for truck platooning with vehicle to vehicle communication. In Proceedings of the Conference on Intelligent Transportation Systems, Boston, MA, USA, 12 November 1997; pp. 117–122. [Google Scholar]
  21. Shladover, S.E. Truck automation operational concept alternatives. In Proceedings of the 2010 IEEE Intelligent Vehicles Symposium, La Jolla, CA, USA, 21–24 June 2010; pp. 1072–1077. [Google Scholar]
  22. Kunze, R.; Ramakers, R.; Henning, K.; Jeschke, S. Organization and operation of electronically coupled truck platoons on German motorways. In Automation, Communication and Cybernetics in Science and Engineering 2009/2010; Springer: Berlin/Heidelberg, Germany, 2011; pp. 427–439. [Google Scholar]
  23. Tsugawa, S. Results and issues of an automated truck platoon within the energy ITS project. In Proceedings of the 2014 IEEE Intelligent Vehicles Symposium Proceedings, Dearborn, MI, USA, 8–11 June 2014; pp. 642–647. [Google Scholar]
  24. Shladover, S.E.; Su, D.; Lu, X.Y. Impacts of cooperative adaptive cruise control on freeway traffic flow. Transp. Res. Rec. 2012, 2324, 63–70. [Google Scholar] [CrossRef]
  25. Maiti, S.; Winter, S.; Kulik, L.; Sarkar, S. Ad-hoc platoon formation and dissolution strategies for multi-lane highways. J. Intell. Transp. Syst. 2023, 27, 161–173. [Google Scholar] [CrossRef]
  26. Jiang, Y.; Wang, S.; Yao, Z.; Zhao, B.; Wang, Y. A cellular automata model for mixed traffic flow considering the driving behavior of connected automated vehicle platoons. Phys. A Stat. Mech. Its Appl. 2021, 582, 126262. [Google Scholar] [CrossRef]
  27. Chang, X.; Li, H.; Rong, J.; Zhao, X.; Li, A.R. Analysis on traffic stability and capacity for mixed traffic flow with platoons of intelligent connected vehicles. Phys. A Stat. Mech. Its Appl. 2020, 557, 124829. [Google Scholar] [CrossRef]
  28. Zhou, J.; Zhu, F. Modeling the fundamental diagram of mixed human-driven and connected automated vehicles. Transp. Res. Part C Emerg. Technol. 2020, 115, 102614. [Google Scholar] [CrossRef]
  29. Zhou, Y.J.; Zhu, H.B.; Guo, M.M.; Zhou, J.L. Impact of CACC vehicles’ cooperative driving strategy on mixed four-lane highway traffic flow. Phys. A Stat. Mech. Its Appl. 2020, 540, 122721. [Google Scholar] [CrossRef]
  30. Songchitruksa, P.; Bibeka, A.; Lin, L.I.; Zhang, Y. Incorporating Driver Behaviors into Connected and Automated Vehicle Simulation; Center for Advancing Transportation Leadership and Safety (ATLAS Center): Ann Arbor, MI, USA, 2016. [Google Scholar]
  31. Wang, Z.; Wu, G.; Hao, P.; Boriboonsomsin, K.; Barth, M. Developing a platoon-wide eco-cooperative adaptive cruise control (CACC) system. In Proceedings of the 2017 IEEE Intelligent Vehicles Symposium (IV), Los Angeles, CA, USA, 11–14 June 2017; pp. 1256–1261. [Google Scholar]
  32. Papadoulis, A.; Quddus, M.; Imprialou, M. Evaluating the safety impact of connected and autonomous vehicles on motorways. Accid. Anal. Prev. 2019, 124, 12–22. [Google Scholar] [CrossRef] [PubMed]
  33. Lee, S.; Oh, C. A methodology to establish operational strategies for truck platoonings on freeway on-ramp areas. J. Korean Soc. Transp. 2018, 36, 67–85. [Google Scholar] [CrossRef]
  34. Besselink, B.; Turri, V.; Van De Hoef, S.H.; Liang, K.Y.; Alam, A.; Mårtensson, J.; Johansson, K.H. Cyber–physical control of road freight transport. Proc. IEEE 2016, 104, 1128–1141. [Google Scholar] [CrossRef]
  35. Shao, B. Scheduling Plan Optimization of Truck Platooning Considering Ecological Benefits Under Connected Vehicle Environment. Master’s Thesis, Beijing Jiaotong University, Beijing, China, 2020. [Google Scholar]
  36. Bolton, W. Instrumentation and Control Systems; Newnes: Oxford, UK, 2021. [Google Scholar]
  37. Klančar, G.; Matko, D.; Blažič, S. Wheeled mobile robots control in a linear platoon. J. Intell. Robot. Syst. 2009, 54, 709–731. [Google Scholar] [CrossRef]
  38. Turri, V.; Kim, Y.; Guanetti, J.; Johansson, K.H.; Borrelli, F. A model predictive controller for non-cooperative eco-platooning. In Proceedings of the 2017 American Control Conference (ACC), Seattle, WA, USA, 24–26 May 2017; pp. 2309–2314. [Google Scholar]
  39. Chan, E. SARTRE automated platooning vehicles. Towards Innov. Freight Logist. 2016, 2, 137–150. [Google Scholar]
  40. Eilers, S.; Mårtensson, J.; Pettersson, H.; Pillado, M.; Gallegos, D.; Tobar, M.; Johansson, K.H.; Ma, X.; Friedrichs, T.; Borojeni, S.S.; et al. COMPANION—Towards Co-operative Platoon Management of Heavy-Duty Vehicles. In Proceedings of the 2015 IEEE 18th International Conference on Intelligent Transportation Systems, Gran Canaria, Spain, 15–18 September 2015; pp. 1267–1273. [Google Scholar]
  41. Kazemi, A.; Sharifi, I.; Talebi, H.A. Longitudinal and lateral control of vehicle platoons using Laguerre-based and robust MPC with merge and exit maneuvers. Control Eng. Pract. 2024, 142, 105737. [Google Scholar] [CrossRef]
  42. Nilsson, J.; Brännström, M.; Fredriksson, J.; Coelingh, E. Longitudinal and lateral control for automated yielding maneuvers. IEEE Trans. Intell. Transp. Syst. 2016, 17, 1404–1414. [Google Scholar] [CrossRef]
  43. Tian, D.; Zhou, J.; Han, X.; Lang, P. Robust platoon control of mixed autonomous and human-driven vehicles for obstacle collision avoidance: A cooperative sensing-based adaptive model predictive control approach. Engineering 2024, 42, 244–266. [Google Scholar] [CrossRef]
  44. Newell, G.F. A simplified car-following theory: A lower order model. Transp. Res. Part B Methodol. 2002, 36, 195–205. [Google Scholar] [CrossRef]
  45. Li, H.; Pang, H.; Xia, H.; Huang, Y.; Zeng, X. Research on Trajectory Planning Method Based on Bézier Curves for Dynamic Scenarios. Electronics 2025, 14, 494. [Google Scholar] [CrossRef]
  46. Feinstein, Z.; Kleiber, M.; Weber, S. Stochastic cell transmission models of traffic networks. arXiv 2023, arXiv:2304.11654. [Google Scholar]
  47. Huang, Y.-S.; Weng, Y.-S.; Shih, C.-Y. Utilizing Cell Transmission Models to Alleviate Accident-Induced Traffic Congestion in Two-Way Grid Networks. Algorithms 2025, 18, 193. [Google Scholar] [CrossRef]
  48. Ogbemhe, J.; Mpofu, K.; Tlale, N.S. Continuous trajectory planning for welding of complex joints using Bezier curve. Procedia Manuf. 2019, 33, 685–692. [Google Scholar] [CrossRef]
  49. Hua, Z.; Zhang, W. Obstacle-Avoidance Path Planning for Autonomous Vehicles Based on Bezier Curves. Automot. Dig. 2021, 3, 46–49. [Google Scholar]
  50. Rawlings, J.B.; Mayne, D.Q.; Diehl, M. Model Predictive Control: Theory, Computation, and Design; Nob Hill Publishing: Madison, WI, USA, 2017. [Google Scholar]
  51. Al-Jumaili, M.H.; Özok, Y.E. New control model for autonomous vehicles using integration of Model Predictive and Stanley based controllers. Sci. Rep. 2024, 14, 19872. [Google Scholar] [CrossRef] [PubMed]
  52. Zhang, Y.; Tian, B.; Xu, Z.; Gong, S.; Gao, Y.; Cui, Z.; Chen, X. A local traffic characteristic based dynamic gains tuning algorithm for cooperative adaptive cruise control considering wireless communication delay. Transp. Res. Part C Emerg. Technol. 2022, 142, 103766. [Google Scholar] [CrossRef]
  53. Wu, Z.; Wang, J.; Xu, H.; He, Z. T3C: A traffic-communication coupling control approach for autonomous intersection management system. Transp. Res. Part C Emerg. Technol. 2024, 169, 104886. [Google Scholar] [CrossRef]
  54. Wang, S.; Li, Z.; Wang, B.; Li, M. Collision avoidance motion planning for connected and automated vehicle platoon merging and splitting with a hybrid automaton architecture. IEEE Trans. Intell. Transp. Syst. 2023, 25, 1445–1464. [Google Scholar] [CrossRef]
  55. Ali, Y.; Zheng, Z.; Bliemer, M.C.J. Calibrating lane-changing models: Two data-related issues and a general method to extract appropriate data. Transp. Res. Part C Emerg. Technol. 2023, 152, 104182. [Google Scholar] [CrossRef]
  56. Li, R.; Sun, S.; Wu, Y.; Hao, H.; Wen, X.; Yao, Z. Fundamental diagram of mixed traffic flow considering time lags, platooning intensity, and the degradation of connected automated vehicles. Phys. A Stat. Mech. Its Appl. 2023, 627, 129130. [Google Scholar] [CrossRef]
  57. Li, R.; Jiang, B.; Zong, Y.; Lu, N.; Guo, L. Event-Triggered Collaborative Fault Diagnosis for UAV–UGV Systems. Drones 2024, 8, 324. [Google Scholar] [CrossRef]
  58. Wang, N.; Li, X.; Suo, Z.; Fan, J.; Wang, J.; Xie, D. Traversability Analysis and Path Planning for Autonomous Wheeled Vehicles on Rigid Terrains. Drones 2024, 8, 419. [Google Scholar] [CrossRef]
Figure 1. Schematic diagram of two UGVs forming a platoon in mixed traffic flow.
Drones 09 00711 g001
Figure 2. Schematic diagram of vehicle platoon control in different dedicated UGV lanes.
Drones 09 00711 g002
Figure 3. Speed and relative speed distribution under different weights.
Drones 09 00711 g003
Figure 4. Platooning performance under different weighting strategies.
Drones 09 00711 g004
Figure 5. Spatio-temporal trajectories of a three-vehicle s-UGV platoon on a curved segment.
Drones 09 00711 g005
Figure 6. Spatio-temporal trajectories of a five-vehicle s-UGV platoon on a curved segment.
Drones 09 00711 g006
Figure 7. Platooning performance under different congestion levels.
Drones 09 00711 g007
Figure 8. Platooning performance under different UGV penetration rates.
Drones 09 00711 g008
Figure 9. Vehicle trajectory and heatmap of speed under different strategies.
Drones 09 00711 g009
Figure 10. Comparison of average platoon length and roadway throughput under different UGV penetration rates.
Drones 09 00711 g010
Table 1. MPC objective items and their weights.
PerformanceObjectiveCriterionDescription
Traffic
performance
J u Q u PenaltyPenalize frequent acceleration, deceleration, and lane changes by s-UGVs, discouraging abrupt maneuvers that disrupt traffic flow.
J w Q w RewardReward s-UGVs for maintaining speeds not lower than the surrounding traffic, preventing obstruction during catch-up.
J χ Q χ RewardReward higher upstream throughput by promoting increased downstream outflow during platoon formation.
Platooning performance J ζ Q ζ RewardReward successful platoon formation through lane changing, reflected in a sustained car-following state between two s-UGVs.
J v Q v PenaltyPenalize large relative speed differences between s-UGVs, encouraging speed harmonization.
J z q z PenaltyPenalize deviations in inter-vehicle gaps from the desired spacing, promoting stable platoon distances.
Table 2. Weight settings for different strategies.
StageWeightBalancePlatooning
Efficiency First
Traffic
Efficiency First
Adaptive Weights
MPC-I q u 0.300.200.40Adaptive
q z 0.300.300.300.30
MPC-II q w 0.350.200.50Adaptive
q z 0.350.350.350.35
Table 3. Control performance under sensing noise, V2X latency, and HDV cut-ins.
ScenariosMinimum TTC (s)Violation Rate of Headway (%)Recovery Time (s)
MinMeanMaxMinMeanMaxMinMeanMax
Sensing
noise
5%3.14.36.70.00.40.921.534.346.8
10%2.73.96.10.21.12.326.339.652.4
15%2.13.35.60.82.54.337.948.469.0
V2X latency50 ms2.94.16.30.10.61.417.629.946.1
100 ms2.53.85.90.71.52.819.533.452.6
150 ms2.13.35.41.94.16.525.839.768.2
HDV cut-in2.33.96.00.61.83.238.457.688.5
Table 4. Comparison of parameters with and without platoon organization.
Demand (veh/h/lane)ANOLC (count/veh)APL (veh)POPFROF (veh/h/lane)
ReferencePlatoonReferencePlatoonReferencePlatoonReferencePlatoonImpact Ratio
100000.492.65.00.730.881000998−0.20%
150000.512.85.10.740.8515001468−2.13%
200000.532.75.10.740.8720001922−3.90%
250000.563.15.40.780.9024872200−11.54%
Note: ANOLC: average number of lane changes, APL: average platoon length, POPF: probability of platoon formation, ROF: road output flow.
Disclaimer/Publisher’s Note: The statements, opinions and data contained in all publications are solely those of the individual author(s) and contributor(s) and not of MDPI and/or the editor(s). MDPI and/or the editor(s) disclaim responsibility for any injury to people or property resulting from any ideas, methods, instructions or products referred to in the content.