Article

Predicting Apple Tree Macronutrients Using Unmanned Aerial Vehicle-Based Hyperspectral Imagery to Manage Apple Orchard Nutrients

1
Department of Smart Agro-Industry, Institute of Agriculture and Life Sciences, Gyeongsang National University, Jinju 52725, Republic of Korea
2
Department of Bio-Industrial Machinery Engineering, Institute of Agriculture and Life Sciences, Gyeongsang National University, Jinju 52828, Republic of Korea
3
Fruit Research Division, National Institute of Horticulture & Herbal Science, Wanju 55365, Republic of Korea
4
Department of Agricultural Engineering, National Institute of Agricultural Science, Jeonju 54875, Republic of Korea
*
Author to whom correspondence should be addressed.
Drones 2024, 8(8), 369; https://doi.org/10.3390/drones8080369
Submission received: 1 July 2024 / Revised: 30 July 2024 / Accepted: 31 July 2024 / Published: 1 August 2024
(This article belongs to the Special Issue Advances of UAV in Precision Agriculture)

Abstract

:
Herein, the development of an estimation model to measure the chlorophyll (Ch) and macronutrients, such as the total nitrogen (T-N), phosphorus (P), potassium (K), carbon (C), calcium (Ca), and magnesium (Mg), in apples is detailed, using key band ratios selected from hyperspectral imagery acquired with an unmanned aerial vehicle, for the management of nutrients in an apple orchard. The k-nearest neighbors regression (KNR) model for Ch and all macronutrients was chosen as the best model through a comparison of calibration and validation R2 values. As a result of model development, a total of 13 band ratios (425/429, 682/686, 710/714, 714/718, 718/722, 750/754, 754/758, 758/762, 762/766, 894/898, 898/902, 906/911, and 963/967) were selected for Ch and all macronutrients. The estimation potential for the T-N and Mg concentrations was low, with an R2 ≤ 0.37. The estimation performance for the other macronutrients was as follows: R2 ≥ 0.70 and RMSE ≤ 1.43 μg/cm2 for Ch; R2 ≥ 0.44 and RMSE ≤ 0.04% for P; R2 ≥ 0.53 and RMSE ≤ 0.23% for K; R2 ≥ 0.85 and RMSE ≤ 6.18% for C; and R2 ≥ 0.42 and RMSE ≤ 0.25% for Ca. Through establishing a fertilization strategy using the macronutrients estimated through hyperspectral imagery and measured soil chemical properties, this study presents a nutrient management decision-making method for apple orchards.

1. Introduction

Adequate mineral nutrition, one of the most important agrotechnical practices in modern horticulture, determines the health, resistance, yield, quality, and storage capacity of fruit-bearing plants [1]. The most often mentioned mineral nutrients in agriculture are nitrogen (N), phosphorus (P), and potassium (K), while other macronutrients include carbon (C), calcium (Ca), magnesium (Mg), and sodium, which affect plant growth [2]. N is an important element for plant growth and influences the amount of amino acids, proteins, nucleic acids, and chlorophyll present in a plant, thereby determining its photosynthetic efficiency [3]. An increase in the C/N (carbohydrate/nitrogen) ratio hinders tree growth due to a N deficiency, while excess N can make trees susceptible to diseases and increase the probability of premature fruit fall [4]. P has received less attention than N and K, as it does not considerably affect fruit qualities such as size, acidity, or color. However, P not only improves fruit yield but also reduces the incidence of pulp at harvest, assists in resisting browning, and increases antioxidant content [5]. Meanwhile, P deficiency negatively affects fruit formation through slowing tree development, delaying bud formation, and reducing flower bud divisions; furthermore, it causes leaves and fruit to age quickly [6]. In contrast to P, K has direct impacts on chlorophyll, leaf area, dry weight, and photosynthetic efficiency and has a dominant influence on external and internal fruit qualities, such as color, size, acidity, and yield [7,8]. C is accumulated through photosynthesis and is essential for the formation of organic matter. It circulates through each plant organ and plays a key role in the formation of leaves and fruits [9]; however, if too much C is allocated to fruit formation, leaf formation may not occur, thereby negatively affecting continuous fruit production [10]. Ca is transferred between trees and fruit and is one of the most important nutrients affecting fruit quality as it can prevent various physiological fruit disorders [11].
When using intuitive practices, farmers fertilize at an even rate without considering the trees’ nutritional status or soil properties [12]. Therefore, fertilizer is often used excessively or insufficiently. Excess fertilizer that is not fully absorbed accumulates in natural water bodies, causing ecological problems such as eutrophication [13]. Trees also become vulnerable to pests and diseases due to associated stresses, negatively impacting their productivity [14]. Insufficient fertilization leads to insufficient growth due to a lack of macronutrients and low photosynthetic assimilation, causing a decrease in fruit production [15]. It is difficult to determine the amount of fertilizer needed when depending on the tree and soil conditions, due to the time and cost limitations associated with collecting leaf samples and performing chemical analyses. It is difficult to manage the nutritional status of trees in large and varied orchards with this traditional method. Therefore, a new type of technology that can define the nutritional status of trees in orchards using accurate spatial and temporal information is necessary.
The digital transformation of agriculture is an important challenge worldwide [16]. Various digital technologies have been applied to stabilize agricultural product production, and the topic of crop cultivation using data has become the focus of a large body of research [17]. The data types used include environmental factors, such as climate and soil, which affect the growth and cultivation of crops, including the sowing (planting) date, weeding, and control. Various studies have used these data, along with indicators such as biomass, quality, and physiologically active crop substances, over broad areas to numerically represent growth status [18,19]. Climate data have the advantage of low processing costs, as they allow for a broad estimation of the condition of an unspecified number of crops; however, they have the disadvantage of not providing direct information about spatially distributed crops. Conversely, destroying biological samples and conducting chemical identification is an expensive process which takes a long time [20]. Remote sensing (RS) technology has been introduced to overcome these limitations. Various spectral image sensors mounted on multiple platforms (e.g., tractors, aircraft, satellites) can obtain spectral information about crops in a specific spatio-temporal context [21]. The spectral range from visible to near-infrared light is mostly used to read plant information, as their spectral characteristics, absorption, and reflection can be well captured in this range [22]. Selecting an appropriate platform according to the topographic and climatic conditions is important in order to acquire optimal spectral imagery. As Korea has many mountainous regions, and typhoons and the rainy season arrive at the time as the growth period of the apple tree (Malus pumila Mill.), a platform which is flexible in terms of shooting missions and schedules is advantageous. Unmanned aerial vehicles (UAVs) can perform imaging in arbitrary directions over a wide range of locations, including those with highly variable altitudes such as steep mountains. Their shooting schedules can be freely adjusted as they are portable and fly below clouds [23].
Hyperspectral imagery provides us with an opportunity to interpret the unique spectral attributes of crops [24]. A hyperspectral image includes numerous spectral bands with a narrow spectral resolution in a wide range of wavelengths. A hyperspectral image, comprising high-dimensional data, allows for a precise understanding of crop canopy attributes [25]. Based on this understanding, crop models can be developed to predict various parameters, such as biomass and crop chemical contents [26]. A regression analysis has been performed to develop a crop model for the estimation of dependent (crop parameters) and independent variables (spectral data, climate, and soil data). The independent variables in high-dimensional data can cause overfitting, which interferes with the reproducibility of high-performance models [27]. Some key bands among the narrow and merged spectral bands in hyperspectral data need to be selected to overcome this problem [28]. Machine learning approaches have been utilized to develop high-precision models which minimize overfitting through selecting the key bands for monitoring vegetation status [29]. The nutritional status of apple trees can be monitored using machine learning and UAV-based imagery. N and non-structural carbohydrate estimation models, such as the C/N ratio, which are important indicators of apple tree nutrition, have been developed using key bands from hyperspectral imagery. Support vector machine regression (SVR) for N estimation and Gaussian process regression for non-structural carbohydrate estimation have been proposed [30,31]. There have also been attempts to estimate the leaf area index, which can be used to indirectly evaluate the nutritional status of apple trees using multispectral imagery and a gradient-boosting decision tree [32]. Some studies have estimated the chlorophyll, N, P, and K in apple trees using non-imagery ground-based spectroscopy [33,34]; however, there have been no attempts to estimate other apple tree macronutrients through the use of airborne spectral imagery. Only one study has attempted to estimate the macronutrients in citrus trees using UAV-based multispectral imagery and gradient-boosting regression (GBR) [35], while another study attempted to estimate the macro- and micronutrients of persimmon leaves in the laboratory [36].
This study aimed to develop an estimation model for chlorophyll (Ch) and various macronutrients—including total nitrogen (T-N), P, K, C, Ca, and Mg—in apple trees using key bands obtained from hyperspectral imagery. Partial least squares regression (PLSR), as a multivariate analysis approach, and ridge regression (RR), k-nearest neighbors regression (KNR), SVR, and GBR, as machine learning approaches, were used to develop candidate models for this purpose. Their performance with full bands and selected key bands was evaluated to determine the best-performing model. Finally, an appropriate fertilization strategy is proposed through comparing and analyzing the estimated nutritional status of a tree using hyperspectral imagery and soil chemical properties, including pH; organic matter (OM); and T-N, P2O5, K, Ca, and Mg contents.

2. Materials and Methods

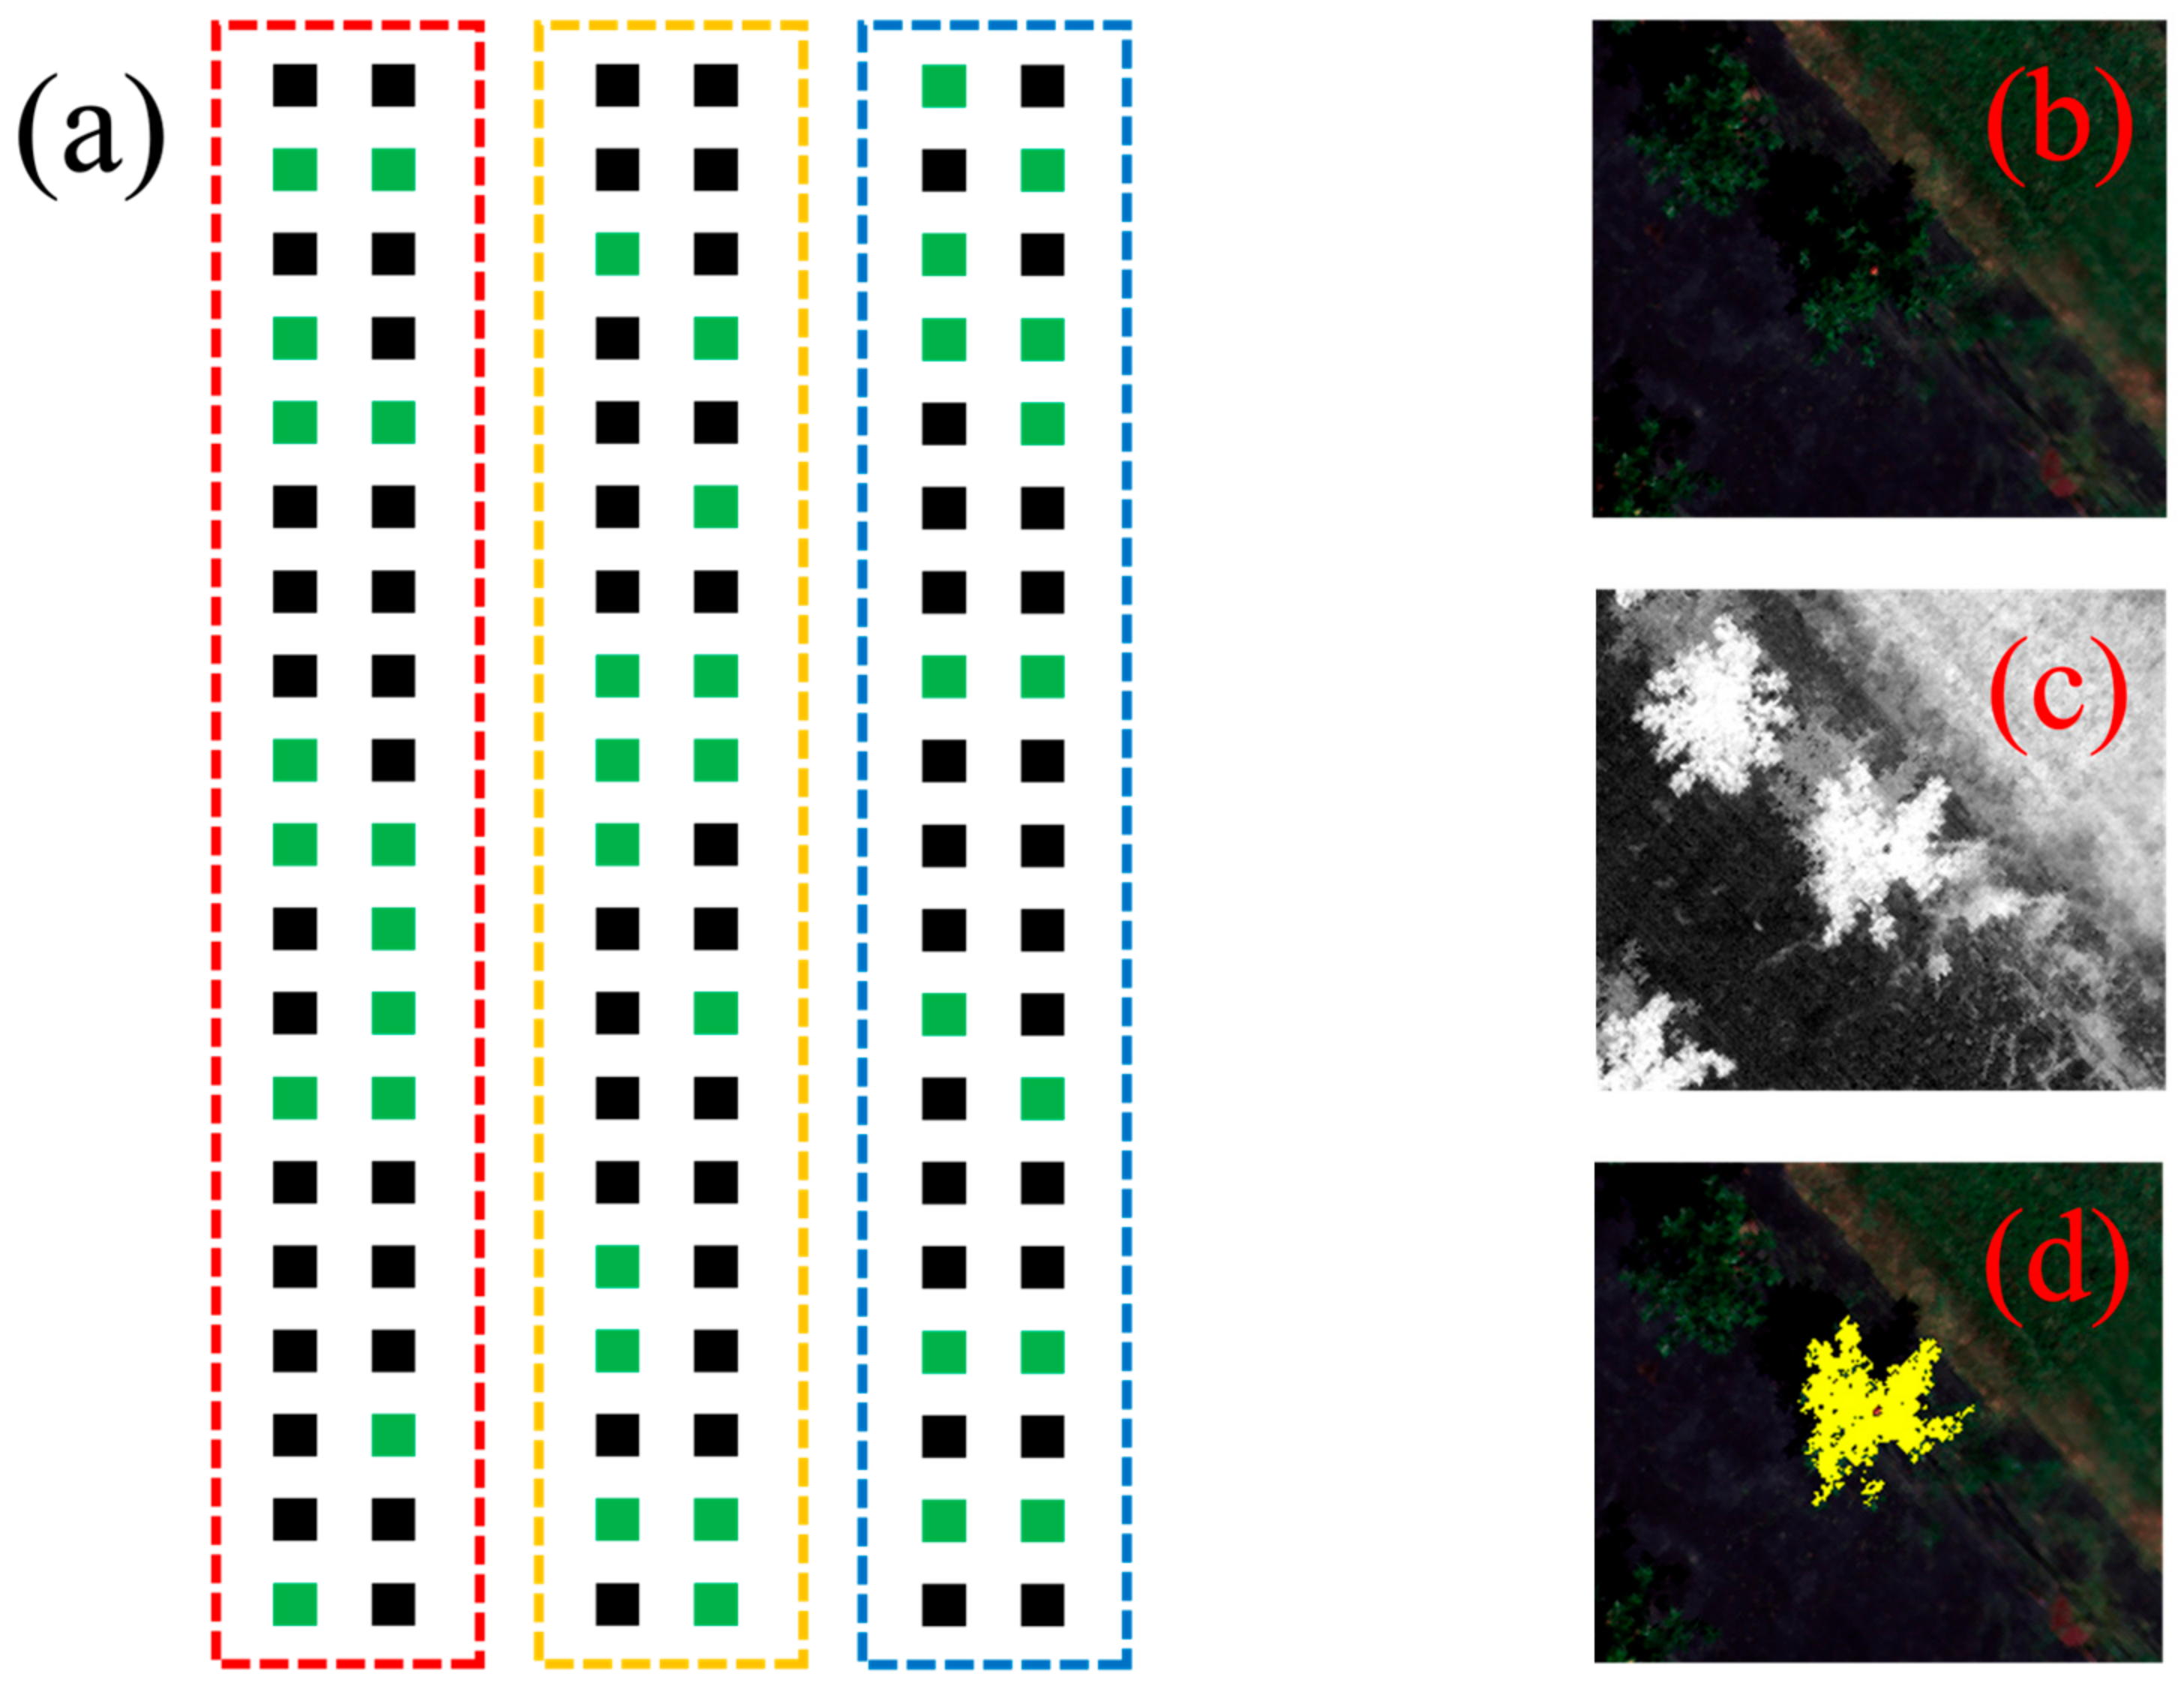
2.1. Experimental Design

This study was conducted in an experimental field (35°49′42.1″ N 127°01′53.4″ E) of the National Institute of Horticultural and Herbal Science in Wanju-gun, Jeollabuk-do. Two- and three-year-old apple trees of the Hongro/M.9 cultivar were grown in pots 43 cm in diameter and 41 cm in height, containing a 5:4:1 ratio of horticultural bed soil, decomposed granite soil, and perlite. Ammonium nitrate (NH4NO3) with a N content of 35% was diluted in 2 L of water and applied to the pots. Fertilizer was applied weekly during the growing period. The amount of fertilizer was doubled for the first 1.5 months, from the first to the fourth fertilization, in order to clarify the difference in tree nutrients depending on the nitrogen treatment group. A total of 114 trees were divided into 3 equal groups of 38 trees with different nitrogen fertilization regimes: excessive (171 g/year), moderate (43 g/year), and untreated (0 g/year) (Figure 1).
The meteorological conditions, averaged monthly for each year of the study, are shown in Figure 2. A weather station approximately 1.4 km from the experimental field collected the meteorological data. The mean temperature was similar between years, and the accumulated precipitation in 2022 was approximately 50 mm to 180 mm lower than that in 2021 between May and September, during the phase of active vegetative and reproductive growth.

2.2. Hyperspectral Image Acquisition and Processing

Hyperspectral images were acquired on June 9, June 22, July 13, July 28, August 11, August 31, September 15, September 30, and October 15 of 2021 and on May 23, June 3, June 17, July 4, July 19, July 28, August 16, September 7, and September 21 of 2022 using a hyperspectral imaging sensor (MicroHSI 410 Shark, Corning Inc., Corning, NY, USA) mounted on a UAV. This hyperspectral imaging sensor can measure 150 wavelengths in the 400–1000 nm range, with a field of view of 29.5°. The UAV was a quadcopter (Matrice 300 RTK, DJI Technology Inc., Shenzhen, China), with the dimensions and weight of 96 cm × 103 cm × 43 cm and 6.3 kg, respectively, and it had a maximum loading weight of 2.7 kg and a flight time of approximately 45 min when the hyperspectral imaging sensor was mounted on it. Automatic flight was controlled using flight planning software (DJI Pilot 1.1.5, DJI Technology Inc., China). The imaging area and flight plan were programmed in the Linux-based OS of the hyperspectral imaging sensor. The images were acquired with a spatial resolution of 4.4 cm/pixel at a flight speed of 6 m/s, an overlap rate of 70%, and an altitude of 60 m.
Image processing software (ENVI 5.6, Exelis Visual Information Solutions, Boulder, CO, USA) was used to generate orthoimages with gyroscopic and geometric corrections. The ρ reflectances of the orthoimages were radiometrically corrected through dividing by the ρ reflectances of a 12% reference board (Portable Fabric Target, Group 8 Technology Inc., Provo, UT, USA), in order to minimize the different light effects according to the time series, as follows:
ρ r a d i o m e t r i c   c o r r e c t i o n = ρ h y p e r s p e c t r a l   i m a g e ρ r e f e r e n c e   b o a r d .
The images were converted into normalized difference vegetation index images to emphasize the vegetation areas with ρ reflectances of 850 nm in the near-infrared (NIR) range and 677 nm in the red range:
N o r m a l i z e d   d i f f e r e n c e   v e g e t a t i o n   i n d e x = ( ρ N I R ρ r e d ) ( ρ N I R + ρ r e d ) .
The area with apple trees comprised the region of interest for extracting the spectral data of the apple tree canopy among the vegetation areas highlighted by the NDVI transformation. Figure 3 shows the positions of the sample trees, which were spaced 3 m apart horizontally and 2 m apart vertically, and depicts the process of spectral data extraction.
The single-band reflectances in the time-series images were divided into adjacent single bands using the band ratio method in order to minimize the unstable radiation effect caused by differences in sunlight angle and intensity, which vary with time.

2.3. Leaf Macronutrients and Soil Chemical Properties

Leaf macronutrient concentrations and soil chemical properties were analyzed according to the standards of the National Institute of Agricultural Science and Technology Soil and Plant Analysis Method [37]. First, 10 mature apple tree leaf samples from a total of 21 trees (7 per treatment group) were collected after hyperspectral image acquisition, in order to measure their chlorophyll content and macronutrient concentrations. Parts of the samples were extracted using a 1.1 cm diameter cork immersed in an Erlenmeyer flask containing acetone solution maintained at 4 °C in the dark for more than 12 h. The total chlorophyll content was measured with a spectrophotometer. After drying the sample with hot air at 60 °C for 5 days, 0.5 g was wet-decomposed with 10 mL of perchloric acid at a ratio of 85:15. The filtrate was washed with distilled water. Finally, the macronutrient content was measured using a C/N elemental analyzer (PrimacsSNC, Skalar Analytical BV, Breda, The Netherlands). The macronutrient content was calculated as a percentage of each tree’s dry mass in triplicate.
Samples for the soil chemical analysis were collected from each pot immediately after acquiring the leaf hyperspectral images. The sample was passed through a 2 mm mesh, mixed in a 1:5 ratio of the air-dried sample to distilled water, and shaken for 1 h to determine pH using an ORION Model 720A pH meter (Orion Instrument Co., Boston, MA, USA). OM was measured using the Tyurin method. Phosphoric acid was measured using the Lancaster method, and exchangeable chemical properties were measured using inductively coupled plasma atomic emission spectroscopy (GBC Integra XM2 model, GBC Scientific Equipment Ltd., Melbourne, Australia) after extraction with NH4Oac (pH 7.0). The cation exchange capacity was measured by mixing 10 g of the soil sample with 50 mL of leachate NH4Oac (pH 7.0), adjusting to complete the leaching in 12 h, followed by washing with 80% ethyl alcohol and distilling the soil sample with a Kjeldahl distiller.

2.4. Analysis

PLSR, RR, KNR, SVR, and GBR models, which were designed and calibrated to estimate macronutrient concentrations from the reflectances of the band ratios, were integrated into an agricultural data analysis platform (FinePro, Hortizen Co. Ltd., Republic of Korea). The PLSR model, a multivariate regression analysis, was developed to estimate regression’s performance in comparison with the machine learning models. The calibration was cross-validated by setting the k-fold parameter to 5, considering the number of samples used for validation. A grid search was used to identify the best parameters for each model (i.e., with the lowest MSE) to minimize overfitting. The model parameters were selected by sequentially applying latent variables from 1 to 15 in PLSR; an alpha of 0.001, 0.01, 0.1, and 1 in RR; n_neighbors from 1 to 10 in KNR; C from 1 to 10 in SVR; and n_estimators of 100, 200, 400, and 600 in GBR. R2 calibration and validation results using full-band ratios were compared to select the optimal models that showed potential for estimation. The possibilities of reducing computational costs and improving reproducibility were considered through comparing the performance of the selected models when using full-band ratios and selected key band ratios [38]. The key band ratios were selected through comparing the R2 calibration and validation results, depending on the combination used, and listed according to the rank of importance of each band ratio, using the variable importance in projection score for the PLSR model and the Shapley additive explanation (SHAP) value for the other models. Specifically, the models were developed with their band ratio decreasing from 10 to 2, depending on the SHAP rank lists (band ratios ranked in descending order of SHAP value), and the minimum combination of band ratios that showed a reduction rate of less than 10% compared with the R2 of the model using the full-band ratio was selected as the key band ratio combination for each macronutrient. All mentioned analyses are detailed in Figure 4.
Model performance was evaluated using the coefficient of determination (R2), the root mean squared error (RMSE), and the relative error (RE). The RMSE and RE were calculated as follows:
R M S E = i = 1 n ( y i y ¯ i ) 2 n ,
R E = 100 y ¯ i = 1 n ( y i y ¯ i ) 2 n ,
where y i and y ¯ i are the observed and estimated values, respectively, of the macronutrient concentration i; y ¯ i is the mean value of the macronutrient concentration; and n is the number of samples. RE represents the ratio of the RMSE to the mean value in vegetation.
The leaf macronutrient concentrations and soil chemical properties were compared with a two-sample t-test, depending on the growing season and their fertilization. Changes in nutritional status due to the internal circulation of apple trees, which was related to changes in the soil chemical properties absorbed at the root, were observed through this analysis, allowing an appropriate fertilization strategy to be suggested based on the monitoring results obtained using the estimation models.

2.4.1. Partial Least Squares Regression

PLSR is a bilinear calibration approach that reduces large quantities of measured collinear spectral variables into uncorrelated principal components combined with a multiple regression analysis using data compression [12]. Latent factors that describe the covariance between the independent and dependent variables are extracted as much as possible through the principal component analysis. To estimate the value of the dependent variable, the multiple regression step involves independent variable decomposition. PLSR has been previously used to obtain the biophysical information of vegetation from spectral information, especially when the estimators correlate highly, are multicollinear, or when the number of predictors exceeds that of the independent variables, such as typically is the case for hyperspectral data [39].

2.4.2. Ridge Regression

RR is a shrinkage method that minimizes the magnitude of multiple regression coefficients with highly correlated independent variables [40]. Due to the multicollinearity problem of independent variables, some information—including noise, which reduces accuracy—is deleted to develop an optimal model.

2.4.3. k-Nearest Neighbors Regression

k-nearest neighbors (kNN) is a non-parametric technique that groups individual data points by proximity [41]. The number of neighbors in kNN, n_neighbors, is determined to derive predictions with respect to an associated group of nearest neighbors, derived through calculating the Euclidean, Manhattan, and Minkowski distances present in this study [42]. In the regression analysis, continuous values are derived using the mean of the nearest neighbors; as such, the lower the n_neighbors value, the more complex the model, making it more prone to overfitting.

2.4.4. Support Vector Machine Regression

To design optimal decision boundaries, a support vector machine (SVM) uses the hypothesis space of linear functions in a high-dimensional feature space [43]. The C parameter of the SVM determines how much error can be tolerated, with a large value allowing samples to approach the hard margin, increasing the overfitting possibility, while a small value approaches the soft margin. When applying a kernel, gamma determines the curvature of the decision boundary [44]. The kernel was fixed to be linear, in order to reduce the model complexity, and gamma was selected as 1 × 10⁻⁷ for all SVR models.

2.4.5. Gradient-Boosting Regression

A gradient-boosting machine is a tree-based method that uses a forward-learning ensemble [45]. Each tree is iteratively adjusted to reduce the previous tree’s residual in the gradient direction to create a sequence of trees, thus minimizing the error between the output and the true value [46]. The final model is obtained by summing the outputs of all models from previous iterations [32].

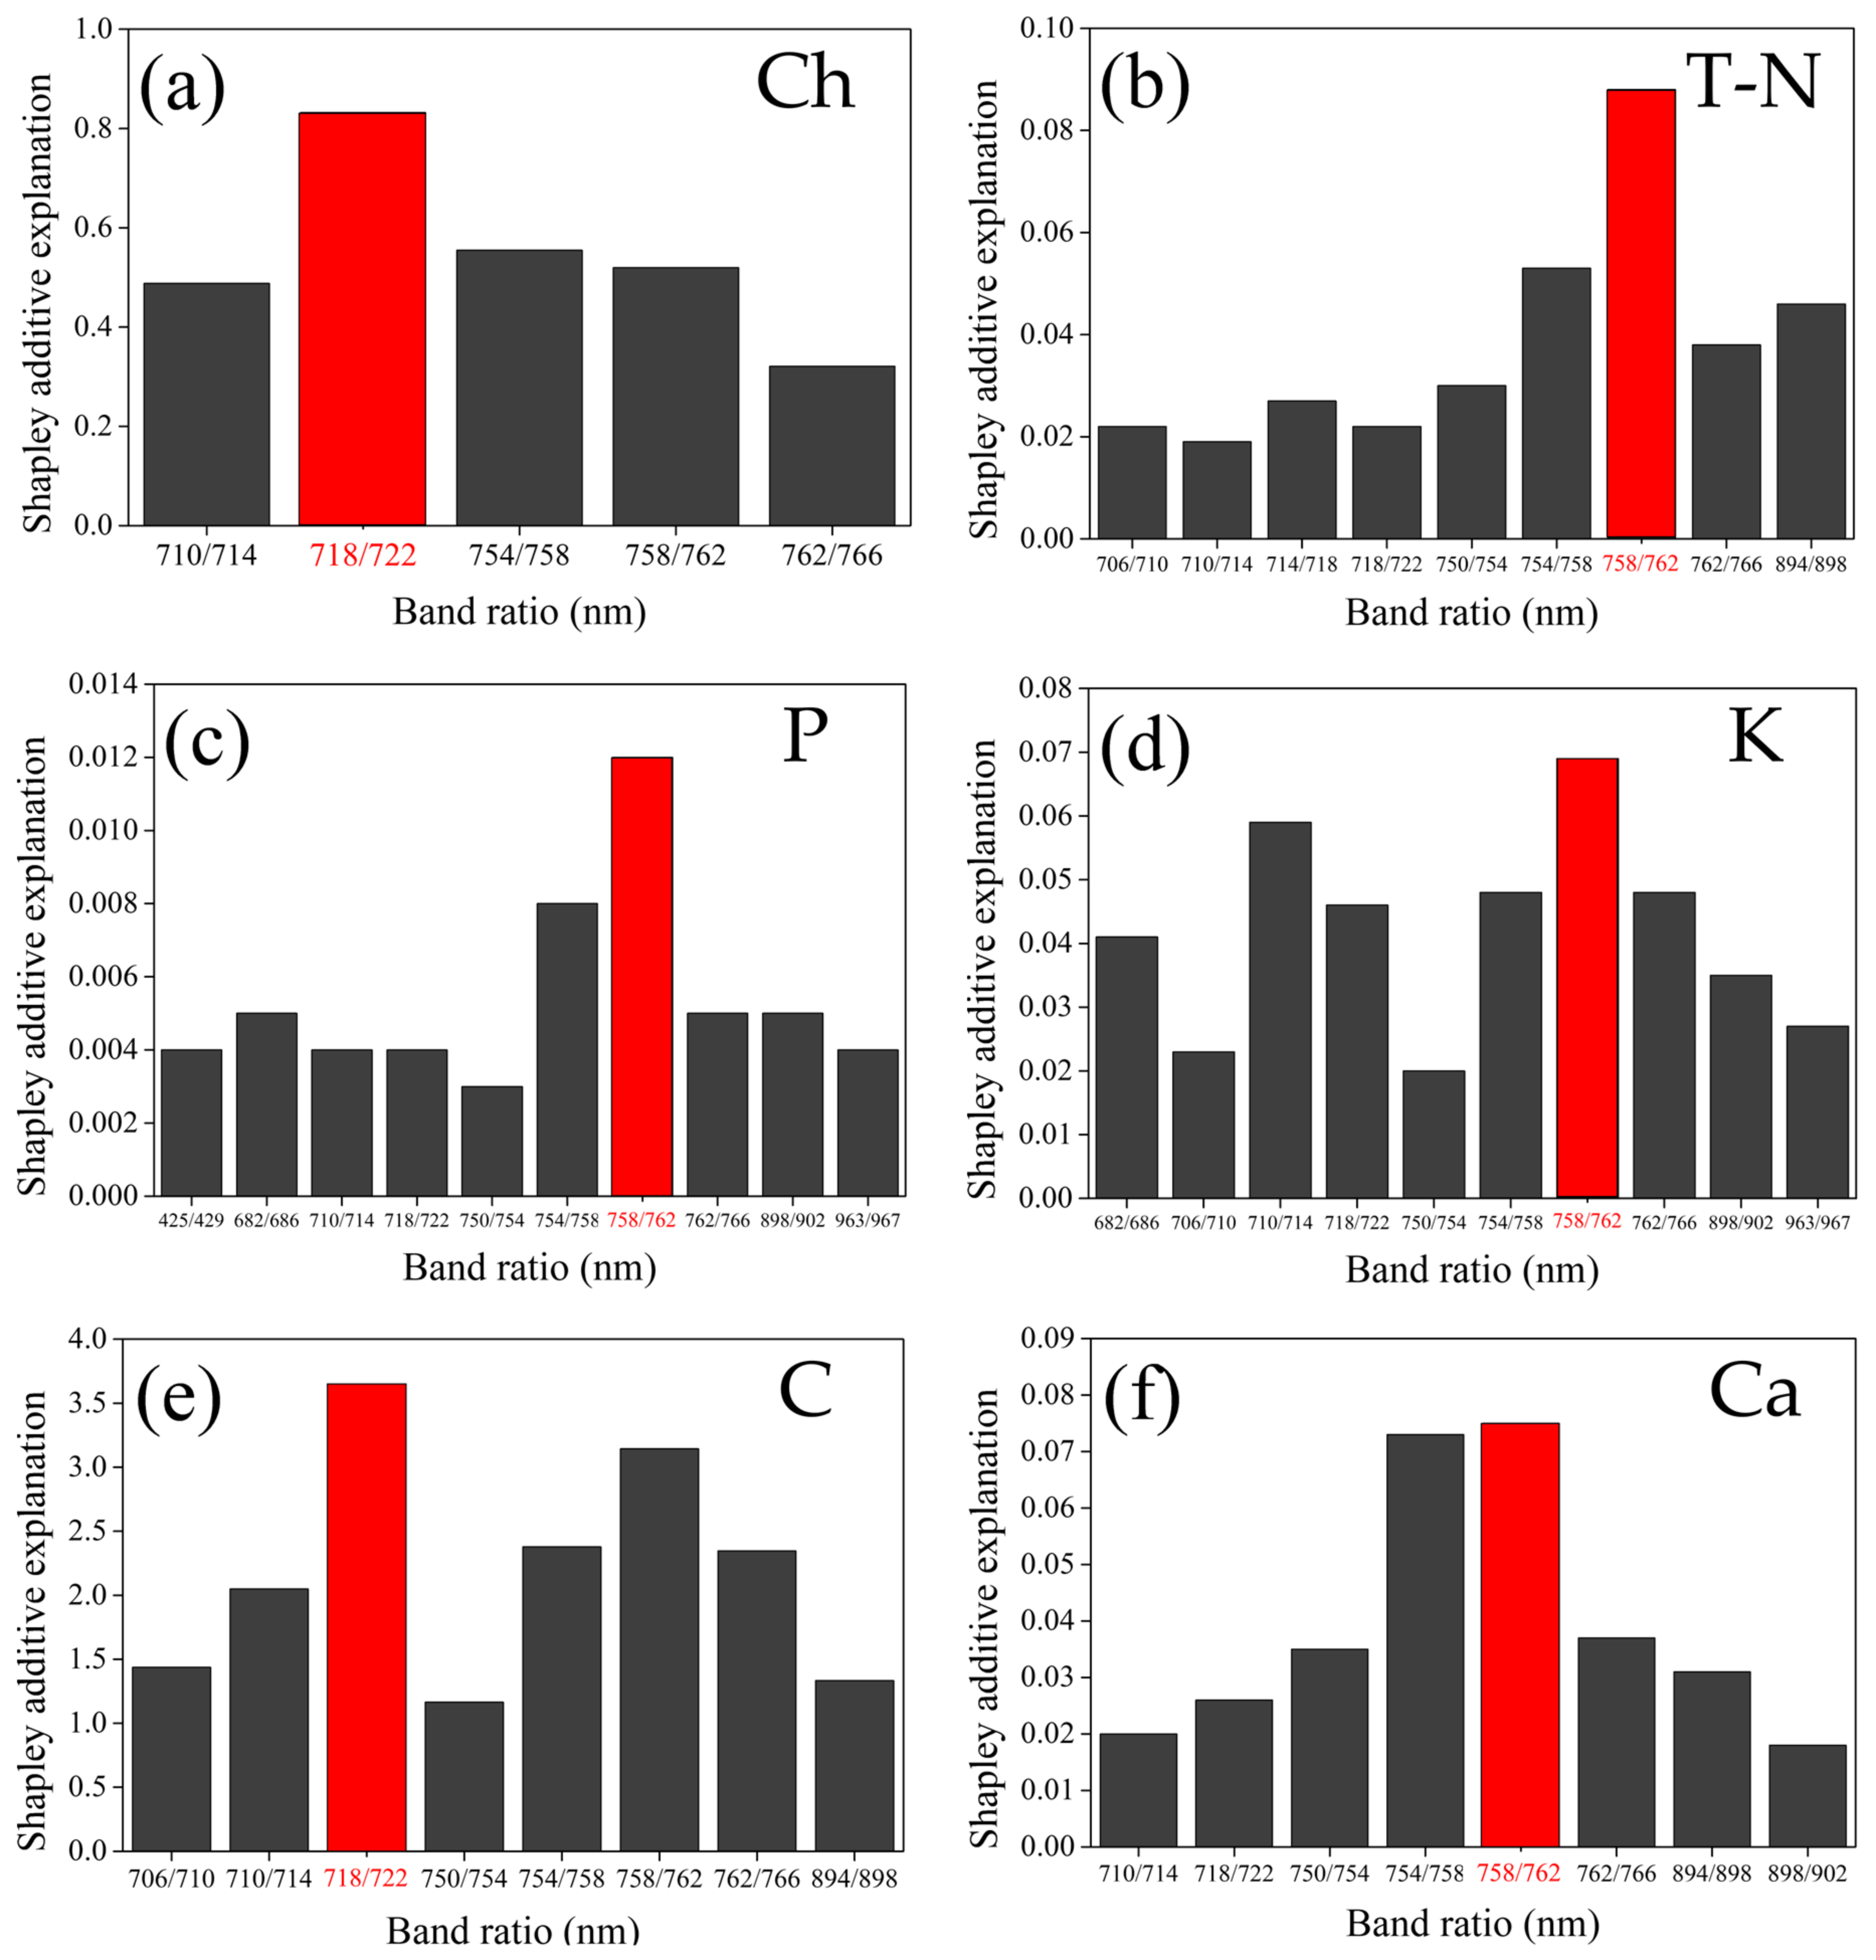
2.4.6. Shapley Additive Explanation

The Shapley value allows for the investigation of the mechanism by which the input variables contribute to the output values of a complex machine learning model. Important input variables are identified by observing the Shapley value (change in the predicted value), which is obtained as a result of combined changes due to adding or removing input variables. The Shapley value creates a matrix and ranks variables based on their average values [47]. In this way, the positive and negative effects of individual input variables on the entire data set can be calculated, providing granular insight into the functionality of the model [48].

3. Results

3.1. Reflectance Curve

Figure 5 shows the apple tree canopy reflectance curves for the band ratios obtained using hyperspectral imagery time series from 2021 and 2022. The reflectances tended to reduce sharply at the highest green (510–520 nm) in the visible light range, the starting point (680–700 nm) and endpoint (750–770 nm) of the red edge, and the NIR range (960–970 nm), which is the moisture absorption wavelength range. Conversely, the reflectances in the NIR region—which is the endpoint of the red edge (750–760 nm) and has a starting point of approximately 900 nm—tended to increase. Decreases and increases are expressed normally, based on the main spectral characteristics of the vegetation.

3.2. Estimation Model with Full-band Ratios

Table 1 presents the obtained data (i.e., sample number and mean ± standard deviation) on Ch and macronutrients used to develop the model.
Table 2 shows the performance of each machine learning model developed using the full-band ratios for 2021, 2022, and all years when estimating Ch and macronutrients. Validation was given priority in the model selection criteria, as it is an important indicator in showing whether a model is well designed (i.e., without underfitting or overfitting, which interferes with model reproducibility) [49]. For Ch, the R2 validation was <0.35 within each individual year, but was >0.46 for all years, based on the worst-performing machine learning model. The chlorophyll content levels in 2021 and 2022 shown in Table 1 indicate that the low content of 5.03 μg/cm2 in 2021 and the high content of 9.22 μg/cm2 in 2022 were complemented, further indicating the advantage of developing an estimation model [25]. The R2 values of KNR and SVR were the highest (at over 0.72) in the validation; therefore, Ch estimation models using data from all years were employed as the standard. The highest R2 in calibration was 0.99 with GBR; however, in validation, this value reduced to 0.52, showing the tendency of this model to overfit. Considering overfitting, which hinders the applicability of a model in the field, KNR and SVR were assumed to be the most appropriate models for estimating Ch, with validation R2 values greater than 0.72.
For T-N concentration estimations, the R2 validation was <0.33 for all years and machine learning models, showing its low estimation potential. For P, R2 was N/A for most machine learning models; however, in the KNR model only, its value was calculated as 0.30 in 2021, 0.64 in 2022, and 0.48 in all years. For K, similar to Ch, the validation R2 was <0.22 for all machine learning models in 2021, with a low concentration deviation, demonstrating their low estimation potential. In 2022, the average and deviation for P were relatively high compared to those in 2021, and the SVR and KNR validation R2 values were greater than 0.67 and greater than 0.58 in all years. Additionally, C presented the same trend as Ch and K in each year and, in all years, the KNR model showed overwhelmingly high R2 values (0.99 in calibration and 0.90 in validation).
In contrast, for Ca, where the mean and deviation were similar in each year, the highest validation R2 was 0.54 in 2021, 0.43 in 2022, and 0.50 in all years. Mg had similar means and deviations for each year, but its estimation potential was low, with an R2 < 0.27 in its validation for all years and machine learning models. In summary, among the macronutrients in the apple tree leaves, the N and Mg concentrations did not have a high estimation potential in all years. For the other macronutrient concentrations, including Ch, it was more advantageous to develop an estimation model for all years as then more sufficient variation in the data set could be ensured, compared to that possible for a single year, where it was not calculated (N/A) or overfitted in most models. Among the machine learning models, KNR and SVR showed relatively high estimation potentials. Therefore, these models were developed using data sets from all years with key band ratios.

3.3. Estimation Model with the Selection of Key Band Ratios

Table 3 presents the R2 values of the SVR and KNR models developed by reducing the number of band ratios from 10 to 2, according to their SHAP importance in the models using full-band ratios. As the number of band ratios was reduced, if the loss in validation R2 did not exceed 10% based on the full-band ratios, as the first condition, and did not exceed 5% based on the 10 band ratios, as the second condition, the combination was selected as the key band ratio; in other words, it was assumed that a model developed with a combination of band ratios (key band ratios) that maintained an R2 value in that range had the highest estimation potential. For Ch, not only was the R2 of the KNR model higher than that of SVR in all band ratio combinations, but it was also maintained at five band ratios, which is fewer than that for the SVR model, in which it was maintained at nine band ratios. For T-N, the SVR model showed a higher R2 (of 0.14) but was insufficient to estimate the N concentration. For P, R2 was not calculated for all SVR models. However, the R2 of the KNR model using 10 band ratios (with 0.66 in calibration and 0.44 in validation) was similar to those of the model using full-band ratios. Even for K, the R2 of the KNR models was higher than that of the SVR models. Ten band ratios were selected, and the R2 was 0.73 in calibration and 0.53 in validation. Compared with the full-band ratio model results for C, Ca, and Mg, the KNR models maintained a better R2 than the SVR models. Eight band ratios were selected for the KNR models for C and Ca, with R2 values of 0.96 and 0.66 for calibration and 0.85 and 0.42 for validation, respectively. Regarding Mg, the KNR model using 10 band ratios had an R2 of 0.21, which was insufficient for the estimation of its concentration. Compared with the KNR model using full-band ratios, an R2 deterioration of more than 10% was not observed in any of the macronutrient estimates, showing the potential for estimation using hyperspectral imagery, except for the estimation of T-N and Mg. In conclusion, the KNR model was found to have a higher potential for estimating the macronutrients in apple tree leaves than the other machine learning models.
The key band ratios and the KNR model parameters for estimating each macronutrient, selected through comparing the R2 values of the models based on different band ratio numbers, which are displayed in Table 3, are presented in Table 4. For N and Mg estimations using the KNR model, the band ratios between 706 and 722, 750 and 766, and 894 and 911 were the most sensitive variables within the spectral data set used in this study; however, they remained insufficient for their estimation. Moreover, the models were underfitted with a n_neighbors of 9, even though 10 band ratios and the parameters selected with the minimum MSE were used. This finding means that other spectral information, besides the data set used in this study, is required. For P, band ratios between 710 and 766 in the red edge wavelength range, 425/429 in the blue wavelength range, the start point (682/686) in the red edge wavelength range, and 898/902 and 963/967 in the NIR wavelength range were selected as the key band ratios. For K, the key band ratios were selected in the same wavelength range, except for 425/429. The key band ratios also overlapped in the same wavelength range for C and Ca, which was mainly composed of the red edge (710 to 722), the endpoint (750 to 766) of the red edge, and the start point (894 to 902) of the water absorption wavelength region. Furthermore, for Ch, five key band ratios were selected in only the red edge range, completely overlapping with the key band ratios for the macronutrients. For Ch and all macronutrients (except for T-N and Mg, which were underfitted), an n_neighbors value of less than 5 was selected. As a result, 13 key band ratios were determined to be required for apple orchard nutritional management: 425/429, 682/686, 710/714, 714/718, 718/722, 750/754, 754/758, 758/762, 762/766, 894/898, 898/902, 906/911, and 963/967.

3.4. Optimized Estimation Model

The estimation performance of the KNR model composed of the selected key band ratios and parameters for each macronutrient is presented in Table 5. For P, K, and Ca, the calibration and validation errors exhibited an RMSE of 0.04%, 0.23%, and 0.25% or less and an RE of 28.2%, 27.6%, and 20.0% or less, respectively. In the P, K, and Ca validations, the REs were in the range of 20.0%–28.2%, while those for Ch and C did not exceed 20%. Estimating the Ch content—which is mainly located in the palisade parenchyma closest to the leaf epidermis—and the C concentration—constituting the entire leaf—was relatively more advantageous than estimating the other macronutrients. T-N and Mg showed RE values between 18.8% and 25.3% in their calibration and validation, but were considered to be unsuitable as estimation models due to their low R2 values. Furthermore, a method for improving linearity is required for the P and Ca models, as their validation R2 did not exceed 0.50.
Figure 6 shows the linear relationships between the measured Ch and macronutrients and the Ch and macronutrients predicted using the KNR models based on UAV-derived hyperspectral imagery. As indicated by the REs, which were less than 30% for all macronutrient estimation models, the sample points were not significantly scattered. In terms of linearity, the order of C, Ch, K, P, and Ca was well fitted to the 1:1 line. However, T-N and Mg showed sharply different slopes from the 1:1 line, reflecting the relatively poor model performance here.
If comprehensive apple tree health monitoring technology utilizing the predictions made by the KNR models with UAV-based hyperspectral imaging data is leveraged to develop a more detailed fertilization plan in the orchard, it can be expected to have positive impacts on fruit yield and quality.

3.5. Soil Chemical Properties

Establishing a fertilization strategy for each tree in accordance with the objective of applying precision agriculture to orchards is appropriate; however, considering that this study was conducted by artificially controlling the amount of N fertilizer in the experimental field, soil chemical properties and macronutrients were also analyzed using the average depending on the tree’s fertilization group and growing season.
The two-sample t-test results for 2021 and 2022 indicated that the soil chemical properties depended on the fertilization group and growing season, as shown in Table 6 and Table 7, respectively. The T-N of the soil in both 2021 and 2022 showed a general tendency to increase as fertilization increased. T-N, in the form of organic matter (OM), decomposed into inorganic substances with a relatively high summer temperature, as shown in Figure 1, and was steadily absorbed into the tree during its vegetative and reproductive growth periods between May and August; as such, its content in the soil was relatively low. In contrast, uptake was lower during the fruit enlargement period, causing the soil T-N content to increase after September [50,51]. Therefore, OM also showed a similar trend to T-N. As nitrogen fertilization increased in all years and all growing seasons, the soil became more acidic and the pH significantly decreased [19]. Soil pH is an important factor that affects the availability of soil nutrients, which affects vegetation growth. As pH increases, the K, Ca, and Mg in the soil also increase, consequently increasing tree uptake [52,53,54].

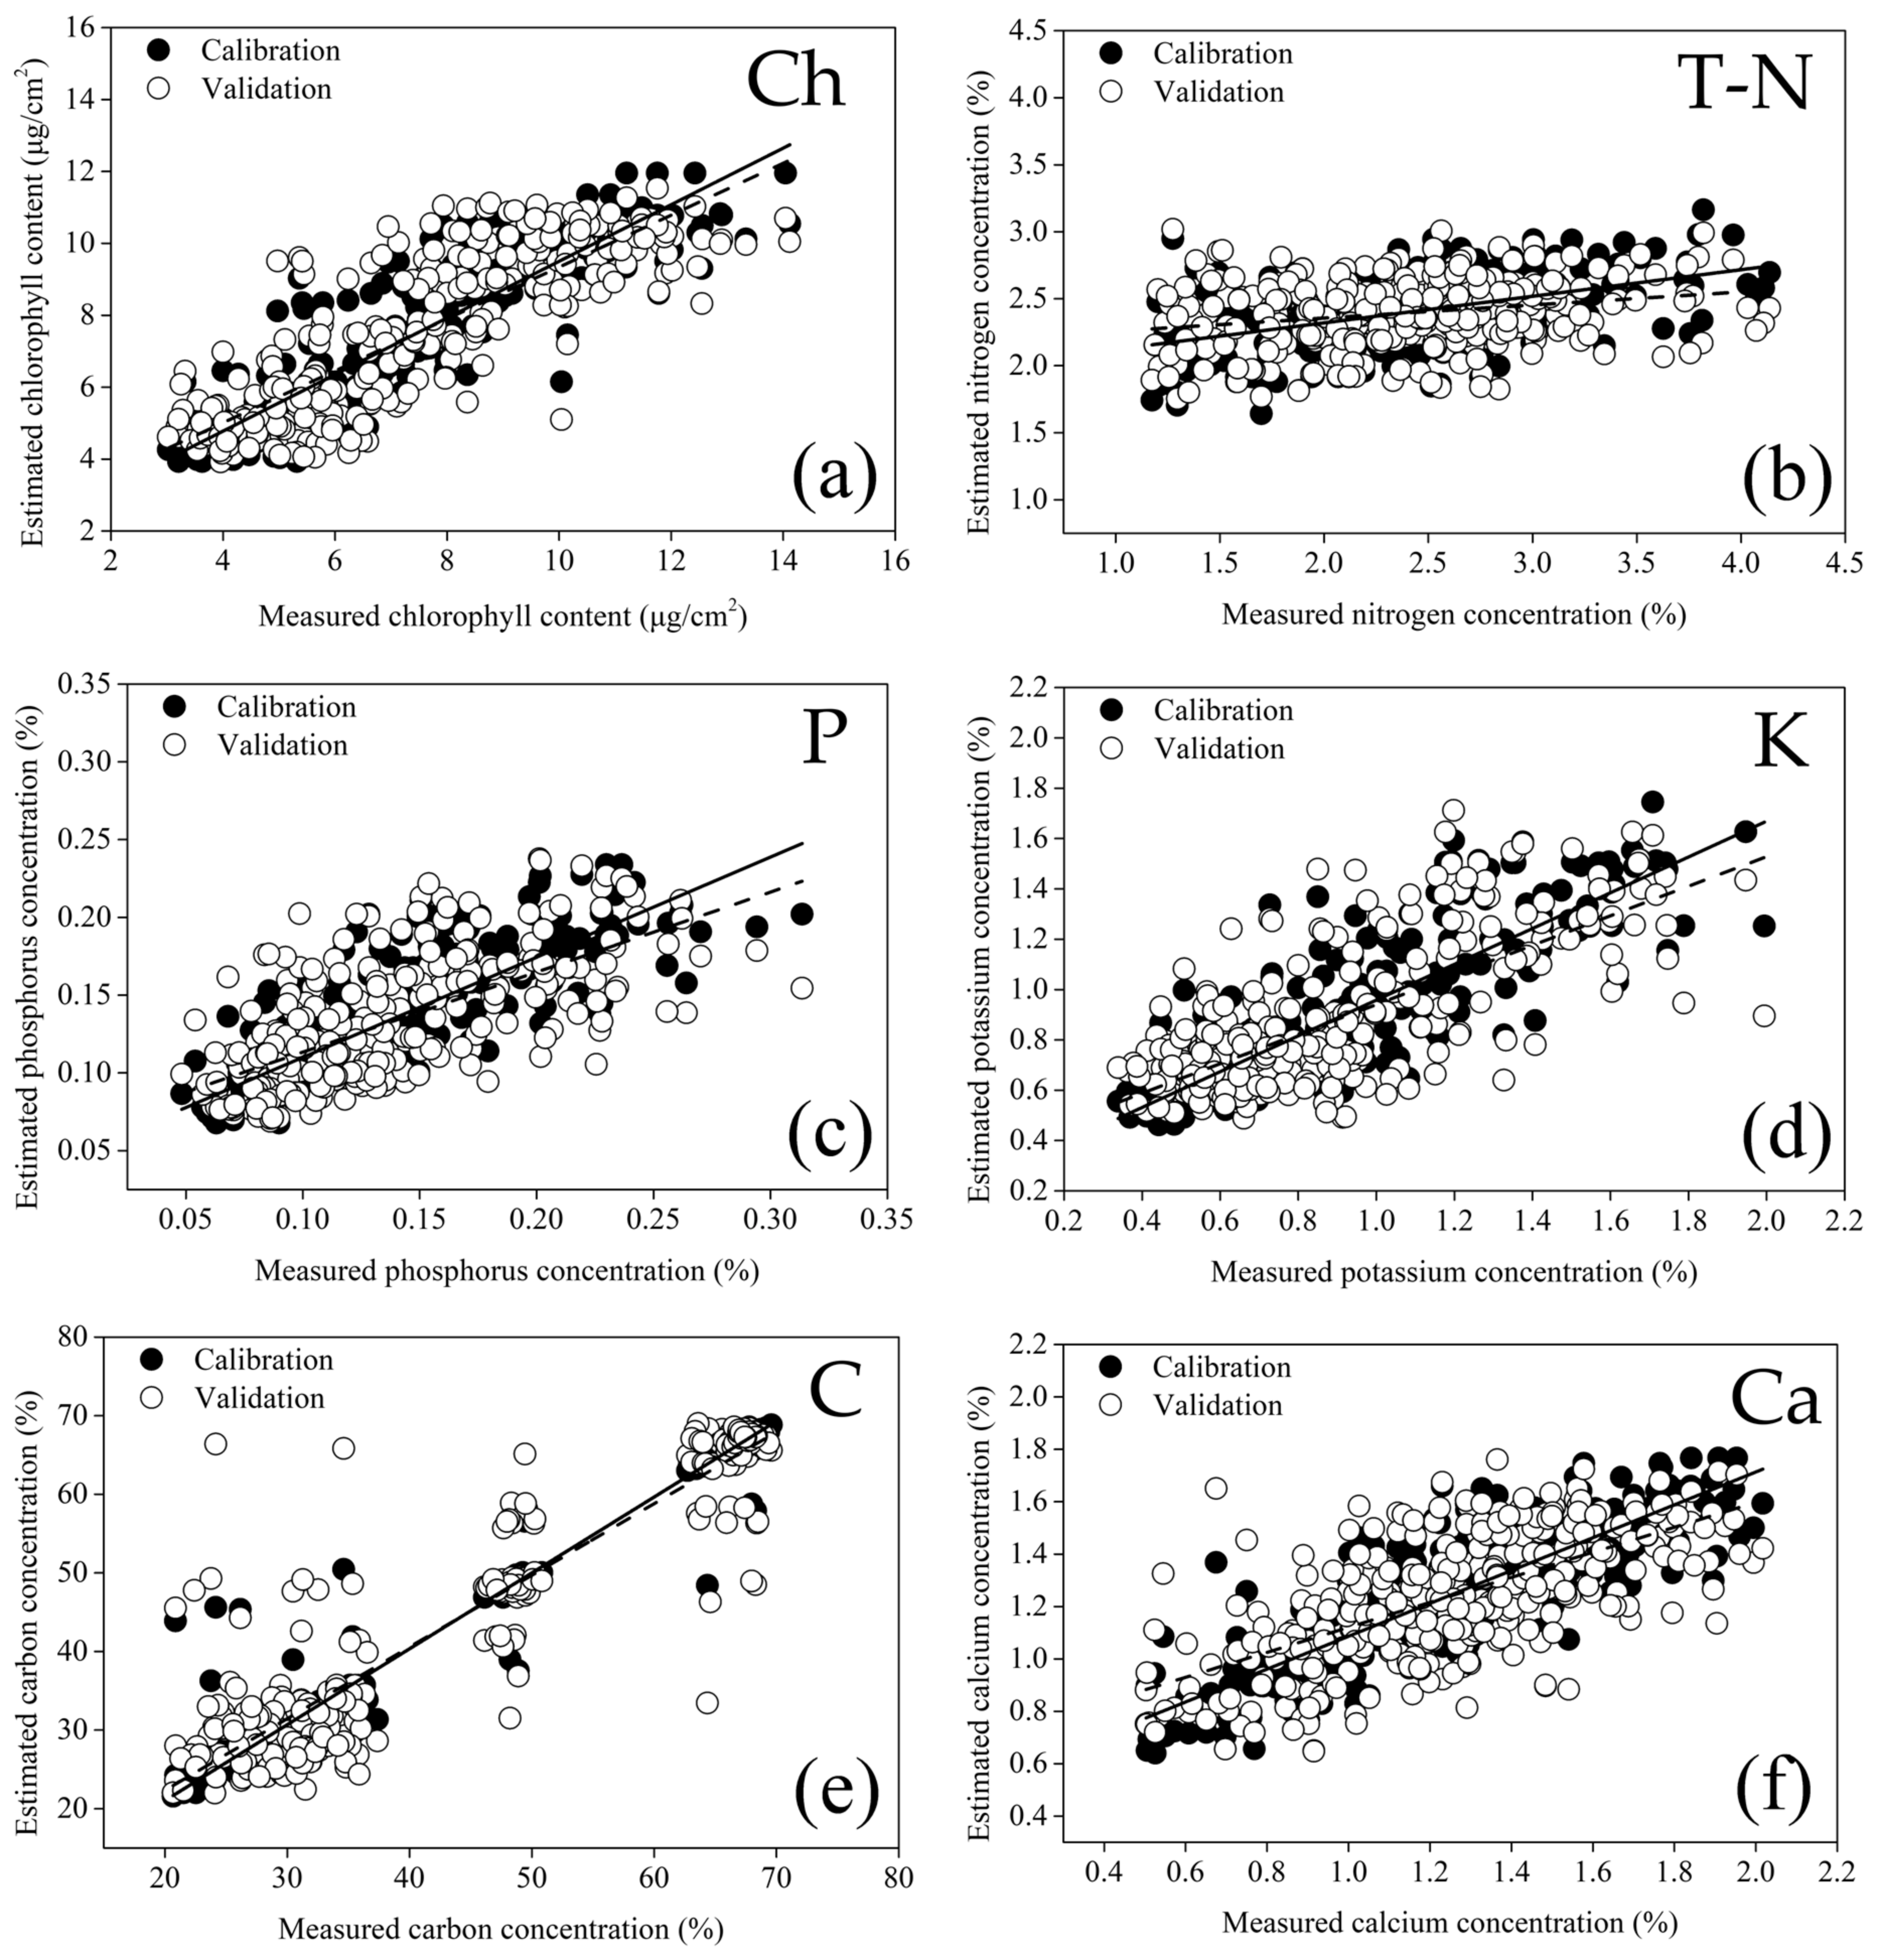
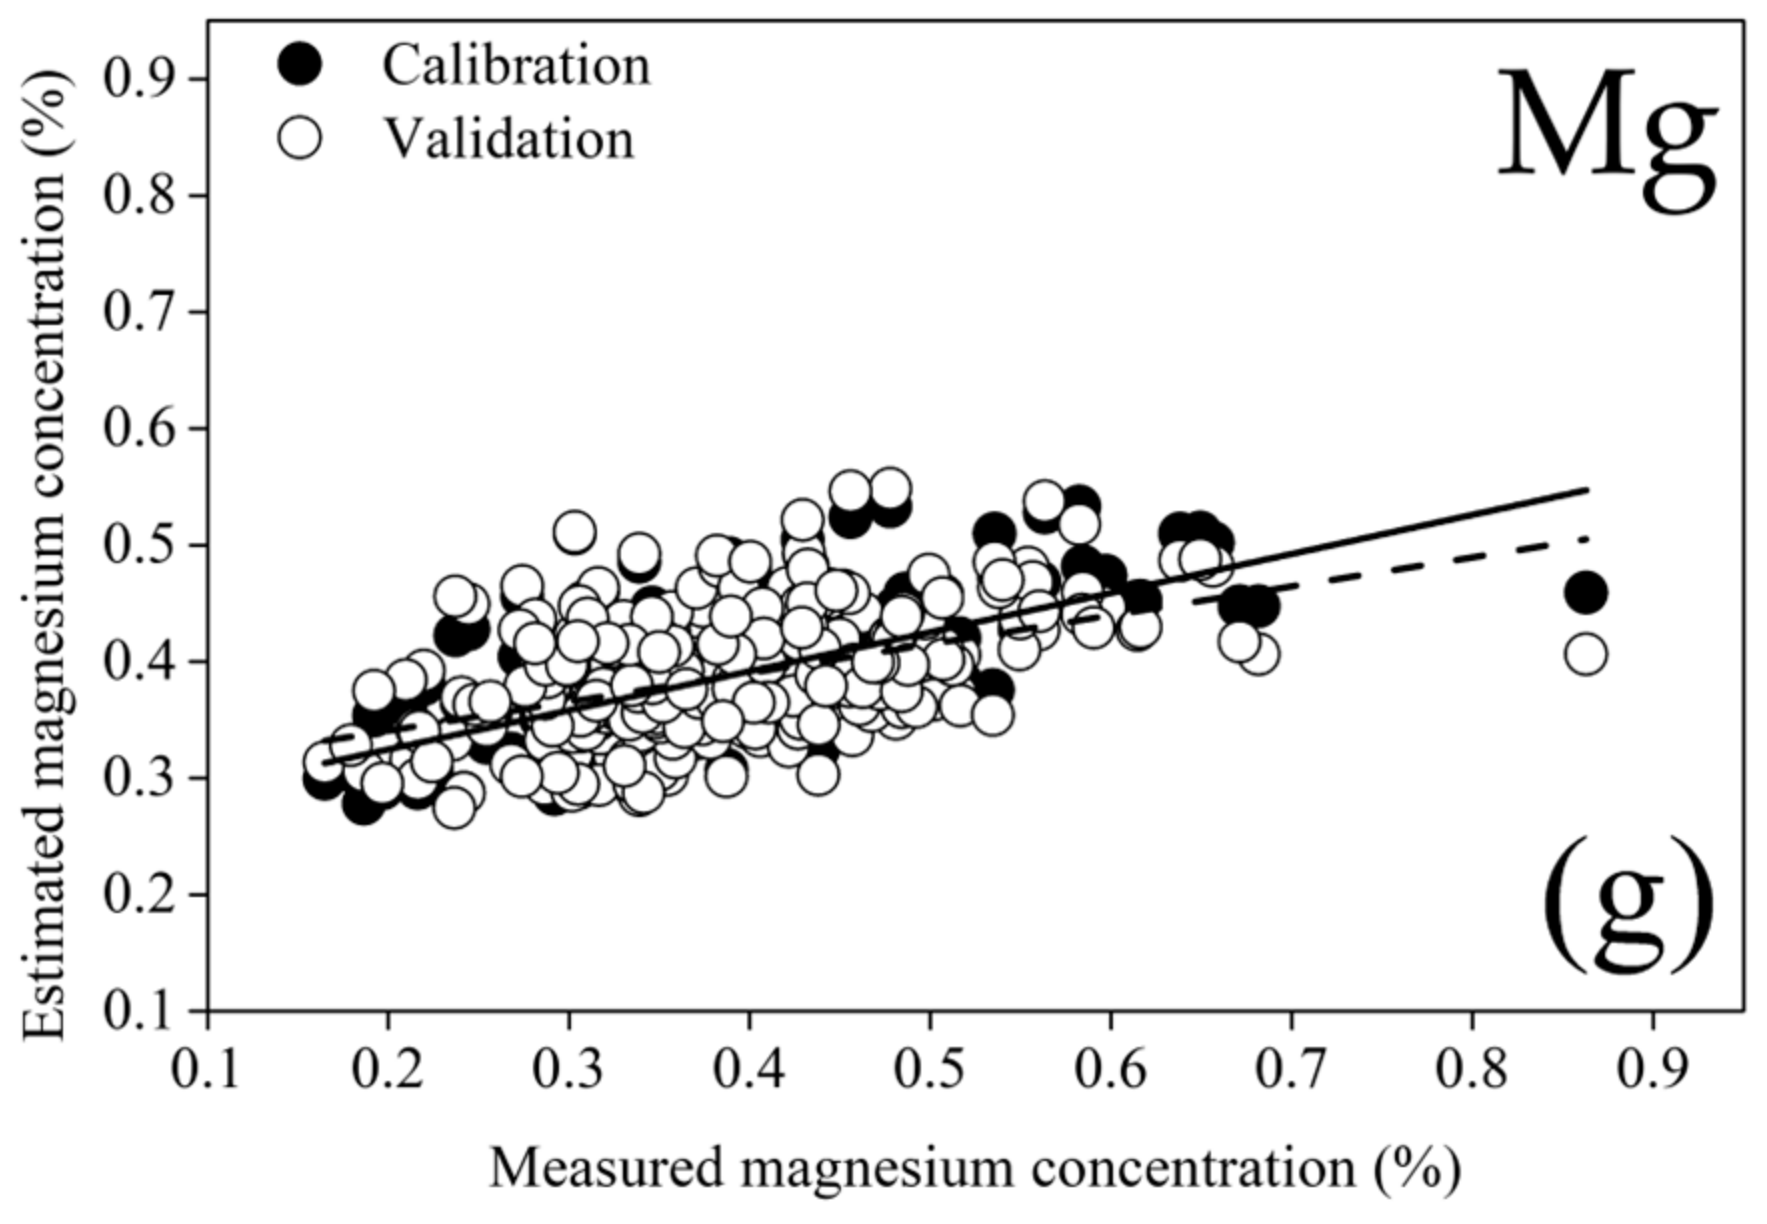
3.6. Estimated Macronutrients

Table 8 and Table 9 present the results of a two-sample t-test evaluating the means and standard deviations of the estimated Ch content and macronutrient concentrations in the apple trees for the validation of the KNR models (excluding N and Mg, as they had low estimation potential) for each growing season and N fertilization group. Among the average macronutrient values for all nitrogen fertilization groups in each growing season in 2021 and 2022, the values of P and K decreased or were maintained at constant levels throughout the season. The average value of C also increased or was maintained at a constant level, while that of Ca steadily increased. The P and K concentrations in the leaves decreased as the transfer rate from tree organs to fruit increased during the transition from vegetative growth to reproductive growth, as proven by the decreasing trend in leaf Ch. Furthermore, C increased from late May when OM production, such as leaves and branches, was active, while Ca increased to maintain the larger above-ground parts of the tree [55]. In contrast, the K concentration decreased, indirectly suggesting that Mg—which plays the same role as Ca—dominated in this competition.

4. Discussion

4.1. The Key Band Ratios of the Estimation Model

Figure 7 shows the Shapley values for the key band ratios for chlorophyll and each macronutrient. The Shapley values were compared as relative rankings among the band ratios, as they do not represent absolute values. The highest Shapley value for all macronutrients was obtained for 758/762 while, for Ch and C, 718/722 yielded the highest. As in the study that suggested 715 nm for estimating Ch, it was determined that 718/722 was advantageous for estimating Ch and C, which occupy the largest portions in plant compositions [56]. Regarding T-N, P, C, and Ca, 754/758 was the second-highest band ratio and, for most macronutrients, it was also ranked the third- or fourth-highest. As in the study where 750–760 nm was included in large quantities as the favorable wavelength for estimating the macronutrients in oil palm trees, 754/758 and 758/762 were determined to be wavelengths with a high influence on estimating the macronutrients in apple trees [57]. The second-highest band ratios for P and Mg differed, being 710/714 and 762/766, respectively. It was demonstrated that slightly different red edges, 718/722, and the endpoint (758/762) of the red edge with the highest rankings had a relatively strong influence when estimating macronutrients. In addition, for the KNR estimation model, it was advantageous to include a ratio of two or three NIR band ratios in the water absorption wavelength (close to or after 900) [26,58] in order to estimate the P, K, Ca, and Mg moving through the leaf veins in the xylem and phloem. T-N, which is the sum of nitrate nitrogen (NO3-N) and ammonia nitrogen (NH4-N), is used to synthesize amino acids, proteins, and growth hormones. C accumulates via photosynthesis and is essential for forming organic structures [59]. The key band ratios were selected through adding only the 894/898 NIR band ratio, focusing on the red edge, which is closely related to biochemical and biophysical changes. Only red edges were sufficient to estimate chlorophyll, which is mainly located in the palisade parenchyma [60]. The results of this spectral analysis serve as basic data for future research on nutrient management in apple orchards using hyperspectral data.

4.2. Fertilization Strategy

An approach to establishing a future fertilization strategy was developed by reviewing the macronutrient estimates and soil analysis results for apple trees grown under uniform fertilization in the orchard field considered in this study.
Late May is an important time in the nutrient transition period, when assimilated nutrients are used for the branch and leaf growth necessary for fruit production that year. The shape of the fruit is determined at this time in a manner depending on the tree’s nutrient status, which greatly affects the size of the fruit [61]. In this context, P is needed to help with cell division, and Ca must also be supplemented to prevent calcium physiological disorders. From 23 May 2022, soil P2O5 concentrations (Table 7) increased and Ca concentrations decreased in a manner dependent on the amount of N fertilization; however, there was no significant difference in leaf P and Ca concentrations (Table 9). As shown in Figure 1, it can be assumed that the lack of water in May (with 0 mm precipitation) reduced the trees’ nutrient uptake and transport [62]. Additional experiments will be needed in the future to suggest a specific fertilization strategy for early to mid-May.
Late May to early July is a self-sufficient period, in which nutrients can be sucked up from new roots and photosynthesized in leaves, promoting the growth and expansion of branches and roots. Most of the N provided during this period is used for leaf growth for photosynthesis, and a part of it flows into the fruit [63]. Additionally, a significant amount of K is needed to transport large amounts of stored nutrients and Mg—the main component of chlorophyll—in order to increase the photosynthetic efficiency of the plant [64]. Although the Mg concentration could not be observed quantitatively in this study, due to the low performance of the Mg estimation model, the increase in the chlorophyll content in the apple trees from June 3 to July 4 of 2022 (Table 8 and Table 9) suggests that Mg was steadily absorbed. The K concentration in the apple trees was considerably higher on June 9 and June 22 in 2021 and on June 3, June 17, and July 4 in 2022 compared to other seasons. No notable difference was observed in the apple trees’ K concentration due to their N fertilization groups in all seasons, except for on June 17, 2022. On the same date, the C concentration increased slightly in the forming leaves depending on the amount of provided N fertilization. No significant difference was observed in soil K concentration, even at different soil pH values, regardless of the amount of nitrogen fertilization supplied, in late May to early July of 2021 and 2022. As the soil pH decreased and N fertilization increased, the soil Mg concentration tended to equally decrease. When comparing the average values of all N fertilization groups, the Mg concentration was 1.63 cmol/kg or less in June and early July of 2022 and was lower than 2.33 cmol/kg in June 2021; hence, increasing the soil pH through reducing N fertilization during the corresponding period in 2022 was critical. During late May to early July in this orchard field, considering the T-N, K, and Mg concentrations with respect to the soil pH and K and C concentrations in the apple trees, applying N at an amount between that of the untreated group and moderate fertilization was considered appropriate, as was increasing the K fertilization ratio to reduce the environmental load.
The turning point from vegetative to physiological growth occurs from early July to early September. P and Ca are important nutrients for the differentiation of flower buds and full-scale fruit enlargement. In this period, a large amount of Mg is absorbed. There were no significant differences between the P concentrations in the apple trees on July 13, July 28, August 11, and August 31 in 2021 and on July 19 and July 28 in 2022, with the average values ranging from 0.10% to 0.13% in all N fertilization groups (Table 8 and Table 9). There was also no significant difference in Ca between the N fertilization groups, which ranged from 0.98% to 1.42%. In 2021 and 2022, the P and Ca concentrations tended to increase slightly in August, compared with July, in the growing season. In the soil, it was confirmed that the trees absorbed P2O5 and Ca, and their average concentration values rapidly decreased in August of 2021 and 2022 in all N fertilization groups (Table 6 and Table 7). Mg, which is highly absorbed in this season, also showed the same pattern as Ca. As N fertilization increased during the growing season in early July and early September, the soil P2O5 concentration increased considerably, and the Ca concentration decreased; however, no significant change was observed in the concentrations of P2O5 and Ca absorbed by the apple trees. Therefore, the application of a N treatment at a level between no treatment and moderate fertilization was considered sufficient. If the soil pH is too low (e.g., lower than 6), supplying Mg through a dolomitic limestone application should be considered [65].
N absorption in the fruit enlargement stage (after September) promotes root development, restores aged photosynthetic ability, and enhances carbohydrate synthesis, helping to improve fruit quality [66]. As the amount of N fertilization increased, the K concentration in the apple trees, which helps with fruit enlargement, decreased, with a relatively low soil pH on 7 September 2022 (as shown in Table 8 and Table 9); however, there was no or only a slightly significant difference in the other growing seasons. During most of the season in September and October, soil K concentrations were lowered due to apple tree uptake, and the average values for all N fertilization groups are shown in Table 6 and Table 7. In addition, P, which affects the sugar content of the fruit, significantly increased the concentration of P2O5 in the soil, depending on the amount of N applied, but was not absorbed proportionally; thus, there was no significant difference between the P concentrations in the apple trees. However, as N fertilization increased in most seasons, soil Ca and Mg concentrations—which enable stable production through preventing physiological disorders in fruit and maintaining healthy trees—tended to decrease with decreasing pHs. It was assumed that it would be advantageous to maintain the N fertilization level in order to produce high-quality fruit through minimizing physiological disorders, according to the standard fertilization method, as the apple trees maintained Ca concentrations of 1.32% or higher when moderate amounts of fertilization were applied, as reflected in the average values for all N fertilization groups in Table 8 and Table 9.
There was no significant difference in most of the macronutrients in the apple tree leaves, depending on the amount of N applied before fruit enlargement. Therefore, the results prove that providing an amount below that of moderate N fertilization in apple orchards before fruit enlargement is both economically and environmentally advantageous. It is necessary to reproduce these models during the apple tree growing season in the same orchard and other orchards, adjusting N fertilization with respect to the estimated macronutrient values, and examining how this affects yield and quality, may demonstrate the effectiveness of the developed models.

5. Conclusions

Through selecting key band ratios derived from the UAV-based hyperspectral imagery of experimental fields treated using different N fertilization amounts in 2021 and 2022, this study developed an estimation model for the Ch and macronutrients in apple trees. The KNR model using 13 key band ratios (425/429, 682/686, 710/714, 714/718, 718/722, 750/754, 754/758, 758/762, 762/766, 894/898, 898/902, 906/911, and 963/967) was selected as the best method between a multivariate regression model (PLSR) and several machine learning regression models (RR, KNR, SVR, and GBR). The estimation potential of the T-N and Mg concentrations was low, with an R2 ≤ 0.37 in calibration and validation. The estimation performance for the other macronutrients was as follows: R2 ≥ 0.70, RMSE ≤ 1.43 μg/cm2, and RE ≤ 19.5% for Ch; R2 ≥ 0.44, RMSE ≤ 0.04%, and RE ≤ 28.2% for P; R2 ≥ 0.53, RMSE ≤ 0.23%, and RE ≤ 27.6% for K; R2 ≥ 0.85, RMSE ≤ 6.18%, and RE ≤ 13.9% for C; and R2 ≥ 0.42, RMSE ≤ 0.25%, and RE ≤ 20.0% for Ca.
This study has several limitations; for example, the T-N, Mg, P, and Ca models were found to have low linearity, as their validation R2 values did not exceed 0.5. However, this study is still considered useful, as it can serve as a standard for establishing a precise and comprehensive nutrient management system through the development of a macronutrient estimation model for apple tree orchards with an RE ≤ 28.2%. Accordingly, in this study, a decision-making method for comprehensive apple orchard nutrient management—which can be expanded to other orchards—was developed through establishing a fertilization strategy based on spectral imaging-based RS technology, which depends on the level of N fertilization and the growing season. In other words, this study does not introduce innovative topics and technologies. However, it contains new ways of putting existing technologies into practice.
Based on the results of this study, future research should aim to develop a model which minimizes the errors in regional and climatic diversity through collecting hyperspectral imagery not only of apple orchards where variable fertilization is applied by design, but also actual apple orchards. There is also a need to overcome the limitations of expensive and heavy hyperspectral image sensors through the development a multispectral image sensor that contains a bandpass filter (e.g., lens) designed according to our final verified key band ratios.

Author Contributions

Conceptualization, Y.S.K., C.S.R., and J.G.C.; methodology, Y.S.K. and C.S.R.; software, Y.S.K.; validation, C.S.R. and J.G.C.; formal analysis, K.S.P.; investigation, J.G.C. and K.S.P.; resources, J.G.C.; data curation, Y.S.K.; writing—original draft preparation, Y.S.K.; writing—review and editing, C.S.R.; visualization, Y.S.K.; supervision, Y.S.K.; project administration, Y.S.K. and J.G.C.; funding acquisition, Y.S.K. All authors have read and agreed to the published version of the manuscript.

Funding

This research was funded by the National Institute of Crop Science, Rural Development Administration (project name: development of image-based physiological diagnosis technique for apple and pear trees; project number: PJ0156572023).

Data Availability Statement

Data are contained within the article.

Acknowledgments

The authors appreciate all the staff who helped with this study at the National Institute of Horticulture & Herbal Science, Rural Development Administration, the Republic of Korea.

Conflicts of Interest

The authors declare no conflicts of interest.

References

  1. Kowalczyk, W.; Wrona, D.; Przybyłko, S. Effect of nitrogen fertilization of apple orchard on soil mineral nitrogen content, yielding of the apple trees and nutritional status of leaves and fruits. Agriculture 2022, 12, 2169. [Google Scholar] [CrossRef]
  2. Bhatla, S.C.; Lal, A.; Kathpalia, R.; Bhatla, S.C. Plant mineral nutrition. In Plant Physiology, Development and Metabolism; Springer: Berlin/Heidelberg, Germany, 2018; pp. 37–81. [Google Scholar]
  3. Sun, T.; Zhang, J.; Zhang, Q.; Li, X.; Li, M.; Yang, Y.; Zhou, J.; Wei, Q.; Zhou, B. Integrative physiological, transcriptome, and metabolome analysis reveals the effects of nitrogen sufficiency and deficiency conditions in apple leaves and roots. Environ. Exp. Bot. 2021, 192, 104633. [Google Scholar] [CrossRef]
  4. Carranca, C.; Brunetto, G.; Tagliavini, M. Nitrogen nutrition of fruit trees to reconcile productivity and environmental concerns. Plants 2018, 7, 4. [Google Scholar] [CrossRef]
  5. Neilsen, G.H.; Neilsen, D.; Toivonen, P.; Herbert, L. Annual bloom-time phosphorus fertigation affects soil phosphorus, apple tree phosphorus nutrition, yield, and fruit quality. Hortscience 2008, 43, 885–890. [Google Scholar] [CrossRef]
  6. Taylor, B.K.; Goubran, F.H. The phosphorus nutrition of the apple tree. I. Influence of rate of application of superphosphate on the performance of young trees. Aust. J. Agric. Res. 1975, 26, 843–853. [Google Scholar] [CrossRef]
  7. Zhao, D.; Oosterhuis, D.M.; Bednarz, C.W. Influence of potassium deficiency on photosynthesis, chlorophyll content, and chloroplast ultrastructure of cotton plants. Photosynthetica 2001, 39, 103–109. [Google Scholar] [CrossRef]
  8. Erner, Y.; Artzi, B.; Tagari, E.; Hamou, M. Potassium Affects Citrus Tree Performance; Volcani Center, Institute of Horticulture, Department of Fruit Trees: Tel Aviv, Israel, 2005; pp. 405–414. [Google Scholar]
  9. Pallas, B.; Da Silva, D.; Valsesia, P.; Yang, W.; Guillaume, O.; Lauri, P.E.; Vercambre, G.; Génard, M.; Costes, E. Simulation of carbon allocation and organ growth variability in apple tree by connecting architectural and source–sink models. Ann. Bot. 2016, 118, 317–330. [Google Scholar] [CrossRef] [PubMed]
  10. Génard, M.; Dauzat, J.; Franck, N.; Lescourret, F.; Moitrier, N.; Vaast, P.; Vercambre, G. Carbon allocation in fruit trees: From theory to modelling. Trees 2008, 22, 269–282. [Google Scholar] [CrossRef]
  11. Cheng, L.; Ma, F.; Ranwala, D. Nitrogen storage and its interaction with carbohydrates of young apple trees in response to nitrogen supply. Tree Physiol. 2004, 24, 91–98. [Google Scholar] [CrossRef]
  12. Noguera, M.; Aquino, A.; Ponce, J.M.; Cordeiro, A.; Silvestre, J.; Arias-Calderón, R.; Marcelo, M.E.; Jordão, P.; Andújar, J.M. Nutritional status assessment of olive crops by means of the analysis and modelling of multispectral images taken with UAVs. Biosyst. Eng. 2021, 211, 1–18. [Google Scholar] [CrossRef]
  13. Kumar, R.; Kumar, R.; Prakash, O. The Impact of Chemical Fertilizers on Our Environment and Ecosystem, Chapter 5; Chief Ed.; Uttar Pradesh: Varanasi, India, 2019; Volume 35, pp. 69–88. [Google Scholar]
  14. Gordon, T.R.; Swett, C.L.; Wingfield, M.J. Management of Fusarium diseases affecting conifers. Crop Prot. 2015, 73, 28–39. [Google Scholar] [CrossRef]
  15. Al-Busaidi, A. 5. Al-Busaidi, A. 5 fertilizer application. In Dates: Production, Processing, Food, and Medicinal Values; CRC Press: Boca Raton, FL, USA, 2012; pp. 67–80. [Google Scholar]
  16. López-Morales, J.A.; Martínez, J.A.; Skarmeta, A.F. Digital transformation of agriculture through the use of an interoperable platform. Sensors 2020, 20, 1153. [Google Scholar] [CrossRef] [PubMed]
  17. Abbasi, R.; Martinez, P.; Ahmad, R. The digitization of agricultural industry—A systematic literature review on agriculture 4.0. Smart Agric. Technol. 2022, 2, 100042. [Google Scholar] [CrossRef]
  18. Hoogenboom, G. Contribution of agrometeorology to the simulation of crop production and its applications. Agric. For. Meteorol. 2000, 103, 137–157. [Google Scholar] [CrossRef]
  19. Rutkowski, K.; Łysiak, G.P. Effect of nitrogen fertilization on tree growth and nutrient content in soil and cherry leaves (Prunus cerasus L.). Agriculture 2023, 13, 578. [Google Scholar] [CrossRef]
  20. Paul, S.; Poliyapram, V.; Imamoglu, N.; Uto, K.; Nakamura, R.; Kumar, D.N. Canopy averaged chlorophyll content prediction of pear trees using convolutional autoencoder on hyperspectral data. IEEE J. Sel. Top. Appl. Earth Obs. Remote Sens. 2020, 13, 1426–1437. [Google Scholar] [CrossRef]
  21. Mulla, D.J. Twenty five years of remote sensing in precision agriculture: Key advances and remaining knowledge gaps. Biosyst. Eng. 2013, 114, 358–371. [Google Scholar] [CrossRef]
  22. Vescovo, L.; Wohlfahrt, G.; Balzarolo, M.; Pilloni, S.; Sottocornola, M.; Rodeghiero, M.; Gianelle, D. New spectral vegetation indices based on the near-infrared shoulder wavelengths for remote detection of grassland phytomass. Int. J. Remote Sens. 2012, 33, 2178–2195. [Google Scholar] [CrossRef] [PubMed]
  23. Colica, E. Geophysics and Geomatics Methods for Coastal Monitoring and Hazard Evaluation. Ph.D. Thesis, L-Università ta’ Malta, Msida, Malta, 2022. [Google Scholar]
  24. Wang, J.; Zhang, C.; Shi, Y.; Long, M.; Islam, F.; Yang, C.; Yang, S.; He, Y.; Zhou, W. Evaluation of quinclorac toxicity and alleviation by salicylic acid in rice seedlings using ground-based visible/near-infrared hyperspectral imaging. Plant Methods 2020, 16, 30. [Google Scholar] [CrossRef] [PubMed]
  25. Kang, Y.S.; Ryu, C.S.; Kim, S.H.; Jun, S.R.; Jang, S.H.; Park, J.W.; Song, H.Y. Yield prediction of Chinese cabbage (Brassicaceae) using broadband multispectral imagery mounted unmanned aerial system in the air and narrowband hyperspectral imagery on the ground. Korean Soc. Agric. Mach. 2018, 43, 138–147. [Google Scholar]
  26. Pandey, P.; Ge, Y.; Stoerger, V.; Schnable, J.C. High throughput in vivo analysis of plant leaf chemical properties using hyperspectral imaging. Front. Plant Sci. 2017, 8, 1348. [Google Scholar] [CrossRef] [PubMed]
  27. Cao, C.; Wang, T.; Gao, M.; Li, Y.; Li, D.; Zhang, H. Hyperspectral inversion of nitrogen content in maize leaves based on different dimensionality reduction algorithms. Comput. Electron. Agric. 2021, 190, 106461. [Google Scholar] [CrossRef]
  28. Park, K.; Hong, Y.K.; Kim, G.H.; Lee, J. Classification of apple leaf conditions in hyper-spectral images for diagnosis of Marssonina blotch using mRMR and deep neural network. Comput. Electron. Agric. 2018, 148, 179–187. [Google Scholar] [CrossRef]
  29. Han, L.; Yang, G.; Dai, H.; Xu, B.; Yang, H.; Feng, H.; Li, Z.; Yang, X. Modeling maize above-ground biomass based on machine learning approaches using UAV remote-sensing data. Plant Methods 2019, 15, 10. [Google Scholar] [CrossRef]
  30. Li, M.; Zhu, X.; Li, W.; Tang, X.; Yu, X.; Jiang, Y. Retrieval of nitrogen content in apple canopy based on unmanned aerial vehicle hyperspectral images using a modified correlation coefficient method. Sustainability 2022, 14, 1992. [Google Scholar] [CrossRef]
  31. Kang, Y.S.; Park, K.S.; Kim, E.R.; Jeong, J.C.; Ryu, C.S. Estimation of the total nonstructural carbohydrate concentration in apple trees using hyperspectral imaging. Horticulturae 2023, 9, 967. [Google Scholar] [CrossRef]
  32. Liu, Z.; Guo, P.; Liu, H.; Fan, P.; Zeng, P.; Liu, X.; Feng, C.; Wang, W.; Yang, F. Gradient boosting estimation of the leaf area index of apple orchards in uav remote sensing. Remote Sens. 2021, 13, 3263. [Google Scholar] [CrossRef]
  33. Azadnia, R.; Rajabipour, A.; Jamshidi, B.; Omid, M. New approach for rapid estimation of leaf nitrogen, phosphorus, and potassium contents in apple-trees using Vis/NIR spectroscopy based on wavelength selection coupled with machine learning. Comput. Electron. Agric. 2023, 207, 107746. [Google Scholar] [CrossRef]
  34. Zhang, Y.; Chang, Q.; Chen, Y.; Liu, Y.; Jiang, D.; Zhang, Z. Hyperspectral estimation of chlorophyll content in apple tree leaf based on feature band selection and the CatBoost model. Agronomy 2023, 13, 2075. [Google Scholar] [CrossRef]
  35. Costa, L.; Kunwar, S.; Ampatzidis, Y.; Albrecht, U. Determining leaf nutrient concentrations in citrus trees using UAV imagery and machine learning. Precis. Agric. 2022, 23, 854–875. [Google Scholar] [CrossRef]
  36. Acosta, M.; Rodríguez-Carretero, I.; Blasco, J.; de Paz, J.M.; Quiñones, A. Nondestructive appraisal of macro- and micronutrients in persimmon leaves using Vis/NIR hyperspectral imaging. Agriculture 2023, 13, 916. [Google Scholar] [CrossRef]
  37. Jang, S.; Han, J.; Cho, J.; Jung, J.; Lee, S.; Lee, D.; Kim, J. Estimation of Apple Leaf Nitrogen Concentration Using Hyperspectral Imaging-Based Wavelength Selection and Machine Learning. Horticulturae 2023, 10, 35. [Google Scholar] [CrossRef]
  38. Kang, Y.S.; Jang, S.H.; Park, J.W.; Song, H.Y.; Ryu, C.S.; Jun, S.R.; Kim, S.H. Yield prediction and validation of onion (Allium cepa L.) using key variables in narrowband hyperspectral imagery and effective accumulated temperature. Comput. Electron. Agric. 2020, 178, 105667. [Google Scholar] [CrossRef]
  39. Wold, S.; Sjöström, M.; Eriksson, L. PLS-regression: A basic tool of chemometrics. Chemom. Intell. Lab. Syst. 2001, 58, 109–130. [Google Scholar] [CrossRef]
  40. Hoerl, A.E.; Kennard, R.W. Ridge regression: Applications to nonorthogonal problems. Technometrics 1970, 12, 69–82. [Google Scholar] [CrossRef]
  41. Burba, F.; Ferraty, F.; Vieu, P. k -Nearest Neighbour method in functional nonparametric regression. J. Nonparametric Stat. 2009, 21, 453–469. [Google Scholar] [CrossRef]
  42. Ge, H.; Ma, F.; Li, Z.; Tan, Z.; Du, C. Improved accuracy of phenological detection in rice breeding by using ensemble models of machine learning based on UAV-RGB imagery. Remote Sens. 2021, 13, 2678. [Google Scholar] [CrossRef]
  43. Jakkula, V. Tutorial on support vector machine (svm). Sch. EECS Wash. State Univ. 2006, 37, 3. [Google Scholar]
  44. Huang, C.L.; Wang, C.J. A GA-based feature selection and parameters optimization for support vector machines. Expert Syst. Appl. 2006, 31, 231–240. [Google Scholar] [CrossRef]
  45. Prodhan, F.A.; Zhang, J.; Yao, F.; Shi, L.; Pangali Sharma, T.P.; Zhang, D.; Cao, D.; Zheng, M.; Ahmed, N.; Mohana, H.P. Deep learning for monitoring agricultural drought in South Asia using remote sensing data. Remote Sens. 2021, 13, 1715. [Google Scholar] [CrossRef]
  46. Arumugam, P.; Chemura, A.; Schauberger, B.; Gornott, C. Remote sensing based yield estimation of Rice (Oryza sativa L.) using gradient boosted regression in India. Remote Sens. 2021, 13, 2379. [Google Scholar] [CrossRef]
  47. Kannangara, K.K.P.M.; Zhou, W.; Ding, Z.; Hong, Z. Investigation of feature contribution to shield tunneling-induced settlement using Shapley additive explanations method. J. Rock Mech. Geotech. Eng. 2022, 14, 1052–1063. [Google Scholar] [CrossRef]
  48. Marcílio, W.E.; Eler, D.M. From explanations to feature selection: Assessing SHAP values as feature selection mechanism. In Proceedings of the 33rd SIBGRAPI Conference on Graphics, Patterns and Images (SIBGRAPI), Porto de Galinhas, Brazil, 7−10 November 2020. [Google Scholar]
  49. Zhang, Y.; Gao, J.; Cen, H.; Lu, Y.; Yu, X.; He, Y.; Pieters, J.G. Automated spectral feature extraction from hyperspectral images to differentiate weedy rice and barnyard grass from a rice crop. Comput. Electron. Agric. 2019, 159, 42–49. [Google Scholar] [CrossRef]
  50. Sánchez, E.E.; Giayetto, A.; Cichón, L.; Fernández, D.; Aruani, M.C.; Curetti, M. Cover crops influence soil properties and tree performance in an organic apple (Malus domestica Borkh) orchard in northern Patagonia. Plant Soil 2007, 292, 193–203. [Google Scholar] [CrossRef]
  51. Laurén, A.; Lappalainen, M.; Kieloaho, A.J.; Karhu, K.; Palviainen, M. Temperature sensitivity patterns of carbon and nitrogen processes in decomposition of boreal organic soils—Quantification in different compounds and molecule sizes based on a multifactorial experiment. PLoS ONE 2019, 14, e0223446. [Google Scholar] [CrossRef] [PubMed]
  52. Lutz, J.A., Jr.; Genter, C.F.; Hawkins, G.W. Effect of soil pH on element concentration and uptake by maize: I. P, K, Mg, and Na 1. Agron. J. 1972, 64, 581–583. [Google Scholar] [CrossRef]
  53. Agboola, A.A.; Corey, R.B. The relationship between soil pH, organic matter, available phosphorus, exchangeable potassium, calcium, magnesium, and nine elements in the maize tissue. Soil Sci. 1973, 115, 367–375. [Google Scholar] [CrossRef]
  54. Zhao, J.; Dong, Y.; Xie, X.; Li, X.; Zhang, X.; Shen, X. Effect of annual variation in soil pH on available soil nutrients in pear orchards. Acta Ecol. Sin. 2001, 31, 212–216. [Google Scholar] [CrossRef]
  55. Weng, X.; Li, H.; Ren, C.; Zhou, Y.; Zhu, W.; Zhang, S.; Liu, L. Calcium regulates growth and nutrient absorption in poplar seedlings. Front. Plant Sci. 2022, 13, 887098. [Google Scholar] [CrossRef]
  56. Haboudane, D.; Tremblay, N.; Miller, J.R.; Vigneault, P. Remote estimation of crop chlorophyll content using spectral indices derived from hyperspectral data. IEEE Trans. Geosci. Remote Sens. 2008, 46, 423–437. [Google Scholar] [CrossRef]
  57. Amirruddin, A.D.; Muharam, F.M.; Ismail, M.H.; Tan, N.P.; Ismail, M.F. Hyperspectral spectroscopy and imbalance data approaches for classification of oil palm’s macronutrients observed from frond 9 and 17. Comput. Electron. Agric. 2020, 178, 105768. [Google Scholar] [CrossRef]
  58. Mohd Asaari, M.S.M.; Mishra, P.; Mertens, S.; Dhondt, S.; Inzé, D.; Wuyts, N.; Scheunders, P. Close-range hyperspectral image analysis for the early detection of stress responses in individual plants in a high-throughput phenotyping platform. ISPRS J. Photogramm. Remote Sens. 2018, 138, 121–138. [Google Scholar] [CrossRef]
  59. Khoi, C.M. Management of Chaetoceros Calcitrans Growth in Hypersaline Artemia Franciscana Ponds by Optimizing Nitrogen and Phosphorus Availability. Ph.D. Thesis, Katholieke Universiteit Leuven, Leuven, Belgium, 2006. [Google Scholar]
  60. Chang-Hua, J.U.; Yong-Chao, T.I.A.N.; Xia, Y.A.O.; Wei-Xing, C.A.O.; Yan, Z.H.U.; Hannaway, D. Estimating leaf chlorophyll content using red edge parameters. Pedosphere 2010, 20, 633–644. [Google Scholar]
  61. Ennab, H. Effect of organic manures, biofertilizers and NPK on vegetative growth, yield, fruit quality and soil fertility of eureka lemon trees (Citrus limon (L.) Burm). J. Soil Sci. Agric. Eng. 2016, 7, 767–774. [Google Scholar] [CrossRef]
  62. Ullah, H.; Santiago-Arenas, R.; Ferdous, Z.; Attia, A.; Datta, A. Improving water use efficiency, nitrogen use efficiency, and radiation use efficiency in field crops under drought stress: A review. Adv. Agron. 2019, 156, 109–157. [Google Scholar]
  63. Aminifard, M.H.; Aroiee, H.; Nemati, H.; Azizi, M.; Khayyat, M. Effect of nitrogen fertilizer on vegetative and reproductive growth of pepper plants under field conditions. J. Plant Nutr. 2012, 35, 235–242. [Google Scholar] [CrossRef]
  64. Hawkesford, M.; Horst, W.; Kichey, T.; Lambers, H.; Schjoerring, J.; Møller, I.S.; White, P. Functions of Macronutrients. In Marschner’s Mineral Nutrition of Higher Plants; Academic Press: Cambridge, MA, USA, 2021; pp. 135–189. [Google Scholar]
  65. Vashisth, T.; Kadyampakeni, D. Diagnosis and management of nutrient constraints in citrus. In Fruit Crops; Elsevier: New Dehli, India, 2020; pp. 723–737. [Google Scholar]
  66. Asibi, A.E.; Chai, Q.; Coulter, A. Mechanisms of nitrogen use in maize. Agronomy 2019, 9, 775. [Google Scholar] [CrossRef]
Figure 1. Experimental field containing the excessive (blue), moderate (yellow), and untreated (red) nitrogen fertilization groups.
Drones 08 00369 g001
Figure 2. Variations in (a) average temperature and (b) accumulated precipitation over different months in the years 2021 and 2022.
Drones 08 00369 g002
Figure 3. (a) Sample apple tree arrangement (green color). Hyperspectral image processing procedure: (b) acquisition of raw RGB image, conversion to the (c) normalized difference vegetation index, and (d) the extraction of individual canopies.
Drones 08 00369 g003
Figure 4. Flowchart for estimating the chlorophyll and macronutrients in apple tree leaves using hyperspectral imagery.
Drones 08 00369 g004
Figure 5. Reflectance curves of various band ratios for the apple tree canopy, obtained using hyperspectral imagery from (a) 2021 and (b) 2022.
Drones 08 00369 g005
Figure 6. Linear relationships between measured values, using chemical analysis, and estimated values, using the k-nearest neighbors model with key band ratios: (a) chlorophyll; (b) total nitrogen; (c) phosphorus; (d) potassium; (e) carbon; (f) calcium; and (g) magnesium.
Drones 08 00369 g006aDrones 08 00369 g006b
Figure 7. Shapley additive explanation values depending on key band ratios used to estimate (a) chlorophyll and the macronutrients (b) total nitrogen, (c) phosphorus, (d) potassium, (e) carbon, (f) calcium, and (g) magnesium using the k-nearest neighbors model, highlighting the band ratio with the highest ranking (red color).
Drones 08 00369 g007aDrones 08 00369 g007b
Table 1. Chlorophyll and macronutrient data used for model development.
20212022All Years
n 1Mean ± S.D. 2nMean ± S.D.nMean ± S.D.
Ch (μg/cm2)1475.03 ± 1.121829.22 ± 1.853297.35 ± 2.61
T-N (%)1752.30 ± 1.741822.49 ± 0.463572.40 ± 0.62
P (%)0.12 ± 0.040.14 ± 0.050.13 ± 0.05
K (%)0.67 ± 0.161.02 ± 0.370.85 ± 0.34
C (%)29.8 ± 4.0658.8 ± 9.0244.6 ± 16.1
Ca (%)1.17 ± 0.341.32 ± 0.301.25 ± 0.33
Mg (%)0.36 ± 0.080.32 ± 0.100.39 ± 0.09
1 Number of samples. 2 Standard deviation.
Table 2. Coefficient of determination (R2) for models using full-band ratios in individual years and all years.
20212022All Years
CalibrationValidationCalibrationValidationCalibrationValidation
ChPLSR0.510.200.360.110.720.46
RR0.440.130.450.130.780.46
KNR0.390.060.630.350.820.72
SVR0.400.320.420.350.750.73
GBR0.450.120.990.210.990.52
T-NPLSR0.10N/A0.390.120.170.02
RR0.09N/A0.420.180.300.06
KNR0.09N/A0.370.210.18N/A
SVR0.230.100.470.330.280.18
GBR0.01N/A0.960.160.05N/A
PPLSR0.470.040.78N/A0.16N/A
RR0.670.040.87N/A0.24N/A
KNR0.470.300.750.640.650.48
SVRN/AN/AN/AN/AN/AN/A
GBR0.580.030.99N/A0.56N/A
KPLSR0.44N/A0.810.300.670.16
RR0.400.020.860.010.610.12
KNR0.230.020.720.610.700.58
SVR0.370.220.700.620.700.62
GBRN/AN/A0.12N/A0.980.05
CPLSR0.80N/A0.960.180.760.39
RR0.17N/A0.980.060.800.27
KNR0.490.230.990.950.990.90
SVR0.230.150.420.390.630.61
GBR0.09N/A0.99N/A0.990.39
CaPLSR0.52N/A0.56N/A0.59N/A
RR0.75N/A0.61N/A0.67N/A
KNR0.770.540.570.430.770.50
SVR0.660.460.540.430.600.49
GBR0.99N/A0.11N/A0.28N/A
MgPLSR0.43N/A0.15N/A0.49N/A
RR0.42N/A0.52N/A0.570.06
KNR0.480.270.340.150.470.24
SVR0.390.240.380.260.410.27
GBR0.99N/A0.09N/A0.82N/A
Bold: results with R2 ≥ 0.5 in both calibration and validation models.
Table 3. Coefficient of determination (R2) for models depending on the number of band ratios used from all years.
n 1ChNPKCCaMg
CalValCalValCalValCalValCalValCalValCalVal
KNR100.820.730.190.010.660.440.730.530.970.880.630.430.370.21
90.820.730.220.040.650.390.750.480.960.870.660.410.430.19
80.820.730.200.030.570.360.750.450.960.850.660.420.430.18
70.820.720.240.030.550.320.750.440.890.830.600.390.430.19
60.810.710.200.010.490.280.750.450.950.840.580.360.320.17
50.8020.700.18N/A0.400.260.840.450.920.830.560.360.410.16
40.800.670.17N/A0.430.230.750.450.910.820.520.340.370.15
30.790.650.17N/A0.470.190.720.390.810.660.450.290.310.11
20.530.330.210.010.340.190.380.220.820.600.390.240.260.08
SVR100.710.700.170.14N/AN/A0.420.410.530.520.310.290.230.19
90.700.700.170.13N/AN/A0.400.380.490.480.300.270.230.20
80.690.680.130.11N/AN/A0.390.370.470.470.260.240.240.19
70.690.680.140.12N/AN/A0.390.380.460.450.240.220.250.23
60.680.670.130.11N/AN/A0.290.280.430.410.140.130.240.21
50.670.660.110.10N/AN/A0.280.270.410.400.130.120.060.05
40.630.620.100.09N/AN/A0.240.230.400.400.080.070.050.04
30.450.440.100.09N/AN/A0.230.220.370.360.070.070.040.03
20.440.430.050.04N/AN/A0.020.010.320.320.060.060.010.01
1 Number of band ratios. 2 Bold: number and R2 of the selected key band ratio.
Table 4. Selected key band ratios for estimating chlorophyll and macronutrients in all years.
n 1ChNPKCCaMg
KNR1710/714706/710425/429682/686706/710710/714710/714
2718/722710/714682/686706/710710/714718/722714/718
3754/758714/718710/714710/714718/722750/754718/722
4758/762718/722718/722718/722750/754754/758750/754
5762/766750/754750/754750/754754/758758/762754/758
6 754/758754/758754/758758/762762/766758/762
7 758/762758/762758/762762/766894/898762/766
8 762/766762/766762/766894/898898/902894/898
9 894/898898/902898/902 898/902
10 963/967963/967 906/911
n_neighbors5944249
1 Number of band ratios.
Table 5. Performance estimation of k-nearest neighbors regression model using key band ratios in all years.
NutrientVariablesAlgorithmPerformance
ChCalibrationR20.81
RMSE (μg/cm2)1.15
RE (%)15.6
ValidationR20.70
RMSE (μg/cm2)1.43
RE (%)19.5
NCalibrationR20.22
RMSE (%)0.55
RE (%)22.8
ValidationR20.04
RMSE (%)0.61
RE (%)25.3
PCalibrationR20.66
RMSE (%)0.03
RE (%)21.8
ValidationR20.44
RMSE (%)0.04
RE (%)28.2
KCalibrationR20.73
RMSE (%)0.18
RE (%)20.9
ValidationR20.53
RMSE (%)0.23
RE (%)27.6
CCalibrationR20.96
RMSE (%)3.31
RE (%)7.42
ValidationR20.85
RMSE (%)6.18
RE (%)13.9
CaCalibrationR20.66
RMSE (%)0.19
RE (%)15.2
ValidationR20.42
RMSE (%)0.25
RE (%)20.0
MgCalibrationR20.37
RMSE (%)0.07
RE (%)18.8
ValidationR20.21
RMSE (%)0.08
RE (%)21.0
Table 6. Two-sample t-test of pH and chemical properties in apple orchard soil depending on the growing season and fertilization provided in 2021.
20219 June22 June13 July28 July11 August31 August15 September30 September15 October
pH (1:5)E 1a 6.43   ±  
0.15 E 2
a 6.08   ±  
0.13 D
a 5.29   ±  
0.16 B
a 5.01   ±  
0.17 A
a 5.64   ±  
0.31 C
a 5.06   ±  
0.25 AB
a 5.11   ±  
0.15 AB
a 5.49   ±  
0.14 C
a 5.26   ±  
0.18 B
Mb 6.98   ±  
0.11 D
b 6.92   ±  
0.11 D
b 6.68   ±  
0.31 BC
b 6.58   ±  
0.09 B
b 6.43   ±  
0.42 AB
b 6.88   ±  
0.67 BCD
b 6.18   ±  
0.14 A
b 6.73   ±  
0.08 C
b 6.40   ±  
0.12 BC
Uc 7.25   ±  
0.10 BC
c 7.26   ±  
0.13 BC
c 7.27   ±  
0.10 BC
c 7.34   ±  
0.13 CD
c 6.98   ±  
0.47 AB
b 6.93   ±  
0.34 A
c 7.38   ±  
0.06 D
c 7.57   ±  
0.15 E
c 7.45   ±  
0.17 BCDE
All 6.89   ±  
0.37 D
6.75   ±  
0.52 CD
6.41   ±  
0.87 BD
6.31   ±  
1.00 AB
6.35   ±  
0.68 AB
6.29   ±  
0.99 AB
6.22   ±  
0.95 AB
6.60   ±  
0.88 BD
6.37   ±  
0.93 BC
OM (%)Ea 2.85   ±  
0.21 AB
a2.66   ±  
0.21 A
b2.85   ±  
0.52 ABC
b3.19   ±  
0.13 C
c2.92   ±  
0.17 B
b2.92   ±  
0.15 B
a2.69   ±  
0.30 AB
a2.84   ±  
0.38 AB
a3.05   ±  
0.78 ABC
Ma 2.85   ±  
0.14 C
a2.61   ±  
0.18 B
a2.38   ±  
0.22 A
a2.78   ±  
0.26 BC
b2.69   ±  
0.12 BC
a2.72   ±  
0.17 BC
a2.81   ±  
0.17 C
a2.73   ±  
0.16 BC
a2.86   ±  
0.20 C
Ua2.90   ±  
0.37 C
a2.71 0.23 BCab2.58   ±  
0.14 B
ab3.04   ±  
0.30 CD
a2.39   ±  
0.21 A
ab2.82   ±  
0.30 CD
a2.97   ±  
0.62 BC
a2.86   ±  
0.21 CD
a3.05   ±  
0.25 CD
All 2.87   ±  
0.25 DE
2.66   ±  
0.21 AB
2.60   ±  
0.38 A
3.00   ±  
0.29 E
2.67   ±  
0.28 ABC
2.82   ±  
0.22 D
2.82   ±  
0.41 BDE
2.81   ±  
0.27 CD
2.99   ±  
0.48 DE
T-N (%)Ea 0.09   ±  
0.01 C
b0.12   ±  
0.01 D
b0.05   ±  
0.01 A
b0.06   ±  
0.01 AB
b0.05   ±  
0.03 A
b0.16   ±  
0.02 F
c0.13   ±  
0.01 E
b0.07   ±  
0.04 ABC
b0.08   ±  
0.04 BC
Ma 0.08   ±  
0.01 E
a0.08   ±  
0.01 E
a0.02   ±  
0.01 A
a0.03   ±  
0.02 AB
a0.02   ±  
0.02 A
a0.04   ±  
0.01 BC
b0.06   ±  
0.01 D
b0.07   ±  
0.03 CDE
b0.07   ±  
0.03 CDE
Ua 0.08   ±  
0.02 C
a0.08   ±  
0.02 C
a0.01   ±  
0.01 A
a0.02   ±  
0.02 A
a0.01   ±  
0.01 A
a0.04   ±  
0.01 B
a0.04   ±  
0.01 B
a0.04   ±  
0.01 B
a0.04   ±  
0.01 B
All 0.08   ±  
0.01 C
0.09   ±  
0.02 D
0.03   ±  
0.02 A
0.04   ±  
0.02 A
0.03   ±  
0.03 A
0.08   ±  
0.06 CD
0.08   ±  
0.04 CD
0.06   ±  
0.03 B
0.06   ±  
0.03 B
P2O5 (mg/kg)Ea 37.2   ±  
4.06 B
b25.5   ±  
0.64 A
b88.3   ±  
5.43 E
c76.9   ±  
2.98 D
b80.1   ±  
5.41 D
c35.1   ±  
5.46 B
c39.9   ±  
10.1 BC
c45.0   ±  
7.39 C
c45.5   ±  
4.93 C
Mb 41.7   ±  
4.72 E
b28.6   ±  
5.08 D
a71.7   ±  
4.38 H
a61.8   ±  
2.72 G
a58.5   ±  
3.26 F
a7.97   ±  
1.36 A
b13.8   ±  
5.15 BC
b15.8   ±  
1.32 C
b11.7   ±  
2.32 B
Ua 37.2   ±  
3.72 C
a19.8   ±  
7.78 A
a71.8   ±  
6.70 E
b66.9   ±  
5.78 E
a59.7   ±  
6.84 D
b13.8   ±  
1.04 B
a9.09   ±  
1.59 B
a13.0   ±  
3.08 B
a5.31   ±  
0.76 AB
All 38.7   ±  
4.58 C
24.6   ±  
6.37 B
77.3   ±  
9.58 E
68.5   ±  
7.52 D
66.1   ±  
11.3 D
19.0   ±  
12.3 A
20.9   ±  
15.2 AB
24.6   ±  
15.4 AB
20.8   ±  
18.2 AB
K (cmol/kg)Ea 0.22   ±  
0.03 G
a0.19   ±  
0.02 F
b0.24   ±  
0.03 G
a0.16   ±  
0.01 DE
a0.17   ±  
0.01 E
a0.13   ±  
0.03 BC
a0.09   ±  
0.02 A
a0.10   ±  
0.03 AB
a0.15   ±  
0.02 CD
Ma 0.21   ±  
0.03 E
a0.19   ±  
0.03 DE
a0.21   ±  
0.03 E
ab0.18   ±  
0.03 DE
a0.19   ±  
0.07 CDE
a0.12   ±  
0.02 A
b0.14   ±  
0.03 AB
b0.15   ±  
0.01 BC
b0.18   ±  
0.03 D
Ua 0.20   ±  
0.02 C
a0.20   ±  
0.04 BC
a0.20   ±  
0.03 BC
b0.20   ±  
0.04 BC
b0.25   ±  
0.03 D
b0.17   ±  
0.02 B
b0.14   ±  
0.02 A
b0.15   ±  
0.03 A
a0.14   ±  
0.01 A
All 0.21   ±  
0.03 E
0.20   ±  
0.03 DE
0.21   ±  
0.03 E
0.18   ±  
0.03 D
0.20   ±  
0.05 DE
0.14   ±  
0.03 BC
0.12   ±  
0.03 A
0.13   ±  
0.03 AB
0.16   ±  
0.02 C
Ca (cmol/kg)Ea 6.01   ±  
0.26 D
a6.59   ±  
0.49 E
a5.66   ±  
0.49 CD
a5.23   ±  
0.56 C
a4.71   ±  
1.54 BC
a4.00   ±  
0.13 B
a4.84   ±  
1.48 BC
a6.01   ±  
0.35 D
a3.50   ±  
0.22 A
Mb 6.83   ±  
0.32 C
b7.19   ±  
0.13 D
b7.86   ±  
0.64 E
b6.80   ±  
0.43 C
ab5.84   ±  
1.94 BCD
b7.79   ±  
0.92 DE
a3.98   ±  
0.66 A
a5.04   ±  
1.42 AB
b6.39   ±  
0.34 C
Ub 7.17   ±  
0.47 BC
c8.46   ±  
1.11 DE
b8.34   ±  
0.76 E
c8.18   ±  
0.56 E
b6.36   ±  
0.67 A
b7.63   ±  
0.47 CD
b7.90   ±  
1.12 CDE
b7.27   ±  
0.35 BC
c7.13   ±  
0.54 AB
All 6.67   ±  
0.61 C
7.41   ±  
1.04 E
7.29   ±  
1.34 DE
6.74   ±  
1.33 BCD
5.64   ±  
1.59 A
6.47   ±  
1.88 AC
5.58   ±  
2.03 A
6.10   ±  
1.25 AB
5.67   ±  
1.64 A
Mg (cmol/kg)Ea 2.27   ±  
0.12 G
a1.85   ±  
0.09 F
a1.28   ±  
0.13 DE
a1.34   ±  
0.10 E
a0.97   ±  
0.42 C
a0.55   ±  
0.03 A
a0.60   ±  
0.05 B
a0.66   ±  
0.12 BC
a0.61   ±  
0.09 AB
Mb 2.62   ±  
0.13 F
b2.45   ±  
0.14 E
b2.27   ±  
0.16 D
b2.02   ±  
0.09 BC
a1.39   ±  
0.91 AB
b1.99   ±  
0.48 BCD
b1.53   ±  
0.24 A
b1.80   ±  
0.23 B
b1.79   ±  
0.20 AB
Ub 2.64   ±  
0.12 B
c2.69   ±  
0.24 BC
c2.70   ±  
0.07 B
c2.88   ±  
0.21 C
b2.35   ±  
0.63 AB
b2.05   ±  
0.24 A
c2.23   ±  
0.11 A
c2.61   ±  
0.13 B
c2.19   ±  
0.31 A
All 2.51   ±  
0.12 C
2.33   ±  
0.40 B
2.08   ±  
0.61 B
2.08   ±  
0.66 B
1.57   ±  
0.88 A
1.53   ±  
0.77 A
1.45   ±  
0.69 A
1.69   ±  
0.83 A
1.53   ±  
0.71 A
1 E: excessive fertilization; M: moderate fertilization; U: untreated; All: averaged E, M, and U. 2 Two-sample t-test at significance level (p-value < 0.05) with mean ± standard deviation; uppercase letters indicate significant differences between dates, and lowercase letters indicate significant differences between different nitrogen fertilization regimes.
Table 7. Two-sample t-test of pH and chemical properties in apple orchard soil depending on the growing season and fertilization provided in 2022.
202223 May3 June17 June4 July19 July28 July16 August7 September21 September
pH (1:5)E 1a 5.74   ±  
0.23 E 2
a 5.13   ±  
0.08 B
a 5.68   ±  
0.05 E
a 4.93   ±  
0.12 A
a 5.09   ±  
0.21 AB
a 5.00   ±  
0.15 A
a 5.30   ±  
0.10 C
a 5.40   ±  
0.09 D
a 6.98   ±  
0.18 F
Mb 6.73   ±  
0.24 CD
b 6.57   ±  
0.30 C
b 6.20   ±  
0.53 BC
b 5.53   ±  
0.13 A
b 5.73   ±  
0.10 A
b 5.56   ±  
0.28 A
b 5.96   ±  
0.15 B
b 6.01   ±  
0.35 B
a 6.96   ±  
0.10 D
Ub 6.55   ±  
0.18 A
b 6.83   ±  
0.53 ABC
c 7.18   ±  
0.11 C
c 7.01   ±  
0.09 C
c 6.66   ±  
0.22 AB
c 6.95   ±  
0.04 BC
c 6.53   ±  
0.35 AB
c 6.81   ±  
0.16 C
b 7.53   ±  
0.45 D
All 6.34   ±  
0.49 B
6.18   ±  
0.83 AB
6.35   ±  
0.70 B
5.82   ±  
0.90 A
5.82   ±  
0.68 A
5.83   ±  
0.85 A
5.93   ±  
0.56 A
6.08   ±  
0.63 AB
7.16   ±  
0.38 C
OM (%)Eb 3.23   ±  
0.23 C
a2.72   ±  
0.16 A
c2.92   ±  
0.16 B
b2.72   ±  
0.12 A
b3.03   ±  
0.21 ABC
a3.14   ±  
0.15 C
b3.18   ±  
0.10 C
a2.81   ±  
0.09 AB
b2.82   ±  
0.18 AB
Ma2.67   ±  
0.09 B
a2.74   ±  
0.09 BC
a2.51   ±  
0.18 AB
a2.54   ±  
0.13 A
b2.71   ±  
0.10 BCD
a2.94   ±  
0.28 CD
ab2.94   ±  
0.15 ABCD
a2.84   ±  
0.35 D
b2.88   ±  
0.10 BCD
Ua2.62   ±  
0.35 ABC
a2.64   ±  
0.15 BC
b2.75   ±  
0.11 C
ab2.60   ±  
0.09 B
a2.39   ±  
0.22 AB
a3.15   ±  
0.04 D
a2.93   ±  
0.35 CD
a2.90   ±  
0.16 BCD
a2.42   ±  
0.45 A
All2.84   ±  
0.37 BDE
2.70   ±  
0.14 AB
2.73   ±  
0.22 AB
2.62   ±  
0.16 A
2.71   ±  
0.39 ABC
3.07   ±  
0.38 F
3.02   ±  
0.34 DF
2.85   ±  
0.11 CE
2.70   ±  
0.36 AB
T-N (%)Ec0.10   ±  
0.01 C
c0.12   ±  
0.04 CD
c0.10   ±  
0.02 BC
c0.18   ±  
0.02 E
b0.15   ±  
0.02 D
b0.47   ±  
0.11 F
b0.09   ±  
0.01 B
ab0.07   ±  
0.01 A
b0.43   ±  
0.21 F
Ma 0.05   ±  
0.01 A
b0.05   ±  
0.01 AB
b0.04   ±  
0.01 A
b0.08   ±  
0.01 C
a0.12   ±  
0.03 D
ab0.28   ±  
0.27 D
ab0.07   ±  
0.03 AC
a0.06   ±  
0.01 BC
ab0.24   ±  
0.51 ABCD
Ub 0.06   ±  
0.01 B
a0.03   ±  
0.01 A
a0.02   ±  
0.01 A
a0.06   ±  
0.01 B
a0.09   ±  
0.01 D
a0.14   ±  
0.03 D
a0.06   ±  
0.02 B
b0.08   ±  
0.01 C
a0.13   ±  
0.08 CD
All 0.07   ±  
0.03 AB
0.07   ±  
0.04 AB
0.05   ±  
0.04 A
0.10   ±  
0.06 C
0.12   ±  
0.03 C
0.30   ±  
0.21 D
0.07   ±  
0.02 B
0.07   ±  
0.01 B
0.27   ±  
0.34 D
P2O5 (mg/kg)Eb 144   ±  
42.9 E
b92.6   ±  
36.7 D
b16.4   ±  
1.55 A
c39.2   ±  
11.5 C
c110   ±  
36.0 DE
a77.7   ±  
30.4 D
b34.7   ±  
6.15 C
b25.0   ±  
7.01 B
c477   ±  
328 F
Ma 72.6   ±  
17.8 E
a38.9   ±  
28.8 BE
b16.1   ±  
6.11 BC
b18.6   ±  
2.17 B
b49.7   ±  
9.61 DE
a71.7   ±  
7.53 E
ab27.4   ±  
14.9 BD
a14.4   ±  
0.33 AB
a9.40   ±  
10.4 AC
Ua 85.0   ±  
30.6 D
a34.8   ±  
7.26 C
a8.99   ±  
0.71 A
a12.3   ±  
2.27 ABC
a69.1   ±  
8.93 D
b231   ±  
108 E
a19.5   ±  
2.14 B
a14.6   ±  
1.00 B
b128   ±  
139 DE
All 101   ±  
44.4 E
56.6   ±  
38.8 D
13.8   ±  
4.96 A
23.4   ±  
14.5 BC
76.3   ±  
33.3 D
127   ±  
97.6 E
27.2   ±  
11.0 C
18.0   ±  
6.41 B
205   ±  
282 E
K (cmol/kg)Eb 0.42   ±  
0.18 D
a0.17   ±  
0.02 B
a0.07   ±  
0.04 A
b0.18   ±  
0.04 BC
a0.19   ±  
0.02 C
a0.17   ±  
0.02 B
a0.18   ±  
0.02 BC
a0.11   ±  
0.04 A
c0.82   ±  
0.55 D
Ma 0.25   ±  
0.12 C
a0.17   ±  
0.04 BC
a0.06   ±  
0.02 A
a0.14   ±  
0.03 B
a0.19   ±  
0.03 C
b0.23   ±  
0.04 C
a0.19   ±  
0.04 C
ab0.13   ±  
0.02 B
a0.15   ±  
0.04 B
Ua 0.21   ±  
0.12 BC
a0.15   ±  
0.07 B
a0.07   ±  
0.02 A
a0.15   ±  
0.02 B
b0.23   ±  
0.02 C
b0.28   ±  
0.08 C
a0.22   ±  
0.06 C
b0.15   ±  
0.02 B
b0.28   ±  
0.18 C
All 0.29   ±  
0.16 FG
0.16   ±  
0.05 C
0.07   ±  
0.03 A
0.15   ±  
0.03 C
0.21   ±  
0.03 DE
0.23   ±  
0.07 EF
0.19   ±  
0.05 D
0.13   ±  
0.03 B
0.42   ±  
0.43 G
Ca (cmol/kg)Ea 4.74   ±  
0.38 C
a5.32   ±  
1.64 CD
a4.71   ±  
1.19 AC
a4.16   ±  
0.62 AB
a4.00   ±  
0.10 A
a4.39   ±  
0.42 BC
a4.51   ±  
0.58 C
a4.56   ±  
0.53 BC
a6.13   ±  
0.53 D
Mb 6.25   ±  
0.28 C
a6.18   ±  
0.98 CD
a5.72   ±  
1.15 AC
b5.87   ±  
0.49 AB
b6.26   ±  
0.25 C
b6.69   ±  
0.70 C
b5.85   ±  
0.27 BC
b6.96   ±  
0.41 D
b7.37   ±  
0.28 F
Uab 7.14   ±  
3.47 ACD
a6.34   ±  
0.67 A
b7.34   ±  
0.79 C
c7.27   ±  
0.17B C
b6.54   ±  
0.31 A
c8.50   ±  
1.48 CE
b6.02   ±  
0.46 AB
c8.60   ±  
0.44 DE
a6.63   ±  
0.51 A
All 6.05   ±  
2.19 ABC
5.95   ±  
1.21 A
5.93   ±  
1.50 A
5.77   ±  
1.37 A
5.60   ±  
1.18 A
6.53   ±  
1.96 B
5.46   ±  
0.81 A
6.70   ±  
1.75 C
6.71   ±  
0.68 C
Mg (cmol/kg)Ea 1.33   ±  
0.19 D
a1.23   ±  
0.40 CD
a0.77   ±  
0.19 A
a0.82   ±  
0.12 A
a0.92   ±  
0.05 B
a1.08   ±  
0.08 C
a1.07   ±  
0.11 C
a1.06   ±  
0.11 C
a1.44   ±  
0.08 D
Mb 1.95   ±  
0.24 C
b1.91   ±  
0.18 C
b1.36   ±  
0.31 AB
b1.41   ±  
0.10 B
b1.64   ±  
0.06 A
b1.48   ±  
0.16 B
b1.24   ±  
0.06 A
b1.60   ±  
0.16 B
b1.56   ±  
0.07 A
Uc 3.04   ±  
1.43 D
b1.76   ±  
0.15 B
c1.87   ±  
0.09 C
c1.92   ±  
0.06 C
c2.21   ±  
0.16 D
c2.44   ±  
0.30 D
c1.61   ±  
0.33 B
b1.82   ±  
0.30 BC
a1.45   ±  
0.09 A
All 2.11   ±  
1.08 F
1.63   ±  
0.39 D
1.33   ±  
0.50 AB
1.38   ±  
0.47 BE
1.59   ±  
0.54 BD
1.66   ±  
0.61 DEF
1.31   ±  
0.30 AC
1.49   ±  
0.38 BCD
1.49   ±  
0.09 BD
1 E: excessive fertilization; M: moderate fertilization; U: untreated; All: averaged E, M, and U. 2 Two-sample t-test at significance level (p-value < 0.05) with mean ± standard deviation; uppercase letters indicate significant differences between dates, and lowercase letters indicate significant differences between different nitrogen fertilization regimes.
Table 8. Two-sample t-test of chlorophyll and macronutrients in apple tree leaves estimated using UAV-based hyperspectral imagery depending on the growing season and fertilization provided in 2021.
20219 June22 June13 July28 July11 August31 August15 September30 September15 October
Ch   ( μ g / c m 2 )E 1 a 6.07   ±  
0.68 B 2
a 4.77   ±  
0.57 A
a 4.94   ±  
0.59 A
a 4.38   ±  
0.17 A
a 5.44   ±  
0.88 AB
a 5.47   ±  
1.20 AB
a 5.03   ±  
0.86 A
M a 5.77   ±  
0.44 B
a 4.99   ±  
0.46 A
a 4.88   ±  
0.65 A
b 5.08   ±  
0.36 A
a 4.85   ±  
0.69 A
a 5.92   ±  
2.31 AB
a 4.86   ±  
0.62 A
U a 5.69   ±  
0.36 C
a 5.02   ±  
0.69 A
a 5.01   ±  
0.29 AB
ab 5.22   ±  
0.84 ABC
a 4.99   ±  
0.89 BC
a 6.39   ±  
1.61 AC
a 5.07   ±  
0.59 AB
All 5.85   ±  
0.52 C
4.93   ±  
0.56 A
4.94   ±  
0.51 A
5.06   ±  
0.64 AB
5.03   ±  
0.82 A
6.00   ±  
1.81 BC
4.98   ±  
0.63 A
P
(%)
Ea 0.10   ±  
0.03 AB
a0.10   ±  
0.02 A
a0.10   ±  
0.02 A
a0.11   ±  
0.01 A
a0.13   ±  
0.02 C
a0.12   ±  
0.01 AC
a0.14   ±  
0.02 BC
a0.15   ±  
0.02 C
a0.14   ±  
0.02 BC
Ma 0.11   ±  
0.03 B
a0.11   ±  
0.03 B
a0.10   ±  
0.02 A
a0.11   ±  
0.01 AB
a0.12   ±  
0.01 AB
a0.11   ±  
0.01 A
a0.14   ±  
0.02 C
a0.14   ±  
0.02 C
a0.13   ±  
0.02 BC
Ua 0.12   ±  
0.02B C
a0.10   ±  
0.02 B
a0.10   ±  
0.01 B
a0.11   ±  
0.02 BC
a0.12   ±  
0.03 BC
a0.13   ±  
0.04 BCD
a0.14   ±  
0.03 CD
a0.15   ±  
0.02 D
a0.14   ±  
0.03 CD
All 0.11   ±  
0.02 AB
0.10   ±  
0.02 A
0.10   ±  
0.02 A
0.11   ±  
0.01 B
0.12   ±  
0.02 BC
0.12   ±  
0.03 B
0.14   ±  
0.02 CD
0.15   ±  
0.02 D
0.14   ±  
0.03 CD
K (%)Ea 0.68   ±  
0.09 AB
a0.73   ±  
0.12 AB
a0.74   ±  
0.12 AB
a0.73   ±  
0.06 B
a0.67   ±  
0.06 AB
a0.57   ±  
0.04 A
a0.72   ±  
0.08 AB
a0.68   ±  
0.06 AB
b0.71   ±  
0.09 B
Ma 0.69   ±  
0.08 BCE
a0.68   ±  
0.10 ABD
a0.77   ±  
0.15 CDE
a0.74   ±  
0.06 DE
a0.69   ±  
0.11 AE
a0.65   ±  
0.06 ACE
a0.63   ±  
0.06 AB
a0.69   ±  
0.06 BE
a0.60   ±  
0.07 A
Ua 0.69   ±  
0.08 AB
a0.70   ±  
0.14 AB
a0.74   ±  
0.07 B
a0.69   ±  
0.05 AB
a0.65   ±  
0.08 A
a0.73   ±  
0.26 AB
a0.70   ±  
0.14 AB
a0.67   ±  
0.09 AB
ab0.67   ±  
0.18 AB
All 0.68   ±  
0.08 AB
0.70   ±  
0.12 BC
0.75   ±  
0.11 C
0.72   ±  
0.06 BC
0.67   ±  
0.08 A
0.67   ±  
0.18 AB
0.68   ±  
0.11 AB
0.68   ±  
0.07 AB
0.65   ±  
0.13 A
C
(%)
Ea 28.6   ±  
7.43 ABC
a30.2   ±  
3.00 B
a34.9   ±  
3.69 CD
a30.2   ±  
1.83 B
a30.8   ±  
2.83 B
a32.2   ±  
2.16 CD
a34.3   ±  
7.37 BC
a28.1   ±  
2.56 B
a27.4   ±  
2.69 A
Ma 27.3   ±  
3.41 AB
a35.4   ±  
13.7 BCF
a35.3   ±  
3.85 CD
a31.0   ±  
1.66 CE
a30.9   ±  
2.17 CE
a31.8   ±  
1.59 C
a30.4   ±  
1.94 BE
a32.7   ±  
8.40 BCF
a27.4   ±  
2.97 ADF
Ua 27.2   ±  
2.24 A
a29.5   ±  
4.10 ABC
a33.7   ±  
4.53 BC
a31.0   ±  
2.09 BC
a28.8   ±  
2.17 A
a33.9   ±  
6.28 C
a32.1   ±  
7.80 A
a29.7   ±  
8.10 ABC
a27.1   ±  
4.62 AB
All 27.7   ±  
4.69 AC
31.7   ±  
8.46 CE
34.6   ±  
3.90 E
30.8   ±  
1.82 CD
30.2   ±  
2.29 C
32.8   ±  
4.23 DE
31.9   ±  
6.55 CE
30.5   ±  
7.22 BCD
27.3   ±  
3.41 AB
Ca (%)Ea 0.89   ±  
0.16 A
a0.95   ±  
0.18 A
a0.98   ±  
0.10 A
a1.21   ±  
0.08 B
a1.21   ±  
0.11 B
a1.31   ±  
0.05 BC
b1.51   ±  
0.13 D
a1.38   ±  
0.19 BD
b1.46   ±  
0.15 CD
Ma 0.97   ±  
0.28 AB
a1.03   ±  
0.31 BC
a0.96   ±  
0.13 A
a1.12   ±  
0.14 BC
a1.14   ±  
0.08 BC
a1.23   ±  
0.09 C
a1.36   ±  
0.08 D
a1.44   ±  
0.13 E
a1.26   ±  
0.08 CD
Ua 0.99   ±  
0.23 ABC
a0.84   ±  
0.10 A
a1.01   ±  
0.09 C
a1.19   ±  
0.15 BE
a1.10   ±  
0.20 BCD
a1.17   ±  
0.14 BE
ab1.30   ±  
0.23 E
a1.33   ±  
0.18 DE
ab1.29   ±  
0.21 DE
All 0.95   ±  
0.22 A
0.93   ±  
0.22 A
0.98   ±  
0.10 A
1.17   ±  
0.13 B
1.15   ±  
0.14 B
1.22   ±  
0.12 B
1.37   ±  
0.17 C
1.39   ±  
0.18 C
1.32   ±  
0.16 C
1 E: excessive fertilization; M: moderate fertilization; U: untreated; All: averaged E, M, and U. 2 Two-sample t-test at significance level (p-value < 0.05) with mean ± standard deviation; uppercase letters indicate significant differences between dates, and lowercase letters indicate significant differences between different nitrogen fertilization regimes.
Table 9. Two-sample t-test of chlorophyll and macronutrients in apple tree leaves estimated using UAV-based hyperspectral imagery depending on the growing season and fertilization provided in 2022.
2022May 23June 03June 17July 04July 19July 28August 16September 07September 21
Ch   ( μ g / c m 2 )E 1a 6.42   ±  
0.51 A 2
a 7.85   ±  
0.72 B
a 9.46   ±  
1.62 D
a 9.92   ±  
2.49 D
a 9.37   ±  
1.44 CD
a 9.70   ±  
0.65 D
a 9.57   ±  
1.00 D
ab 10.3   ±  
1.25 D
b 8.34   ±  
0.37 BC
Ma 6.61   ±  
0.80 A
a 8.11   ±  
1.08 B
a 8.98   ±  
0.48 BC
a 9.88   ±  
0.72 C
a 10.2   ±  
0.54 CD
b 10.5   ±  
0.40 D
a 9.59   ±  
0.78 C
b 10.6   ±  
0.27 D
b 8.47   ±  
0.76 B
Ua 6.82   ±  
0.86 A
a 8.03   ±  
0.97 B
a 9.16   ±  
0.38 C
a 9.74   ±  
0.86 CD
a 10.4   ±  
0.57 D
ab 10.1   ±  
0.74 D
a 9.31   ±  
1.30 CD
a 10.1   ±  
0.49 D
a 7.55   ±  
0.41 AB
All 6.62   ±  
0.71 A
8.00   ±  
0.90 B
9.20   ±  
0.52C
9.85   ±  
0.67 D
9.98   ±  
1.01 DE
10.1   ±  
0.67 D
9.49   ±  
1.00 CD
10.3   ±  
0.77 E
8.12     ±  
0.66 B
P
(%)
Ea 0.18   ±  
0.03C D
ab0.17   ±  
0.01 C
b0.21   ±  
0.01 E
a0.19   ±  
0.02 D
b0.13   ±  
0.01 B
a0.14   ±  
0.03 B
a0.10   ±  
0.01 A
c0.12   ±  
0.02 B
a0.09   ±  
0.02 A
Ma 0.15   ±  
0.04 E
b0.18   ±  
0.02 EF
b0.20   ±  
0.03 F
a0.19   ±  
0.02 EF
ab0.13   ±  
0.02 DE
a0.11   ±  
0.01 CD
a0.11   ±  
0.01 C
b0.10   ±  
0.01 B
a0.07   ±  
0.01 A
Ua 0.19   ±  
0.03 DF
a0.16   ±  
0.01 E
a0.17   ±  
0.01 F
a0.19   ±  
0.02 F
a0.11   ±  
0.01 D
a0.13   ±  
0.01 C
a0.11   ±  
0.01 D
a0.09   ±  
0.01 B
a0.08   ±  
0.01 A
All 0.17   ±  
0.04 DE
0.17   ±  
0.04 D
0.19   ±  
0.02 F
0.19   ±  
0.02 EF
0.12   ±  
0.02 C
0.13   ±  
0.02 C
0.11   ±  
0.01 B
0.10   ±  
0.02 B
0.08   ±  
0.01 A
K (%)Ea 1.27   ±  
0.23C D
a1.29   ±  
0.13 D
a1.36   ±  
0.09 D
a1.13   ±  
0.12 C
a0.88   ±  
0.21 B
a0.94   ±  
0.30 BC
a0.67   ±  
0.08 A
a0.61   ±  
0.05 A
a0.80   ±  
0.10 B
Ma 1.18   ±  
0.27 DE
a1.32   ±  
0.09 E
a1.44   ±  
0.08 F
a1.10   ±  
0.19 D
a0.92   ±  
0.17 CD
a0.86   ±  
0.09 C
a0.70   ±  
0.10 A
b0.78   ±  
0.03 AB
a0.81   ±  
0.07 BC
Ua 1.33   ±  
0.20 C
a1.21   ±  
0.14 C
b1.58   ±  
0.10 D
a1.12   ±  
0.18 C
a0.79   ±  
0.12 B
a0.88   ±  
0.17 B
a0.63   ±  
0.12 A
c0.89   ±  
0.10 B
a0.86   ±  
0.10 B
All 1.26   ±  
0.23 E
1.27   ±  
0.12 E
1.46   ±  
0.13 F
1.11   ±  
0.16 D
0.86   ±  
0.17 C
0.89   ±  
0.20 C
0.67   ±  
0.10 A
0.76   ±  
0.13 B
0.83   ±  
0.09 BC
C
(%)
Ea 45.0   ±  
4.18 AB
a48.2   ±  
6.35 AC
b49.2   ±  
0.31 C
a52.3   ±  
6.77 BCD
a63.4   ±  
7.11 E
a63.5   ±  
8.06 E
a58.3   ±  
10.3 DE
ab63.3   ±  
7.54 E
a65.3   ±  
7.24 E
Ma 46.4   ±  
2.82 A
a48.4   ±  
0.63 A
b49.0   ±  
0.39 B
a53.8   ±  
4.66 C
a65.3   ±  
4.06 DEF
a67.0   ±  
0.84 EF
a65.1   ±  
1.57 D
b66.8   ±  
0.13 E
a67.4   ±  
0.52 F
Ua 45.2   ±  
3.52 A
a50.1   ±  
3.57 B
a48.3   ±  
0.53 B
a51.8   ±  
4.28 B
a64.3   ±  
5.04 CDE
a67.9   ±  
0.52 E
a62.9   ±  
2.97 C
a66.0   ±  
0.59 D
a67.6   ±  
0.36 E
All 45.5   ±  
3.34 A
48.9   ±  
4.10 B
48.8   ±  
0.57 B
52.6   ±  
5.14 C
64.3   ±  
5.32 DE
66.1   ±  
5.19 E
62.1   ±  
6.61 D
65.4   ±  
4.41 E
66.8   ±  
4.11 E
Ca (%)Ea 0.98   ±  
0.10 AB
a1.08   ±  
0.09 A
b1.43   ±  
0.05 CD
a1.43   ±  
0.09 DE
a1.24   ±  
0.17 CD
a1.19   ±  
0.08 BC
a1.46   ±  
0.08 DF
a1.47   ±  
0.13 DE
ab1.57   ±  
0.15 EF
Ma 0.92   ±  
0.13 A
a1.08   ±  
0.11 B
b1.31   ±  
0.14 BCD
a1.39   ±  
0.17 C
a1.33   ±  
0.12 C
a1.20   ±  
0.09 D
a1.39   ±  
0.10 C
a1.52   ±  
0.04 E
b1.64   ±  
0.10 F
Ua 0.95   ±  
0.12 A
a1.08   ±  
0.09 AB
a1.13   ±  
0.07 B
a1.39   ±  
0.17 D
a1.34   ±  
0.11 CD
a1.24   ±  
0.08 C
a1.41   ±  
0.11 D
a1.56   ±  
0.03 E
a1.55   ±  
0.04 E
All 0.95   ±  
0.11 A
1.08   ±  
0.09 B
1.29   ±  
0.15 D
1.41   ±  
0.14 E
1.31   ±  
0.14 D
1.21   ±  
0.10 C
1.42   ±  
0.10 E
1.52   ±  
0.08 F
1.58   ±  
0.11 G
1 E: excessive fertilization; M: moderate fertilization; U: untreated; All: averaged E, M, and U. 2 Two-sample t-test at significance level (p-value < 0.05) with mean ± standard deviation; uppercase letters indicate significant differences between dates, and lowercase letters indicate significant differences between different nitrogen fertilization regimes.
Disclaimer/Publisher’s Note: The statements, opinions and data contained in all publications are solely those of the individual author(s) and contributor(s) and not of MDPI and/or the editor(s). MDPI and/or the editor(s) disclaim responsibility for any injury to people or property resulting from any ideas, methods, instructions or products referred to in the content.

