Review

Review of Crop Phenotyping in Field Plot Experiments Using UAV-Mounted Sensors and Algorithms

by
Takashi Sonam Tashi Tanaka
1,
Sheng Wang
1,
Johannes Ravn Jørgensen
1,
Marco Gentili
1,
Armelle Zaragüeta Vidal
2,
Anders Krogh Mortensen
3,
Bharat Sharma Acharya
4,
Brittany Deanna Beck
1 and
René Gislum
1,*
1
Department of Agroecology, Faculty of Technical Sciences, Aarhus University, 4200 Slagelse, Denmark
2
Departamento Ciencias, Instituto de Innovación y Sostenibilidad en la Cadena Agroalimentaria (IS-FOOD), Universidad Pública de Navarra, 31006 Pamplona, Spain
3
The AI Lab, 8210 Aarhus V, Denmark
4
Rodale Institute, Southeast Organic Center, Chattahoochee Hills, GA 30268, USA
*
Author to whom correspondence should be addressed.
Drones 2024, 8(6), 212; https://doi.org/10.3390/drones8060212
Submission received: 29 April 2024 / Revised: 15 May 2024 / Accepted: 16 May 2024 / Published: 21 May 2024
(This article belongs to the Special Issue Advances of UAV in Precision Agriculture)

Abstract

:
The phenotyping of field crops quantifies a plant’s structural and physiological characteristics to facilitate crop breeding. High-throughput unmanned aerial vehicle (UAV)-based remote sensing platforms have been extensively researched as replacements for more laborious and time-consuming manual field phenotyping. This review aims to elucidate the advantages and challenges of UAV-based phenotyping techniques. This is a comprehensive overview summarizing the UAV platforms, sensors, and data processing while also introducing recent technological developments. Recently developed software and sensors greatly enhance the accessibility of UAV-based phenotyping, and a summary of recent research (publications 2019–2024) provides implications for future research. Researchers have focused on integrating multiple sensing data or utilizing machine learning algorithms, such as ensemble learning and deep learning, to enhance the prediction accuracies of crop physiological traits. However, this approach will require big data alongside laborious destructive measurements in the fields. Future research directions will involve standardizing the process of merging data from multiple field experiments and data repositories. Previous studies have focused mainly on UAV technology in major crops, but there is a high potential in minor crops or cropping systems for future sustainable crop production. This review can guide new practitioners who aim to implement and utilize UAV-based phenotyping.

1. Introduction

With the global population steadily rising, there is a rising demand for enhanced crop production while ensuring environmental sustainability [1]. To support the sustainable intensification of agricultural production systems, high-throughput field phenotyping is used, which quantitatively assesses crop biophysical and biochemical characteristics. This process is crucial for accelerating crop breeding and improving agricultural production [2]. Field crop phenotyping is also highly needed for understanding crop growth and development, to support the identification of cultivars or genotypes for climate change adaptation [3]. Despite the high importance of phenotyping, traditional methods of field crop phenotyping often involve labor-intensive and time-consuming field surveys, limiting the scale and efficiency of data collection [4]. Unmanned aerial vehicles (UAVs), commonly known as drones or Unmanned Aerial Systems (UASs), have emerged as transformative tools with the potential to revolutionize crop phenotyping. UAVs equipped with an array of sensors and imaging technologies can offer nondestructive, high-resolution, and rapid approaches for acquiring critical spatial and temporal information on crop characteristics, growth, and stress [5]. The integration of UAVs into phenotyping practices holds great promise for unlocking insights into plant responses to environmental stressors, diseases, and nutrient deficiencies.
To date, UAV-based phenotyping using different sensors has been comprehensively reviewed in previous studies [6,7,8,9]. For instance, UAV platforms can be equipped with imaging or non-imaging sensors to collect RGB, multispectral, hyperspectral, light detection and ranging (LiDAR), and thermal infrared signals for crop phenotyping. However, those review papers were based on publications primarily from 2000 to 2020. Meanwhile, the most recently published review papers have focused only on a specific topic such as UAV image quality standardization [10], thermal sensing [11,12], deep learning [13], and biomass prediction [14]. Most research has focused on the development of data processing algorithms and analytics (machine learning and deep learning), but there has also been a big movement in commercially available cameras and software for UAVs over the past few years. Therefore, it is necessary to review recent publications including various practical applications to provide new insights into the advantages, limitations, and challenges of UAV-based phenotyping. Furthermore, it is also important to prompt the principal and theoretical explanations for the mechanisms of how crop physiological parameters can be quantified using UAV-based phenotyping technologies to develop further research directions and guide new practitioners who focus on crop breeding and have no or very limited knowledge within UAV-based crop sensing.
Given the recent rapid progress in UAV-based phenotyping, this review paper aims to provide a comprehensive overview of the UAV platforms and sensors, data processing algorithms, and UAV applications in crop phenotyping. The ultimate goal of the current paper is to guide new practitioners who aim to implement and utilize UAV-based phenotyping. Furthermore, this review aims to elucidate the strengths and challenges associated with UAV-based crop phenotyping, including data processing complexities, data analytics, and the need for standardization. By evaluating current research findings, we aim to provide insights into the pathway for further advancements in UAV-based phenotyping research, fostering a more sustainable and efficient approach to agricultural practices in the face of global food security challenges.
This review is divided into eight sections. Section 1 provides background information for this review. Section 2 describes an overview of the relationships between breeding and field phenotyping. Section 3 covers different types of UAV platforms and sensors. Section 4 provides a theoretical description of crop reflectance and chemical characteristics. Section 5 describes the process of analyzing UAV image data to extract crop physiological traits. Recent case studies on UAV phenotyping are summarized in Section 6. Section 7 discusses the recent development of UAV phenotyping, limitations, and future implications, and conclusions are presented in Section 8.

2. Breeding and Field Phenotyping
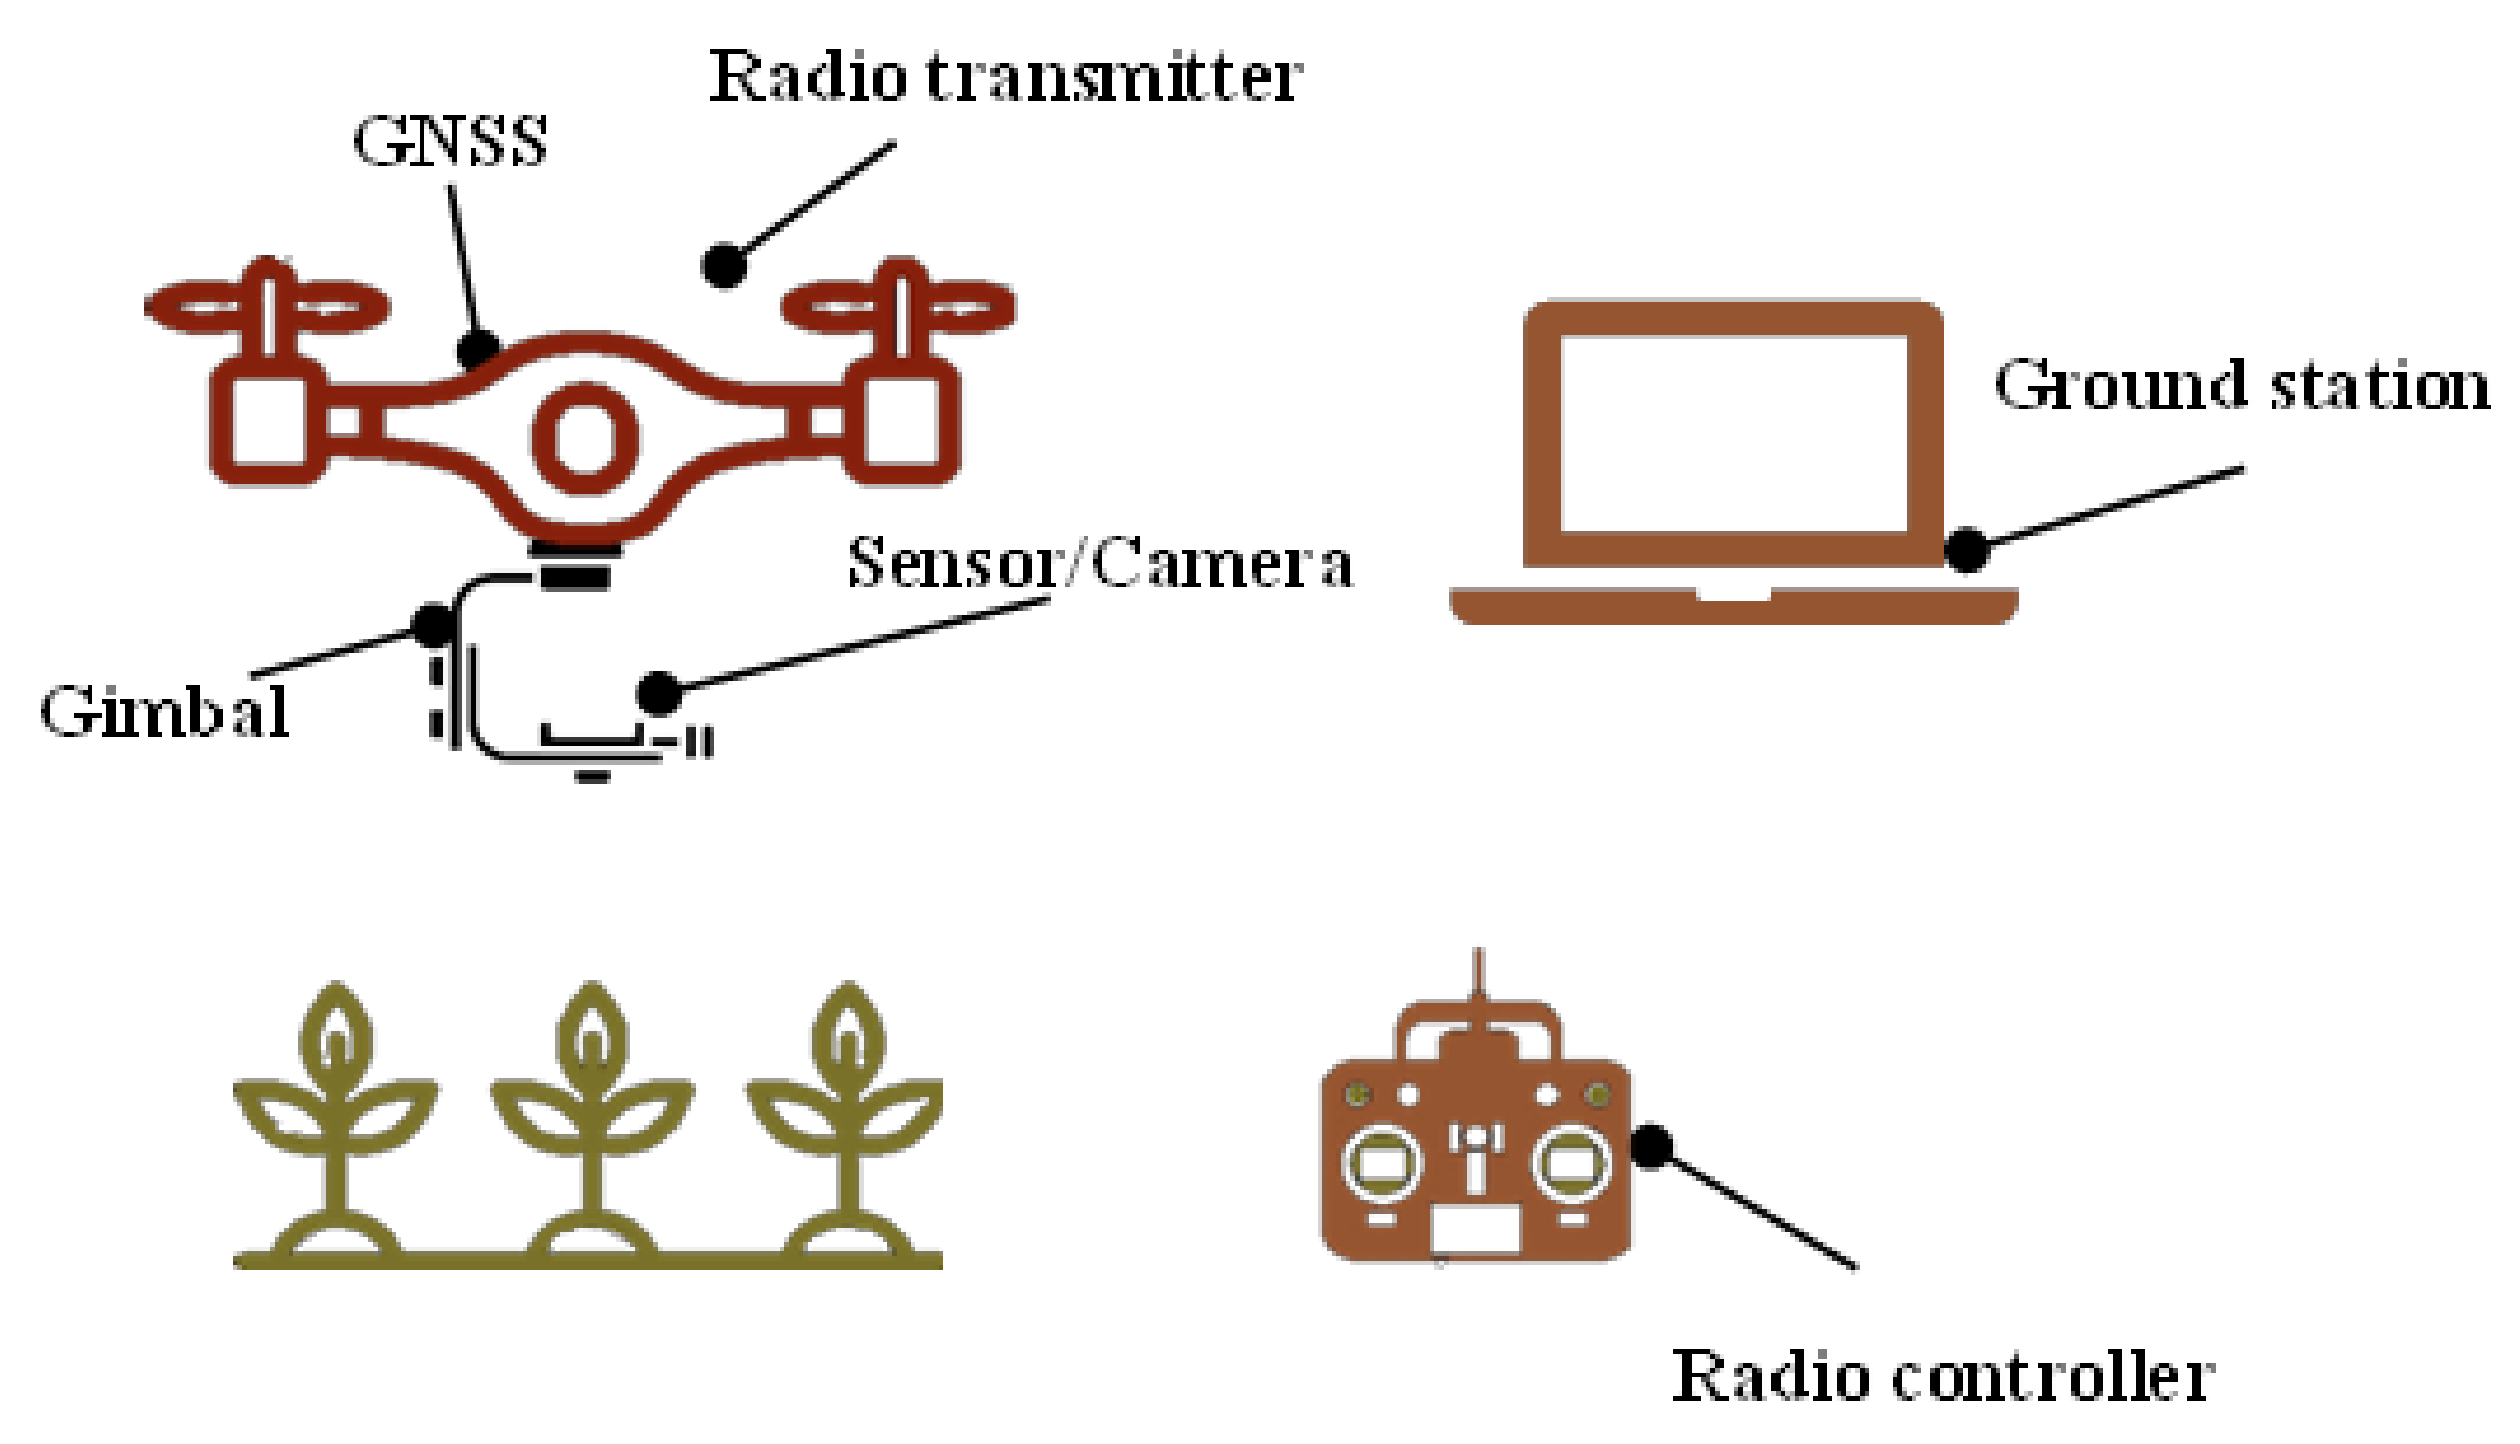
The main goal of plant breeding is to develop new plant varieties or cultivars with desirable traits, such as increased yield, improved quality, pest and disease resistance, and tolerance to environmental stresses. Field phenotyping can be used to evaluate a wide range of traits in the plant breeding of crops. This review focuses on cereal and forage crops. These traits can be broadly categorized into three categories: yield-related traits [15], abiotic stress tolerance traits [2], and biotic stress tolerance traits.
Yield-related traits include germination rate, grain yield, yield component, biomass, harvest index, and grain quality such as protein content, starch content, moisture content, and damaged kernels. Traits providing tolerance to abiotic stress can be assessed by water use efficiency, leaf rolling and wilting as indicators of the plant’s response to water stress, and canopy temperature as an indicator of the plant’s response to heat stress. Traits providing tolerance to biotic stress indicate disease severity and pest resistance. Plant architecture, which refers to the arrangement of leaves and branches, can represent both yield-related traits and biotic stress tolerance [16]. Furthermore, phenology, the timing of key developmental stages such as flowering, affects the plant’s susceptibility to pests and diseases such as ergot infection.
In breeding fields, phenotyping can be used by the measurement and analysis of various plant characteristics, including growth parameters, and physiological traits in large-scale field trials, where plants are exposed to natural environmental variations, including soil types, climate conditions, and biotic stresses. As manual measurement is laborious and time-consuming, high-throughput phenotyping enabled by UAV platforms can facilitate a better understanding of crop physiological traits, which further allows for the more efficient progress of breeding programs.

3. UAV and Sensors

UAV platforms have proven to be a promising tool for the high-throughput phenotyping of crop growth traits. A UAV platform consists of a UAV controlled by an operator on the ground, a controller, sensors, and a global navigation satellite system (GNSS), allowing for high-resolution images of the crop in the field (Figure 1). Sensors are normally equipped with a gimbal to keep the sensors steady during flight. There are several different types of UAVs used in agriculture such as rotary-wing, fixed-wing, gas helicopters, and hybrids (Table 1). The most used platform for field phenotyping includes the rotary-wing and the fixed-wing UAV, while the gas helicopter is generally used for other purposes such as spraying. The choice of UAV and sensor type for a specific task depends on parameters like stability, safety, flight duration, altitude, range, purpose, and cost.
Sensors such as RGB (red, green, and blue) cameras, multispectral cameras, hyperspectral cameras, thermal cameras, and LiDAR systems are used to measure crop growth and development [6,17]. The resulting images and point clouds obtained from these types of sensors are subsequently processed to obtain the information required to determine crop traits. Detailed information on each sensor is described in the following sections.
Table 1. The advantages and limitations of the most used UAVs for field phenotyping.
Type of UAVAdvantagesLimitationsReferences
Rotary-wing
Drones 08 00212 i001
Highly maneuverable, suitable for small or irregularly shaped fields, high-resolution imaging, detailed mapping of cropsLimited flight time, less efficient for large-scale mapping, vulnerable to windy conditions [9,18,19]
Fixed-wing
Drones 08 00212 i002
Speed, long flight time, ideal for covering large areas quicklyInability to hover in place, need a large open space[20,21]
Gas helicopter
Drones 08 00212 i003
Stable in windy conditions, able to be used for long periods of time, can carry a heavier payloadHigh cost, complexity, loud noise[6,22]
Hybrid
Drones 08 00212 i004
Integrates the advantages of rotary-wing and fixed-wing UAVs. Taking off and landing use rotary-wing mode, and long-distance surveys use fixed-wing mode.High cost, complexity, requires professional pilots[23]

3.1. RGB Camera

RGB cameras represent the most used sensors in UAV-based field phenotyping, due to their low price, light weight, work flexibility, easy operation, and easy data analysis [8]. RGB cameras mimic the human eye by sensing visible light wavelengths from 400 to 700 nm. In this range, the reflectance is predominantly influenced by the plant pigment chlorophyll (Chl) [16]. This allows for the calculation of different vegetation indices by computing the reflectance of a certain band of the green and red zone of the electromagnetic spectrum [24]. Therefore, RGB image analysis can serve as a valuable tool for crop monitoring [25]. Several studies report that RGB cameras can successfully be used for assessing crop height [26,27], texture [28], crop biomass [29,30], leaf area index (LAI) [31], yield [30,32], lodging [27,28], and to obtain other parameters related to the active photosynthetic canopy and senescence such as green area (GA), greener green area (GGA), and the crop senescence index (CSI) [33]. However, RGB cameras can only provide information in the visual spectral bands, which are limited compared to multispectral or hyperspectral cameras [6]. Moreover, they do not have continuous spectrum information [9]. The RGB camera has a limitation in that it can only provide the digital number (DN) recorded by the image sensors, which hinders a direct comparison of images taken in different illumination conditions.

3.2. Multispectral Camera

Multispectral imaging sensors capture images using several narrow spectral bands (10–57 nm) within the electromagnetic spectrum (Figure 2). The resulting images can provide information about the chemical and physiological properties of crops [6]. The wider range of useful wavebands in both visible and near-infrared (NIR) spectral regions compared to RGB cameras make them valuable tools for calculating several vegetation indices, such as the normalized difference vegetation index (NDVI) [34], green normalized difference vegetation index (GNDVI) [35], and normalized difference red edge index (NDRE) [36], which are then used to predict traits like yield, biomass, nitrogen (N) content, Chl content, and other relevant parameters [9,37,38]. However, multispectral cameras are limited by the low spectrum resolution, which could limit their ability to detect subtle differences in plant traits, and discontinuous spectrum, which means that they cannot provide continuous spectrum information [39].

3.3. Hyperspectral Camera

Hyperspectral cameras are commonly divided into spectral regions, including VIS (400–700 nm), NIR (700–1100 nm), and SWIR (1100–2500 nm). In contrast to multispectral cameras, they capture images with very narrow (<10 nm) and continuous wavelengths. They represent a promising technology as continuous spectral images allow for a more comprehensive understanding of plant performance and environmental interactions [40]. Over the past few years, the use of hyperspectral imaging cameras has emerged as a method for obtaining crop traits, including crop water content, leaf N concentration, Chl content, LAI, and other physical and chemical parameters, to predict yield [8]. However, the application of this type of sensor in agriculture is still marginal due to its high cost, the large volume of data, the high dimensionality of the data, and the complex analysis of the information. Therefore, the acquisition, processing, and analysis of hyperspectral images remain a challenging research topic [41].

3.4. Thermal Camera

Thermal imaging cameras capture images containing information about the energy emitted from body surfaces, such as the plant canopy [25]. Canopy temperature measurement is valuable information for detecting changes in stomal conductance and transpiration rates in response to plant water status. Since stomal conductance, photosynthetic, and transpiration rates are closely correlated with canopy temperature, thermal infrared technology can be effectively utilized to assess the response of crops under stress conditions [37,42].
Several studies report how thermal imaging cameras can successfully be used to estimate crop water status, using canopy temperature as a suitable phenotypic trait for describing the plant response to water deficit [33,43]. Other studies have revealed the potential of remote sensing methods in detecting and assessing plant diseases. For example, Francesconi et al. [25] report the potential application of a thermal imaging camera, combined with an RGB camera, for detecting Fusarium head blight in wheat, by detecting changes in the temperature and color of spikes as a result of the crop’s physiological response. However, the low resolution of the imaging (current cameras are in the range of 640 × 500 pixels) may limit the use of such cameras from aerial platforms [2].

3.5. LiDAR

LiDAR is a form of remote sensing technology that measures distance using the time of flight by emitting a narrow light beam and analyzing the returned signal when the light beam hits an object. Firing multiple light beams in quick succession at different angles allows LiDAR to build a 3D point cloud of the surrounding environment. It represents a promising technique for precision agriculture and forestry applications, thanks to its high accuracy, fast reading rates, and flexibility. Additionally, the ability of LiDAR technology to work in a wide range of light conditions makes this technology highly favorable for outdoor use [44]. UAVs equipped with LiDAR sensors can map the overflown environment in point clouds. The authors of [45] successfully explored the capability of UAV-based LiDAR to collect spatial data from crop fields, to estimate height, canopy volume, and a textural analysis of individual crop parcels. Moreover, the authors of [46] reported the potential application of UAV LiDAR to estimate plant phenotypes, such as biomass and plant height. However, the use of LiDAR for field phenotyping is limited by several factors such as high cost, narrow beam width, requiring high accuracy in the UAV position and orientation measurements, and large data processing.

3.6. Microwave Sensors

There are passive and active microwave sensors. Passive sensors, for example, GNSS reflectometry, measure the natural thermal emission from land surfaces using a radiometer to determine surface reflectivity. Meanwhile, active microwave sensors emit their own microwave radiation which has a higher potential for agricultural applications. An important example is ground-penetrating radar (GPR) which emits high-frequency radio waves. UAV-based GPR is used for high-resolution soil moisture mapping in hydrological studies [47]. Synthetic Aperture Radar (SAR) is also an active microwave sensor, capable of deriving high-resolution crop and field physical characteristics (i.e., dielectric constant, roughness, orientation). Croplands could be accurately classified using the time series L-band information captured by UAV-based SAR and machine learning models [48]. Although there is a great potential of SAR which differs from those derived from optical sensors, studies on agricultural applications are limited. Microwave sensors were initially developed for satellite platforms, and few microwave sensors are implemented with small-sized UAV platforms. It is required to develop commercially available microwave sensors with different wavelengths and polarizations for further research on UAV-based phenotyping applications.

4. Crop Reflectance and Chemical Information

It is a crucial step to understand the mechanism of how UAV phenotyping can quantify crop physiological traits, including chlorophylls and N contents. This section provides basic knowledge of the relationships between crop reflectance, chlorophylls, and N contents in terms of the chemometrics.

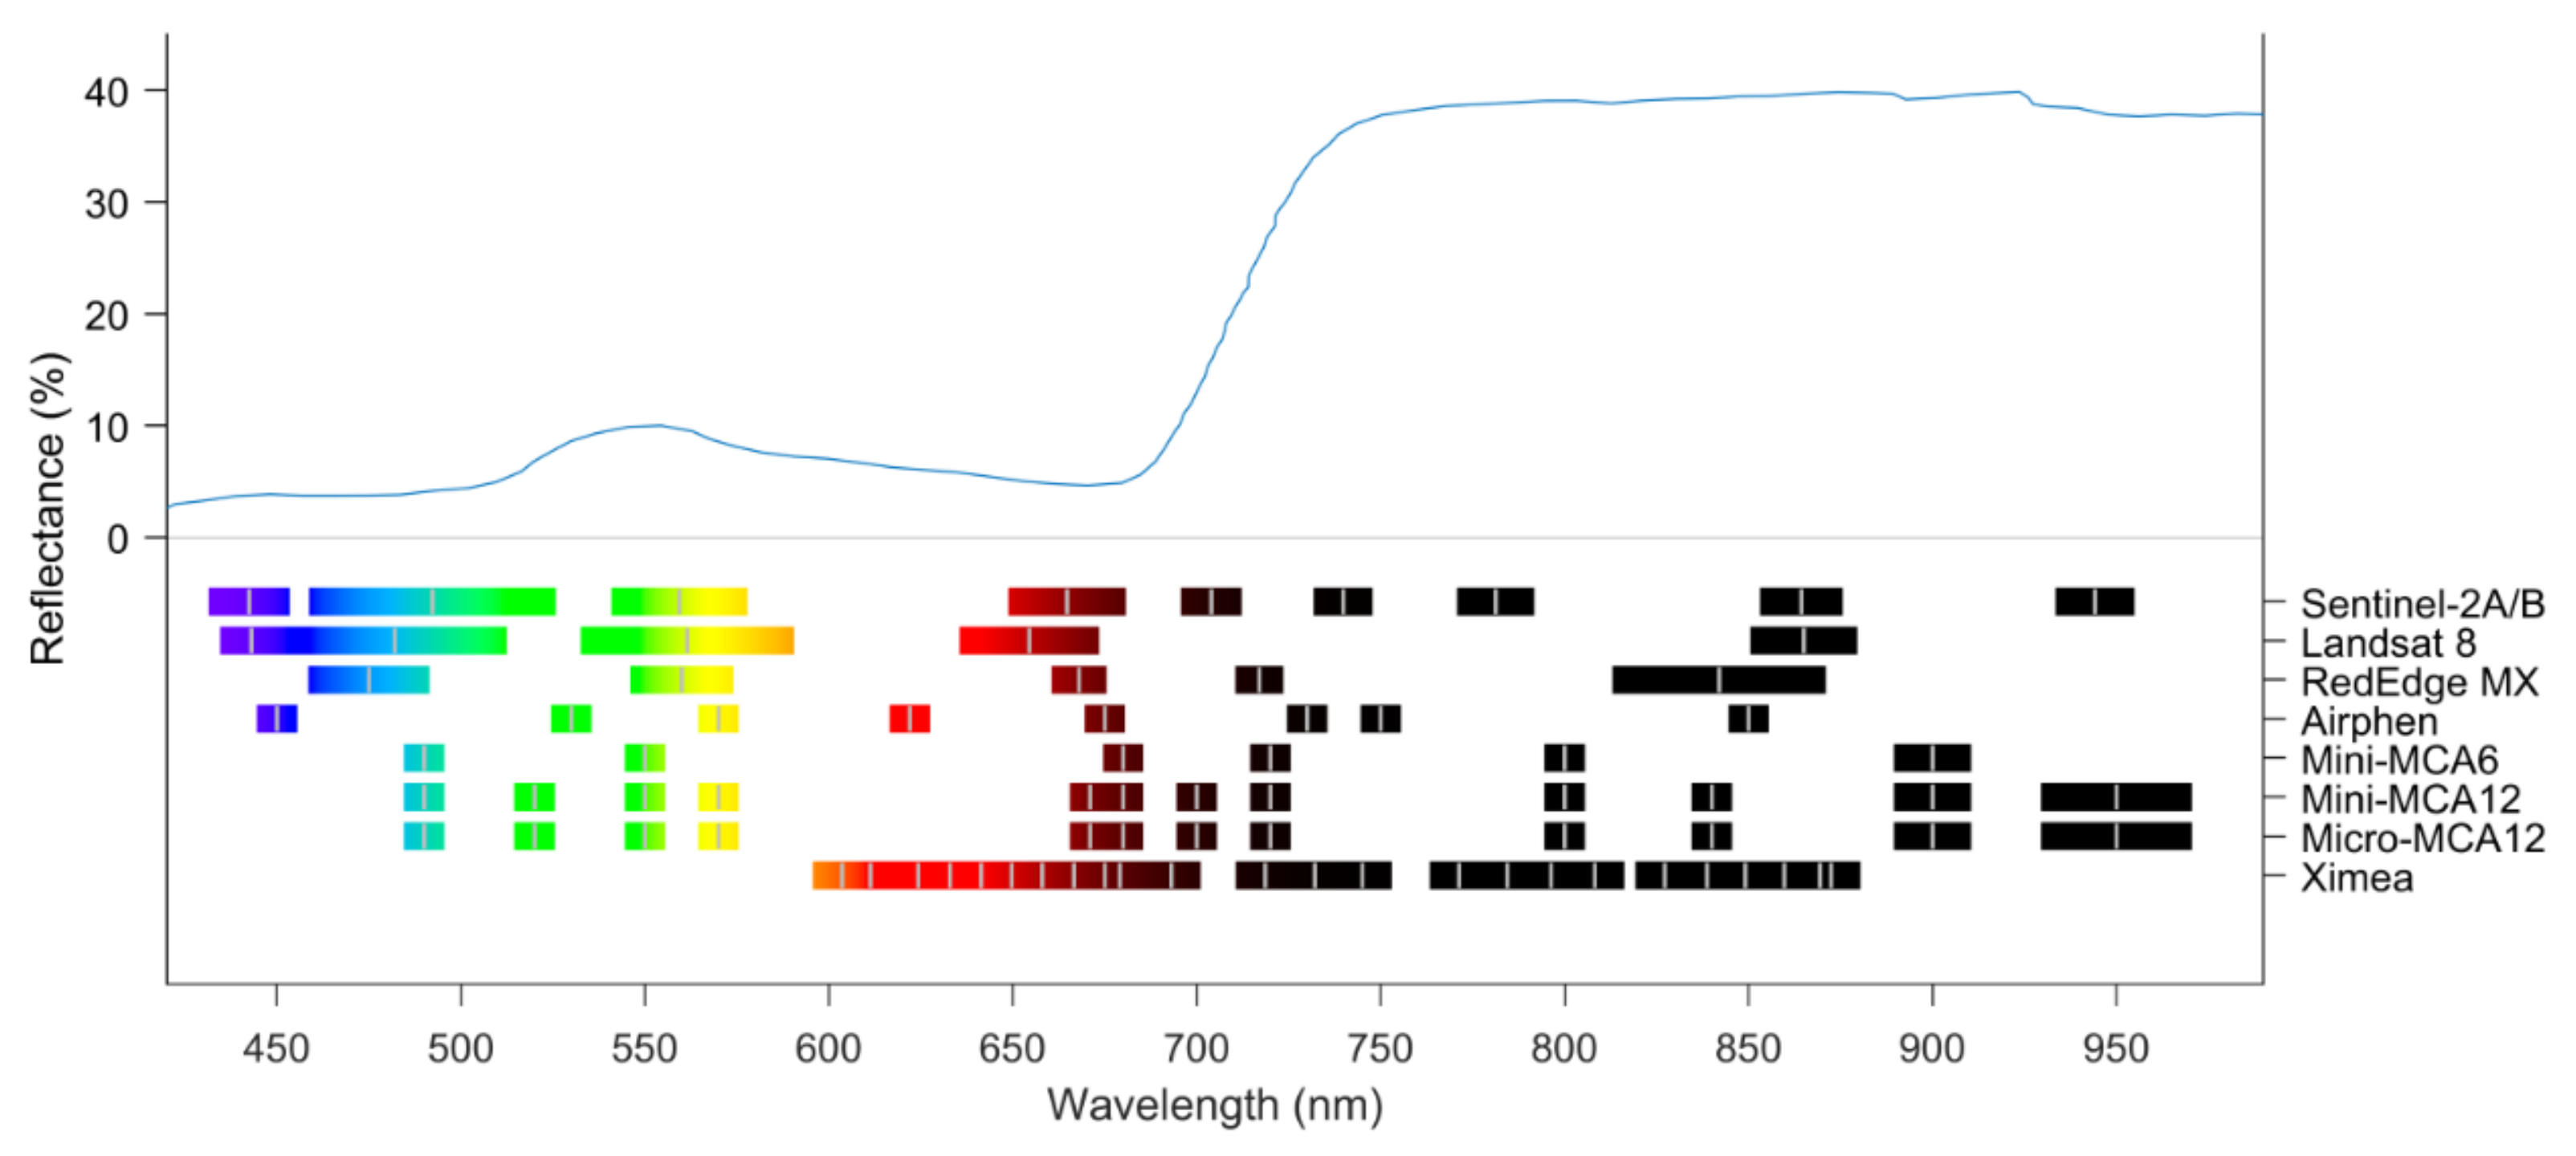
4.1. Crop Reflectance Figure

The presence of chlorophylls or N in plant tissues is often used as an indicator of crop health. Healthier crops contain more chlorophylls and N and reflect more energy in the green (550 nm) [49] and NIR (700 to 2500 nm) spectrum (Figure 3) [9]. The reflectance in NIR is attributed to the fact that, in this region of light, it easily interacts with different types of bonds such as NH, CH, and OH characterized by specific frequencies or wavelengths [50]. For example, the reflectance at wavelengths from 700 to 1200 nm is caused by the scattering of leaf cells. At each wavelength of 1200, 1450, and 2400, water existence absorbs the incoming light, which reduces the reflectance value. (Figure 3) [9,51].

4.2. Plant Spectrum Figure

The structure of Chl with several conjugated double bonds generates an electron density in which electrons are shared around a tetrapyrrole unit. This allows for electron transitions to higher-energy molecular orbitals after absorbing photons of solar radiation. This type of structure determines the type of spectrum absorbed by Chl and gives it its spectral properties in the range from visible to bode red (400 to 710 nm) [52]. Specifically, the absorbance spectra of chlorophylls show a predominant band in the visible blue and red. However, each Chl absorbs at different wavelengths due to their structural differences. In the case of Chl a, the arrangement of alternating single and double bonds in the porphyrin ring provides delocalized electrons generating absorption maximums in 432 nm and 670 nm (Figure 4). These absorption points coincide with the two excited states of Chl a. In the case of Chl b, the absorbance corresponds to 451 nm and 633 nm [52].

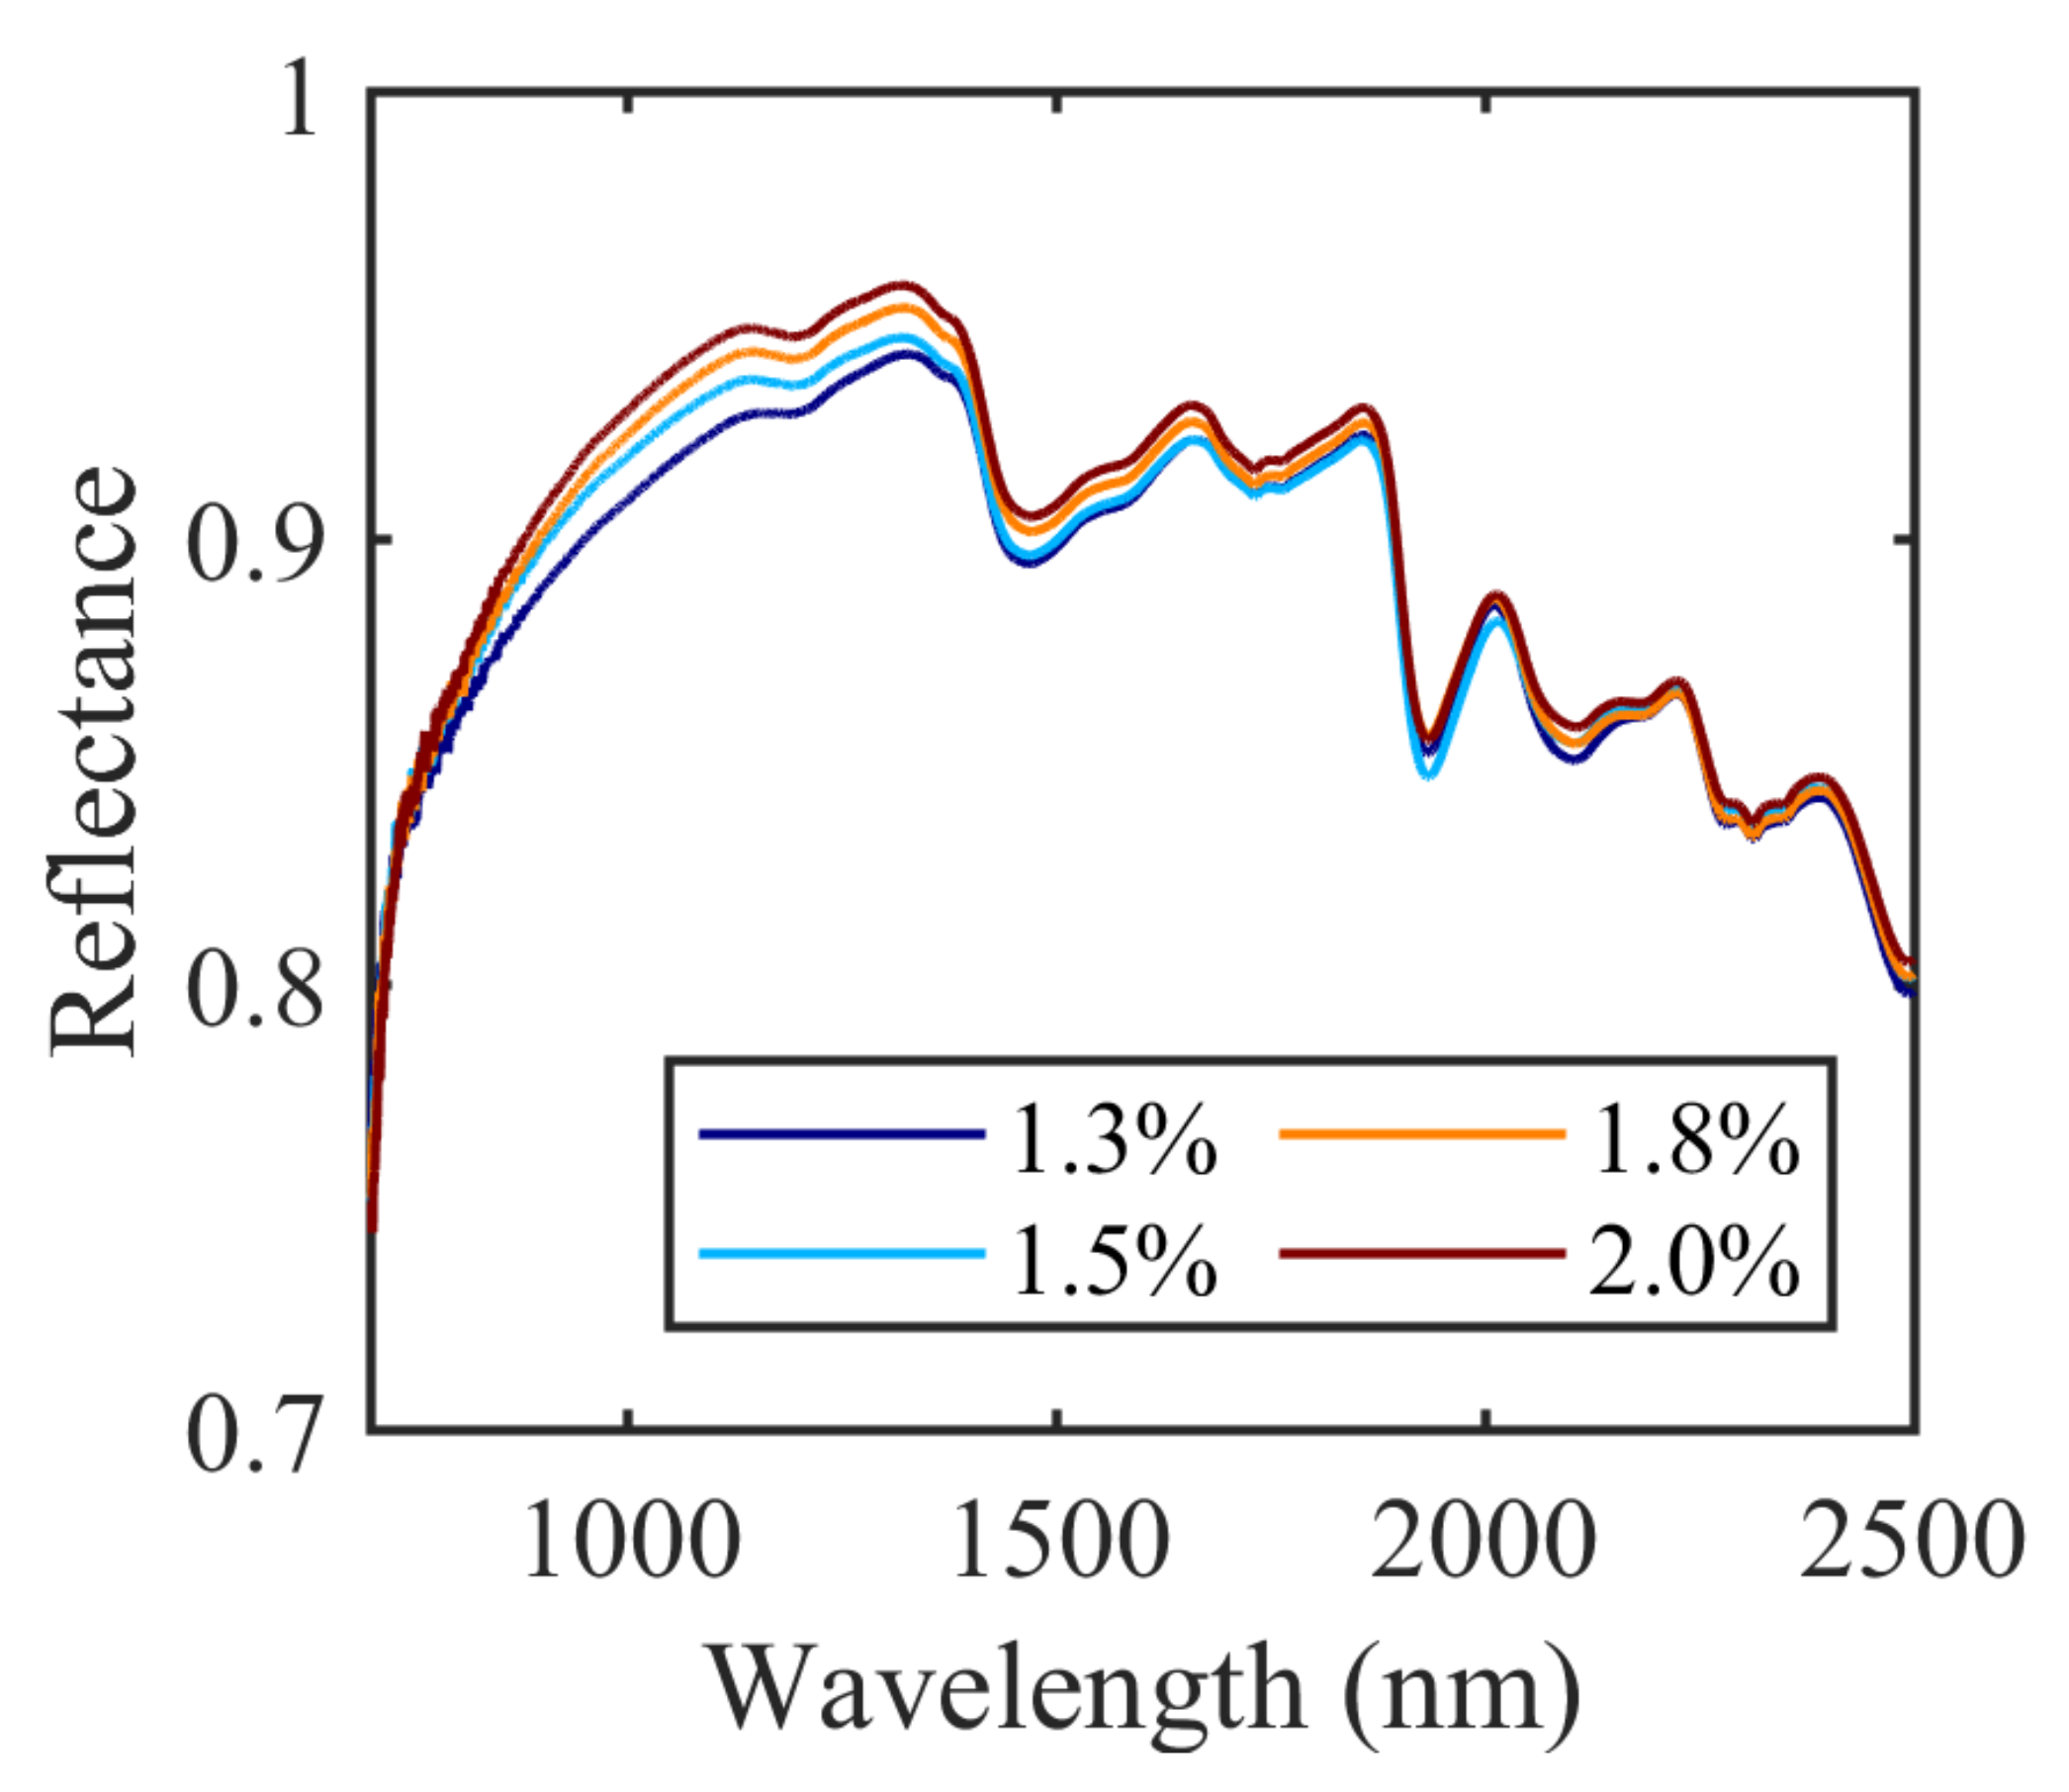
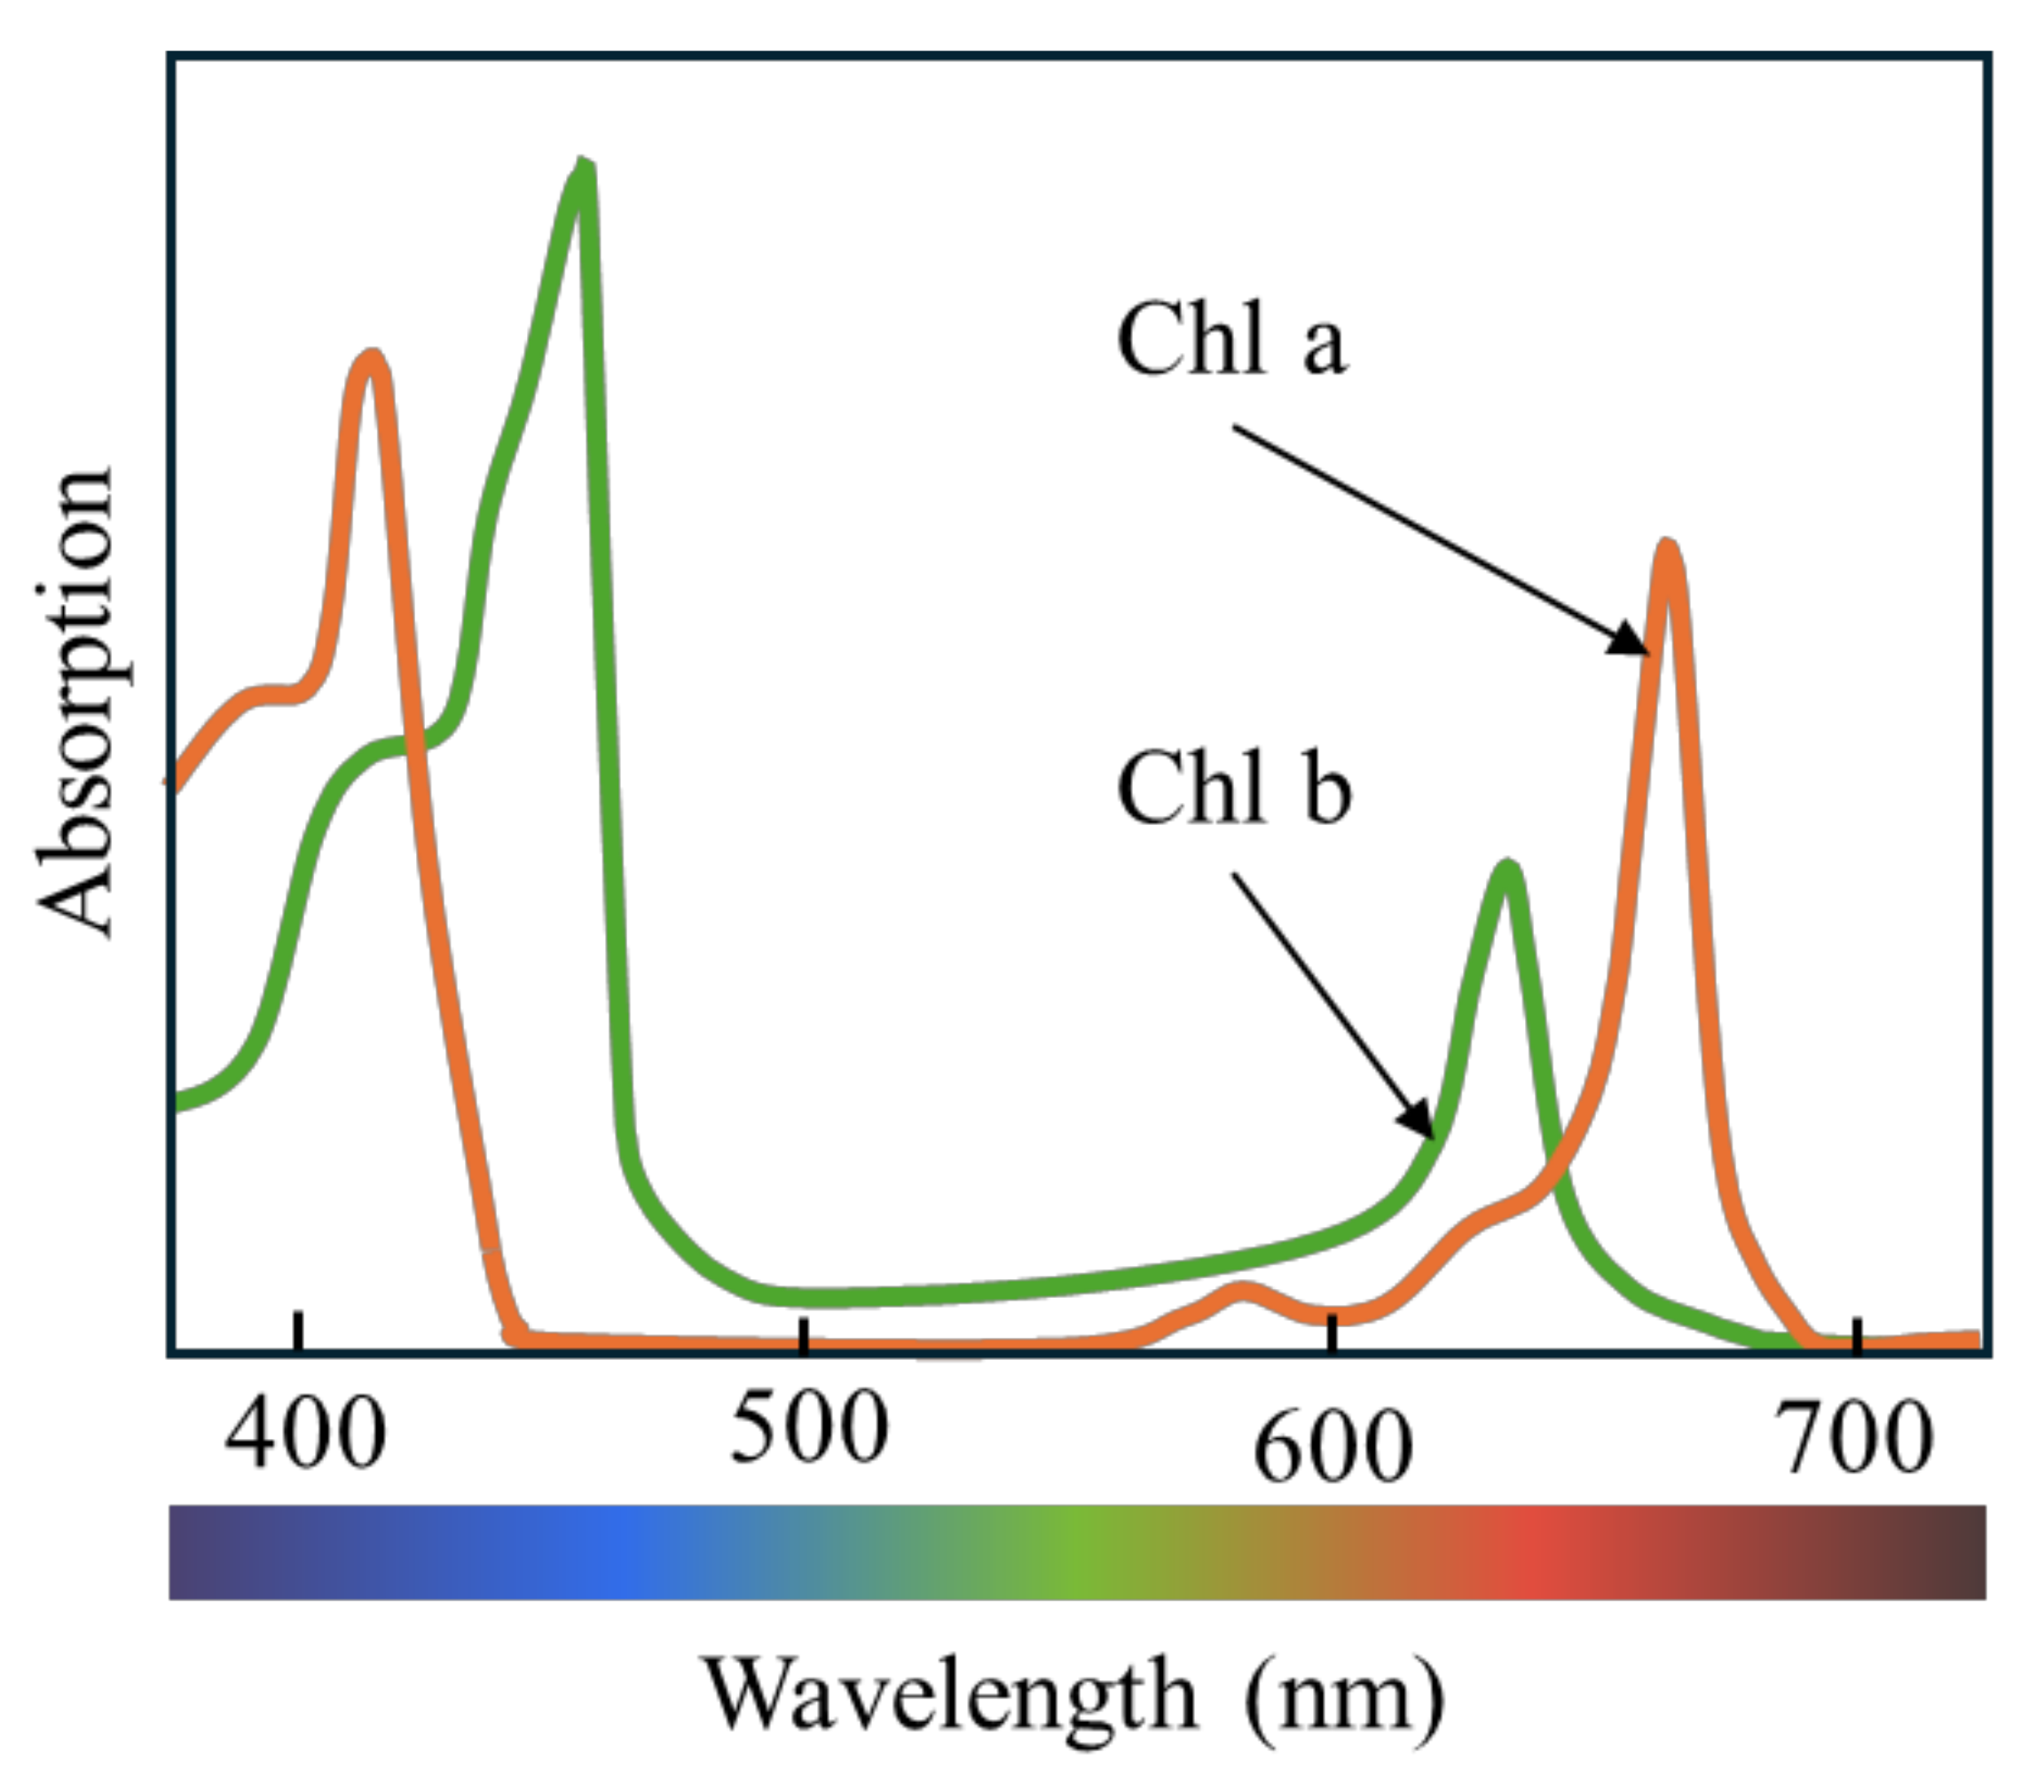
4.3. Relationship between Chl and N in Crops

Nitrogen is an essential element for crops and is involved in most biochemical processes, for example, to form Chl [54]. Chl is a photosynthetic pigment found in plants, algae, and cyanobacteria. The function of chlorophylls is to absorb sunlight to initiate an electrochemical potential across the photosynthetic membrane to reduce atmospheric carbon dioxide to carbohydrates. This conversion of light energy into chemical energy is made possible by the structure of chlorophylls [52]. The porphyrin macrocycle is the basic structure of chlorophylls and consists of four pyrrole rings. Each of the rings contains four C and one N linked by one carbon bridge. The four-N arrangement creates an ideal situation for binding metal ions in the center; in the case of chlorophylls, this is almost always Mg. Furthermore, chlorophylls normally have an additional five-membered fifth E-ring, and the C17 side chain is esterified by long-chain terpenoid alcohol (phytol, C20) [55]. Chlorophylls a, b, d, and f (Chl a, b, d, and f) are found in oxygenic organisms (i.e., crops). The best known is Chl a, which is present in all photosynthetic organisms except a group of bacteria and is essential for photosynthesis. Chl b is present in all higher plants and acts as an accessory to Chl a in photosynthesis. Chl a and b differ in structure, differing in the C7 side chain, with a methyl group (CH3) in Chl a and a formyl group (CHO) in Chl b. In vascular plants, Chl a and b are found in a 3:1 or 1:1 ratio depending on maturity and stress [52].

4.4. N and Biomass

The use of indicators related to crop N concentration has been commonly used to estimate the N nutritional status of crops. Quemada et al. [56] used hyperspectral imagery to determine crop N status and predict maize yield at flowering. Wang et al. [57] applied machine learning algorithms with hyperspectral imagery to detect maize N deficiency and end-season yield. This estimation is based on the concept of the critical N dilution curve, a crop diagnostic approach based on the allometry between N uptake dynamics and biomass accumulation in crops [58]. For example, the use of the biomass of the whole crop as a predictor of the dilution trend of N concentration in the crop in the field has been widely used. This is because N used by the crop is based on absorption, assimilation, and subsequent translocation to the grain. Therefore, during the growing season, there is a decrease in the concentration of N [59].

5. Extracting Phenotypic Traits from UAV Image

Raw image data taken by UAV platforms are not ready for extracting phenotypic traits. This section introduces basic knowledge on the data analytical process of extracting crop physiological traits from UAV images.

5.1. Georeferencing, Structure-from-Motion, and Radiometric Calibration

Each single image taken by UAV platforms has position and altitude information because they are equipped with a GNSS receiver and inertial measurement unit (IMU). However, most commercially available UAV platforms are not implemented with high-precision modules due to high economic cost, causing the systems to suffer from measurement errors of image position, altitude, and orientation estimates [60]. To overcome the problems of the inaccuracy of UAV image position and orientation, the Structure-from-Motion (SfM) technique in photogrammetry has generally been used. Briefly, the SfM technique first finds and matches key points from overlaps in the images and then obtains accurate position and orientation parameters based on bundle adjustments. Based on these accurate parameters, the SfM technique further reconstructs the surficial 3D point cloud captured in the scene. The UAV images are projected onto the 3D point cloud to develop a textured 3D model, which can be used for generating an orthomosaic. Precise georeferencing is key to generating high-quality orthomosaics with accurate spatial referencing. This can be achieved by providing accurately known geographic coordinates, so-called ground control points (GCPs), for tie points in SfM processing. However, setting GCPs in fields is laborious and time-consuming. Either real-time kinematic (RTK) or post-processing kinematic (PPK) enables accurate georeferencing for all UAV images, which is a preferable approach as it can eliminate the need for setting GCPs in the fields.
Optical image sensors including RGB, multispectral, and hyperspectral cameras record the radiant energy as pixel values in an image, the so-called DN. The illumination of the environment undergoes intensity and spectral changes during UAV image acquisition. To make the image data consistent and precise across or among the flight events, it is essential to convert the DN to surface reflectance through radiometric calibration. Radiometric calibration can be performed using a calibration panel and sunshine sensor generally provided with commercial multispectral and hyperspectral cameras from the manufacturers.
Currently, several software products, including Pix4D mapper (Pix4D, Prilly, Switzerland) and MetaShape (Agisoft LLC, St. Petersburg, Russia), are commercially available for SfM processing followed by radiometric calibration. The SfM technique is computationally extensive; thus, it is performed using a workstation. But several companies provide cloud-based processing services including the Pix4D cloud (Pix4D, Prilly, Switzerland) and DJI Terra (DJI, Shenzhen, China). Some bundled software for UAVs performs not only flight mission creation but also PPK processing for every image’s data that enables eliminating GCPs. For instance, the software eMotion (AgEagle, Wichita, KS, USA) is developed for processing data from the fixed-wing drone ‘eBee’ series, and DJI Terra is compatible with their enterprise UAVs. The manufacturers developed seamless and convenient software for their own UAV and sensing products. Meanwhile, KlauPPK (Klau Geomatics, Nowra, NSW, Australia) provides a unique PPK toolkit and software that can be equipped with any combination of UAVs and cameras.

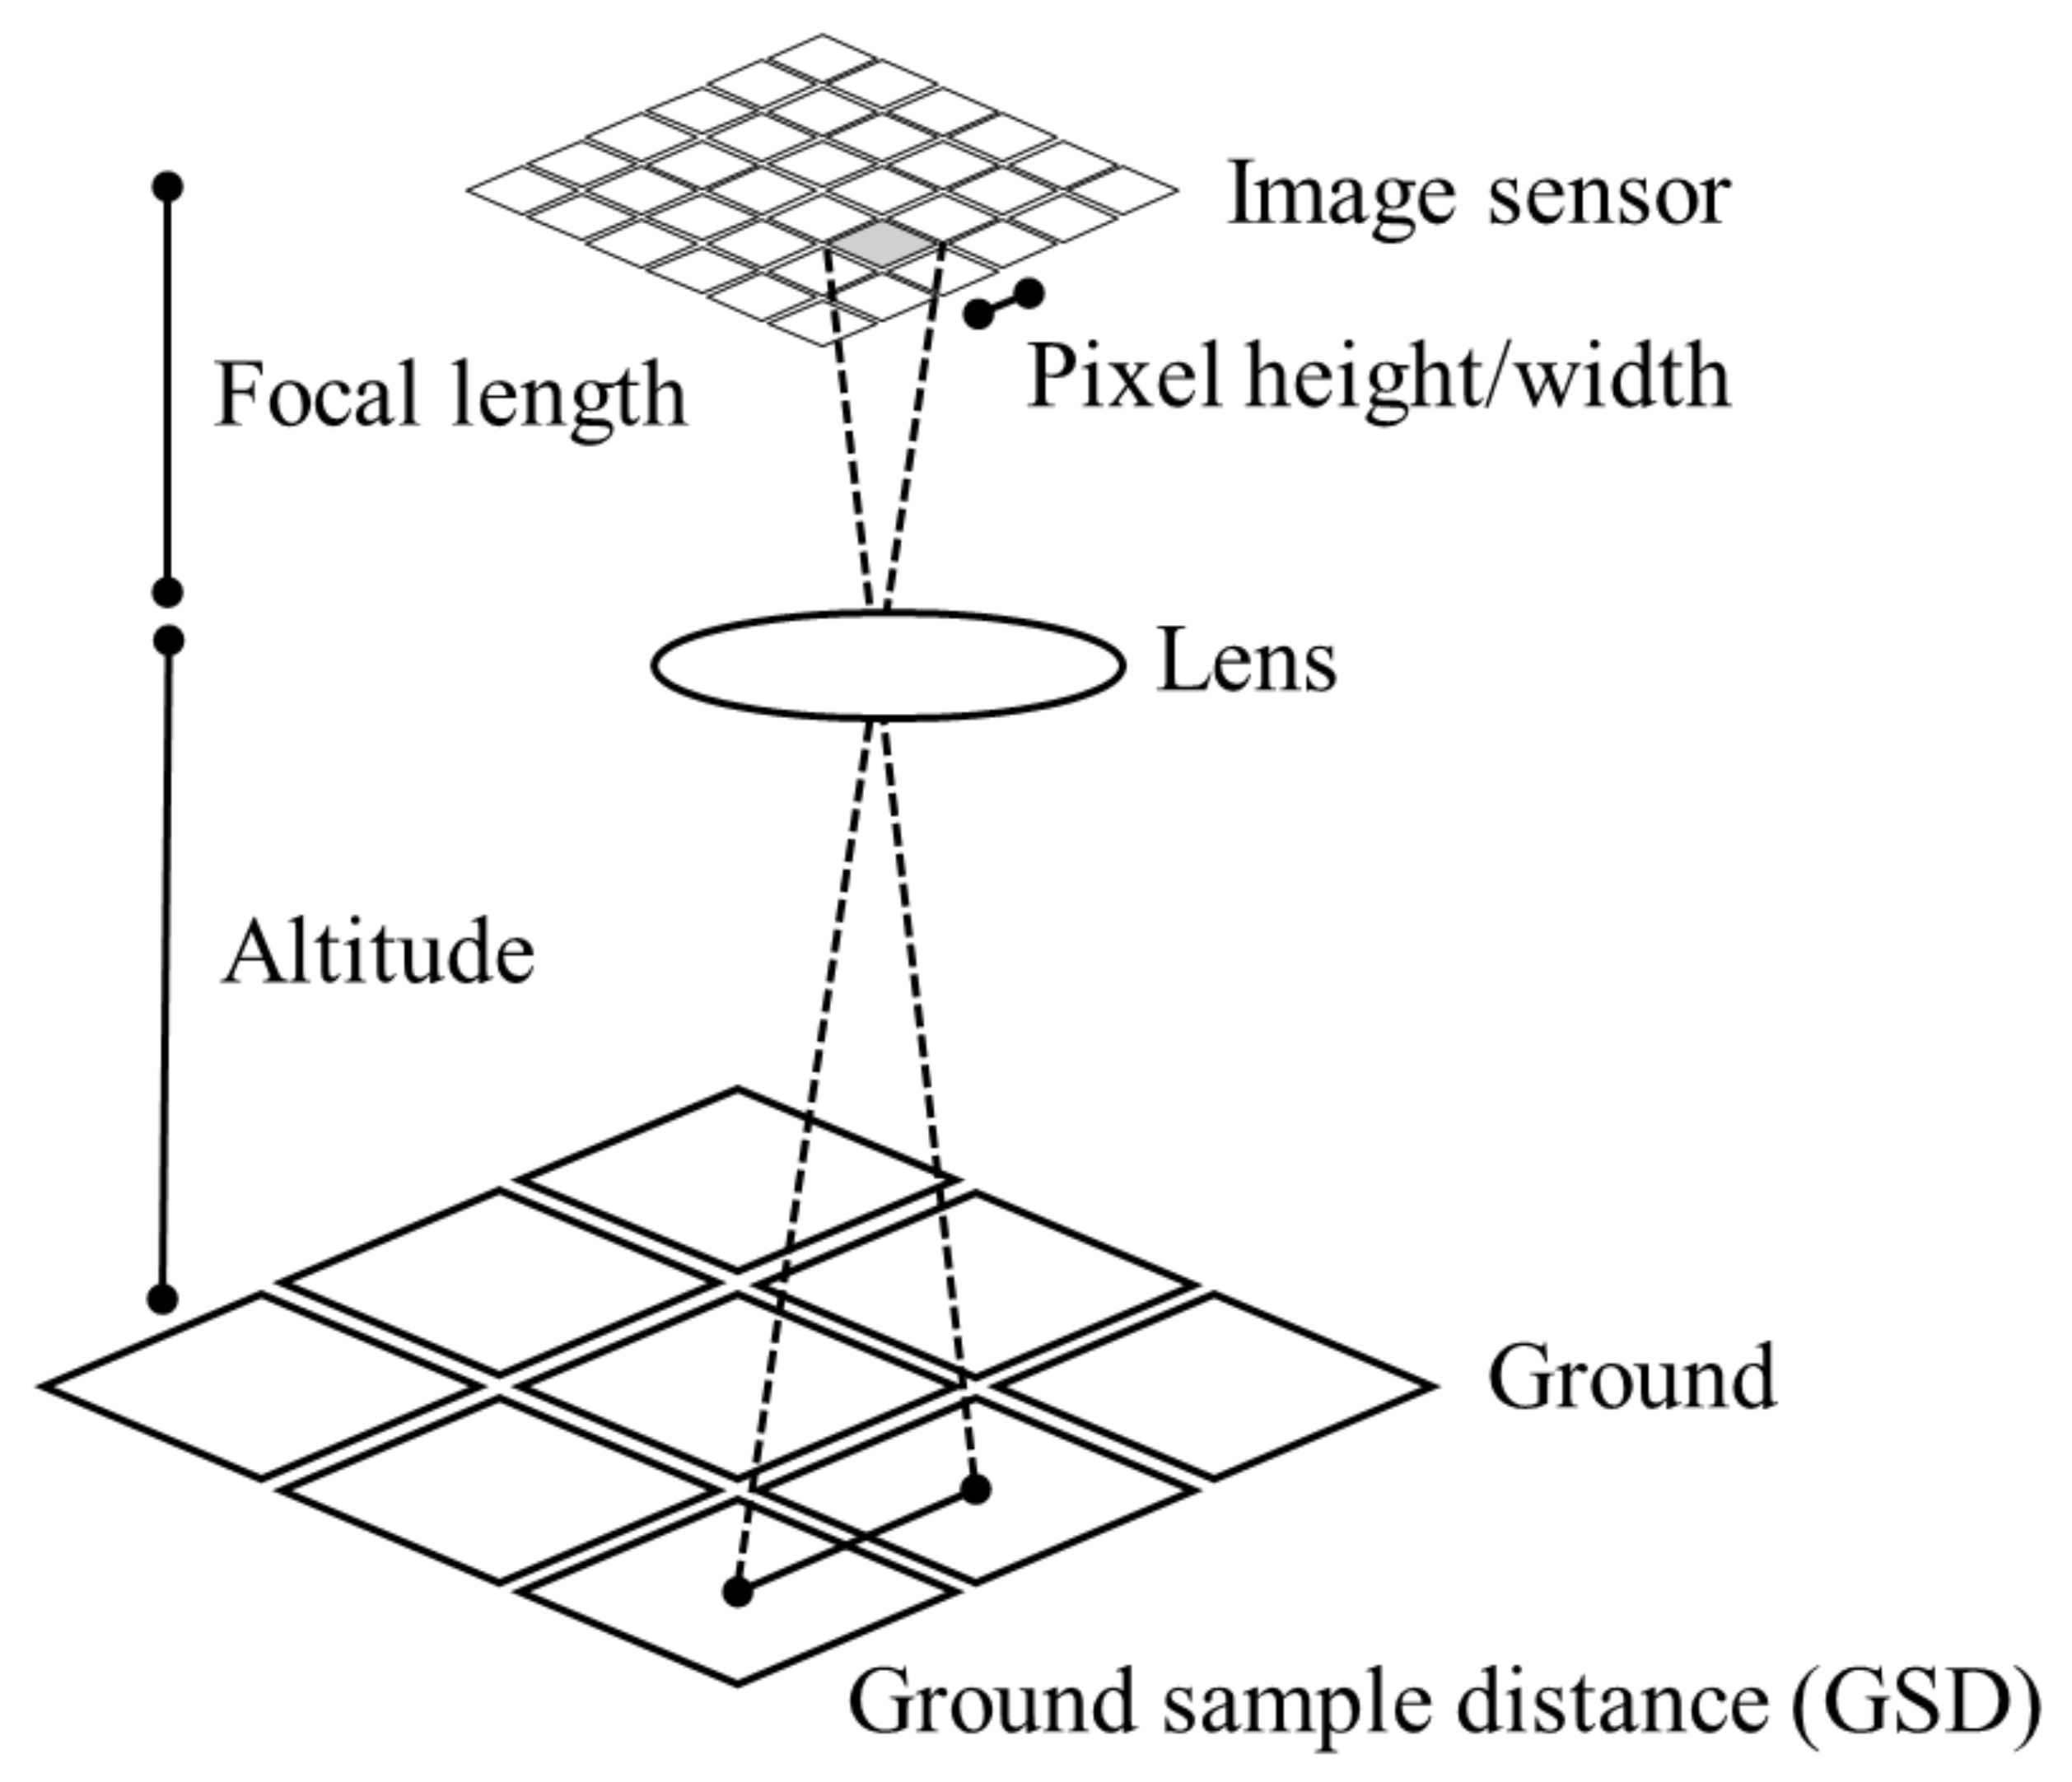
5.2. Ground Sampling Distance

Ground sampling distance (GSD) is a term used in remote sensing to describe the size of the smallest discernable feature in an image or dataset, measured in units of distance on the ground. It is a key parameter that describes the spatial resolution of a remote sensing system and is determined by the flight height (distance from the terrain) and camera specifications like sensor resolution, sensor size, and focal length (Figure 5). A smaller GSD indicates a higher spatial resolution, meaning that smaller features can be discerned in the image or dataset. It plays a crucial role in determining the level of detail that can be captured by the UAV’s sensors. The GSD is important in certain high-quality orthomosaics to obtain the digital surface model (DSM) [26,27]. The accuracies of orthomosaics generated by images taken from a UAV can be influenced by the GSD. Therefore, it is possible to reduce the GSD using a high-resolution camera or flying at low altitude, to improve the resolution of the obtained orthomosaic [61].

5.3. Region of Interest and Extracted Features

A region of interest (ROI) is a subset of an image identified for a specific objective, such as an experimental plot and destructively harvested area. An ROI is often defined as a polygon using GIS software. Basic statistics such as the mean and median pixel values are generally extracted from orthomosaics. The pixel values include the DN, surface reflectance, vegetation indices, surficial temperature, and elevation depending on the sensors, as described in Section 3.1, Section 3.2, Section 3.3, Section 3.4, Section 3.5 and Section 3.6. As UAV platforms can capture images with high spatial resolution, UAV images contain high spatial information. Therefore, not only basic statistics but also texture-based feature extraction methods are widely performed to extract values related to crop physiological traits [63]. The extracted values are further used as explanatory variables for developing prediction models for a particular response variable of crop physiological traits such as biomass, N content, and grain yield. Although the crop’s physiological traits might be more reliable if they are measured in a sufficiently large harvest plot, it is difficult to efficiently collect a large number of samples using a destructive sampling method. A recent study showed that even a single-harvested hill was sufficiently reliable for developing a UAV-based biomass prediction model, indicating that a small ROI might be more efficient for collecting ground truth data [64].

5.4. Data Analysis

It is well known that either vegetation indices or vegetation cover are strongly correlated with several crop physiological traits such as biomass, N content, and grain yield. An analysis of variance (ANOVA) has been applied for the vegetation indices to see the treatment effects [25,65]. Linear regression or empirical regression has also been traditionally used to develop prediction models using RGB and multispectral cameras [32,66,67]. Meanwhile, most of the recent studies have developed prediction models using machine learning techniques as they can model more complicated and non-linear relationships among the variables [28,68,69]. Given that sensors such as thermal and hyperspectral cameras other than RGB and multispectral cameras have been becoming more commercially available, recent studies have actively combined multimodal sensing platforms and machine learning techniques to enhance the mode performance. Support vector regression models performed the best among various model frameworks (i.e., partial least squares, neural network, and non-linear model regression) for evaluating the vigor of rapeseed seedlings [70]. Meanwhile, the prediction accuracies of the ensemble learning approach that stacks multiple base machine learning models outperformed each base model (i.e., ridge regression, support vector machine, random forest, Gaussian process, and K-neighbor network) when predicting the LAI, fresh weight, and biomass of maize [71]. For the classification or segmentation task, deep learning methods such as convolutional neural networks (CNNs) have been widely used to detect plant stands [72,73] and reproductive organs [74] and delineate the dominant areas of crops and weeds [75]. CNNs are also employed for regression tasks that can predict crop biomass [76] and yield [77,78].

6. Phenotypic Applications

A variety of phenotypic applications using UAV platforms is summarized from recent publications (2019–2024) in Table 2. The result covered 17 different types of crops and four different types of sensors. The GSD ranged from 0.2 to 31.25 cm pixel−1. More than ten different kinds of focus crop traits were predicted using various regression and classification algorithms and explanatory variables.

6.1. Chl and N

As mentioned, Chl and N are two parameters that are strongly related to crop nutrition. Their knowledge can be relevant for the prediction of yield or the need for fertilization. To quantify N concentration and absorption in the crop, a prototype multicamera system addressing the spectral region from 600 to 1700 nm was used [85]. For this purpose, a combination of bandpass filters was implemented to obtain two vegetation indices (GnyLi and Normalized Ratio Index). Subsequently, both indices were applied using data obtained from a single observation date, and crop heights were derived from UAV-based RGB image data. Based on these variables, regression models were developed that estimated N concentration and uptake among other parameters. The authors evaluated the relationships between vegetation indices and estimated crop traits (R2 = 0.57 to 0.66). Furthermore, the best predictor of N concentration was found to be dry biomass data (R2 = 0.65). Thus, the results showed how the multicamera system was suitable for estimating N concentration and uptake. However, the prediction accuracy is generally at a moderate level. Practitioners are suggested to validate the performance of developed prediction models to confirm whether the prediction error is acceptable for their experimental purposes.
Another study explored the potential of field phenotyping using a UAV coupled to a multispectral camera to evaluate the PROSAIL model and estimate rice and oilseed rape crop biomass [81]. For this purpose, multispectral images and field measurements of leaf and canopy Chl content during crop growth were collected. The authors observed how multispectral image coupling successfully recovered leaf and canopy Chl content in rice (root-mean-square error (RMSE) = 5.40 μg cm−2 and 43.50 μg cm−2, respectively). In addition, they observed how canopy Chl content gave a good estimate of biomass in rice (R2 = 0.92, RMSE = 0.22 kg m−2).

6.2. Height and Lodging

Plant height (PH) is an important trait in the screening of most crops. It represents a significant indicator for predicting yield, biomass, and lodging severity. It is also an important trait in plant breeding, as it can provide insight into how genotype and environmental variations influence plant growth [26]. Manual PH measurements are easy but can be labor-intensive and time-consuming. UAVs can increase the temporal resolution of PH data collection. Several studies demonstrate the effectiveness of using UAVs to determine crop height in the field at various stages throughout development. Tirado et al. [80] and Volpato et al. [26] show how RGB images collected from UAVs can successfully be used for estimating PH by applying the SfM technique. This enables the generation of 3D point clouds that can be used to reconstruct multitemporal crop surface models from which PH can be estimated [26]. Wilke et al. [66] applied the SfM technique using an RGB camera to quantify lodging percentage and lodging severity, based on canopy height models on Barley, demonstrating that UAV-based PH can be highly correlated with manually determined PH collected with a measuring ruler in the field. The approach developed for lodging percentage assessment in this study provided very high accuracy in breeding trials (R2 = 0.96, RMSE = 7.66%) leading to an overestimation of 2% when applied to a classical farmer field. Furthermore, Tan et al. [28] successfully discovered an efficient way to assess the lodging severity in grass seed crops, by extracting two types of features from individual plot images captured with an RGB camera: the histogram of oriented gradients (HOG) feature and canopy height. The results showed that the HOG feature and height distribution achieved an accuracy of 71.9% and 79.1%, respectively.

6.3. Biomass and Yield

Biomass is one of the significant indicators to reflect light use efficiency and crop growth, and numerous studies were able to predict biomass through UAV imagery. In a study in Senegal with a sorghum crop, the biomass of different sorghum varieties grown under two different water supply conditions (water stress and adequate irrigation) was evaluated [65]. Weekly, from emergence to maturity, drones were flown, and then destructive samples were taken. Vegetation indices derived from multispectral sensing on board a UAV platform showed their ability to estimate biomass. In particular, the NDVI (R2 = 0.60) was the best predictor. The developed models were validated with data from the following year (R2 = 0.91). Note that the NDVI value tends to saturate in high-biomass regions [87]. Thus, the NDVI-based regression model is not favorable for predicting high biomass and yield accurately. The use of UAVs was also used to assess wheat, barley, and triticale biomass for bioethanol production [67]. Multitemporal UAV images were taken by a six-band camera along different phenological stages of the crop, and orthomosaic images were generated. The images were then analyzed with an object-based algorithm, and vegetation indices were calculated. Finally, a statistical analysis of spectral data and bioethanol-related variables was performed. For biomass estimation, the vegetation indices studied were based on the NIR band. The average values of each vegetation index obtained during full crop growth were the most accurate for biomass estimation. Additional research aimed at estimating oat biomass using vegetation indices derived from high-resolution UAV imagery found a positive correlation at two of the three sites studied [68]. Approximately 70% of the variance was explained by the random forest, support vector machine, and partial least squares models for biomass prediction. However, distinctively different plant physical properties were found even in the same crop probably due to the different environments. This indicated that additional sampling from multiple experimental years might be needed to enhance the model prediction performance. This further indicated that the use of a single algorithm may not be sufficient for accurate biomass monitoring. Another study evaluated the effect of organic matter application in growing maize on biomass [29]. To conduct this, they created 3D surface models from high-resolution RGB UAV images before crop emergence and during crop development. Maize height was estimated, and regression models were used to predict aerial biomass. The generalized additive model was found to be the most efficient (R2 = 0.9), followed by the power model and finally the exponential model. The results showed that biomass measurements have a strong correlation with UAV-estimated corn height (R2 = 0.83–0.92). Along these lines, another study predicted biomass from canopy height data in rice [30]. Parameters related to canopy height were calculated with a non-linear time series model. The time point of the maximum canopy height contributed to the prediction of days to bolting and was able to predict stem weight, leaf weight, and aboveground weight. This probably reflects the association of biomass with the duration of vegetative growth.
Yield is one of the most desirable factors to predict because of its direct relationship with economic benefits. In a study conducted under low-N conditions, maize yield was assessed using remotely sensed indices derived from RGB images, together with the NDVI [32]. It was observed that the GGA and crop senescence index correlated better with grain yield from the UAV than the other RGB-based vegetation indices such as a*, b*, and GA. Another study evaluated the use of RGB cameras, thermal cameras, and NDVI sensors for the field phenotyping and forage yield assessment of alfalfa [33]. It was observed that the NDVI showed exponential and positive relationships with forage yield. In addition, RGB indices of intensity, saturation, and the greenest area were highly correlated with yield for both hydric states. The use of thermal cameras to obtain canopy temperature was also evaluated. The stress degree day (difference between canopy temperature and air temperature) was negatively related to forage yield. Another study focused on evaluating genotypic differences in yield using thermal, multispectral, and RGB cameras coupled to a UAV confirms that RGB images are good tools for accessing crop yield [37]. As for hyperspectral cameras, a study assessing yield in maize demonstrated the ability of UAV spectral imagery to assess maize yield under full and deficit irrigation [79]. Yield prediction models were evaluated at different stages of maize development, with the best model using reproductive stage 2 (R2 = 0.73). Furthermore, the spectral models allowed the authors to distinguish between different developmental stages and irrigation treatments. This would potentially allow them to estimate the experimental treatment effects on corn yield nondestructively.
In addition to the effort of data fusion integrating multiple sensing data and the combination of temporal sensing data into the modeling, several studies attempted to enhance model prediction accuracy using CNN models. CNNs can extract spatial features directly from the canopy image that might be related to crop yield rather than simply taking average or median values from the entire pixels in the image. Nevavouri et al. [78] indicated a higher yield prediction performance of CNN models based on RGB images compared to the conventional NDVI-based algorithm in wheat and barley production. Another study on wheat yield prediction indicated that although the RMSE values decreased by approximately 0.06 t ha−1 in the CNN model compared to the linear regression model based on the vegetation index (i.e., enhanced vegetation index 2), the degree of the prediction accuracy improvement in the CNN was not substantial [77]. The most recent work developed soybean yield prediction using multitemporal UAV-based RGB images and more complicated CNN models, but the most efficient model showed a moderate yield prediction accuracy (R2 = 0.6) [82]. A CNN generally requires hundreds or thousands of training datasets, which may hinder practical phenotyping applications.

6.4. LAI

The LAI is defined as the ratio of the total leaf area of a crop to the area of soil on which it is established. Predicting the LAI can be of interest because of its relationship to photosynthesis, crop nutritional status, canopy cover, and yield. The LAI together with canopy cover values were extracted from an RGB camera for soybean [31]. In a study under Mediterranean climate conditions with different varieties of forage alfalfa and two different irrigated scenarios, the LAI was assessed using RGB, a thermal camera, and an NDVI sensor [33]. As was the case for forage yield in the same study (Section 6.3), the NDVI also showed positive and exponential relationships with the LAI. In general, similar findings were observed for forage yield, where indices, such as intensity, saturation, a*, u*, and greenest area obtained from RGB images, were highly correlated with the LAI in both water situations. Another study in Senegal with sorghum under two water treatments used UAV-derived vegetation indices to estimate the leaf index area [65]. The vegetation indices estimated from the multispectral images showed similar results to those mentioned above for biomass for the same study (Section 6.3). The NDVI showed a good prediction of the LAI (R2 = 0.83), and as with biomass (R2 = 0.60), the models were validated with the following year’s data (R2 = 0.92 for LAI and R2 = 0.91 for biomass). In a study whose main objective was to predict the biomass of rice and oilseed rape, the results showed that the LAI obtained by coupling multispectral images using the PROSAIL model recovered as well (mean square error = 1.13 μg cm−2) as that observed in the same study for Chl (Section 6.1) in the case of rice [81].

6.5. Plant Number and Area Cover

Plant density is a significant agronomic factor in agriculture, affecting various aspects such as water and fertilizer needs, intraspecific competition, and the occurrence of weeds or pathogens. Therefore, it is a crucial factor to consider for optimal crop management. Thereby, an efficient high-throughput phenotyping of plant density is crucial for making informed decisions in precision farming and breeding. Wilke et al. [66] were able to determine plant density with a high prediction accuracy for barley and wheat (R2 > 0.91) estimating fractional cover from UAV multispectral image data. The fractional cover was assessed by calculating two vegetation indices including excess green minus excess red and the NDVI. BBCH stages 13 and 12 were identified as the most suitable plant development stages for UAV data acquisition, as there is more overlap between neighboring plants in the later growth stages. The results showed that plant density was predicted with uncertainties of less than 10%. The study also showed that the prediction accuracy slightly declined for multispectral images having a higher GSD. If the image spatial resolution is high enough to identify individual plants visually, CNN models enable precise plant counting [72,73]. In the case of seedling detection, object detection algorithms can be implemented using You only look once (YOLO). A relatively small number of annotations (i.e., 100–200 pictures) can achieve precise object detection performance using transfer learning techniques for the pre-trained YOLO models [88].

7. Discussions

Previous holistic review papers have highlighted both the challenges and potentials of UAV-based phenotyping for practical uses [6,7,8,9]. First, the data quality of UAV images is variable from various factors, including illumination conditions, sensor characteristics, and payload limitations. Therefore, optimizing flight and sensor parameters, such as flight speed, height, overlaps, and sensor calibration, has been a crucial topic, and standardized software and protocols were highly required. However, as described in Section 5.1, UAV and sensor manufacturers endeavored to create seamless software for each sensing platform, and some software even has the function of cloud-based processing. The RTK/PPK system is becoming a default implementation for UAV sensing platforms, which enables eliminating the GCPs’ setting. Furthermore, those protocols are generally well documented, although slight modification is needed depending on practitioners’ purposes. With the use of a single sensing platform, optimizing flight/sensor parameters and standardizing protocols are no longer major constraints for UAV-based phenotyping. Meanwhile, several studies have demonstrated the advantages of integrating multiple sensors for UAV-based phenotyping [70,71]. Multiple sensors physically can be mounted on the UAV due to the advancement of battery and payload capability. However, it is noteworthy that each sensor has different optimal parameters, which may make it difficult to collect high-quality image data all at once. Depending on the experimental objectives, practitioners should keep in mind that data quality and work efficiency should be balanced.
Although the data collection and processing workflow using a specific sensing platform is standardized, it remains challenging to develop protocols standardizing image data collected from different sensing platforms. As shown in Figure 2, each optical camera has somewhat different specifications of band wavelengths. This problem is even more serious when several researchers collaboratively work with each other as they often use different types of sensing platforms under different flight environments. Furthermore, as new models of commercially available cameras are released rapidly, practitioners may not be able to use the image and ground truth data collected in the previous experimentations directly for the following seasons if they purchase a new camera. Given that a data-driven approach based on machine learning and deep learning techniques will be more frequently used for field phenotyping, a protocol standardizing a collected dataset is key for maintaining data quality while accumulating datasets from multiple experimentations. Due to academic journals and the high demand for sharing UAV-based phenotyping datasets, it is becoming a new standard to store collected data in open data repositories. The methodologies and conditions of data collection should be documented in detail because that information is important for applying data standardization. Thus, more attention should be paid to data articles describing relevant methodologies for data repositories not only from the perspective of academic novelty. However, such big data will involve great efforts of manual data merging and cleansing in the near future. So far, the necessity of interoperability (data transfer and communication without human interference) among devices has been a pivotal issue in digital agriculture [89]. Most of the IoT (Internet of Things) devices, such as weather stations and sensors for soil moisture and soil electrical conductivity, generate tabular or vector data. Meanwhile, UAV-based phenotyping technologies generate more complicated two- or three-dimensional datasets with different spatiotemporal resolutions. This will raise the necessity of developing efficient and easy-to-use data transfer and sharing technologies specifically for UAV-based phenotypic datasets from multiple data repositories or research outputs.
Hyperspectral or multimodal sensing is a current research trend in UAV-based phenotyping. Increases in spatial and temporal resolution may also contribute to enhancing the capability of UAV-based phenotyping. However, researchers should note that the more complexity increases in data collection and model architecture, the more it costs the practitioners to implement. A higher model complexity and finer spatiotemporal resolution of UAV remote sensing did not necessarily improve crop yield prediction accuracy in deep learning models [77,82]. Furthermore, although deep learning models outperformed traditional statistical and machine learning models, the degree of model performance improvements is sometimes not substantial, and the ultimate model performance generally scored at the moderate level. UAV-based phenotyping may not be able to replace all the conventional destructive sampling and in-field manual scouting methods. Rather than just having extreme expectations of UAV-based phenotyping, it might be necessary to find a solution based on the assumption that the conventional methods are also partially employed in field experiments. Furthermore, a recent study demonstrated the importance of integrating not only UAV-based phenotypic data but also multiple sub-target crop physiological traits into a deep learning model to predict the main-target trait of rice biomass [90]. The proposed deep learning model is expected to improve the prediction accuracy for a specific response variable (i.e., biomass) and facilitate an understanding of the effect of other sub-target crop physiological traits (i.e., LAI, height, and tiller numbers) on the main-target trait. Thus, it might be one of the solutions for the limitations of the accuracy and interpretability of UAV-based phenotyping to utilize multiple sub-target ground truth crop physiological traits in the modeling. This review paper presented how the UAV-based phenotyping technique can quantify crop physiological parameters by introducing the principal theories and real applications. This will undoubtfully help the hypothesis generation of what crop physiological traits should be taken into account for developing precise and interpretable machine learning models beneficial for crop breeding. Future studies on UAV phenotyping and machine learning should focus not only on the prediction accuracy but also on interpretability of collected data.
Expanding the application of UAV-based phenotyping in minor crops or mixed cropping will be a prospective research direction. In this paper, it was found that most of the recent publications still focused only on major crops such as wheat, maize, rice, and soybean under a monoculture condition. Minor crops, such as buckwheat, lentils, and chickpeas, are expected to be a new protein source for humans. Given the necessity of mitigating the impact of modern agriculture on global warming and the resultant effect of climate change on cropping systems, accelerating the breeding programs for minor crops will be more emergent than before. Although UAV-based phenotyping can contribute to facilitating crop breeding, minor crops were less focused on. Furthermore, intercropping is becoming a hot research topic in the EU due to the high demand for chemical usage reduction aimed for by the EU Green Deal [91]. Under the intercropping conditions, favorable crop physiological traits could differ from the monoculture system. The development of UAV-based phenotyping technologies for the intercropping system will be more challenging than the monoculture system, but deep learning techniques that can automatically identify differences between crops and weed [75] might be one of the solutions for that.

8. Conclusions

UAV-based remote sensing has been widely used in recent studies on field phenotyping. Various seamless and useful software for UAV image analysis has been developed in the past few years, while the parameters of the UAV flight and sensor are well documented in the protocols. This contributed to simplifying the task of UAV-based phenotyping substantially. The integration of multiple sensors, such as multispectral/hyperspectral, thermal, and LiDAR sensors, together with machine learning algorithms has been one of the most popular research topics in this field. Some studies successfully demonstrated the high predictive performance of UAV-based phenotyping such as scouting individual plant numbers and fractional cover, but others showed moderate performance, especially for biomass and yield estimation. Future research directions should focus on enhancing data interpretability to boost physiological understanding among multiple variables rather than simply improving the prediction performance of crop structural and physiological traits. Given a rapid increase in UAV-based phenotypic studies implementing data-hungry deep learning algorithms, standardization for data merging protocols from multiple research projects or repositories is also becoming increasingly important.

Author Contributions

Conceptualization, J.R.J. and R.G.; methodology, A.K.M. and B.D.B.; investigation, T.S.T.T., S.W., B.D.B. and M.G.; writing—original draft preparation, T.S.T.T., S.W., J.R.J., M.G., A.Z.V., A.K.M., B.S.A. and R.G.; writing—review and editing, B.D.B. and R.G.; visualization, T.S.T.T., A.K.M. and M.G.; supervision, R.G.; project administration, R.G.; funding acquisition, M.G. and R.G. All authors have read and agreed to the published version of the manuscript.

Funding

This research was funded by Innovationskraft 2023, 1022-00005B and Erasmus+ (European Action Scheme for the Mobility of University Students).

Data Availability Statement

Data are contained within the article.

Conflicts of Interest

The authors declare no conflicts of interest.

References

  1. Tilman, D.; Balzer, C.; Hill, J.; Befort, B.L. Global food demand and the sustainable intensification of agriculture. Proc. Natl. Acad. Sci. USA 2011, 108, 20260–20264. [Google Scholar] [CrossRef]
  2. Araus, J.L.; Cairns, J.E. Field high-throughput phenotyping: The new crop breeding frontier. Trends Plant Sci. 2014, 19, 52–61. [Google Scholar] [CrossRef]
  3. Araus, J.L.; Kefauver, S.C. Breeding to adapt agriculture to climate change: Affordable phenotyping solutions. Curr. Opin. Plant Biol. 2018, 45, 237–247. [Google Scholar] [CrossRef]
  4. Reynolds, M.; Chapman, S.; Crespo-Herrera, L.; Molero, G.; Mondal, S.; Pequeno, D.N.L.; Pinto, F.; Pinera-Chavez, F.J.; Poland, J.; Rivera-Amado, C.; et al. Breeder friendly phenotyping. Plant Sci. 2020, 295, 110396. [Google Scholar] [CrossRef]
  5. Wang, S.; Garcia, M.; Ibrom, A.; Bauer-Gottwein, P. Temporal interpolation of land surface fluxes derived from remote sensing—Results with an unmanned aerial system. Hydrol. Earth Syst. Sci. 2020, 24, 3643–3661. [Google Scholar] [CrossRef]
  6. Sankaran, S.; Khot, L.R.; Espinoza, C.Z.; Jarolmasjed, S.; Sathuvalli, V.R.; Vandemark, G.J.; Miklas, P.N.; Carter, A.H.; Pumphrey, M.O.; Knowles, N.R.; et al. Low-altitude, high-resolution aerial imaging systems for row and field crop phenotyping: A review. Eur. J. Agron. 2015, 70, 112–123. [Google Scholar] [CrossRef]
  7. Feng, L.; Chen, S.; Zhang, C.; Zhang, Y.; He, Y. A comprehensive review on recent applications of unmanned aerial vehicle remote sensing with various sensors for high-throughput plant phenotyping. Comput. Electron. Agric. 2021, 182, 106033. [Google Scholar] [CrossRef]
  8. Yang, G.; Liu, J.; Zhao, C.; Li, Z.; Huang, Y.; Yu, H.; Xu, B.; Yang, X.; Zhu, D.; Zhang, X.; et al. Unmanned Aerial Vehicle Remote Sensing for Field-Based Crop Phenotyping: Current Status and Perspectives. Front. Plant Sci. 2017, 8, 1111. [Google Scholar] [CrossRef]
  9. Xie, C.; Yang, C. A review on plant high-throughput phenotyping traits using UAV-based sensors. Comput. Electron. Agric. 2020, 178, 105731. [Google Scholar] [CrossRef]
  10. Priyanka, G.; Choudhary, S.; Anbazhagan, K.; Naresh, D.; Baddam, R.; Jarolimek, J.; Parnandi, Y.; Rajalakshmi, P.; Kholova, J. A step towards inter-operable Unmanned Aerial Vehicles (UAV) based phenotyping; A case study demonstrating a rapid, quantitative approach to standardize image acquisition and check quality of acquired images. ISPRS Open J. Photogramm. Remote Sens. 2023, 9, 100042. [Google Scholar] [CrossRef]
  11. Das, S.; Chapman, S.; Christopher, J.; Choudhury, M.R.; Menzies, N.W.; Apan, A.; Dang, Y.P. UAV-thermal imaging: A technological breakthrough for monitoring and quantifying crop abiotic stress to help sustain productivity on sodic soils—A case review on wheat. Remote Sens. Appl. Soc. Environ. 2021, 23, 100583. [Google Scholar] [CrossRef]
  12. Wen, T.; Li, J.H.; Wang, Q.; Gao, Y.Y.; Hao, G.F.; Song, B.A. Thermal imaging: The digital eye facilitates high-throughput phenotyping traits of plant growth and stress responses. Sci. Total Environ. 2023, 899, 165626. [Google Scholar] [CrossRef] [PubMed]
  13. Arya, S.; Sandhu, K.S.; Singh, J.; Kumar, S. Deep learning: As the new frontier in high-throughput plant phenotyping. Euphytica 2022, 218, 47. [Google Scholar] [CrossRef]
  14. Bazrafkan, A.; Delavarpour, N.; Oduor, P.G.; Bandillo, N.; Flores, P. An Overview of Using Unmanned Aerial System Mounted Sensors to Measure Plant Above-Ground Biomass. Remote Sens. 2023, 15, 3543. [Google Scholar] [CrossRef]
  15. Naito, H.; Ogawa, S.; Valencia, M.O.; Mohri, H.; Urano, Y.; Hosoi, F.; Shimizu, Y.; Chavez, A.L.; Ishitani, M.; Selvaraj, M.G.; et al. Estimating rice yield related traits and quantitative trait loci analysis under different nitrogen treatments using a simple tower-based field phenotyping system with modified single-lens reflex cameras. ISPRS J. Photogramm. 2017, 125, 50–62. [Google Scholar] [CrossRef]
  16. Mahlein, A.K. Plant Disease Detection by Imaging Sensors—Parallels and Specific Demands for Precision Agriculture and Plant Phenotyping. Plant Dis. 2016, 100, 241–251. [Google Scholar] [CrossRef] [PubMed]
  17. Zhang, C.; Kovacs, J.M. The application of small unmanned aerial systems for precision agriculture: A review. Precis. Agric. 2012, 13, 693–712. [Google Scholar] [CrossRef]
  18. Kim, J.; Kim, S.; Ju, C.; Son, H.I. Unmanned Aerial Vehicles in Agriculture: A Review of Perspective of Platform, Control, and Applications. IEEE Access 2019, 7, 105100–105115. [Google Scholar] [CrossRef]
  19. Boon, M.A.; Drijfhout, A.P.; Tesfamichael, S. Comparison of a Fixed-Wing and Multi-Rotor Uav for Environmental Mapping Applications: A Case Study. Int. Arch. Photogramm. Remote Sens. Spat. Inf. Sci. 2017, XLII-2/W6, 47–54. [Google Scholar] [CrossRef]
  20. Rahman, M.F.F.; Fan, S.; Zhang, Y.; Chen, L. A Comparative Study on Application of Unmanned Aerial Vehicle Systems in Agriculture. Agriculture 2021, 11, 22. [Google Scholar] [CrossRef]
  21. del Cerro, J.; Cruz Ulloa, C.; Barrientos, A.; de León Rivas, J. Unmanned Aerial Vehicles in Agriculture: A Survey. Agronomy 2021, 11, 203. [Google Scholar] [CrossRef]
  22. Reddy Maddikunta, P.K.; Hakak, S.; Alazab, M.; Bhattacharya, S.; Gadekallu, T.R.; Khan, W.Z.; Pham, Q.-V. Unmanned Aerial Vehicles in Smart Agriculture: Applications, Requirements, and Challenges. IEEE Sens. J. 2021, 21, 17608–17619. [Google Scholar] [CrossRef]
  23. Bandini, F.; Lopez-Tamayo, A.; Merediz-Alonso, G.; Olesen, D.; Jakobsen, J.; Wang, S.; Garcia, M.; Bauer-Gottwein, P. Unmanned aerial vehicle observations of water surface elevation and bathymetry in the cenotes and lagoons of the Yucatan Peninsula, Mexico. Hydrogeol. J. 2018, 26, 2213–2228. [Google Scholar] [CrossRef]
  24. Barbosa, B.D.S.; Ferraz, G.A.S.; Gonçalves, L.M.; Marin, D.B.; Maciel, D.T.; Ferraz, P.F.P.; Rossi, G. RGB vegetation indicies applied to grass monitoring: A qualitative analysis. Agron. Res. 2019, 17, 349–357. [Google Scholar] [CrossRef]
  25. Francesconi, S.; Harfouche, A.; Maesano, M.; Balestra, G.M. UAV-Based Thermal, RGB Imaging and Gene Expression Analysis Allowed Detection of Fusarium Head Blight and Gave New Insights Into the Physiological Responses to the Disease in Durum Wheat. Front. Plant Sci. 2021, 12, 628575. [Google Scholar] [CrossRef] [PubMed]
  26. Volpato, L.; Pinto, F.; Gonzalez-Perez, L.; Thompson, I.G.; Borem, A.; Reynolds, M.; Gerard, B.; Molero, G.; Rodrigues, F.A., Jr. High Throughput Field Phenotyping for Plant Height Using UAV-Based RGB Imagery in Wheat Breeding Lines: Feasibility and Validation. Front. Plant Sci. 2021, 12, 591587. [Google Scholar] [CrossRef] [PubMed]
  27. Wilke, N.; Siegmann, B.; Klingbeil, L.; Burkart, A.; Kraska, T.; Muller, O.; van Doorn, A.; Heinemann, S.; Rascher, U. Quantifying Lodging Percentage and Lodging Severity Using a UAV-Based Canopy Height Model Combined with an Objective Threshold Approach. Remote Sens. 2019, 11, 515. [Google Scholar] [CrossRef]
  28. Tan, S.Y.; Mortensen, A.K.; Ma, X.; Boelt, B.; Gislum, R. Assessment of grass lodging using texture and canopy height distribution features derived from UAV visual-band images. Agric. For. Meteorol. 2021, 308, 108541. [Google Scholar] [CrossRef]
  29. Gilliot, J.M.; Michelin, J.; Hadjard, D.; Houot, S. An accurate method for predicting spatial variability of maize yield from UAV-based plant height estimation: A tool for monitoring agronomic field experiments. Precis. Agric. 2020, 22, 897–921. [Google Scholar] [CrossRef]
  30. Taniguchi, S.; Sakamoto, T.; Imase, R.; Nonoue, Y.; Tsunematsu, H.; Goto, A.; Matsushita, K.; Ohmori, S.; Maeda, H.; Takeuchi, Y.; et al. Prediction of heading date, culm length, and biomass from canopy-height-related parameters derived from time-series UAV observations of rice. Front. Plant Sci. 2022, 13, 998803. [Google Scholar] [CrossRef]
  31. Roth, L.; Barendregt, C.; Bétrix, C.-A.; Hund, A.; Walter, A. High-throughput field phenotyping of soybean: Spotting an ideotype. Remote Sens. Environ. 2022, 269, 112797. [Google Scholar] [CrossRef]
  32. Buchaillot, M.L.; Gracia-Romero, A.; Vergara-Diaz, O.; Zaman-Allah, M.A.; Tarekegne, A.; Cairns, J.E.; Prasanna, B.M.; Araus, J.L.; Kefauver, S.C. Evaluating Maize Genotype Performance under Low Nitrogen Conditions Using RGB UAV Phenotyping Techniques. Sensors 2019, 19, 1815. [Google Scholar] [CrossRef] [PubMed]
  33. del Pozo, A.; Espinoza, S.; Barahona, V.; Inostroza, L.; Gerding, M.; Humphries, A.; Lobos, G.; Cares, J.; Ovalle, C. Aerial and ground-based phenotyping of an alfalfa diversity panel to assess adaptation to a prolonged drought period in a Mediterranean environment of central Chile. Eur. J. Agron. 2023, 144, 126751. [Google Scholar] [CrossRef]
  34. Rouse, J.W.; Haas, R.H.; Schell, J.A.; Deering, D.W. Monitoring Vegetation Systems in the Great Plains with ERTS. In Proceedings of the Third Earth Resources Technology Satellite-1 Symposium, Washington, DC, USA, 10–14 December 1973; pp. 309–317. Available online: https://ntrs.nasa.gov/citations/19740022614 (accessed on 10 May 2024).
  35. Gitelson, A.A.; Kaufman, Y.J.; Merzlyak, M.N. Use of a green channel in remote sensing of global vegetation from EOS-MODIS. Remote Sens. Environ. 1996, 58, 289–298. [Google Scholar] [CrossRef]
  36. Barnes, E.M.C.; Richards, S.E.; Colaizzi, P.D.; Haberland, J.; Kostrzewski, M.; Waller, P.; Choi, C.; Riley, E.; Thompson, T. Coincident detection of crop water stress, nitrogen status and canopy density using ground based multispectral data. In Proceedings of the Fifth International Conference on Precision Agriculture, Bloomington, MN, USA, 16–19 July 2000. [Google Scholar]
  37. Gracia-Romero, A.; Kefauver, S.C.; Fernandez-Gallego, J.A.; Vergara-Díaz, O.; Nieto-Taladriz, M.T.; Araus, J.L. UAV and Ground Image-Based Phenotyping: A Proof of Concept with Durum Wheat. Remote Sens. 2019, 11, 1244. [Google Scholar] [CrossRef]
  38. Wan, L.; Zhang, J.; Dong, X.; Du, X.; Zhu, J.; Sun, D.; Liu, Y.; He, Y.; Cen, H. Unmanned aerial vehicle-based field phenotyping of crop biomass using growth traits retrieved from PROSAIL model. Comput. Electron. Agric. 2021, 187, 106304. [Google Scholar] [CrossRef]
  39. Candiago, S.; Remondino, F.; De Giglio, M.; Dubbini, M.; Gattelli, M. Evaluating Multispectral Images and Vegetation Indices for Precision Farming Applications from UAV Images. Remote Sens. 2015, 7, 4026–4047. [Google Scholar] [CrossRef]
  40. Saric, R.; Nguyen, V.D.; Burge, T.; Berkowitz, O.; Trtilek, M.; Whelan, J.; Lewsey, M.G.; Custovic, E. Applications of hyperspectral imaging in plant phenotyping. Trends Plant Sci. 2022, 27, 301–315. [Google Scholar] [CrossRef] [PubMed]
  41. Lu, B.; Dao, P.; Liu, J.; He, Y.; Shang, J. Recent Advances of Hyperspectral Imaging Technology and Applications in Agriculture. Remote Sens. 2020, 12, 2659. [Google Scholar] [CrossRef]
  42. Baluja, J.; Diago, M.P.; Balda, P.; Zorer, R.; Meggio, F.; Morales, F.; Tardaguila, J. Assessment of vineyard water status variability by thermal and multispectral imagery using an unmanned aerial vehicle (UAV). Irrig. Sci. 2012, 30, 511–522. [Google Scholar] [CrossRef]
  43. Giménez-Gallego, J.; González-Teruel, J.D.; Soto-Valles, F.; Jiménez-Buendía, M.; Navarro-Hellín, H.; Torres-Sánchez, R. Intelligent thermal image-based sensor for affordable measurement of crop canopy temperature. Comput. Electron. Agric. 2021, 188, 106319. [Google Scholar] [CrossRef]
  44. Lin, Y. LiDAR: An important tool for next-generation phenotyping technology of high potential for plant phenomics? Comput. Electron. Agric. 2015, 119, 61–73. [Google Scholar] [CrossRef]
  45. Christiansen, M.P.; Laursen, M.S.; Jorgensen, R.N.; Skovsen, S.; Gislum, R. Designing and Testing a UAV Mapping System for Agricultural Field Surveying. Sensors 2017, 17, 2703. [Google Scholar] [CrossRef] [PubMed]
  46. ten Harkel, J.; Bartholomeus, H.; Kooistra, L. Biomass and Crop Height Estimation of Different Crops Using UAV-Based Lidar. Remote Sens. 2019, 12, 17. [Google Scholar] [CrossRef]
  47. Acharya, B.S.; Bhandari, M.; Bandini, F.; Pizarro, A.; Perks, M.; Joshi, D.R.; Wang, S.; Dogwiler, T.; Ray, R.L.; Kharel, G.; et al. Unmanned Aerial Vehicles in Hydrology and Water Management: Applications, Challenges, and Perspectives. Water Resour. Res. 2021, 57, e2021WR029925. [Google Scholar] [CrossRef]
  48. Huang, X.D.; Reba, M.; Coffin, A.; Runkle, B.R.K.; Huang, Y.B.; Chapman, B.; Ziniti, B.; Skakun, S.; Kraatz, S.; Siqueira, P.; et al. Cropland mapping with L-band UAVSAR and development of NISAR products. Remote Sens. Environ. 2021, 253, 112180. [Google Scholar] [CrossRef]
  49. Nobel, P.S. Light. In Physicochemical and Environmental Plant Physiology; Nobel, P.S., Ed.; Academic Press: Cambridge, MA, USA, 2009. [Google Scholar]
  50. Bec, K.B.; Huck, C.W. Breakthrough Potential in Near-Infrared Spectroscopy: Spectra Simulation. A Review of Recent Developments. Front. Chem. 2019, 7, 48. [Google Scholar] [CrossRef] [PubMed]
  51. Kuska, M.T.; Behmann, J.; Mahlein, A.K. Potential of hyperspectral imaging to detect and identify the impact of chemical warfare compounds on plant tissue. Pure Appl. Chem. 2018, 90, 1615–1624. [Google Scholar] [CrossRef]
  52. Roca, M.; Chen, K.; Pérez-Gálvez, A. Chlorophylls. In Handbook on Natural Pigments in Food and Beverages: Industrial Applications for Improving Food Color; Carle, R.S.R.M., Ed.; Woodhead Publishing: Cambridge, UK, 2016; pp. 125–158. [Google Scholar]
  53. Gholizadeh, M.H.; Melesse, A.M.; Reddi, L. A Comprehensive Review on Water Quality Parameters Estimation Using Remote Sensing Techniques. Sensors 2016, 16, 1298. [Google Scholar] [CrossRef]
  54. Maheswari, M.; Murthy, A.N.G.; Shanker, A.K. Nitrogen Nutrition in Crops and Its Importance in Crop Quality. In The Indian Nitrogen Assessment: Sources of Reactive Nitrogen, Environmental and Climate Effects, Management Options, and Policies; Abrol, Y.P., Adhya, T.K., Aneja, V.P., Raghuram, N., Pathak, H., Kulshrestha, U., Sharma, C., Singh, B., Eds.; Elsevier: Amsterdam, The Netherlands, 2017; pp. 175–186. [Google Scholar]
  55. Chen, M. Photosynthesis: Chlorophylls. In Encyclopedia of Biological Chemistry; Lennarz, W.J., Lane, M.D., Eds.; Academic Press: Cambridge, MA, USA, 2021; Volume 2, pp. 157–162. [Google Scholar]
  56. Quemada, M.; Gabriel, J.L.; Zarco-Tejada, P. Airborne Hyperspectral Images and Ground-Level Optical Sensors As Assessment Tools for Maize Nitrogen Fertilization. Remote Sens. 2014, 6, 2940–2962. [Google Scholar] [CrossRef]
  57. Wang, S.; Guan, K.; Wang, Z.H.; Ainsworth, E.A.; Zheng, T.; Townsend, P.A.; Liu, N.F.; Nafziger, E.; Masters, M.D.; Li, K.Y.; et al. Airborne hyperspectral imaging of nitrogen deficiency on crop traits and yield of maize by machine learning and radiative transfer modeling. Int. J. Appl. Earth Obs. Geoinf. 2021, 105, 102617. [Google Scholar] [CrossRef]
  58. Li, X.Y.; Ata-UI-Karim, S.T.; Li, Y.; Yuan, F.; Miao, Y.X.; Yoichiro, K.; Cheng, T.; Tang, L.; Tian, X.S.; Liu, X.J.; et al. Advances in the estimations and applications of critical nitrogen dilution curve and nitrogen nutrition index of major cereal crops. A review. Comput. Electron. Agric. 2022, 197, 106998. [Google Scholar] [CrossRef]
  59. Zhang, K.; Ma, J.F.; Wang, Y.; Cao, W.X.; Zhu, Y.; Cao, Q.; Liu, X.J.; Tian, Y.C. Key variable for simulating critical nitrogen dilution curve of wheat: Leaf area ratio-driven approach. Pedosphere 2022, 32, 463–474. [Google Scholar] [CrossRef]
  60. Turner, D.; Lucieer, A.; Wallace, L. Direct Georeferencing of Ultrahigh-Resolution UAV Imagery. IEEE Trans. Geosci. Remote Sens. 2014, 52, 2738–2745. [Google Scholar] [CrossRef]
  61. Chawade, A.; van Ham, J.; Blomquist, H.; Bagge, O.; Alexandersson, E.; Ortiz, R. High-Throughput Field-Phenotyping Tools for Plant Breeding and Precision Agriculture. Agronomy 2019, 9, 258. [Google Scholar] [CrossRef]
  62. Jeziorska, J. Flight Planning GIS/MEA 584: Mapping and Analysis Using UAS. Available online: https://ncsu-geoforall-lab.github.io/uav-lidar-analytics-course/lectures/2017_Flight_planning.html#/ (accessed on 13 May 2024).
  63. Wang, F.M.; Yi, Q.X.; Hu, J.H.; Xie, L.L.; Yao, X.P.; Xu, T.Y.; Zheng, J.Y. Combining spectral and textural information in UAV hyperspectral images to estimate rice grain yield. Int. J. Appl. Earth Obs. Geoinf. 2021, 102, 102397. [Google Scholar] [CrossRef]
  64. Yamaguchi, T.; Sasano, K.; Katsura, K. Improving efficiency of ground-truth data collection for UAV-based rice growth estimation models: Investigating the effect of sampling size on model accuracy. Plant Prod. Sci. 2024, 27, 1–13. [Google Scholar] [CrossRef]
  65. Gano, B.; Dembele, J.S.B.; Ndour, A.; Luquet, D.; Beurier, G.; Diouf, D.; Audebert, A. Using UAV Borne, Multi-Spectral Imaging for the Field Phenotyping of Shoot Biomass, Leaf Area Index and Height of West African Sorghum Varieties under Two Contrasted Water Conditions. Agronomy 2021, 11, 850. [Google Scholar] [CrossRef]
  66. Wilke, N.; Siegmann, B.; Postma, J.A.; Muller, O.; Krieger, V.; Pude, R.; Rascher, U. Assessment of plant density for barley and wheat using UAV multispectral imagery for high-throughput field phenotyping. Comput. Electron. Agric. 2021, 189, 106380. [Google Scholar] [CrossRef]
  67. Ostos-Garrido, F.J.; de Castro, A.I.; Torres-Sanchez, J.; Piston, F.; Pena, J.M. High-Throughput Phenotyping of Bioethanol Potential in Cereals Using UAV-Based Multi-Spectral Imagery. Front. Plant Sci. 2019, 10, 948. [Google Scholar] [CrossRef]
  68. Sharma, P.; Leigh, L.; Chang, J.; Maimaitijiang, M.; Caffe, M. Above-Ground Biomass Estimation in Oats Using UAV Remote Sensing and Machine Learning. Sensors 2022, 22, 601. [Google Scholar] [CrossRef] [PubMed]
  69. Simões, I.O.P.S.; Rios do Amaral, L. Uav-Based Multispectral Data for Sugarcane Resistance Phenotyping of Orange and Brown Rust. Smart Agric. Technol. 2023, 4, 100144. [Google Scholar] [CrossRef]
  70. Yang, Y.; Wei, X.B.; Wang, J.; Zhou, G.S.; Wang, J.; Jiang, Z.T.; Zhao, J.; Ren, Y.L. Prediction of Seedling Oilseed Rape Crop Phenotype by Drone-Derived Multimodal Data. Remote Sens. 2023, 15, 3951. [Google Scholar] [CrossRef]
  71. Shu, M.Y.; Fei, S.P.; Zhang, B.Y.; Yang, X.H.; Guo, Y.; Li, B.G.; Ma, Y.T. Application of UAV Multisensor Data and Ensemble Approach for High-Throughput Estimation of Maize Phenotyping Traits. Plant Phenomics 2022, 2022, 9802585. [Google Scholar] [CrossRef] [PubMed]
  72. Vong, C.N.; Conway, L.S.; Zhou, J.F.; Kitchen, N.R.; Sudduth, K.A. Early corn stand count of different cropping systems using UAV-imagery and deep learning. Comput. Electron. Agric. 2021, 186, 106214. [Google Scholar] [CrossRef]
  73. Habibi, L.N.; Watanabe, T.; Matsui, T.; Tanaka, T.S.T. Machine Learning Techniques to Predict Soybean Plant Density Using UAV and Satellite-Based Remote Sensing. Remote Sens. 2021, 13, 2548. [Google Scholar] [CrossRef]
  74. Wang, X.; Yang, W.; Lv, Q.; Huang, C.; Liang, X.; Chen, G.; Xiong, L.; Duan, L. Field rice panicle detection and counting based on deep learning. Front. Plant Sci. 2022, 13, 966495. [Google Scholar] [CrossRef] [PubMed]
  75. Hashemi-Beni, L.; Gebrehiwot, A.; Karimoddini, A.; Shahbazi, A.; Dorbu, F. Deep Convolutional Neural Networks for Weeds and Crops Discrimination From UAS Imagery. Front. Remote Sens. 2022, 3, 755939. [Google Scholar] [CrossRef]
  76. Schreiber, L.V.; Amorim, J.G.A.; Guimaraes, L.; Matos, D.M.; da Costa, C.M.; Parraga, A. Above-ground Biomass Wheat Estimation: Deep Learning with UAV-based RGB Images. Appl. Artif. Intell. 2022, 36, 2055392. [Google Scholar] [CrossRef]
  77. Tanabe, R.; Matsui, T.; Tanaka, T.S.T. Winter wheat yield prediction using convolutional neural networks and UAV-based multispectral imagery. Field Crops Res. 2023, 291, 108786. [Google Scholar] [CrossRef]
  78. Nevavuori, P.; Narra, N.; Lipping, T. Crop yield prediction with deep convolutional neural networks. Comput. Electron. Agric. 2019, 163, 104859. [Google Scholar] [CrossRef]
  79. Herrmann, I.; Bdolach, E.; Montekyo, Y.; Rachmilevitch, S.; Townsend, P.A.; Karnieli, A. Assessment of maize yield and phenology by drone-mounted superspectral camera. Precis. Agric. 2019, 21, 51–76. [Google Scholar] [CrossRef]
  80. Tirado, S.B.; Hirsch, C.N.; Springer, N.M. UAV-based imaging platform for monitoring maize growth throughout development. Plant Direct 2020, 4, e00230. [Google Scholar] [CrossRef] [PubMed]
  81. Wan, L.; Zhu, J.; Du, X.; Zhang, J.; Han, X.; Zhou, W.; Li, X.; Liu, J.; Liang, F.; He, Y.; et al. A model for phenotyping crop fractional vegetation cover using imagery from unmanned aerial vehicles. J. Exp. Bot. 2021, 72, 4691–4707. [Google Scholar] [CrossRef] [PubMed]
  82. Bhadra, S.; Sagan, V.; Skobalski, J.; Grignola, F.; Sarkar, S.; Vilbig, J. End-to-end 3D CNN for plot-scale soybean yield prediction using multitemporal UAV-based RGB images. Precis. Agric. 2023, 25, 834–864. [Google Scholar] [CrossRef]
  83. Zhou, J.; Beche, E.; Vieira, C.C.; Yungbluth, D.; Zhou, J.; Scaboo, A.; Chen, P. Improve Soybean Variety Selection Accuracy Using UAV-Based High-Throughput Phenotyping Technology. Front. Plant Sci. 2021, 12, 768742. [Google Scholar] [CrossRef]
  84. Aharon, S.; Peleg, Z.; Argaman, E.; Ben-David, R.; Lati, R.N. Image-Based High-Throughput Phenotyping of Cereals Early Vigor and Weed-Competitiveness Traits. Remote Sens. 2020, 12, 3877. [Google Scholar] [CrossRef]
  85. Jenal, A.; Hüging, H.; Ahrends, H.E.; Bolten, A.; Bongartz, J.; Bareth, G. Investigating the Potential of a Newly Developed UAV-Mounted VNIR/SWIR Imaging System for Monitoring Crop Traits—A Case Study for Winter Wheat. Remote Sens. 2021, 13, 1697. [Google Scholar] [CrossRef]
  86. Jenal, A.; Bareth, G.; Bolten, A.; Kneer, C.; Weber, I.; Bongartz, J. Development of a VNIR/SWIR Multispectral Imaging System for Vegetation Monitoring with Unmanned Aerial Vehicles. Sensors 2019, 19, 5507. [Google Scholar] [CrossRef]
  87. Jiang, Z.Y.; Huete, A.R.; Kim, Y.; Didan, K. 2-band enhanced vegetation index without a blue band and its application to AVHRR data. Proc. SPIE 2007, 6679, 45–53. [Google Scholar] [CrossRef]
  88. Redmon, J.; Divvala, S.; Girshick, R.; Farhadi, A. You Only Look Once: Unified, Real-Time Object Detection. In Proceedings of the IEEE Conference on Computer Vision and Pattern Recognition, Las Vegas, NV, USA, 27–30 June 2016; pp. 779–788. [Google Scholar] [CrossRef]
  89. Dhal, S.; Wyatt, B.M.; Mahanta, S.; Bhattarai, N.; Sharma, S.; Rout, T.; Saud, P.; Acharya, B.S. Internet of Things (IoT) in digital agriculture: An overview. Agron. J. 2023, 116, 1144–1163. [Google Scholar] [CrossRef]
  90. Yamaguchi, T.; Katsura, K. A novel neural network model to achieve generality for diverse morphologies and crop science interpretability in rice biomass estimation. Comput. Electron. Agric. 2024, 218, 108653. [Google Scholar] [CrossRef]
  91. Tataridas, A.; Kanatas, P.; Chatzigeorgiou, A.; Zannopoulos, S.; Travlos, I. Sustainable Crop and Weed Management in the Era of the EU Green Deal: A Survival Guide. Agronomy 2022, 12, 589. [Google Scholar] [CrossRef]
Figure 1. The UAV set up for field phenotyping. The UAV platform can be represented by a commercial off-the-shelf drone already set up with the different components or a custom-built UAV specifically designed for field phenotyping. UAVs equipped with GNSS receivers and sensors are controlled by a radio controller or ground station.
Drones 08 00212 g001
Figure 2. The crop reflectance curve and individual bands from different satellite sensors and commercial UAV multispectral cameras. Vertical lines indicate the center wavelength of the individual bands. Gradient colors correspond to the wavelength of the visible RGB colors, and black color represents the NIR.
Drones 08 00212 g002
Figure 3. Reflectance pattern of Perennial ryegrass (Lolium perenne) with different N contents.
Drones 08 00212 g003
Figure 4. The absorption spectrum of both Chl a and b pigments. The figure was slightly modified from [53].
Drones 08 00212 g004
Figure 5. Ground sampling distance scheme. The figure was modified from [62].
Drones 08 00212 g005
Table 2. Summary of selected applications of UAV platforms for field phenotyping.
CropsCameraGSD
cm Pixel−1
Explanatory
Variables 1
Predicted
Traits
Data Analysis 2Ref.
TypeModel
AlfalfaRGBDJI Zenmuse XT20.19Saturation, a*, b*, Canopy temperatureLAI, Forage yield (FY)LME[33]
Thermal
BarleyRGBSony Alpha 60000.85DSMPlant height, lodging percentageAverage lodging severity, weighted average lodging severity[27]
Barley, wheatRGBSony Alpha 60000.2–0.59ExGR, NDVIPlant densityANOVA, LRM[66]
MultispectralMicasense RedEdge 0.69–1.36
Barley, wheatRGB
Multispectral
Parrot Sequioa31.25Resized RGB images,
Resized NDVI images
YieldCNN[78]
Barley, Wheat, TriticaleMultispectralMini-MCA6 Tetracam0.54NDVI, ExG, GNDVITotal dry biomass, Sugar release, Theoretical ethanol Yield, Bioethanol potentialANOVA, LRM[67]
MaizeRGBLumix GX7 Panasonic0.94GGA, Hue, NDLab, TGI, NGRDI, CSIGrain yieldANOVA, LSD, LRM[32]
MaizeRGBCanon IXUS 127 HS2DSMBiomass, Grain yieldLRM, exponential regression, power regression, GAM[29]
MaizeRGBDJI Phantom 4 Advanced0.3Resized RGB imagesSeedlingsCNN[72]
MaizeRGBSony A51001.96
20.87
GNDVI, NDVI, NDREI, REIP, SIPIGrain yield, Canopy cover, LAI, Relative Water content, Ear weightPLS-R, PLS-DA[79]
MultispectralMini MCA12 Tetracam
MaizeRGBDJI Phantom 4 Advanced0.82DSMPlant heightLRM, ANOVA[80]
OatMultispectralMicaSense RedEdge-MX 1.74GNDVI, NDVI, NGRDI, RVI, DVI, EVI, CVI, TVI, PSRI, BGI, VARI, GLIAboveground biomassPLSR, SVM, RF, ANN[68]
Oilseed rape, rice, wheat, cottonRGBSony NEX 70.6Canopy reflectance Fractional vegetation coverPROSAIL-GP, RF[81]
MultispectralMQ022HG-IM-SM5 × 5-NIR2 Ximea
Red fescue, Perennial ryegrass, Tall fescueRGBCanon ELPH 110 HS S.O.D.A senseFly1.38–2.27Texture, HeightLodgingSVM[28]
RiceRGBDJI Phantom 4 Pro0.2DSMBiomass, Heading date, Culm length, Grain weight, Panicle number, Panicle lengthLME[30]
RiceRGBFUJIFILM GFX 100 camera0.2Resized RGB imagesRice panicles detectionCNN[74]
Rice, Oilseed rapeMultispectralMQ022HG-IM-SM5X5-NIR2 Ximea1.12Canopy reflectance, fractional vegetation cover LAI, Leaf/canopy Chl content, BiomassPROSAIL, RF[38]
SoybeanRGBSony α9 ILCE-90.6DSM Plant height, canopy cover, LAIFitted P-splines[31]
SoybeanRGBDJI Phantom 4 Pro3.4Resized RGB imagesYieldCNN[82]
SoybeanRGBDJI Phantom 4 Pro0.35Resized RGB imagesSeedlings detectionCNN[73]
SoybeanMultispectralMicaSense RedEdge-M2.08DSM, 36 vegetation indices (e.g., CiGreen, GNDVI, TGI)Selected or non-selected superior breeding lines by breedersANOVA, LASSO, PCA[83]
Sugarcane, weedRGBCanon G9X camera5Resized RGB imagesWeed/crop classificationCNN[75]
SugarcaneMultispectralMicaSense RedEdge-MX 1.77NDVI, GNDVI, NDREI, RVI, CiGreen, CiRE, DVI, EVI, CVI, TVI, PSRI, BGI, VARI, GLIOrange and brown rust resistanceSVM, KNN, RF, ANN, DT[69]
TriticaleRGBDJI Phantom 4 Pro0.6ExG, PSA, DSMEarly Vigor and weed competitivenessThree-parameter sigmoid equation[84]
WheatRGBDJI Zenmuse X32.14Resized RGB imagesBiomassCNN[76]
WheatMultispectralParrot Sequoia
MicaSense Rededge altum
1.4–7.1Resized images for each band, EVI2YieldLRM
CNN
[77]
WheatRGBDJI Zenmuse X50.5VEG, GLI, Spike temperatureFusarium Head Blight detectionANOVA, PCA, HSD[25]
ThermalDJI Zenmuse XT
WheatRGBLumix GX7 Panasonic0.94GA, GGA, NGRDI, TGI, NDVIGrain yieldANOVA, LSD, Bivariate Pearson correlation[37]
MultispectralTetracam Micro MCA12
ThermalFLIR Tau2 640
WheatRGBCanon Powershot 110
Sony NEX5 DJI Zenmuse X5
0.7–1.7DSMPlant heightLME[26]
WheatRGBDJI Phantom 4 Pro0.7NRI, GnyLi, DSMBiomass, moisture, N concentration, N uptakeLRM, power regression[85]
VNIR/SWIRPrototype [86]1.3
1 CiGreen = Chlorophyll index—Green; CiRE = Chlorophyll index—Red Edge; CSI = crop senescence index; CTVI = Corrected Transformed Vegetation Index; DSM = digital surface model; EVI2 = enhanced vegetation index 2; ExG = Excessive Green; ExGR = Excess Green minus Red; GA = green area; GGA = greener green area; GLI = Green Leaf Index; GNDVI = green normalized difference vegetation index; MSAVI2 = Soil-Adjusted Vegetation Index; NDLab = Normalized Difference between a* and b*; NDREI = normalized difference red edge index; NDVI = normalized difference vegetation index; NGRDI = Normalized Green-Red Difference Index; NRI = Normalized Ratio Index; PSA = Projected Shoot Area; REIP = Red Edge Inflection Point; RTVI = Red Edge Triangular Vegetation Index; RVI = Ration Vegetation Index; SIPI = Structure Insensitive Pigment Index; TGI = Triangular Greenness Index; TVI = Triangular Vegetation Index; VARI= Visual Atmospheric Resistance Index; VEG = Vegetative. 2 ANN = Artificial Neural Network; ANOVA = analysis of variance; CNN = convolutional neural network; DT = Decision Tree; GAM = generalized additive model; HSD = Honest Significant Difference; KNN = K-Nearest Neighbors; LASSO = Least Absolute Shrinkage and Selection Operator; LME = Linear Mixed Effect; LRM = linear regression model; LSD = Least Significant Difference; PCA = Principal Component Analysis; PLSA-DA = Partial Least Squares Discriminant Analysis; PLSA-R = Partial Least Squares Regression; RF = random forest; SVM = support vector machine.
Disclaimer/Publisher’s Note: The statements, opinions and data contained in all publications are solely those of the individual author(s) and contributor(s) and not of MDPI and/or the editor(s). MDPI and/or the editor(s) disclaim responsibility for any injury to people or property resulting from any ideas, methods, instructions or products referred to in the content.

