Abstract
With its ability to estimate yield, winemakers may better manage their vineyards and obtain important insights into the possible crop. The proper estimation of grape output is contingent upon an accurate evaluation of the morphology of the vine canopy, as this has a substantial impact on the final product. This study’s main goals were to gather canopy morphology data using a sophisticated 3D model and assess how well different morphology characteristics predicted yield results. An unmanned aerial vehicle (UAV) with an RGB camera was used in the vineyards of Topoľčianky, Slovakia, to obtain precise orthophotos of individual vine rows. Following the creation of an extensive three-dimensional (3D) model of the assigned region, a thorough examination was carried out to determine many canopy characteristics, including thickness, side section dimensions, volume, and surface area. According to the study, the best combination for predicting grape production was the side section and thickness. Using more than one morphological parameter is advised for a more precise yield estimate as opposed to depending on only one.
1. Introduction
The diversity of vineyards is often associated with factors such as sun exposure [1], water availability [2], local climate [3], soil management and composition. These influential factors have a direct impact on the health and productivity of grapevines. To illustrate, they play a significant role in determining the strength of the canopy, the surface area of leaves (referred to as leaf area index or LAI), the overall volume of the canopy, the number of grapes produced, and the quality of the grapes harvested. Within the domain of precision agriculture, the evaluation of canopy size, whether through manual methods or by utilizing digital sensors, is a widely adopted procedure. Consequently, these measurements are frequently transformed into pertinent indicators related to the canopy, such as the leaf area index [4], leaf wall area, and tree row volume [5].
Crop yield estimation plays a crucial role in the agricultural sector due to the significant impact of the correlation between yield and various agronomic factors in assisting farmers in making informed decisions regarding future management practices. The process of forecasting crop yield relies heavily on the continuous monitoring and analysis of meteorological conditions, environmental influences, soil characteristics, and crop-specific parameters. A variety of techniques and instruments are utilized in the evaluation and quantification of canopy dimensions, including but not limited to empirical and non-invasive approaches [6] alongside direct and invasive methodologies [7], as well as the utilization of optical or alternative sensor technologies [8,9]. These diverse methods contribute to a comprehensive understanding of crop growth and development, facilitating more accurate predictions and informed decision-making for farmers and stakeholders in the agricultural domain.
Canopy manual measurement with measuring tape is unsuitable because it is subjective, laborious, and time-consuming [10]. Modern advancements in technology have enabled viticulturists to employ precise, rapid, and consistent techniques for assessing canopy characteristics in grape cultivation, thus enhancing the efficiency and accuracy of viticultural practices. These include drones [11], laser scanners (handheld, mobile) [12], structure from motion (SfM) [13], photogrammetry techniques and software [14], and global navigation satellite system (GNSS) receivers [15].
Photogrammetry is a technique of precise reconstruction that overlays images of a given area or part of a vineyard using methods from many disciplines, including optics and projective geometry. Using photogrammetry techniques, spatial models are created based on the combination of several images that overlap, creating an orthomosaic of images. Photogrammetric processing can be performed using specific image processing tools and software. This tool allows to perform photogrammetric triangulation, creating a point cloud. The combination of these techniques makes it possible to reconstruct a 3D model of the vine. Moreover, further detailed parameters of the plant can be determined. Several studies have pointed out the advantages of using 3D reconstruction of the canopy size [16], spatial variability of vines, detecting trunk [17] and row gap [18], optimizing the number of pesticides and sprays [19], and determining the health status [20].
This study is focused on the exploration and analysis of specific canopy parameters at an individual level, aiming to establish their correlations with grape yield to assess their appropriateness for predicting yield as an integral component of pre-harvest agronomic practices. The primary goal of this research is to examine how various canopy characteristics interact with grape production levels, thereby contributing valuable insights to the effective management of vineyards before harvesting. In this study, the authors follow up their preliminary research [21], which focused on yield prediction using a low-cost drone. In this study, research was enriched with more input data from a professional drone, complemented with a more comprehensive analysis.
2. Materials and Methods
2.1. Field Experimental Site
The study area included five vine rows in Topoľčianky (48°25′40.14″ N, 18°23′51.48″ E, WGS84) (Slovakia) (Figure 1). This vineyard was planted in 2015 (Vitis vinifera cv Riesling Italico). Rows were approximately the same length, 121 m on average. Vines were spaced 3 m between rows and 0.8 m within a row, with the height of the vine approximately 2 m. The vineyard was located on the plain, and the surveyed area was 0.2 ha. A total of 5 rows were studied.
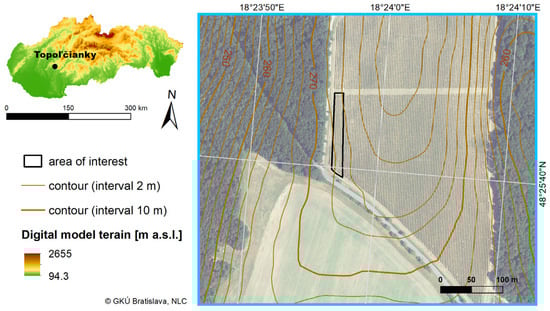
Figure 1.
Area of interest (background: orthophotomosaic by GKÚ Bratislava, NLC).
2.2. Data Collection
A collection of five ground control points (GCP) was strategically positioned on the ground in between rows for the purpose of georeferencing. Each individual GCP underwent precise measurements through the utilization of a cutting-edge GNSS receiver known as the Trimble TSC3 combined with the highly efficient Trimble R8s antenna (Trimble, Sunnyvale, CA, USA). The level of accuracy achieved in determining the position of each GCP was an impressive 1 cm. The drone used for image acquisition was programmed to capture images from three distinct angles, ensuring comprehensive coverage of the targeted area.
Specifically, a popular consumer-grade drone model, the DJI Mavic Pro (DJI Technology Co., Shenzhen, China), was equipped with a standard built-in RGB camera for this aerial surveying task. The camera has a 1/2.3-inch CMOS sensor. The resolution of the images stood at 4000 pixels by 3000 pixels, with a ground sampling distance (GSD) of 0.30 cm per pixel. The flight plan for the DJI Mavic Pro drone was created in the Litchi application (Litchi, VC Technology Ltd. © 2024, London, UK). In total, the drone flew over each row 3 times, once vertically and twice obliquely (Figure 2). The drone maintained a consistent flight height of 10 m above the ground during the data collection process. In order to ensure comprehensive image coverage and accuracy, the forward overlap and side overlap percentages were set at 95% and 85%, respectively, adhering to industry best practices. A substantial volume of data was gathered, with a total of 943 images collected in the year 2021 and 924 images gathered in 2022, with images being captured at every 2 m of flight progression. The acquisition of drone images took place at two distinct time points, specifically 26 days and 6 days prior to the anticipated harvest seasons in the years 2021 and 2022, respectively, aligning with the agricultural calendar for effective monitoring and assessment purposes (Table 1). Data acquisition was performed around 12 p.m.
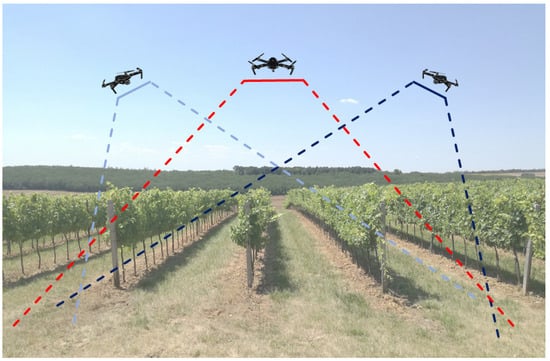
Figure 2.
Schematic representation of vineyard mapping by DJI Mavic Pro. Red represents a vertical fly-over row, and light and dark blue represent the assessment of oblique images of a row taken by the tilted camera of the drone.

Table 1.
Overview table on flight date, drone type, and harvest time.
Since 2022, the surveyed area has also been imaged with a DJI Matrice 300 drone with a Zenmuse P1 camera with a 35 mm lens (DJI Technology Co., Shenzhen, China). The flight plan was created in the DJI Pilot application, where the area of interest was determined, and the application prepared the flight plan itself. The flight height was 25 m above the terrain. Lower flight height was not possible due to an automated flight plan because a wider area, including surrounding vegetation, was inevitable for oblique images (Figure 3). The camera has an 8192 by 5460 pixels, 45 MP full-frame sensor, offering optimal image quality. GSD has 0.31 cm per pixel. Vertical and oblique images were also taken; for the area of interest, 606 images were used for each year. The same flight plan was used for both years. In 2023, it was flown 7 days before harvest at around 12 p.m. (Table 1).
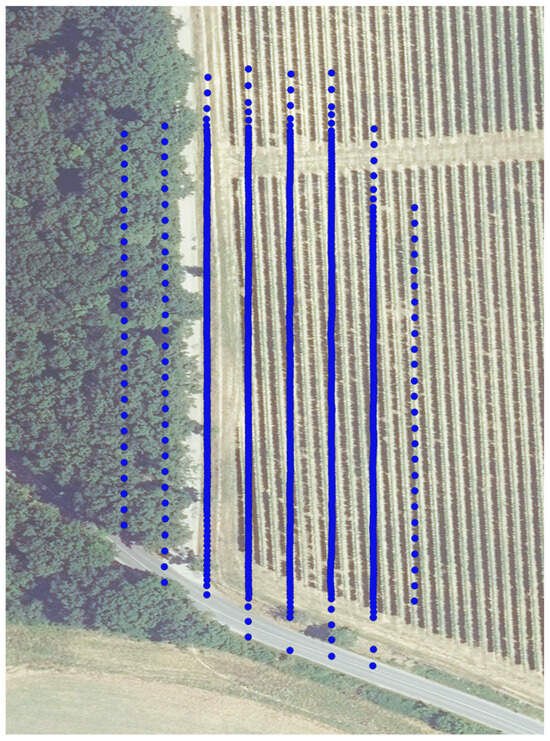
Figure 3.
Schematic representation of vineyard mapping by DJI Matrice 300. Blue points represent the position of images. Background: orthophotomosaic by GKÚ Bratislava, NLC.
2.3. Data Processing
The process of reconstructing the 3D point cloud was conducted using Agisoft Metashape Professional software (Agisoft LLC in St. Petersburg, Russia). The specific region of interest, encompassing 5 rows along with the ground, contained an estimated 71,000,000 individual points. The parameters like the accuracy (in step “align photos”) and quality (in step “build dense cloud” and “build mesh”) were set to highest and high, respectively. The same setup was used to prepare the point cloud for all study years. Subsequently, the point cloud generated by Agisoft Metashape Professional was subjected to visualization and initial processing using CloudCompare software (CloudCompare 2.12.4 GNU License, Paris, France). Within the CloudCompare platform, various elements such as noise points, ground features, posts, and tree trunks were meticulously eliminated through manual intervention. The average density of the 3D point cloud representing the canopy was determined to be approximately 31,000 points per cubic meter. To facilitate further analysis, each row was subdivided into segments delineated by the presence of every second post, resulting in a total of 13 segments per row, as illustrated in Figure 4. Each segment encompassed an average of 12 tree trunks and spanned a length of approximately 9.5 m. In the year 2021, the area under investigation harbored a total of 708 plants, whereas, in 2022, the plant count had slightly increased to 711 individuals, and in 2023, there were 730 of them. Envelopes (thick border lines, Figure 4) were created in the CloudCompare software and represent the thickness (Figure 4A) and side section (Figure 4B) for each row. These envelopes were subsequently implemented in ArcMap 10.7 (ESRI, Redlands, CA, USA). The rows were divided into individual segments, and the area (m2) of the side section and thickness parameters were calculated for each segment. Canopy volume (m3) and surface area (m2) were calculated in Agisoft Metashape Professional for each segment. During the data processing, a computer with these parameters was used: processor Intel(R) Core(TM) i7-9750H CPU @ 2.60 GHz and graphic card NVIDIA GeForce GTX 1660 Ti. Computer time was approximately 3.5 days.
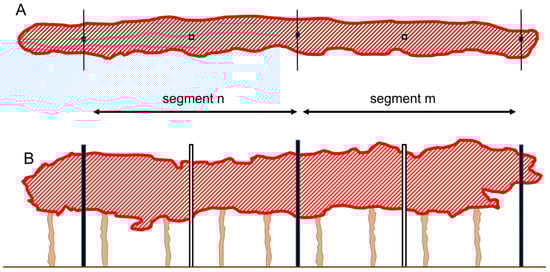
Figure 4.
Schematic representation of segments and the area representing the thickness (A) and side section (B). On average, each segment included 12 trunks in reality. Segments were formed by every second pole (black).
2.4. Grape Yield Assessment
The grapes harvested from the vineyard were individually subjected to weighing procedures according to their respective segments. Each grape’s weight, along with various canopy parameters, was meticulously documented and then used to establish correlations between different variables. It is important to note that the decision was taken to exclude the last segments in the four rows from the analysis due to their shorter length compared to the other segments. This precaution was necessary to prevent any potential introduction of discrepancies or inaccuracies in the statistical analysis. The last segment of the fifth row was not excluded because it was the same length as the rest of the segments in the row.
2.5. Statistical Analysis
The normality test conducted in GraphPad Prism (v.8; GraphPad Software, San Diego, CA, USA) did not provide evidence to confirm the adherence of the data to the Gaussian distribution. For this reason, non-parametric Spearman correlation was used to determine the strength and direction of association between grape yield and individual morphology parameters. Subsequently, linear regression and multiple linear regression were used to describe a relation between grape yield and a variety of morphology parameters. The mathematical equations derived from linear regression and multiple linear regression analysis conducted in the year 2022 were then used for the prediction of the yield production of 2023. Results were compared to the actual harvest weight.
3. Results
3.1. Grape Yield
The graphical representation of the grape harvest is shown in Figure 5. Several zones alternated between higher and lower yields on a biannual base. The total production output for the year 2021 equaled 1688 kg, followed by 1620 kg in 2022 and 1625 kg in 2023. The quantity of grapes harvested from individual segments varied, ranging from 6.4 kg to 48.4 kg in 2021, 6.9 kg to 39.3 kg in 2022, and 3.3 kg to 38.2 kg in 2023.
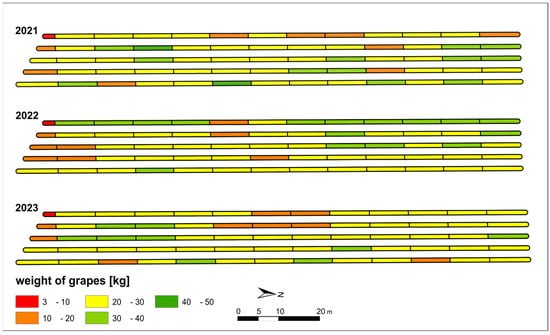
Figure 5.
Harvest weight of grapes for individual segments for years.
3.2. 3D Point Cloud
In the year 2021, a total of 943 photos entered the 3D point cloud, with an equal number aligned. In 2022, 924 photos from DJI Mavic Pro were used, of which 837 photos were aligned. In the case of DJI Matrice 300, 606 photos entered the 3D point cloud in 2022–2023, while the number of aligned was 584 and 579 in 2022 and 2023, respectively. The process of alignment was conducted with the highest accuracy and highest quality, and it was set in the generation of the point cloud. Descriptive data of each parameter are shown in Table 2.
Table 2.
Mean and standard deviation (SD) value for each parameter per segment.
3.3. Correlation and Regression Analysis
The relationship between morphological parameters and grape yield was analyzed using Spearman correlation analysis (Table 3). When DJI Mavic Pro was used for imaging in 2021, a positive but weak correlation was confirmed only in the case of the side section. Using DJI Mavic Pro in 2022 showed a correlation with all morphological parameters but was quite weak. Switching to a professional drone, DJI Matrice 300, led to a stronger correlation between the grape yield and morphological parameters, especially side section and thickness.
Table 3.
Spearman correlation between grapes weight and parameters.
3.4. Prediction of Grape Yield
Yield prediction based on side section, thickness, and volume showed a discrepancy in the range of 10–12% (Table 4). Prediction based on the surface showed the lowest discrepancy from harvested yield, 1%. Additional multiple linear regression analysis appointed four other equations combining parameters such as side section, thickness, and volume. Among these, three predictions led to a satisfying discrepancy in the range of 2–3.2% (Table 4).
Table 4.
Equations used for the prediction of grape weight and comparison with harvested yield in 2023. Equations are derived from linear regression (1–4) and multiple linear regression (5–8) and calculated from 2022 data. The discrepancy of predicted weight was calculated from the overall harvested yield.
The distribution of individual yield prediction compared to harvested yield is graphically visualized in Figure 6. The closest distribution of predicted data and mean to harvested yield is when equation E (Table 4) was applied, using parameters such as side section and thickness. The mean of predicted yield was comparable to harvested yield, 25.1 ± 4.6 kg and 25.7 ± 5.3 kg, respectively.
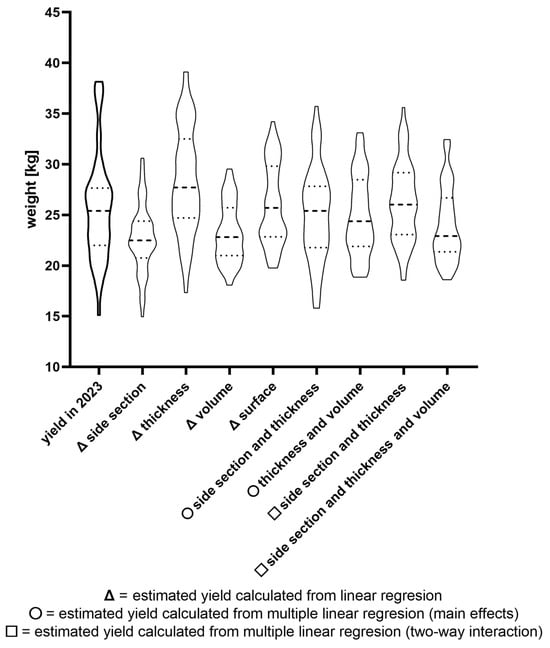
Figure 6.
Comparison of weight yields and estimated weight yields equation based on morphological parameters. Linear regression and multiple linear regression were used as a base for equations. The main effect equals the effect of the factor regardless of other factors. Two-way interaction is a combined (multiplied) effect of two factors. The data are expressed as violin graphs with median (dashed) and quartile (dotted) lines.
Equations based on the same parameters as in 2022 were calculated also from 2023 data (Table 5). The equations 13–15 based on 2022 (Table 4) are very similar in means of coefficients and intercepts when compared to the equation from 2023 (Table 5).
Table 5.
Equations are derived from linear regression (9–12) and multiple linear regression (13–16) and calculated from 2023 data.
4. Discussion
Yield prediction is an important tool in the management of vineyards and helps farmers to adjust economic and human resources before harvest. Morphological parameters are one of the options for how to predict yield. Current methods for crop prediction are either very subjective (manual assessment), invasive (leaf area index), or expensive (autonomous robots with scanners). Drone technology enables an accurate, fast, non-invasive assessment of images. Combination with photogrammetric techniques results in reliable 3D models of vineyards. This study focused on using images taken by drones for the creation of a 3D point cloud. Subsequently, the morphological features of the vineyard were calculated and evaluated. Lastly, results were tested in the application of yield estimation.
Measurement of harvested grapes showed similar yield production in three consecutive years. However, several zones in the monitored vineyard exhibited a fluctuation of yield on a biannual basis. The fluctuations in weight among the individual segments are considered a common occurrence for vine plants, reflecting the natural growth patterns. Farmers typically prefer lower levels of fluctuation to maintain stability in weight yields over the long term, as it is more conducive to effective planning and management of resources.
Using a professional drone led to a reduction in input data and, thus, to more efficient processing when compared to commercial drones. On the other hand, there are also disadvantages too. The main negative is route planning. The professional drone has limited conditions for shooting, e.g., more maneuvering space. In this study, the area of interest is located near the forest; thus, the flight height had to be adjusted higher to limit any possible contact with the trees.
An important aspect is imaging itself. If the forward image overlap is lower than 80% and the side overlap is less than 75% [22], there is an inadequate reconstruction of the object’s shape, and so the accuracy of the result is reduced. A high forward overlap (95%) and side overlap (more than 80%) achieve suitable conditions for the creation of 3D point clouds [23], which results in the correct and accurate shape of the object. There are several factors that play a role in using imaging for the prediction of the yield, and one of those is timing. Imaging in the early stage of the vineyard growing cycle can lead to underestimation of the yield. Also, imaging before the management of the vineyard, such as pruning, can overestimate the yield. Ballesteros et al. [24] collected data at five time points representing different stages of the vine. It has been confirmed that the ideal time for imaging is after management, close to the harvest date. The limitation of this procedure is that processing images and generation of a 3D point cloud is time-consuming and requires proper computing power. On the other hand, this procedure can correctly map vineyard parameters compared to manual measurement [5].
Two drones were used in this study: commercial (DJI Mavic Pro) and professional (DJI Matrice 300). Commercial drones with built-in camera performance showed a weak correlation of the side section parameter in both 2021 and 2022. Overall performance could be explained by the timing of the imaging process. Specifically, imaging was conducted nearly a month before the harvest in 2021, whereas, in 2022, it took place only 6 days before the harvest. During the period between imaging and harvest in 2021, there were additional activities carried out in the vineyard, such as leaf removal, which could potentially impact the accuracy and consistency of the morphology parameters and their correlation with the grape yield. Furthermore, the side section parameter may exhibit a lower degree of sensitivity to partial leaf removal in comparison to factors such as canopy thickness, volume, and surface area. Despite the fact that the correlation between the side section and grape yield was deemed to be weak, the findings remained consistent across both years under observation, thus hinting at a recurring relationship. Correlation analysis shows that a professional drone, DJI Matrice 300 equipped with a Zenmuse P1 camera, is more suitable for accurate data collection, resulting in a stronger correlation between morphological features and harvested yield, especially side section and thickness.
Equations based on linear regression led to acceptable but still inaccurate predictions of yield except for surface parameters. The range of discrepancy, 10–12%, is similar to a study by Di Gennaro et al. [25]. The authors estimated the grape yield by counting the bunches of grapes depicted in the images and subsequently multiplying this count by the average weight of each bunch. This method resulted in a 12% underestimation of the actual yield. Although the surface parameter had the best yield estimation, the correlation of the surface parameter with harvested yield and the distribution of estimated weights of individual segments rather point to its unsuitability for prediction. Moreover, equations for yield prediction created in both consecutive years (2022, 2023) have different values of intercept (2022: Y = 1.32 + 0.5705 × surface, 2023: Y = 7.492 + 0.422 × surface), indicating instability. For more accurate yield estimation in individual segments, it is necessary to include another factor in the equation.
Such a factor can be an interaction or combination of morphological features. Several combinations were tested. The outcome of the most promising based on the statistical analysis is presented in the study. Almost all of them demonstrated much lower discrepancy in yield prediction in the range of 2–3.2%, which is far better than other studies [25]. Moreover, prediction based on side section and thickness as main effects (Table 4—E) is most similar to the distribution and mean of harvested grapes in individual segments. It is for this reason that we consider this equation to be the most appropriate.
5. Conclusions
In the current investigation, a 3D point cloud of vine rows was generated utilizing UAV images and photogrammetry software, enabling the determination of various canopy parameters, including side section, thickness, volume, and surface area. Among these parameters, the side section, in combination with thickness, emerges as the most dependable for predicting yield. The calculated grape yield weight exhibited a slight underestimation of merely—2.5% compared to the actual measured weight, a level of variance that is acceptable within the research context. The forthcoming phases of this project will involve annual assessments to validate the reliability of this approach and enhance the accuracy of yield estimations to minimize any discrepancies. This innovative methodology holds promise for enhancing yield estimation accuracy, as well as providing valuable support for pre-harvest planning and agronomic decision-making processes.
Author Contributions
Conceptualization, A.Š. and I.M.; methodology, A.Š. and G.M.; investigation, A.Š.; resources, A.Š. and I.M.; data curation, A.Š. and G.M.; writing—original draft preparation, A.Š.; writing—review and editing, G.M.; visualization, A.Š.; supervision, I.M.; funding acquisition, I.M. All authors have read and agreed to the published version of the manuscript.
Funding
This research was funded by the Scientific Grant Agency of The Ministry of Education, Science, Research and Sport in Slovakia—project VEGA 1/0217/23 Modern methods and actual data sources in detailed research of the landscape spatial structure. The research was also supported by the project ‘The feasibility of the circular economy during national defense activities’ of the 2021 Thematic Excellence Programme of the National Research, Development and Innovation Office under grant no. TKP2021-NVA-22, led by the Centre for Circular Economy Analysis.
Data Availability Statement
The data that support the findings of this article are available by the authors under reasonable request.
Acknowledgments
The authors are grateful to vineyard Topoľčianky for providing a research area.
Conflicts of Interest
The authors declare no conflicts of interest.
References
- Uhlig, B.A. Effects of Solar Radiation on Grape (Vitis vinifera L.) Composition and Dried Fruit Colour. J. Hortic. Sci. Biotechnol. 1998, 73, 111–123. [Google Scholar] [CrossRef]
- Sirera, À.P.; Antichi, D.; Raffa, D.W.; Rallo, G. Application of Remote Sensing Techniques to Discriminate the Effect of Different Soil Management Treatments over Rainfed Vineyards in Chianti Terroir. Remote Sens. 2021, 13, 716. [Google Scholar] [CrossRef]
- Asproudi, A.; Petrozziello, M.; Cavalletto, S.; Ferrandino, A.; Mania, E.; Guidoni, S. Bunch Microclimate Affects Carotenoids Evolution in Cv. Nebbiolo (V. vinifera L.). Appl. Sci. 2020, 10, 3846. [Google Scholar] [CrossRef]
- Zheng, G.; Moskal, L.M. Retrieving Leaf Area Index (LAI) Using Remote Sensing: Theories, Methods and Sensors. Sensors 2009, 9, 2719–2745. [Google Scholar] [CrossRef] [PubMed]
- Miranda-Fuentes, A.; Llorens, J.; Gamarra-Diezma, J.L.; Gil-Ribes, J.A.; Gil, E. Towards an Optimized Method of Olive Tree Crown Volume Measurement. Sensors 2015, 15, 3672–3687. [Google Scholar] [CrossRef] [PubMed]
- Tsialtas, J.T.; Koundouras, S.; Zioziou, E. Leaf Area Estimation by Simple Measurements and Evaluation of Leaf Area Prediction Models in Cabernet-Sauvignon Grapevine Leaves. Photosynthetica 2008, 46, 452–456. [Google Scholar] [CrossRef]
- Cohen, S.; Striem, M.J.; Bruner, M.; Klein, I. Grapevine Leaf Area Index Evaluation by Gap Fraction Inversion. Acta Hortic. 2000, 537, 87–94. [Google Scholar] [CrossRef]
- De Castro, A.I.; Jiménez-Brenes, F.M.; Torres-Sánchez, J.; Peña, J.M.; Borra-Serrano, I.; López-Granados, F. 3-D Characterization of Vineyards Using a Novel UAV Imagery-Based OBIA Procedure for Precision Viticulture Applications. Remote Sens. 2018, 10, 584. [Google Scholar] [CrossRef]
- Zhang, J.; Cheng, T.; Guo, W.; Xu, X.; Qiao, H.; Xie, Y.; Ma, X. Leaf Area Index Estimation Model for UAV Image Hyperspectral Data Based on Wavelength Variable Selection and Machine Learning Methods. Plant Methods 2021, 17, 49. [Google Scholar] [CrossRef]
- Chakraborty, M.; Khot, L.R.; Sankaran, S.; Jacoby, P.W. Evaluation of Mobile 3D Light Detection and Ranging Based Canopy Mapping System for Tree Fruit Crops. Comput. Electron. Agric. 2019, 158, 284–293. [Google Scholar] [CrossRef]
- Ouyang, J.; de Bei, R.; Fuentes, S.; Collins, C. UAV and Ground-Based Imagery Analysis Detects Canopy Structure Changes after Canopy Management. OENO One 2020, 54, 1093–1103. [Google Scholar] [CrossRef]
- Arnó, J.; Escolà, A.; Vallès, J.M.; Llorens, J.; Sanz, R.; Masip, J.; Palacín, J.; Rosell-Polo, J.R. Leaf Area Index Estimation in Vineyards Using a Ground-Based LiDAR Scanner. Precis. Agric. 2013, 14, 290–306. [Google Scholar] [CrossRef]
- García-Fernández, M.; Sanz-Ablanedo, E.; Pereira-Obaya, D.; Rodríguez-Pérez, J.R. Vineyard Pruning Weight Prediction Using 3D Point Clouds Generated from UAV Imagery and Structure from Motion Photogrammetry. Agronomy 2021, 11, 924. [Google Scholar] [CrossRef]
- Sassu, A.; Ghiani, L.; Salvati, L.; Mercenaro, L.; Deidda, A.; Gambella, F. Integrating UAVs and Canopy Height Models in Vineyard Management: A Time-Space Approach. Remote Sens. 2022, 14, 130. [Google Scholar] [CrossRef]
- Catania, P.; Comparetti, A.; Febo, P.; Morello, G.; Orlando, S.; Roma, E.; Vallone, M. Positioning Accuracy Comparison of GNSS Receivers Used for Mapping and Guidance of Agricultural Machines. Agronomy 2020, 10, 924. [Google Scholar] [CrossRef]
- Pagliai, A.; Ammoniaci, M.; Sarri, D.; Lisci, R.; Perria, R.; Vieri, M.; Arcangelo, M.E.D.; Storchi, P.; Kartsiotis, S. Comparison of Aerial and Ground 3D Point Clouds for Canopy Size Assessment in Precision Viticulture. Remote Sens. 2022, 14, 1145. [Google Scholar] [CrossRef]
- Jurado, J.M.; Pádua, L.; Feito, F.R.; Sousa, J.J. Automatic Grapevine Trunk Detection on UAV-Based Point Cloud. Remote Sens. 2020, 12, 3043. [Google Scholar] [CrossRef]
- Di Gennaro, S.F.; Matese, A. Evaluation of Novel Precision Viticulture Tool for Canopy Biomass Estimation and Missing Plant Detection Based on 2.5D and 3D Approaches Using RGB Images Acquired by UAV Platform. Plant Methods 2020, 16, 91. [Google Scholar] [CrossRef]
- Gil, E.; Arnó, J.; Llorens, J.; Sanz, R.; Llop, J.; Rosell-Polo, J.R.; Gallart, M.; Escolà, A. Advanced Technologies for the Improvement of Spray Application Techniques in Spanish Viticulture: An Overview. Sensors 2014, 14, 691–708. [Google Scholar] [CrossRef]
- Ouyang, J.; De Bei, R.; Collins, C. Assessment of Canopy Size Using UAV-Based Point Cloud Analysis to Detect the Severity and Spatial Distribution of Canopy Decline. OENO One 2021, 55, 253–266. [Google Scholar] [CrossRef]
- Šupčík, A.; Beranová, V. Grape Yield Prediction Based on Vine Canopy Morphology Obtained by 3D Point Clouds from UAV Images. In Precision Agriculture’23; Wageningen Academic Publishers: Wageningen, The Netherlands, 2023; pp. 619–625. [Google Scholar]
- Tu, Y.H.; Phinn, S.; Johansen, K.; Robson, A.; Wu, D. Optimising Drone Flight Planning for Measuring Horticultural Tree Crop Structure. ISPRS J. Photogramm. Remote Sens. 2020, 160, 83–96. [Google Scholar] [CrossRef]
- Torres-Sánchez, J.; López-Granados, F.; Borra-Serrano, I.; Manuel Peña, J. Assessing UAV-Collected Image Overlap Influence on Computation Time and Digital Surface Model Accuracy in Olive Orchards. Precis. Agric. 2018, 19, 115–133. [Google Scholar] [CrossRef]
- Ballesteros, R.; Intrigliolo, D.S.; Ortega, J.F.; Ramírez-Cuesta, J.M.; Buesa, I.; Moreno, M.A. Vineyard Yield Estimation by Combining Remote Sensing, Computer Vision and Artificial Neural Network Techniques. Precis. Agric. 2020, 21, 1242–1262. [Google Scholar] [CrossRef]
- Di Gennaro, F.S.; Toscano, P.; Cinat, P.; Berton, A.; Matese, A. A Low-Cost and Unsupervised Image Recognition Methodology for Yield Estimation in a Vineyard. Front. Plant Sci. 2019, 10, 559. [Google Scholar] [CrossRef] [PubMed]
Disclaimer/Publisher’s Note: The statements, opinions and data contained in all publications are solely those of the individual author(s) and contributor(s) and not of MDPI and/or the editor(s). MDPI and/or the editor(s) disclaim responsibility for any injury to people or property resulting from any ideas, methods, instructions or products referred to in the content. |
© 2024 by the authors. Licensee MDPI, Basel, Switzerland. This article is an open access article distributed under the terms and conditions of the Creative Commons Attribution (CC BY) license (https://creativecommons.org/licenses/by/4.0/).