Article

Detection of Leak Areas in Vineyard Irrigation Systems Using UAV-Based Data

1
Centre for the Research and Technology of Agro-Environmental and Biological Sciences, University of Trás-os-Montes e Alto Douro, 5000-801 Vila Real, Portugal
2
Institute for Innovation, Capacity Building and Sustainability of Agri-Food Production, University of Trás-os-Montes e Alto Douro, 5000-801 Vila Real, Portugal
3
Engineering Department, School of Science and Technology, University of Trás-os-Montes e Alto Douro, 5000-801 Vila Real, Portugal
4
Agronomy Department, School of Agrarian and Veterinary Sciences, University of Trás-os-Montes e Alto Douro, 5000-801 Vila Real, Portugal
5
Biology and Environment Department, School of Life Sciences and Environment, University of Trás-os-Montes e Alto Douro, 5000-801 Vila Real, Portugal
6
Centre for Robotics in Industry and Intelligent Systems (CRIIS), Institute for Systems and Computer Engineering, Technology and Science (INESC TEC), 4200-465 Porto, Portugal
*
Author to whom correspondence should be addressed.
Drones 2024, 8(5), 187; https://doi.org/10.3390/drones8050187
Submission received: 4 April 2024 / Revised: 3 May 2024 / Accepted: 4 May 2024 / Published: 8 May 2024
(This article belongs to the Special Issue Advances of UAV in Precision Agriculture)

Abstract

:
Water is essential for maintaining plant health and optimal growth in agriculture. While some crops depend on irrigation, others can rely on rainfed water, depending on regional climatic conditions. This is exemplified by grapevines, which have specific water level requirements, and irrigation systems are needed. However, these systems can be susceptible to damage or leaks, which are not always easy to detect, requiring meticulous and time-consuming inspection. This study presents a methodology for identifying potential damage or leaks in vineyard irrigation systems using RGB and thermal infrared (TIR) imagery acquired by unmanned aerial vehicles (UAVs). The RGB imagery was used to distinguish between grapevine and non-grapevine pixels, enabling the division of TIR data into three raster products: temperature from grapevines, from non-grapevine areas, and from the entire evaluated vineyard plot. By analyzing the mean temperature values from equally spaced row sections, different threshold values were calculated to estimate and map potential leaks. These thresholds included the lower quintile value, the mean temperature minus the standard deviation ( T m e a n σ ), and the mean temperature minus two times the standard deviation ( T m e a n 2 σ ). The lower quintile threshold showed the best performance in identifying known leak areas and highlighting the closest rows that need inspection in the field. This approach presents a promising solution for inspecting vineyard irrigation systems. By using UAVs, larger areas can be covered on-demand, improving the efficiency and scope of the inspection process. This not only reduces water wastage in viticulture and eases grapevine water stress but also optimizes viticulture practices.

1. Introduction

Viticulture and winemaking play big roles in the economies of several regions across the world, particularly in Mediterranean countries such as France, Italy, Spain, and Portugal. These countries collectively contribute significantly to the global wine production, and the cultural and economic significance of producing high-quality wine is crucial for local communities [1]. However, contemporary viticulture faces several challenges essentially resulting from global warming. This phenomenon is responsible for an increase in growing-season temperatures in Europe [2]. The global trend indicates an average temperature rise of 0.42 °C per decade and 2.04 °C overall between 2000 and 2049 [3]. These changes are associated with more frequent and prolonged heatwaves, potentially leading to a reduction in yields of up to 35% in specific viticultural regions [4]. In viticulture, the impact of air temperature on the growth and productivity of grapevines is widely reported [5,6]. Furthermore, it has been established that air temperature significantly affects grapevine physiology and the composition of the fruit [7]. Additionally, a decrease in precipitation events can lead to soil water scarcity. This scarcity can result in severe water and nutrient deficits throughout the grapevines’ growth cycle, which can adversely affect both the yield of the vineyard and the characteristics of the fruit [8,9,10,11].
To address the challenges posed by water stress and to minimize its impacts on vineyard productivity, there has been an increase in the adoption of irrigation in viticulture over the past few decades [12]. Micro-irrigation techniques are commonly employed in vineyards due to its cost-effectiveness in both installation and maintenance, when compared to sprinkler systems [13]. Above-ground drip irrigation emitters are the most common due to their ease of installation and management. However, above-ground emitters are more susceptible to damage, often caused by factors such as sunlight exposure, wildlife interference or machinery inadvertently puncturing the tubing, leading to water leakage [14].
Given the scarcity of this vital natural resource and its critical role in ensuring a healthy and productive grapevine, it is imperative to develop efficient methods for detecting leak areas to enhance irrigation effectiveness and reduce water loss. Improving the efficiency of early leak detection can lead to economic benefits for farmers by reducing water consumption costs but also prevents the growth of weeds in areas inadvertently irrigated. Conventional leak detection techniques involve manual inspections of visible above-ground pipes and areas exhibiting signs of flooding caused by underground pipe ruptures [15]. However, these methods require additional labor and lack the capability for real or near real-time monitoring. Another used alternative is temporarily interrupting the water supply system and use acoustic devices to check if sound can traverse to the end of the pipe without interference, signaling an absence of leaks [16]. Yet, similar to visual inspections, this approach demands additional human resources and disrupts regular system operations, resulting in water supply interruptions that may interfere with irrigation efficiency. Consequently, given its laborious and time-consuming nature, this method is typically executed periodically rather than in real time.
The use of remote sensing technology, particularly unmanned aerial vehicles (UAVs), has emerged as a valuable and recognized tool, offering comprehensive support to farmers in various precision agriculture tasks. These versatile applications include monitoring crop growth, assessing plant health, identifying diseases and pests, estimating crop yields, weed mapping, irrigation management, and crop spraying [17]. In the specific context of viticulture, winegrowers prioritize activities such as vineyard monitoring and management [18], water stress estimation [19,20,21,22], monitoring effects of minerals application [23], fertilization and irrigation management [24], canopy management [25], monitoring fruit growth and characteristics [26], harvest timing [27], and seasonal trimming [28].
In the field of irrigation management, the existing literature mainly focuses on the efficient use of water resources by assessing crop water stress and estimating plant water stress. However, it is equally important to investigate the extent of water lost from leaks in irrigation systems. In this regard, only a limited number of studies have explored the potential of UAV-derived data to assist farmers in detecting irrigation malfunctions. In this set of studies, methods for detecting water leaks in agriculture can be categorized into automatic and semi-automatic algorithms, visual inspections or a combination of both. Visual inspections targeted water leak detection in irrigation canals using multispectral and thermal infrared (TIR) sensors mounted on UAV platforms [29,30]. These inspections identified open canals and selected subsurface irrigation leaks, relying on vegetation indices, spectral band rations (NIR/Green and NIR/Blue), for detection of standing water. Moreover, the reliability of the normalized difference vegetation index (NDVI) [31] was found to be inconsistent. While successful in identifying large-scale canal leaks, these studies did not include an analysis of irrigation systems at the plantation scale. Similarly, the potential of remote sensing was evaluated for detecting irrigation areas [32]. An airborne thermal camera was employed to analyze crop temperature and differentiate irrigated and non-irrigated areas. It successfully identified sprinkler irrigation stages in a clover parcel and their impact on adjacent corn plots. Additionally, it detected temperature changes in parcels transitioning from wheat harvest to corn sowing, revealing leakage from neighboring paddy parcels to a corn field.
Through the use of semi-automatic approaches, the validation of a water leak detection technique was assessed employing the empirical Triangle/Trapezoid method with multispectral and TIR data obtained from manned aircraft and UAV platforms [33,34,35]. These studies evaluated the efficacy of vegetation indices such as NDVI and optimized soil adjusted vegetation index (OSAVI) [36] combined with the TIR-based water index (WI), with OSAVI presenting better resistance to soil reflectance variations. Nonetheless, despite their effectiveness in detecting larger leaks caused by hydrants, these methods primarily focused on substantial puddles and lacked a complete automation. On the other hand, an automated algorithm was developed to monitor irrigation system malfunctions in olive orchards using airborne TIR data [37]. This method included image segmentation through the merging of Continuous Max-Flow-Min-Cut with the Otsu method [38] and subpixel edge detection to address mixed pixels. It involved tree irrigation classification using bagging with random forest algorithms, achieving high success rates for leak detection (89.5%) and identifying clogging malfunctions (87.5%). Similarly, UAV-based TIR remote sensing was applied to detect irrigation system malfunctions in olive orchards and table grape vineyards [39]. The developed algorithm relied on temperature assessment and the differentiation of soil and canopy pixels, detecting irrigation anomalies based on a normal distribution. While cooler pixels indicated leaks, warmer pixels suggested clogging. The algorithm detected both leaks and clogs in crops with deficit irrigation, such as olive trees. However, in table grapes, which received high daily water amounts, only long-term clogging was easily detectable, while leaks remained undetected.
This study aims to address the limitations identified in previous studies, which include inconsistencies in plantation-scale leak detection, limitations in vegetation indices accuracy, lack of automation, challenges in detecting leaks across varying crop conditions, and difficulties in short-term leak detection in crops with high water consumption. The research presented in this article focuses on estimating malfunctions in vineyard irrigation systems, with an emphasis on leak detection. To achieve this, the high spatial resolution of UAV-based imagery, grapevine segmentation from RGB imagery is applied into TIR imagery for this purpose to distinguish temperature from grapevines and non-grapevine areas. Furthermore, different threshold values, including those derived from existing literature, are applied to analyze mean temperature values of row sections. This approach enables a comparative and critical assessment of areas, distances and number of rows potentially affected by leaks. This method contributes to a more sustainable grapevine growing practices through a more efficient use of water.

2. Materials and Methods

2.1. Study Area

In this study, data from vineyard plots in two distinct vineyards were used (Figure 1). Both vineyards are located within the Douro Demarcated Region in Portugal and have surface drip line irrigation systems installed along its rows, with known leak areas. Vineyard A is located in Vila Real (41°17′43.5″ N, 7°42′48.6″ W) and is part of a collection of red grapevine varieties, maintained for preservation and enotourism purposes (Figure 1a). This vineyard plot has a total of 19 rows, each approximately 30 m in length, resulting in a total area of 875 m2. The plants are spaced 0.8 m apart, with a row spacing of 1.5 m. In turn, Vineyard B (Figure 1b), is located in the municipality of São João da Pesqueira near the Douro River (41°10′59.4″ N, 7°30′52.9″ W) and employs a vertically trained system. This vineyard consists of 114 rows, with lengths ranging from 2.2 m to 147 m (averaging 99 m). Grapevines are spaced one meter apart, covering an area of 2.4 hectares (23,958 m2) with rows spaced at 2 m.

2.2. UAV Data Acquisition

The remote sensing data used in this study were acquired using a Mavic 3T multi-rotor UAV (DJI, Shenzhen, China). This UAV is equipped to capture RGB images through its 1/2-inch CMOS sensor, with a 12-megapixel resolution. Additionally, it captures TIR imagery at a resolution of 640 × 512 pixels, through a thermal imager, a uncooled vanadium oxide (VOx) microbolometer, sensitive in the 8–14 μm wavelength range, providing an accuracy of ±2 °C. Both sensors are integrated into a 3-axis gimbal for stabilization. The UAV is further enhanced with an real time kinematic (RTK) module, ensuring centimeter-level positioning and precise georeferencing of the acquired imagery.
The flights were carried out under clear sky conditions, with the mission in Vineyard A conducted on 24 August 2023, at 15:20, and the mission in Vineyard B on 24 August 2023, at 13:00. For real-time positioning using RTK, the UAV maintained a connection to the Portuguese Network of GNSS Permanent Stations (ReNEP). The use of ReNEP enabled the achievement of centimeter-level accuracy in UAV-based measurements through real-time correction data, making this precision adequate for detecting and mapping potential leaks in vineyard irrigation systems. The missions were planned to capture imagery with 90% longitudinal overlap and 70% lateral overlap. In Vineyard A, the flight height was set at 40 m above the terrain level, with a maximum speed of 3.8 m s−1, covering an area of 2300 m2 and achieving an expected spatial resolution of 0.053 m. Meanwhile, in vineyard B, the flight height was set at 60 m with a maximum speed of 4 m s−1, covering approximately 27,600 m2 and achieving an expected spatial resolution of 0.079 m. Adjustments in flight height, and consequently, spatial resolution, were made to ensure the coverage of the entire vineyard plots within a single flight, avoiding significant temperature variations. During the flights, the air temperatures recorded were 27 °C for Vineyard A and 40 °C for Vineyard B.

2.3. Data Analysis

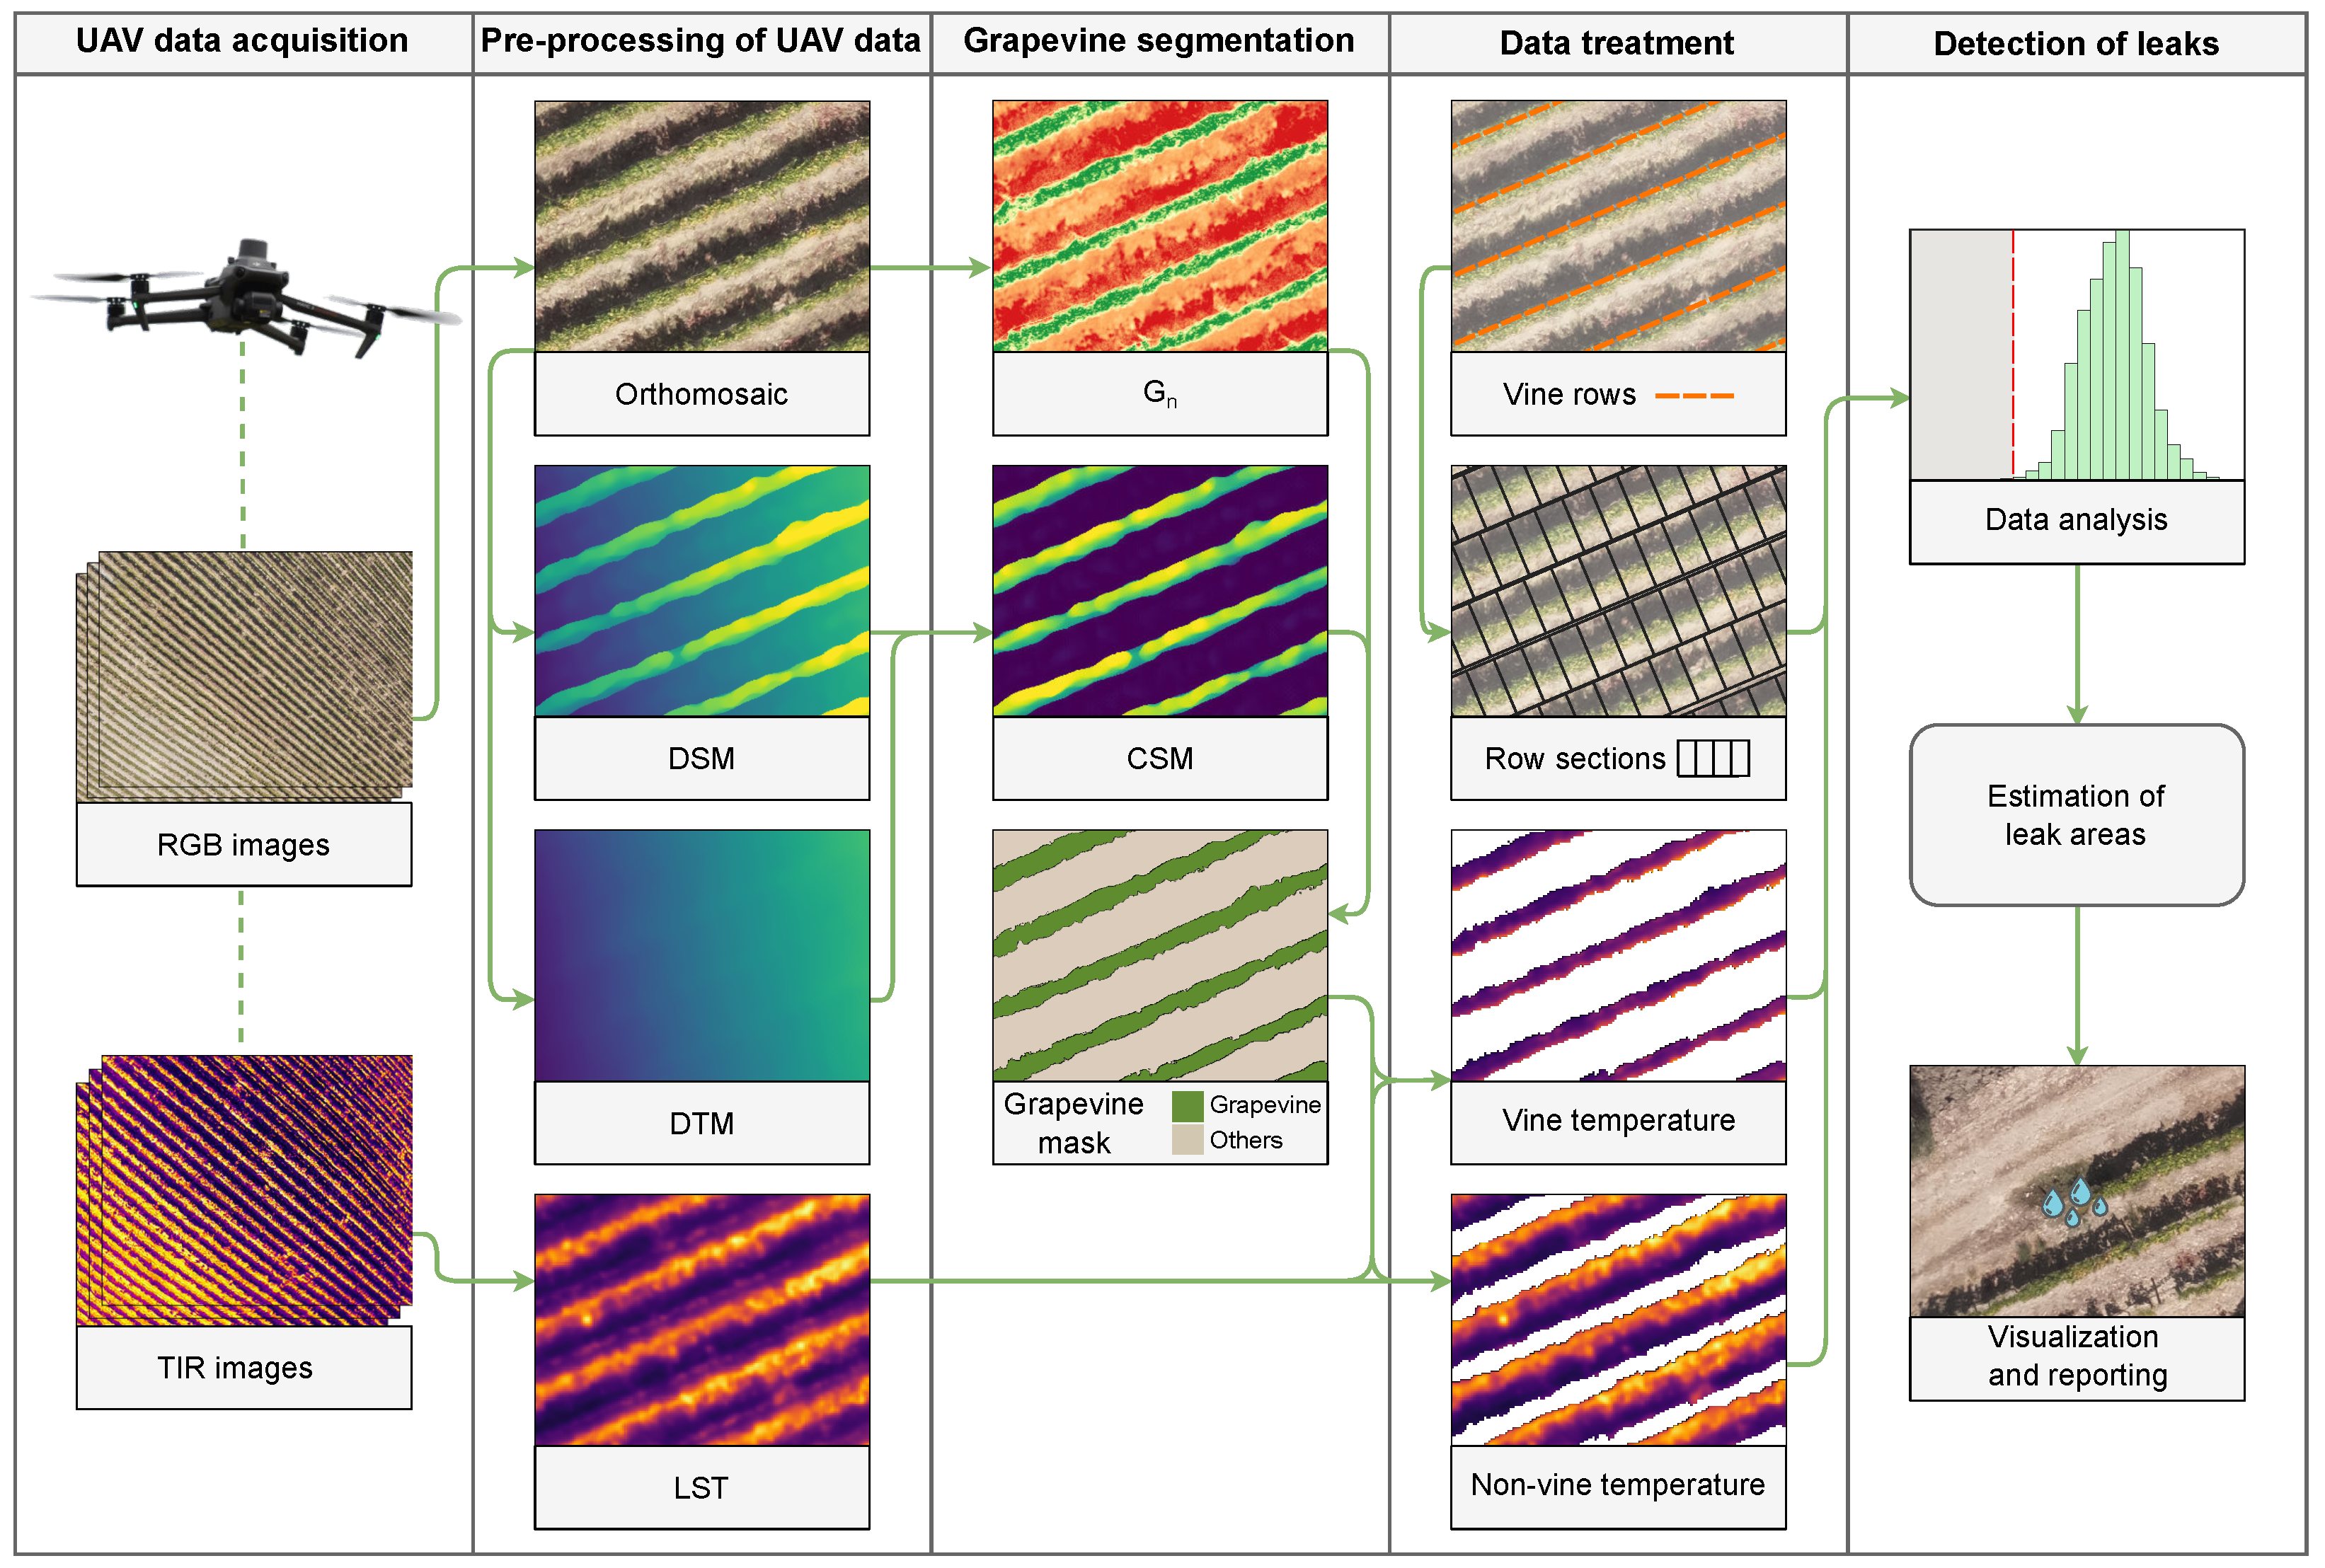
This section details the methodology used for detecting leaks in the vineyard irrigation system (Figure 2), covering a sequence of steps from UAV data acquisition to photogrammetric processing of the obtained imagery, grapevine segmentation, and subsequent data treatment. The process involves the extraction and analysis of various approaches for identifying potential leaking areas, which will be assessed in this study.

2.3.1. Pre-Processing of UAV Data

The UAV imagery (captured as described in Section 2.2) underwent photogrammetric processing in Pix4Dmapper (Pix4D, Lausanne, Switzerland) to generate orthorectified raster products. A dense point cloud with a high point density is created, and various raster products are computed using noise filtering and interpolation through the inverse distance weighting method. These products include RGB orthophoto mosaics, a digital terrain model (DTM) representing a 2.5D terrain, a Digital Surface Model (DSM) including terrain, vegetation, structures, and land surface temperature (LST) from TIR imagery. The DSM and DTM rasters are used to compute the canopy surface model (CSM):
CSM = DSM DTM ,
providing height information for features above the terrain level. In addition to the generated orthorectified raster products, the normalized green value ( G n ) or green percentage (G%) [40] is calculated using the digital numbers derived from the red, green, and blue bands of the orthophoto mosaic. The computation is performed using the following equation:
G n = g r e e n ( r e d + g r e e n + b l u e ) ,
The new raster obtained from this operation enhances the representation of green vegetation within the imagery, allowing a detailed analysis of the vegetation distribution across the surveyed vineyards.

2.3.2. Grapevine Segmentation and Row Parameters Extraction

By using some of the orthorectified raster products, the subsequent step regards the discrimination between grapevine and non-grapevine areas. To achieve this, the method described in Pádua et al. [41] is used. The approach relies on the computation of a grapevine vegetation mask by employing an automatic threshold derived from the analysis of G n and applying a height threshold to the CSM. In the scope of this study, the outcome is a binary mask, highlighting pixels that correspond to grapevines.
The high resolution of UAV data and precision of available georeferencing devices improve the potential of the outcomes for precision viticulture tasks. One of these tasks is the identification and data extraction for each grapevine plant [42]. For this purpose, the coordinates of the row endpoints are used to draw each row central line. These lines, along with the knowledge of the row and plant spacing, enable the establishment of polygonal sections. This is achieved by buffering the lines representing the rows according to its spacing and subsequently dividing the buffered lines into smaller polygons.

2.3.3. Detection of Potential Leaks and Mapping

Through the application of the grapevine mask obtained from the UAV RGB data to the LST raster from the processing of TIR imagery, it enabled the separation into two products: one representing the grapevine temperature and another for non-grapevine areas. The grapevine polygon sections are then used to obtain the mean value from the three raster products (entire area, grapevine pixels, and non-grapevine pixels).
Different methods were used to estimate a temperature value threshold (L), which can represent the potential existence of leaks within the vineyard irrigation system. All methods rely on the mean temperature values of the polygon row sections. Three methods are evaluated in this study. The first method is based on the approach proposed by Dag et al. [39]. This method considers potential leak areas as those with values colder than the average grapevine temperature value minus its standard deviation (3). The second evaluated method considers leak areas as those in which the L value is lower than the mean temperature minus two times its standard deviation (4).
L = T m e a n σ ,
L = T m e a n 2 · σ ,
where T m e a n is the mean temperature of a given polygon and σ is the standard deviation of the grapevine temperatures. These methods can help in the identification of areas potentially containing leaks, allowing for an assessment of the irrigation system’s integrity.
The third method calculates the L value based on the lower quintile. This is determined by 20% of the temperature range ( T m a x T m i n ) added to the minimum temperature value, where T m i n and T m a x are the minimum and maximum temperatures, respectively:
L = ( T m a x T m i n ) · 0.2 + T m i n ,
Based on the obtained results, the main outcomes are generated: a map highlighting areas with potential leaks and the corresponding geographical coordinates for these potential leak areas. Additionally, the number of rows recommended for in-field inspection is provided along with the distance to be evaluated derived from the length of each polygon section with potential leaks.

2.4. Proposed Method Validation and Comparative Analysis

The validation of the proposed methodology relies on the visual inspection of the LST maps from both vineyards. This inspection aims to evaluate the method’s effectiveness in detecting and mapping areas with potential leaks within the vineyard irrigation system. The spatial mapping evaluation of the leaks detected in each approach ensures an accurate identification of leaking areas within the vineyard irrigation system, contributing to the optimization of viticulture practices. Discrepancies or alignments between visual observations and predictions are analyzed, considering overall accuracy, false positives, and false negatives. This comprehensive assessment provides insights into the strengths and potential limitations of the method.
Subsequently, the quantitative outputs generated by different approaches are analyzed. These outputs are derived from the different sources of LST retrieval, including the entire vineyard, grapevines and non-grapevine areas and the approaches of data analysis Equations (3)–(5), presented in Section 2.3.3. The results are compared with the map delineating potential leaking areas. Additionally, both segmented (including grapevine and non-grapevine temperatures) and non-segmented LST rasters are interpolated to generate a three-class temperature distribution map. This approach is commonly used in multispectral vegetation indices [43,44]. In the case of this study, these maps were used to evaluate the spatial distribution of surface temperature. This approach serves as an additional evaluation of spatial temperature distribution, its relationship with identified leaks, and enables the analysis of grapevines and non-grapevines’ contributions to the overall vineyard temperature distribution.

3. Results

3.1. Data Analysis

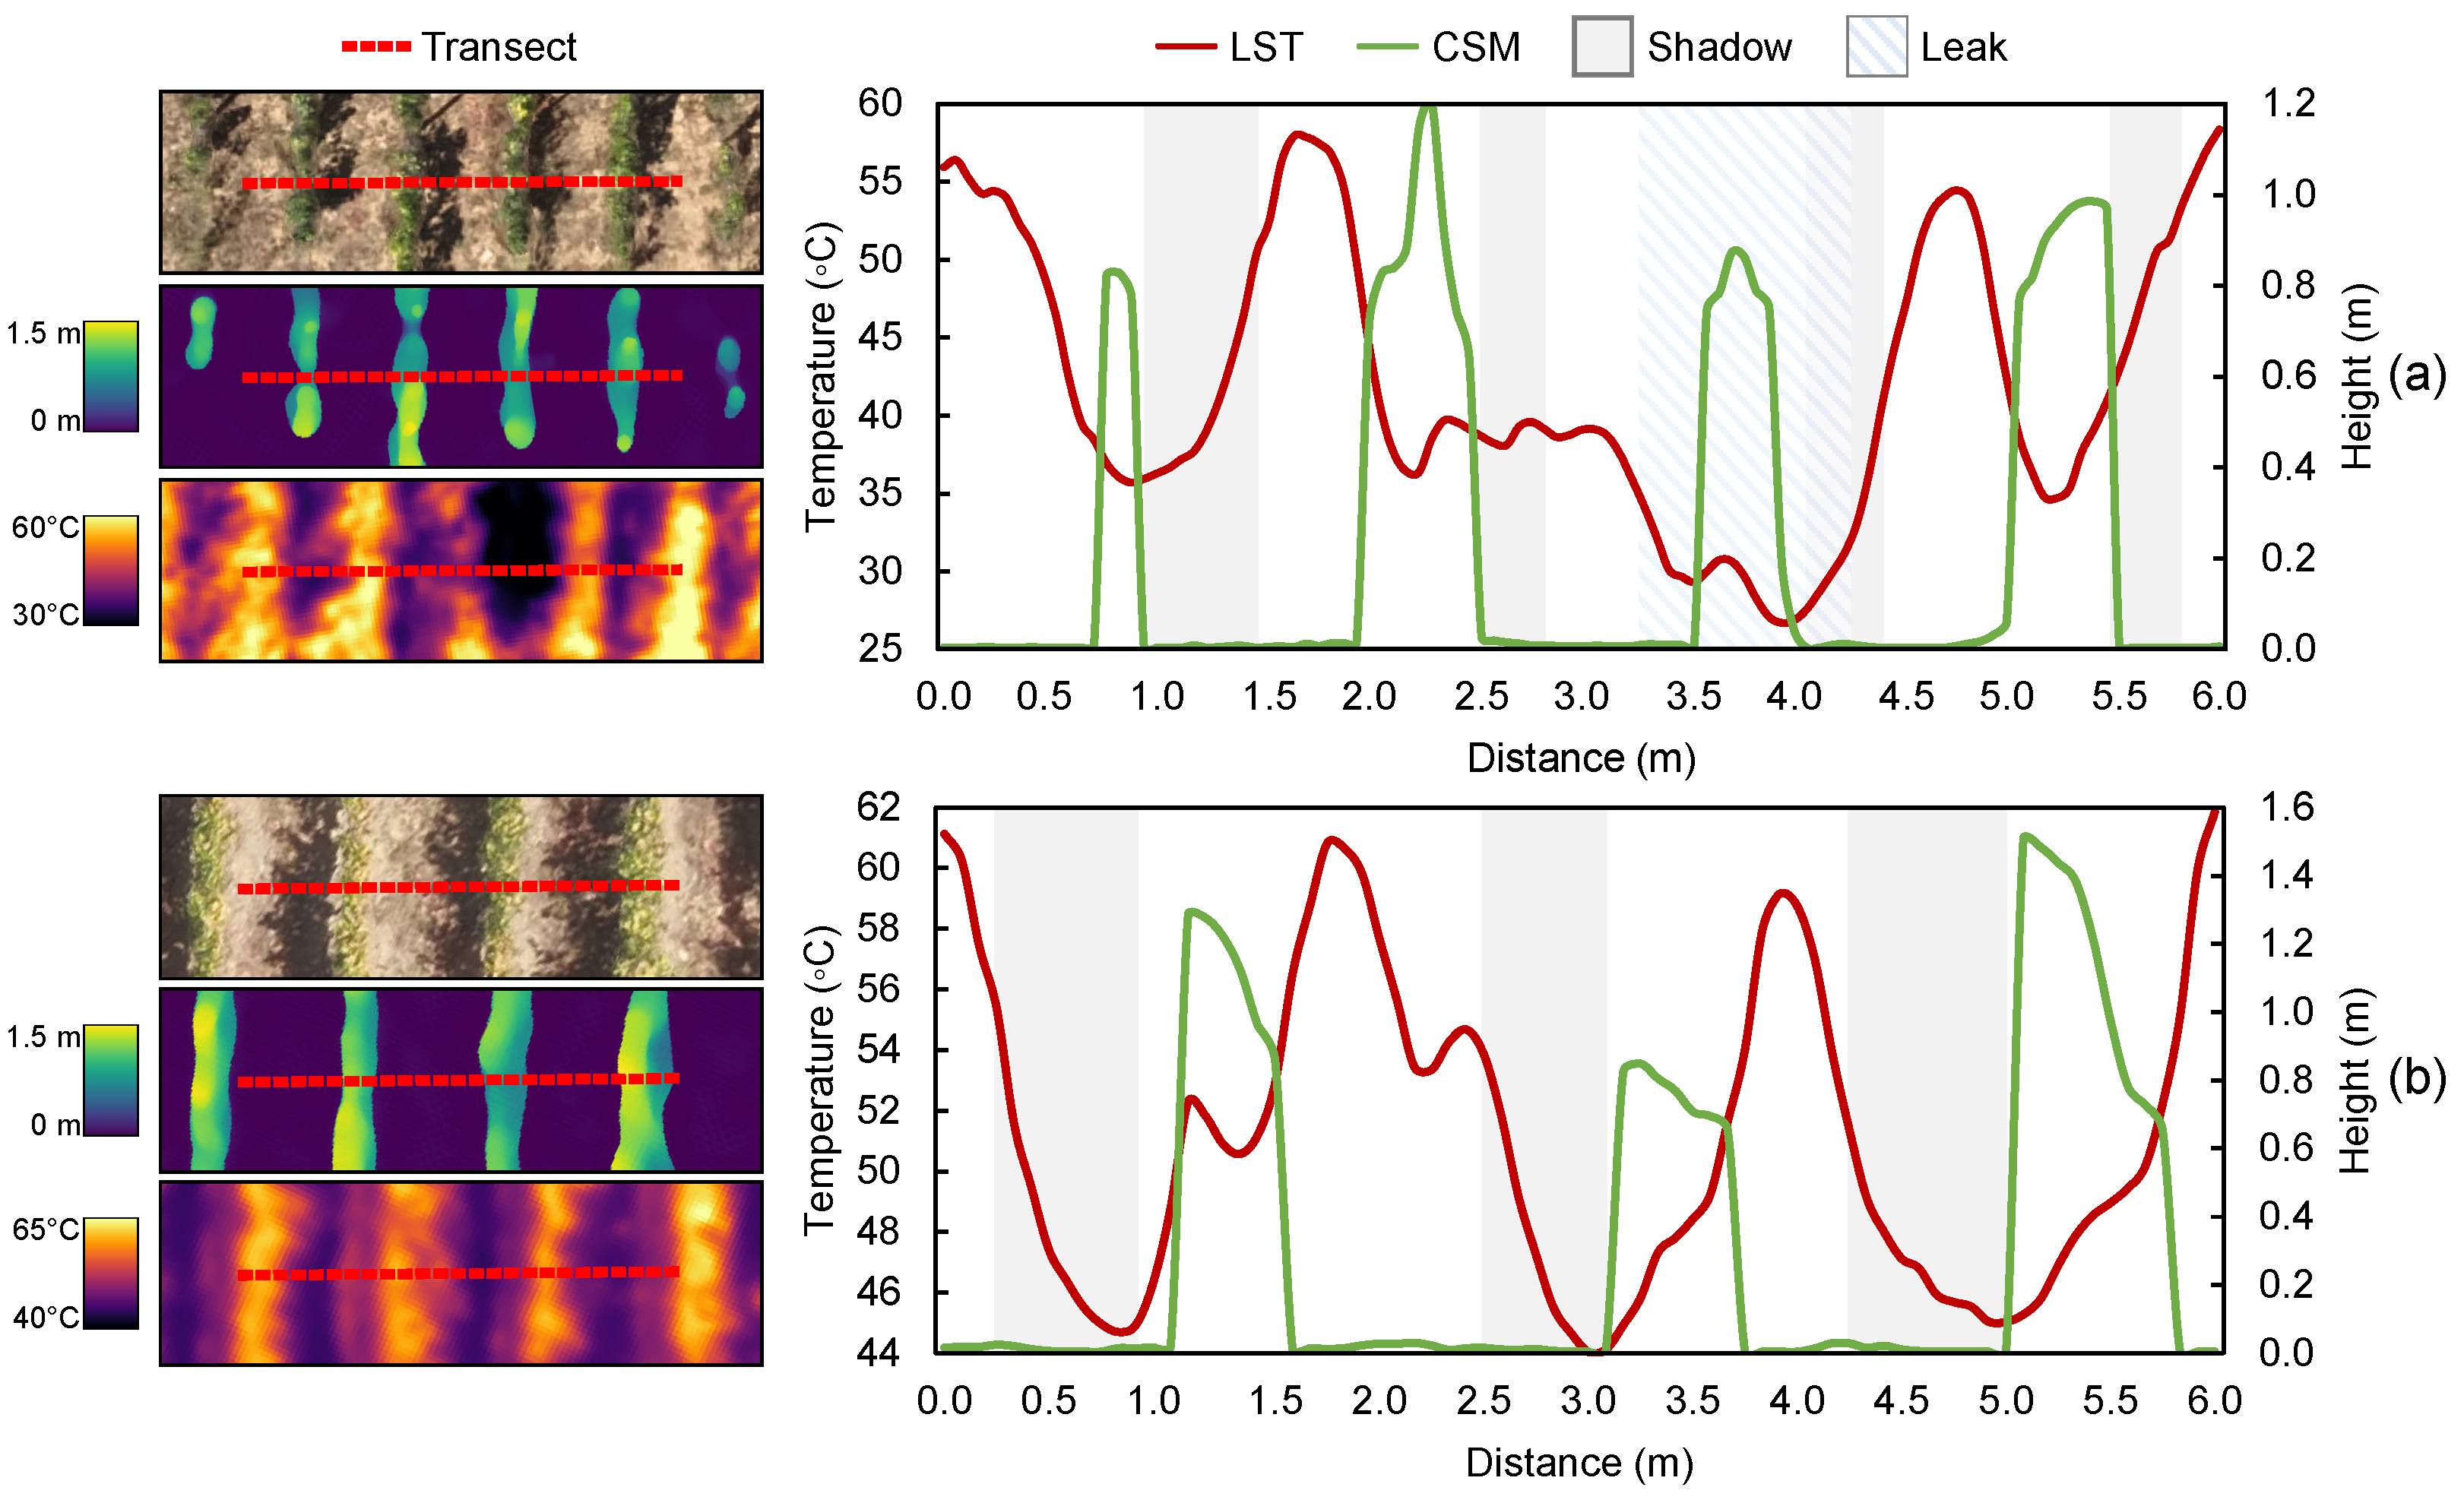
To characterize and analyze the thermal behavior in the studied vineyards, a six-meter profile was traced in both vineyards (Figure 3). In Vineyard A, it crosses through four rows including a leaking area in the third row (from the left to the right of the transect), while in Vineyard B it spans three rows. The Vineyard A profile (Figure 3a) shows a mean temperature of 42 °C with the values ranging between 26.7 °C and 58.4 °C with both minimum and maximum values being observed in non-grapevine areas. Considering only the grapevines, a mean temperature of 35.9 °C is verified, while non-grapevine areas show a mean temperature of 44.1 °C with the shadowed areas averaging 39.9 °C. The lowest values registered in each grapevine row were 35.7 °C, 36.4 °C, 26.7 °C, 34.7 °C with only 26.7 °C being observed in an non-grapevine area. Concerning the water leak identified in Vineyard A, its impact is noticeable in both grapevine and non-grapevine categories, with a mean temperature of 30.1 °C and a mean value of 29.4 °C and 30.4 °C for grapevine row and non-grapevine parts, respectively. In the case of the profile from Vineyard B (Figure 3b) it has a mean value of 51.8 °C, ranging between 44 °C to 62.8 °C, with both of these values being located in non-grapevine areas. The mean value of the grapevines was 49.1 °C while the non-grapevine areas showed a mean temperature of 52.8 °C. When analyzing the profile, the lower values registered in each grapevine row area the values 44.7 °C, 44 °C, and 45 °C, with all of these values being registered in areas of grapevine shadows. In turn, each of the three grapevine rows showed a minimum temperature value of 50.6 °C, 44.9 °C, and 45.3 °C. The differences between these temperatures and the lowest temperatures in the inter-row areas were 5.9 °C, 0.9 °C, and 0.2 °C, respectively.
The thermal patterns observed in both vineyards (Figure 4) exhibit distinct behaviors. In Vineyard A, (Figure 1a) the pixel temperature ranges from 26.1 °C to 67.1 °C, with a mean of 47.9 °C and a standard deviation of 8.2 °C. When masking the temperature data, grapevine vegetation shows a mean temperature of 37.1 °C (±3.5 °C, range of 31.5 °C), while non-grapevine pixels exhibit a mean temperature of 49.9 °C (±7.2 °C, range of 41 °C). In Vineyard B (Figure 1b), the temperature ranges from 35.5 °C to 72.2 °C, with an average temperature of 52.4 °C. The grapevine vegetation has a mean temperature of 48.9 °C ± 3.3 °C, range of 32.5 °C), while other areas show an average temperature of 53.3 °C ± 6.3 °C, range of 36.7 °C).
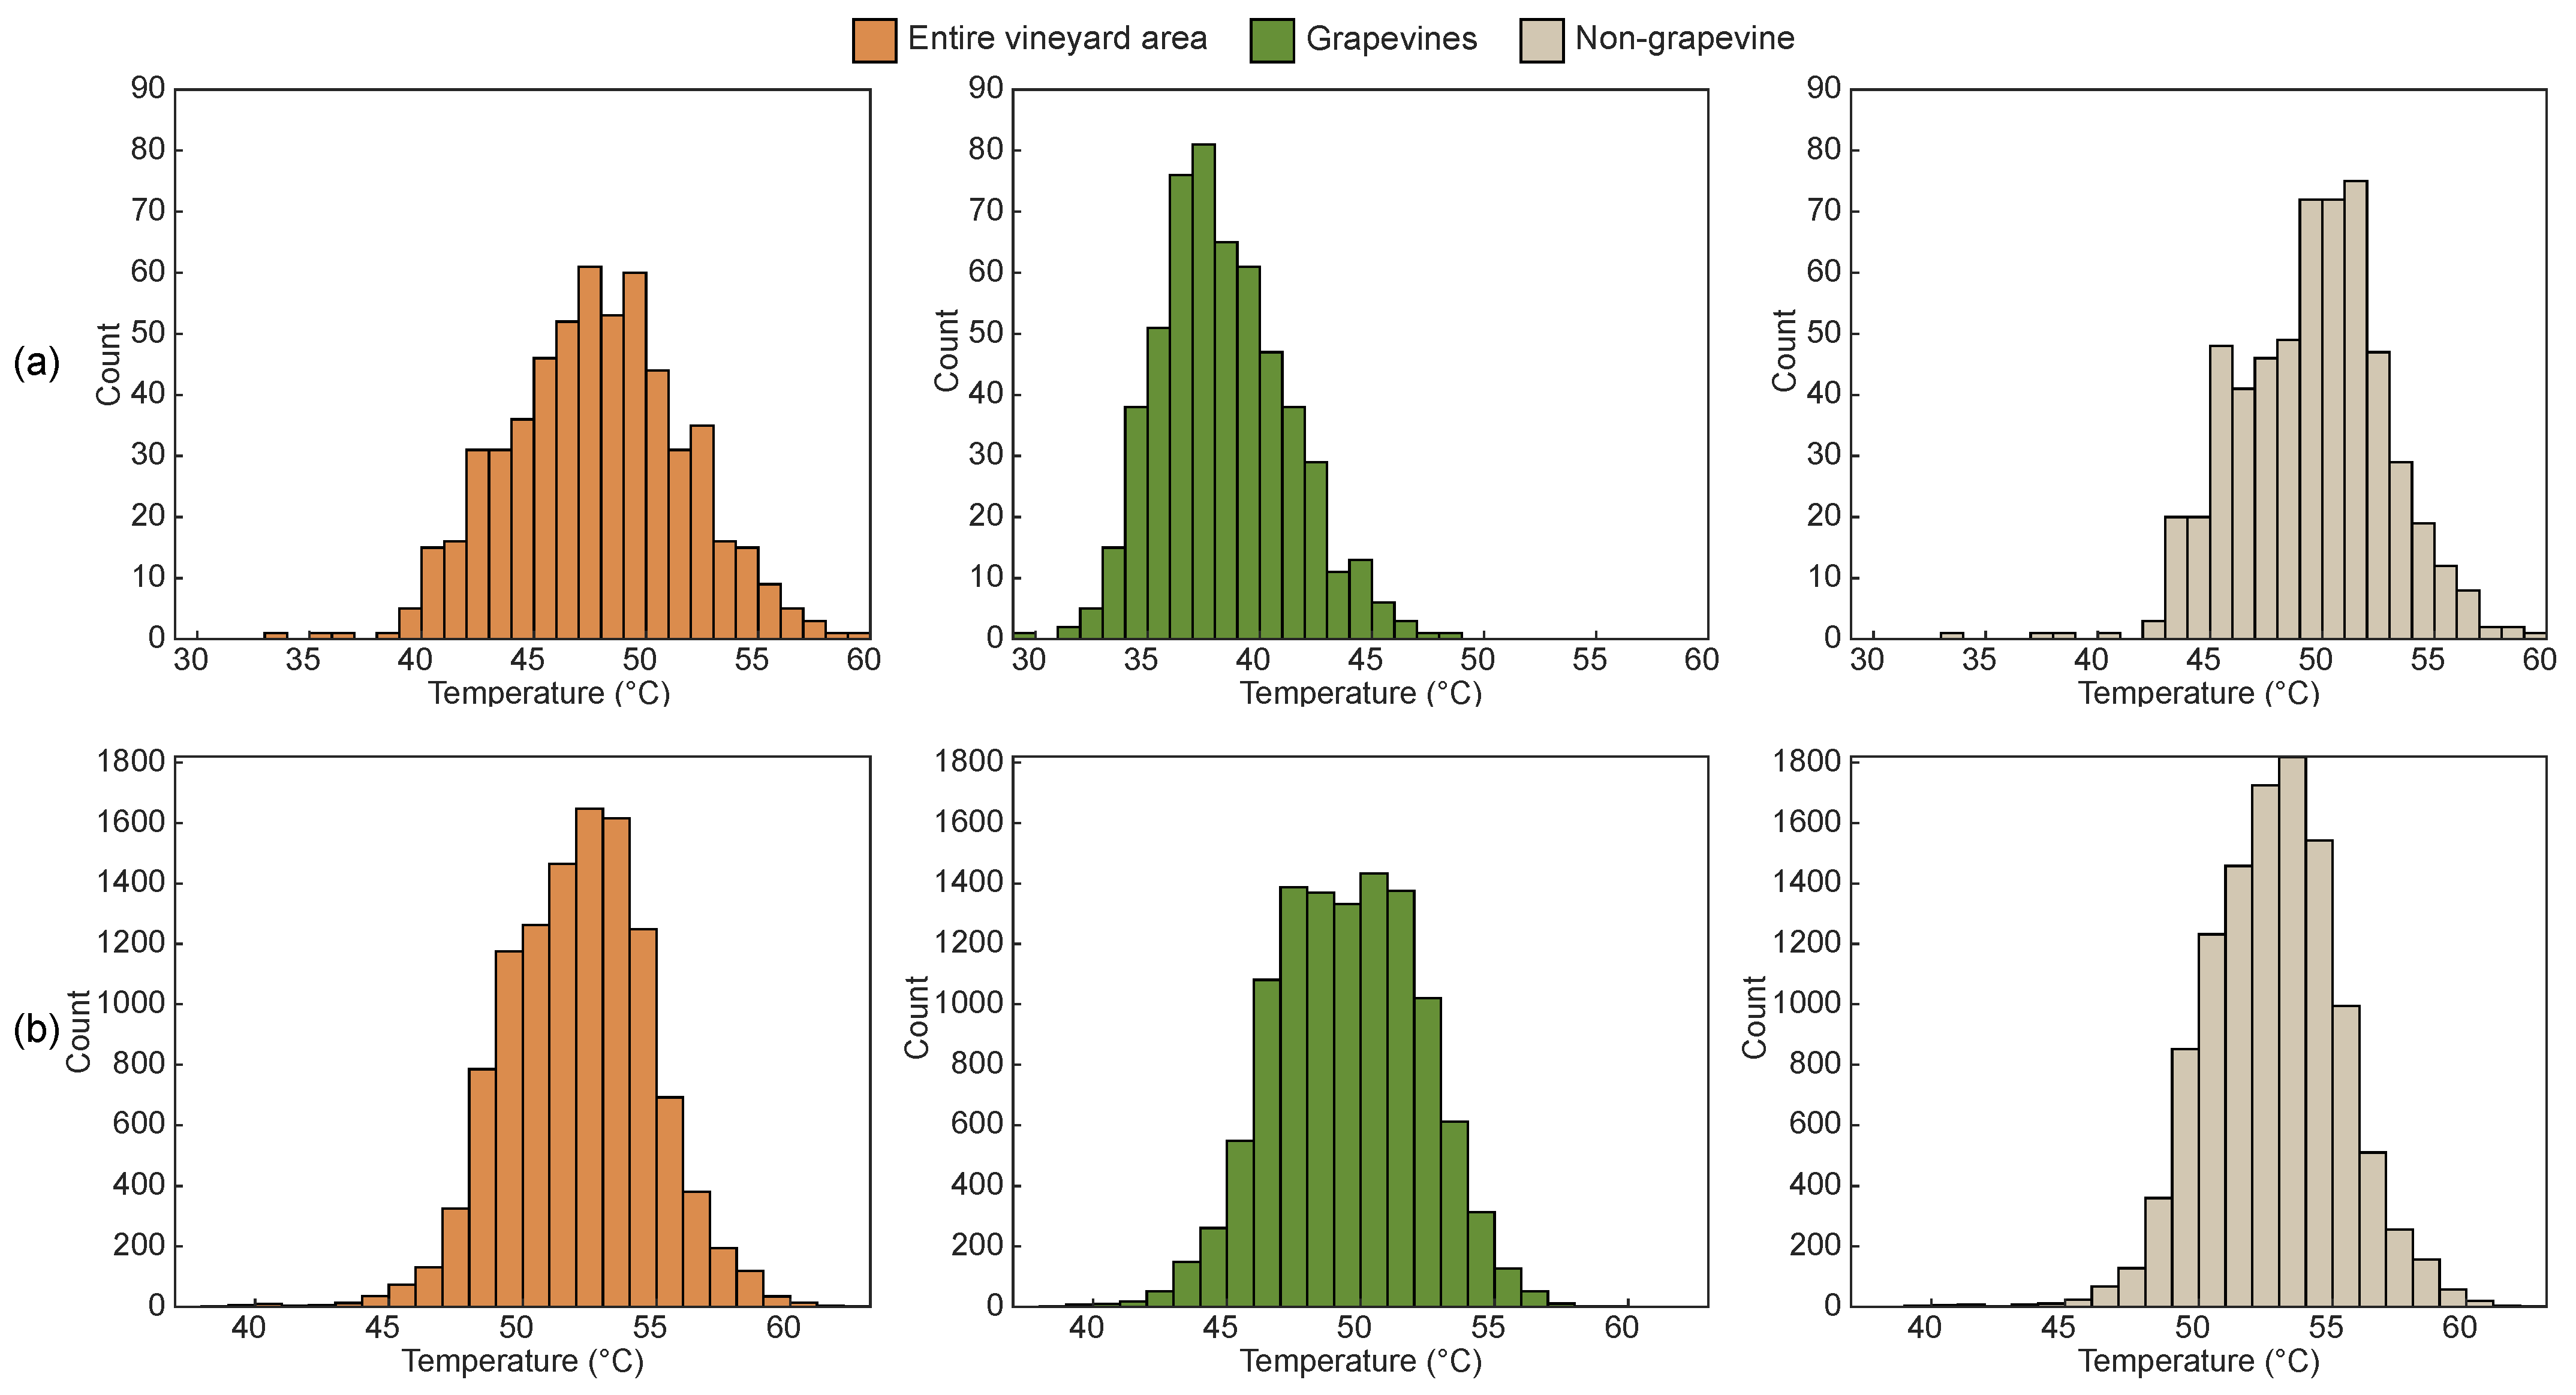
After the application of the grapevine vegetation mask to the LST mosaics, the extraction of the mean temperature values was carried in each row section considering pixels from the entire row section, from grapevines, and from non-grapevine areas. Figure 5 presents the temperature histogram of the studied vineyards in each evaluated approach. Despite the absolute temperature variations, a consistent pattern was verified in both vineyards. Specifically, when focusing only on non-grapevine areas, the highest temperatures are observed, primarily because of the presence of bare soil pixels, whereas grapevine regions show the lowest temperatures. In the case of Vineyard A (Figure 5a), the entire vineyard area displays a mean temperature of 47.8 °C, with a maximum of 59.3 °C and a minimum of 33.1 °C. However, when considering non-grapevine pixels, a slight increase in the mean temperature to 49.5 °C is observed, though the maximum and minimum temperatures remain consistent with those of the entire vineyard area (59.3 °C and 34 °C, respectively). In contrast, analyzing only the grapevine temperature reveals a decrease in the mean temperature to 38.4 °C, indicating a reduction compared to the mean temperature across the entire vineyard area. The same trend is verified for the maximum and minimum temperature values, being 48.1 °C and 29.8 °C, respectively.
In Vineyard B (Figure 3b), a general trend of higher temperatures was observed across the three categories. The mean temperatures for the entire vineyard area, grapevines, and non-grapevines were 52.1 °C, 49.5 °C, and 52.8 °C, respectively. The lowest temperature, 38.3 °C, is observed in grapevine-only sections, while the maximum temperature is 59.5 °C. Among the three data sets, the non-grapevine vegetation registered the highest mean temperature (62.4 °C). Additionally, this dataset showed the highest minimum temperature (39.4 °C). Yet, considering all vineyard information, temperature values ranged from 38.9 °C to 62.2 °C.
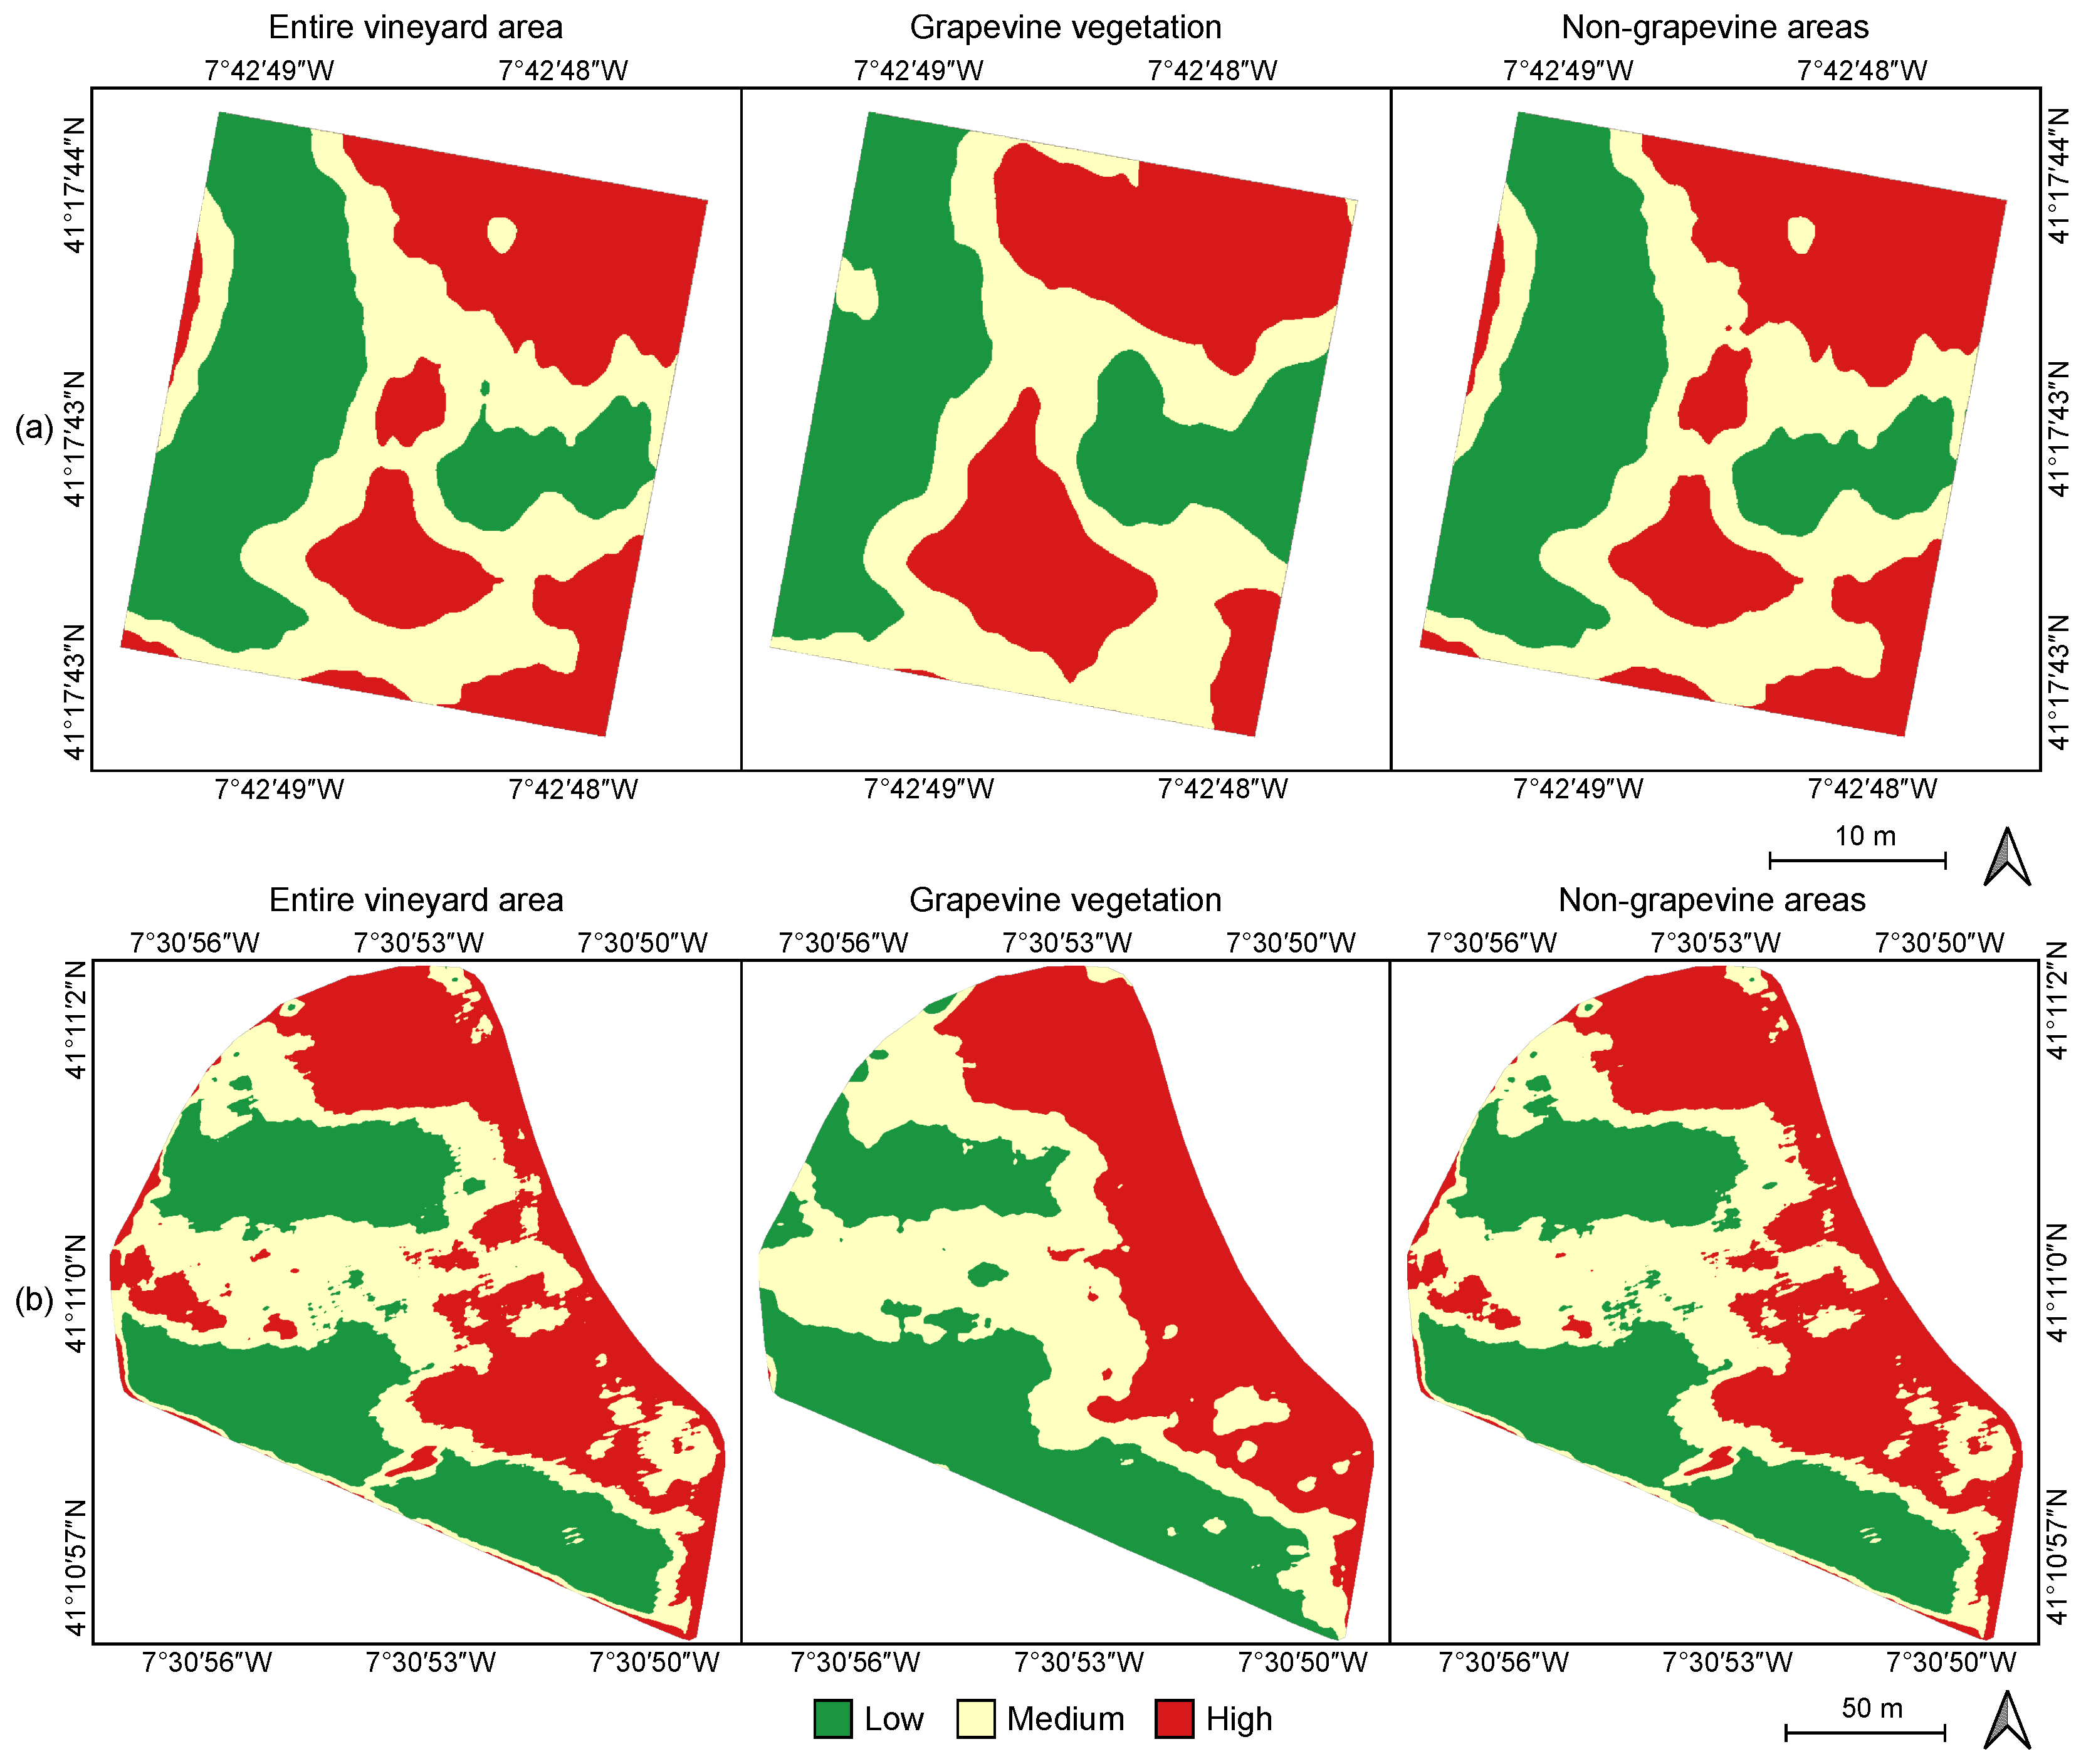
Figure 6 shows the temperature distribution in the vineyards, including grapevine and non-grapevine areas. Major class areas match across all methods, although discrepancies appear when comparing the grapevine data map with others. This is more noticeable in the center of Vineyard A (Figure 6a) and is similar in Vineyard B (Figure 6b). The map from the entire vineyard area and the non-grapevine areas map show more similar patterns.

3.2. Mapping Leak Areas

The temperature thresholds of each approach tested for leak detection in vineyards’ irrigation systems are outlined in Table 1. In both vineyards, lower temperature values are found when considering only pixels belonging to grapevines, followed by entire row section, and non-grapevine areas presenting the higher values.
In Vineyard A, the differences between non-grapevine and grapevine threshold values vary between 5.57 °C, 10.75 °C, and 10.39 °C for the lower quintile, T m e a n σ , and T m e a n 2 σ , respectively. Within the same pixels considered in Vineyard A, the approach that focuses on the lower quintile presents the lower temperature values when considering all pixels from the entire row sections and when using non-grapevine areas within the row sections. Contrarily, when considering the temperature from grapevine pixels, the T m e a n 2 σ approach presented the lowest values (32.55 °C). The T m e a n σ approach presented the higher temperature threshold values, with differences of 5.48 °C for the approach with lower values when using the mean temperature values of the entire row section, 2.92 °C when using grapevine pixels and 7.20 °C when considering temperature from non-grapevine areas. Regarding Vineyard B, the temperature data from each approach considered presents threshold values spanning from 42.53 °C to 50.29 °C (Table 1). The differences between grapevine and non-grapevine threshold values are 1.46 °C (lower quintile), 3.52 °C ( T m e a n σ ), and 3.76 °C ( T m e a n 2 σ ). Across all areas considered, the lower quintile consistently presents the lowest threshold values. On the other hand, the highest threshold values are presented in the T m e a n σ approach, with the non-grapevine areas showing the highest value within this approach, differing by a difference of 6.31 °C from the lowest quintile approach.
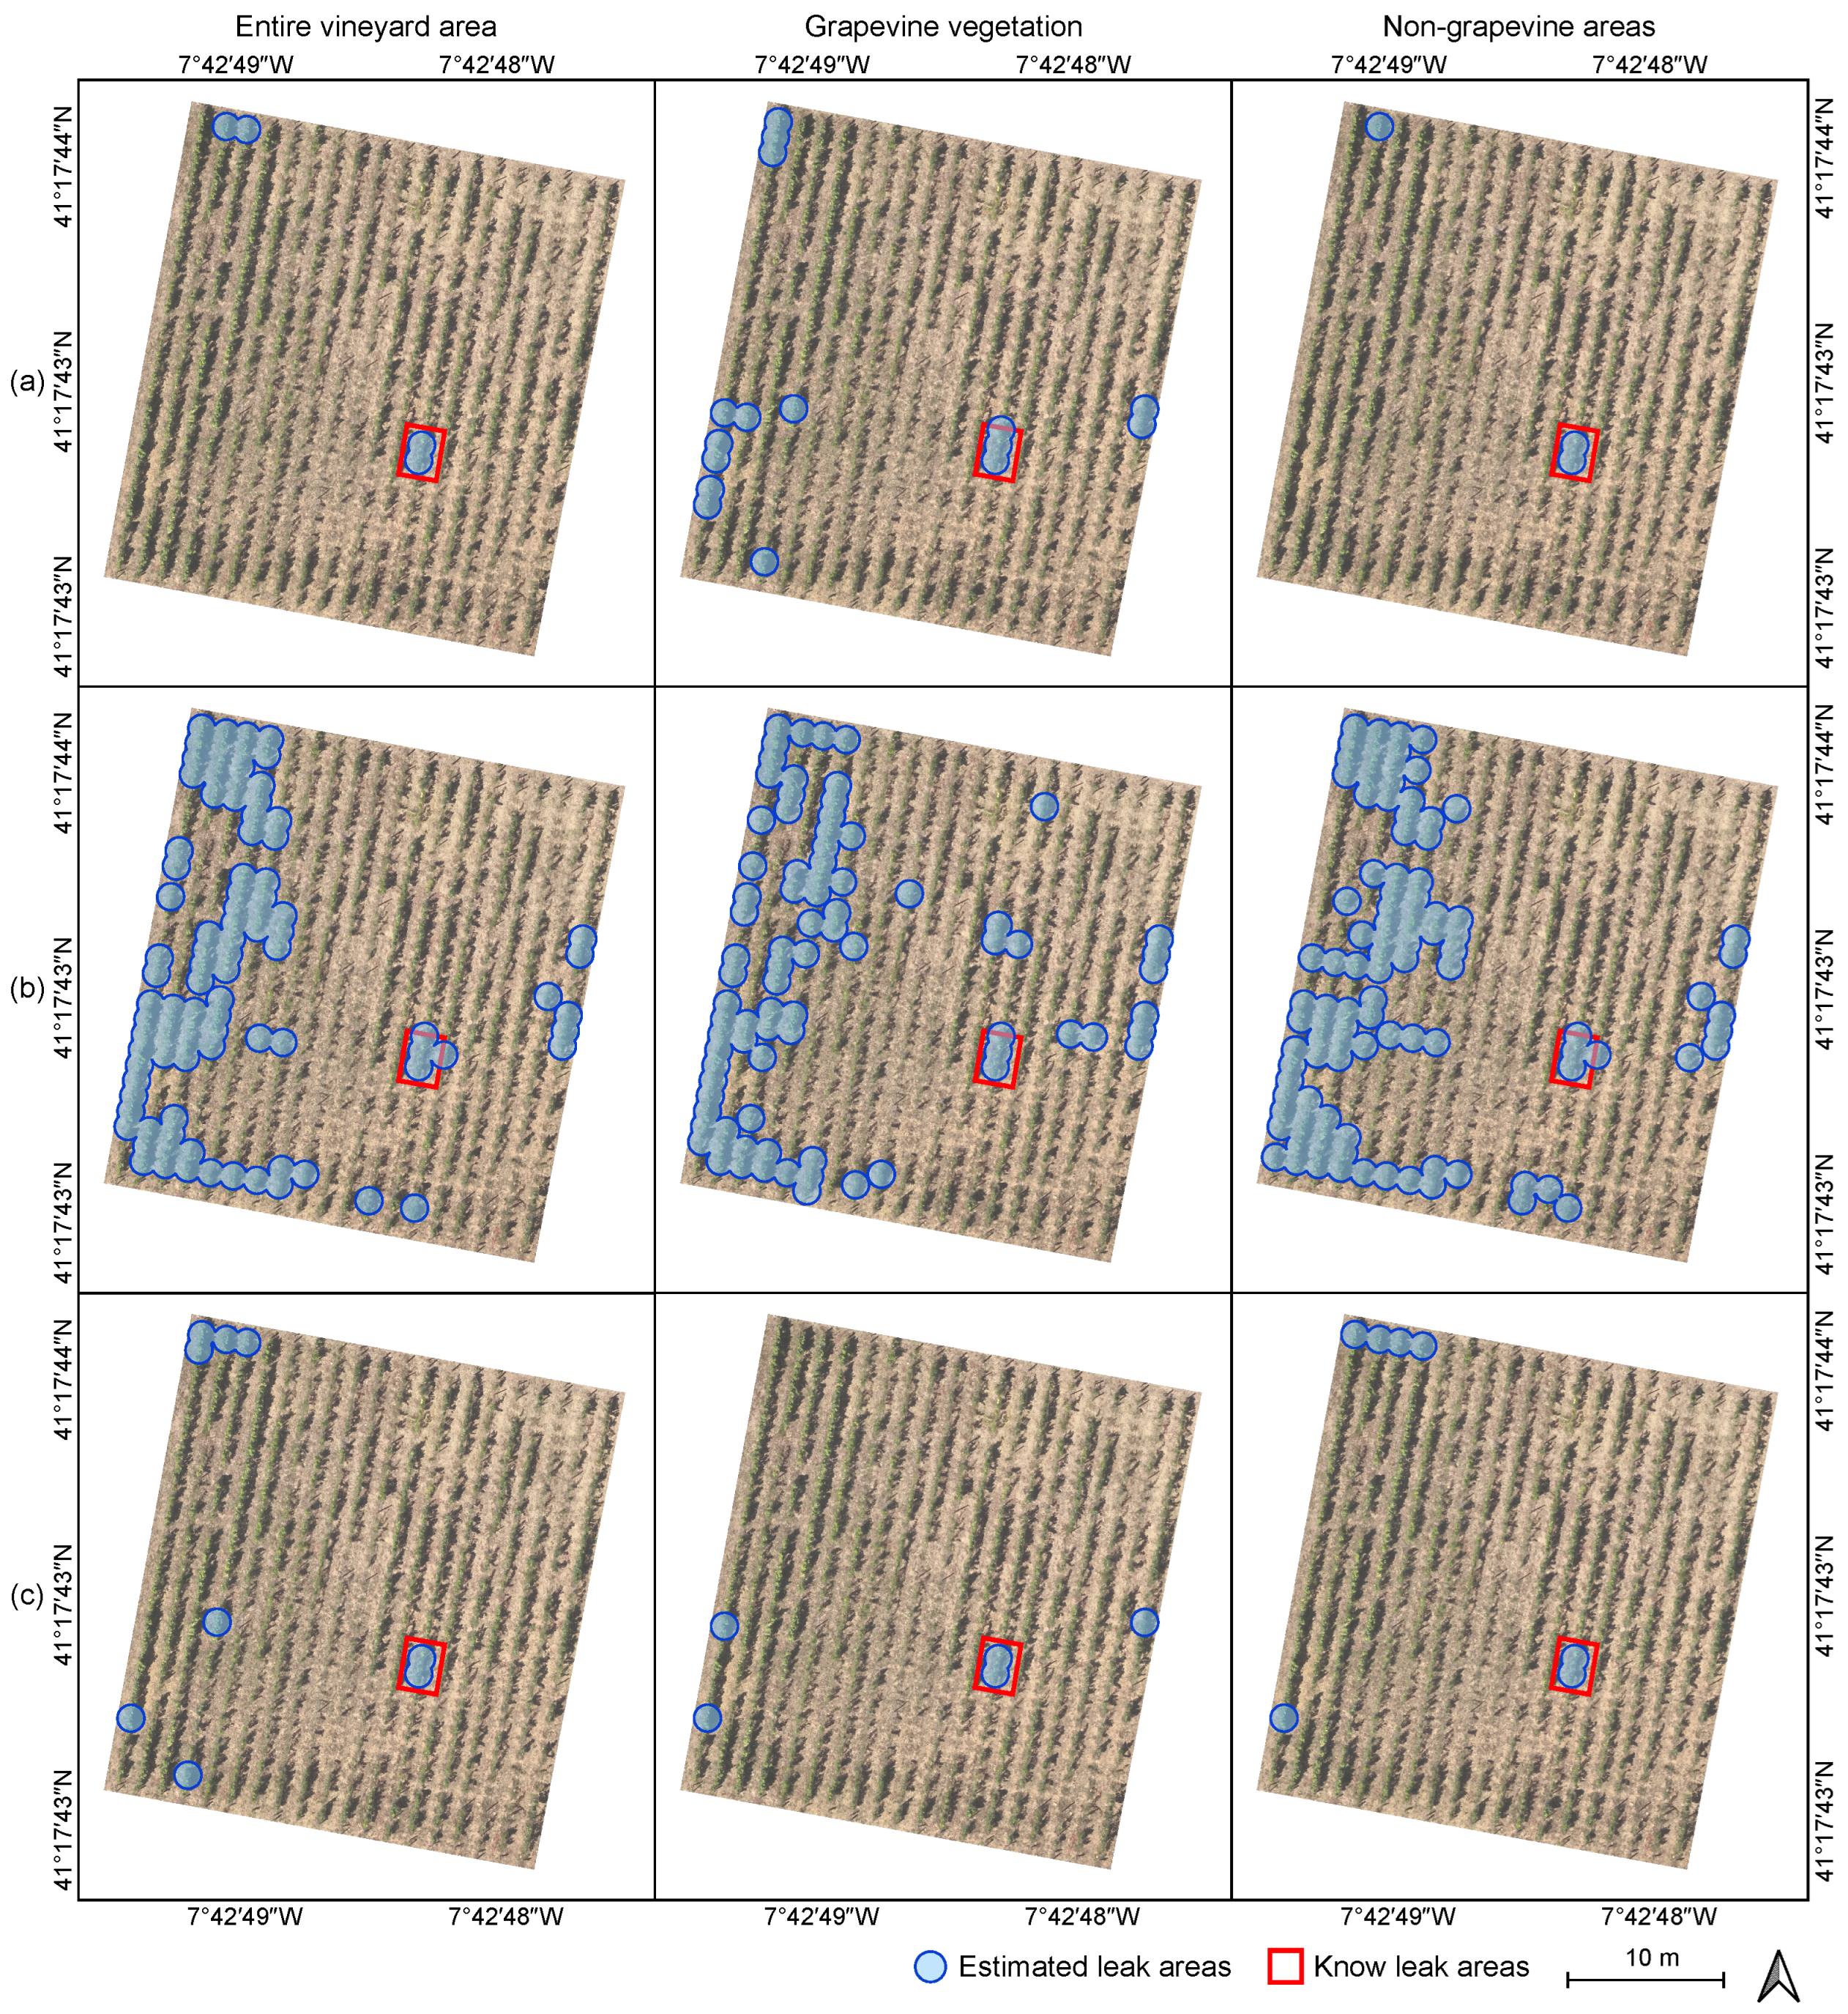
The location of each leaking areas for Vineyard A is presented in Figure 7. When considering the T m e a n σ (Figure 7b), an increased number of potential leakage areas are identified, regardless the part of the vineyard considered. The T m e a n 2 σ approach (Figure 7c) reveals more areas for evaluation across five rows when considering the entire vineyard and non-grapevine areas, and across four rows when only considering temperature data from grapevine vegetation. On the other hand, the lower quintile approach (Figure 7a) presents five rows requiring inspection when analyzing grapevine vegetation only, three rows when considering data from the entire vineyard, and two rows when using temperature data from non-grapevine areas.
Figure 8 illustrates the maps of areas potentially containing leakages in Vineyard B. The lower quintile approach (Figure 8a) identifies fewer sections with potential leaks across the three sets of temperature data analyzed. By applying the threshold values in this approach, three distinct clusters emerge in the vineyard: one in the north and two in the southwest part of the vineyard when considering temperature data from the entire vineyard sections; two clusters in the southwestern part when using temperature data from grapevine vegetation; and two clusters (north and west) when using temperature data from non-grapevine areas. The T m e a n σ approach (Figure 8b) reveals clusters of potential leakages spanning the central and western parts of the vineyard, with these clusters consistent among the three sets of temperatures. As for the T m e a n 2 σ approach (Figure 8c), it identifies more clusters of potential leakages in the north, northwest, and southwest parts of the vineyard, when applying the threshold value for the entire vineyard and for non-grapevine areas. The latter presents more potential leak areas in other parts of the vineyard. When using temperature data from grapevines, large clusters form in the western part of the vineyard, with smaller sections being detected in other areas.
The distance and number of rows to be evaluated, considering each approach and type of temperature data used in both vineyards, are presented in Table 2. Across both vineyards, the T m e a n σ approach presents a larger number of rows and a greater distance to be covered in the field. This is evident when considering non-grapevine vegetation in Vineyard A (103 m, representing 18.1% of the vineyard rows) and the entire area in Vineyard B (1862 m, representing 16.6% of the vineyard rows).
Regarding the use of temperature from non-grapevine areas, the lower quintile approach results in the smallest area requiring evaluation. This approach concentrates leak areas into three meters across two rows (10.5%) in Vineyard A and 26 m across four different rows (3.5%) in Vineyard B. When using temperature data from both grapevine and non-grapevine areas, 4 meters across 3 rows (15.8% of the rows) in Vineyard A and 30 m across 6 rows (5.3%) in Vineyard B are designated for potential leak inspection.
When using temperature data from grapevine vegetation, a greater distance is required for evaluation (16 m in Vineyard A and 52 m in Vineyard B). In the T m e a n 2 σ approach, a slightly greater distance for potential leak inspection is observed compared to the lower quintile approach in Vineyard A, considering temperature data from non-grapevine and both grapevine and non-grapevine areas. However, when considering temperature data from grapevines, a smaller distance is obtained (five meters across three rows). In Vineyard B, these values are higher across all categories.

4. Discussion

4.1. Data and Methodology

Numerous approaches documented in the literature aim to segment or mask crop-related pixels from non-crop ones for TIR imagery. Qin et al. [45] employed a similar approach to the one used in this study to remove soil, using the excess green index (ExG) [46] on wheat. Liu et al. [47] used multispectral imagery to compute NDVI generating a mask for application to the LST map, also on wheat. Segmentation methods directly applied to TIR imagery usually rely on threshold values [48,49,50,51] and/or image processing techniques [52]. Han et al. [50] directly applied thresholds to individual TIR imagery of fruit trees, while Zhang et al. [49] applied temperature thresholds in blueberry crops. Similarly, Ludovisi et al. [48] applied multiple threshold values to segment the TIR imagery of poplar trees to remove pixels corresponding to soil and weed while retaining fixed temperature ranges for estimating average canopy temperature.
The methodology applied in this study for masking LST information (Figure 2) through the RGB orthophoto mosaic ( G n ) and CSM is revealed to be effective in distinguishing between grapevine and non-grapevine vegetation. It relies only on RGB orthophoto mosaics and crop height information to differentiate between grapevine and non-grapevine pixels when masking LST raster products of the same area. This approach is adaptable in scenarios where RGB or CSM data are unavailable. If RGB is not available, CSMs derived from TIR can be used, if they have sufficient resolution [53]. In turn, if CSMs are unavailable, combinations of spectral bands from RGB imagery can be used to identify areas with green leaf vegetation. As the study goal is to analyze potential leak areas within the irrigation system, directly applying segmentation approaches to TIR data may misclassify non-crop pixels as crops, especially shadows and soil with high moisture levels, due to similar or lower temperatures. This may require more complex approaches for accurate segmentation. Moreover, as the UAV used in this study is capable of acquiring both RGB and TIR imagery simultaneously, there are no logistical constraints concerning flight operations. This type of sensor combination is becoming more common with solutions available off-the-shelf at lower costs, this facilitates and economizes the acquisition of UAVs or sensors equipped with both RGB and TIR sensors. Additionally, the methodology used in this study can be easily implemented into a geographical information system.
Different temperature variations across sections of the vineyard rows (Figure 3) are notorious. Indeed, in Vineyard B, a temperature decrease is verified in shadowed areas, while in Vineyard A, temperature drops occur at transitions between grapevines and soil. This can be associated with the time when the flights were conducted and the orientation of the rows. While temperature variations can be influenced by factors other than water leaks, such as shadows, the presence of water leak areas disrupts this typical pattern. This disruption manifests as lower temperatures compared to shadow areas, grapevines, and other surrounding parts, as illustrated in Figure 3. Other studies discarded shadow pixels [54,55], but in this study, omitting shadow pixels could potentially reduce the accuracy of detecting leaks within the vineyard. In fact, depending on the angle of the sun and the orientation of the terrain, shadows may cover a significant portion of the inter-row sections. TIR data acquisition should occur under optimal atmospheric conditions [56], with the sun positioned at a high angle to minimize deep shadows [57] and intra-plant temperature differences. Sunlight influence is noticeable on Figure 3. Moreover, plants at the edges of rows may have higher temperatures [42].
After applying the mask distinguishing grapevine and non-grapevine areas to the LST raster products (Figure 4), two distinct rasters are created: one containing temperature data from non-grapevine areas and the other including temperatures from grapevine vegetation (Figure 2). Analysing these different raster products revealed a consistent temperature range for non-grapevine compared to the raster representing the entire vineyard in each of the vineyards (41 °C and 36.7 °C for Vineyards A and B, respectively). This uniformity in both minimum and maximum temperature values across both vineyards suggests that, with the scope of this study, cooler temperatures indicative of potential leaking areas could potentially be observed by focusing solely on non-grapevine areas. On the other hand, bare soil areas present the highest temperature values. Similar trends and thermal variations are also reported by Lu et al. [55].
The analysis of the histograms of row sections (Figure 5) shows a significant impact of temperature values in non-grapevine areas, where the nonexistence of plants prevents water absorption, leading to water accumulation in the soil [58]. In Vineyard A, the analysis of non-grapevine pixels shows a slight rise in the mean temperature to 49.5 °C, representing a 3.5% increase compared to the mean temperature of the entire vineyard area. Temperatures from grapevines showed a mean temperature decrease to 38.4 °C, revealing a 20% decrease compared to the mean temperature of the entire vineyard area. The temperature range in Vineyard B is slightly narrower, indicating less variability compared to Vineyard A. Moreover, in Vineyard B, the mean temperatures for the entire vineyard area, grapevines and non-grapevines are higher compared to Vineyard A. In the method proposed by Li et al. [52], the temperature histograms of raw TIR imagery show two pronounced peaks, one representing canopy and another representing soil. After filtering, only one peak is observed, similar to Figure 5 on grapevine vegetation.
The temperature distribution classes (Figure 6) shows that the distribution of non-grapevine areas are more similar to the entire vineyard area, highlighting their significant contribution to the generated map, with minimal variations within the clusters of each class. The temperature distribution classes specific to grapevine vegetation (Figure 6) can be used for the application of crop water stress index (CWSI) [59] distribution at high resolution [57], this type of maps shows spatial correlations with vegetative vigor and vineyard heterogeneity [43,60].

4.2. Estimated Leak Areas

The proposed method uses statistical measures to evaluate the sensitivity of leak detection, offering a more precise evaluation of potential issues in the irrigation system within the vineyard. This approach contrasts with using fixed temperature values, which may vary across vineyards and survey periods.
The temperature thresholds (Table 1) for the different values used to estimate areas containing potential leaks shows lower temperature values when using the lower quintile value for non-grapevine temperature and entire vineyard areas. Similarly, in Vineyard B, lower temperature values are observed. In Vineyard A, using only grapevine temperature, the T m e a n 2 σ has a lower temperature value. On the other hand, higher temperature threshold values are verified in the T m e a n σ , regardless of the vineyard area where the temperature was measured. This difference highlights the temperature variations between different areas within the same vineyard.
When analyzing the results of potential leaking areas for both Vineyard A (Figure 7) and Vineyard B (Figure 8), different trends emerge. In Vineyard A, using the lower quintile value (Figure 7a), the areas with leaks when using both the mean temperature of the entire vineyard and non-grapevine areas in the row sections are effectively addressed. However, it tends to overestimate the known leak areas when using temperature data from grapevine vegetation. Similarly, in Vineyard B, this approach (Figure 8a) highlights the identified leak areas, but fails to detect the smaller area in the north of the vineyard when considering only grapevine vegetation. Additionally, it shows some exaggeration in the limits of the identified leaking area, particularly verified when considering the entire vineyard area. On the other hand, using the T m e a n σ approach (Figure 7b and Figure 8b) showed a pronounced exaggeration of potential leaking areas in both vineyards, following the observed temperature differences in the vineyards (Figure 1). This becomes more evident when compared with the maps of temperature low temperature class (Figure 6). In contrast, the map of potential leak areas in the T m e a n 2 σ approach showed a good performance in Vineyard A (Figure 7c), particularly when considering the threshold value applied to non-grapevine temperature. However, in Vineyard B (Figure 8c), this consistency was not verified, as the known leak areas are detected but there is an overestimation when considering the temperature from non-grapevine areas.
The row distances required for inspection in the vineyard across different approaches (lower quintile, T m e a n σ , and T m e a n 2 σ ), offer insights into spatial considerations for evaluating inspection methodologies. Using the lower quantile approach resulted in the shortest distance to be evaluated and the fewest number of rows in both vineyards (Table 1). This observation implies that the temperature variations in non-grapevine regions might serve as a reliable indicator for detecting areas with potential irrigation system leaks. As for the temperature data used (grapevines, non-grapevine areas, or both), the grapevine vegetation temperature showed more areas to be evaluated. This could mean that these values are indicating areas where plants are well watered rather than areas with leaks. This inference is supported by the fact that, when compared with the other two approaches, fewer rows are identified, and only a short distance needs to be evaluated. For instance, a leak area in the northern part of Vineyard B (Figure 8) was detected when using the entire temperature of the row section and when using only non-grapevine vegetation temperature, as this leak formed a small water puddle in the soil.
From the analysis of the obtained results, the use of the lower quintile value within the non-grapevine areas in the row sections can be deemed as more efficient in detecting the leak areas. This approach demonstrates consistency across both vineyards, requiring a lower distance (<1%) to be evaluated across fewer rows (approximately 10% in Vineyard A and less than 5% in Vineyard B). It showed efficiency since leak areas in both vineyards stand out as outliers from the overall temperature distribution within the vineyard (Figure 5). Temperature in areas with water leaks is significantly lower than that in shadowed areas, grapevines, and other parts of the vineyard (Figure 3), making them easily identifiable. This temperature contrast improves the ability to accurately detect these areas. On the other hand, the T m e a n σ approach, based on the work of Dag et al. [39], did not provide the optimal results, showing a clear overestimation potential leak areas across more rows and a greater distance. However, the use of the T m e a n 2 σ approach shows consistency, regardless of the area from which the data is obtained. This approach requires inspecting 1% to approximately 2% of rows needing to be evaluated across 15% to 30% of the total number of rows. This approach can be used when a more detailed inspection of the irrigation system is intended to be performed. Conversely, the maps and analysis resulting from the use of the lower quintile approach can effectively identify areas where immediate intervention is needed. Both the lower quintile approach and the approach using T m e a n 2 σ proven to be efficient methods for inspecting leaks in vineyard irrigation systems. These methods provide specific areas for evaluation, thereby reducing the time required for fieldwork. Ultimately, these approaches allow the restoration of the irrigation system to its normal operational state. Despite these findings, it is crucial to conduct additional research and maintain consistent observations to improve the reliability of the proposed methods. This includes evaluating additional vineyards across various temperature conditions and phenological stages to further refine the methodology. In addition to leak detection, the method can also be tested for detecting clogs in vineyard irrigation system.
Furthermore, the use of TIR imagery in vineyards can be extended, by integrating it with other types of UAV-based imagery. Combining TIR and multispectral data is useful for estimating soil water content [61,62,63] and implementing site-specific irrigation management strategies [64]. Additionally, exploring the use of thermal point clouds could be advantageous, as they can help refine temperature values compared to raster products [65]. However, it is worth noting that such point clouds, may lack resolution and accurate geometry representation when compared to RGB point clouds [66]. With the possibility to extend the LST data to compute plant related indices such as CWSI which can enable the assessment of plant water status and irrigation demand [57] as well as stomatal conductance [67,68]. Another application applicability of TIR imagery is monitoring dry stone terraced vineyards [69], it can be used to analyze differences in rows near dry stone walls and the ones from the walls at the same terrace.

5. Conclusions

This study explores the application of orthorectified raster products derived from the photogrammetric processing of UAV-based RGB and TIR imagery to map potential leaks in vineyard irrigation systems. It considers examining various sections of vineyard plots and implementing different GIS techniques. The RGB data are used to classify grapevine and non-grapevine pixels, enabling the segmentation of LST maps into three distinct categories: grapevines, non-grapevine areas, and the entire vineyard. Mean temperature values from these categories are then extracted across several sections of the vineyard rows.
Three different approaches were employed to determine threshold values for mapping potential leaks along the rows. These approaches were based on the mean, standard deviation, and quintiles of the temperature information extracted from vineyard row sections. The application of the methodology followed in this study can contribute to sustainable practices for improved water and nutrient management in viticulture by helping to enhance the efficiency of water and mineral resources. Results from each approach highlight the significance of non-grapevine areas, characterized by temperatures below the lower quintile value, as indicators for leak identification. However, the use of only grapevine temperature was inadequate for detecting identified leak areas. In contrast, the use of the T m e a n 2 σ can be effective for more extensive inspections. This information is particularly valuable for winegrowers, offering a time-efficient approach for field inspections and targeted maintenance efforts. Future research should include the analysis of 3D point clouds through projection methods of thermal data into the RGB information. This would enable the creation of 3D segmentation methods to separate the different vineyard elements, allowing for an analysis of soil information bellow grapevine plants, reducing the temperature influence from grapevines. Nevertheless, the methodology presented in this study could be applied in other crops using drip irrigation systems, with crop-specific modifications. This potential extension would enable an evaluation of its suitability and consistency across various crops.

Author Contributions

Conceptualization, L.P., P.M. and J.J.S.; methodology, L.P.; software, L.P. and P.M.; validation, L.P. and P.M.; formal analysis, L.P. and P.M.; investigation, L.P., P.M., L.-T.D. and J.M.-P.; resources, J.J.S., R.M. and E.P.; data curation, L.P.; writing—original draft preparation, L.P. and P.M.; writing—review and editing, P.M., L.-T.D., J.M.-P., J.J.S. and E.P.; visualization, L.P.; supervision, R.M., J.J.S. and E.P.; project administration, L.P.; funding acquisition, L.-T.D., J.M.-P., J.J.S., R.M. and E.P. All authors have read and agreed to the published version of the manuscript.

Funding

This research activity was supported by the Vine&Wine Portugal Project, co-financed by the RRP—Recovery and Resilience Plan and the European NextGeneration EU Funds, within the scope of the Mobilizing Agendas for Reindustrialization, under ref. C644866286-00000011; the project “DATI—Digital Agriculture Technologies for Irrigation efficiency” co-funded by the Portuguese Foundation for Science and Technology (FCT), under ref. PRIMA/0007/2020 (https://doi.org/10.54499/PRIMA/0007/2020); and by National Funds by FCT, under the projects UIDB/04033/2020 (https://doi.org/10.54499/UIDB/04033/2020) and LA/P/0126/2020 (https://doi.org/10.54499/LA/P/0126/2020).

Data Availability Statement

The data that support the findings of this study are available from the corresponding author upon reasonable request.

Conflicts of Interest

The authors declare no conflicts of interest. The funders had no role in the design of the study; in the collection, analyses, or interpretation of data; in the writing of the manuscript; or in the decision to publish the results.

References

  1. OIV. Statistical Report on World Vitiviniculture; OIV: Paris, France, 2018. [Google Scholar]
  2. Agrimonti, C.; Lauro, M.; Visioli, G. Smart agriculture for food quality: Facing climate change in the 21st century. Crit. Rev. Food Sci. Nutr. 2021, 61, 971–981. [Google Scholar] [CrossRef] [PubMed]
  3. Yerlikaya, B.A.; Ömezli, S.; Aydoğan, N. Climate change forecasting and modeling for the year of 2050. In Environment, Climate, Plant and Vegetation Growth; Springer: Cham, Switzerlnad, 2020; pp. 109–122. [Google Scholar]
  4. Fraga, H.; Molitor, D.; Leolini, L.; Santos, J.A. What is the impact of heatwaves on European viticulture? A modelling assessment. Appl. Sci. 2020, 10, 3030. [Google Scholar] [CrossRef]
  5. Fraga, H. Viticulture and winemaking under climate change. Agronomy 2019, 9, 783. [Google Scholar] [CrossRef]
  6. Moutinho-Pereira, J.; Magalhães, N.; Gonçalves, B.; Bacelar, E.; Brito, M.; Correia, C. Gas exchange and water relations of three Vitis vinifera L. cultivars growing under Mediterranean climate. Photosynthetica 2007, 45, 202–207. [Google Scholar] [CrossRef]
  7. Coombe, B. Influence of temperature on composition and quality of grapes. In Proceedings of the Symposium on Grapevine Canopy and Vigor Management, XXII IHC 206, Davis, CA, USA, 18 August 1986; pp. 23–36. [Google Scholar]
  8. Hardie, W.J.; Martin, S.R. Shoot growth on de-fruited grapevines: A physiological indicator for irrigation scheduling. Aust. J. Grape Wine Res. 2000, 6, 52–58. [Google Scholar] [CrossRef]
  9. Iglesias, A.; Garrote, L. Adaptation strategies for agricultural water management under climate change in Europe. Agric. Water Manag. 2015, 155, 113–124. [Google Scholar] [CrossRef]
  10. Sadras, V.O.; Moran, M.A. Elevated temperature decouples anthocyanins and sugars in berries of Shiraz and Cabernet Franc. Aust. J. Grape Wine Res. 2012, 18, 115–122. [Google Scholar] [CrossRef]
  11. Moran, M.A.; Sadras, V.O.; Petrie, P.R. Late pruning and carry-over effects on phenology, yield components and berry traits in Shiraz. Aust. J. Grape Wine Res. 2017, 23, 390–398. [Google Scholar] [CrossRef]
  12. Romero, P.; Navarro, J.M.; Ordaz, P.B. Towards a sustainable viticulture: The combination of deficit irrigation strategies and agroecological practices in Mediterranean vineyards. A review and update. Agric. Water Manag. 2022, 259, 107216. [Google Scholar] [CrossRef]
  13. Madramootoo, C.A.; Morrison, J. Advances and challenges with micro-irrigation. Irrig. Drain. 2013, 62, 255–261. [Google Scholar] [CrossRef]
  14. Evans, R.G.; Wu, I.P.; Smajstrala, A.G. Microirrigation systems. In Design and Operation of Farm Irrigation Systems, 2nd ed.; American Society of Agricultural and Biological Engineers: St. Joseph, MI, USA, 2007; pp. 632–683. [Google Scholar]
  15. Alves Coelho, J.; Glória, A.; Sebastião, P. Precise water leak detection using machine learning and real-time sensor data. IoT 2020, 1, 474–493. [Google Scholar] [CrossRef]
  16. Khulief, Y.; Khalifa, A.; Mansour, R.B.; Habib, M. Acoustic detection of leaks in water pipelines using measurements inside pipe. J. Pipeline Syst. Eng. Pract. 2012, 3, 47–54. [Google Scholar] [CrossRef]
  17. Tsouros, D.C.; Bibi, S.; Sarigiannidis, P.G. A review on UAV-based applications for precision agriculture. Information 2019, 10, 349. [Google Scholar] [CrossRef]
  18. Sassu, A.; Gambella, F.; Ghiani, L.; Mercenaro, L.; Caria, M.; Pazzona, A.L. Advances in unmanned aerial system remote sensing for precision viticulture. Sensors 2021, 21, 956. [Google Scholar] [CrossRef] [PubMed]
  19. Matese, A.; Baraldi, R.; Berton, A.; Cesaraccio, C.; Di Gennaro, S.F.; Duce, P.; Facini, O.; Mameli, M.G.; Piga, A.; Zaldei, A. Estimation of water stress in grapevines using proximal and remote sensing methods. Remote Sens. 2018, 10, 114. [Google Scholar] [CrossRef]
  20. Romero, M.; Luo, Y.; Su, B.; Fuentes, S. Vineyard water status estimation using multispectral imagery from an UAV platform and machine learning algorithms for irrigation scheduling management. Comput. Electron. Agric. 2018, 147, 109–117. [Google Scholar] [CrossRef]
  21. Loggenberg, K.; Strever, A.; Greyling, B.; Poona, N. Modelling water stress in a Shiraz vineyard using hyperspectral imaging and machine learning. Remote Sens. 2018, 10, 202. [Google Scholar] [CrossRef]
  22. Kandylakis, Z.; Falagas, A.; Karakizi, C.; Karantzalos, K. Water stress estimation in vineyards from aerial SWIR and multispectral UAV data. Remote Sens. 2020, 12, 2499. [Google Scholar] [CrossRef]
  23. Pádua, L.; Bernardo, S.; Dinis, L.T.; Correia, C.; Moutinho-Pereira, J.; Sousa, J.J. The Efficiency of Foliar Kaolin Spray Assessed through UAV-Based Thermal Infrared Imagery. Remote Sens. 2022, 14, 4019. [Google Scholar] [CrossRef]
  24. Spachos, P.; Gregori, S. Integration of wireless sensor networks and smart uavs for precision viticulture. IEEE Internet Comput. 2019, 23, 8–16. [Google Scholar] [CrossRef]
  25. López-Granados, F.; Torres-Sánchez, J.; Jiménez-Brenes, F.M.; Oneka, O.; Marín, D.; Loidi, M.; de Castro, A.I.; Santesteban, L.G. Monitoring vineyard canopy management operations using UAV-acquired photogrammetric point clouds. Remote Sens. 2020, 12, 2331. [Google Scholar] [CrossRef]
  26. De Castro, A.I.; Jiménez-Brenes, F.M.; Torres-Sánchez, J.; Peña, J.M.; Borra-Serrano, I.; López-Granados, F. 3-D characterization of vineyards using a novel UAV imagery-based OBIA procedure for precision viticulture applications. Remote Sens. 2018, 10, 584. [Google Scholar] [CrossRef]
  27. Di Gennaro, S.F.; Dainelli, R.; Palliotti, A.; Toscano, P.; Matese, A. Sentinel-2 validation for spatial variability assessment in overhead trellis system viticulture versus UAV and agronomic data. Remote Sens. 2019, 11, 2573. [Google Scholar] [CrossRef]
  28. Torres-Sánchez, J.; Marín, D.; De Castro, A.; Oria, I.; Jiménez-Brenes, F.; Miranda, C.; Santesteban, L.; López-Granados, F. Assessment of vineyard trimming and leaf removal using UAV photogrammetry. In Precision Agriculture’19; Wageningen Academic Publishers: Wageningen, The Netherlands, 2019; p. e0130479. [Google Scholar]
  29. Dufek, J.; Traore, S.; Swanson, C.; Fipps, G.; Murphy, R. Preventing irrigation canal breaches using small unmanned aerial system with multispectral payload. In Proceedings of the 2019 IEEE International Symposium on Safety, Security, and Rescue Robotics (SSRR), Würzburg, Germany, 2–4 September 2019; pp. 133–138. [Google Scholar]
  30. Traore, S.; Fipps, G.; Swanson, C.; Dufek, J.; Robin, M. Unmanned aerial vehicle system integrating high-resolution sensors for detecting leaks in irrigation canals—Proof of concept. Irrig. Drain. 2022, 71, 206–217. [Google Scholar] [CrossRef]
  31. Rouse, J.W.; Haas, R.H.; Schell, J.A.; Deering, D.W. Monitoring vegetation systems in the Great Plains with ERTS. NASA Spec. Publ. 1974, 351, 309. [Google Scholar]
  32. Sener, M.; Pehlivan, M.; Tekiner, M.; Ozden, U.E.; Erdem, T.; Celen, H.H.; Seren, A.; Aytac, S.A.; Kolsuz, H.U.; Seyrek, K.; et al. Monitoring of irrigation schemes by using thermal camera mounted UAVs. Feb-Fresenius Environ. Bull. 2019, 28, 4684–4691. [Google Scholar]
  33. Chatelard, C.; Muñoz, J.S.; Krapez, J.C.; Mazel, C.; Olichon, V.; Polo, J.B.; Frédéric, Y.M.; Hélias, F.; Barillot, P.; Legoff, I.; et al. Leak detection in water transmission systems by multispectral remote sensing with airplane and UAV. In Proceedings of the IGARSS 2019–2019 IEEE International Geoscience and Remote Sensing Symposium, Yokohama, Japan, 28 July–2 August 2019; pp. 7124–7127. [Google Scholar]
  34. Krapez, J.C.; Muñoz, J.S.; Chatelard, C.; Mazel, C.; Olichon, V.; Polo, J.B.; Frédéric, Y.M.; Coiro, E.; Carreira, D.; Carvalho, A. Assessment of the triangle method (T-VI) for detection of water leaks from airplane and UAV. In Proceedings of the IGARSS 2020–2020 IEEE International Geoscience and Remote Sensing Symposium, Waikoloa, HI, USA, 26 September–2 October 2020; pp. 4715–4718. [Google Scholar]
  35. Krapez, J.C.; Sanchis Muñoz, J.; Mazel, C.; Chatelard, C.; Déliot, P.; Frédéric, Y.M.; Barillot, P.; Hélias, F.; Barba Polo, J.; Olichon, V.; et al. Multispectral optical remote sensing for water-leak detection. Sensors 2022, 22, 1057. [Google Scholar] [CrossRef]
  36. Rondeaux, G.; Steven, M.; Baret, F. Optimization of soil-adjusted vegetation indices. Remote Sens. Environ. 1996, 55, 95–107. [Google Scholar] [CrossRef]
  37. Kalo, N.; Edan, Y.; Alchanatis, V. Detection of irrigation malfunctions based on thermal imaging. In Precision Agriculture’21; Wageningen Academic Publishers: Wageningen, The Netherlands, 2021; pp. 2217–2224. [Google Scholar]
  38. Otsu, N. A threshold selection method from gray-level histograms. IEEE Trans. Syst. Man Cybern. 1979, 9, 62–66. [Google Scholar] [CrossRef]
  39. Dag, A.; Cohen, Y.; Alchanatis, V.; Zipori, I.; Sprinstin, M.; Cohen, A.; Maaravi, T.; Naor, A. Automated detection of malfunctions in drip-irrigation systems using thermal remote sensing in vineyards and olive orchards. In Precision Agriculture’15; Wageningen Academic Publishers: Wageningen, The Netherlands, 2015; pp. 12–23. [Google Scholar]
  40. Richardson, A.D.; Jenkins, J.P.; Braswell, B.H.; Hollinger, D.Y.; Ollinger, S.V.; Smith, M.L. Use of digital webcam images to track spring green-up in a deciduous broadleaf forest. Oecologia 2007, 152, 323–334. [Google Scholar] [CrossRef]
  41. Pádua, L.; Marques, P.; Hruška, J.; Adão, T.; Bessa, J.; Sousa, A.; Peres, E.; Morais, R.; Sousa, J.J. Vineyard properties extraction combining UAS-based RGB imagery with elevation data. Int. J. Remote Sens. 2018, 39, 5377–5401. [Google Scholar] [CrossRef]
  42. Pádua, L.; Adão, T.; Sousa, A.; Peres, E.; Sousa, J.J. Individual grapevine analysis in a multi-temporal context using UAV-based multi-sensor imagery. Remote Sens. 2020, 12, 139. [Google Scholar] [CrossRef]
  43. Pádua, L.; Marques, P.; Adão, T.; Guimarães, N.; Sousa, A.; Peres, E.; Sousa, J.J. Vineyard variability analysis through UAV-based vigour maps to assess climate change impacts. Agronomy 2019, 9, 581. [Google Scholar] [CrossRef]
  44. Duarte, L.; Teodoro, A.C.; Sousa, J.J.; Pádua, L. QVigourMap: A GIS open source application for the creation of canopy vigour maps. Agronomy 2021, 11, 952. [Google Scholar] [CrossRef]
  45. Qin, W.; Wang, J.; Ma, L.; Wang, F.; Hu, N.; Yang, X.; Xiao, Y.; Zhang, Y.; Sun, Z.; Wang, Z.; et al. UAV-Based Multi-Temporal Thermal Imaging to Evaluate Wheat Drought Resistance in Different Deficit Irrigation Regimes. Remote Sens. 2022, 14, 5608. [Google Scholar] [CrossRef]
  46. Chen, J.; Yi, S.; Qin, Y.; Wang, X. Improving estimates of fractional vegetation cover based on UAV in alpine grassland on the Qinghai–Tibetan Plateau. Int. J. Remote Sens. 2016, 37, 1922–1936. [Google Scholar] [CrossRef]
  47. Liu, H.; Song, W.; Lv, J.; Gui, R.; Shi, Y.; Lu, Y.; Li, M.; Chen, L.; Chen, X. Precise Drought Threshold Monitoring in Winter Wheat Using the Unmanned Aerial Vehicle Thermal Method. Remote Sens. 2024, 16, 710. [Google Scholar] [CrossRef]
  48. Ludovisi, R.; Tauro, F.; Salvati, R.; Khoury, S.; Mugnozza Scarascia, G.; Harfouche, A. UAV-based thermal imaging for high-throughput field phenotyping of black poplar response to drought. Front. Plant Sci. 2017, 8, 1681. [Google Scholar] [CrossRef] [PubMed]
  49. Zhang, Y.; Zhou, J.; Meng, L.; Li, M.; Ding, L.; Ma, J. A method for deriving plant temperature from UAV TIR Image. In Proceedings of the 2018 7th International Conference on Agro-Geoinformatics (Agro-Geoinformatics), Hangzhou, China, 6–9 August 2018; pp. 1–5. [Google Scholar]
  50. Han, Y.; Tarakey, B.A.; Hong, S.J.; Kim, S.Y.; Kim, E.; Lee, C.H.; Kim, G. Calibration and image processing of aerial thermal image for UAV application in crop water stress estimation. J. Sens. 2021, 2021, 5537795. [Google Scholar] [CrossRef]
  51. Pagacz, S.; Witczuk, J. Estimating ground surface visibility on thermal images from drone wildlife surveys in forests. Ecol. Inform. 2023, 78, 102379. [Google Scholar] [CrossRef]
  52. Li, W.; Liu, C.; Yang, Y.; Awais, M.; Li, W.; Ying, P.; Ru, W.; Cheema, M. A UAV-aided prediction system of soil moisture content relying on thermal infrared remote sensing. Int. J. Environ. Sci. Technol. 2022, 19, 9587–9600. [Google Scholar] [CrossRef]
  53. Zhou, Z.; Majeed, Y.; Naranjo, G.D.; Gambacorta, E.M. Assessment for crop water stress with infrared thermal imagery in precision agriculture: A review and future prospects for deep learning applications. Comput. Electron. Agric. 2021, 182, 106019. [Google Scholar] [CrossRef]
  54. Poblete, T.; Ortega-Farías, S.; Ryu, D. Automatic Coregistration Algorithm to Remove Canopy Shaded Pixels in UAV-Borne Thermal Images to Improve the Estimation of Crop Water Stress Index of a Drip-Irrigated Cabernet Sauvignon Vineyard. Sensors 2018, 18, 397. [Google Scholar] [CrossRef] [PubMed]
  55. Lu, S.; Xuan, J.; Zhang, T.; Bai, X.; Tian, F.; Ortega-Farias, S. Effect of the shadow pixels on evapotranspiration inversion of vineyard: A high-resolution UAV-based and ground-based remote sensing measurements. Remote Sens. 2022, 14, 2259. [Google Scholar] [CrossRef]
  56. Messina, G.; Modica, G. Applications of UAV thermal imagery in precision agriculture: State of the art and future research outlook. Remote Sens. 2020, 12, 1491. [Google Scholar] [CrossRef]
  57. Bellvert, J.; Zarco-Tejada, P.J.; Girona, J.; Fereres, E. Mapping crop water stress index in a ‘Pinot-noir’vineyard: Comparing ground measurements with thermal remote sensing imagery from an unmanned aerial vehicle. Precis. Agric. 2014, 15, 361–376. [Google Scholar] [CrossRef]
  58. Scharwies, J.D.; Dinneny, J.R. Water transport, perception, and response in plants. J. Plant Res. 2019, 132, 311–324. [Google Scholar] [CrossRef] [PubMed]
  59. Idso, S.; Jackson, R.; Pinter Jr, P.; Reginato, R.; Hatfield, J. Normalizing the stress-degree-day parameter for environmental variability. Agric. Meteorol. 1981, 24, 45–55. [Google Scholar] [CrossRef]
  60. Atencia Payares, L.K.; Tarquis, A.M.; Hermoso Peralo, R.; Cano, J.; Cámara, J.; Nowack, J.; Gómez del Campo, M. Multispectral and Thermal Sensors Onboard UAVs for Heterogeneity in Merlot Vineyard Detection: Contribution to Zoning Maps. Remote Sens. 2023, 15, 4024. [Google Scholar] [CrossRef]
  61. Wigmore, O.; Mark, B.; McKenzie, J.; Baraer, M.; Lautz, L. Sub-metre mapping of surface soil moisture in proglacial valleys of the tropical Andes using a multispectral unmanned aerial vehicle. Remote Sens. Environ. 2019, 222, 104–118. [Google Scholar] [CrossRef]
  62. Bertalan, L.; Holb, I.; Pataki, A.; Négyesi, G.; Szabó, G.; Szalóki, A.K.; Szabó, S. UAV-based multispectral and thermal cameras to predict soil water content–A machine learning approach. Comput. Electron. Agric. 2022, 200, 107262. [Google Scholar] [CrossRef]
  63. Guan, Y.; Grote, K. Assessing the Potential of UAV-Based Multispectral and Thermal Data to Estimate Soil Water Content Using Geophysical Methods. Remote Sens. 2023, 16, 61. [Google Scholar] [CrossRef]
  64. Chandel, A.K.; Khot, L.R.; Molaei, B.; Peters, R.T.; Stöckle, C.O.; Jacoby, P.W. High-resolution spatiotemporal water use mapping of surface and direct-root-zone drip-irrigated grapevines using uas-based thermal and multispectral remote sensing. Remote Sens. 2021, 13, 954. [Google Scholar] [CrossRef]
  65. Buunk, T.; Vélez, S.; Ariza-Sentís, M.; Valente, J. Comparing Nadir and Oblique Thermal Imagery in UAV-Based 3D Crop Water Stress Index Applications for Precision Viticulture with LiDAR Validation. Sensors 2023, 23, 8625. [Google Scholar] [CrossRef] [PubMed]
  66. López, A.; Jurado, J.M.; Ogayar, C.J.; Feito, F.R. An optimized approach for generating dense thermal point clouds from UAV-imagery. ISPRS J. Photogramm. Remote Sens. 2021, 182, 78–95. [Google Scholar] [CrossRef]
  67. Baluja, J.; Diago, M.P.; Balda, P.; Zorer, R.; Meggio, F.; Morales, F.; Tardaguila, J. Assessment of vineyard water status variability by thermal and multispectral imagery using an unmanned aerial vehicle (UAV). Irrig. Sci. 2012, 30, 511–522. [Google Scholar] [CrossRef]
  68. Matese, A.; Di Gennaro, S.F. Practical applications of a multisensor UAV platform based on multispectral, thermal and RGB high resolution images in precision viticulture. Agriculture 2018, 8, 116. [Google Scholar] [CrossRef]
  69. Tucci, G.; Parisi, E.I.; Castelli, G.; Errico, A.; Corongiu, M.; Sona, G.; Viviani, E.; Bresci, E.; Preti, F. Multi-sensor UAV application for thermal analysis on a dry-stone terraced vineyard in rural Tuscany landscape. ISPRS Int. J. Geo-Inf. 2019, 8, 87. [Google Scholar] [CrossRef]
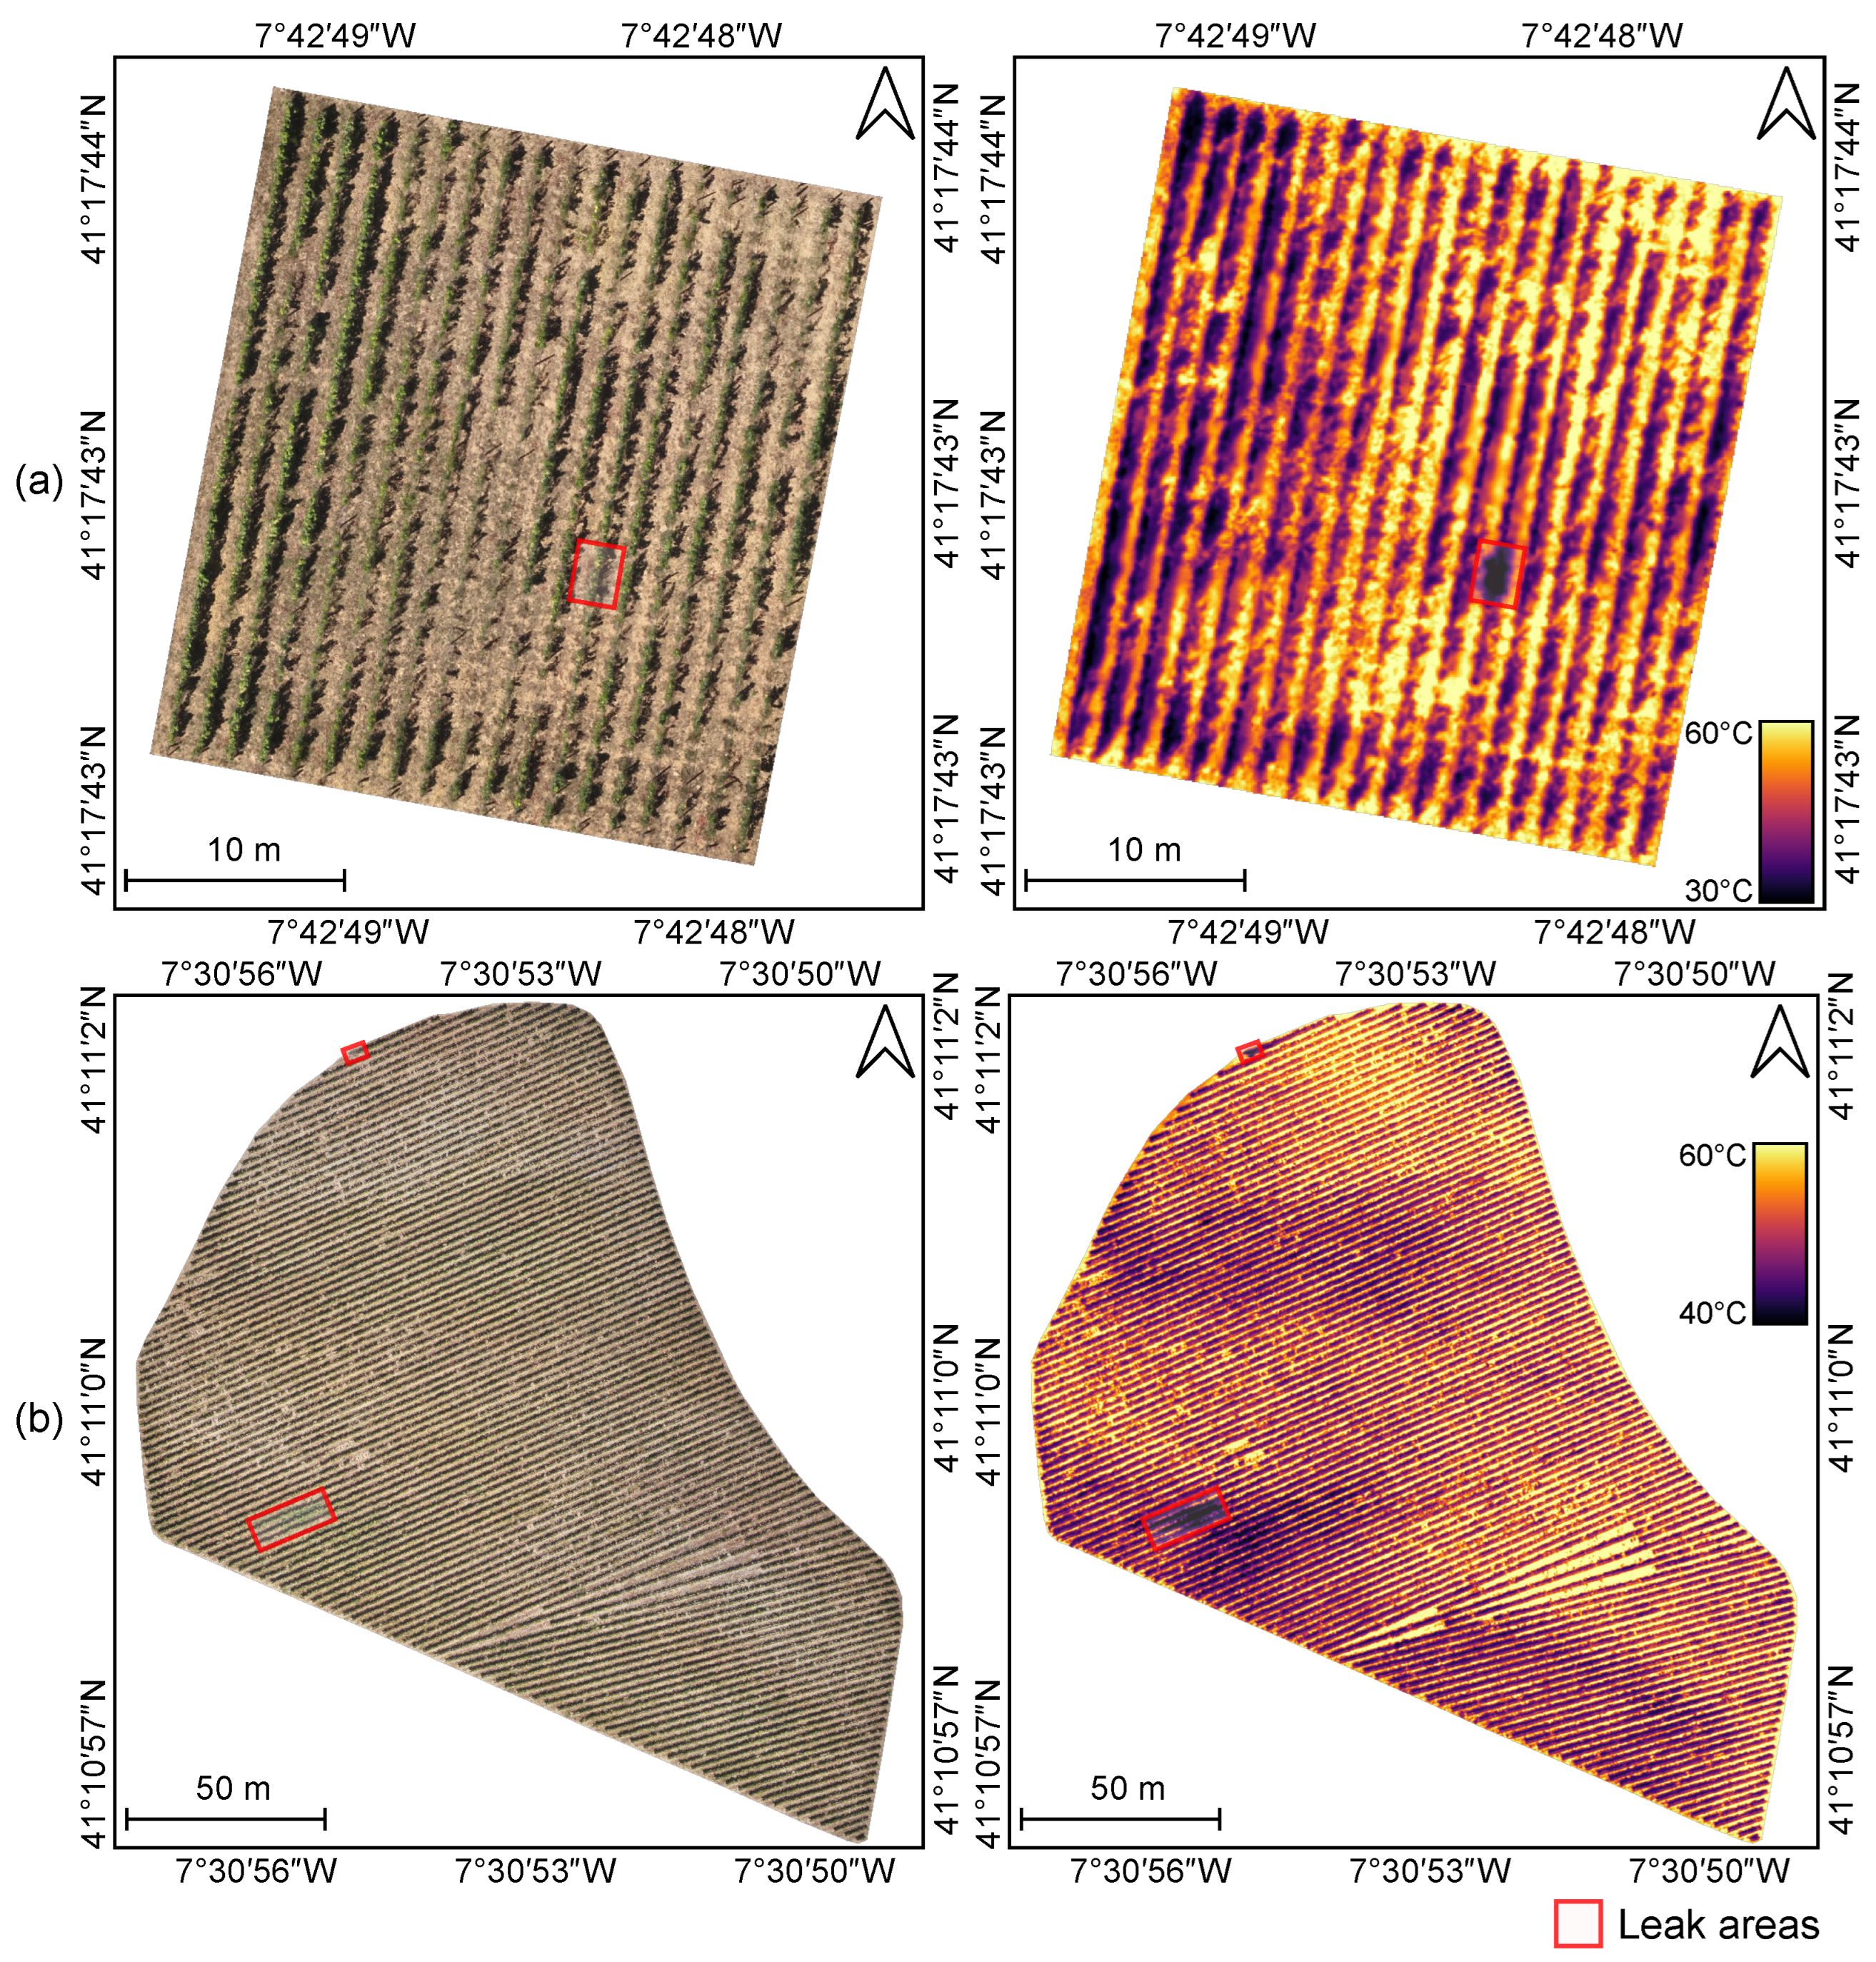
Figure 1. Overview of the vineyard plots analyzed along with land surface temperature data of Vineyard A (a) and Vineyard B (b).
Drones 08 00187 g001
Figure 2. Overview of the data processing pipeline employed for the detection of leaks in vineyard irrigation systems. TIR: thermal infrare; DSM: digital surface model; DTM: digital terrain model; LST: land surface temperature; G n : normalized green value; CSM: crop surface model.
Drones 08 00187 g002
Figure 3. Land surface temperature (LST) behavior in a cross-row profiles in Vineyard A (a) and Vineyard B (b). Height values from the crop surface model (CSM) are also provided. Gray areas correspond grapevine shadows.
Drones 08 00187 g003
Figure 4. Temperature distribution of Vineyard A and Vineyard B when considering temperature from the entire vineyard area, grapevine vegetation, and non-grapevine areas.
Drones 08 00187 g004
Figure 5. Row section histograms for Vineyard A (a) and Vineyard B (b) when considering the entire vineyard area, grapevine temperature only, and non-grapevine areas.
Drones 08 00187 g005
Figure 6. Temperature distribution classes in Vineyard A (a) and Vineyard B (b) categorized by the entire vineyard area, grapevine temperature exclusively, and non-grapevine areas.
Drones 08 00187 g006
Figure 7. Areas of potential leaks in Vineyard A when using (a) the lower quintile value, (b) T m e a n σ , and (c) T m e a n 2 σ .
Drones 08 00187 g007
Figure 8. Areas of potential leaks in Vineyard B when using (a) the lower quintile value, (b) T m e a n σ , and (c) T m e a n 2 σ .
Drones 08 00187 g008
Table 1. Temperature thresholds considered for leak detection in the evaluated approaches.
VineyardConsidered AreaTemp (°C)
Lower Quintile T mean σ T mean 2 σ
AEntire area38.3643.8339.88
Grapevines33.4535.4732.55
Non-grapevines39.0246.2242.94
BEntire area43.5449.4246.73
Grapevines42.5346.7744.03
Non-grapevines43.9850.2947.79
Table 2. Vineyard rows distance (in meters) to be inspected using the evaluated methods, along with the corresponding number of rows and their respective percentages.
VineyardConsidered
Area
Lower Quintile T mean σ T mean 2 σ
DistanceNo. of RowsDistanceNo. of RowsDistanceNo. of Rows
AEntire area4 (0.7%)3 (15.8%)94 (16.5%)14 (77.3%)9 (1.6%)5 (26.3%)
Grapevines16 (2.8%)5 (26.3%)83 (14.6%)13 (68.4%)5 (0.9%)3 (15.8%)
Non-grapevines3 (0.5%)2 (10.5%)103 (18.1%)14 (77.3%)7 (1.2%)5 (26.3%)
BEntire area30 (0.3%)6 (5.3%)1862 (16.6%)101 (88.6%)228 (2.0%)29 (25.4%)
Grapevines52 (0.5%)8 (7.0%)1830 (16.3%)99 (86.8%)245 (2.2%)21 (18.4%)
Non-grapevines26 (0.2%)4 (3.5%)1784 (15.9%)102 (89.5%)229 (2.0%)35 (30.7%)
Disclaimer/Publisher’s Note: The statements, opinions and data contained in all publications are solely those of the individual author(s) and contributor(s) and not of MDPI and/or the editor(s). MDPI and/or the editor(s) disclaim responsibility for any injury to people or property resulting from any ideas, methods, instructions or products referred to in the content.