Article

Yield Prediction Using NDVI Values from GreenSeeker and MicaSense Cameras at Different Stages of Winter Wheat Phenology

1
Department of Plant Sciences, Albert Kázmér Faculty of Agricultural and Food Sciences, Széchenyi István University, 9200 Mosonmagyaróvár, Hungary
2
Agricultural and Food Research Centre, Széchenyi István University, 9200 Mosonmagyaróvár, Hungary
3
Department of Precision Agriculture and Digital Farming, Institute of Agronomy, Hungarian University of Agriculture and Life Sciences, 2100 Gödöllő, Hungary
4
Department of Biosystems and Precision Technologies, Albert Kázmér Faculty of Agricultural and Food Sciences, Széchenyi István University, 9200 Mosonmagyaróvár, Hungary
5
Department of Water Management and Natural Ecosystems, Albert Kázmér Faculty of Agricultural and Food Sciences, Széchenyi István University, 9200 Mosonmagyaróvár, Hungary
*
Author to whom correspondence should be addressed.
Drones 2024, 8(3), 88; https://doi.org/10.3390/drones8030088
Submission received: 9 January 2024 / Revised: 29 February 2024 / Accepted: 1 March 2024 / Published: 5 March 2024
(This article belongs to the Special Issue Advances of UAV in Precision Agriculture)

Abstract

:
This work aims to compare and statistically analyze Normalized Difference Vegetation Index (NDVI) values provided by GreenSeeker handheld crop sensor measurements and calculate NDVI values derived from the MicaSense RedEdge-MX Dual Camera, to predict in-season winter wheat (Triticum aestivum L.) yield, improving a yield prediction model with cumulative growing degree days (CGDD) and days from sowing (DFS) data. The study area was located in Mosonmagyaróvár, Hungary. A small-scale field trial in winter wheat was constructed as a randomized block design including Environmental: N-135.3, P2O5-77.5, K2O-0; Balance: N-135.1, P2O5-91, K2O-0; Genezis: N-135, P2O5-75, K2O-45; and Control: N, P, K 0 kg/ha. The crop growth was monitored every second week between April and June 2022 and 2023, respectively. NDVI measurements recorded by GreenSeeker were taken at three pre-defined GPS points for each plot; NDVI values based on the MicaSense camera Red and NIR bands were calculated for the same points. Results showed a significant difference (p ≤ 0.05) between the Control and treated areas by GreenSeeker measurements and Micasense-based calculated NDVI values throughout the growing season, except for the heading stage. At the heading stage, significant differences could be measured by GreenSeeker. However, remotely sensed images did not show significant differences between the treated and Control parcels. Nevertheless, both sensors were found suitable for yield prediction, and 226 DAS was the most appropriate date for predicting winter wheat’s yield in treated plots based on NDVI values and meteorological data.

1. Introduction

Agriculture plays a crucial role in meeting the daily food needs of a growing population [1]. The ever-increasing food needs and yield levels can only be met through constant technological improvements. Winter wheat (Triticum aestivum L.) is one of the most important crops for global food safety [2], which also plays a crucial role in Hungary’s agricultural production [3]. To continuously achieve high yields, it is essential to integrate precision agriculture technologies into farming practices, including monitoring solutions [4]. Over the last two decades, a significant boom in using remote-sensing tools for agricultural purposes has occurred. Data collection can be carried out by various means, including different satellites [5,6,7,8], uncrewed aerial vehicles (UAVs) [9,10,11,12,13], or ground-based platforms [14,15,16,17]. These tools provide opportunities to monitor changes in plant and soil conditions, to predict in-season yields [18] and nutrient requirements [19], and to detect various diseases [20].
The use of UAVs in agriculture has become widespread in the last decade. Depending on the field of application, such as monitoring, spraying, etc., there are many types of drones to choose from [11,12,21,22,23,24]. For monitoring purposes, image collection has to be carried out. The camera, which can be an RGB [12,20,25], a multispectral [23,26], or a hyperspectral camera [27,28], influences the quality and quantity of data collected and mounted on the drone.
UAVs can be used to monitor the development stages of plants and the changes in the crops. Due to their adjustable flight altitude and high spatial resolution, camera data can be reliably collected from small areas or plots [10,11,22,29]. An additional advantage of drones is that they make it possible—among other applications—to forecast harvests [30,31,32]. However, alternative options for field data collection exist alongside remote-sensing techniques.
Various plant parameters can be measured by handheld ground-based sensors such as the SPAD 502 Plus Chlorophyll Meter (Spectrum Technologies, Plainfield, IL, USA), GreenSeeker (NTech Industries, Trimble, Sunnyvale, CA, USA), or Crop Circle ACS-470 sensor (Holland Scientific, Inc., Lincoln, NE, USA). Most of these handheld devices measure differences in chlorophyll content in plants. However, compared to remotely sensed image collection, their disadvantages are that they provide spot sampling, and the area covered by sampling is limited due to the poor resolution of collected points [17,23,29]. Despite their limited data collection capabilities, the GreenSeeker handheld sensor is an excellent tool for examining nitrogen conditions and biomass development of crops or predicting in-season plant yield [11,19,30].
The GreenSeeker measurement provides an NDVI value directly measured on the spot. Conversely, various vegetation indices can be calculated using different images collected by the MicaSense Dual camera system. Other vegetation indices can describe different plant characteristics; however, the most commonly used index is NDVI [18,23,33].
NDVI index can quantify vegetation greenness, understand vegetation density, and assess plant health changes. NDVI index is calculated using red and near-infrared spectra of the multispectral cameras or from GreenSeeker sensor measurements [34,35], and it can be used to quantify vegetation greenness, understand vegetation density, and assess plant health changes. Due to its versatility and ease of extraction, it is a frequently used vegetation index among farmers and researchers. Several studies stated that a significant correlation (p ≤ 0.05) could be found between the NDVI index and nitrogen level [36,37], as well as the NDVI index and chlorophyll content of durum wheat genotypes in different nitrogen levels [38]. In addition to monitoring crops, NDVI is an appropriate predictor of yields.
Duan et al. [22] identified a strong correlation between NDVI values around flowering time and the final yield of wheat (R2 = 0.82). This finding is corroborated by Naser et al. [38], who found a significant correlation (p ≤ 0.05) under dryland conditions between NDVI values and the yield of winter wheat at three different growth stages. Vannoppen et al. [39] estimated wheat yield using NDVI and meteorological data, suggesting that monthly precipitation during tillering and anthesis provided better predictions than NDVI-derived yield proxies. Other studies [4,38,40] examined the relationship between NDVI values and wheat yield, while the impact of meteorological features on yield was also investigated to reduce the variability in yield between years.
This study examined the relationship between the NDVI index measured by the GreenSeeker handheld crop sensor and NDVI index data obtained from the MicaSense multispectral camera. It aimed to (i) compare the NDVI values measured by two instruments to assess the data collection usability for winter wheat at various phenological stages; (ii) determine, based on NDVI, the optimal growth stage for predicting in-season yield for both sensors; (iii) estimate the significance of seasonal variability in yield prediction using cumulative growing degree days (CGDD) and days after sowing (DAS); and (iv) develop a yield prediction model.

2. Materials and Methods
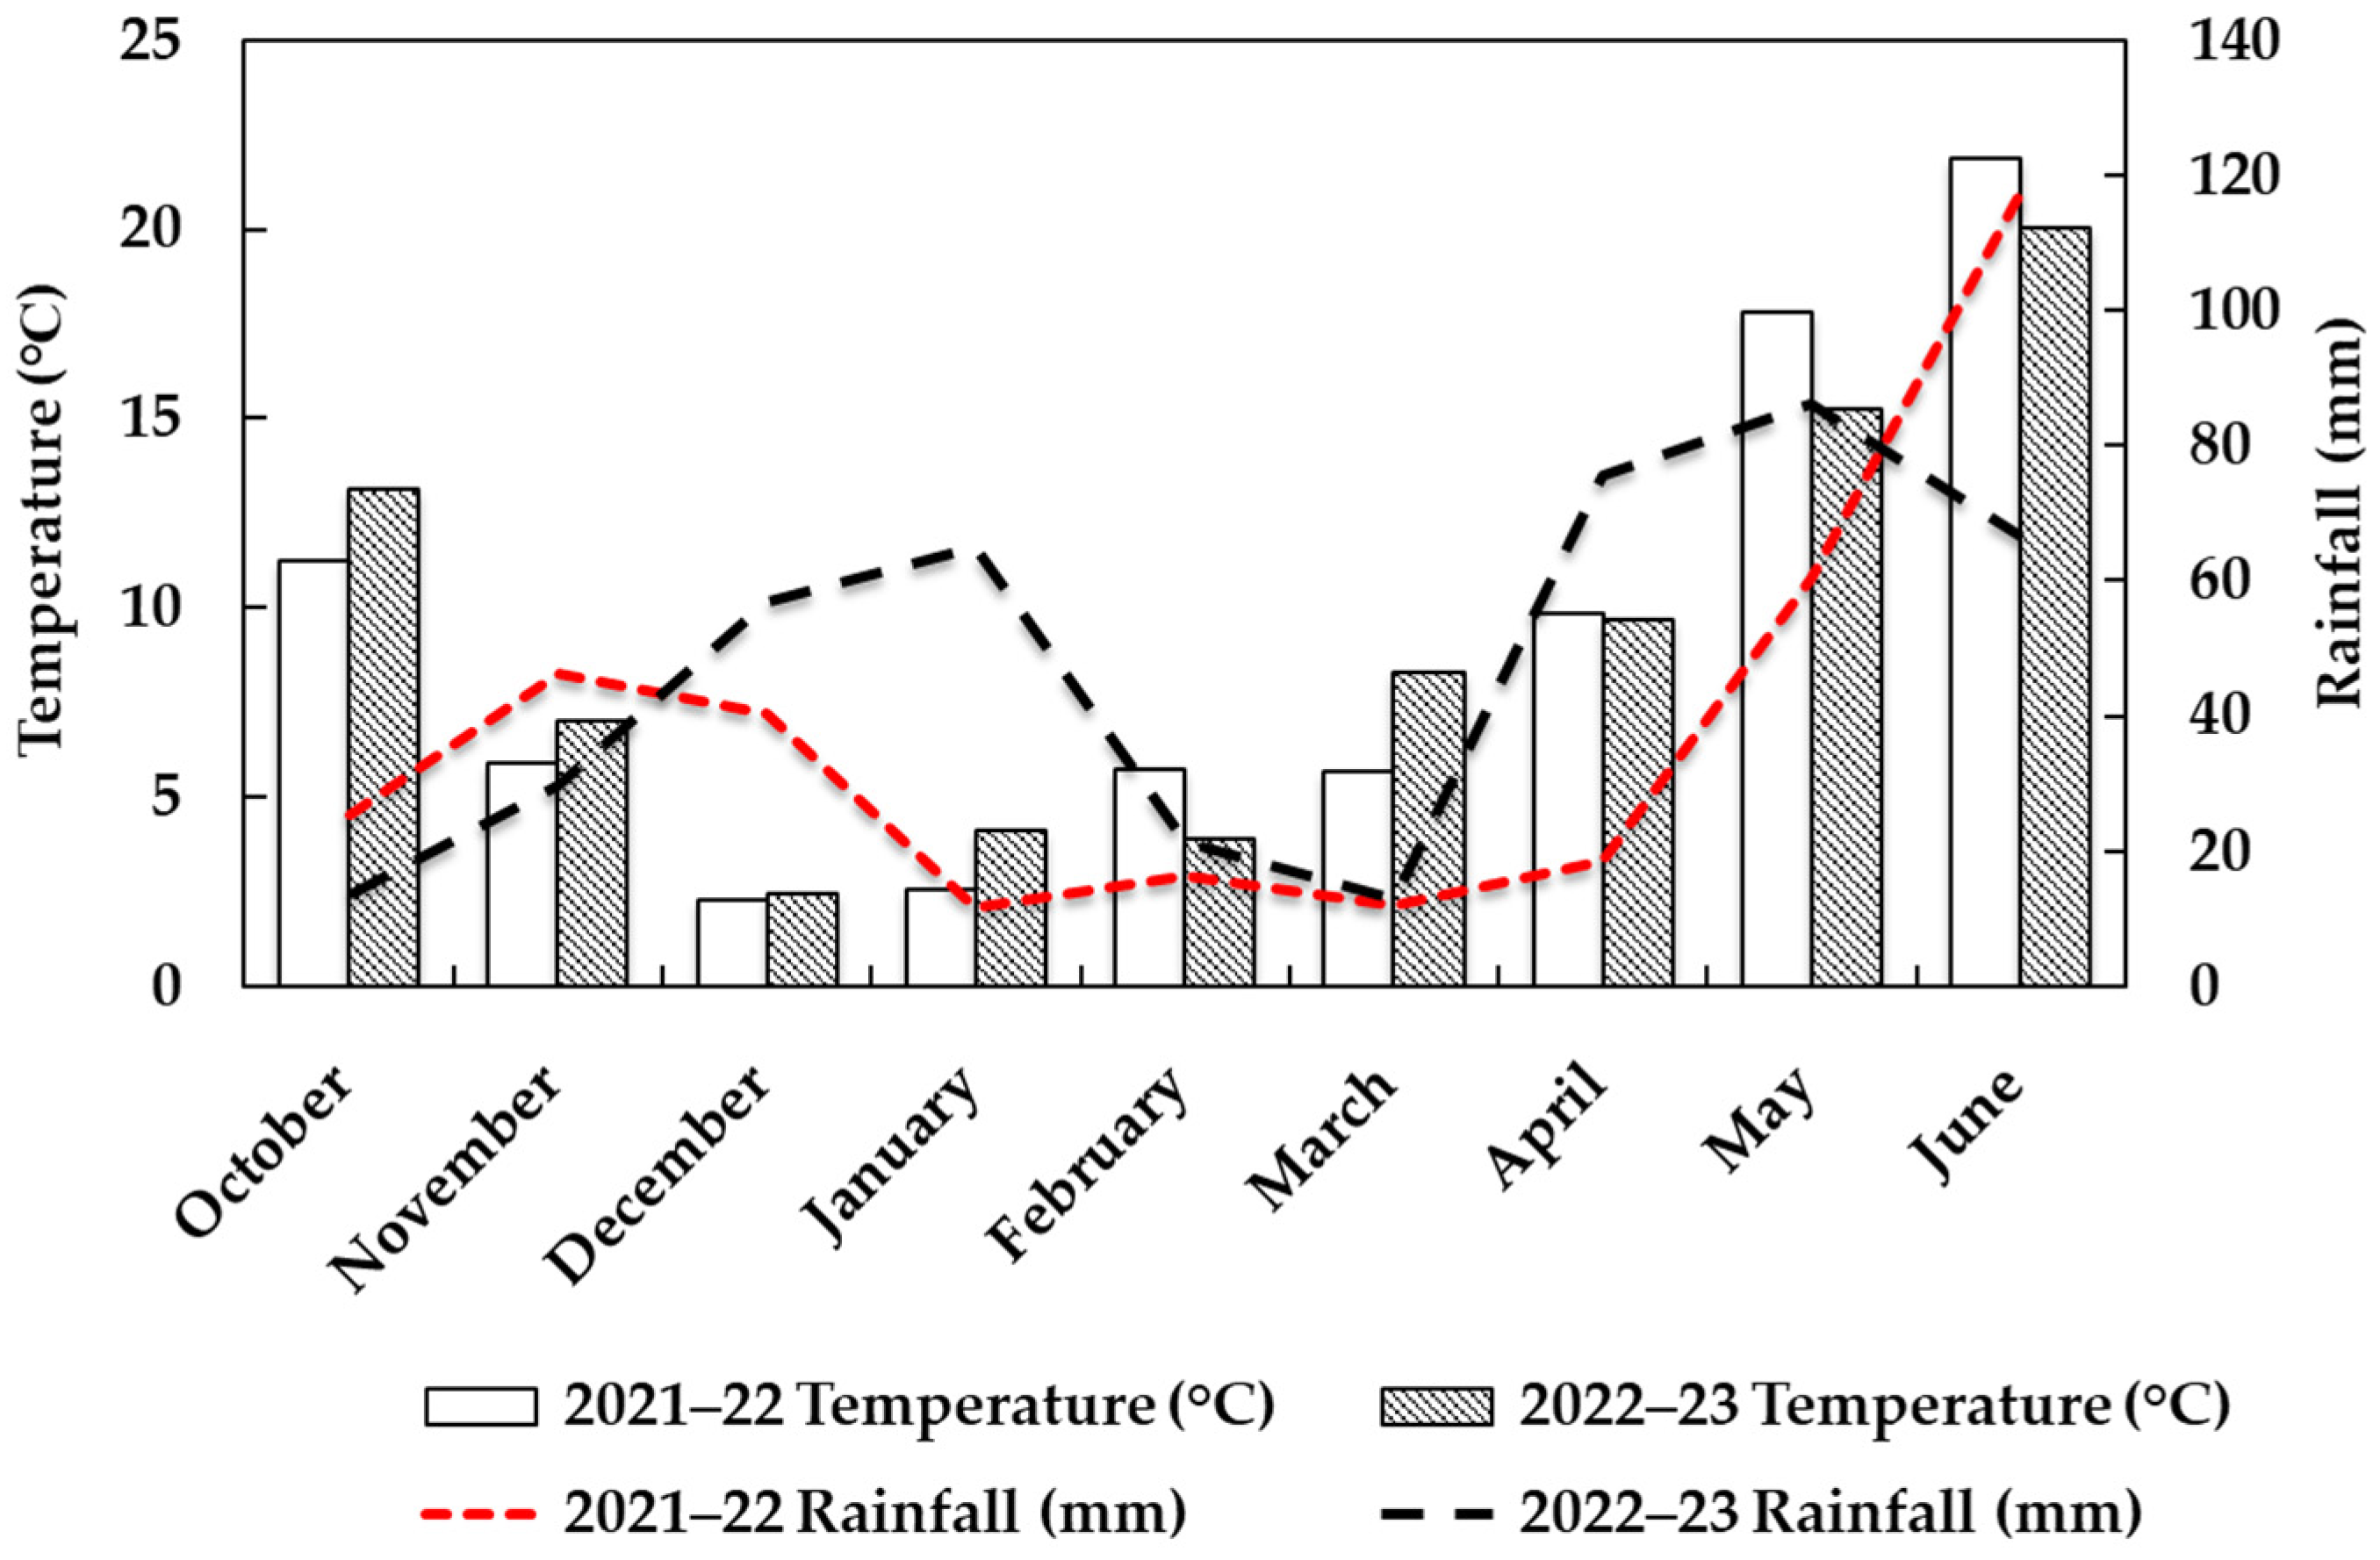
2.1. Study Area

The study area was located in Mosonmagyaróvár (N 47°8′67.89″ E 17°26′9.94″), in the north-western part of Hungary (Figure 1) at an altitude of 119 m above mean sea level. The two-year field experience was conducted in the 2021–2022 and 2022–2023 growing season from October to the end of June.
According to the Hungarian Meteorological Service (OMSZ) (Figure 2), the mean temperature was 9.0 °C during the growing season in both years. On the contrary, the monthly average temperature during the measurement period was 9.7 °C, 17.6 °C, and 21.9 °C in April, May, and June in 2022, while 9.2 °C, 15.1 °C, and 19.9 °C were in 2023. Over the period under examination, the highest temperatures were 22.5 °C, 30.3 °C, and 35.8 °C in 2022 and 17.4 °C, 20.4 °C, and 25.9 °C in 2023, respectively. The total rainfall was 348.6 mm in 2021–2022 and 427.1 from October to the end of June in the 2022–2023 period, while the monthly mean precipitation was 18.6 mm, 60.2 mm, 117.6 mm, and 75.5 mm, 86.1 mm, and 66.4 mm during the measurement periods. The sunshine duration was 1549.8 h and 1135.7 h during the growing period in 2022 and 2023.

2.2. Experimental Design

The experimental layout was a randomized block design with four blocks and four treatments of different fertilizer rates (Figure 1). The size of the plot was 4.2 × 22.0 m. The area under investigation was cultivated by winter wheat during this study. The forecrop of winter wheat (Triticum aestivum L.) was rapeseed (Brassica napus L.). The genetic soil type of the experimental field is Danube alluvial soils.
Winter wheat was sowed on 25 October 2021 in both years, and row-to-row spacing was 12 cm. The number of seeds sown was 4.5 million for each hectare. Fertilizer was applied in two rounds (Table 1) immediately before sowing (25 October 2021 and 2022 and 1 March 2022 and 2023). The amount of nitrogen used was 135 kg/ha (Environmental-135.3 kg/ha, Balance-135.1 kg/ha, Genezis-135 kg/ha). In autumn, different amounts of phosphorus fertilizer (Environmental-77.5 kg/ha, Balance-91 kg/ha, Genezis-75 kg/ha) were applied. The “Genezis” treatment also received potassium (45 kg/ha) as a basal fertilizer before sowing. From each plot, 2.4 m × 22.0 m was harvested separately by Sampo SR2010 parcel combine.

2.3. Data Collection

The image acquisition occurred between 5 and 11 at Feekes growth stages [41] at six different dates from April to the end of June 2022 and 2023. Two other platforms were used for the collection of the data, i.e., GreenSeeker (NTech Industries, Trimble, Sunnyvale, California, USA) and the MicaSense RedEdge-MX Dual Camera System (MicaSense Inc., Seattle, Washington, USA) mounted on a DJI Matrice 210 V2 (Da-Jing Innovation, Nanshan, Shenzhen, China).
A GreenSeeker Model HCS-250 manual active optical sensor carried out the ground measurements. The NDVI index values recorded by GreenSeeker were measured at three pre-defined GPS locations (Table A1) for each plot. The sensor was held approximately 60 cm above the canopy, following the recommendations of Zhitao et al. [33], to display the NDVI for a 0.5 m2 area on the LCD. According to the methods of Wang et al. [11], the measurement was repeated three times in a plot, and each measurement included an average NDVI value of 10 readings.
The image acquisition campaigns were performed on 12 April, 28 April, 12 May, 24 May, 7 June, and 21 June in 2022. The exact dates were used for image acquisition in 2023, but starting from the third measurement date, there was a deviation of ±two days compared to 2022 due to weather conditions. The duration of each flight was 2–3 min; the images were acquired between 11:30 and 12:00 to ensure the same environmental conditions [33]. The flights were carried out at 40 m height with a 2.9 cm/pixel ground resolution. The flight route was planned with a 70% front and side overlap ratio, and 48 triggers in 10 bands were taken; thus, 480 multispectral images were acquired at each flight. The calibration panel was consistently photographed before and after each flight to eliminate variations caused by changing light conditions at different flight times [42].
Before the first flight, four fixed ground control points (GCPs) were placed on the experimental field to perform accurate geo-referencing. The center of the GCPs was geolocated by a South S660N GPS RTK Receiver (South Surveying & Mapping Instrument Co., Ltd., Beijing, China), thus providing two centimeters of accuracy. The GCPs were used at each flight to geo-reference the orthomosaic images to them. The geo-referencing ensured the possibility of comparison over time.
The weather station operated by the Hungarian Meteorological Service (OMSZ) is approximately 500 m from the experimental field and provides the essential meteorological data (temperature, rainfall, hours of sunshine) required for this research.

2.4. Data Processing

After data capture, the raw images were processed to generate ortho-mosaic images using Agisoft Metashape Professional (version 2.0.1). The standard Metashape workflow was applied to all processed images, with the only adjustments made to ensure high-quality results. The ortho-mosaic image was exported in *.tiff format in the WGS84 coordinate system, and the pixel size was set to 2 × 2 cm.
The data were processed using the open-source QuantumGIS (version 3.22). Firstly, using the red and NIR images, NDVI values were calculated according to the following Equation (1):
NDVI = ( NIR Red ) ( NIR + Red )
where:
NIR = reflectance at the near-infrared (842 nm)
Red = reflectance at the red (668 nm)
To improve the accuracy of the yield prediction model, they were calculated with the following Equation (2).
The NDVI/DFS ratio was calculated by dividing NDVI by DFS (number of days from sowing) to sensing when GDD (growing degree days) > 0).
GDD = Tmax + Tmin 2 0   ° C
where:
Tmax = daily maximum temperature
Tmin = daily minimum temperature
0 °C is the base growing temperature for winter wheat [43].
The NDVI/CGDD ratio was calculated by dividing NDVI by CGDD (cumulative growing degree days) from sowing to sensing when GDD > 0.

2.5. Statistical Analysis

The statistical analyses were conducted separately for each treatment, date, and sensor using R statistical software and its package ‘rcompanion’ [44,45]. At first (1), descriptive statistics were used to describe the dataset’s characteristics, including means and standard deviations at different measurement times and with other sensors.
In the second step (2), the behavior of the sensors (MicaSense and GreenSeeker) at different measurement times and treatments was compared by applying a two-sample t-test, assuming equal or unequal variances based on the outcome of Levene’s test. Then, regression analysis was conducted to show the relationship between two sensor performances in the different treatments.
In the third step (3), Tukey’s Honestly Significant Difference (HSD) for two-way analysis of variance (ANOVA) was performed to reveal the differences in NDVI values between the treatments measured by the sensors. Each statistical analysis was determined at a significance level of p ≤ 0.05.
In the fourth step (4), the correlations (significance level at p ≤ 0.05, p ≤ 0.01, and p ≤ 0.001) between NDVI values produced from the data measured by GreenSeeker (GS) and MicaSense (MS) cameras and winter wheat yield at different sowing dates were examined by Pearson correlations analysis, to determine the most appropriate date for further examination from sowing.
In the fifth step (5), the coefficient of determination (R2) was determined (significance level at p ≤ 0.05, p ≤ 0.01, and p ≤ 0.001) between NDVI values measured by GreenSeeker and calculated from MicaSense camera data and the yield of winter wheat by using linear, exponential, and quadratic equations.
In the sixth step (6), based on Pearson correlation and coefficient of determination analyses, the most appropriate date of sowing was determined to predict yield using NDVI values. RMSE (root mean square error) values were calculated for the different prediction equations to have information about the prediction accuracy.
In the seventh step (7), new models were set up using CGDD (cumulative growing degree days) and DFS (days from sowing) values to minimize the impact of environmental factors. RMSE values were also calculated for these new models.
In the eighth step (8), model validation was performed. The newly developed model, modified with NDVI and CGDD values, was validated by calculating the coefficient of determination and RMSE values.

3. Results

3.1. Comparison of NDVI Values among the Various Treatments

Table 2 compares NDVI values for both sensing techniques (GreenSeeker and MicaSense) at six different momenta in the 2021–2022 and 2022–2023 periods. The NDVI values produced from the MicaSense camera data in every measurement date showed higher values than the NDVI values measured by GreenSeeker. Detailed measurement data can be found in Table 2. During the measurement periods, NDVI data collected by GreenSeeker were significantly lower than those collected from the treated area. MicaSense camera-based data showed similar results, except for 12 May, when no significant difference was observed in the NDVI values for the “Environmental”, “Balance”, “Genezis”, and “Control” units.

3.2. The Relationship of Yield to Different Treatments

Figure 3 depicts the yields of different treatments in the 2021–2022 and 2022–2023 growing seasons, showing a significant difference between the two years’ yields. Significantly different yields were observed between the Control and other treatments. However, yields showed no significant differences among the Environmental, Balance, and Genezis treatments. The 2021–2022 period showed more notable differences between treatments, whereas, in the 2022–2023 season, favorable weather conditions for winter wheat resulted in excellent and optimal conditions. Consequently, the differences in yield among Environmental, Balance, and Genezis treatments were insignificant during this season.

3.3. Correlation between NDVI Values and Winter Wheat Yields

The results of Pearson correlation analysis between NDVI values obtained from data measured by the GreenSeeker and MicaSense camera and winter wheat yield are presented in Table 3. For GreenSeeker, a significant relationship, indicated by the “Pearson r”, was observed between the calculated NDVI values and the observed winter wheat yield in all treatments except for the Control treatment. The “Pearson r” values ranged from 0.289 to 0.863 in the Control treatment, while in the Environmental, Balance, and Genezis treatments, the values ranged from 0.672 to 0.884, 0.669 to 0.946, and 0.726 to 0.897, respectively. In the case of the MicaSense camera, a decreasing trend was found in the relationship between yield and NDVI values from 170 DAS to 200 DAS. However, the Genezis treatment had a peak value of 186 DAS. Negative values are also found for the MicaSense camera at 200 DAS due to saturation of the NDVI values. The highest “Pearson r” values for treatments were achieved on different dates, and the most robust correlations between NDVI values and yield were at 170 DAS and 226 DAS for both sensors.
To assess the relationship between NDVI values and winter wheat yield, three equations (exponential (E), linear (L), and quadratic (Q)) from 170 DAS to 240 DAS were employed in Table 4. No significant differences were observed in the regression analyses of the three equations for GreenSeeker and MicaSense cameras. In the Control treatment, the highest coefficient of determination between NDVI values and winter wheat yield was found at 240 DAS for both sensors. However, in the Environmental, Balance, and Genezis treatments, the highest values were observed at 170 DAS and 226 DAS. The MicaSense camera produced the lowest coefficient of determination values between 200 DAS and 212 DAS, likely due to the high biomass of winter wheat during this period, and it could not make a difference between treatments. The most accurate prediction results were measured in treated plots by the GreenSeeker at 226 DAS (R2 = 0.76–0.91). Similar results were obtained with the MicaSense camera in treated plots at 226 DAS (R2 = 0.69–0.86). However, the coefficient of determination values was more variable with the MicaSense camera, with the highest R2 values found at 186 DAS (R2 = 0.88) and 240 DAS (R2 = 0.89–0.90).
Comparing the data provided by the two tools, measurements by the GreenSeeker proved more reliable and more relevant predictions of yield in all treatments from stem extension to ripening. Table 4 shows minimal differences among the different equations; therefore, all three models can be applied to predict wheat yield at 226 DAS for both sensors.

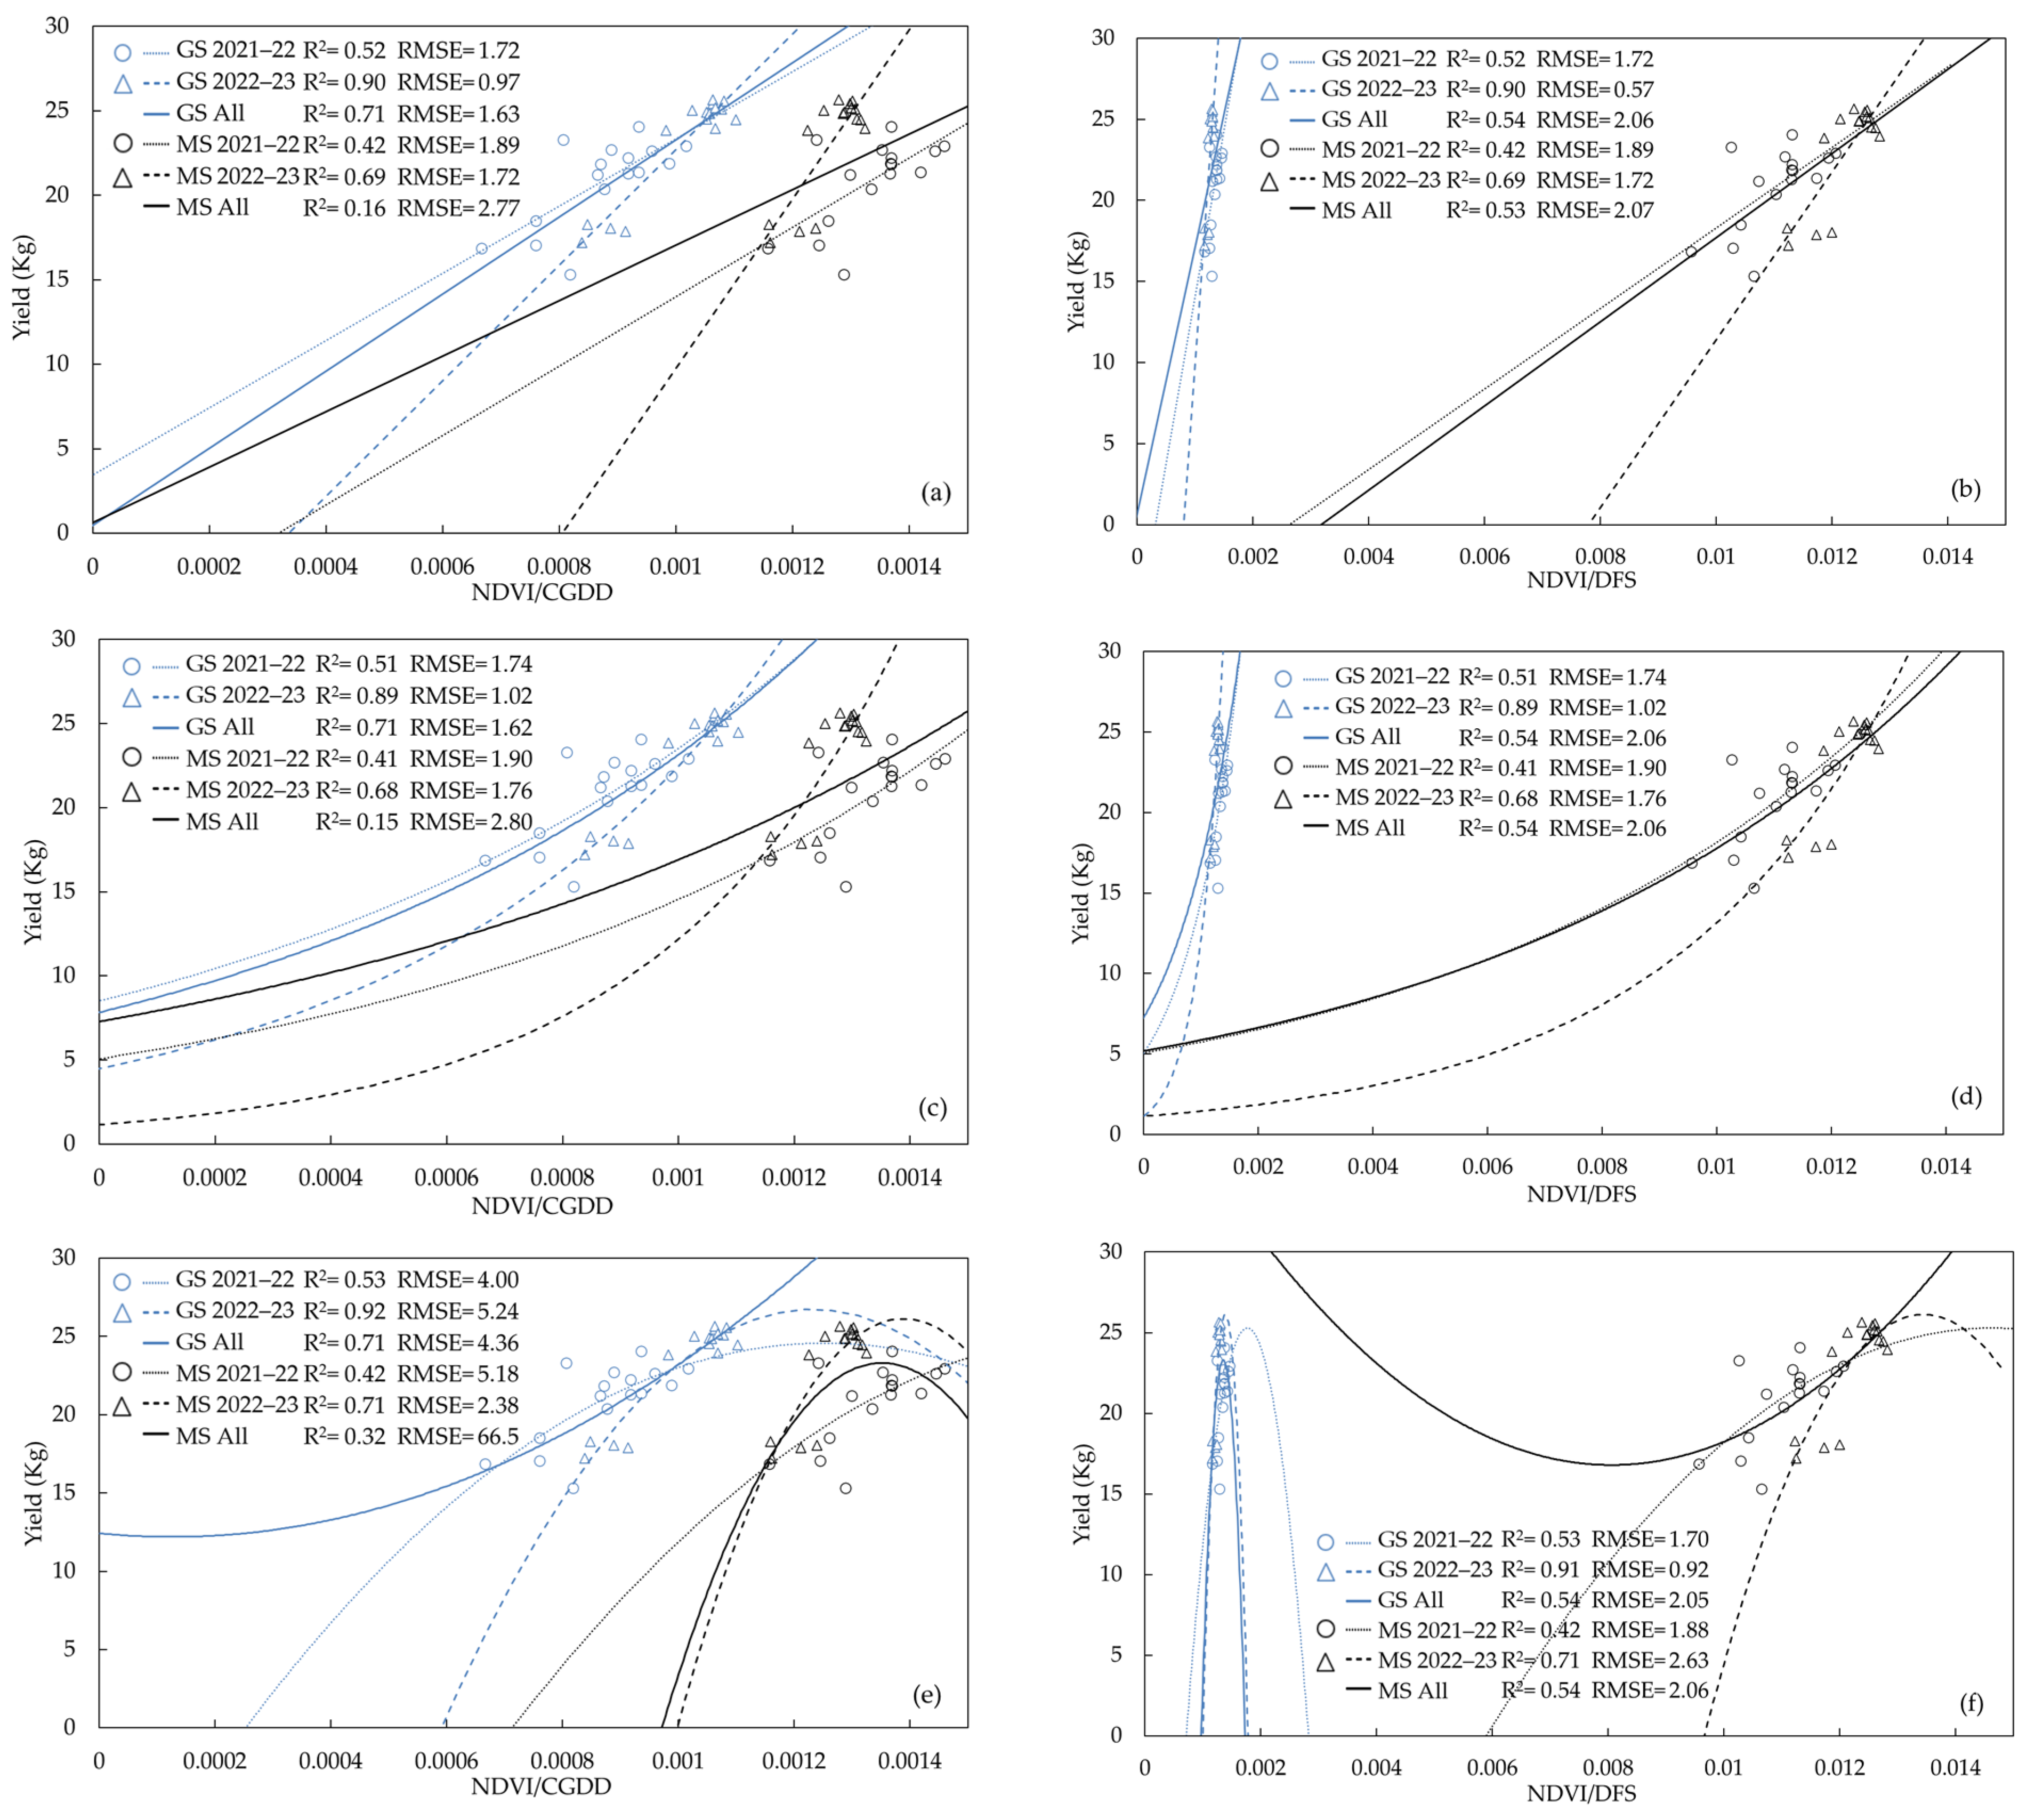
3.4. Predicting Winter Wheat Yields Based on NDVI

Based on regression analyses (Figure 4), using both sensors, the 226 DAS demonstrated the most accurate results for in-season prediction of winter wheat yield. The NDVI values of four treatments and winter wheat yield were compared at this specific date for both sensors during the 2021–2022 and 2022–2023 seasons. The results are presented in three equations (linear, exponential, and quadratic) in Figure 4. For each equation and sensor, the Control treatment presented the lowest relationship between measured NDVI values and yield. In the Control treatment, GreenSeeker and MicaSense showed minor R2 values ranging from 0.15 to 0.21 and 0.15 to 0.17. The GreenSeeker effectively explained all yield curves in the other treatments (Environmental, Balance, and Genezis), with R2 values ranging from 0.78 to 0.83, 0.65 to 0.70, and 0.62 to 0.85, respectively. These values were accompanied by relatively low RMSE values 0.56 to 0.65, 0.96 to 1.03, and 0.60 to 0.87, respectively. However, MicaSense camera could predict yield effectively only in the Genesis treatment (R2 = 0.78 and RMSE = 0.73–1.34), while Environmental and Balance treatment with R2 values ranged from 0.62 and 0.41 to 0.60 and RMSE values between 0.85 and 0.86 and 1.10 and 1.34, respectively. As shown in Figure 4, a significant difference was observed between the data points regardless of the equation used for comparison.

3.5. Supplementing the Yield Prediction Equation with DFS and CGDD Values

Figure 3 shows a difference in yield between years despite applying the same amount of nutrients to treatments each year; therefore, results of yield prediction models can be significantly influenced by varying weather conditions between years. Therefore, minimizing the impact of environmental effects on the model is crucial. In this study, CGDD and DFS values were utilized to enhance the yield prediction model for both sensors, as illustrated in Figure 5. This figure demonstrates the accuracy of the three yield prediction equations. The CGDD values of the 2021–2022 and 2022–2023 periods were 819.1 and 964.2, respectively. However, the DFS values were equal (170 days) during the first measurement time in both years.
The NDVI/CGDD values from GreenSeeker measurements showed a coefficient of determination of 0.71 for all three equations. Notably, the exponential equation showed the lowest RMSE (1.62), while the quadratic equation had the highest (4.36). These results indicate slight differences in predicting winter wheat yield using GreenSeeker. However, the MicaSense camera showed less favorable results in the yield prediction model across linear, exponential, and quadratic equations, with R2 values of 0.16, 0.15, and 0.32, and corresponding RMSE values of 2.77, 2.80, and 66.5, respectively.
The NDVI/DFS values did not significantly enhance the yield prediction model using GreenSeeker, as the R2 values remained at 0.54, and the RMSE ranged between 2.05 and 2.06 across all equations. However, MicaSense showed an R2 of 0.71 in the quadratic equation with an RMSE of 2.63, while the other equations showed R2 values of 0.53 and 0.54 with RMSE values of 2.07 and 2.06, respectively.
Based on the results, CGDD proved to enhance the accuracy of the yield prediction equations. All equations performed well when measured using GreenSeeker. However, in the case of MicaSense, these values did not significantly improve the yield prediction model.

3.6. Model Validation

The linear equation developed from modified NDVI data of two sensors (GreenSeeker and MicaSense) with CGDD values at 226 DAS could show a good correlation between the in-season yield predictions for winter wheat, and the results of the integrated yield prediction model of devices are found in Table 5. The GreenSeeker yield prediction model demonstrated a remarkably high coefficient of determination (0.90) and a comparatively low RMSE (0.97). The MicaSense camera presented a significantly lower R2 value (0.69), accompanied by a higher RMSE (1.71). Based on the results of yield prediction models (Figure 6), it could be more accurate to estimate winter wheat yield with a GreenSeeker than with a MicaSense camera.

4. Discussion

This research aimed to examine one of the most popular and frequently used vegetation indexes: NDVI. Two measurement units were compared: a handheld NDVI index measuring instrument called GreenSeeker and a MicaSense multispectral image collection device with a designated NIR and Red band.

4.1. Comparison of GreenSeeker and MicaSense NDVI Values

One of the primary data points of this research is the NDVI values provided by the GreenSeeker handheld crop sensor.
The GreenSeeker can rapidly determine the state of the crop, providing an opportunity to measure biomass changes [46,47], and examine the nutrient supply of the harvest, as it correlates well with changes in the amount of nitrogen supplied to the crop [12]. Li et al. [48] found a strong correlation between biomass and nitrogen uptake at Feekes growth stages 4–5 and 6–7. Moreover, NDVI correlated better with nitrogen uptake than nitrogen concentration at all growth stages [48]. In line with these results, as shown in Table 2, we found differences between the values of each treatment. However, the differences were only minor. The Control treatment stood out distinctly from the other treatments.
In contrast, the other three treatments had NDVI values that are relatively close to each other but still distinguishable from one another. One reason may be that the amount of nitrogen applied was about the same in the different treatments. However, there were minor changes in the timing of the application rates (Table 1), which the plants could compensate for during their growth [49]. Second, phosphorus and potassium were also applied as basal fertilizers to the three treatments (Table 1), which may have caused slight differences. This could be a potential reason for the measured differences [50].
A relatively new possibility for NDVI value data collection is to use multispectral cameras mounted on various UAVs [51,52,53]. In this case, multispectral sensors mounted on UAVs, such as the MicaSense RedEdge MX Dual camera system, provide much more detailed data and better spatial resolution than handheld sensors or satellites.
The hypersensitivity of a camera can be a disadvantage in cases where a plant has too high biomass, and the NDVI values produced by the MicaSense camera can no longer monitor changes in biomass after a certain period [53]. Dimyati et al. [54] examined paddy fields at different phenological stages in 2023 using four different multispectral cameras, and the data collected were compared using five different vegetation indices and NDVI. The NDVI values obtained with the MicaSense camera were by far the highest in all three phenological stages, i.e., 0.9 in the heading stage and 0.8 at the ripening phase [54]. According to our measurements and results, the highest NDVI values were also at the booting stage; moreover, in the two systems that have been compared, MicaSense images resulted in higher values than GreenSeeker data.
Upon closer examination of Table 2, it becomes apparent that NDVI indices acquired from data measured by the MicaSense camera show NDVI values approximately 0.2 higher than those measured by GreenSeeker. The same findings can be observed when NDVI values measured by aerial and ground-based devices were compared in rice and wheat, barley, and corn [18,22,38].
Based on the results of the present study, it makes a remarkable difference which tool is used to measure NDVI at a given time, as there are times when the GreenSeeker handheld optical sensor can detect a significant difference (p ≤ 0.05) between treatments. Meanwhile, aerial-imagery-based vegetation indices cannot do so. The reason for this is that NDVI values from the MicaSense camera data were already 0.2 units higher, which could have brought the NDVI values closer to a saturation point. In the case of dense vegetation or large biomass, the sensor can no longer detect a difference above a particular value, even when the green mass continues to grow [55]. Goffart et al. [53] encountered a similar problem in winter wheat between the stem elongation stage and the flag leaf stage and proposed that another, more suitable vegetation index (e.g., Normalized Difference Index, NDI) should be used at this crucial time.

4.2. Yield Prediction Based on NDVI

After comparing the NDVI values of two sensors (Table 2), it was demonstrated that the devices sometimes measure different NDVI values at different growing stages. The saturation of NDVI in wheat [38] or rice [56] poses a significant challenge during the critical period of the beginning of the heading stage. Given this observation, predicting yields uniformly across different growing stages is not feasible. Therefore, it is of paramount importance to always estimate yield at the optimal time. Previous studies found a positive correlation between wheat yield and NDVI during the anthesis and mid-grain-filling stages [57,58,59]. In this experiment, the Pearson correlation analyses (Table 3) showed that both sensors are suitable for predicting the in-season yield at the beginning of stem elongation (around DAS 170) and mid-filling stages (around DAS 226). These findings have been confirmed by several studies in wheat [38,58,60,61,62]. However, the results in Table 2 presented that GreenSeeker can be utilized to estimate expected yield at numerous additional time points.

4.3. Using Yield Prediction Equations

Several studies have been conducted on winter wheat, using both linear and non-linear equations to estimate expected yields [63,64,65,66]. In both sensors (Table 4), the linear and exponential equations differed significantly from the quadratic equation across different treatments. However, the quadratic equation achieved the highest R2 values, while the linear and exponential equations presented lower values. By comparison and equation modification, the linear equation achieved the most reliable results, so this equation was chosen over exponential and quadratic. Several researchers have examined the relationship between wheat yield and NDVI using linear regression [4,40,64], while Raun et al. [66] opted for an exponential equation. As discussed earlier, the linear model achieved the most reliable results. Thus, it was utilized for further analysis of wheat yields at 226 DAS.

4.4. Effect of Climate Conditions on the Yield Prediction Model

The yields of the two years were significantly different (Figure 3), so weather conditions were also examined to create a more accurate yield estimation model. Numerous studies have shown that in addition to soil properties, different weather conditions also affect the expected yield of wheat [67,68,69]; therefore, GDD and DFS values were introduced into the model, similar to other authors [70,71,72], to improve the yield prediction model. Based on the results above, the GreenSeeker sensor emerges as a much more reliable estimator of expected yields, so the two factors (CGDD, DFS) should also be considered from the GreenSeeker perspective. Regardless of the equation, the CGDD values significantly increased the accuracy of the yield estimation model by a more significant margin (R2 = 0.71) compared to the DFS values (R2 = 0.54). Similar findings were observed in sugarcane [47]; however, neither the DFS nor the GDD values improved yield potential prediction in rice [72], while similarly, negative results were obtained using GDD values in maize, as they failed to increase the model estimate significantly [67]. Based on the results of previous studies, it can be concluded that the effects of GDD and DFS values are not indifferent to the specific plant and climatic conditions under examination. Minimal differences were observed when comparing the different equations (linear, exponential, quadratic) for all treatments combined. However, no significant differences were observed between the sensor measurements. Incorporating meteorological variables into the yield prediction model yielded promising outcomes concerning GreenSeeker metrics, as evidenced by a notable reduction in RMSE from 0.97 to 0.04. Conversely, the integration produced less favorable outcomes for the MicaSense camera, manifesting as a substantial escalation in RMSE from 1.71 to 7.23.

4.5. Comparison of Sensors in the Yield Prediction Model

Based on the yield prediction model, GreenSeeker was more suitable for winter wheat yield prediction than the MicaSense camera. This is likely the saturation point in the NDVI value, as the MicaSense camera measures approximately 0.2 higher values than the GreenSeeker [55]. Thus, wheat can no longer detect a significant difference between the different treatments in mid-season and, therefore, will produce low yield prediction values [38]. On the contrary, GreenSeeker provided reliable data from the stem extension period to almost the end of the growing stages for the treated plots (Table 4). However, other studies have significantly improved wheat yield prediction models using multispectral sensors. These studies employed multispectral imaging along with wheat elevation data [73], or they integrated vegetation indices (VI) derived from UAV-based multispectral images, solar radiation, and crop height data [74].

5. Conclusions

The research involved a small-scale field trial time series analysis in winter wheat, where the same amount of nitrogen-active substance was applied. The temporal distribution of the applied amount was different. The effects of fertilizers applied at different rates were measured using NDVI, which was also employed to assess plant biomass change. These data were collected from a GreenSeeker (GS) handheld sensor and a MicaSense (MS) multispectral camera.
The comparison between GS-NDVI and UAV-NDVI values shows the following:
  • The Control treatment could be differentiated from the other treatments using the GreenSeeker sensor; however, with the MicaSense camera, the same result could only be consistently observed five out of six times.
  • Higher NDVI values were obtained from the MicaSense camera data than from GreenSeeker, making it challenging to differentiate between the treatments.
In line with expectations from the literature, the Pearson and regression analyses revealed that NDVI values obtained from the MicaSense camera and GreenSeeker data at 226 DAS were significantly correlated with the predicted yield. Additionally, CGDD values improved the yield prediction model, while DFS values showed no significant effect on wheat yield. Only minor differences were observed among linear, exponential, and quadratic equations in most cases for both sensors. However, the GreenSeeker device provided more reliable and accurate winter wheat yield prediction data. Moreover, it is a less expensive and simpler device for farmers to use compared to UAVs.

Author Contributions

Conceptualization, S.Z. and I.M.K.; methodology, G.M.; software, G.K.; validation, L.B., V.V. and Z.V.; formal analysis, I.M.K.; investigation, S.Z.; resources, S.Z.; data curation, Z.V.; writing—original draft preparation, I.M.K.; writing—review and editing, S.Z.; visualization, D.S.; supervision, G.M.; project administration, A.J.K.; funding acquisition, G.T. All authors have read and agreed to the published version of the manuscript.

Funding

This work was supported by the ÚNKP-22-3-II New National Excellence Program of the Ministry for Culture and Innovation from the source of the National Research, Development and Innovation Fund and 2020-1.1.2-PIACI-KFI-2021-00182 project.

Data Availability Statement

The data presented in this study are available upon request from the corresponding author. The data are not publicly available due to their use in subsequent studies.

Acknowledgments

The authors would like to thank the Nitrogénművek Zrt. for providing support for this project.

Conflicts of Interest

The authors declare no conflicts of interest.

Abbreviations

The following abbreviations are used in this manuscript:
CGDDCumulative Growing Degree Days
DFSDays From Sowing
GDDGrowing Degree Days
GSGreenSeeker
MSMicaSense
NDVINormalized Difference Vegetation Index
NIRNear-infrared
RMSERoot Mean Square Error
UAVUncrewed aerial vehicle

Appendix A

Table A1. Coordinates of the 48 sampling points.
PointsLatitudeLongitude
147.894050634117.2637578119
247.894060519417.2637935554
347.894071566917.2638307009
447.894121301917.2640041544
547.894132180917.2640401513
647.894142713817.2640768041
747.894193600617.2642487861
847.894204408317.2642854641
947.894214914817.2643212156
1047.894265518517.2644942766
1147.894275941217.2645303661
1247.894286049617.2645665189
1347.894083796317.2637346252
1447.894094516117.2637698844
1547.894104871217.2638069701
1647.894155138817.2639813850
1747.894165973617.2640164961
1847.894175871217.2640529956
1947.894226447817.2642248041
2047.894237147417.2642625486
2147.894242605117.2642807087
2247.894298555117.2644709162
2347.894308624317.2645082581
2447.894319621117.2645446066
2547.894122099417.2637077809
2647.894131562417.2637449315
2747.894141752917.2637816772
2847.894192390317.2639548473
2947.894202007817.2639910587
3047.894212697417.2640278134
3147.894262522317.2642000449
3247.894272487517.2642369656
3347.894283035217.2642726519
3447.894335245417.2644482310
3547.894346456217.2644868593
3647.894357081317.2645222206
3747.894150518817.2636876134
3847.894161083217.2637233155
3947.894171492917.2637604708
4047.894221878517.2639338507
4147.894231806717.2639709153
4247.894242315217.2640068118
4347.894291961317.2641801123
4447.894302834217.2642160843
4547.894313587217.2642521333
4647.894363801917.2644258443
4747.894374469717.2644621059
4847.894385087517.2644969838

References

  1. Tandzi, L.N.; Mutengwa, C.S. Estimation of maize (Zea mays L.) yield per harvest area: Appropriate methods. Agronomy 2022, 10, 29. [Google Scholar] [CrossRef]
  2. Shiferaw, B.; Smale, M.; Braun, H.J.; Duveiller, E.; Reynolds, M.; Muricho, G. Crops that feed the world Past successes and future challenges to the role played by wheat in global food security. Food Secur. 2013, 5, 291–317. [Google Scholar] [CrossRef]
  3. Kiss, I. Significance of wheat production in world economy and position of Hungary in it. In Applied Studies in Agribusiness and Commerce—APSTRACT; Agroinform Publishing House: Budapest, Hungary, 2011; pp. 115–119. [Google Scholar] [CrossRef]
  4. Magneya, T.S.; Eitel, J.U.H.; Huggins, D.R.; Vierling, L.A. Proximal NDVI derived phenology improves in-season predictions of wheat quantity and quality. Agric. For. Meteorol. 2016, 217, 26–60. [Google Scholar] [CrossRef]
  5. Kokhan, S.; Vostokov, A. Application of nanosatellites PlanetScope data to monitor crop growth. E3S Web Conf. 2020, 171, 02014. [Google Scholar] [CrossRef]
  6. Pellegrini, P.; Cossani, C.M.; Di Bella, C.M.; Piñeiro, G.; Sadras, V.O.; Oesterheld, M. Simple regression models to estimate light interception in wheat crops with Sentinel-2 and a handheld sensor. Crop Sci. 2020, 60, 1607–1616. [Google Scholar] [CrossRef]
  7. Ritz, E.; Bjerke, J.W.; Tømmervik, H. Monitoring Winter Stress Vulnerability of High-Latitude Understory Vegetation Using Intraspecific Trait Variability and Remote Sensing Approaches. Sensors 2020, 20, 2102. [Google Scholar] [CrossRef]
  8. Novák, J.; Lukas, V.; Rodriguez-Moreno, F.; Křen, J. Assessment of soil variability of south Moravian region based on the satellite imagery. Acta Univ. Agric. Silvic. Mendel. Brun 2018, 66, 119–129. [Google Scholar] [CrossRef]
  9. Milics, G. Application of UAVs in Precision Agriculture. In International Climate Protection; Palocz-Andresen, M., Szalay, D., Gosztom, A., Sípos, L., Taligás, T., Eds.; Springer: Berlin/Heidelberg, Germany, 2019; pp. 93–97. [Google Scholar] [CrossRef]
  10. Tang, L.; Morel, J.; Halling, M.; Öhlund, L.; Parsons, D. A comparison of field assessment methods for lucerne inoculation experiments. Acta Agric. Scand. Sect. B Soil Plant Sci. 2022, 72, 860–872. [Google Scholar] [CrossRef]
  11. Wang, J.; Badenhorst, P.; Phelan, A.; Pembleton, L.; Shi, F.; Cogan, N.; Spangenberg, G.; Smith, K. Using Sensors and Unmanned Aircraft Systems for High-Throughput Phenotyping of Biomass in Perennial Ryegrass Breeding Trials. Front. Plant Sci. 2019, 10, 1381. [Google Scholar] [CrossRef]
  12. Choudhary, S.S.; Biswal, S.; Saha, R.; Chatterjee, C. A non-destructive approach for assessment of nitrogen status of wheat crop using unmanned aerial vehicle equipped with RGB camera. Arab. J. Geosci. 2021, 14, 1739. [Google Scholar] [CrossRef]
  13. Dash, J.P.; Pearse, G.D.; Watt, M.S. UAV multispectral imagery can complement satellite data for monitoring forest health. Remote Sens. 2018, 10, 1216. [Google Scholar] [CrossRef]
  14. Ali, M.A.; Ibrahim, S.M.; Bijay-Singh. Wheat grain yield and nitrogen uptake prediction using atLeaf and GreenSeeker portable optical sensors at jointing growth stage. Inf. Process. Agric. 2020, 7, 375–383. [Google Scholar] [CrossRef]
  15. Verhulst, N.; Govaerts, B.; Nelissen, V.; Sayre, K.D.; Crossa, J.; Raes, D.; Deckers, J. The effect of tillage, crop rotation and residue management on maize and wheat growth and development evaluated with an optical sensor. Field Crops Res. 2011, 120, 58–67. [Google Scholar] [CrossRef]
  16. Martins, R.N.; Moraes, H.M.F.; Portes, M.F.; Junior, W.A.O.; Junior, M.F.R. Do optical sensor readings change throughout the day? An evaluation of two sensor systems. J. Plant Nutr. 2020, 43, 1689–1696. [Google Scholar] [CrossRef]
  17. Padilla, F.M.; Souza, R.; Peña Fleitas, M.T.; Grasso, R.; Gallardo, M.; Thompson, R.B. Influence of time of day on measurement with chlorophyll meters and canopy reflectance sensors of different crop N status. Precis. Agric. 2019, 20, 1087–1106. [Google Scholar] [CrossRef]
  18. Nakano, H.; Tanaka, R.; Guan, S.; Ohdan, H. Predicting rice grain yield using normalized difference vegetation index from UAV and GreenSeeker. Crop Environ. 2023, 2, 59–65. [Google Scholar] [CrossRef]
  19. Papadopoulos, G.; Mavroeidis, A.; Roussis, O.; Kakabouki, I.; Stavropoulos, P.; Bilalis, D. Evaluation of tillage & fertilization in Carthamus tinctorius L. using remote sensing. Smart Agric. Technol. 2023, 4, 100158. [Google Scholar] [CrossRef]
  20. Bhandari, M.; Ibrahim, A.M.H.; Xue, Q.; Jung, J.; Chang, A.; Rudd, J.C.; Maeda, M.; Rajan, N.; Neely, H.; Landivar, J. Assessing winter wheat foliage disease severity using aerial imagery acquired from small Unmanned Aerial Vehicle (UAV). Comput. Electron. Agric. 2020, 176, 105665. [Google Scholar] [CrossRef]
  21. Rejeb, A.; Abdollahi, A.; Rejeb, K.; Treiblmaier, H. Drones in agriculture: A review and bibliometric analysis. Comput. Electron. Agric. 2022, 198, 107017. [Google Scholar] [CrossRef]
  22. Duan, T.; Chapmana, S.C.; Guo, Y.; Zheng, B. Dynamic monitoring of NDVI in wheat agronomy and breeding trials using an unmanned aerial vehicle. Field Crops Res. 2017, 210, 71–80. [Google Scholar] [CrossRef]
  23. Khadka, K.; Burt, A.J.; Earl, H.J.; Raizada, M.N.; Navabi, A. Does Leaf Waxiness Confound the Use of NDVI in the Assessment of Chlorophyll When Evaluating Genetic Diversity Panels of Wheat? Agronomy 2021, 11, 486. [Google Scholar] [CrossRef]
  24. Berzéki, M.; Kozma-Bognár, V.; Berke, J. Examination of vegetation indices based on multitemporal drone images. Gradus 2023, 10, 6. [Google Scholar] [CrossRef]
  25. Svensgaard, J.; Jensen, S.M.; Christensen, S.; Rasmussen, J. The importance of spectral correction of UAV-based phenotyping with RGB cameras. Field Crops Res. 2021, 269, 108177. [Google Scholar] [CrossRef]
  26. Cao, S.; Danielson, B.; Clare, S.; Koenig, S.; Campos-Vargas, C.; Sanchez-Azofeifa, A. Radiometric calibration assessments for UAS-borne multispectral cameras: Laboratory and field protocols. ISPRS J. Photogramm. Remote Sens. 2019, 149, 132–145. [Google Scholar] [CrossRef]
  27. Almoujahed, M.B.; Rangarajan, A.K.; Whetton, R.L.; Vincke, D.; Eylenbosch, D.; Vermeulen, P.; Mouazen, A.M. Detection of fusarium head blight in wheat under field conditions using a hyperspectral camera and machine learning. Comput. Electron. Agric. 2022, 203, 107456. [Google Scholar] [CrossRef]
  28. Yin, S.; Zhou, K.; Cao, L.; Shen, X. Estimating the horizontal and vertical distributions of pigments in canopies of ginkgo plantation based on UAV-Borne LiDAR, hyperspectral data by coupling PROSAIL model. Remote Sens. 2022, 14, 715. [Google Scholar] [CrossRef]
  29. Jelínek, Z.; Starý, K.; Kumhálová, J.; Lukáš, J.; Mašek, J. Winter wheat, winter rape and poppy crop growth evaluation with the help of remote and proximal sensing measurements. Agron. Res. 2020, 18, 2049–2059. [Google Scholar] [CrossRef]
  30. Shafiee, S.; Mroz, T.; Burud, I.; Lillemo, M. Evaluation of UAV multispectral cameras for yield and biomass prediction in wheat under different sun elevation angles and phenological stages. Comput. Electron. Agric. 2023, 210, 107874. [Google Scholar] [CrossRef]
  31. Tanabe, R.; Matsui, T.; Tanaka, T.S.T. Winter wheat yield prediction using convolutional neural networks and UAV-based multispectral imagery. Field Crops Res. 2023, 291, 108786. [Google Scholar] [CrossRef]
  32. Ma, J.; Liu, B.; Ji, L.; Zhu, Z.; Wu, Y.; Jiao, W. Field-scale yield prediction of winter wheat under different irrigation regimes based on dynamic fusion of multimodal UAV imagery. Int. J. Appl. Earth Obs. Geoinf. 2023, 118, 103292. [Google Scholar] [CrossRef]
  33. Zhitao, Z.; Lan, Y.; Pute, W.; Wenting, H. Model of soybean NDVI change based on time series. J. Agric. Biol. Eng. 2014, 70, 64–70. [Google Scholar] [CrossRef]
  34. Swoish, M.; Filho, J.F.D.C.L.; Reiter, M.S.; Campbell, J.B.; Thomason, W.E. Comparing satellites and vegetation indices for cover crop biomass estimation. Comput. Electron. Agric. 2022, 196, 106900. [Google Scholar] [CrossRef]
  35. Hassan, M.A.; Yang, M.; Rasheed, A.; Yang, G.; Reynolds, M.; Xia, X.; Xiao, Y.; He, Z. A rapid monitoring of NDVI across the wheat growth cycle for grain yield prediction using a multi-spectral UAV platform. Plant Sci. 2019, 282, 95–103. [Google Scholar] [CrossRef] [PubMed]
  36. Teboh, J.M.; Tubaña, B.S.; Udeigwe, T.K.; Emendack, Y.Y.; Lofton, J. Applicability of Ground-based Remote Sensors for Crop N Management in Sub Saharan Africa. J. Agric. Sci. 2012, 4, 175–188. [Google Scholar] [CrossRef]
  37. Kizilgeci, F.; Yildirim, M.; Islam, M.S.; Ratnasekera, D.; Iqbal, M.A.; Sabagh, A.E. Normalized Difference Vegetation Index and Chlorophyll Content for Precision Nitrogen Management in Durum Wheat Cultivars under Semi-Arid Conditions. Sustainability 2021, 13, 3725. [Google Scholar] [CrossRef]
  38. Naser, M.A.; Khosla, R.; Longchamps, L.; Dahal, S. Using NDVI to Differentiate Wheat Genotypes Productivity Under Dryland and Irrigated Conditions. Remote Sens. 2020, 12, 824. [Google Scholar] [CrossRef]
  39. Vannoppen, A.; Gobin, A. Estimating Farm Wheat Yields from NDVI and Meteorological Data. Agronomy 2021, 11, 946. [Google Scholar] [CrossRef]
  40. Thapa, S.; Rudd, J.C.; Xue, Q.; Bhandari, M.; Reddy, S.K.; Jessup, K.E.; Liu, S.; Devkota, R.N.; Baker, J.; Baker, S. Use of NDVI for characterizing winter wheat response to water stress in a semi-arid environment. J. Crop Improv. 2019, 33, 633–648. [Google Scholar] [CrossRef]
  41. Large, E.C. Growth stages in cereals—Illustration of the Feekes scale. Plant Pathol. 1954, 3, 128–129. [Google Scholar] [CrossRef]
  42. An, N.; Palmer, C.M.; Baker, R.L.; Markelz, R.J.C.; Ta, J.; Convington, M.F.; Maloof, J.N.; Welch, S.M.; Weinig, C. Plant high-throughput phenotyping using photogrammetry and imaging techniques to measure leaf length and rosette area. Comput. Electron. Agric. 2016, 127, 376–394. [Google Scholar] [CrossRef]
  43. Salazar-Gutierrez, M.R.; Johnson, J.; Chaves-Cordoba, B.; Hoogenboom, G. Relationship of base temperature to development of winter wheat. Int. J. Plant Prod. 2013, 7, 741–762. [Google Scholar]
  44. R Core Team. A Language and Environment for Statistical Computing; R Foundation for Statistical Computing: Vienna, Austria, 2020; Available online: https://www.r-project.org (accessed on 5 February 2024).
  45. Mangiafico, S. Package ‘Rcompanion’: Functions to Support Extension Education Program Evaluation, R Package Version 2.4.1; GNU Project: Vienna, Austria, 2021.
  46. Teal, R.K.; Tubana, B.; Girma, K.; Freeman, K.W.; Arnall, D.B.; Walsh, O.; Raun, W.R. In-Season Prediction of Corn Grain Yield Potential Using Normalized Difference Vegetation Index. Agron. J. 2006, 98, 1488–1494. [Google Scholar] [CrossRef]
  47. Lofton, J.; Tubana, B.S.; Kanke, Y.; Teboh, J.; Viator, H.; Dalen, M. Estimating Sugarcane Yield Potential Using an In-Season Determination of Normalized Difference Vegetative Index. Sensors 2012, 12, 7529–7547. [Google Scholar] [CrossRef]
  48. Li, F.; Miao, Y.; Zhang, F.; Cui, Z.; Li, R.; Chen, X.; Zhang, H.; Schroder, J.; Raun, W.R.; Jia, L. In-season optical sensing improves nitrogen use efficiency for winter wheat. Soil Sci. Soc. Am. J. 2009, 73, 1566–1574. [Google Scholar] [CrossRef]
  49. He, C.E.; Liu, X.J.; Fangmeier, A.; Zhang, F.S. Quantifying the total airborne nitrogen input into agroecosystems in the North China Plain. Agric. Ecosyst. Environ. 2007, 121, 395–400. [Google Scholar] [CrossRef]
  50. Samborski, S.M.; Tremblay, N.; Fallon, E. Strategies to Make Use of Plant Sensors-Based Diagnostic Information for Nitrogen Recommendations. Agron. J. 2009, 101, 800–816. [Google Scholar] [CrossRef]
  51. Ya, N.N.C.; Lee, L.S.; Ismail, M.R.; Razali, S.M.; Roslin, N.A.; Omar, M.H. Development of Rice Growth Map Using the Advanced Remote Sensing Techniques. In Proceedings of the International Conference on Computer and Drone Applications (IConDA), Kuching, Malaysia, 19–21 December 2019; pp. 23–28. [Google Scholar] [CrossRef]
  52. Wilke, N.; Siegmann, B.; Postma, J.A.; Muller, O.; Krieger, V.; Pude, R.; Rascher, U. Assessment of plant density for barley and wheat using UAV multispectral imagery for high-throughput field phenotyping. Comput. Electron. Agric. 2021, 189, 106380. [Google Scholar] [CrossRef]
  53. Goffart, D.; Dvorakova, K.; Crucil, G.; Curnel, Y.; Limbourg, Q.; Van Oost, K.; Castaldi, F.; Planchon, V.; Goffart, J.P.; van Wesemael, B. UAV Remote Sensing for Detecting within-Field Spatial Variation of Winter Wheat Growth and Links to Soil Properties and Historical Management Practices. A Case Study on Belgian Loamy Soil. Remote Sens. 2022, 14, 2806. [Google Scholar] [CrossRef]
  54. Dimyati, M.; Supriatna, S.; Nagasawa, R.; Pamungkas, F.D.; Pramayuda, R.A. Comparison of Several UAV-Based Multispectral Imageries in Monitoring Rice Paddy (A Case Study in Paddy Fields in Tottori Prefecture, Japan). ISPRS Int. J. Geo-Inf. 2023, 12, 36. [Google Scholar] [CrossRef]
  55. Gu, Y.; Wylie, B.K.; Howard, D.M.; Phuyal, K.P.; Ji, L. NDVI saturation adjustment: A new approach for improving cropland performance estimates in the Greater Platte River Basin, USA. Ecol. Indic. 2013, 30, 1–6. [Google Scholar] [CrossRef]
  56. Cao, Q.; Miao, Y.; Shen, J.; Yu, W.; Yuan, F.; Cheng, S.; Huang, S.; Wang, H.; Yang, W.; Liu, F. Improving in-season estimation of rice yield potential and responsiveness to topdressing nitrogen application with Crop Circle active crop canopy sensor. Precis. Agric. 2016, 17, 136–154. [Google Scholar] [CrossRef]
  57. Goodwin, A.W.; Lindsey, L.E.; Harrison, S.K.; Paul, P.A. Estimating Wheat Yield with Normalized Difference Vegetation Index and Fractional Green Canopy Cover. Crop Forage Turfgrass Manag. 2018, 4, 1–6. [Google Scholar] [CrossRef]
  58. Guan, S.; Fukami, K.; Matsunaka, H.; Okami, M.; Tanaka, R.; Nakano, H.; Sakai, T.; Nakano, K.; Ohdan, H.; Takahashi, K. Assessing Correlation of High-Resolution NDVI with Fertilizer Application Level and Yield of Rice and Wheat Crops Using Small UAVs. Remote Sens. 2019, 11, 112. [Google Scholar] [CrossRef]
  59. Kiran Pavuluri, K.; Chim, B.K.; Griffey, C.A.; Reiter, M.S.; Balota, M.; Thomason, W. Canopy spectral reflectance can predict grain nitrogen use efficiency in soft red winter wheat. Precis. Agric. 2015, 16, 405–424. [Google Scholar] [CrossRef]
  60. Walsh, O.S.; Marshall, J.M.; Nambi, E.; Jackson, C.A.; Ansah, E.O.; Lamichhane, R.; McClintick-Chess, J.; Bautista, F. Wheat Yield and Protein Estimation with Handheld and Unmanned Aerial Vehicle-Mounted Sensors. Agronomy 2023, 13, 207. [Google Scholar] [CrossRef]
  61. Martí, J.M.; Bort, J.; Slafer, G.A.; Araus, J.L. Can wheat yield be assessed by early measurements of normalized difference vegetation index? Ann. Appl. Biol. 2007, 150, 253–257. [Google Scholar] [CrossRef]
  62. Royo, C.; Aparicio, N.; Villegas, D.; Casadesus, J.; Monneveux, P.; Araus, J.L. Usefulness of spectral reflectance indices as durum wheat yield predictors under contrasting Mediterranean conditions. Int. J. Remote Sens. 2003, 24, 4403–4419. [Google Scholar] [CrossRef]
  63. Kogan, F.; Kussul, N.; Adamenko, T.; Skakun, S.; Kravchenko, O.; Kryvobok, O.; Shelestov, A.; Kolotii, A.; Kussul, O.; Lavrenyuk, A. Winter wheat yield forecasting in Ukraine based on Earth observation, meteorological data and biophysical models. Int. J. Appl. Earth Obs. Geoinf. 2013, 23, 192–203. [Google Scholar] [CrossRef]
  64. Almeida-Ñauñay, A.F.; Tarquis, A.M.; López-Herrera, J.; Pérez-Martín, E.; Pancorbo, J.L.; Raya-Sereno, M.D.; Quemada, M. Optimization of soil background removal to improve the prediction of wheat traits with UAV imagery. Comput. Electron. Agric. 2023, 205, 107559. [Google Scholar] [CrossRef]
  65. Ratjen, A.M.; Böttcher, U.; Kage, H. Improved modeling of grain number in winter wheat. Field Crops Res. 2012, 133, 167–175. [Google Scholar] [CrossRef]
  66. Raun, W.R.; Solie, J.B.; Johnson, G.V.; Stone, M.L.; Lukina, E.V.; Thomason, W.E.; Schepers, J.S. In-Season Prediction of Potential Grain Yield in Winter Wheat Using Canopy Reflectance. Agron. J. 2001, 93, 131–138. [Google Scholar] [CrossRef]
  67. Iwańska, M.; Stępień, M. The effect of soil and weather conditions on yields of winter wheat in multi-environmental trials. Biom. Lett. 2019, 56, 263–279. [Google Scholar] [CrossRef]
  68. Erekul, O.; Köhn, W. Effect of Weather and Soil Conditions on Yield Components and Bread-Making Quality of Winter Wheat (Triticum aestivum L.) and Winter Triticale (Triticosecale Wittm.) Varieties in North-East Germany. J. Agron. Crop Sci. 2006, 192, 452–464. [Google Scholar] [CrossRef]
  69. Linina, A.; Ruza, A. The influence of cultivar, weather conditions and nitrogen fertilizer on winter wheat grain yield. Agric. Res. 2018, 16, 147156. [Google Scholar] [CrossRef]
  70. Bauer, A.; Frank, A.B.; Black, A.L. Estimation of Spring Wheat Leaf Growth Rates and Anthesis from Air Temperature. Agric. J. 1984, 76, 829–835. [Google Scholar] [CrossRef]
  71. Giolo, M.; Sallenave, R.; Pornaro, C.; Velasco-Cruz, C.; Macolino, S.; Leinauer, B. Base temperatures affect accuracy of growing degree day model to predict emergence of bermudagrasses. Agric. J. 2021, 113, 2960–2966. [Google Scholar] [CrossRef]
  72. Harrell, D.L.; Tubaña, B.S.; Walker, T.W.; Phillips, S.B. Estimating Rice Grain Yield Potential Using Normalized Difference Vegetation Index. Agric. J. 2011, 103, 1717–1723. [Google Scholar] [CrossRef]
  73. Liu, T.; Wu, F.; Mou, N.; Zhu, S.; Yang, T.; Zhang, W.; Wang, H.; Wu, W.; Zhao, Y.; Sun, C.; et al. The estimation of wheat yield combined with UAV canopy spectral and volumetric data. Food Energy Secur. 2024, 13, e527. [Google Scholar] [CrossRef]
  74. Khodjaev, S.; Kuhn, L.; Bobojonov, I.; Glauben, T. Combining multiple UAV-Based indicators for wheat yield estimation, a case study from Germany. Eur. J. Remote Sens. 2024, 57, 2294121. [Google Scholar] [CrossRef]
Figure 1. Research field at Széchenyi István University, Mosonmagyaróvár, Hungary. The four treatments (Environmental, Balance, Genezis, and Control) are in different colors.
Drones 08 00088 g001
Figure 2. Average air temperature (°C) and monthly precipitation (mm) at the experimental field from October to June in 2021–2022 and 2022–2023 growing season.
Drones 08 00088 g002
Figure 3. (a) winter wheat yields between 2021–2022 and 2022–2023 period, (b) winter wheat yields between treatments (Control, Environmental, Balance, Genezis) in 2021–2022 and 2022–2023 growing season. a–significant difference (p ≥ 0.05), b–no significant difference.
Drones 08 00088 g003
Figure 4. Relationship between winter wheat yield and NDVI measurements for all treatments (Control, Environmental, Balance, and Genezis) in the 2021–2022 and 2022–2023 periods, (a) GreenSeeker linear, (b) MicaSense linear, (c) GreenSeeker exponential, (d) MicaSense exponential, (e) GreenSeeker quadratic, (f) MicaSense quadratic equations.
Drones 08 00088 g004
Figure 5. Modification of linear (a,b), exponential (c,d), and quadratic (e,f) yield prediction equations using CGDD and DFS data based on GreenSeeker (GS) measurements and MicaSense-derived (MS) NDVI values. The figures depict the measurement results for the 2021–2022 and 2022–2023 periods for both sensors. CGDD and DFS values represent the number of days from sowing to sensing, where GDD (growing degree days) > 0 and the cumulative growing degree days (CGDD) from sowing to sensing, respectively.
Drones 08 00088 g005
Figure 6. Relationship between the observed and predicted yields of the linear yield prediction model for estimating in-season yield of winter wheat based on (a) GreenSeeker data and (b) MicaSense camera data.
Drones 08 00088 g006
Table 1. The table provides information on the active substances applied during the treatments, including the amount, type, and date of fertilizer application in autumn and spring.
TreatmentActive Substance Discharged (kg/ha)Fertilizer Applied kg/ha (Autumn) 25 October 2021 and 2022Fertilizer Applied kg/ha (Spring) 1 March 2022 and 2023
NP2O5K2OTypeQuantityTypeQuantity
Control (C)-------
Environ-mental (A)135.377.5-NP 15-25310N 27%329
Balance (B)135.191.0-NP 15-25364N 27%298
Genezis (D)135.075.045NPK 5-18-18
NP 15-25
250
120
N 27%387
Table 2. The NDVI values were categorized by four treatments (Control, Environmental (Envir.), Balance, Genezis) and six dates in the 2021–2022 and 2022–2023. (Within each year and sensor, treatments that differ significantly at p ≤ 0.05 are indicated with a different letter).
YearSensorTreatment12 April28 April12 May24 May7 June21 June
2021–2022Green-SeekerControl0.46 ± 0.06 a0.55 ± 0.08 a0.59 ± 0.06 a0.47 ± 0.07 a0.43 ± 0.06 a0.13 ± 0.05 a
Envir.0.54 ± 0.06 b0.69 ± 0.04 b0.70 ± 0.02 b0.61 ± 0.03 b0.53 ± 0.03 b0.20 ± 0.03 b
Balance0.51 ± 0.10 b0.67 ± 0.10 b0.68 ± 0.04 b0.58 ± 0.03 b0.51 ± 0.04 b0.20 ± 0.05 b
Genezis0.53 ± 0.05 b0.68 ± 0.03 b0.68 ± 0.03 b0.59 ± 0.04 b0.53 ± 0.05 b0.20 ± 0.05 b
Mica-SenseControl0.60 ± 0.07 a0.80 ± 0.05 a0.84 ± 0.03 a0.79 ± 0.04 a0.71 ± 0.06 a0.35 ± 0.08 a
Envir.0.67 ± 0.07 b0.89 ± 0.02 b0.89 ± 0.01 a0.86 ± 0.01 b0.79 ± 0.02 b0.47 ± 0.06 b
Balance0.64 ± 0.10 b0.88 ± 0.06 b0.86 ± 0.10 a0.85 ± 0.03 b0.77 ± 0.05 b0.47 ± 0.06 b
Genezis0.66 ± 0.05 b0.89 ± 0.02 b0.89 ± 0.01 a0.86 ± 0.01 b0.78 ± 0.04 b0.45 ± 0.07 b
2022–2023Green-SeekerControl0.65 ± 0.07 a0.60 ± 0.07 a0.66 ± 0.05 a0.58 ± 0.05 a0.45 ± 0.06 a0.15 ± 0.03 a
Envir.0.76 ± 0.07 b0.76 ± 0.06 b0.76 ± 0.04 b0.70 ± 0.03 b0.60 ± 0.05 b0.25 ± 0.04 b
Balance0.79 ± 0.02 b0.79 ± 0.02 b0.78 ± 0.02 b0.71 ± 0.02 b0.62 ± 0.02 b0.24 ± 0.02 b
Genezis0.78 ± 0.03 b0.79 ± 0.02 b0.79 ± 0.02 b0.72 ± 0.01 b0.62 ± 0.02 b0.24 ± 0.03 b
Mica-SenseControl0.88 ± 0.04 a0.86 ± 0.04 a0.85 ± 0.04 a0.80 ± 0.03 a0.75 ± 0.03 a0.38 ± 0.04 a
Envir.0.92 ± 0.04 b0.91 ± 0.03 b0.89 ± 0.02 a0.86 ± 0.03 b0.83 ± 0.01 b0.53 ± 0.04 b
Balance0.94 ± 0.01 b0.92 ± 0.01 b0.89 ± 0.01 a0.86 ± 0.02 b0.83 ± 0.02 b0.52 ± 0.03 b
Genezis0.94 ± 0.01 b0.92 ± 0.01 b0.90 ± 0.01 a0.87 ± 0.01 b0.83 ± 0.01 b0.49 ± 0.03 b
Table 3. Pearson correlation analysis of the NDVI values produced from the data measured by GreenSeeker (GS) and MicaSense (MS) camera and winter wheat yield of four treatments (Control–Con., Environmental–Env., Balance–Bal., Genezis–Gen.).
DAS (Day)Con. (GS)Con. (MS)Env. (GS)Env. (MS)Bal. (GS)Bal. (MS)Gen. (GS)Gen. (MS)
1700.2890.3490.853 **0.866 **0.832 *0.854 **0.860 **0.888 **
1860.2260.2620.728 *0.4490.6690.5020.830 *0.946 ***
2000.360−0.0840.877 **−0.0940.854 **0.2890.891 **0.296
2120.4850.2750.884 **0.1010.874 **0.5160.897 **0.632
2260.3170.6840.872 **0.869 **0.946 ***0.871 **0.874 **0.821 *
2400.863 **0.940 ***0.6720.5700.822 *0.834 **0.726 *0.673
Significance level: * p ≤ 0.05, ** p ≤ 0.01, *** p ≤ 0.001. The correlation coefficients were calculated at each sampling date n = 8 at every sampling time.
Table 4. The coefficient of determination (R2) between NDVI values measured by GreenSeeker and calculated from MicaSense camera data and yield of winter wheat of Control, Environmental, Balance, and Genezis treatments using three different equations.
DAS (Day)Treatments (GreenSeeker)
ControlEnvironmentalBalanceGenezis
E 1L 2Q 3E 1L 2Q 3E 1L 2Q 3E 1L 2Q 3
1700.090.080.080.72 **0.73 **0.74 *0.81 *0.70 **0.68 *0.74 **0.75 **0.76 *
1860.060.050.090.52 *0.53 *0.78 *0.420.440.75 *0.67 *0.80 *0.68
2000.120.110.160.78 **0.89 **0.82 *0.68 *0.70 **0.73 *0.77 **0.78 **085 **
2120.250.230.470.81 **0.80 **0.81 *0.74 **0.77 **0.77 *0.78 **0.79 **0.80 *
2260.130.110.610.76 **0.77 **0.82 *0.90 ***0.91 ***0.91 **0.78 **0.79 **0.79 *
2400.70 **0.70 **0.86 **0.440.430.450.68 *0.66 **0.84 **0.53 *0.53 *0.57
DAS (Day)Treatments (MicaSense)
ControlEnvironmentalBalanceGenezis
E 1L 2Q 3E 1L 2Q 3E 1L 2Q 3E 1L 2Q 3
1700.130.120.230.74 **0.75 **0.82 *0.71 **0.72 **0.80 *0.78 *0.79 **0.86 **
1860.320.090.120.190.200.210.280.290.88 **0.88 ***0.88 ***0.88 ***
2000.00-0.120.080.010.010.070.080.200.150.150.15
2120.070.060.250.040.040.300.280.280.280.370.370.37
2260.500.480.700.79 **0.79 **0.86 **0.79 **0.78 **0.79 **0.69 *0.69 *0.69 *
2400.90 ***0.89 ***0.89 **0.370.350.380.71 **0.87 *0.690.470.470.48
1 Represented the exponential equation, and formula yyield = a × eb × xNDVI was used; 2 represented the linear equation, and formula yyield = a × xNDVI + b was used; 3 represented the quadratic equation, and formula yyield = a × xNDVI2 + b × xNDVI + c was used, a and b are regression parameters in each equation. * Significance level at the p ≤ 0.05 level, ** significance level at the p ≤ 0.01 level, *** significance level at the p ≤ 0.001 level.
Table 5. Regression coefficients (a, b), coefficient of determination (R2), and root mean square error (RMSE) for the in-season yield prediction models of winter wheat using different sensors.
Plant IndexMonitoring TimeR2Regression Parameters aRMSE
ab
Yield prediction model (GreenSeeker)NDVI/CGDD226 DAS0.9034,206−11.4830.97
Yield prediction model (MicaSense)NDVI/CGDD226 DAS0.6950,110−40.3361.71
a Regression parameter, in-season yield = a × eb × index value. The integrated yield prediction model was built using data from four treatments (Control, Environmental, Balance, Genezis) and two sensors (GreenSeeker, MicaSense camera) in 2021–2022 and 2022–2023 periods.
Disclaimer/Publisher’s Note: The statements, opinions and data contained in all publications are solely those of the individual author(s) and contributor(s) and not of MDPI and/or the editor(s). MDPI and/or the editor(s) disclaim responsibility for any injury to people or property resulting from any ideas, methods, instructions or products referred to in the content.

