Abstract
Ecological monitoring programs are fundamental to following natural-system populational trends. Drones are a new key to animal monitoring, presenting different benefits but two basic re-strictions First, the increase of information requires a high capacity of storage and, second, time invested in data analysis. We present a protocol to develop an automatic object recognizer to minimize analysis time and optimize data storage. We conducted this study at the Cruces River, Valdivia, Chile, using a Phantom 3 Advanced drone with an HD-standard camera. We used a Black-necked swan (Cygnus melancoryphus) as a model because it is abundant and has a contrasting color compared to the environment, making it easy detection. The drone flew 100 m from water surface (correcting AGL in relation to pilot landing altitude) obtaining georeferenced images with 75% overlap and developing approximately 0.69 km2 of orthomosaics images. We estimated the swans’ spectral signature to build the recognizer and adjusted nine criteria for object-oriented classification. We obtained 140 orthophotos classified into three brightness categories. We found that the Precision, Sensitivity, Specificity, and Accuracy indicator were higher than 0.93 and a calibration curve with R2= 0.991 for images without brightness. The recognizer prediction decreases with brightness but is corrected using ND8-16 filter lens. We discuss the importance of this recognizer to data analysis optimization and the advantage of using this recognition protocol for any object in ecological studies.
1. Introduction
Ecological monitoring programs are essential to understanding the population dynamics of different species worldwide. These monitoring programs allow researchers to describe natural patterns or detect disturbances, generating information to develop efficient management tools and knowledge-based decision-making [1,2,3,4]. New technologies improve the data collection quantity and quality from natural systems, increasing the precision and exactitude of measures to establish better monitoring programs [4,5]. Remote sensing techniques allow for obtaining information from isolated places, reducing sampling time and effort and increasing the collected information’s accuracy [6,7]. Additionally, remote sensing can provide consistent long-term observation data at different scales, from local to global [8]. The information generated from these remote sensors depends on the sensor incorporated and on the characteristics of the images it produces, like (a) spatial resolution (pixel size), (b) spectral resolution (wavelength ranges), (c) temporal resolution (when and how often images are collected), and (d) spatial extent (ground area represented) [9].
Drones use has rapidly overcrowded over the years because of their accessibility, low-cost operation, versatility in size, flight autonomy, and the type of information they can collect [10,11,12]. This approach has been increasing the number of applications, including monitoring processes in agriculture, forestry, and ecology [13,14,15,16,17,18,19,20]. In this sense, monitoring programs have benefited from drones’ advantages, mainly because of the replicability of flight paths and the lower sampling effort, making more attainable time-series data (Table 1) [17].
Although the use of drones improves the accuracy of the spatial information obtained [5,21,22], the increase in data collection and the time invested in data analysis can be a significant disadvantage [21,23,24]. In response to this problem, automation in processing and analyzing images is a recent and promising research area [25]. This process generates multiple benefits, mainly reducing the time invested in analyzing photographs and videos and reducing or eliminating the bias generated by the observer [24]. Being an automatic process, it has the potential to be standardized and replicable [23]. Also, most of the parameters in the algorithms can be modified and used with different drones, focal species, and research for various purposes [23].

Table 1.
Summary of the drone’s advantages and disadvantages and recognizer use in the ecological context.
Table 1.
Summary of the drone’s advantages and disadvantages and recognizer use in the ecological context.
| Methodology | Advantages | Disadvantage | References |
|---|---|---|---|
| Direct counting versus manual drone counting | Objects on the images can be counted more than once by different observers. Improving the accuracy of abundance determination over classical sampling (i.e., binocular) and the spatial position of each individual can be obtained. | There may be observer and experience bias in image analysis. | [16,17,18,21,22,24] |
| Larger areas can be sampled simultaneously, making it a cost-efficient tool. In addition, it makes it possible to reach remote places. | Larger areas can be sampled simultaneously, making it a cost-efficient tool. In addition, it makes it possible to reach remote places.A large amount of information is generated, and ample storage and processing capacity is required. If the fly does not consider the basic biology of animals can cause disturbances to normal behavior. | [21,23,24] | |
| The images can be reviewed and used for various studies. | Storage power must be available. | [16,24] | |
| Use of recognizers | Reduces or eliminates observer bias and reduces analysis time for repeated sampling | The confusion matrix must be created, to determine the true positive, true negative, false positive, and false negative cases and make a correct interpretation based on the species. | [24] |
Most automatic recognition methods involve the use of spectral properties [26], pattern recognition (i.e., shape and texture [27]), and the use of filters to increase the contrast between the object of interest and the background [28]. These methods allow the systematic monitoring of multiple species and reduce the analysis time [29], optimizing the early detection of wildlife behavioral or populational changes, and contributing to evaluating conservation measures’ effectiveness (Table 1) [7]. Although automation brings multiple benefits, some disadvantages must be taken into consideration. Because it is a relatively new methodology, it has been used for species that are easier to detect and highly contrasted with their habitat [30]. In addition, each time a new dataset is available, the recognizers must be recreated or the existing ones adjusted, increasing the analysis time [31].
This study develops and describes an automatic count protocol of black-necked swans (Cygnus melancoryphus) under natural conditions. We used drone imagery and supervised classification methods to establish the spectral signature of black-necked swans and the shape attributes, and propose this protocol as a tool for the automatic classification of any object (individual) to be recognized from drone imagery. Although we have adjusted this tool to recognize swans, by modifying the parameters, it can be assigned to any species of interest.
2. Materials and Methods
2.1. Model and Study Area
The black-necked swan is an aquatic bird of the Anatidae family and the only species of the genus Cygnus in the Neotropics [32]. Its distribution includes Argentina, Chile, Uruguay, and Southern Brazil [32,33]. This species is a medium size (5–7 kg) herbivorous bird which diet is strongly related to the consumption of Egeria densa [34]. Black-necked swans are highly social and gregarious outside the breeding season, between July and March [35]. In the IUCN Red List of Threatened Species [33], the black-necked swan is classified as Least Concern, but the Chilean classification has different conservation status categories (Endangered and Vulnerable). In the study site, the black-necked swan is classified as Endangered.
We carried out this study at the Carlos Anwandter Sanctuary (39°49′ S, 73°15′ W), a 48.8 km² coastal wetland located in the southern range of the Valdivian Temperate Rain Forests Ecoregion, Chile [36,37]. In addition, we incorporated two sites in the Cruces River close to Valdivia City (Figure 1). We selected three sites where we performed 110 survey missions (48 for site 1, 44 for site 2, and 18 for site 3) between July 2017 and October 2018 using a Phantom 3 Advanced drone with an HD standard camera recorder (Sony Exmor R BSI 1/2.3″ sensor with 12 MP). We obtained the image following a pre-established back-and-forth route (transect) using the MyPilot application (https://www.mypilotapps.com, accessed on July 2017 to October 2018). The drone flew 100 m above the water surface (corrected with AGL from the pilot landing altitude) at a mean seed of 10 m/s (range between six to 12 m/s depending on the daily weather condition (slower in clouding conditions), automatically regulated by the camera’s sensor), minimizing blur in the images.We considered 100 m of altitude for survey, considering the minimum effect of the swans’ behavior, and following previous studies of drone effect on colonial birds’ behavior [38,39], and based on preliminary fly probes between 25 and 100 m without apparent changes in swans’ behavior. We georeferenced images with 75% overlap at both axes for orthophotograph construction (Figure 2). During each survey, we obtained 370 ± 90 (mean ± 1 SD) images with a surface of 0.69 km2 by orthomosaic and a pixel resolution of 3.854 ± 0.135 (mean ± 1 SD) cm. For orthophotograph construction, each set of images (one set for the survey mission) was mosaiced using an online version of the DroneDeploy software (https://www.dronedeploy.com, accessed on July 2017 to October 2018). Orthophotos were composed of 3 bands: red, green, and blue (RGB color model) within the visible spectrum (740 to 380 nm λ).
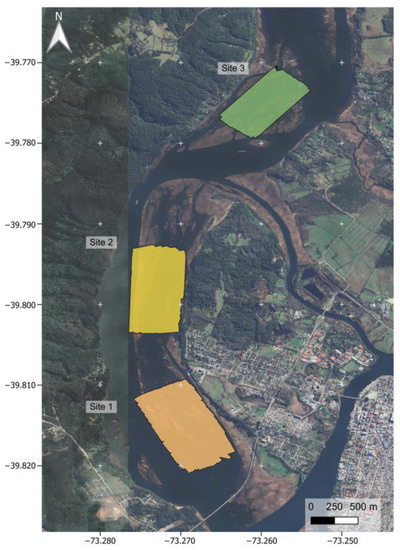
Figure 1.
Study area. Geographic location of the study area. The area within squares represents each sampling site; orange corresponds to site 1, yellow corresponds to site 2, and green corresponds to site 3.
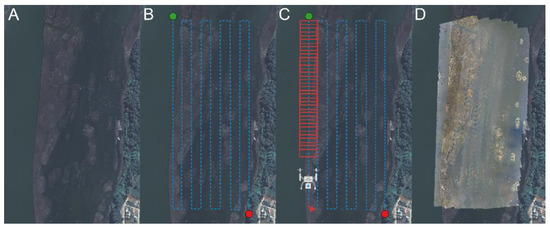
Figure 2.
Steps for obtaining orthophotographs. (A) Example for the sampling site number 2, (B) the design of the flight transects, (C) the superimposition of the obtained images, and (D) the creation of the orthophotography in the DroneDeploy software.
2.2. Building the Recognizer
The first step in developing the automatic recognizer was to describe the black-necked swans’ spectral signature. We randomly selected 14 out of 110 orthophotos and manually selected 10 individuals (140 total) for each. We recorded the range of spectral values for each pixel in each band for each selected individual. We determined the minimum threshold value for defining a black-necked swan in a band as the first quartile of the distribution of the spectral values in each band. According to the previous configuration, we filtered each orthophoto. If the pixel shows values higher than the threshold in all bands, it is classified as 1 and 0 otherwise (Supplementary Materials Figure S1). Finally, we vectorized the raster obtaining a vector layer, where each polygon represents a potential swan.
In the second step, we established an object-oriented classification. We selected nine attributes of the shape. We classified these measures into three groups following an intragroup hierarchical procedure. Group 1 included polygons: (a) size, (b) perimeter, (c) area/perimeter ratio, and (d) shape index, defined as ((4π* Area)/(Perimeter2)), where values close to 0 correspond to more prolonged and thinner figures, and values close to 1 resemble a circle [34,40]. Group 2 included (a) Box’s length, the minimum bounding box’s length that contains the polygon; (b) Box’s width, the minimum bounding box’s width that contains the polygon; (c) Box’s length/width, i.e., the quotient between the length and the width of the box; and (d) the intersection area, which corresponds to the percentage of the box intersected by the object. Group 3 included the vertex numbers of the polygon. To optimize the procedure, we used the first 14 orthophotos (140 individuals) and considered each measure’s maximum and minimum values to incorporate in the recognizer. We applied the filter to the remaining 96 orthophotos to obtain the number and spatial position of the classified “swan” objects. We performed the analyses using QGis 2.18 [41] and R software [42], including the packages Raster [43], rgdal [44], geosphere [45], spatstat [46], maptools [47], gdalUtils [48], rgeos [49], spatialEco [50], and R.utils [51]. We include the R code for the analysis (SM 2).
Due to the water brightness, overexposed or badly reconstructed areas can appear in orthophotos; we classified the orthophotos into three classes following Chabot and Francis (2016) [24]: (a) 0, there was no brightness; (b) 1, there was localized brightness; and (c) 2, the brightness was present throughout the orthophoto (Figure 3). We performed an independent analysis for each of the three categories.
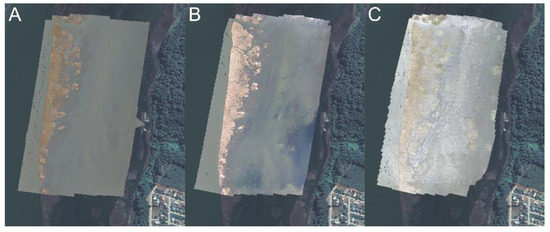
Figure 3.
Brightness orthophoto classification. (A) Category 0, there was no brightness; (B) Category 1, there was localized brightness; and (C) Category 2, the brightness was present throughout the orthophoto.
2.3. Evaluating the Accuracy of the Recognizer and Confusion Matrix
To evaluate the validity of the filtering procedures, we constructed a confusion matrix [52]. We manually checked all objects recognized by the filters in each of the 96 orthophotographs. We estimate the True-Positive objects (TP) as the objects correctly assigned as black-necked swans, the False-Positive objects (FP) corresponding to not black-necked swan objects that the recognizer assigned as swans, and the False-Negatives (FN) as missing black-necked swans archived in the orthophoto but not recognized by the recognizer. In addition, we estimated the true negative as the number of objects recognized by the spectral signature but rejected by the shape filters (TN) (Figure 4a). We estimated confusing matrix indicators, including Precision = TP/(TP + FP), Sensitivity = TP/(TP + FN), Specificity = TN/(TN + FP), and Accuracy = (TP + TN)/(TP + TN + FP + FN) (Figure 4b). Finally, we compared the manual count and recorder estimates in each orthophoto classification fitting linear regression model using R software [42,52].
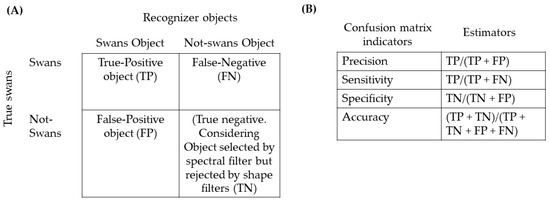
Figure 4.
Summary of the confusion matrix steps. (A) Class analysis where we separated the real and false objects. In (B), the confusion matrix indicator and the mathematical estimators.
3. Results
3.1. Filtering Process
The minimum critical thresholds for the black-necked swans’ coloration corresponded to 220 for the red, 221 for the green, and 221 for the blue band (Figure S1). We summarized the specific range estimated for each shape attributed in Table 2.

Table 2.
Shape attribute values. Lower and upper limits of the range in which an object is classified as a swan for each shape attribute used in the recognizer. Units in parenthesis (undimensional variables not present units).
3.2. Confusion Matrix
When we considered brightness levels, we classified 29 orthophotos in category 0, 14 in category 1, and 67 in category 2, representing 26.4%, 12.7%, and 60.9%, respectively. From the 29 orthophotos classified as category 0, the recognizer found a total of 17,345 objects, while, by direct count, we found 16,940 black-necked swans. Figure 5 shows an example of the explicit distribution of recognized and unrecognized objects (swans). In all brightness categories, we found a correct assignation of objects as swans (true-positive objects, Table 3). However, in high brightness (category 3), brightness spots tend to be recognized as swans, showing very high false-negative assignations (Table 3).
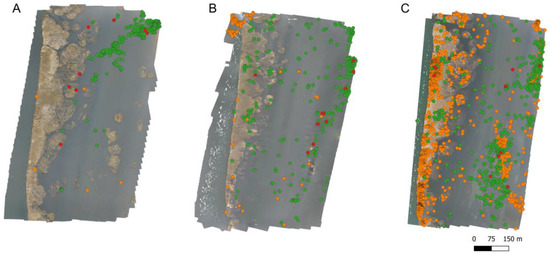
Figure 5.
Example of explicit detections performed by the recognizer. Green dots correspond to true-positive objects recognized, red dots correspond to true-negative objects unrecognized (real swans not detected by the recognizer), and orange dots correspond to false-true objects (object recognized as swans but are not). In (A), without brightness (category 0); in (B), localized brightness (category 1); and in (C), high brightness levels (category 2).

Table 3.
Summary of class analysis, including the true positives, false positives, true negatives, and false negatives separated by brightness categories.
In the confusion matrix, the Precision, Sensitivity, Specificity, and Accuracy were higher than 0.93 (Table 4). In the 14 orthophotos classified as category 1, the recognizer found 10,345 objects, while we estimated 7228 individuals by direct count. Sensitivity, Specificity, and Accuracy remained at high values (<0.90), but the Precision decreased to 0.687 (Table 4). The recognizer in category 2 orthophotos assigned 757,958 objects as black-necked swans, while we estimated 26,584 individuals by manual count. Precision decreased to 0.033, showing very bad object estimations (Table 4). In this case, the recognizer overestimates the FP, assigning a high number of brightness spots as Black-necked swan individuals. Sensitivity remains at high values, but the Specificity and Accuracy decrease to values nearest to 0.82 (Table 4).

Table 4.
Summary of the confusion matrix parameters for each brightness category.
Finally, in a recognized predictive capacity, we found high accuracy in orthophotos classified as category 0 (slope = 0.97, intercept = 0, adjusted R2 = 0.991; Figure 6a). In category 1, we found equivalent results but with a tendency of overestimating abundance (slope = 1.33, intercept = 0, adjusted R2 = 0.989; Figure 6b). Finally, we found no significant linear regression between the manual recount and recognizer in orthophotos classified as Category 2, indicating recognized non-accuracy for the brightness image (Figure 6c).
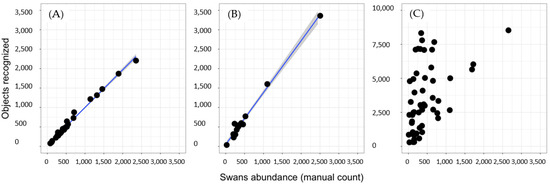
Figure 6.
Recognizer predictivity capacity. We show the linear regression results between absolute abundance (manual count) and the object automatically recognized. The blue line represents the linear model, and the gray confidence interval uses the standard error. In (A), We present the results of orthophotos without brightness (category 0), (B) moderate brightness (category 1), and (C) high brightness levels (category 2).
4. Discussion
We optimized a filtering protocol to establish an automatized system for counting black-necked swans from orthophotos. We analyzed 110 orthophotographs and compared manual versus automatized procedures to do this. We quantified 50,752 swans by manual count, whereas the automatic recognizer estimated a total of 49,262, which missed only 1653 swans (representing 3.257% of individuals lost). The spectral filter lost 163 individuals associated with the object’s size. In this case, we mainly lost chicks represented by a few pixels. Consequently, we found that the spectral signature was altered with environmental borders, because the low number of pixels with the objects is recognized.
We identified eight situations where the recognizer fails: (i) When two individuals are extremely close, the spectral signature cannot separate individuals (n = 251 individuals). In this case, the shape filter excludes both individuals (Figure 7A). (ii) Two individuals are extremely close and present different sizes (n = 257). The spectral filter recognizes only one individual, and then, the shape filter recognizes it; thus, only one individual is lost (Figure 7B). (iii) Young swans (n = 417 individuals). We optimized the filter to recognize adult shapes and sizes; thus, young swans are discarded (Figure 7C). (iv) Familiar groups (n = 68 individuals). When all swans are close together, the shape filter discards all the individuals (Figure 7D). (v) Adult clusters (n = 44 individuals). In some cases, swans swim in lines very close to each other (from three to eight individuals), and the shape filter discards the object, losing all the individuals (Figure 7E). (vi) Swans in wetland vegetation (n = 85 individuals). We observed that grassland distorts swans’ shapes, and the shape filter rejects these objects (Figure 7F). (vii) Flying swans (n = 8 individuals); extended wings change the object’s shape, and the shape filter rejects it (Figure 7G). (viii) Orthomosaic reconstruction (n = 360 individuals). In some cases, especially on borders, orthophotos present deformations, seams, or gaps affecting swan shapes; therefore, the shape filter rejects the objects (Figure 7H).
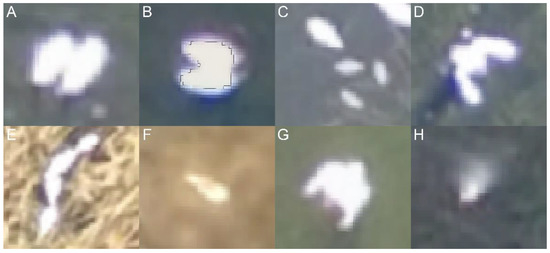
Figure 7.
False-negative objects. Causes of unrecognized black-necked swans. (A) Two black-necked swans close together (lost both), (B) individual proximity (lost one), (C) juvenile or young swans, (D) familiar groups, (E) adult clusters, (F) swans in wetland vegetation, (G) flying swans, and (H) image swan deformations.
In orthophotos classified in category 0, we obtained nearly 6.1% of error in the swan identifications, such as other works in birds and marine mammals [23,24,53,54]. Most automatized recognizers only analyze the identification accuracy concerning manual counts but do not perform a confusion matrix; therefore, they are not evaluating the effectiveness of the recognizers [19,23,55,56]. Moreover, in most cases, the studies complete the recognizer with raw data without error classification omitting availability, perception, misidentification, and double counting [18,55,57,58,59]. By incorporating the description of the types of error and their quantification, we can know the recognizer’s reliability, and we can modify the spectral and shape parameters to increase the accuracy or establish reliability intervals.
We must point out that the brightness directly affects spectral classification and overestimates false-positive objects. In general, when attempting to identify bright or white birds (i.e., black-necked swans), the most difficult elements to remove/discriminate are those related to the color white, such as glitter, flashes, and foam in the water or pale rocks, as they are very similar to the object of interest [24,59]. Other water factors such as waves, sunshine, or water movement generates brightness in the orthophotos failing in the correct object assignation or directly affecting the orthophoto construction by missing image overlapping lost meeting points [24,56]. In our case, we obtained an overestimated black-necked swan abundance directly associated with brightness, causing an increase of false positives and the error in identification by decreasing Accuracy and Sensitivity [56]. A similar problem was described using a thermal camera where the rock heath emission in the forest floor produces false-positive heath points similar to warm blood animals [60,61,62]. We suggest eliminating false positives manually for these cases, mainly if they are concentrated in specific areas of the orthophoto, such as bright spots [24]. We found that brightness is generated mainly at the orthophoto edges, so we recommend increasing the sampling area. An alternative solution is incorporating a polarizer lent to the drone’s camera. In our case, we used an ND8 filter lent (we recommended ND8 or 16). Therefore, using a polarizer or color-correcting lent can help avoid over or under-light exposition and increase the contrast between object and environment. Using these elements permits avoiding the possible errors associated with climate variables and expanding flight schedules.
The flight transects design can influence the correct orthophotos assembly; a wrong orientation of the transect can generate that an animal in movement may be captured in two adjacent photos, which could cause a double count of the same individual (false positives; [59]). A low percentage of overlapping images does not present enough meeting points between adjacent images, generating spaces without data that do not represent the terrain’s reality or the appearance of shadows and shadows within the surface [24]. The literature recommended that the minimum overlap percentage to reconstruct any surface is 60% [63]. We used a 75% overlap during the first stage of sampling; later, we increased it to 80% (overlapping percentage suggested when reconstructing water, snow, and clouds, or surfaces with fewer meeting points due to their color or texture, or constant movement) [24]. Drone movements, because of the wind, can also reduce the percentage of overlap between images. In some cases, wind can cause a 5 to 37% loss overlap when using 57% of overlapping [64]. In extreme cases, the wing instability produces the loss of the nadir position (the perpendicular line between the camera and the surface), causing inconsistencies between the objects’ size and shape [24,64].
We observed an increase in these errors during the breeding and rearing season. First, adults are closer together, especially breeding pairs or familiar groups. Second, black-necked swans build nests on the reed beds, and incubation is exclusively for females while males guard the nest [35]. During this period, individuals spend most of their time on the wetland vegetation, hindering automatic recognition. To avoid these complications, we recommend a post-manual inspection, or as has been suggested, an increase of temporal replications or complement the automatic counting with direct observations [59]. Another option to increase the accuracy of this procedure is to build a specific recognizer for aggregations. For example, in the grey seal (Halichoerus grypus), where the aggregations are of six or more individuals, Convex Envelopes over the polygons were made to discriminate between individuals and aggregations, where depending on the size of the aggregation, the number of individuals was determined [31]. In other cases, authors have used the number of pixels as a size approximation to discriminate between bird aggregations [28].
Aerial drone sampling is a more effective alternative to traditional sampling when monitoring birds, especially waterfowl, obtaining more accurate counts than those made by direct counts [22,58]. Drones have been used to quantify birds’ abundance under-sensitive to observer-generated disturbances, birds concentrated in small areas (colonies or flocks), birds inhabiting open habitats, and birds that contrast strongly with the background and other image elements [24,65,66]. Our work established an automatized protocol, increasing object detection accuracy and reducing the time spent on image processing. We calculated effectiveness indices using the automatized procedures, recorded the different types of errors, and improved image analysis. Although we optimized the recognizer for the black-necked swan’s classification, the steps we described are a procedure that can be generalized. It can be applied to any object recognized (animals, plants, mobile or stationary objects). For example, we applied the same protocol to estimate the abundance of red-gartered coot (Fulica armillata). In this case, the birds’ black general coloration does not permit the implementation of an efficient spectral signal filter. To solve this problem, we use a negative photographic technique to obtain a similar white spectral signature to the black-necked swans. Therefore, we increased the spectral signature resolution by modifying the orthophoto’s original coloration spectral to achieve the best environmental/object contrast.
Automated recognizers are essential to establish long-term animal monitoring aerial surveys. We propose the following steps (i) building an orthomosaic image to construct efficient automated recognizers. (ii) spectral signal definition, if necessary, modify the original image coloration to obtain the best environmental/object contrast, (iii) establish an Object-oriented classification based on shape, (iv) perform a Confusion analysis to estimate the accuracy (and the improvement possibility) of the recognizer, and (v) manual supervision to estimate the number of missing objects.
5. Conclusions
The use of drones and the construction of orthomosaic images in wildlife monitoring is a tool that generates multiple benefits following the recommendations mentioned above. This tool reduces sampling times and allows monitoring of remote and large areas such as wetlands. In addition, by standardizing the sampling area, estimating effectiveness indices, and recording the different types of errors, it is possible to use the counts as an approximation to the abundance and density, making aerial surveys with automatic recognizers one of the most efficient tools for long-term monitoring of waterbirds. The incorporation of automatic recognizers allows the identification of waterbirds to be highly effective, as demonstrated in our results for the dull images (Precision, Sensitivity, Specificity, and Accuracy were higher than 0.93).
Supplementary Materials
The following supporting information can be downloaded at: https://www.mdpi.com/article/10.3390/drones7020071/s1. Figure S1: Pixel value distribution of 100 swans; SM2: R-code for Automatic Recognition of Black-necked Swans (Cygnus melancoryphus) from Orthophotographs.
Author Contributions
Conceptualization, M.J.-T. and M.S.-G.; writing, M.J.-T., M.S.-G., and C.P.S.; data curation, M.J.-T.; formal analysis, M.J.-T., C.R., S.A.E., and M.S.-G.; and founding acquisition, M.S.-G. All authors have read and agreed to the published version of the manuscript.
Funding
This research was partially funded by the Dirección de Investigación, Vicerrectoría de Investigación y Creación Artística, Universidad Austral de Chile: S/N, and Programa Austral-Patagonia, Universidad Austral de Chile: PROAP/46013916. C.R and S.E receive receives funding: ANID PIA/BASAL FB0002. M.J.-T was supported by ANID-Subdirección de Capital Humano/Doctorado Nacional/2022-21221530.
Data Availability Statement
Not applicable.
Conflicts of Interest
The authors declare no conflict of interest.
References
- Siddig, A.; Ellison, A.; Ochs, A.; Villar-Leeman, C.; Lau, M. How do ecologists select and use indicator species to monitor ecological change? Insights from 14 years of publication in Ecological Indicators. Ecol. Indic. 2016, 60, 223–230. [Google Scholar] [CrossRef]
- Young, J.; Murray, K.; Strindberg, S.; Buuveibaatar, B.; Berger, J. Population estimates of endangered mongolian saiga Saiga tatarica mongolica: Implication for effective monitoring and population recovert. Oryx 2010, 44, 285–292. [Google Scholar] [CrossRef]
- Collen, B.; McRae, L.; Deinet, S.; De Palma, A.; Carranza, T.; Cooper, N.; Loh, J.; Baillie, J. Predicting how populations decline to extinction. Phil. Trans. Royal. Soc. Lond. B 2011, 366, 2577–2586. [Google Scholar] [CrossRef]
- Hollings, T.; Burgman, M.; van Andel, M.; Gilbert, M.; Robinson, T.; Robinson, A. How do you find the green sheep? A critical review of the use of remotely sensed imagery to detect and count animals. Methods Ecol. Evol. 2018, 9, 881–892. [Google Scholar] [CrossRef]
- González, L.; Montes, G.; Puig, E.; Johnson, S.; Mengersen, K.; Gaston, K. Unmanned aerial vehicles (UAVs) and artificial intelligence revolutionizing wildlife monitoring and conservation. Sensors 2016, 16, 97. [Google Scholar] [CrossRef] [PubMed]
- Kerr, J.; Ostrovsky, M. From space to species: Ecological applications for remote sensing. Trends Ecol. Evol. 2013, 18, 299–305. [Google Scholar] [CrossRef]
- Rose, R.; Byler, D.; Eastman, J.; Fleishman, E.; Geller, G.; Goetz, S.; Guild, L.; Hamiltom, H.; Hansen, M.; Headley, R.; et al. Ten ways remote sensing can contribute to conservation. Conserv. Biol. 2015, 29, 350–359. [Google Scholar] [CrossRef]
- Wang, K.; Franklin, S.E.; Guo, X.; Cattet, M. Remote sensing of ecology, biodiversity and conservation: A review from the perspective of remote sensing specialists. Sensors 2010, 10, 9647–9667. [Google Scholar] [CrossRef]
- Turner, W.; Spector, S.; Gardiner, E.; Flandeland, M.; Sterling, E.; Steininger, M. Remote sensing for biodiversity science and conservation. Trends Ecol. Evol. 2003, 18, 306–314. [Google Scholar] [CrossRef]
- Hildmann, H.; Kovacs, E. Using unmanned aerial vehicles (UAVs) as mobile sensing platforms (MSPs) for disaster response, civil security and public safety. Drones 2019, 3, 59. [Google Scholar] [CrossRef]
- Yao, H.; Qin, R.; Chen, X. Unmanned aerial vehicle for remote sensing applications—A review. Remote Sens. 2019, 11, 1443. [Google Scholar] [CrossRef]
- Christie, K.; Gilbert, S.; Brown, C.; Hatfield, M.; Hanson, L. Unmanned aircraft systems in wildlife research: Current and future applications of a transformative technology. Front. Ecol. Environ. 2016, 14, 241–251. [Google Scholar] [CrossRef]
- Abd-Elrahman, A.; Pearlstine, L.; Percival, H. Development of pattern recognition algorithm for automatic bird detection from unmanned aerial vehicle imagery. Surv. Land Inf. Sci. 2005, 65, 37–45. [Google Scholar]
- Morgan, J.; Gergel, S.; Coops, N. Aerial photography: A rapidly evolving tool for ecological management. BioScience 2010, 60, 47–59. [Google Scholar] [CrossRef]
- Ambrosia, V.; Wegener, S.; Zajkowski, T.; Sullivan, D.; Buechel, S.; Enomoto, F.; Lobitz, B.; Johan, S.; Brass, J.; Hinkley, E. The Ikhana unmanned airborne system (UAS) western states fire imaging missions: From concept to reality (2006–2010). Geocarto Int. 2011, 26, 85–101. [Google Scholar] [CrossRef]
- Watts, A.; Ambrosia, V.; Hinkley, E. Unmanned aircraft systems in remote sensing and scientific research: Classification and considerations of use. Remote Sens. 2012, 4, 1671–1692. [Google Scholar] [CrossRef]
- Anderson, K.; Gaston, K. Lightweight unmanned aerial vehicles will revolutionize spatial ecology. Front. Ecol. Environ. 2013, 11, 138–146. [Google Scholar] [CrossRef]
- Chabot, D.; Bird, D. Wildlife research and management methods in the 21st century: Where do unmanned aircraft fit in? J. Unmanned Veh. Syst. 2015, 3, 137–155. [Google Scholar] [CrossRef]
- Linchant, J.; Lisein, J.; Semeki, J.; Lejeune, P.; Vermeulen, C. Are unmanned aircraft systems (UASs) the future of wildlife monitoring? A review of accomplishments and challenges. Mamm Rev. 2015, 45, 239–252. [Google Scholar] [CrossRef]
- Duffy, P.; Anderson, K.; Shapiro, A.; Spina Avino, F.; DeBell, L.; Glover-Kapfer, P. Conservation Technology: Drones for Conservation; Conservation Technology Series; 2020; Volume 1, Available online: https://storymaps.arcgis.com/stories/bdbaf9d33e48437bab074354659159e3 (accessed on 1 January 2023).
- van Gemert, J.; Verschoor, C.; Mettes, P.; Epema, K.; Koh, L.; Wich, S. Nature conservation drones for automatic localization and counting of animals. Lect. Notes Comput. Sci. 2015, 8925, 255–270. [Google Scholar]
- Hodgson, J.; Mott, R.; Baylis, S.; Pham, T.; Wotherspoon, S.; Kilpatrick, A.; Raja, R.; Reid, I.; Terauds, A.; Koh, L. Drones count wildlife more accurately and precisely than humans. Methods Ecol. Evol. 2018, 9, 1160–1167. [Google Scholar] [CrossRef]
- Lhoest, S.; Linchant, J.; Quevauvillers, S.; Vermeulen, C.; Lejeune, P. How many hippos (HOMHIP): Algorithm for automatic counts of animals with infra-red thermal imagery from UAV. Int. Arch. Photogramm. Remote Sens. Spat. Inf. Sci.-ISPRS Arch 2015, XL-3/W3, 355–362. [Google Scholar] [CrossRef]
- Chabot, D.; Francis, C. Computer-automated bird detection and counts in high-resolution aerial images: A review. J. Field Ornithol. 2016, 87, 343–359. [Google Scholar] [CrossRef]
- Chen, Y.; Shioi, H.; Fuentes Montesinos, C.; Koh, L.; Wich, S.; Krause, A. Active Detection via Adaptive Submodularity. In Proceedings of the 31st International Conference on Machine Learning, Beijing China, 21–26 June 2014; pp. 55–63. [Google Scholar]
- Chabot, D. Systematic Evaluation of a Stock Unmanned Aerial Vehicle (UAV) System for Small-Scale Wildlife Survey Applications. Master’s Thesis, McGill University, Montreal, QC, Canada, July 2009. [Google Scholar]
- Laliberte, A.; Rango, A. Texture and Scale in Object-Based Analysis of Subdecimeter Resolution Unmanned Aerial Vehicle (UAV) Imagery. IEEE Trans. Geosci. Remote Sens. 2009, 47, 761–770. [Google Scholar] [CrossRef]
- Laliberte, A.; Ripple, W. Automated Wildlife Counts from Remotely Sensed Imagery. Wildl. Soc. Bull. 2003, 31, 362–371. [Google Scholar]
- Longmore, S.; Collins, R.; Pfeifer, S.; Fox, S.; Mulero-Pazmany, M.; Bezombes, F.; Goodwin, A.; De Juan Ovelar, M.; Knapen, J.; Wich, S. Adapting astronomical source detection software to help detect animals in thermal images obtained by unmanned aerial systems. Int. J. Remote Sens. 2017, 38, 2623–2638. [Google Scholar] [CrossRef]
- Jiménez, J.; Mulero-Pázmány, M. Drones for conservation in protected areas: Present and future. Drones 2019, 3, 10. [Google Scholar] [CrossRef]
- Seymour, A.; Dale, M.; Hammill, P.; Halpin Johnston, D. Automated detection and enumeration of marine wildlife using unmanned aircraft systems (UAS) and thermal imagery. Sci. Rep. 2017, 7, 1–10. [Google Scholar] [CrossRef]
- Schlatter, R.; Salazar, J.; Villa, A.; Meza, J. Demography of Black-necked swans Cygnus melancoryphus in three Chilean wetland areas. Wildfowl. 1991, 1, 88–94. [Google Scholar]
- BirdLife International. Cygnus melancoryphus. IUCN Red List. Threat. Species 2016, e.T22679846A92832118. [Google Scholar] [CrossRef]
- Corti, P.; Schlatter, P. Feeding Ecology of the Black necked Swan Cygnus melancoryphus in Two Wetlands of Southern Chile. Stud. Neotrop. Fauna Environ. 2002, 37, 9–14. [Google Scholar] [CrossRef]
- Silva, C.; Schlatter, R.; Soto-Gamboa, M. Reproductive biology and pair behavior during incubation of the black-necked swan (Cygnus melanocoryphus). Ornitol. Neotrop. 2012, 23, 555–567. [Google Scholar]
- Salazar, J. Censo poblacional del Cisne de cuello negro (Cygnus melancoryphus) en Valdivia. 3er Simposio de Vida Silvestre. Medio Ambiente 1998, 9, 78–87. [Google Scholar]
- Schlatter, R. Distribución del cisne de cuello negro en Chile y su dependencia de hábitats acuáticos de la Cordillera de la Costa. In En Historia, Biodiversidad y Ecología de Los Bosques Costeros de Chile, 1st ed.; Smith-Ramírez, C., Armesto, J.J., Valdovinos, C., Eds.; Editorial Universitaria: Santiago, Chile, 2005; pp. 498–504. [Google Scholar]
- Vas, E.; Lescroël, A.; Duriez, O.; Boguszewski, G.; Grémillet, D. Approaching birds with drones: First experiments and ethical guidelines. Biol. Lett. 2015, 11, 20140754. [Google Scholar] [CrossRef] [PubMed]
- Barr, J.; Green, M.; DeMaso, S.; Hardy, T. Drone Surveys Do Not Increase Colony-wide Flight Behaviour at Waterbird Nesting Sites, But Sensitivity Varies Among Species. Sci. Rep. 2020, 10, 3781. [Google Scholar] [CrossRef]
- Polsby, D.; Popper, R. The third criterion: Compactness as a procedural safeguard against partisan gerrymandering. Yale Law Policy Rev. 1991, 9, 301–353. [Google Scholar] [CrossRef]
- Quantum GIS Development Team. Quantum GIS Geographic Information System. Open Source Geospatial Foundation Proyect. 2017. Available online: http://qgis.osgeo.org (accessed on 10 October 2022).
- R Core Team. R: A Language and Environment for Statistical Computing; R Foundation for Statistical Computing: Vienna, Austria, 2017. [Google Scholar]
- Hijmans, R. Raster: Geographic Data Analysis and Modeling, R Package Version 2.5-8. 2016. Available online: https://www.scirp.org/(S(lz5mqp453edsnp55rrgjct55))/reference/ReferencesPapers.aspx?ReferenceID=1892855 (accessed on 1 January 2023).
- Bivand, R.; Keitt, T.; Barry, R. Rgdal: Bindings for the Geospatial Data Abstraction Library, R Package Version 1.2-8. 2017. Available online: https://rdrr.io/cran/rgdal/ (accessed on 1 January 2023).
- Hijmans, R. Geosphere: Spherical Trigonometry, R Package Version 1.5-5. 2016. Available online: https://rdrr.io/cran/geosphere/ (accessed on 1 January 2023).
- Baddeley, A.; Turner, R. Spatstat: An R Package for Analyzing Spatial Point Patterns. J. Stat. Softw. 2005, 12, 1–42. [Google Scholar] [CrossRef]
- Bivand, R.; Lewin-Koh, N. Maptools: Tools for Reading and Handling Spatial Objects, R package Version 0.9-2. 2017. Available online: https://cran.r-project.org/web/packages/maptools/index.html (accessed on 1 January 2023).
- Greenberg, J.; Mattiuzzi, M. GdalUtils: Wrappers for the Geospatial Data Abstraction Library (GDAL) Utilities, R Package Version 2.0.1.7. 2015. Available online: https://www.rdocumentation.org/packages/gdalUtils/versions/2.0.1.7 (accessed on 1 January 2023).
- Bivand, R.; Rundel, C. Rgeos: Interface to Geometry Engine—Open Source (GEOS), R Package Version 0.3-23. 2017. Available online: https://cran.r-project.org/web/packages/rgeos/index.html (accessed on 1 January 2023).
- Evans, J. SpatialEco, R Package Version 0.0.1-7. 2017. Available online: https://cran.r-project.org/package=spatialEco (accessed on 1 January 2023).
- Bengtsson, H.R. R.utils: Various Programming Utilities. R Package Version 2.5.0. 2016. Available online: https://cran.r-project.org/web/packages/R.utils/index.html (accessed on 1 January 2023).
- Ruuska, S.; Hämäläinen, W.; Kajava, S.; Mughal, M.; Matilainen, P.; Mononen, J. Evaluation of the confusion matrix method in the validation of an automated system for measuring feeding behaviour of cattle. Behav. Process. 2018, 148, 56–62. [Google Scholar] [CrossRef]
- Aniceto, A.; Biuw, M.; Lindstrøm, U.; Solbø, S.A.; Broms, F.; Carroll, J. Monitoring marine mammals using unmanned aerial vehicles: Quantifying detection certainty. Ecosphere 2018, 9, e02122. [Google Scholar] [CrossRef]
- Corcoran, E.; Winsen, M.; Sudholz, A.; Hamilton, G. Automated detection of wildlife using drones: Synthesis, opportunities and constraints. Methods Ecol. Evol. 2021, 12, 1103–1114. [Google Scholar] [CrossRef]
- Chabot, D.; Craik, S.; Bird, D. Population census of a large common tern colony with a small unmanned aircraft. PLoS ONE 2015, 10, e0122588. [Google Scholar] [CrossRef]
- Mader, S.; Grenzdörffer, G. Automatic Sea bird detection from high resolution aerial imagery. Int. Arch. Photogramm. Remote Sens. Spatial Inf. Sci. 2016, 41, 299–303. [Google Scholar] [CrossRef]
- Goebel, M.; Perryman, W.; Hinke, J.; Krause, D.; Hann, N.; Gardner, S.; LeRoi, D. A small unmanned aerial system for estimating abundance and size of Antarctic predators. Polar Biol. 2015, 38, 619–630. [Google Scholar] [CrossRef]
- Hodgson, J.; Baylis, S.; Mott, R.; Herrod, A.; Clarke, R.H. Precision wildlife monitoring using unmanned aerial vehicles. Sci. Rep. 2016, 6, 22574. [Google Scholar] [CrossRef] [PubMed]
- Brack, I.; Kindel, A.; Oliveira, L. Detection errors in wildlife abundance estimates from Unmanned Aerial Systems (UAS) surveys: Synthesis, solutions, and challenges. Methods Ecol. Evol. 2018, 9, 1864–1873. [Google Scholar] [CrossRef]
- Garner, D.; Underwood, H.; Porter, W. Use of modern infrared thermography for wildlife population surveys. Environ. Manag. 1995, 19, 233–238. [Google Scholar] [CrossRef]
- Franke, U.; Goll, B.; Hohmann, U.; Heurich, M. Aerial ungulate surveys with a combination of infrared and high–resolution natural colour images. Anim. Biodivers. Conserv. 2012, 35, 285–293. [Google Scholar] [CrossRef]
- Chrétien, L.; Théau, J.; Ménard, P. Visible and thermal infrared remote sensing for the detection of white-tailed deer using an unmanned aerial system. Wildl. Soc. Bull. 2016, 40, 181–191. [Google Scholar] [CrossRef]
- Flores-de-Santiago, F.; Valderrama-Landeros, L.; Rodríguez-Sobreyra, R.; Flores-Verdugo, F. Assessing the effect of flight altitude and overlap on orthoimage generation for UAV estimates of coastal wetlands. J. Coast. Conserv. 2020, 24, 35. [Google Scholar] [CrossRef]
- Chrétien, L.; Théau, J.; Ménard, P. Wildlife multispecies remote sensing using visible and thermal infrared imagery acquired from an unmanned aerial vehicle (UAV). Int. Arch. Photogramm. Remote Sens. Spat. Inf. Sci.-ISPRS Arch. 2015. [Google Scholar] [CrossRef]
- Valle, R.; Scarton, F. Drones improve effectiveness and reduce disturbance of censusing Common Redshanks Tringa totanus breeding on salt marshes. Ardea 2020, 107, 275–282. [Google Scholar] [CrossRef]
- Baums, J. Convert Raster Data to a ESRI Polygon Shapefile and (Optionally) a SpatialPolygonsDataFrame GitHub. Available online: https://gist.github.com/johnbaums/26e8091f082f2b3dd279 (accessed on 19 December 2022).
Disclaimer/Publisher’s Note: The statements, opinions and data contained in all publications are solely those of the individual author(s) and contributor(s) and not of MDPI and/or the editor(s). MDPI and/or the editor(s) disclaim responsibility for any injury to people or property resulting from any ideas, methods, instructions or products referred to in the content. |
© 2023 by the authors. Licensee MDPI, Basel, Switzerland. This article is an open access article distributed under the terms and conditions of the Creative Commons Attribution (CC BY) license (https://creativecommons.org/licenses/by/4.0/).