Article

Using Drones with Thermal Imaging to Estimate Population Counts of European Hare (Lepus europaeus) in Denmark

1
Department of Chemistry and Bioscience, Aalborg University, 9220 Aalborg, Denmark
2
National Institute of Aquatic Resources, Technical University of Denmark, 2800 Kongens Lyngby, Denmark
3
Department of Energy, Aalborg University Esbjerg, 6700 Esbjerg, Denmark
4
Aalborg Zoo, 9000 Aalborg, Denmark
*
Author to whom correspondence should be addressed.
These authors contributed equally to this work.
Submission received: 19 October 2022 / Revised: 8 December 2022 / Accepted: 18 December 2022 / Published: 21 December 2022

Abstract

:
Drones equipped with thermal cameras have recently become readily available, broadening the possibilities for monitoring wildlife. The European hare (Lepus europaeus) is a nocturnal mammal that is closely monitored in Denmark due to populations declining since the mid-1900s. The limitations of current population-assessment methods, such as, spotlight counts and hunting game statistics, could be overcome by relying on drone surveys with thermal imaging for population counts. The aim of this study was to investigate the use of a DJI Mavic 2 Enterprise Advanced drone with thermal imaging as a tool for monitoring the Danish hare population. Multiple test flights were conducted over agricultural areas in Denmark in spring 2022, testing various flight altitudes, camera settings, and recording methods. The test flights were used to suggest a method for identifying and counting hares. The applied use of this methodology was then evaluated through a case survey that had the aim of identifying and counting hares over an agricultural area of 242 ha. Hares could be detected with thermal imaging at flight altitudes up to 80 m, and it was possible to fly as low as 40 m without observing direct behaviorial changes. Thermal images taken at these altitudes also provided enough detail to differentiate between species, and animal body size proved to be a good species indicator. The case study supported the use of thermal imaging-based drone surveys to identify hares and conduct population counts, thus indicating the suggested methodology as a viable alternative to traditional counting methods.

1. Introduction

Quantitative information on wildlife populations is necessary for understanding relations between species and their habitat requirements, thereby providing information essential for nature management and conservation. To conduct wildlife population counts, traditional field surveys have been widely used in the past. Traditional population monitoring includes direct methods, such as field observations of animals on foot or from a manned aircraft, images from fixed onsite locations captured by using camera traps, fecal density counts, and sampling with mark-recapture methods, and indirect monitoring methods, e.g., yearly hunting harvest statistics [1,2,3,4,5,6,7,8]. However, over the past decade the use of drones (unmanned aerial vehicles) has emerged as a precise and noninvasive method for surveying wildlife populations [9,10,11,12,13,14,15]. Drones may be used in environments that are difficult to monitor by traditional methods [11,16]. Even in areas that are easily accessible, drone surveying has in many cases been proven to provide accurate population estimates [9,11,12,14,16,17]. Moreover, drones often reduce time and labor expended on ground surveys and are a cheaper alternative to manned aerial surveys [18].
Drones equipped with thermal cameras have recently become readily available [19]. This development has furthered the use of drones in wildlife research, broadening the possibilities of drone surveys. Thermal imaging relies on animals’ body heat; that is, an animal will appear as a bright object at thermal infrared wavelengths if the surface temperature of an animal is warmer than the surface of its surroundings. This makes drone surveys with thermal imaging ideal for monitoring nocturnal and crepuscular species (e.g., kangaroos (Macropodinae spp.) [20,21] and deer (Cervidae spp.) [18,22,23]), along with forest-dwelling species (e.g., koalas (Phascolarctos cinereus) [24] and macaques (Macaca spp.) [22]), and species camouflaged by their cryptic fur or plumage [25].
The European hare (Lepus europaeus) is a nocturnal species with a cryptic fur, making them difficult to detect. The European hare has been a species of interest in many European countries since the mid-1900s, when populations began declining all over Europe [26,27,28]. Moreover, hare are considered a valued game species in Denmark and other countries [26,29]. The status of the European hare is classified as a matter of least concern in Europe, despite populations continuing to decline [28,30]. Population declines have been linked to the intensification of agricultural practices, e.g., increased use of herbicides and homogeneous crop choices [26,31,32]. The Danish population declined more than 30% in the early 2000s, leading to the European hare being included on the Danish Red List as a vulnerable species in 2007 [28]. However, throughout the past decade this decline has been reduced to 10% and the European hare was reclassified as a least concern in 2019 [33]. A national management plan was created in 2013, which has resulted in a steady development in the Danish hare population [34,35]. These results are based on annual hunting game statistics and local population counts conducted by volunteers annually in the spring and fall.
Local population counts are completed with the spotlight method, where counts are performed 1–2 h after sunset [36]. Spotlight counts are conducted from a car moving approximately 10– 25 km/h along a transect line. Handheld spotlights are then used to illuminate 150 m to each side of the transect route. Observers detect hare based on their silhouette and the light reflection from the hare’s eyes [36]. The quantity of reflected light that is returned to the observer’s eye decreases with distance; e.g., if the distance between the hare and observer is doubled, the amount of light returned is reduced by 94% [32]. Counts are conducted by volunteers without any formal training; thus, results are likely biased based on observer experience and hare distance [37]. The spotlight method assumes that the population distribution in the illuminated area is representative of the distribution of the entire population. However, hares have been found to have an irregular spatial distribution [29,32]. Nonetheless, spotlighting is still considered to be the best method for studying large-scale hare population trends with many study areas and volunteers [29]. Hunting game statistics are also used in many countries to provide an overall indication of population trends; however, game bag records may not provide reliable data for counting hares, as they rely on hunting tradition and legislation [4,26,29,38].
The limitations of spotlight counts and hunting game statistics could be overcome by relying on drone surveys with thermal imaging for population counts. However, the use of drone surveys with thermal imaging has yet to be demonstrated for identifying and counting hares. The value of drone surveys is dependent on a number of flight parameters, such as flight altitude and speed. When determining flight altitude and speed, there is a tradeoff between the maximum ground area able to be covered in the available flight time and the minimum resolution required for species identification [11,25,39,40,41]. It is, therefore, necessary to consider the size of the animals of interest and the aim of the survey when determining flight altitude.
Research demonstrating the use of drone surveys with thermal imaging for detecting and monitoring small mammals is limited, with the majority of previous studies focusing on larger mammals, such as, deer (Cervidae spp.), alpaca (Vicugna pacos), and the long-tailed macaque (Macaca fascicularis) [19,22,23,42,43]. Thus, there is a need for studies assessing the use of drones equipped with thermal cameras as a monitoring tool for smaller mammals. Psiroukis et al. [44] recently demonstrated the use of aerial thermal imaging to monitor free-range rabbits, proving that mammals as small as rabbits can be identified and counted by using drone surveys with thermal imaging. This study identified a flight altitude of 25 m as the optimal flight altitude that was low enough to capture images of sufficient resolution without disturbing the rabbits [44]. However, although this study proves the use of aerial thermal imaging for monitoring mammals smaller than hare, the survey areas of the study were only 2 ha each [44]. Wildlife population counts often rely on the surveillance of much larger areas. It is, therefore, important to determine a flight methodology, including the optimal flight altitude suited for covering larger ground areas.
The aim of this study was to investigate the potential use of a drone equipped with a thermal camera as a tool for monitoring the European hare population in Denmark. More specifically, this study tested multiple flight altitudes to find the appropriate flight altitude for identifying European hares. The maximum flight altitude was expected to be dependent on animal size. Furthermore, it was anticipated that animal body size could be used as a general indicator of species. Moreover, flight speed and flight pattern were tested along with camera angle and recording method, to identify the ideal parameters for conducting population surveys with drone-based thermal imaging. Based on the results of these test flights, an appropriate method for identifying and counting hare with drone surveys by using thermal imaging was suggested. The applied use of the suggested methodology was evaluated through a case survey with the aim of identifying and counting hares over agricultural areas with a total area of 242 ha.

2. Methods

Two different sites with agricultural landscapes in Northern Jutland, Denmark, were used to carry out multiple aerial surveys (Figure 1). The first site had an area of 39 ha and was used to carry out test flights between 21 March 2022, and 13 April 2022. The second site had an area of 242 ha and was only used for the case survey that took place on April 20th, 2022. All flights took place before sunrise or after sunset with the ambient temperature ranging from 2.4 ° C to 8.5 ° C. The drone used in this study was the DJI Mavic 2 Enterprise Advanced (M2EA) equipped with low-noise propellers. The M2EA had an integrated dual camera and gimbal system with a 640 × 512 px thermal camera that had a field of view (FOV) of 48 ° × 38 ° . The DJI Pilot App was used to conduct both manual flights and mission flights [45].

2.1. Flight Parameters

To find the optimal method for identifying and counting hares with drone surveys, flight method, flight altitude, and flight speed were tested along with recording method and camera angle. To compare flight methods, both manual and mission flights were conducted, and while manual flights were not well suited for conducting systematic surveys, they were ideal for quickly finding individuals and closing in on them. Manual flights were, therefore, used to test the animals’ response to different flight altitudes. This was done by the drone hovering above an animal at an altitude of 80 m before slowly descending, briefly pausing every 10 m and stopping when the animal reacted to the presence of the drone.
To assess the tradeoff between area covered and species identification, a series of flights were conducted at 40 m, 60 m, or 80 m, covering 35.6 m, 53.4 m, and 71.2 m horizontally, corresponding to 18 px/m, 12 px/m, and 9 px/m. These three flight altitudes were selected based on initial flights, indicating that at flight altitudes greater than 80 m, animal detection becomes challenging and at flight altitudes lower than 40 m animals began reacting to the presence of the drone, thus, altering their behavior, e.g., running away from the drone. Moreover, flights conducted at an altitude of 40 m should ensure well-resolved images for species identification. Burke et al. [46] suggested that the minimum resolution for accurate classification and temperature measurement is approximately 10 pixels. The optimal flight altitude can, therefore, be calculated based on camera specifications and the average size of the animal species in question by using the following equations [46]. First, it is important to know the camera’s angular pixel scale, ρ a , as defined by the camera’s horizontal field of view, θ , and the horizontal resolution of the camera, N p i x e l s :
ρ a = θ N p i x e l s .
It is also necessary to find the desired physical pixel scale, ρ p , i.e., the desired length in meters each pixel should cover. Thus, determining the resolution, based on the length of the animal, l a , and the desired resolution of the animal, n p i x e l :
ρ p = l a n p .
The body length of a European hare is approximately 50– 70 cm [28], i.e., for optimal thermal detection a pixel scale of ρ p =   0.05 m/pixel ( 5 cm per pixel) is required. Body width could also be used instead of body length, depending on which is larger. The optimal flight altitude, h, can then be calculated based on the desired physical pixel scale and the angular pixel scale of the camera:
h = ρ p tan ( ρ a ) .
Therefore, to detect a hare with a body length of 60 cm the maximum flight altitude should be approximately 46 m with a DJI M2EA.

2.2. Case Survey

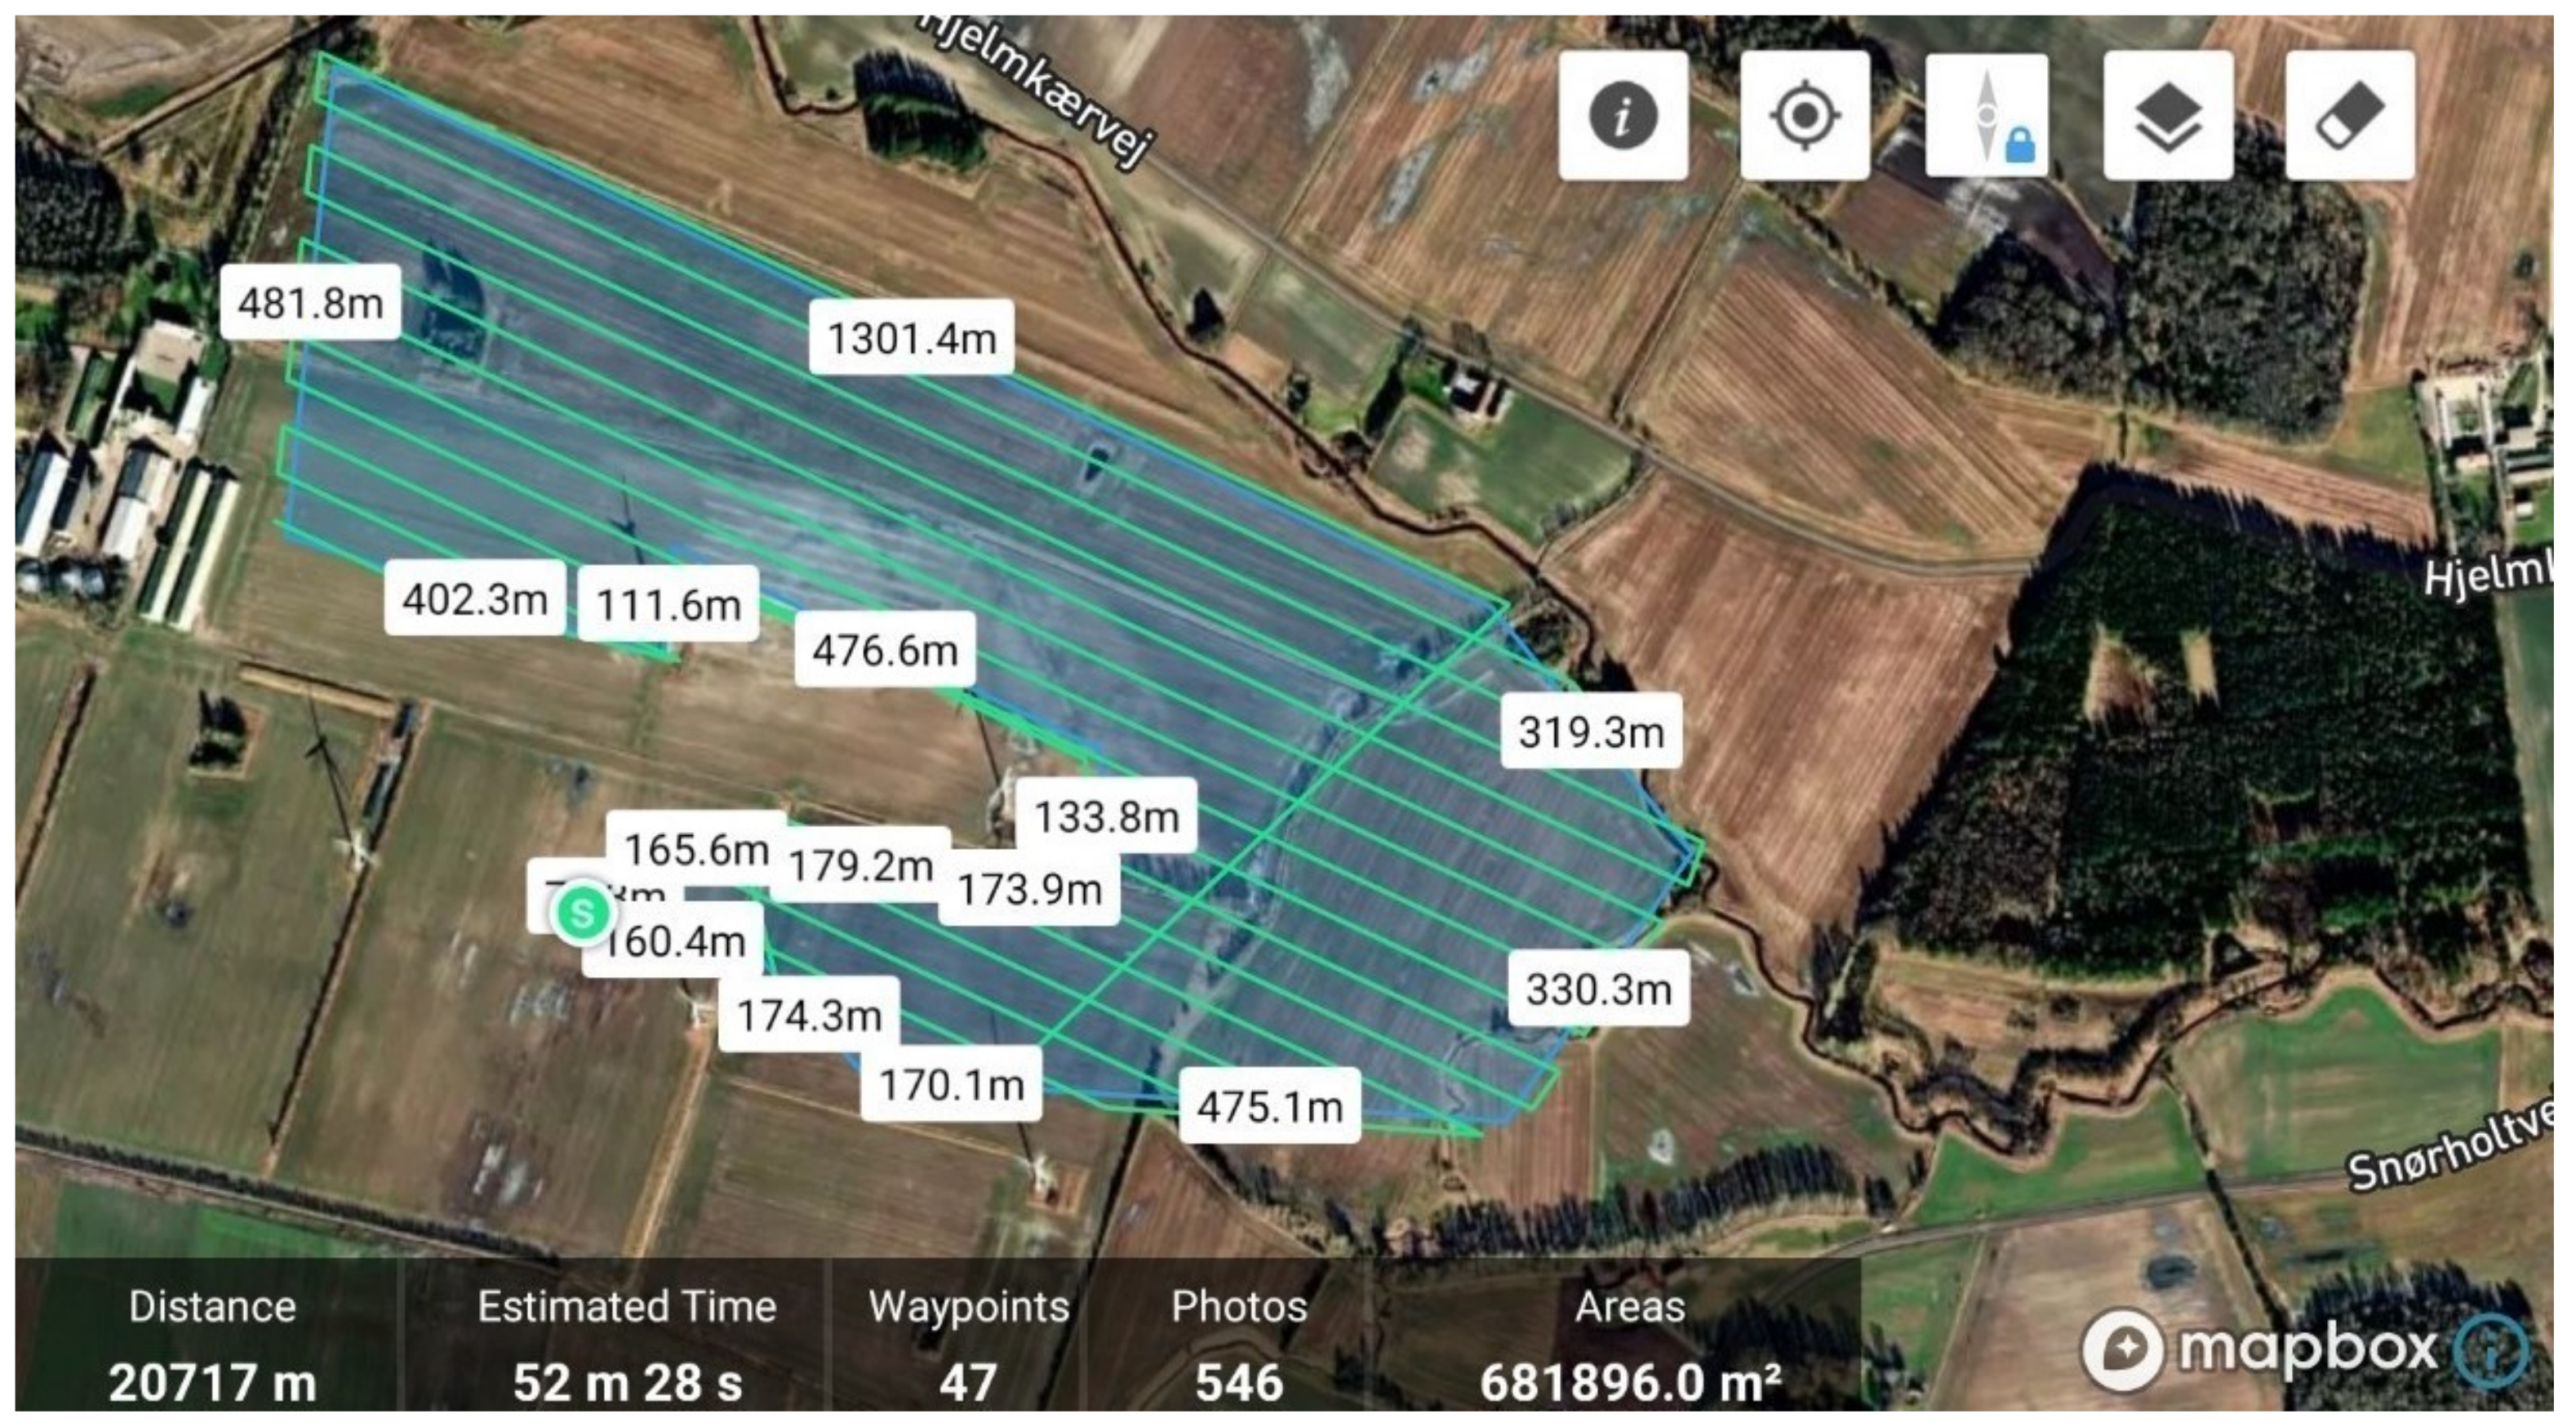
A case survey was conducted with the aim of surveying the hare population over a larger area, where the flight route covered an area of 242 ha. The survey was conducted as a mission flight, meaning that a flight plan was created prior to takeoff, ensuring a systematic coverage of the entire area (Figure 2). This flight method was selected based on previous flights exploring both mission flights and manual flights, where it was determined that mission flights were ideal for conducting systematic population counts. The flight route was created with a 10% side overlap, meaning that neighboring frames from parallel transect lines had a 10% overlap. Moreover, the case flight was conducted at an altitude of 60 m and a speed of 7 m/s based on previous flights comparing flight altitude ( 40 m, 60 m, and 80 m), and flight speed. Previous flights also determined video filming as the preferred recording method compared to taking systematic overlapping pictures throughout the route. The camera was, therefore, set to record in video mode at an angle of 90 ° , i.e., the camera was pointing straight down toward the ground. This angle was selected as it enables the option of mapping the animals’ position later on.

2.3. Data Analysis

2.3.1. Species Classification

Species were primarily classified from images and videos based on the size and shape of their heat signatures. Moreover, when analyzing videos, the animals’ movement style could also contribute to correctly identifying species. The size of each animal was calculated based on its pixels by using Equation 4:
l a = h · tan ( ρ a ) · n p .
A pairwise Mann–Whitney U-test was conducted with R [47] to test if median body size, calculated by using thermal pixel size with Equation 4, was different between animal species.

2.3.2. Mapping Observations

Observations from the case flight were mapped in ArcGIS Pro [48] by using the Full Motion Video (FMV) player [49], which is an Image Analyst extension in ArcGIS Pro. The FMV player requires videos to be combined with their associated metadata into a single, geospatially aware video file [49]. Each video from the case flight was, therefore, combined with its associated metadata file to create FMV-compliant video data by using the Video Multiplexer tool. However, prior to this, the original metadata files had to be converted from SRT files to CSV files, which was done in Python [50]. The FMV player was then used to play the resulting FMV-compliant videos and map animal observations. A new point feature class was created for each animal group, and observations were annotated in the FMV player and added to their respective feature class when they occurred in the video. This method of annotating observations in ArcGIS Pro, ensured that observations in the 10% overlap margin appearing on neighboring frames were only scored as a single observation, thus, minimizing the risk of double counts arising due to the 10% overlap.

3. Results

3.1. Flight Altitude

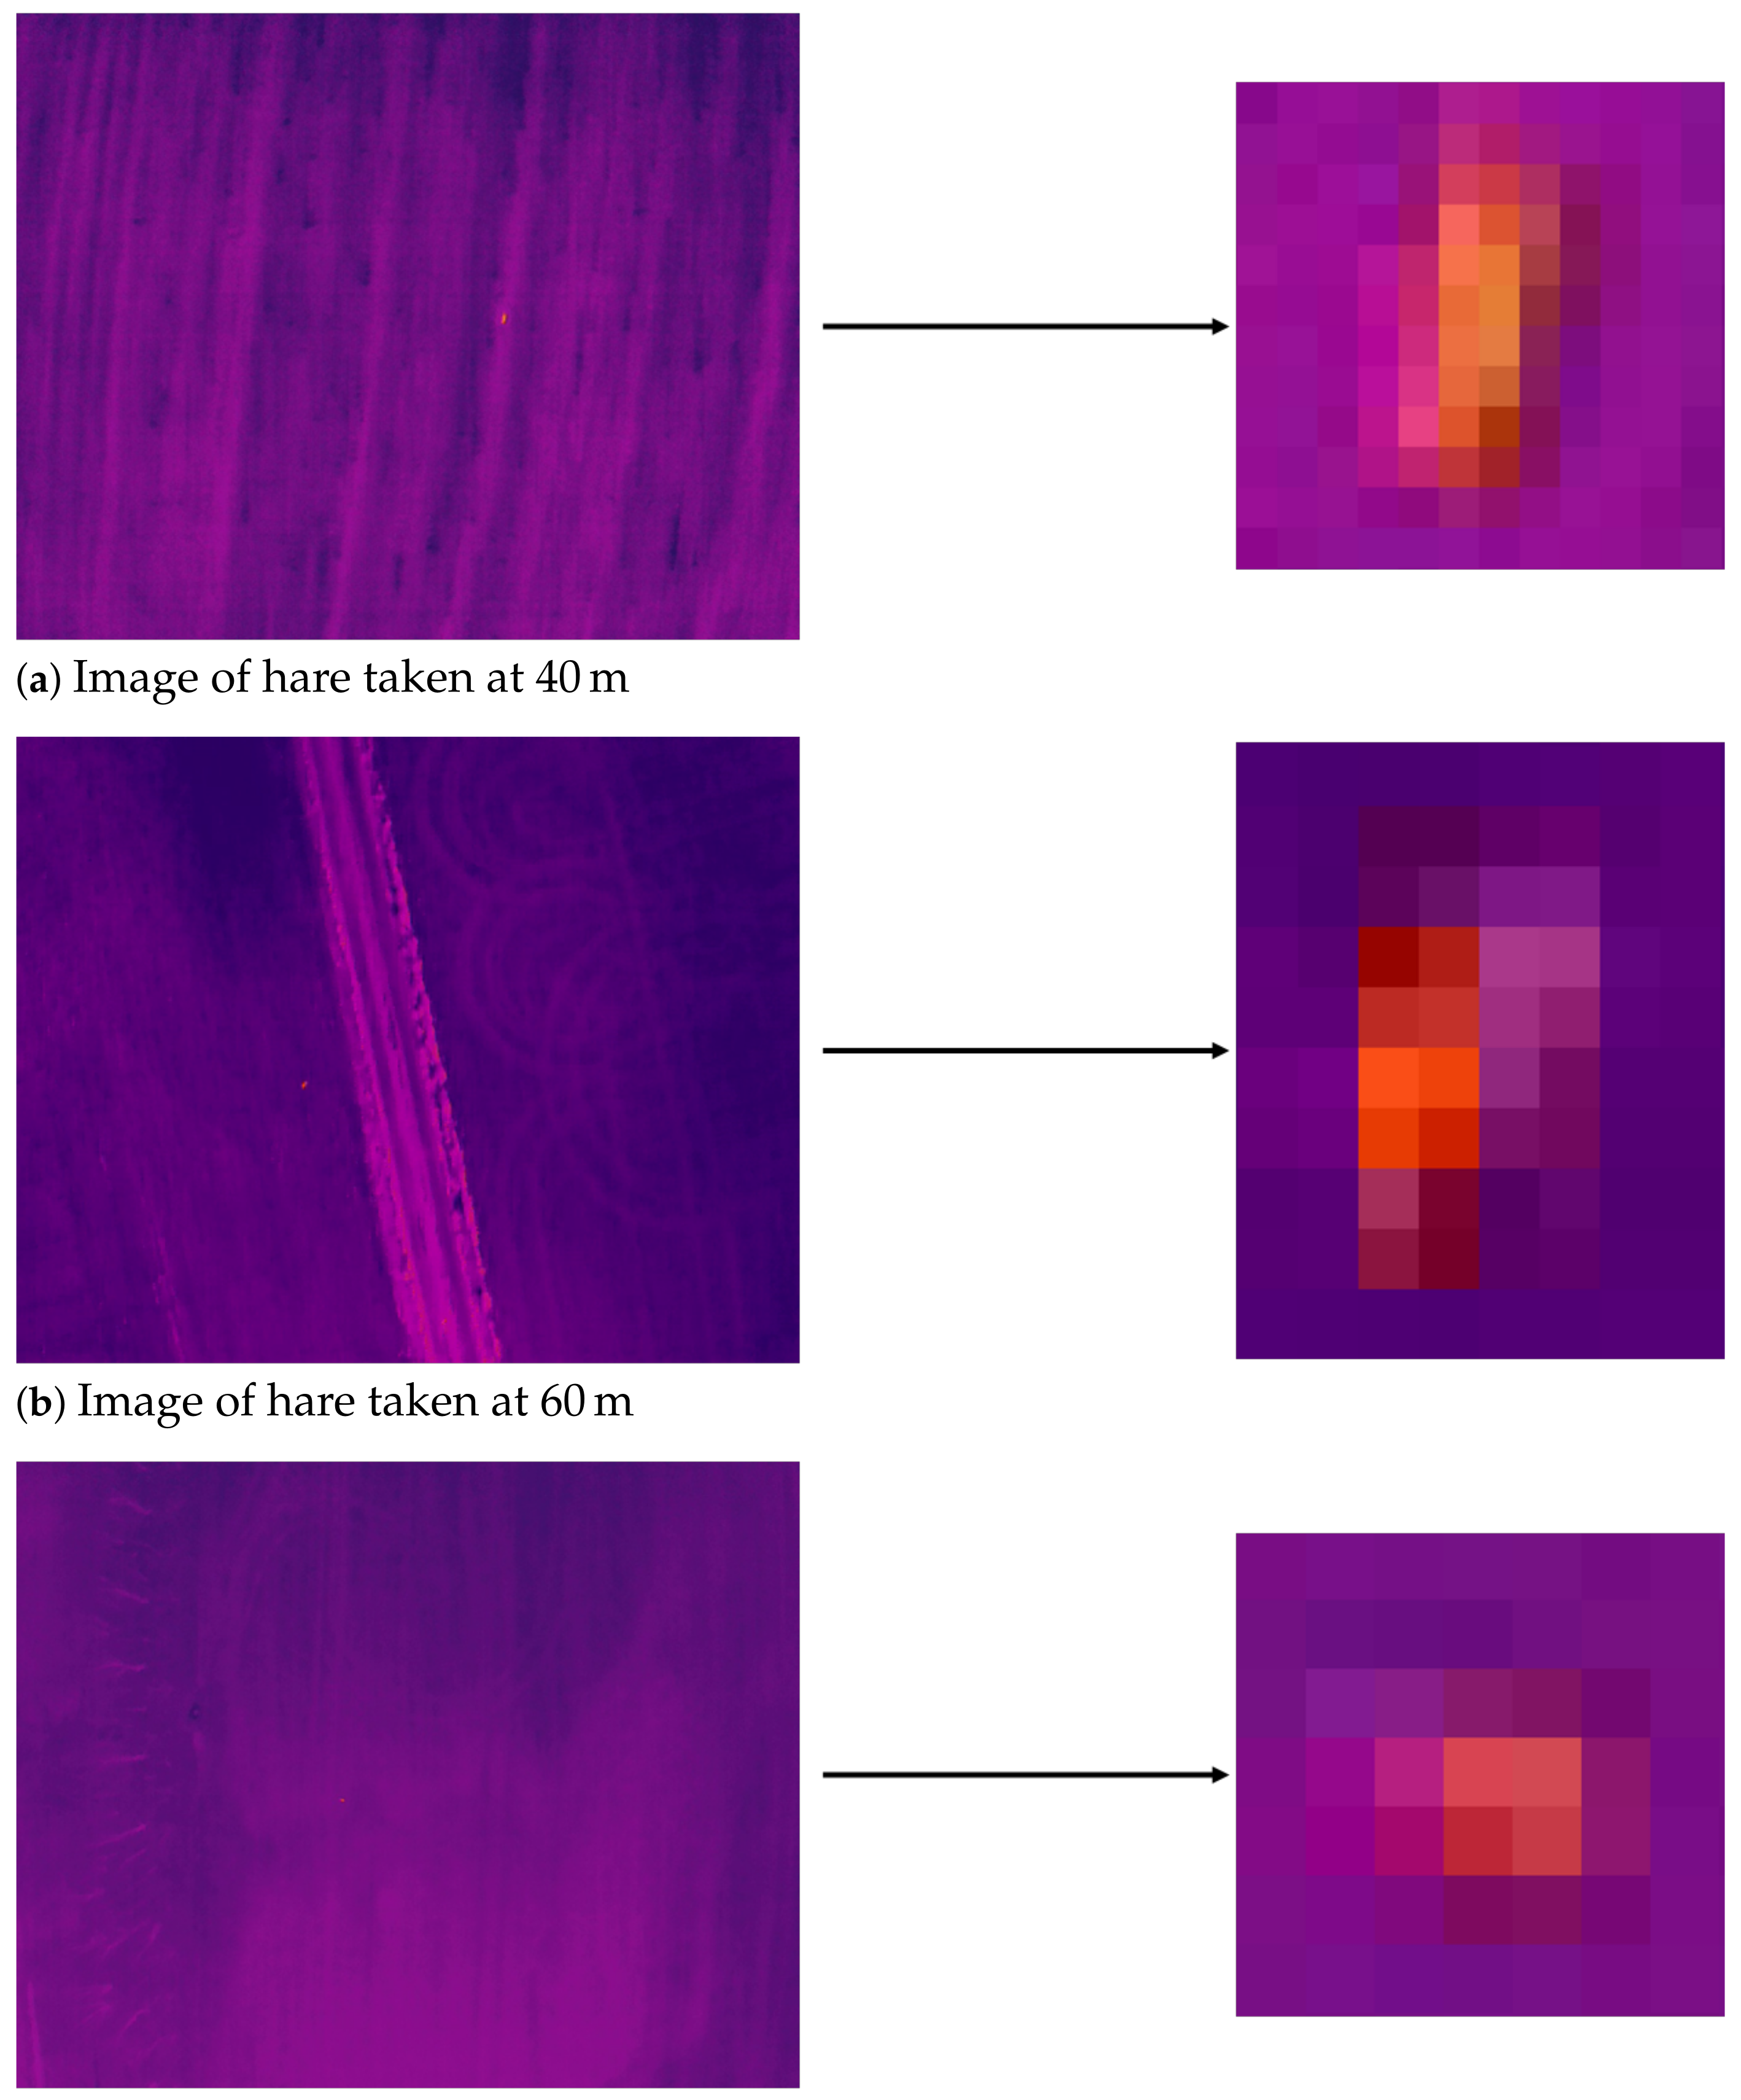
Hares can be identified at flight altitudes up to 80 m (Figure 3). During test flights, animals initially identified as hares were further observed until they moved, where their unique posture during movement was used to confirm the species classification. Moreover, at flight altitudes below 40 m the animals reacted to the drone, moving away from the drone in 90% of the cases.

3.2. Species Classification

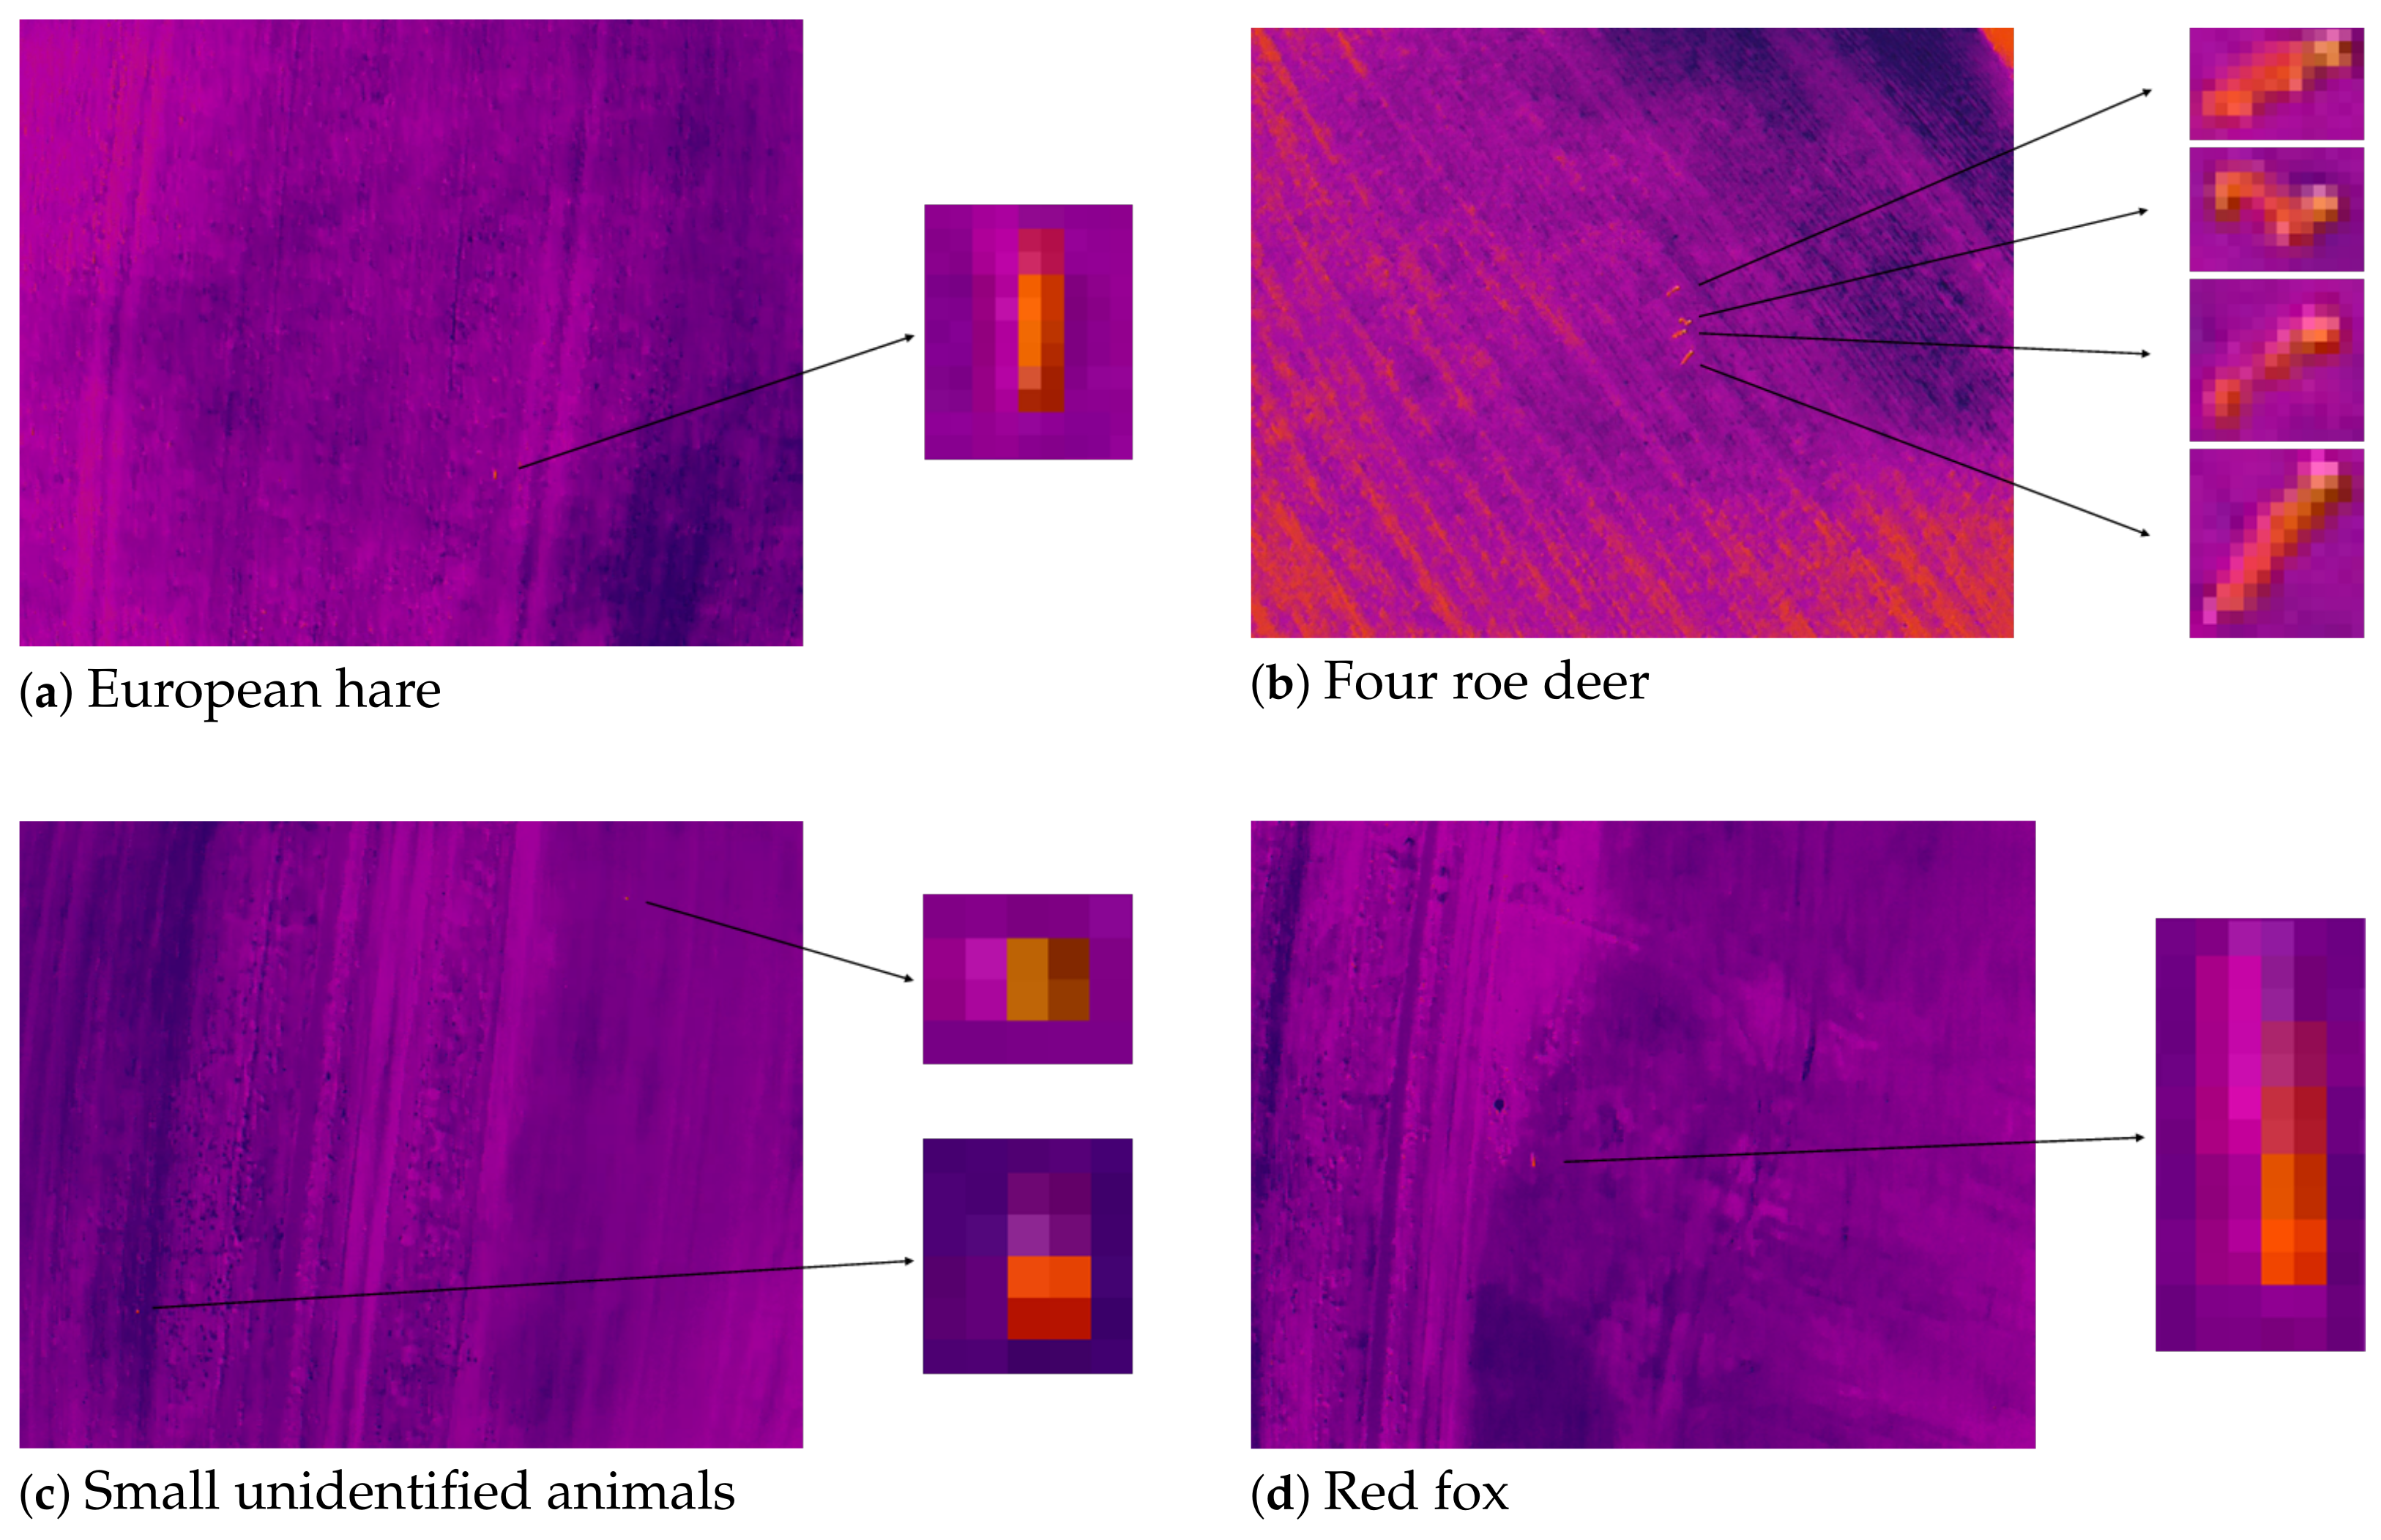
A total of 85 animals were recorded throughout all flights, including the case survey. Of these animals, 35 were classified as hares, 34 as roe deer (Capreolus capreolus), 15 were classified as smaller unidentifiable animals, and a single animal was classified as a red fox (Vulpes vulpes). Animals were mainly classified based on their size; however, the red fox was only possible to classify due to its unique posture during movement (Figure 4).
There was a significant difference between body sizes of different animal species based on their thermal pixel size (Figure 5). The median body length of hares was 0.694 m (IQR = 0.555– 0.833 m), which was significantly smaller ( p < 0.001 ) than the body length of roe deer (median= 1.11 m, I Q R = 0.989– 1.25 m) and significantly larger ( p < 0.001 ) than the body length of smaller unidentifiable animals (median= 0.416 m, IQR = 0.416– 0.416 m). The body width of hares (median= 0.416 m, IQR = 0.382– 0.555 m) was also significantly smaller ( p < 0.001 ) than that of the roe deer (median = 0.642 m, IQR = 0.446– 0.833 m). However, the hares’ median body width was not significantly different from that of the smaller unidentifiable animals (median= 0.416 m, IQR= 0.416– 0.416 m).

3.3. Case Survey

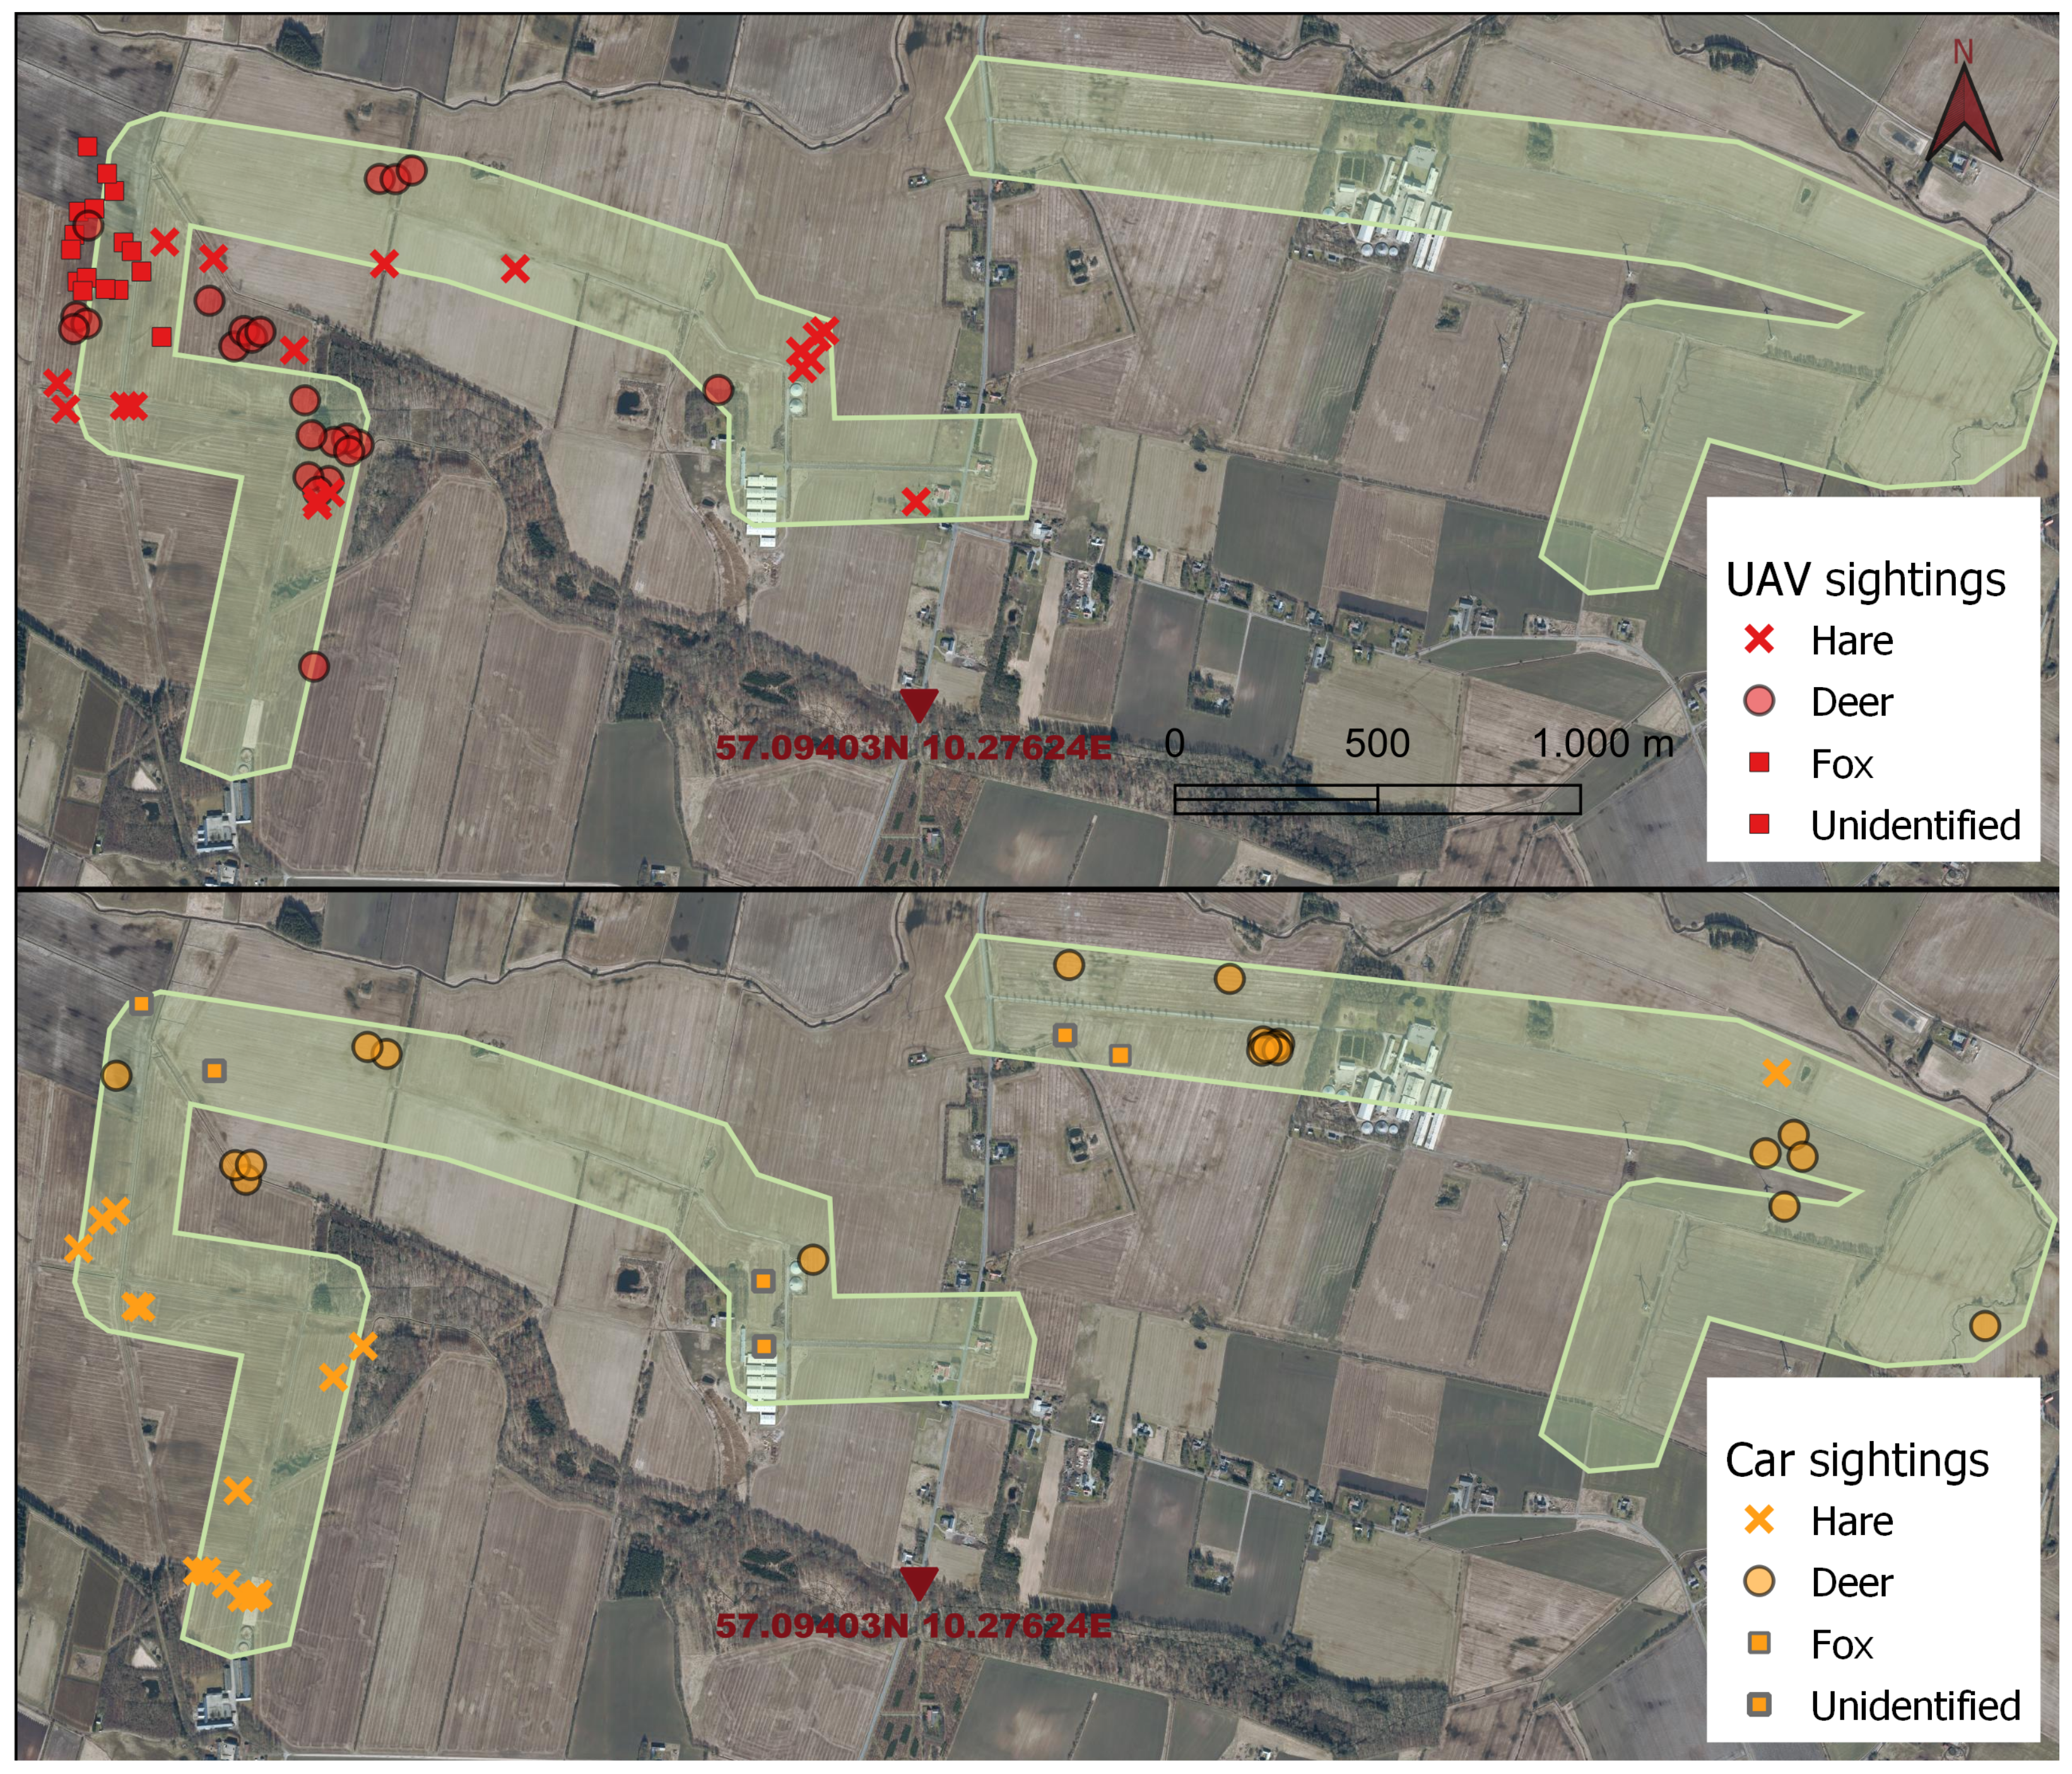
The case survey, conducted at an altitude of 60 m, covered a total area of 242 ha. This yielded a flight route with a total distance of 60,719 m, which took approximately three hours, excluding additional time and distance required to change batteries. Six batteries were needed to complete the aerial survey. If the case survey had been conducted at an altitude of 40 m the flight route would have been 82,393 m and taken approximately four hours to complete. The case flight resulted in the mapping of 57 animals in total, of which 18 were identified as hares, 23 were identified as roe deer, a single observation was identified as a red fox, and 15 were classified as unidentifiable animals smaller than hare (Figure 6). Concurrent with the drone survey, traditional spotlight counts were conducted by volunteers from the Danish Hunters Association. These counts were conducted from a car moving approximately 10– 25 km/h along a transect line from where the observers used handheld spotlights to illuminate 150 m to each side of the transect route, counting sightings and differentiating groups of animals by the reflection of their eyes (Figure 6). In total, 42 animals were spotted by car: 15 hare, 21 deer, one fox, and five unidentified small animals. Divided by the area surveyed, this gives 0.24 animals in total per ha and 0.07 hares per ha spotted by drone, and 0.17 animals in total per ha and 0.06 hare per ha spotted by car, disregarding the distance and angle to the observed animal.

4. Discussion

4.1. Flight Parameters

The flight route of the case study was set to have a 10% side overlap between parallel transect lines to reduce the probability of counting the same animal multiple times. Witczuk et al. [18] suggests a 100 m gap between parallel transect lines to minimize the chance of double counts. However, when mapping the video images and observations, it was easy to identify stationary individuals that appear in the 10% overlap margin on parallel transects and thereby ensure these individuals are not counted twice. Hence, it is difficult to completely avoid the multiple observations of the same individual. For double counts to occur, certain conditions must be met after first detection. First, the animal must be moving, secondly, the direction of movement must be toward the remaining transects, and lastly, the speed of movement needs to be fast enough for the animal to arrive before the drone [18]. Hares have a home range of approximately 20– 40 ha and can run up to 70 km/h [28]. Thus, the probability of double counts is relatively high but will also be dependent on transect length, with longer transect lines increasing the time before the drone surveys the next transect lines. However, as long as animal movement is random relative to the transect lines, which it will be if animals are not affected by the drone, then multiple detection of the same animals on different transects does not introduce bias [18]. Only when flying at altitudes at which the animals are affected by the presence of the drone will the animal movement no longer be random relative to transects and introduce bias.
Different flight altitudes have their own advantages and disadvantages. Lower altitudes increase detection probability; however, flight distance and time are also increased when flying at lower altitudes. Thus, flying at lower altitudes may limit the survey area, depending on time frame and batteries available. When determining the size of the survey area it is important to consider the distribution of the animals in question. In theory, the size of the survey area will not bias the results for species with a completely homogeneous distribution. However, for most this is usually not the case, making it important to take the species distribution into account when deciding the survey area and analyzing the results. For species with a more heterogeneous distribution, a larger area is necessary to provide an accurate estimation of the population size. In this case study, the hare were irregularly distributed, supporting the findings of previous studies and emphasizing the importance of large-scale population surveys [29,32]. Moreover, flying at low altitudes may also have a disturbance effect on the animals, depending on the species, wind factors, and drone and camera used. In this study, hare and roe deer were observed to react to the drone when flying at altitudes below 40 m, despite the M2EA being equipped with noise-reducing propellers. Similarly, Rahman et al. [22] and Rahman and Setiawan [43] found that flying at altitudes below 50 m increased the risk of disturbing the animals.
The case study showed that a flight altitude of 60 m was sufficient to detect and classify species as small as a hare. It was also possible to detect animals smaller than a hare; however, it was not possible to determine the species of these small animals. The thermal signatures of all the small animals were 2 × 2 pixels, and in all cases the small animals lay motionless, making it difficult to determine the species. Flying at a lower flight altitude would have increased the pixel size of these animals, providing their thermal signatures with more detail. There is a risk that the small, unidentifiable animals were indeed hares responding to nearby predators, e.g., humans, the red fox, or perceiving the drone as an avian predator. Hares are known to lie still, tucked in close to the ground with their ears pressed flat along their backs to avoid predation [51]. To avoid detection, they decrease their body length visible from above, changing shape features on the thermal signature used to determine the species.
When comparing observations from the drone footage with observations from the traditional monitoring by car, there was a slight difference in the number of observed animals (Figure 6). Thus, indicating that although drone surveying might reveal more animals in total, hares may be easier to identify by car. However, there was not a significant difference between the two methods, which is likely due to the limited amount of data of the case study. The comparison of the drone survey with the traditional spotlight count should be considered as a preliminary result, proving the use of drone surveys as an alternative method. Further studies are needed to compare the use of drone surveys with spotlight counts over multiple areas.

4.2. Species Classification

Body size proved to be a useful determiner of species, with the species in this study varying significantly in size. However, body size should not be the only criterion for species determination, as the size of some species may overlap. Prior to surveying an area, it is important to not only consider the size of the target species, but to also consider the size of any other species in the area. Species overlapping in size, may be distinguishable based on shape and movement posture, i.e., a hare’s jumping locomotion contrary to a fox trotting. Witczuk et al. [18] was able to differentiate between species overlapping in body length (red deer (Cervus elaphus) and wild boar (Sus scrofa)) based on the shape of their thermal signatures. The thermal signature of red deer was thinner with a distinctive head, whereas wild boar had a wider thermal signature without a distinctive head [18]. In the same study, the thermal signatures of roe deer were described as small headless signatures [18]. Contrary to this, the roe deer recorded in the current study were easily classified due to their thermal signatures having distinctive heads. This difference in thermal signature shape can be explained by the difference in flight altitude. In Witczuk et al. [18], thermal signatures were recorded at an altitude of 150 m, whereas thermal signatures in this study were recorded at altitudes between 40 m and 80 m. This increases the resolution and allows thermal signatures to include more detail.
Automatic detection and species identification may become available for thermal drone surveys of mammals with the collection of more data. With automatic detection it may be possible to identify smaller species that have too little detail for the human eye to classify [18]. Species recognition with machine learning techniques should not only be based on size and shape of thermal signatures, but also incorporate other variables, such as pixel temperature or distribution of pixel intensity, to distinguish between species [11,18]. Automatic recognition may also allow for species identification at higher altitudes, thus potentially further reducing the time and labor required to conduct population counts. Recent advances in machine learning have already enabled automated identification and enumeration of wildlife [44,52]. Psiroukis et al. [44] demonstrated that using deep learning techniques to count the number of rabbits in single thermal drone images taken at an altitude of 25 m was comparable to manual counts. For automatic species identification to be reliable, an extensive reference library with a large variety of training data is required. Future research should, therefore, focus on creating such a reference library with not only a variety of species, but more importantly a variety of intraspecific observations, as intraspecific observations can be highly variable based on the environmental conditions, camera angle, and animal posture. However, automatic detection with smaller datasets is possible by using convolutional neural networks (CNNs) [53]. Preexisting general purpose CNNs can be retrained to detect a target species in thermal drone images by using transfer learning techniques (i.e., only a few hundred images are necessary to train a CNN for automatic detection of a target species). In comparison, training a CNN from scratch would require hundreds of thousands of training images [53]. CNNs use the spectral value of each pixel along with the pixel’s proximity to other pixels in the image matrix to identify unique features, e.g., the outline of an animal. These features are then used to classify the animal based on their similarities with features in training images. CNNs can recognize when an object in an image matches most but not all of the expected features and is able to correctly classify the object despite these differences [53]. Thus, enabling identification of wildlife in different contexts (e.g., different backgrounds), resulting in a contrast between an animal and its varying background, and intraspecific differences in size, shape, and temperature.

4.3. Limitations

The current European drone regulations state that the drone must always be in the pilot’s line of sight. This requires the pilot to frequently relocate and limits the survey areas to locations where the pilot can follow the drone, so as to not lose his or her line of site when covering larger areas. However, it is possible to receive dispensation, particularly when flights are carried out in agreement with local authorities for research and conservation purposes. Another current limitation of drone surveys is the time associated with analyzing and mapping the large amounts of video and image data acquired. Hence, emphasizing the importance of developing robust software for automatic detection and species identification.

5. Conclusions

It was possible to identify hares and conduct population counts by using drone surveys with thermal imaging. Hares could be detected at flight altitudes up to 80 m with the M2EA’s thermal camera, and it was possible to fly as low as 40 m without disturbing the animals. Images taken at flight altitudes between 40 and 80 m provided enough detail to differentiate between species, with animal body size proving to be a good indicator of species. Future research should focus on advancing automatic detection, species identification, and creating a shared reference library with robust data gathered from a variety of species in different contexts.

Author Contributions

Conceptualization, P.P., A.C.L., D.B., C.P., and S.P.; methodology, P.P., A.C.L., and H.L.L.; formal analysis, P.P. and A.C.L.; investigation, P.P., A.C.L., and H.L.L.; resources, S.P.; data curation, P.P. and A.C.L.; writing—original draft preparation, P.P. and A.C.L.; writing—review and editing, P.P., A.C.L., H.L.L., P.D., D.O.A., D.B., C.P., and S.P.; visualization, P.P. and A.C.L.; supervision, D.B., C.P., and S.P.; funding acquisition, S.P. All authors have read and agreed to the published version of the manuscript.

Funding

This research was funded by The Danish Ministry of Environment (grant number 2021-69701). Thank you for the support and making this study possible.

Data Availability Statement

The data presented in this study are available on request from the corresponding author.

Acknowledgments

Thanks to the Danish Hunters Association with special thanks to Frederik de Claville Christiansen, Jakob Bergmann Nielsen, and Thomas Thoft Marcussen from Danish Hunters Association for sharing information and coordinating the case study. Moreover, thanks to Frederiks Vildtopdræt ApS and Klitgaard Agro for providing the case study area.

Conflicts of Interest

The authors declare no conflict of interest. The funders had no role in the design of the study; in the collection, analyses, or interpretation of data; in the writing of the manuscript; or in the decision to publish the results.

References

  1. Webbon, C.C.; Baker, P.J.; Harris, S. Faecal Density Counts for Monitoring Changes in Red Fox Numbers in Rural Britain. J. Appl. Ecol. 2004, 41, 768–779. [Google Scholar] [CrossRef]
  2. Aebischer, N.J.; Baines, D. Evaluating the Use of Drones Equipped with Thermal Sensors as an Effective Method for Estimating Wildlife. Rev. Catalana d’Ornitol. 2008, 24, 30–43. [Google Scholar]
  3. Begon, M.; Howarth, R.; Townsend, C. Essentials of Ecology, 4th ed.; Wiley: Hoboken, NJ, USA, 2014. [Google Scholar]
  4. Kahlert, J.; Fox, A.D.; Heldbjerg, H.; Asferg, T.; Sunde, P. Functional Responses of Human Hunters to Their Prey—Why Harvest Statistics may not Always Reflect Changes in Prey Population Abundance. Wildl. Biol. 2015, 21, 294–302. [Google Scholar] [CrossRef]
  5. Nakashima, Y.; Fukasawa, K.; Samejima, H. Estimating Animal Density Without Individual Recognition Using Information Derivable Exclusively from Camera Traps. J. Appl. Ecol. 2018, 55, 735–744. [Google Scholar] [CrossRef]
  6. Hyun, C.U.; Park, M.; Lee, W.Y. Remotely Piloted Aircraft System (RPAS)-Based Wildlife Detection: A Review and Case Studies in Maritime Antarctica. Animals 2020, 10, 2387. [Google Scholar] [CrossRef]
  7. Ramos, P.L.; Sousa, I.; Santana, R.; Morgan, W.H.; Gordon, K.; Crewe, J.; Rocha-Sousa, A.; Macedo, A.F. A Review of Capture-recapture Methods and Its Possibilities in Ophthalmology and Vision Sciences. Ophthalmic Epidemiol. 2020, 27, 310–324. [Google Scholar] [CrossRef]
  8. Delisle, Z.J.; Flaherty, E.A.; Nobbe, M.R.; Wzientek, C.M.; Swihart, R.K. Next-Generation Camera Trapping: Systematic Review of Historic Trends Suggests Keys to Expanded Research Applications in Ecology and Conservation. Front. Ecol. Evol. 2021, 9, 617996. [Google Scholar] [CrossRef]
  9. Sweeney, K.L.; Helker, V.T.; Perryman, W.L.; LeRoi, D.J.; Fritz, L.W.; Gelatt, T.S.; Angliss, R.P. Flying Beneath the Clouds at the Edge of the World: Using a Hexacopter to Supplement Abundance Surveys of Steller Sea Lions (Eumetopias Jubatus) in Alaska. J. Unmanned Veh. Syst. 2016, 4, 70–81. [Google Scholar] [CrossRef] [Green Version]
  10. Bech-Hansen, M.; Kallehauge, R.M.; Bruhn, D.; Castenschiold, J.H.F.; Gehrlein, J.B.; Laubek, B.; Jensen, L.F.; Pertoldi, C. Effect of Landscape Elements on the Symmetry and Variance of the Spatial Distribution of Individual Birds within Foraging Flocks of Geese. Symmetry 2019, 11, 1103. [Google Scholar] [CrossRef] [Green Version]
  11. Rahman, D.A.; Sitorus, A.B.Y.; Condro, A.A. From Coastal to Montane Forest Ecosystems, Using Drones for Multi-Species Research in the Tropics. Drones 2021, 6, 6. [Google Scholar] [CrossRef]
  12. Wen, D.; Su, L.; Hu, Y.; Xiong, Z.; Liu, M.; Long, Y. Surveys of Large Waterfowl and Their Habitats Using an Unmanned Aerial Vehicle: A Case Study on the Siberian Crane. Drones 2021, 5, 102. [Google Scholar] [CrossRef]
  13. Castenschiold, J.H.F.; Bregnballe, T.; Bruhn, D.; Pertoldi, C. Unmanned Aircraft Systems as a Powerful Tool to Detect Fine-Scale Spatial Positioning and Interactions between Waterbirds at High-Tide Roosts. Animals 2022, 12, 947. [Google Scholar] [CrossRef]
  14. Fettermann, T.; Fiori, L.; Gillman, L.; Stockin, K.A.; Bollard, B. Drone Surveys Are More Accurate Than Boat-Based Surveys of Bottlenose Dolphins (Tursiops Truncatus). Drones 2022, 6, 82. [Google Scholar] [CrossRef]
  15. Setyawan, E.; Stevenson, B.C.; Izuan, M.; Constantine, R.; Erdmann, M.V. How Big Is That Manta Ray? A Novel and Non-Invasive Method for Measuring Reef Manta Rays Using Small Drones. Drones 2022, 6, 63. [Google Scholar] [CrossRef]
  16. Dronova, I.; Kislik, C.; Dinh, Z.; Kelly, M. A Review of Unoccupied Aerial Vehicle Use in Wetland Applications: Emerging Opportunities in Approach, Technology, and Data. Drones 2021, 5, 45. [Google Scholar] [CrossRef]
  17. Wich, S.; Dellatore, D.; Houghton, M.; Ardi, R.; Koh, L.P. A Preliminary Assessment of Using Conservation Drones for Sumatran Orangutan (Pongo abelii) Distribution and Density. J. Unmanned Veh. Syst. 2016, 4, 45–52. [Google Scholar] [CrossRef]
  18. Witczuk, J.; Pagacz, S.; Zmarz, A.; Cypel, M. Exploring the Feasibility of Unmanned Aerial Vehicles and Thermal Imaging for Ungulate Surveys in Forests—Preliminary Results. Int. J. Remote Sens. 2018, 39, 5504–5521. [Google Scholar] [CrossRef]
  19. Lee, S.; Song, Y.; Kil, S.H. Feasibility Analyses of Real-Time Detection of Wildlife Using UAV-Derived Thermal and RGB Images. Remote Sens. 2021, 13, 2169. [Google Scholar] [CrossRef]
  20. Brunton, E.A.; Leon, J.X.; Burnett, S.E. Evaluating the Efficacy and Optimal Deployment of Thermal Infrared and True-Colour Imaging When Using Drones for Monitoring Kangaroos. Drones 2020, 4, 20. [Google Scholar] [CrossRef]
  21. Lethbridge, M.; Stead, M.; Wells, C. Estimating Kangaroo Density by Aerial Survey: A Comparison of Thermal Cameras with Human Observers. Wildl. Res. 2019, 46, 639. [Google Scholar] [CrossRef]
  22. Rahman, D.A.; Setiawan, Y.; Wijayanto, A.K.; Rahman, A.A.A.F.; Martiyani, T.R. An Experimental Approach to Exploring the Feasibility of Unmanned Aerial Vehicle and Thermal Imaging in Terrestrial and Arboreal Mammals Research. E3S Web Conf. 2020, 211, 02010. [Google Scholar] [CrossRef]
  23. Obermoller, T.R.; Norton, A.S.; Michel, E.S.; Haroldson, B.S. Use of Drones with Thermal Infrared to Locate White-tailed Deer Neonates for Capture. Wildl. Soc. Bull. 2021, 45, 682–689. [Google Scholar] [CrossRef]
  24. Howell, L.G.; Clulow, J.; Jordan, N.R.; Beranek, C.T.; Ryan, S.A.; Roff, A.; Witt, R.R. Drone Thermal Imaging Technology Provides a Cost-Effective Tool for Landscape-Scale Monitoring of a Cryptic Forest-Dwelling Species across All Population Densities. Wildl. Res. 2021, 49, 66–78. [Google Scholar] [CrossRef]
  25. Shewring, M.P.; Vafidis, J.O. Using UAV-mounted Thermal Cameras to Detect the Presence of Nesting Nightjar in Upland Clear-fell: A Case Study in South Wales, UK. Ecol. Solut. Evid. 2021, 2, e12052. [Google Scholar] [CrossRef]
  26. Schmidt, N.M.; Asferg, T.; Forchhammer, M.C. Long-term Patterns in European Brown Hare Population Dynamics in Denmark: Effects of Agriculture, Predation, and Climate. BMC Ecol. 2004, 4, 1–7. [Google Scholar] [CrossRef] [Green Version]
  27. Misiorowska, M.; Wasilewski, M. Survival and Causes of Death Among Released Brown Hares (Lepus europaeus Pallas, 1778) in Central Poland. Acta Theriol. 2012, 57, 305–312. [Google Scholar] [CrossRef] [Green Version]
  28. Miljøministeriet Naturstyrelsen. Forvaltningsplan for Hare; Nationalt Center for Miljø og Energi, Aarhus Universitet: Roskilde, Denmark, 2013. [Google Scholar]
  29. Sliwinski, K.; Strauß, E.; Jung, K.; Siebert, U. Comparison of Spotlighting Monitoring Data of European Brown Hare (Lepus europaeus) Relative Population Densities with Infrared Thermography in Agricultural Landscapes in Northern Germany. PLoS ONE 2021, 16, e0254084. [Google Scholar] [CrossRef]
  30. Hacklander, K.; Schai-Braun, S. Lepus europaeus. In The IUCN Red List of Threatened Species 2019; IUCN Red List: Cambridge, UK, 2019; Available online: https://doi.org/10.2305/IUCN.UK.2019-1.RLTS.T41280A45187424.en (accessed on 15 May 2022).
  31. Pépin, D.; Angibault, J.M. Selection of Resting Sites by the European Hare as Related to Habitat Characteristics During Agricultural Changes. Eur. J. Wildl. Res. 2007, 53, 183–189. [Google Scholar] [CrossRef]
  32. Jensen, T.W. Identifying Causes for Population Decline of the Brown Hare (Lepus europaeus) in Agricultural Landscapes in Denmark. Ph.D. Thesis, National Environmental Research Institute, Aarhus University, Aarhus, Denmark, 2009. [Google Scholar]
  33. Moeslund, J.; Nygaard, B.; Ejrnæs, R.; Bell, N.; Bruun, L.; Bygebjerg, R.; Carl, H.; Damgaard, J.; Dylmer, E.; Elmeros, M.; et al. Den Danske Rødliste. 2019. Available online: https://ecos.au.dk/forskningraadgivning/temasider/redlistframe/roedliste-2019 (accessed on 20 May 2022).
  34. Asferg, T.; Clausen, P.; Christensen, T.K.; Bregnballe, R.; Clausen, K.K.; Elmeros, M.; Fox, A.D.; Haugaard, L.; Holm, T.E.; Laursen, K.; et al. Vildtbestand og Jagttider i Danmark: Det Biologiske Grundlag for Jagttidsrevisionen 2018. 2016. Available online: http://dce2.au.dk/pub/SR195.pdf (accessed on 15 May 2022).
  35. Sørensen, I.H.; Midtgaard, L. Notat vedr. Markvildtindsatsens Resultater 2013–2020; Danmarks Jægerforbund: Rønde, Denmark, 2021; Available online: https://www.jaegerforbundet.dk/media/16606/210108-ihs-lmi-notat-markvildt.pdf (accessed on 15 May 2022).
  36. Jægerforbund, D. Vejledning: Pattedyrstællinger. 2022. Available online: https://www.jaegerforbundet.dk/media/19412/t%C3%A6llevejledning_pattedyr_rev_2022.pdf (accessed on 15 May 2022).
  37. Sunde, P.; Jessen, L. It Counts Who Counts: An Experimental Evaluation of the Importance of Observer Effects on Spotlight Count Estimates. Eur. J. Wildl. Res. 2013, 59, 645–653. [Google Scholar] [CrossRef]
  38. Smith, R.K.; Jennings, N.V.; Harris, S. A Quantitative Analysis of the Abundance and Demography of European Hares Lepus europaeus in Relation to Habitat Type, Intensity of Agriculture and Climate. Mammal Rev. 2005, 35, 1–24. [Google Scholar] [CrossRef]
  39. Linchant, J.; Lisein, J.; Semeki, J.; Lejeune, P.; Vermeulen, C. Are unmanned aircraft systems (UAS s) the future of wildlife monitoring? A review of accomplishments and challenges. Mammal Rev. 2015, 45, 239–252. [Google Scholar] [CrossRef]
  40. Avola, D.; Cinque, L.; Fagioli, A.; Foresti, G.L.; Pannone, D.; Piciarelli, C. Automatic estimation of optimal UAV flight parameters for real-time wide areas monitoring. Multimed. Tools Appl. 2021, 80, 25009–25031. [Google Scholar] [CrossRef]
  41. Mesas-Carrascosa, F.J.; Torres-Sánchez, J.; Clavero-Rumbao, I.; García-Ferrer, A.; Peña, J.M.; Borra-Serrano, I.; López-Granados, F. Assessing optimal flight parameters for generating accurate multispectral orthomosaicks by UAV to support site-specific crop management. Remote Sens. 2015, 7, 12793–12814. [Google Scholar] [CrossRef] [Green Version]
  42. Chrétien, L.P.; Théau, J.; Ménard, P. Visible and Thermal Infrared Remote Sensing for the Detection of White-tailed Deer Using an Unmanned Aerial System. Wildl. Soc. Bull. 2016, 40, 181–191. [Google Scholar] [CrossRef]
  43. Rahman, D.A.; Setiawan, Y. Possibility of Applying Unmanned Aerial Vehicle and Thermal Imaging in Several Canopy Cover Class for Wildlife Monitoring – Preliminary Results. E3S Web Conf. 2020, 211, 04007. [Google Scholar] [CrossRef]
  44. Psiroukis, V.; Malounas, I.; Mylonas, N.; Grivakis, K.E.; Fountas, S.; Hadjigeorgiou, I. Monitoring of Free-Range Rabbits Using Aerial Thermal Imaging. Smart Agric. Technol. 2021, 1, 100002. [Google Scholar] [CrossRef]
  45. DJI. DJI Pilot Android v2.5.1.3. 2021. Available online: https://www.dji.com/downloads/djiapp/dji-pilot (accessed on 20 March 2022).
  46. Burke, C.; Rashman, M.; Wich, S.; Symons, A.; Theron, C.; Longmore, S. Optimizing Observing Strategies for Monitoring Animals Using Drone-Mounted Thermal Infrared Cameras. Int. J. Remote Sens. 2019, 40, 439–467. [Google Scholar] [CrossRef] [Green Version]
  47. R Core Team. The R Project for Statistical Computing, Version 4.0.3; R Foundation for Statistical Computing: Vienna, Austria, 2020; Available online: https://www.R-project.org/ (accessed on 15 May 2022).
  48. Esri. ArcGIS Pro 2.9.2. 2021. Available online: http://www.esri.com/ (accessed on 25 April 2022).
  49. Esri. Using the ArcGIS Full Motion Video 1.4 Add-In. 2020. Available online: http://www.esri.com/fmv (accessed on 25 April 2022).
  50. Python Software Foundation. Python 3.9.12. 2022. Available online: https://www.python.org/ (accessed on 25 April 2022).
  51. Steen, K.A.; Villa-Henriksen, A.; Therkildsen, O.R.; Green, O. Automatic Detection of Animals in Mowing Operations Using Thermal Cameras. Sensors 2012, 12, 7587–7597. [Google Scholar] [CrossRef]
  52. Seymour, A.C.; Dale, J.; Hammill, M.; Halpin, P.N.; Johnston, D.W. Automated Detection and Enumeration of Marine Wildlife Using Unmanned Aircraft Systems (UAS) and Thermal Imagery. Sci. Rep. 2017, 7, 45127. [Google Scholar] [CrossRef] [Green Version]
  53. Corcoran, E.; Winsen, M.; Sudholz, A.; Hamilton, G. Automated Detection of Wildlife Using Drones: Synthesis, Opportunities and Constraints. Methods Ecol. Evol. 2021, 12, 1103–1114. [Google Scholar] [CrossRef]
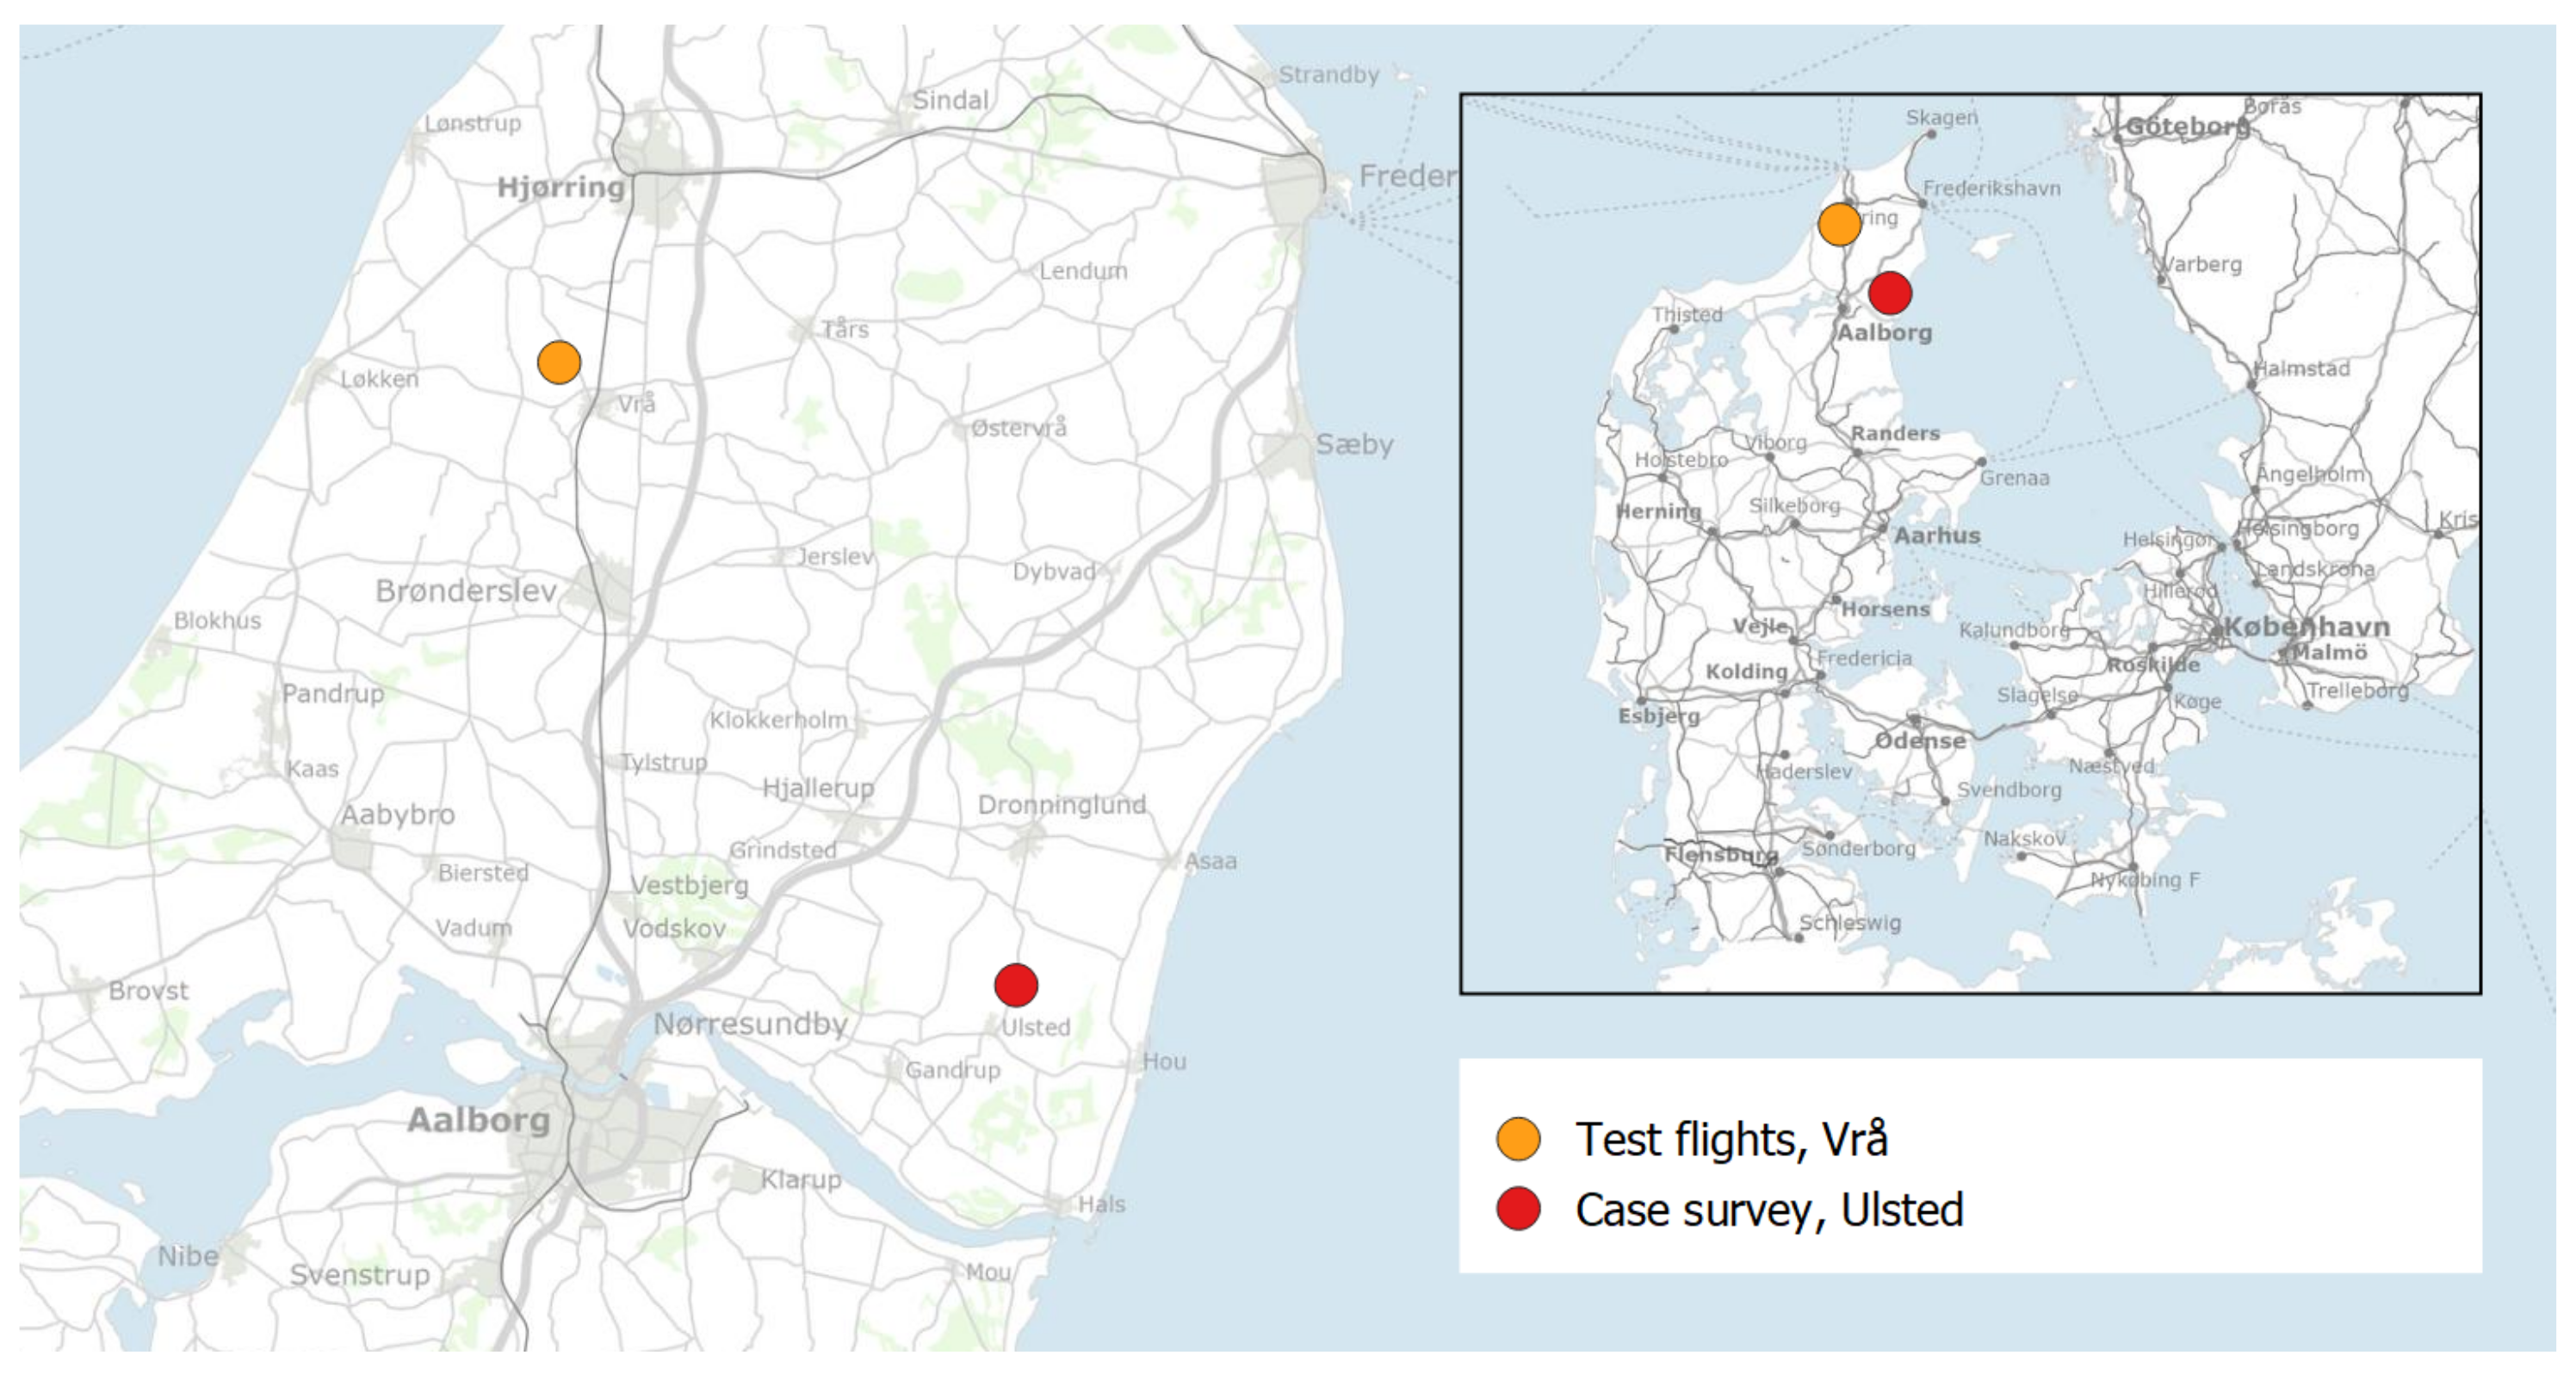
Figure 1. Index map showing the locations of the area of test flights, Vrå (57.37229 N, 9.91373 E), and the case survey, Ulsted (57.09403 N, 10.27624 E).
Drones 07 00005 g001
Figure 2. Example flight route mapped in DJI Pilot App [45]. The blue area indicates the ground area covered on the aerial images and the green lines show the flight route with distances between mapping points annotated along the route.
Drones 07 00005 g002
Figure 3. Thermal images of hare taken at an altitude of 40, 60, and 80 m, respectively.
Drones 07 00005 g003
Figure 4. Thermal images of different animals taken at an altitude of 60 m.
Drones 07 00005 g004
Figure 5. Body size of hares ( n = 35 ), deer ( n = 34 ), and smaller unidentifiable animals ( n = 15 ). The body size was defined by (a) body length, (b) body width, and (c) surface area visible from above. Significance differences between the respective animal groups are denoted above the box plots, with * * * indicating a significance level of p < 0.001 .
Drones 07 00005 g005
Figure 6. Animal observations recorded 20 April 2022, during the case survey. The light green area shows the area surveyed, 242 ha in total. The top map shows drone thermal sightings, and the bottom map shows sightings by car, using spotlights.
Drones 07 00005 g006
Disclaimer/Publisher’s Note: The statements, opinions and data contained in all publications are solely those of the individual author(s) and contributor(s) and not of MDPI and/or the editor(s). MDPI and/or the editor(s) disclaim responsibility for any injury to people or property resulting from any ideas, methods, instructions or products referred to in the content.