


Mapping of Glaciers on Horseshoe Island, Antarctic Peninsula, with Deep Learning Based on High-Resolution Orthophoto

Abstract
1. Introduction
- A novel glacier segmentation dataset for deep learning was generated for the first time to date using UAV imagery in Antarctica.
- Recent state-of-the-art architectures and their performances, such as SegFormer, DeepLabv3+ and K-Net were employed and investigated for glacier segmentation.
- There has been no study to date in the literature that has focused on glacier mapping using aerial or UAV imagery utilizing deep learning
- The extraction of small, discontinuous and shaded glaciers was efficiently dealt with in the K-Net architecture.
- Glacier mapping has been hardly applied in the Antarctica region.
2. Materials and Methods
3. Results and Discussion
4. Conclusions
Author Contributions
Funding
Data Availability Statement
Conflicts of Interest
References
- Turner, J.; Barrand, N.E.; Bracegirdle, T.J.; Convey, P.; Hodgson, D.A.; Jarvis, M.; Jenkins, A.; Marshall, G.; Meredith, M.P.; Roscoe, H.; et al. Antarctic climate change and the environment: An update. Polar Rec. 2014, 50, 237–259. [Google Scholar] [CrossRef]
- Kulp, S.A.; Strauss, B.H. New elevation data triple estimates of global vulnerability to sea-level rise and coastal flooding. Nat. Commun. 2019, 10, 1–12. [Google Scholar]
- Wilkins, H. The Wilkins-Hearst Antarctic Expedition, 1928-1929. Geogr. Rev. 1929, 19, 353–376. [Google Scholar] [CrossRef]
- Pope, A.; Rees, W.G.; Fox, A.J.; Fleming, A. Open access data in polar and cryospheric remote sensing. Remote Sens. 2014, 6, 6183–6220. [Google Scholar] [CrossRef]
- Lucieer, A.; Robinson, S.A.; Turner, D. Unmanned aerial vehicle (UAV) remote sensing for hyperspatial terrain mapping of Antarctic moss beds based on structure from motion (SfM) point clouds. In Proceedings of the 34th International Symposium on Remote Sensing of Environment, Sydney, Australia, 10–15 April 2011. [Google Scholar]
- Turner, D.; Lucieer, A.; Malenovský, Z.; King, D.; Robinson, S.A. Assessment of Antarctic moss health from multi-sensor UAS imagery with Random Forest Modelling. Int. J. Appl. Earth Obs. Geoinf. 2018, 68, 168–179. [Google Scholar] [CrossRef]
- Mergelov, N.; Dolgikh, A.; Shorkunov, I.; Zazovskaya, E.; Soina, V.; Yakushev, A.; Fedorov-Davydov, D.; Pryakhin, S.; Dobryansky, A. Hypolithic communities shape soils and organic matter reservoirs in the ice-free landscapes of East Antarctica. Sci. Rep. 2020, 10, 10277. [Google Scholar] [CrossRef]
- Aykut, N.O. The Research for Usability of Unmanned Aerial Vehicles in Coastal Line Determination. Geomatik 2019, 4, 141–146. [Google Scholar]
- Bliakharskii, D.; Florinsky, I.; Skrypitsyna, T. Modelling glacier topography in Antarctica using unmanned aerial survey: Assessment of opportunities. Int. J. Remote Sens. 2019, 40, 2517–2541. [Google Scholar] [CrossRef]
- Lamsters, K.; Karušs, J.; Krievāns, M.; Ješkins, J. High-resolution orthophoto map and digital surface models of the largest Argentine Islands (the Antarctic) from unmanned aerial vehicle photogrammetry. J. Maps 2020, 16, 335–347. [Google Scholar] [CrossRef]
- Nijhawan, R.; Das, J.; Balasubramanian, R. A hybrid CNN+ random forest approach to delineate debris covered glaciers using deep features. J. Indian Soc. Remote Sens. 2018, 46, 981–989. [Google Scholar] [CrossRef]
- Baumhoer, C.A.; Dietz, A.J.; Kneisel, C.; Kuenzer, C. Automated extraction of antarctic glacier and ice shelf fronts from sentinel-1 imagery using deep learning. Remote Sens. 2019, 11, 2529. [Google Scholar] [CrossRef]
- Xie, Z.; Haritashya, U.K.; Asari, V.K.; Young, B.W.; Bishop, M.P.; Kargel, J.S. GlacierNet: A deep-learning approach for debris-covered glacier mapping. IEEE Access 2020, 8, 83495–83510. [Google Scholar] [CrossRef]
- Xie, Z.Y.; Asari, V.K.; Haritashya, U.K. Evaluating deep-learning models for debris-covered glacier mapping. Appl. Comput. Geosci. 2021, 12, 100071. [Google Scholar] [CrossRef]
- Xie, Z.; Haritashya, U.K.; Asari, V.K.; Bishop, M.P.; Kargel, J.S.; Aspiras, T.H. GlacierNet2: A Hybrid Multi-Model Learning Architecture for Alpine Glacier Mapping. Int. J. Appl. Earth Obs. Geoinf. 2022, in press. [Google Scholar]
- Robson, B.A.; Bolch, T.; MacDonell, S.; Hölbling, D.; Rastner, P.; Schaffer, N. Automated detection of rock glaciers using deep learning and object-based image analysis. Remote Sens. Environ. 2020, 250, 112033. [Google Scholar] [CrossRef]
- Yan, S.; Xu, L.; Yu, G.; Yang, L.; Yun, W.; Zhu, D.; Ye, S.; Yao, X. Glacier classification from Sentinel-2 imagery using spatial-spectral attention convolutional model. Int. J. Appl. Earth Obs. Geoinf. 2021, 102, 102445. [Google Scholar] [CrossRef]
- Khan, A.A.; Jamil, A.; Hussain, D.; Ali, I.; Hameed, A.A. Deep learning-based framework for monitoring of debris-covered glacier from remotely sensed images. Adv. Space Res. 2022; in press. [Google Scholar] [CrossRef]
- Kaushik, S.; Singh, T.; Bhardwaj, A.; Joshi, P.K.; Dietz, A.J. Automated Delineation of Supraglacial Debris Cover Using Deep Learning and Multisource Remote Sensing Data. Remote Sens. 2022, 14, 1352. [Google Scholar] [CrossRef]
- Tian, S.; Dong, Y.; Feng, R.; Liang, D.; Wang, L. Mapping mountain glaciers using an improved U-Net model with cSE. Int. J. Digit. Earth 2022, 15, 463–477. [Google Scholar] [CrossRef]
- Roberts-Pierel, B.M.; Kirchner, P.B.; Kilbride, J.B.; Kennedy, R.E. Changes over the Last 35 Years in Alaska’s Glaciated Landscape: A Novel Deep Learning Approach to Mapping Glaciers at Fine Temporal Granularity. Remote Sens. 2022, 14, 4582. [Google Scholar] [CrossRef]
- RGI Consortium. Randolph Glacier Inventory—A Dataset of Global Glacier Outlines, Version 6 [Data Set]; National Snow and Ice Data Center: Boulder, CO USA, 2017; Available online: https://doi.org/10.7265/4m1f-gd79 (accessed on 12 October 2022).
- Yıldırım, C. Geomorphology of Horseshoe Island, Marguerite Bay, Antarctica. J. Maps 2020, 16, 56–67. [Google Scholar] [CrossRef]
- Padró, J.-C.; Muñoz, F.-J.; Planas, J.; Pons, X. Comparison of four UAV georeferencing methods for environmental monitoring purposes focusing on the combined use with airborne and satellite remote sensing platforms. Int. J. Appl. Earth Obs. Geoinf. 2019, 75, 130–140. [Google Scholar] [CrossRef]
- Ball, G.H.; Hall, D.J. ISODATA, a Novel Method of Data Analysis and Pattern Classification; Stanford Research inst Menlo Park: Menlo Park, CA, USA, 1965. [Google Scholar]
- Chen, L.-C.; Papandreou, G.; Kokkinos, I.; Murphy, K.; Yuille, A.L. Semantic image segmentation with deep convolutional nets and fully connected crfs. arXiv 2014, arXiv:1406.2661. [Google Scholar]
- Chen, L.-C.; Papandreou, G.; Kokkinos, I.; Murphy, K.; Yuille, A.L. Deeplab: Semantic image segmentation with deep convolutional nets, atrous convolution, and fully connected crfs. IEEE Trans. Pattern Anal. Mach. Intell. 2017, 40, 834–848. [Google Scholar] [CrossRef]
- Chen, L.-C.; Papandreou, G.; Schroff, F.; Adam, H. Rethinking atrous convolution for semantic image segmentation. arXiv 2017, arXiv:1706.05587. [Google Scholar]
- Chen, L.-C.; Zhu, Y.; Papandreou, G.; Schroff, F.; Adam, H. Encoder-decoder with atrous separable convolution for semantic image segmentation. In Proceedings of the European Conference on Computer Vision (ECCV), Munich, Germany, 8–14 September 2018; pp. 801–818. [Google Scholar]
- Xie, E.; Wang, W.; Yu, Z.; Anandkumar, A.; Alvarez, J.M.; Luo, P. SegFormer: Simple and efficient design for semantic segmentation with transformers. Adv. Neural Inf. Process. Syst. 2021, 34, 12077–12090. [Google Scholar]
- Zhang, W.; Pang, J.; Chen, K.; Loy, C.C. K-net: Towards unified image segmentation. Adv. Neural Inf. Process. Syst. 2021, 34, 10326–10338. [Google Scholar]
- MMSegmentation Contributors. OpenMMLab Semantic Segmentation Toolbox and Benchmark [Computer Software]. 2020. Available online: https://github.com/open-mmlab/mmsegmentation (accessed on 15 November 2022).


| Study | Method | Highlights | Shortcomings |
|---|---|---|---|
| Nijhawan, et al. [11] | 3 CNNS + PCA + RF + post-processing | Better results than SVM, ANN and RF. | Manual feature selection. |
| Baumhoer, et al. [12] | Modified U-Net + post-processing | Extracts coastlines along with glacier and ice shelf fronts. | Based on only radar imagery. |
| Xie, et al. [13] | GlacierNet CNN + post-processing | The use of morphometric parameters increases boundary detection performance. | Multi-source data acquired at different times caused errors. |
| Xie, et al. [15] | GlacierNet2 CNN | Improved accuracy compared to GlacierNet and DeepLabv3+. | Compared with a single state-of-the-art method. |
| Robson, et al. [16] | CNN + OBIA + post-processing | Based on freely available remote sensing data. | The parameters and thresholds were chosen subjectively. |
| Yan, et al. [17] | Modified U-Net | Increased accuracy with SSAM. | Outperformed the original U-Net by only 1 percent. |
| Khan, et al. [18] | Spatial and spectral CNNS + FCN + post-processing | A shallow network was developed. | Errors along the boundary among the classes. |
| Kaushik, et al. [19] | Six-layered CNN | Based on freely available remote sensing data. | Areas with shadows could not be sufficiently classified. |
| Tian, et al. [20] | Channel-attention U-Net + CRF post-processing | Better results than U-Net and GlacierNet. | Post-processing may result in the underestimation of glaciers. |
| Roberts-Pierel, et al. [21] | ResNeSt-101 + PSPNet | Better glacier outlines than Randolph Glacier Inventory 6.0 data [22]. | Limited ability to accurately map small, discontinuous and shaded glaciers |
| Number of Images | 5393 Images |
| Average ground sampling distance (GSD) | 3.00 cm |
| Area covered | 2668 km2 |
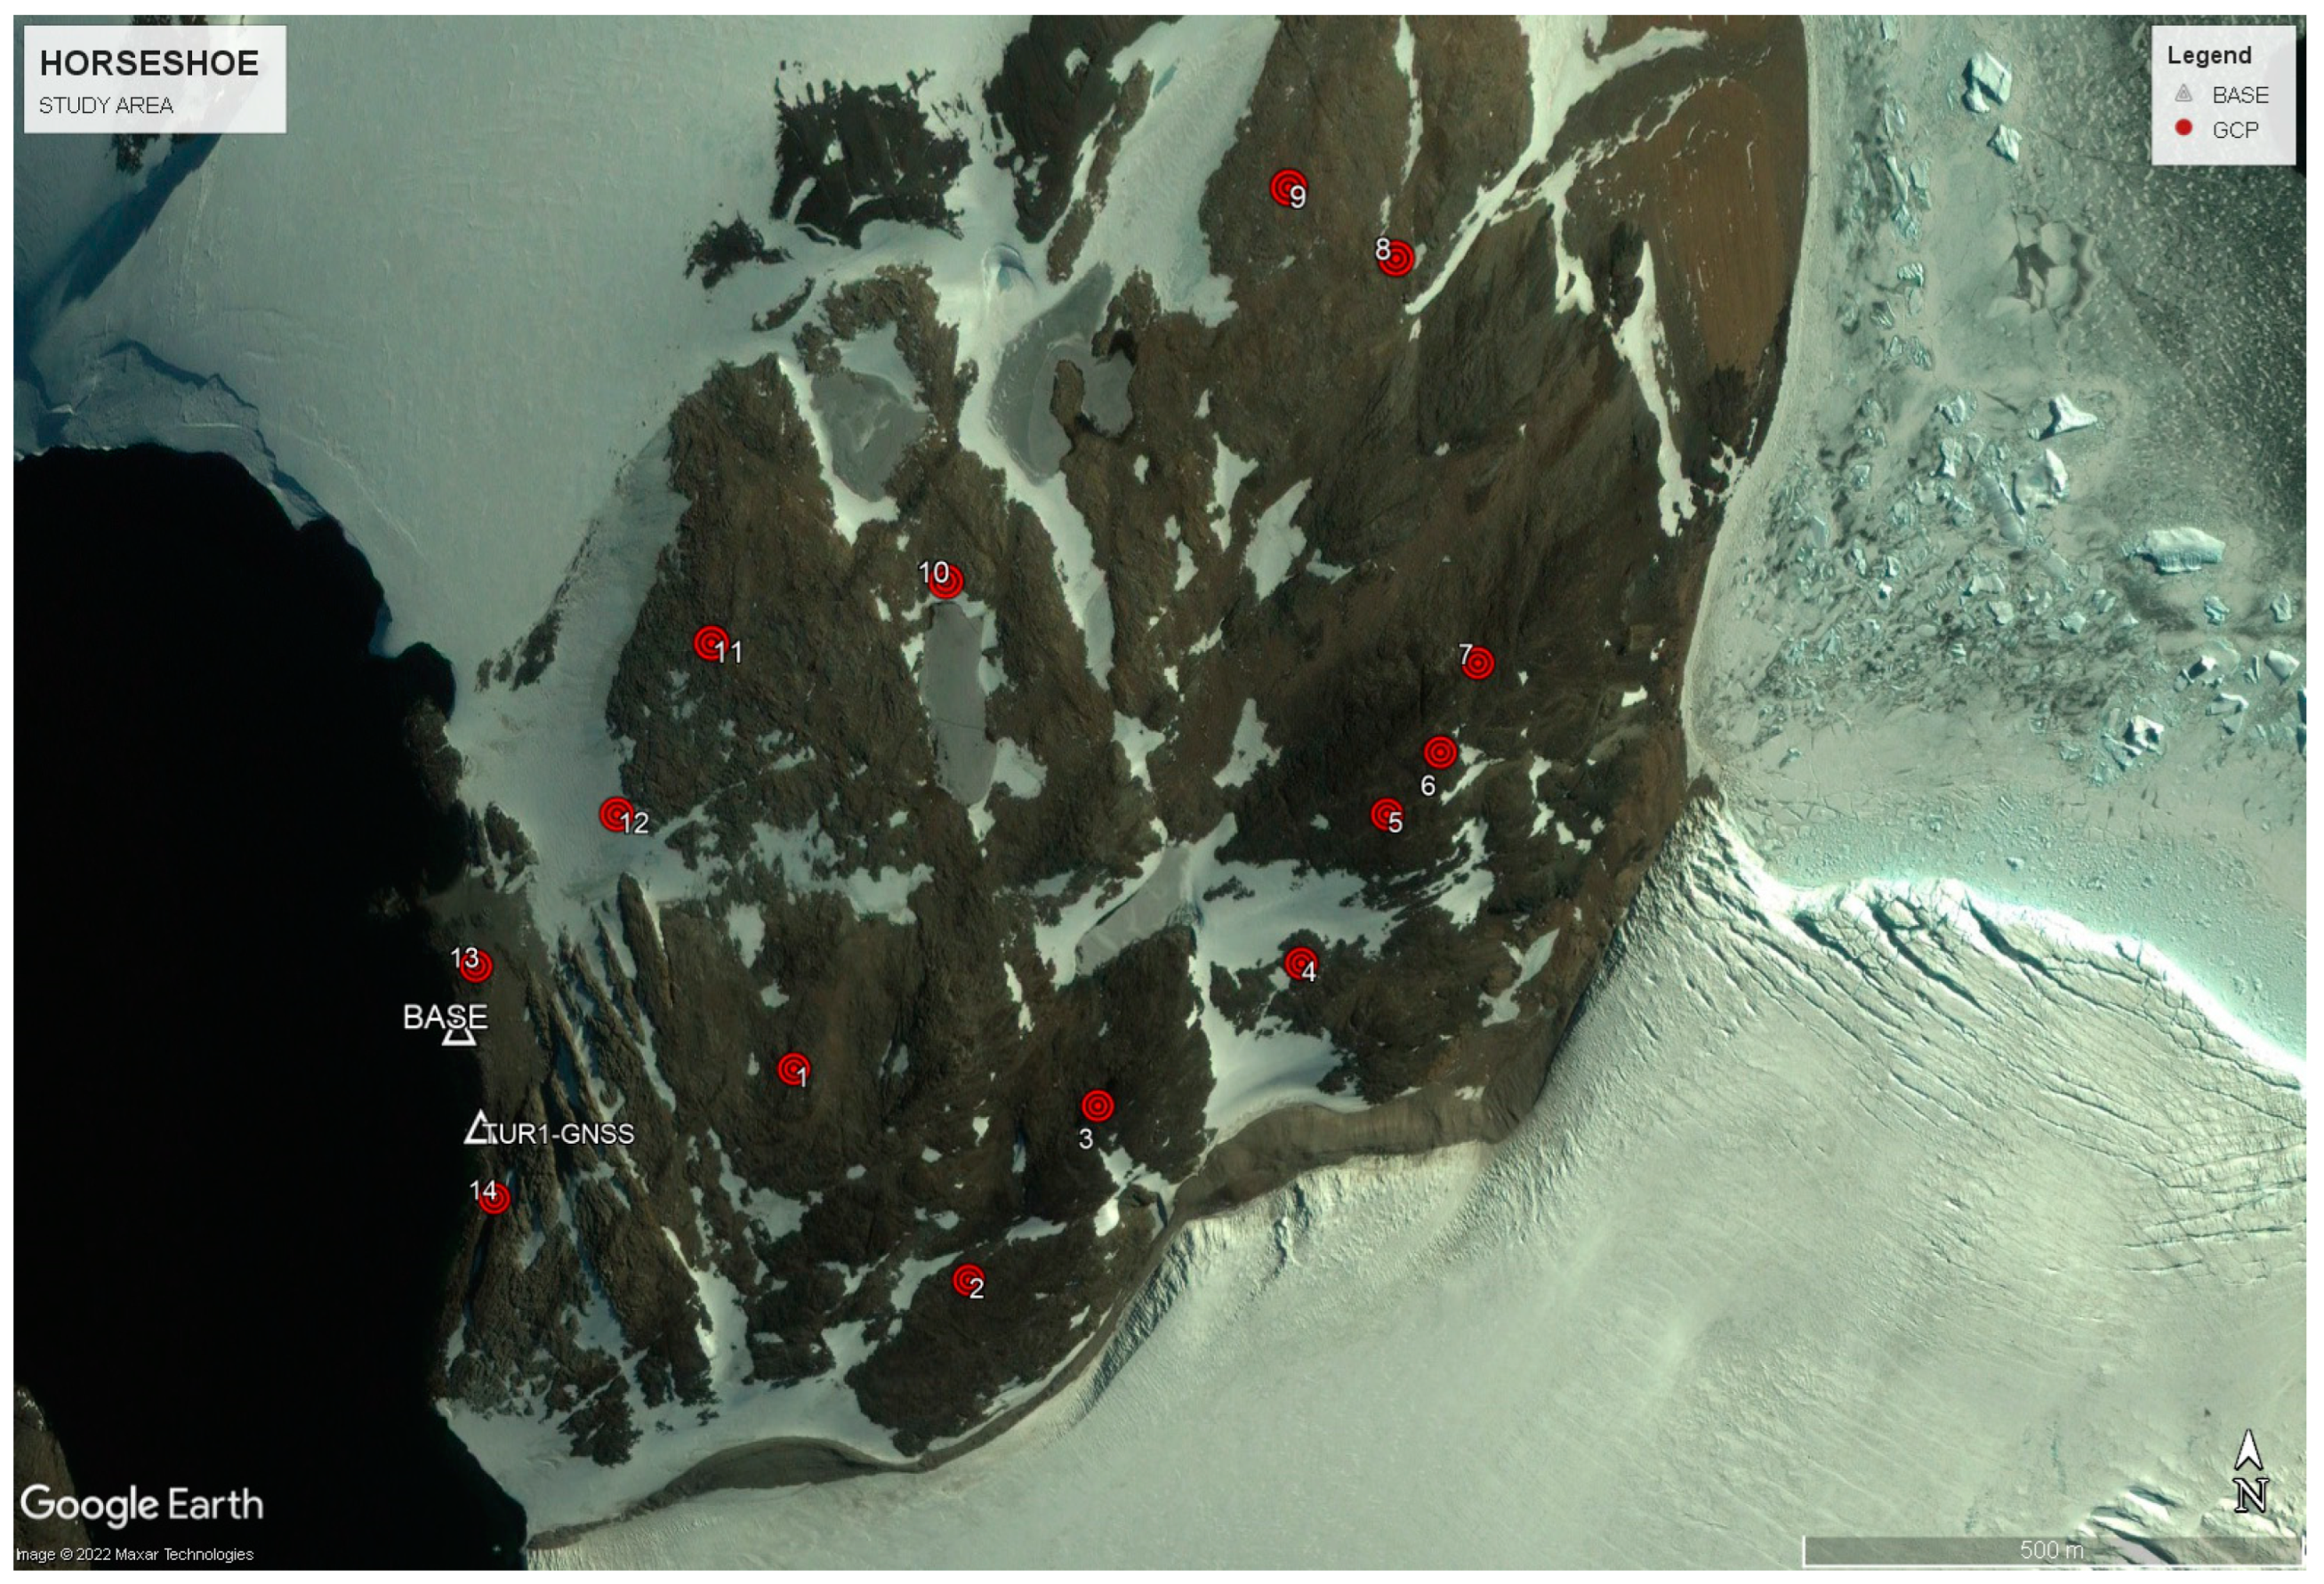
| Georeferencing | 14 3D control points |
| RMS error (cm) [X, Y, Z] | 1.30, 0.97, 2.27 |
| Segformer | DeepLabv3+ | K-Net | |
|---|---|---|---|
| Accuracy | 98.85% | 99.18% | 99.62% |
| IoU | 98.73% | 99.09% | 99.58% |
| Precision | 98.89% | 99.37% | 99.82% |
| Recall | 99.83% | 99.72% | 99.76% |
| F1-Score | 99.36% | 99.54% | 99.79% |
| Study | Data | Resolution | Location | Accuracy | Precision | Recall | F1-Score |
|---|---|---|---|---|---|---|---|
| Yan, et al. [17] | Sentinel-2 | 10 m | Xizang Province, China | 96.87% | 98.70% | 97.88% | N/A |
| Tian, et al. [20] | Landsat 8 | 15 m | Pamir Plateau, Tajikistan | 97.74% | N/A | 89.09% | 89.46% |
| Roberts-Pierel, et al. [21] | Landsat 4, 5, 7, 8 | 30 m | Southern Alaska | N/A | 94.00% | 94.00% | 94.00% |
| Brooks Range, Alaska | N/A | 87.00% | 86.00% | 86.00% | |||
| Ours (K-Net) | UAV | 3 cm | Horseshoe Island, Antarctica | 99.62% | 99.82% | 99.76% | 99.79% |
Disclaimer/Publisher’s Note: The statements, opinions and data contained in all publications are solely those of the individual author(s) and contributor(s) and not of MDPI and/or the editor(s). MDPI and/or the editor(s) disclaim responsibility for any injury to people or property resulting from any ideas, methods, instructions or products referred to in the content. |
© 2023 by the authors. Licensee MDPI, Basel, Switzerland. This article is an open access article distributed under the terms and conditions of the Creative Commons Attribution (CC BY) license (https://creativecommons.org/licenses/by/4.0/).
Share and Cite
Selbesoğlu, M.O.; Bakirman, T.; Vassilev, O.; Ozsoy, B. Mapping of Glaciers on Horseshoe Island, Antarctic Peninsula, with Deep Learning Based on High-Resolution Orthophoto. Drones 2023, 7, 72. https://doi.org/10.3390/drones7020072
Selbesoğlu MO, Bakirman T, Vassilev O, Ozsoy B. Mapping of Glaciers on Horseshoe Island, Antarctic Peninsula, with Deep Learning Based on High-Resolution Orthophoto. Drones. 2023; 7(2):72. https://doi.org/10.3390/drones7020072
Chicago/Turabian StyleSelbesoğlu, Mahmut Oğuz, Tolga Bakirman, Oleg Vassilev, and Burcu Ozsoy. 2023. "Mapping of Glaciers on Horseshoe Island, Antarctic Peninsula, with Deep Learning Based on High-Resolution Orthophoto" Drones 7, no. 2: 72. https://doi.org/10.3390/drones7020072
APA StyleSelbesoğlu, M. O., Bakirman, T., Vassilev, O., & Ozsoy, B. (2023). Mapping of Glaciers on Horseshoe Island, Antarctic Peninsula, with Deep Learning Based on High-Resolution Orthophoto. Drones, 7(2), 72. https://doi.org/10.3390/drones7020072