Article

Vegetation Cover Estimation in Semi-Arid Shrublands after Prescribed Burning: Field-Ground and Drone Image Comparison

by
Antonio J. Pérez-Luque
1,*,
María Eugenia Ramos-Font
1,
Mauro J. Tognetti Barbieri
1,
Carlos Tarragona Pérez
2,
Guillermo Calvo Renta
2 and
Ana Belén Robles Cruz
1
1
Spanish National Research Council, Estación Experimental del Zaidín (EEZ-CSIC), Service of Evaluation, Restoration and Protection of Mediterranean Agrosystems, Profesor Albareda 1, ES-18008 Granada, Spain
2
SpectralGeo (Dronica Solutions S.L.), Calle Nájera 14 B, ES-26540 Alfaro, Spain
*
Author to whom correspondence should be addressed.
Drones 2022, 6(11), 370; https://doi.org/10.3390/drones6110370
Submission received: 30 September 2022 / Revised: 14 November 2022 / Accepted: 18 November 2022 / Published: 21 November 2022
(This article belongs to the Special Issue Drones for Biodiversity Conservation)

Abstract

:
The use of drones for vegetation monitoring allows the acquisition of large amounts of high spatial resolution data in a simple and fast way. In this study, we evaluated the accuracy of vegetation cover estimation by drones in Mediterranean semi-arid shrublands (Sierra de Filabres; Almería; southern Spain) after prescribed burns (2 years). We compared drone-based vegetation cover estimates with those based on traditional vegetation sampling in ninety-six 1 m2 plots. We explored how this accuracy varies in different types of coverage (low-, moderate- and high-cover shrublands, and high-cover alfa grass steppe); as well as with diversity, plant richness, and topographic slope. The coverage estimated using a drone was strongly correlated with that obtained by vegetation sampling (R2 = 0.81). This estimate varied between cover classes, with the error rate being higher in low-cover shrublands, and lower in high-cover alfa grass steppe (normalized RMSE 33% vs. 9%). Diversity and slope did not affect the accuracy of the cover estimates, while errors were larger in plots with greater richness. These results suggest that in semi-arid environments, the drone might underestimate vegetation cover in low-cover shrublands.

1. Introduction

Vegetation cover, which can be defined as the percentage of ground area covered by green vegetation, is a widely used parameter to describe the amount of vegetation in a given area [1]. The estimation of this parameter is essential in the monitoring and management of arid and semi-arid regions [2,3], due, among other reasons, to its importance in key biophysical processes such as evaporation, transpiration, and photosynthesis [4]. Likewise, it is one of the parameters studied to evaluate vegetation recovery after disturbances, such as fires.
Estimates of vegetation cover have traditionally been obtained by classical vegetation sampling (e.g., plot surveys [5]) or classification of digital photographs [6,7,8]. Although these approaches are still used for monitoring vegetation, they have certain limitations. In particular, they are relatively subjective, time-consuming and labor-intensive, and thus seem unrealistic for carrying out accurate large-scale, medium- to long-term dynamic monitoring [9].
Rapid technological advances in remote sensing have enabled an increase in its application in numerous scientific disciplines related to natural resource assessment. In recent years, a wide variety of remote sensing satellites and sensors with different spatial, spectral, and temporal resolutions have been developed, providing high-quality spatial and temporal data at a range of scales [10]. Compared to traditional methods, remote sensing allows the estimation of vegetation condition over larger areas with greater accuracy and efficiency [11], optimizing the assessment of vegetation response to practices such as prescribed burning [12,13]. Given these advantages, numerous studies have used spectral indices derived from remote sensing to estimate vegetation cover [2,14,15,16,17]. Most remote sensing studies have included field validations, although some appear to be biased due to the differences in the scale of the field sampling vs. the pixel size of the information obtained from remote sensing [18].
Likewise, there has been a boom in the use of remotely piloted aircraft systems (RPAS) or drones in ecological, forestry, ecosystem restoration, and environmental resource assessment research (among other fields). This is mainly due to the fact that users can acquire large amounts of high spatial resolution data that allow detailed mapping of structural and functional attributes of vegetation [9,10,19,20,21]. As with remote sensing studies, the use of drones for vegetation cover estimation requires field validation.
This study assessed vegetation cover after prescribed burning, defined as the use of fire in a planned manner to reduce fuel load under appropriate environmental conditions [22,23], in semi-arid Mediterranean shrublands [24,25]. The aims of this study were: (i) to evaluate the accuracy of vegetation cover estimation by drone in semi-arid shrublands under different prescribed burning treatments; and (ii) to analyze the effect of type of vegetation, treatment type (prescribed burning and pyric herbivory), diversity, and slope on the estimation of vegetation cover.

2. Materials and Methods

2.1. Study Site

The study site is located on the north side of Sierra de los Filabres (Almería, Spain) (37°18′35.30″ N 2°36′9.67″ W) (Figure 1a), at 5.5 km and 3.5 km from the Special Conservation Areas of Calares de Sierra de los Filabres and Sierra de Baza, respectively, which are included in the Natura 2000 Network. The climate is semi-arid Mediterranean, with arid summers and cold dry winters. It is characterized by a mean annual temperature of 13.9 °C and mean annual precipitation of 444 mm. Plurennial droughts are relatively frequent and intense. The study area has steep topography (slopes ranging from 12% to 82%) with altitudes between 1170 and 1320 m, though maximum elevations in Sierra de los Filabres exceed 2100 m. The soils in the study area are classified as eutric cambisols, eutric regosols, and chromic luvisols with lithosols, mainly developed on schists and quartzites [26].
The vegetation in Sierra de los Filabres exhibits a pronounced altitudinal gradient, and it has been strongly shaped by human activities since Arab times (8th century) [27,28]. At the study site, potential vegetation includes mid-mountain basophyllous holm oaks (Quercus rotundifolia Lam.). Nonetheless, currently, due to mining, farming, and reforestation programs (between 1955 and 1983), the landscape is dominated by shrublands in a regressive phase and afforested stands of Pinus spp. The most common shrubland species are gorse (Genista scorpius (L.) DC.) and steppe grass (Macrochloa tenacissima (L.) Kunth), accompanied by other species such as Helichtotrichon filifolium (Lag.) Henrard, Bupleurum spinosum Gouan, Helianthemum almeriense Pau, Lavandula lanata Boiss, Salvia lavandulifolia Vahl Schleid subsp. Vellera (Cuatrec.) Rivas Goday & Rivas–Mart.), Teucrium capitatum L., and Hippocrepis bourgaei (Nyman) Hervier.

2.2. Experimental Design

Two management treatments were carried out in our study area (11.87 ha, see Table 1): prescribed burning (PB), and prescribed burning followed by grazing (i.e., pyric herbivory [23,25], PH) (Figure 1). The prescribed burns were carried out at two different times of year: autumn and spring (Table 1). After these burns, in the PH treatment, traditional grazing was carried out with a 300-head flock of sheep, whereas the PB zone was fenced to prevent livestock grazing. One of the goals of these experiments was to evaluate the role of livestock in wildfire prevention [29,30], since livestock may decrease fuel amounts, continuity, and height, and increase fuel moisture content [22,30,31].
For each treatment, a number of randomly distributed 500-m2 circular plots were selected: four for PB and eight for PH. Within each circular plot, eight 1-m2 subplots were established, seeking to capture the variability in vegetation cover in this shrublands (before the prescribed burns): low-, moderate- and high-cover shrublands, and high-cover alfa grass steppe. Vegetation sampling was carried out to estimate plant diversity, richness, and vegetation cover. After PB, vegetation monitoring was carried out every autumn and spring until 2021. Drone flights were also carried out over the 12 circular plots to estimate plant cover (Figure 1b).

2.3. Vegetation Monitoring

In each of the 96 subplots, the total plant and bare soil cover were recorded, as was the cover of each plant species. These data were used to determine species cover, species richness, and plant diversity, estimating the latter with the Shannon–Wiener index [32] as
H = p i log 2 p i  
where pi is the relative frequency of species i in each plot. We used guides to the flora of Spain and Portugal [33] and flora of eastern Andalusia [34] as references for taxonomical identification. Data from the vegetation surveys conducted in the spring of 2021 were selected for comparison with drone data.

2.4. Drone Flights and Image Processing

A total of six drone flights (three flights for RGB and three for multispectral sensors) were made on May 2021, with a multicopter DJI Matrice 210 RTK V2 (Da-Jiang Innovations, Shenzhen, China). Four of the 12 circular plots were covered in each flight. The flights followed a simple grid. To address the potential issues of scale heterogeneity due to low-altitude flights and steep terrain [35], and to obtain the most accurate information possible, the flight routes were planned using UgCS PRO software [36]. The flights were performed at an altitude of 30 m in the central hours of the day, when the sun’s rays strike nearly perpendicular to the terrain, minimizing shadows that distort the spectral information. For the planning and execution of the flights, a digital terrain model updated in 2020 (previously obtained from a low-resolution prospective drone photogrammetric flight) was incorporated into the flight planning software, enabling the same height of image acquisition with respect to the terrain and the same spatial resolution to be maintained across the study area. A total of 8900 visible and multispectral images were acquired. The longitudinal and transversal overlaps were 80% and 75%, respectively, with a 120-min total flight time at 4 m/s. At the time of flights, the sun elevation ranged from 57.6° to 72.9°.
Prior to the acquisition of flight images, 16 ground control points (GCPs) were installed in the study area for georeferencing. The imagery co-registration and georeferencing was undertaken based on the WGS84 (UTM zone 30 N) coordinates of sixteen GCPs scattered across the study area following the recommendations of Martínez-Carricondo et al. [37]. The three-dimensional (3D) coordinates of the GCPs were measured with very accurate equipment composed of a Trimble R6 receptor working in the post-processed kinematic (PPK) mode and a wayside base station.
For the acquisition of multispectral images, a Micasense RedEdge camera was used [38] which consists of a 5-band multispectral sensor (1.2 MP resolution): blue (475 nm), green (560 nm), red (668 nm), red edge (717 nm) and near infrared (842 nm); with a field of view of 47.2°. The spatial resolution for each spectral band was 2 cm. A Zenmuse X7 camera with a resolution of 24 MP and a spatial resolution of 0.7 cm was used to obtain RGB images [39].
Once the flights had been completed, the images were preprocessed and georeferenced, and radiometric corrections were applied. The images acquired in the flights were processed with PIX4D photogrammetry software [40] that allowed the creation of the orthomosaic and the digital surface model of the complex under study (RGB sensor) and the generation of the different reflectance bands (multispectral sensor). The quality of the resulting imagery was evaluated using the root mean square error (RMSE):
RMSE = i = 1 n y i y ^ i 2 n
Supervised spectral classification was used to distinguish the different elements present in the study area. We used a support vector machine (SVM) as a classifier since it yielded a better solution (lower misclassification rate, higher model accuracy and faster training time) than other methods tested, such as decision trees or isoclustering (data not shown). The SVM classifier can be used on segmented and raster layers, which makes it an efficient tool as it reduces the number of processing steps [41]. In addition, it allows load configurations that make it less prone to generating error due to noise, which is key in the detection of elements. This allowed us to discriminate between plant material and inert material, and to subsequently classify the different vegetation cover types. To evaluate the SVM, we used the Sorensen–Dice coefficient [42] calculated as:
Dice A , B = 2 A B A + B
where A and B represent the two datasets (binary images), and the cardinality. This similarity coefficient represents the degree of matching between two binary images.
The A B represents the number of pixels common to the two sets (imagery) obtained by automatic segmentation (the SVM algorithm) and manual segmentation (ground truth). The ground truth was obtained by manually segmenting RGB images of a smaller zone within the study area. Then, a multi-class Dice score, i.e., a mean value of the Dice coefficient was obtained for each class. On the other hand, an algorithm was generated to model the terrain from the clouds of millions of three-dimensional points generated by the photogrammetry software. In this way, raster files were generated with the information on the height, surface and phytovolume of each pixel of the study area previously classified as vegetation. From this point, the vectorization of the masks allowed extraction of the information on vegetation cover for each plot.

2.5. Statistical Analysis

First, we explored the correlation between the vegetation cover estimated from drone and that obtained from field measurements. The fit between the field measurement and the drone data was evaluated using the RMSE. We performed a regression analysis between the drone-based and field measurement-based cover estimates. Then, the predictive error sum of squares (PRESS) statistic was computed as:
P R E S S = i = 1 n y i y ^ i , i 2
where y ^ i , i is the fitted values of a model with the ith observation removed. The lower the PRESS statistic the better the predictive power of the model. We also computed the predictive R2 as:
R p r e d i c t i v e 2 = 1 P R E S S S S T
where SST is the total sum of squares:
S S T = i = 1 n y i y ¯ 2
where y ¯ is the mean of the response variable.
To explore the potential differences in the correlation between drone-based and field measurement-based estimates as a function of the vegetation cover in our study area before the prescribed burns, we used two approaches. On the one hand, we explored how the correlation between the two cover estimates varied for each of the cover types identified in our study area before the burns: low-, moderate- and high-cover shrublands, and high-cover alfa grass steppe. To make RMSE comparable between different cover types, the normalized root mean square error (NRMSE) was calculated as:
NRMSE   % = RMSE Max Min 100 %
where Max and Min were the maximum and minimum value respectively of the field measurement vegetation cover for each cover type considered. On the other hand, we used a classification and regression tree (CART) algorithm [43,44] to explore whether the correlation between the two approaches for the estimation of the vegetation cover (drone and field measurement) was homogeneous across all levels of cover, or there were groups which depended on the level of vegetation cover. With this approach, the data are partitioned along the predictor axes (in our case, the vegetation cover estimated by field surveys) into subsets with homogeneous values of the dependent variable (vegetation cover estimated by drone). To avoid overfitting, the final tree was pruned using a complexity parameter of 0.075 [45,46].
Additionally, to explore whether the correlation between drone- and field measurement-based estimates of the plant cover were affected by the treatments, we compared the NRMSE of the correlations for each group of subplots, i.e., subplots within PB areas and those within the PH area (see Figure 1).
Finally, we assessed how the correlation between the vegetation cover estimates based on drone and field measurements was influenced by other variables related to plant diversity (richness and Shannon–Wiener index), and topographic features (e.g., terrain slope). For this purpose, we explored the relationship between the residuals of the drone-field measurement correlation and each of the variables of interest (richness, diversity, and slope).
All analyses were performed with R software v. 4.0.2 [47]. We used the rpart package [45] for the CART analysis. A full list of all the packages used (generated with the grateful package [48]) is included in the Supplementary Materials.

3. Results

Following the geometric correction of the images using the GCPs, the RGB sensor-based images showed RMSE values of 0.018 m, 0.016 m and 0.022 in the x-, y- and z-directions, respectively. For the multispectral sensor, RMSE values obtained were 0.0045 m, 0.0062 m, and 0.041 m in the x-, y- and z-directions, respectively.
The average ground sampling distance (GSD) of the RGB images were 0.60 cm·pixel−1 and 1.97 cm·pixel−1 for the multispectral images. The classification of the training set yielded a multi-class Dice score of 0.86.
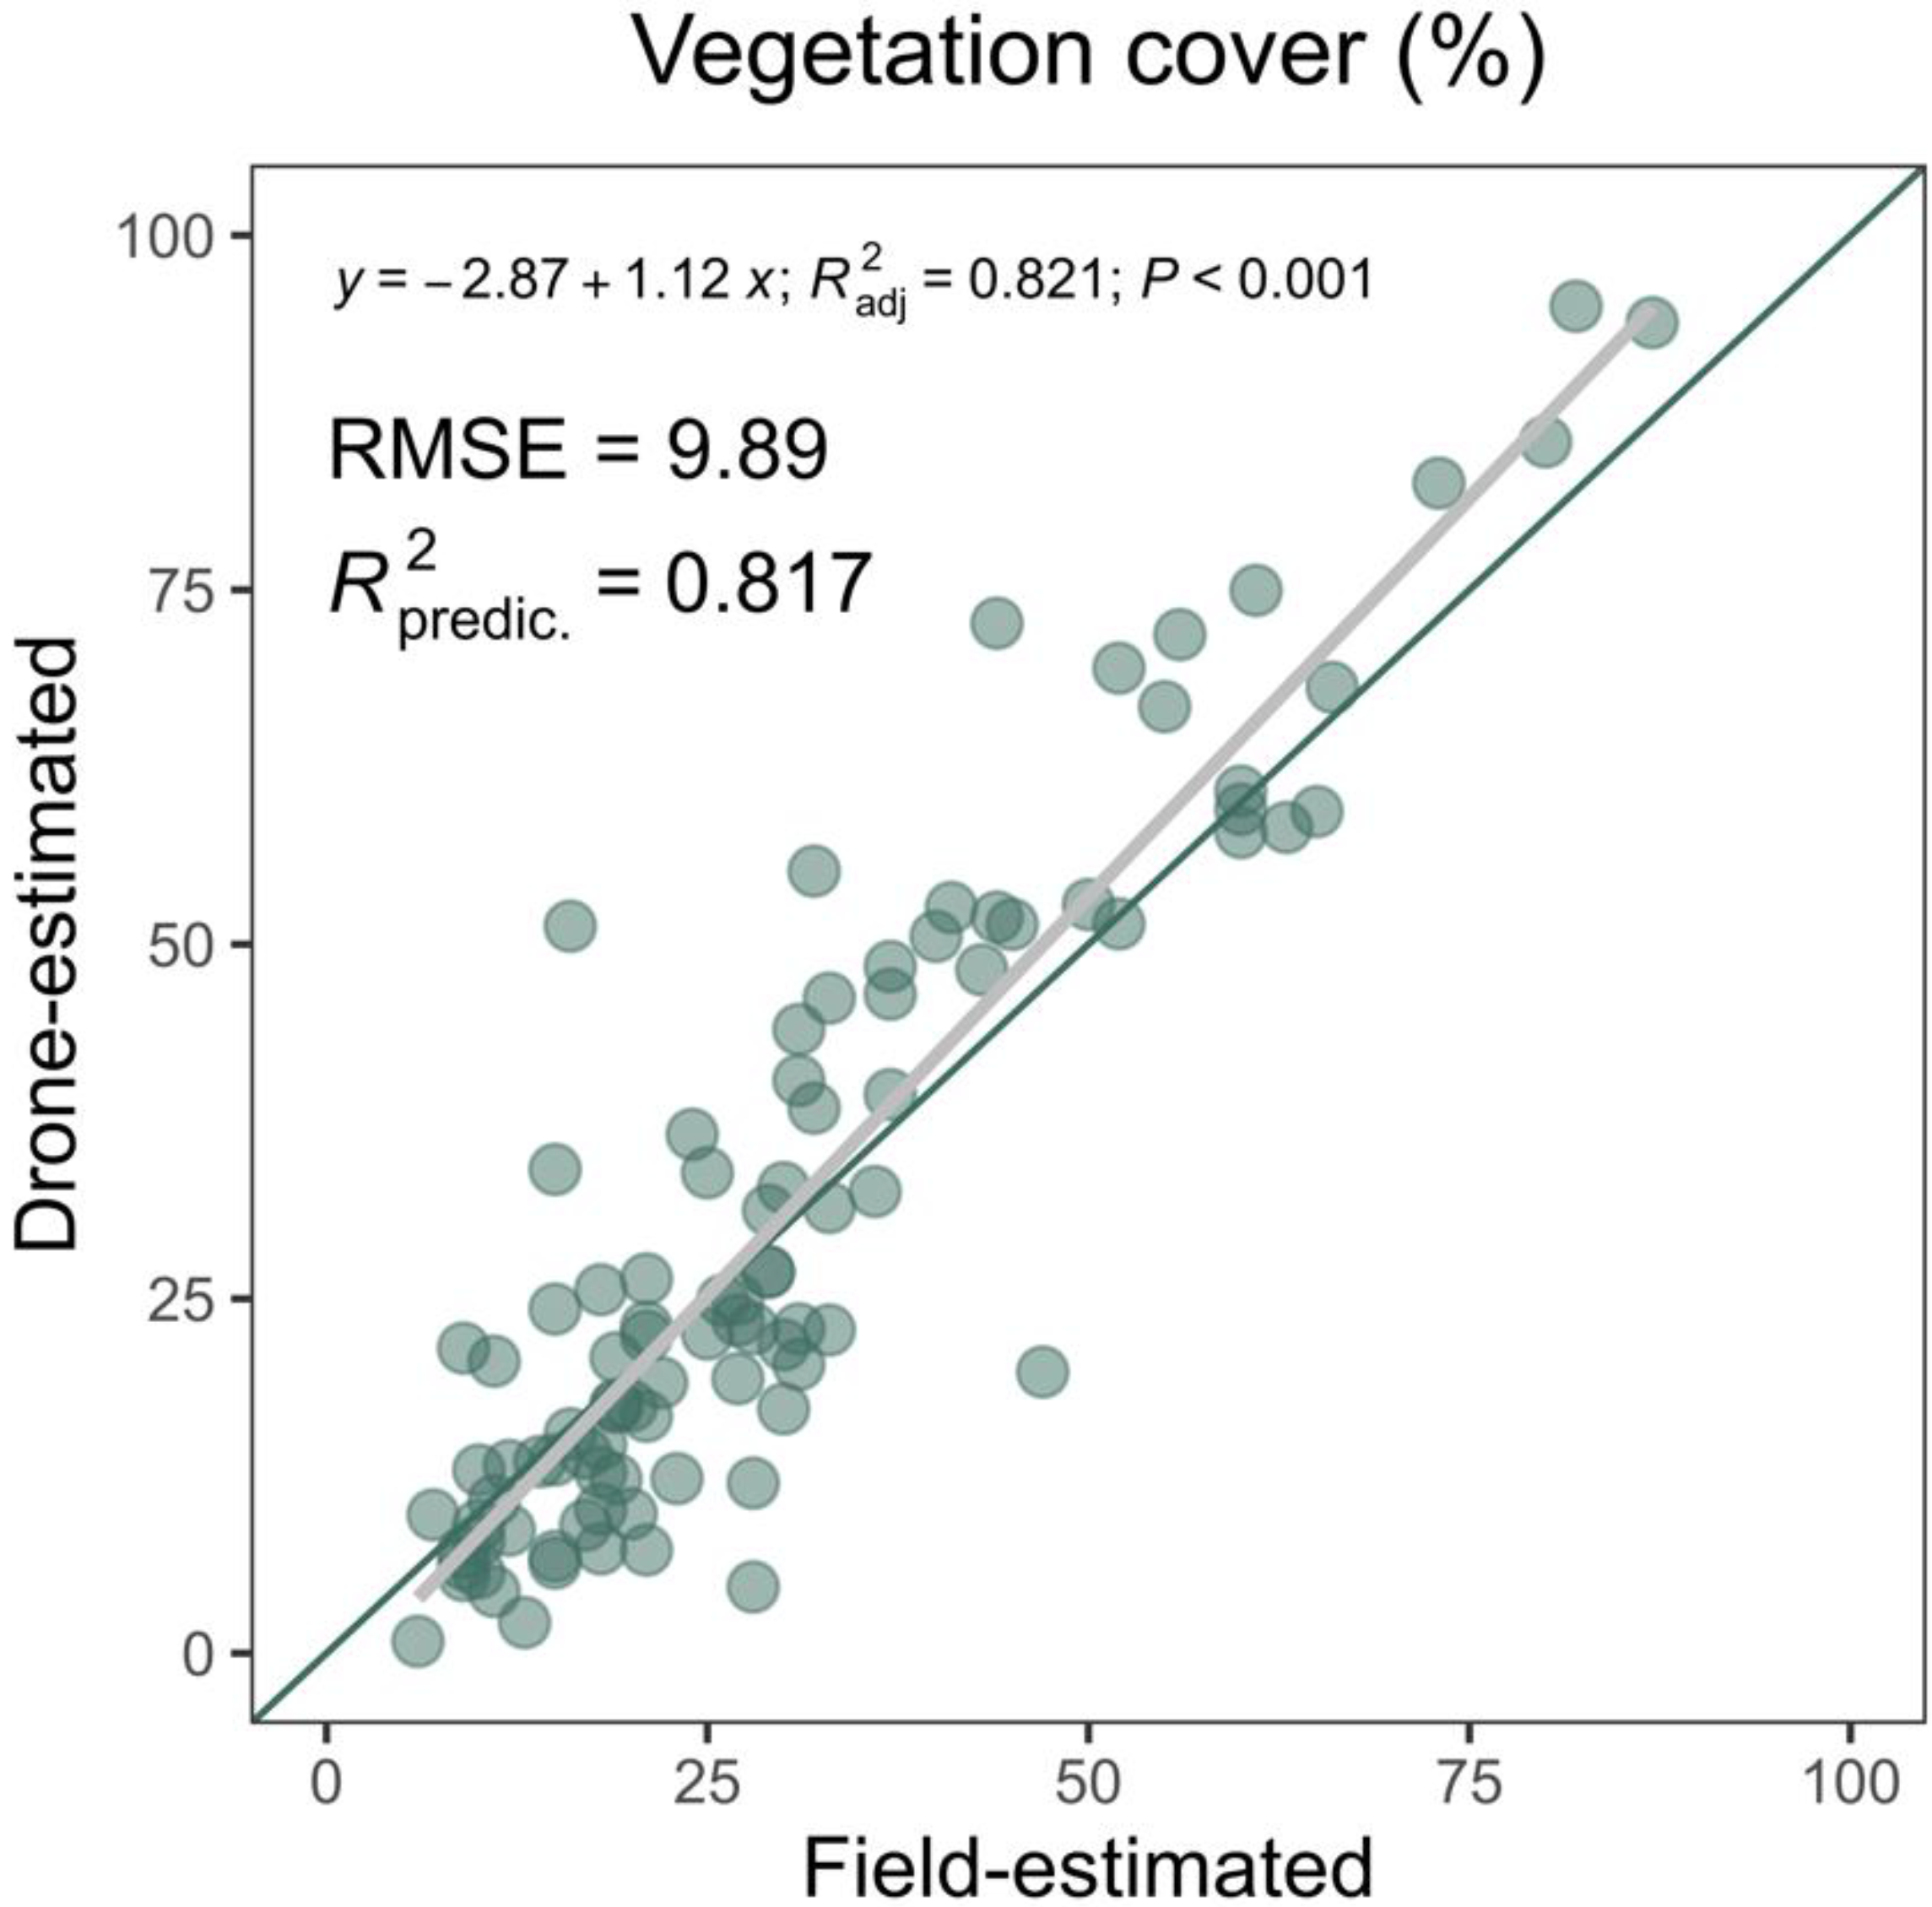
The vegetation cover estimated by drones was strongly correlated with that obtained by field surveys (R2adjusted = 0.821; R2predictive = 0.817; RMSE = 9.89%) (Figure 2). The linear relationship between the two metrics was significant (p-value < 0.0001).
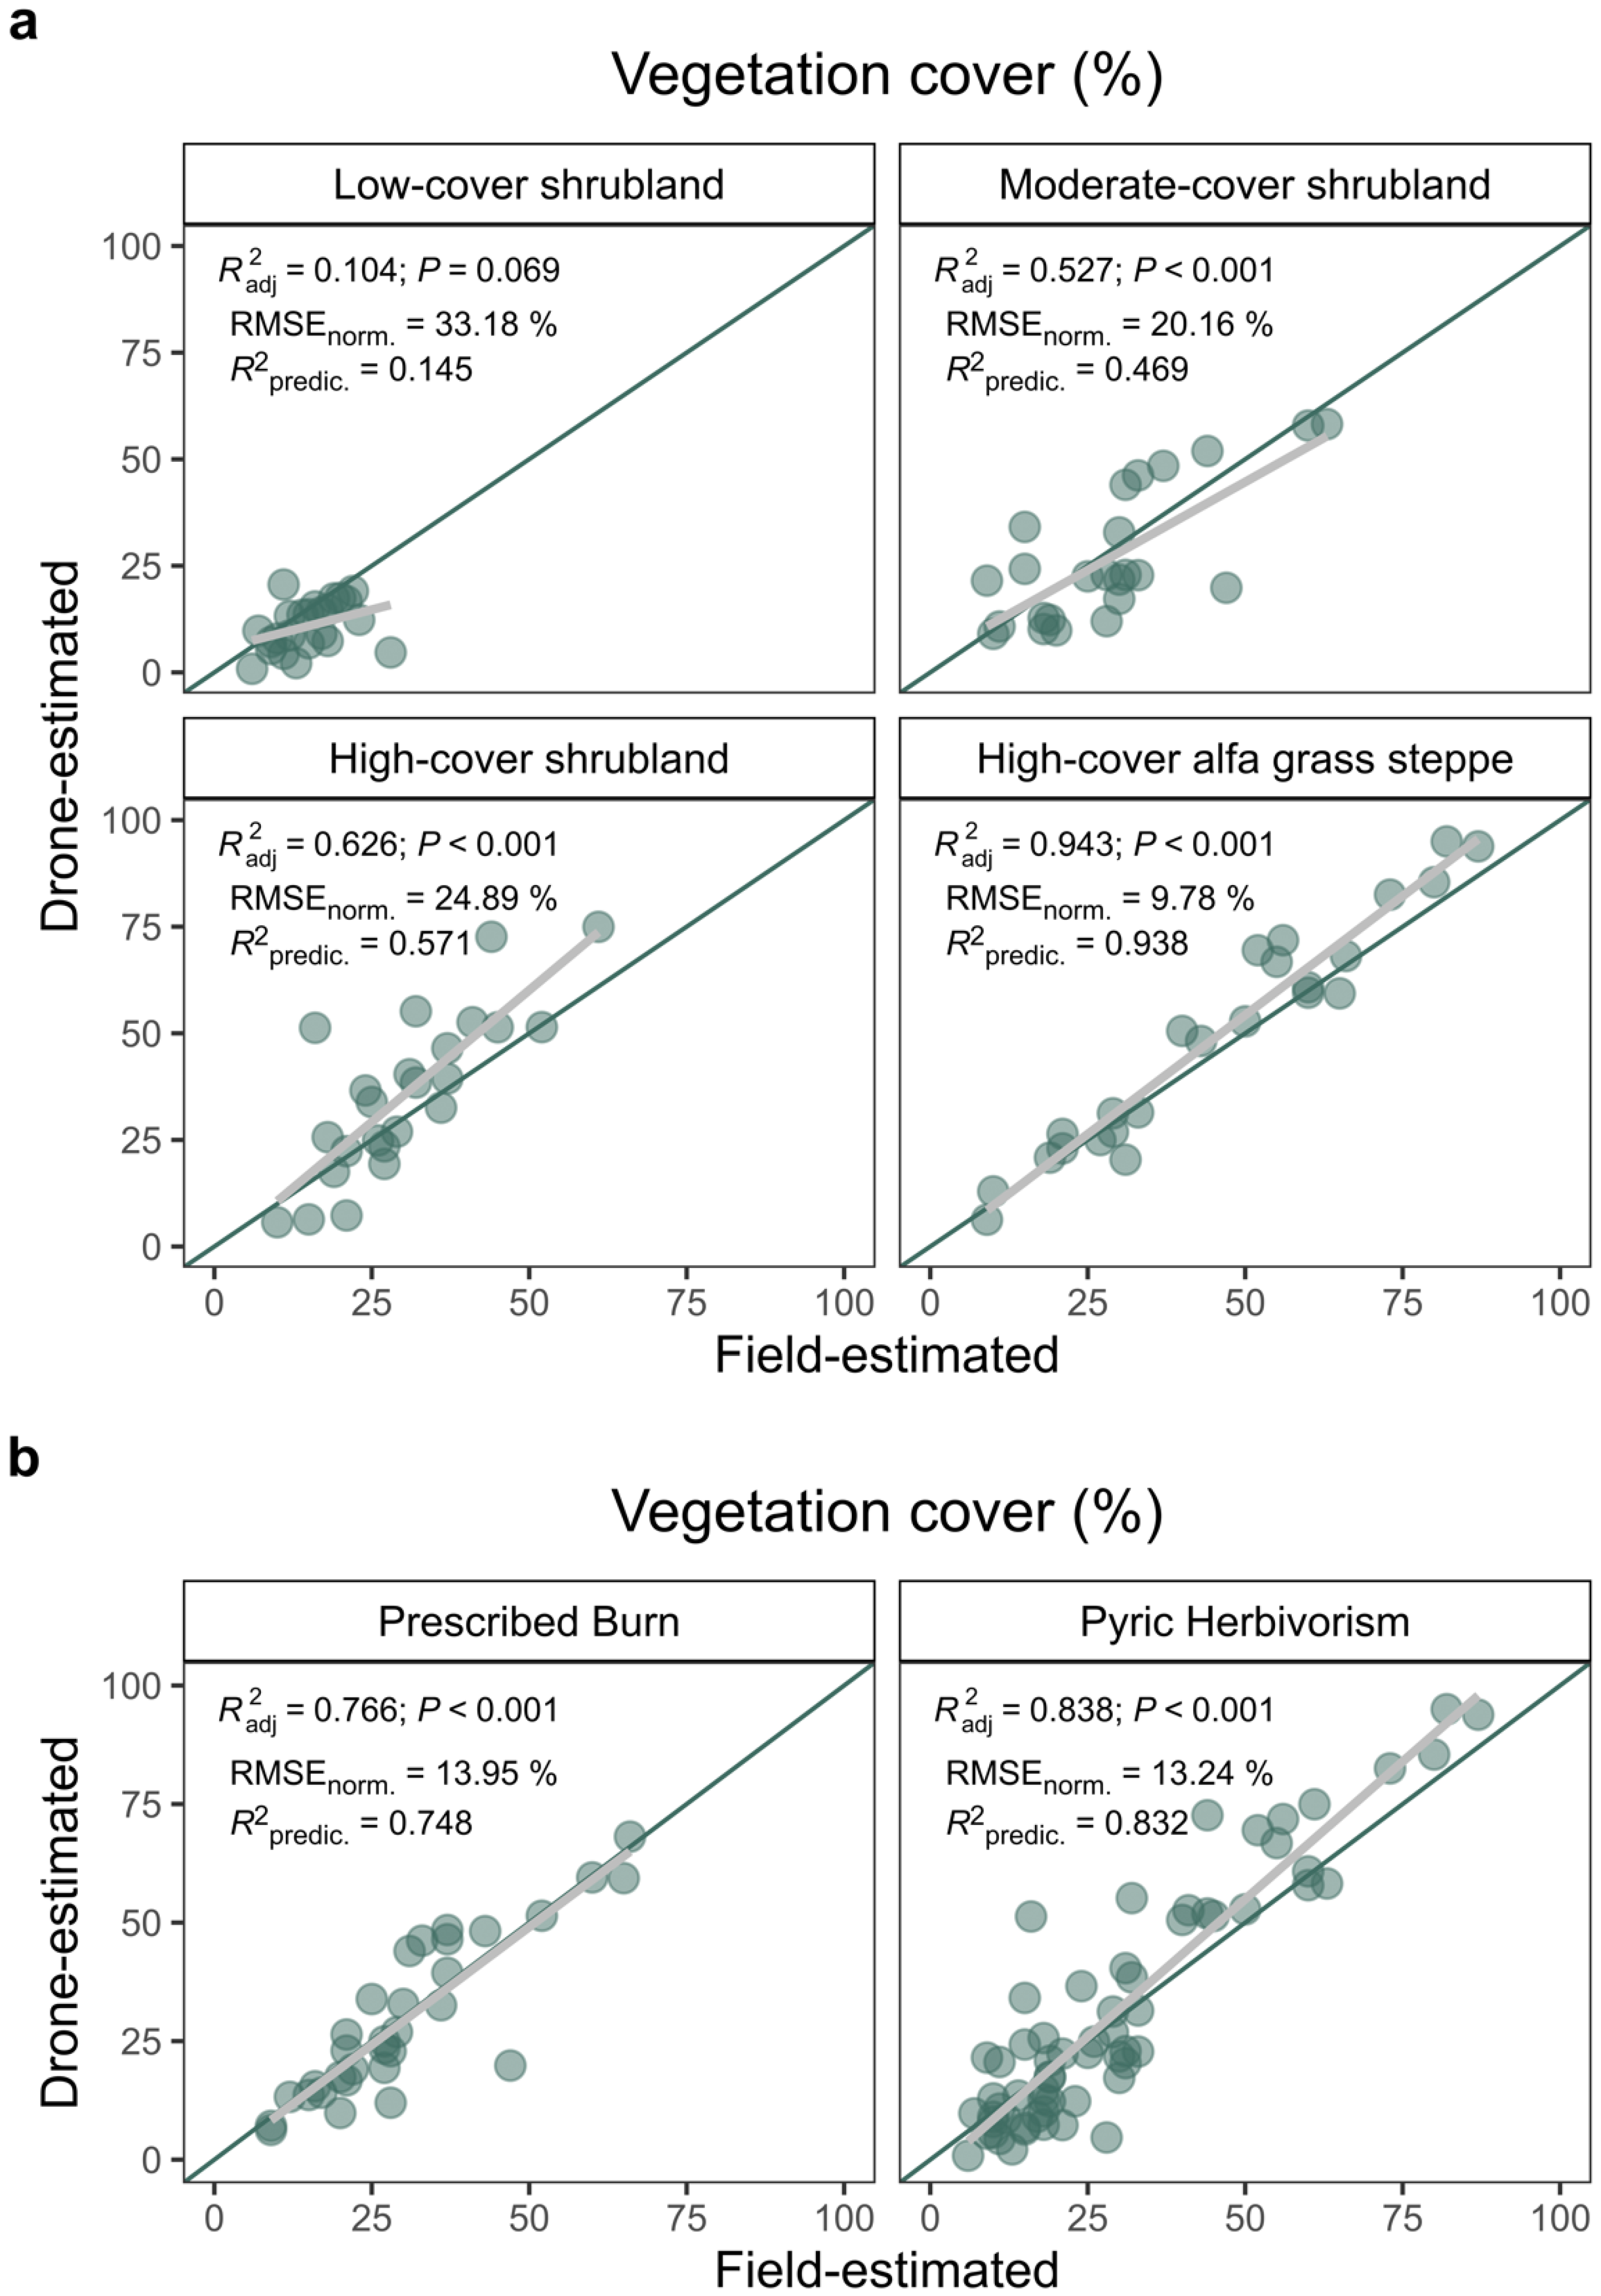
This relationship varied between the different vegetation cover classes, with NRMSE values ranging from 9.78 to 33.18% (Figure 3a). The high-cover alfa grass steppe showed the best fit between drone-based and field measurement-based estimates of vegetation cover (NRMSE = 9.78%; R2predictive = 0.938), while areas with lower cover (low shrublands) showed the highest NRMSE values (33.18%) and the lowest R2predictive (0.0145). No significant regression was also obtained for this vegetation cover type (p = 0.069; Figure 3a).
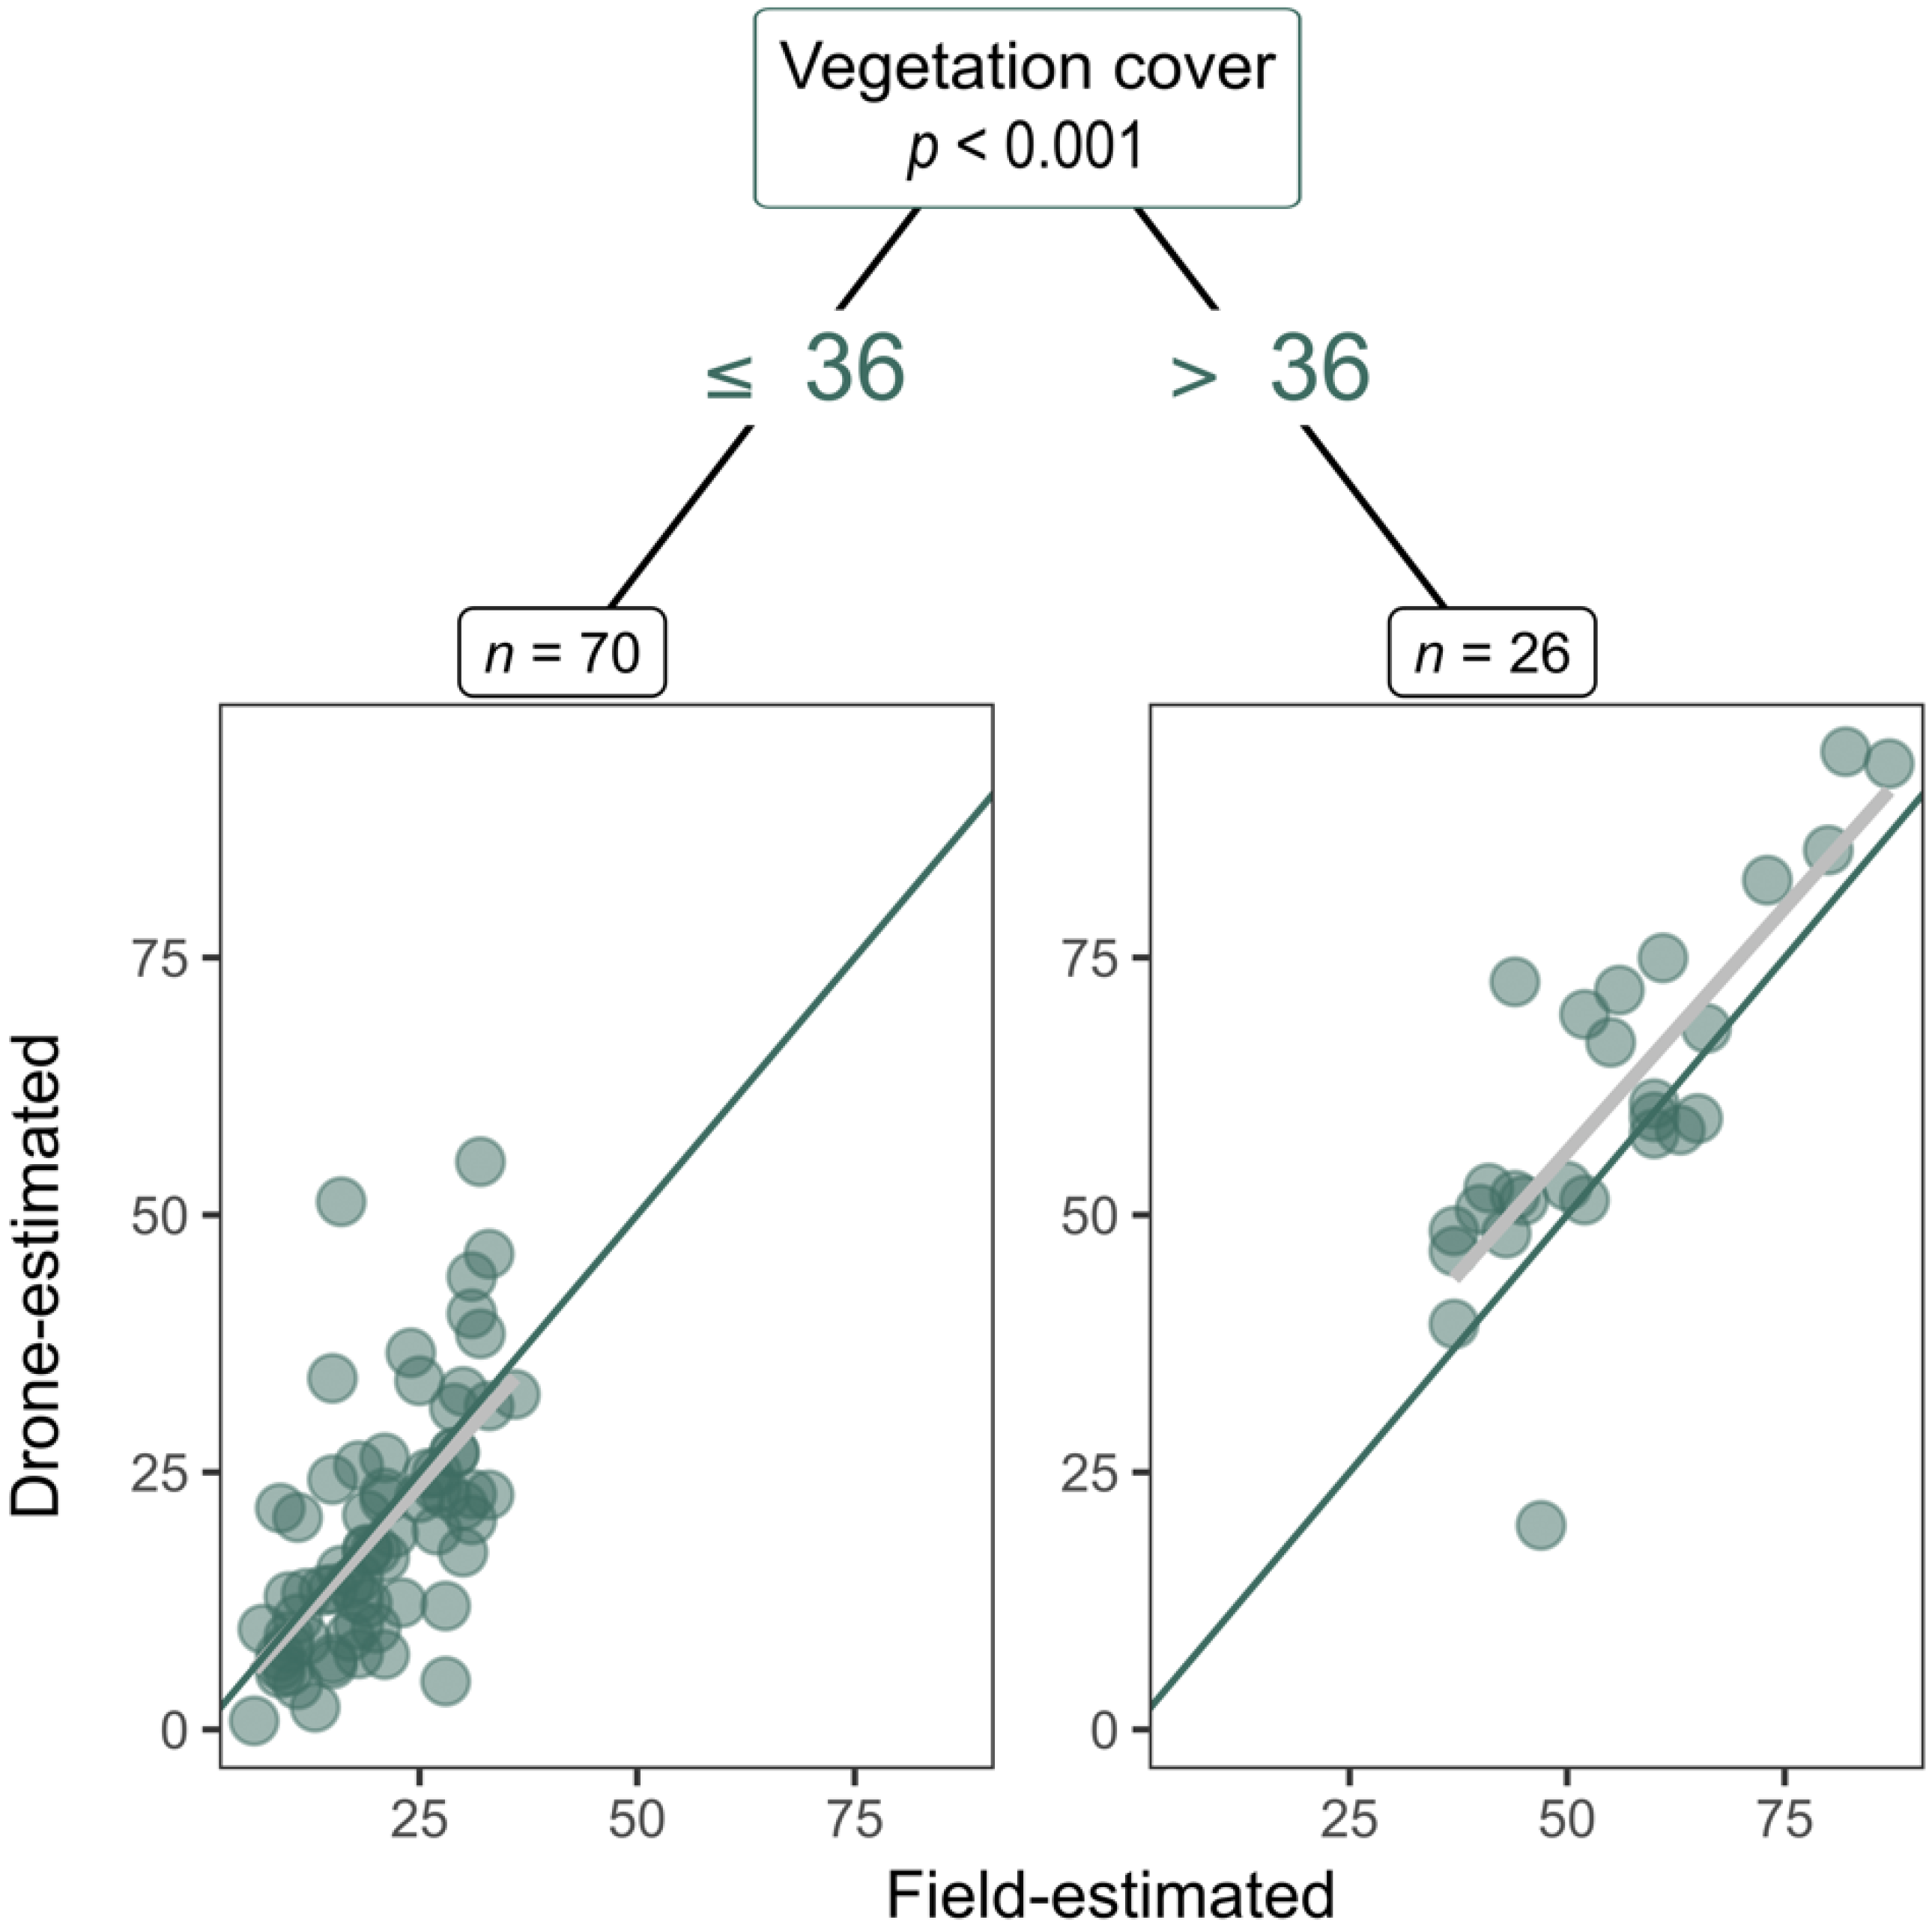
The results of the variance partitioning by vegetation cover in the field showed a split into two groups of data (Figure 4), with a cut-off threshold at 36% of vegetation cover. The NRMSE value for the lower vegetation cover group (i.e., subplots with less than 36% cover, see Figure 2) was higher (NRMSE = 30.68%) than that for the group with higher cover (more than 36%; NRMSE = 23.07%).
The comparison of the estimates for the PB treatment subplots with those for PH treatment subplots yielded very similar NRMSE results (Figure 3b).
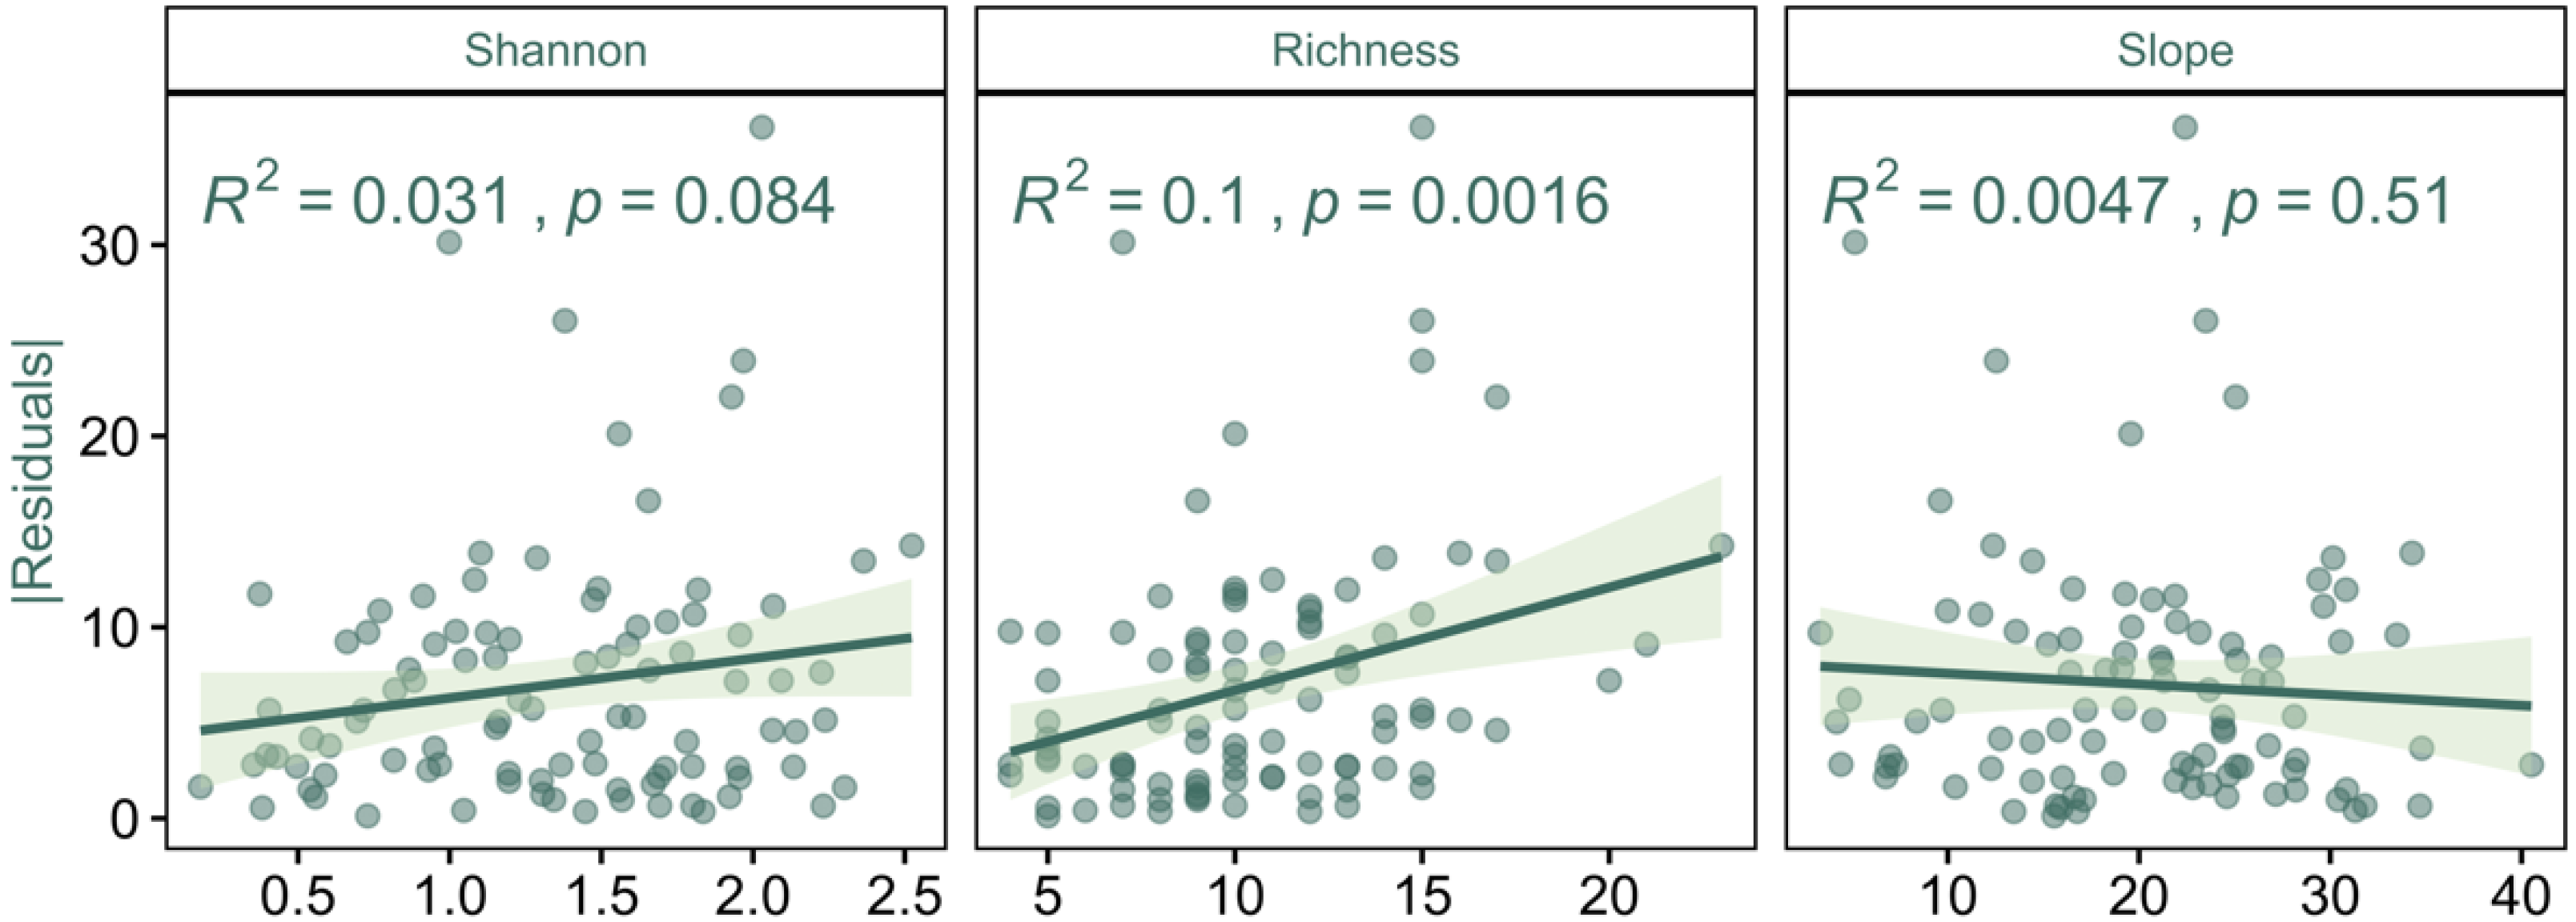
No significant pattern was observed in the residuals of the relationship between the drone-based and field-measurement-based estimates of vegetation cover with either terrain slope of the subplots or plant diversity index (Shannon–Wiener) (Figure 5). In contrast, we obtained a significant but very weak pattern for these residuals as a function of richness (p < 0.01) (Figure 5), with larger residuals for higher values of richness.

4. Discussion

Overall, the results of our study show a strong correlation (R2predictive = 0.817; RMSE = 9.89%, Figure 2) between vegetation cover values estimated from field measurements and those estimated from drone data. This finding is in line with those from studies in shrublands in other ecosystems [3,49,50,51], reinforcing the use of the drone method as a complementary, and less costly method of estimating the attributes of the vegetation, since it provides reasonably accurate measurement of vegetation structural attributes [21]. Nonetheless, caution should be exercised when using vegetation cover estimates from drone-derived data, since we observed how the accuracy of the estimates varied depending on the vegetation coverage (Figure 3b and Figure 4). The results of our two approaches, i.e., exploring the precision of the estimates as a function of vegetation cover types, and using a variance partitioning algorithm, suggest that the accuracy of the estimates is poorest for low vegetation cover (highest NRMSE values) (Figure 3a and Figure 4). Specifically, for low-cover shrubland, it seems that drones underestimate vegetation cover. This is probably due to very small and scattered plants being detected by visual assessment but not by drone sensors. Our results are in agreement with recent studies that indicate an overestimation of vegetation cover when using traditional methods versus drone methods, mainly explained by the presence of species which either have highly branched, diffuse canopies with highly reduced leaves or have high overlaps between individuals, thus disproportionately increasing ground-based area totals relative to UAV-based area measures [52].
The positive relationship of the estimate residuals with richness seems to indicate that estimates vary more and are less accurate in subplots with higher species richness (Figure 5). Therefore, and according to our results, in these semi-arid environments, the estimation of vegetation cover with drones underestimates the real level in low-cover shrublands, which coincide with the areas containing the greatest number of species. This result is in line with recent findings indicating the unfavorable use of drones in the detection of ultra-fine scale demographics changes and species-level detail [52]. However, in semiarid shrublands, the areas with very low cover (<25%) are key because they have low fuel loads and high plant richness, which are of great importance due to their roles in nutrient cycling, water retention, and as seed sources after a fire [53,54].
Regardless of our general good correlation between vegetation cover estimated by drones and that obtained by field measurements, caution is required when sampling larger areas. In our study, we flew at an altitude of 30 m above ground level, and the survey was carried out on 12 plots of 500 m2. However, larger areas would require the use of drones covering larger areas, more flights, or flights at higher altitudes, with the associated image resolution loss. Breckenridge et al. [49], in a comparison study of different RPAS vehicles to estimate vegetation cover, found that fixed-wing drone allowed the assessment of larger areas, but when high-detail data were required, multicopter vehicles performed better than fixed-wing drone. The flight altitude determined the flight distance, the flight duration, the size of images generated, and the computer processing time [55]. Some studies have evaluated how drone flight height affects the estimation of vegetation parameters such us forest biomass [56] or forage mass [57]. Others assessed how the estimation of vegetation cover varied using several flight altitudes in steppe ecosystems using a fixed-wing drone [49]. DiMaggio et al. [57] did not find large differences in forage mass estimates when using different flight altitudes, but they did not include wood plants in their assessment. Therefore, an interesting question for semi-arid mountain shrublands is to determine how the estimation of vegetation cover varies as a function of flight altitude, and then establishing the optimum flight altitude for collecting data using RPAS multicopter. Other studies have proposed a multiple-scale approach combining field data with drone data, and then scaling up with satellite information to estimate the fractional cover of vegetation over large areas [50,58,59]. Those approximations have been successfully applied in the estimation of the cover of some invasive species [50,58], or in the estimation of vegetation cover in tundra areas [59]; however, testing the approaches in low-cover but high-richness species areas, such as those in our study ecosystems, would be of interest.
Drone imagery has been promoted as an alternative to replace arduous and costly field work in remote areas and in adverse weather conditions; however, for this to be possible, there must be a high concordance between results from field data and those obtained with drones [3]. In light of our results, it would be interesting to adapt the cover estimation method (drone-based vs. field measurement-based) to management objectives, and the types of shrubland in our study area. For instance, the potential use of drones to detect vegetation changes in early postfire shrubland communities has recently been highlighted [52]. Thus, if the aim is to analyze cover in high-cover shrublands, drones may be useful. However, if the aims are focused on monitoring changes in cover in areas with high species richness, drone methods should be complemented by field estimation methods. Our results also suggest that, in addition to the potential problems related to variations in lighting conditions between flights or shadow related issues [60], it is important to consider cover type and the scale to be monitored, particularly in semi-arid environments where high spatial heterogeneity exists. In this sense, some studies have shown good agreement between field and drone measurements, both for the estimation of vegetation cover and for the estimation of bare ground [49], the biological importance of which is crucial in semi-arid environments. Likewise, to evaluate the effect of a prescribed burn, it may be interesting to see how reliable drones are in estimating bare ground, since after a disturbance such as prescribed burns, an increase in the percentage of bare ground is expected. Provided that we are aware of their possible limitations, multispectral images obtained with drones can play a key and complementary role in vegetation monitoring, as some studies have indicated [3,20], particularly in areas with high heterogeneity, such as semi-arid shrublands.

Supplementary Materials

All codes used are deposited at https://serpam.github.io/rpasveg_alcontar/, accessed on 29 September 2022.

Author Contributions

Conceptualization: A.J.P.-L., M.E.R.-F., M.J.T.B. and A.B.R.C.; Data curation: A.J.P.-L., M.J.T.B., C.T.P. and G.C.R. Formal analysis: A.J.P.-L.; Funding acquisition: A.B.R.C. Investigation: A.J.P.-L., M.E.R.-F., M.J.T.B. and A.B.R.C. Methodology: A.J.P.-L., M.E.R.-F., M.J.T.B., C.T.P., G.C.R. and A.B.R.C. Project administration: A.B.R.C. Resources: A.B.R.C. Supervision: A.B.R.C. Validation: A.J.P.-L., M.J.T.B., C.T.P. and G.C.R. Visualization: A.J.P.-L. Writing—original draft: A.J.P.-L. Writing—review & editing: A.J.P.-L., M.E.R.-F., M.J.T.B., A.B.R.C. and C.T.P. All authors have read and agreed to the published version of the manuscript.

Funding

This research was funded by Interreg Sudoe Programme, European Regional Development Fund, European-Union, grant number SOE2/P5/E0804; by MICINN through European Regional Development Fund (SUMHAL, LIFEWATCH-2019-09-CSIC-13, POPE 2014-2020); and by Ministry of Science and Innovation (MCIN/AEI/10.13039/501100011033) grant number PID2020-116786RB-C32.

Institutional Review Board Statement

Not applicable.

Informed Consent Statement

Not applicable.

Data Availability Statement

The data used in this work have been properly documented and uploaded to Figshare https://doi.org/10.6084/m9.figshare.21207836 (accessed on 29 September 2022).

Acknowledgments

This work has been developed in the framework of the Open2preserve project (SOE2/P5/E0804) funded by the Interreg Sudoe Program. It has also received funding from MICINN through the European Regional Development Fund [SUMHAL, LIFEWATCH-2019-09-CSIC-13, POPE 2014-2020]; and from Pyriclabs project (PID2020-116786RB-C32) funded by MCIN/AEI/10.13039/501100011033. We would like to thank to A. Rubio Loscertales, M. Martínez (SpectralGeo), and D. Romero Hinojosa (Air Granada) for help with the flights. We also thanks to the shepherd A. Blánquez for his very important role; and to personnel of the Consejería de Medio Ambiente y Ordenación del Territorio de la Junta de Andalucía for their help with the prescribed burns. A.J.P.-L. is grateful for the invaluable support received from his family over the years.

Conflicts of Interest

The authors declare no conflict of interest.

References

  1. Chen, W.; Sakai, T.; Moriya, K.; Koyama, L.; Cao, C. Estimation of Vegetation Coverage in Semi-Arid Sandy Land Based on Multivariate Statistical Modeling Using Remote Sensing Data. Environ. Model. Assess. 2013, 18, 547–558. [Google Scholar] [CrossRef]
  2. Zhang, S.; Chen, H.; Fu, Y.; Niu, H.; Yang, Y.; Zhang, B. Fractional Vegetation Cover Estimation of Different Vegetation Types in the Qaidam Basin. Sustainability 2019, 11, 864. [Google Scholar] [CrossRef] [Green Version]
  3. Zhang, J.; Okin, G.S.; Zhou, B.; Karl, J.W. UAV-derived Imagery for Vegetation Structure Estimation in Rangelands: Validation and Application. Ecosphere 2021, 12, e03830. [Google Scholar] [CrossRef]
  4. Gaitán, J.J.; Oliva, G.E.; Bran, D.E.; Maestre, F.T.; Aguiar, M.R.; Jobbágy, E.G.; Buono, G.G.; Ferrante, D.; Nakamatsu, V.B.; Ciari, G.; et al. Vegetation Structure Is as Important as Climate for Explaining Ecosystem Function across Patagonian Rangelands. J. Ecol. 2014, 102, 1419–1428. [Google Scholar] [CrossRef] [Green Version]
  5. Elzinga, C.L.; Salzer, D.W.; Willoughby, J.W.; Gibbs, J.P. (Eds.) Monitoring Plant and Animal Populations; Wiley-Blackwell: Great Britain, UK, 2001; ISBN 978-0-632-04442-9. [Google Scholar]
  6. Chen, Z.; Chen, W.; Leblance, S.G.; Henry, G.H.R. Digital Photograph Analysis for Measuring Percent Plant Cover in the Arctic. Arctic 2010, 63, 315–326. [Google Scholar] [CrossRef] [Green Version]
  7. Louhaichi, M.; Hassan, S.; Clifton, K.; Johnson, D.E. A Reliable and Non-Destructive Method for Estimating Forage Shrub Cover and Biomass in Arid Environments Using Digital Vegetation Charting Technique. Agroforest. Syst. 2018, 92, 1341–1352. [Google Scholar] [CrossRef] [Green Version]
  8. Luscier, J.D.; Thompson, W.L.; Wilson, J.M.; Gorham, B.E.; Dragut, L.D. Using Digital Photographs and Object-Based Image Analysis to Estimate Percent Ground Cover in Vegetation Plots. Front. Ecol. Environ. 2006, 4, 408–413. [Google Scholar] [CrossRef] [Green Version]
  9. Chen, W.; Zhao, J.; Cao, C.; Tian, H. Shrub Biomass Estimation in Semi-Arid Sandland Ecosystem Based on Remote Sensing Technology. Glob. Ecol. Conserv. 2018, 16, e00479. [Google Scholar] [CrossRef]
  10. Assmann, J.J.; Kerby, J.T.; Cunliffe, A.M.; Myers-Smith, I.H. Vegetation Monitoring Using Multispectral Sensors—Best Practices and Lessons Learned from High Latitudes. J. Unmanned Veh. Sys. 2019, 7, 54–75. [Google Scholar] [CrossRef] [Green Version]
  11. Stojanova, D.; Panov, P.; Gjorgjioski, V.; Kobler, A.; Džeroski, S. Estimating Vegetation Height and Canopy Cover from Remotely Sensed Data with Machine Learning. Ecol. Inform. 2010, 5, 256–266. [Google Scholar] [CrossRef]
  12. Chuvieco, E.; Mouillot, F.; van der Werf, G.R.; San Miguel, J.; Tanase, M.; Koutsias, N.; García, M.; Yebra, M.; Padilla, M.; Gitas, I.; et al. Historical Background and Current Developments for Mapping Burned Area from Satellite Earth Observation. Remote Sens. Environ. 2019, 225, 45–64. [Google Scholar] [CrossRef]
  13. Huang, R.; Zhang, X.; Chan, D.; Kondragunta, S.; Russell, A.G.; Odman, M.T. Burned Area Comparisons Between Prescribed Burning Permits in Southeastern United States and Two Satellite-Derived Products. J. Geophys. Res. Atmos. 2018, 123, 4746–4757. [Google Scholar] [CrossRef]
  14. Amiri, F. Using Remote Sensing Data for Vegetation Cover Assessment in Semi-Arid Rangeland of Center Province of Iran. World Appl. Sci. J. 2010, 10, 1537–1546. [Google Scholar]
  15. Jia, K.; Li, Y.; Liang, S.; Wei, X.; Yao, Y. Combining Estimation of Green Vegetation Fraction in an Arid Region from Landsat 7 ETM+ Data. Remote Sens. 2017, 9, 1121. [Google Scholar] [CrossRef] [Green Version]
  16. Jiapaer, G.; Chen, X.; Bao, A. A Comparison of Methods for Estimating Fractional Vegetation Cover in Arid Regions. Agric. For. Meteorol. 2011, 151, 1698–1710. [Google Scholar] [CrossRef]
  17. Purevdorj, T.; Tateishi, R.; Ishiyama, T.; Honda, Y. Relationships between Percent Vegetation Cover and Vegetation Indices. Int. J. Remote Sens. 1998, 19, 3519–3535. [Google Scholar] [CrossRef]
  18. Zhang, X.; Yan, G.; Li, Q.; Li, Z.-L.; Wan, H.; Guo, Z. Evaluating the Fraction of Vegetation Cover Based on NDVI Spatial Scale Correction Model. Int. J. Remote Sens. 2006, 27, 5359–5372. [Google Scholar] [CrossRef]
  19. Blanco-Sacristán, J.; Panigada, C.; Gentili, R.; Tagliabue, G.; Garzonio, R.; Martín, M.P.; Ladrón de Guevara, M.; Colombo, R.; Dowling, T.P.F.; Rossini, M. UAV RGB, Thermal Infrared and Multispectral Imagery Used to Investigate the Control of Terrain on the Spatial Distribution of Dryland Biocrust. Earth Surf. Process. Landf. 2021, 46, 2466–2484. [Google Scholar] [CrossRef]
  20. Díaz-Delgado, R.; Mücher, S. Editorial of Special Issue “Drones for Biodiversity Conservation and Ecological Monitoring”. Drones 2019, 3, 47. [Google Scholar] [CrossRef] [Green Version]
  21. Gonzalez Musso, R.F.; Oddi, F.J.; Goldenberg, M.G.; Garibaldi, L.A. Applying Unmanned Aerial Vehicles (UAVs) to Map Shrubland Structural Attributes in Northern Patagonia, Argentina. Can. J. For. Res. 2020, 50, 615–623. [Google Scholar] [CrossRef]
  22. Fernandes, P.M.; Davies, G.M.; Ascoli, D.; Fernández, C.; Moreira, F.; Rigolot, E.; Stoof, C.R.; Vega, J.A.; Molina, D. Prescribed Burning in Southern Europe: Developing Fire Management in a Dynamic Landscape. Front. Ecol. Environ. 2013, 11, e4–e14. [Google Scholar] [CrossRef]
  23. Fuhlendorf, S.D.; Engle, D.M.; Kerby, J.; Hamilton, R. Pyric Herbivory: Rewilding Landscapes through the Recoupling of Fire and Grazing. Conserv. Biol. 2009, 23, 588–598. [Google Scholar] [CrossRef] [PubMed]
  24. Pausas, J.G.; Llovet, J.; Rodrigo, A.; Vallejo, R. Are Wildfires a Disaster in the Mediterranean Basin?—A Review. Int. J. Wildland Fire 2008, 17, 713. [Google Scholar] [CrossRef] [Green Version]
  25. Fuhlendorf, S.D.; Limb, R.F.; Engle, D.M.; Miller, R.F. Assessment of Prescribed Fire as a Conservation Practice. In Conservation Benefits of Rangeland Practices: Assessment, Recommendations, and Knowledge Gaps; Briske, D.D., Ed.; United States Department of Agriculture, Natural Resources Conservation Service: Washington, DC, USA, 2011. [Google Scholar]
  26. Aguilar Ruiz, J.; Simón Torres, M.; Fernández García, J.; García Fernández, I.; Milán Martin, J. Proyecto LUCDEME. Mapa de Suelos. Escala 1:100.000. FIÑANA-1012; Ministerio de Agricultura, Pesca y Alimentación, ICONA, Universidad de Granada: Granada, Spain, 1987. [Google Scholar]
  27. Navarro Cerrillo, R.M.; Carreras Egaña, C. Los Territorios Del Agua: Sierra de Filabres. In El agua Domesticada: Los Paisajes de los Regadíos de Montaña en Andalucía; Guzmán Álvarez, J.R., Navarro Cerrillo, R.M., Eds.; Agencia Andaluza del Agua. Junta de Andalucía: Sevilla, Spain, 2010; pp. 385–401. ISBN 978-84-92807-48-2. [Google Scholar]
  28. Peñas, J.; Cabello, J.; Oyonarte, C.; Mota, J.F. Variación Altitudinal y Diversidad Vegetal En Matorrales: Sierra de Los Filabres (Almería, España). ABM 1995, 20, 133–142. [Google Scholar] [CrossRef]
  29. Canals, R.M.; Múgica, L.; San Emeterio, L.; Sarries Martínez, M.; Sáez Istillart, J.L.; Echeverria Echavarren, L.; Lizarza, J.; Uharte, O.; Yaben, A.; Pérez de Muniaín, A. Open2Preserve: Preservación de Espacios Abiertos de Montaña. Navar. Agrícola 2018, 231, 30–32. [Google Scholar]
  30. Canals, R.M. Landscape in Motion: Revisiting the Role of Key Disturbances in the Preservation of Mountain Ecosystems. CIG 2019, 45, 515. [Google Scholar] [CrossRef] [Green Version]
  31. Davies, K.W.; Wollstein, K.; Dragt, B.; O’Connor, C. Grazing Management to Reduce Wildfire Risk in Invasive Annual Grass Prone Sagebrush Communities. Rangelands 2022, 44, 194–199. [Google Scholar] [CrossRef]
  32. Krebs, C.J. Ecological Methodology, 2nd ed.; Benjamin/Cummings: Menlo Park, CA, USA, 1999; ISBN 978-0-321-02173-1. [Google Scholar]
  33. Castroviejo, S. (Ed.) Flora Ibérica; Real Jardín Botánico, CSIC: Madrid, Spain, 1986; Volumes 1–8, 10–15, 17–18, 21. [Google Scholar]
  34. Blanca, G.; Cabezudo, B.; Cueto, M.; Salazar, C.; Morales-Torres, C. Flora Vascular de Andalucía Oriental; Universidades de Almería: Granada, Spain; Jaén y Málaga: Granada, Spain, 2011. [Google Scholar]
  35. Carvajal-Ramírez, F.; Serrano, J.M.P.R.; Agüera-Vega, F.; Martínez-Carricondo, P. A Comparative Analysis of Phytovolume Estimation Methods Based on UAV-Photogrammetry and Multispectral Imagery in a Mediterranean Forest. Remote Sens. 2019, 11, 2579. [Google Scholar] [CrossRef] [Green Version]
  36. Ground Station Software | UgCS PC Mission Planning. Available online: https://www.ugcs.com/ (accessed on 20 September 2022).
  37. Martínez-Carricondo, P.; Agüera-Vega, F.; Carvajal-Ramírez, F.; Mesas-Carrascosa, F.-J.; García-Ferrer, A.; Pérez-Porras, F.-J. Assessment of UAV-Photogrammetric Mapping Accuracy Based on Variation of Ground Control Points. Int. J. Appl. Earth Obs. Geoinf. 2018, 72, 1–10. [Google Scholar] [CrossRef]
  38. Micasense RedEdge-MX—MicaSense. Available online: https://ageagle.com/drone-sensors/rededge-p (accessed on 20 September 2022).
  39. DJI Zenmuse X7. Available online: https://www.dji.com/es/zenmuse-x7 (accessed on 20 September 2022).
  40. PIX4D. Available online: www.pix4d.com (accessed on 20 September 2022).
  41. Ben-Hur, A.; Horn, D.; Siegelmann, H.T.; Vapnik, V. Support Vector Clustering. J. Mach. Learn. Res. 2002, 2, 125–137. [Google Scholar] [CrossRef]
  42. Dice, L.R. Measures of the Amount of Ecologic Association Between Species. Ecology 1945, 26, 297–302. [Google Scholar] [CrossRef]
  43. Breiman, L.; Friedman, J.H.; Olshen, R.A.; Stone, C.J. Classification and Regression Trees, 1st ed.; Chapman and Hall/CRC: Boca Raton, FL, USA; London, UK; New York, NY, USA, 1984; ISBN 978-1-315-13947-0. [Google Scholar]
  44. Zhang, H.; Singer, B.H. Recursive Partitioning and Applications; Springer Series in Statistics; Springer: New York, NY, USA, 2010; ISBN 978-1-4419-6823-4. [Google Scholar]
  45. Therneau, T.; Atkinson, B. Rpart: Recursive Partitioning and Regression Trees, R package version 4.1.16; 2022. Available online: https://CRAN.R-project.org/package=rpart (accessed on 20 September 2022).
  46. Bertsimas, D.; Dunn, J. Optimal Classification Trees. Mach. Learn. 2017, 106, 1039–1082. [Google Scholar] [CrossRef]
  47. R Core Team. R: A Language and Environment for Statistical Computing; R Foundation for Statistical Computing: Vienna, Austria, 2020. [Google Scholar]
  48. Rodríguez-Sánchez, F.; Jackson, C.P.; Hutchins, S.D. Grateful: Facilitate Citation of R Packages, R package version 0.1.5; 2022. Available online: https://github.com/Pakillo/grateful (accessed on 20 September 2022).
  49. Breckenridge, R.P.; Dakins, M.; Bunting, S.; Harbour, J.L.; White, S. Comparison of Unmanned Aerial Vehicle Platforms for Assessing Vegetation Cover in Sagebrush Steppe Ecosystems. Rangel. Ecol. Manag. 2011, 64, 521–532. [Google Scholar] [CrossRef]
  50. Gränzig, T.; Fassnacht, F.E.; Kleinschmit, B.; Förster, M. Mapping the Fractional Coverage of the Invasive Shrub Ulex Europaeus with Multi-Temporal Sentinel-2 Imagery Utilizing UAV Orthoimages and a New Spatial Optimization Approach. Int. J. Appl. Earth Obs. Geoinf. 2021, 96, 102281. [Google Scholar] [CrossRef]
  51. Booth, D.T.; Cox, S.E.; Meikle, T.; Zuuring, H.R. Ground-Cover Measurements: Assessing Correlation Among Aerial and Ground-Based Methods. Environ. Manag. 2008, 42, 1091–1100. [Google Scholar] [CrossRef]
  52. van Blerk, J.J.; West, A.G.; Smit, J.; Altwegg, R.; Hoffman, M.T. UAVs Improve Detection of Seasonal Growth Responses during Post-Fire Shrubland Recovery. Landsc. Ecol. 2022. [Google Scholar] [CrossRef]
  53. Maestre, F.T.; Cortina, J. Insights into Ecosystem Composition and Function in a Sequence of Degraded Semiarid Steppes. Restor. Ecol. 2004, 12, 494–502. [Google Scholar] [CrossRef]
  54. Maestre, F.T.; Ramírez, D.A.; Cortina, J. Ecología del esparto (Stipa tenacissima L.) y los espartales de la Península Ibérica. Ecosistemas 2007, 16, 111–130. [Google Scholar]
  55. Flores-de-Santiago, F.; Valderrama-Landeros, L.; Rodríguez-Sobreyra, R.; Flores-Verdugo, F. Assessing the Effect of Flight Altitude and Overlap on Orthoimage Generation for UAV Estimates of Coastal Wetlands. J. Coast. Conserv. 2020, 24, 35. [Google Scholar] [CrossRef]
  56. Swayze, N.C.; Tinkham, W.T.; Creasy, M.B.; Vogeler, J.C.; Hoffman, C.M.; Hudak, A.T. Influence of UAS Flight Altitude and Speed on Aboveground Biomass Prediction. Remote Sens. 2022, 14, 1989. [Google Scholar] [CrossRef]
  57. DiMaggio, A.M.; Perotto-Baldivieso, H.L.; Ortega, S.J.A.; Walther, C.; Labrador-Rodriguez, K.N.; Page, M.T.; Martinez, J.d.l.L.; Rideout-Hanzak, S.; Hedquist, B.C.; Wester, D.B. A Pilot Study to Estimate Forage Mass from Unmanned Aerial Vehicles in a Semi-Arid Rangeland. Remote Sens. 2020, 12, 2431. [Google Scholar] [CrossRef]
  58. Kattenborn, T.; Lopatin, J.; Förster, M.; Braun, A.C.; Fassnacht, F.E. UAV Data as Alternative to Field Sampling to Map Woody Invasive Species Based on Combined Sentinel-1 and Sentinel-2 Data. Remote Sens. Environ. 2019, 227, 61–73. [Google Scholar] [CrossRef]
  59. Riihimäki, H.; Luoto, M.; Heiskanen, J. Estimating Fractional Cover of Tundra Vegetation at Multiple Scales Using Unmanned Aerial Systems and Optical Satellite Data. Remote Sens. Environ. 2019, 224, 119–132. [Google Scholar] [CrossRef]
  60. Manfreda, S.; McCabe, M.; Miller, P.; Lucas, R.; Pajuelo Madrigal, V.; Mallinis, G.; Ben Dor, E.; Helman, D.; Estes, L.; Ciraolo, G.; et al. On the Use of Unmanned Aerial Systems for Environmental Monitoring. Remote Sens. 2018, 10, 641. [Google Scholar] [CrossRef]
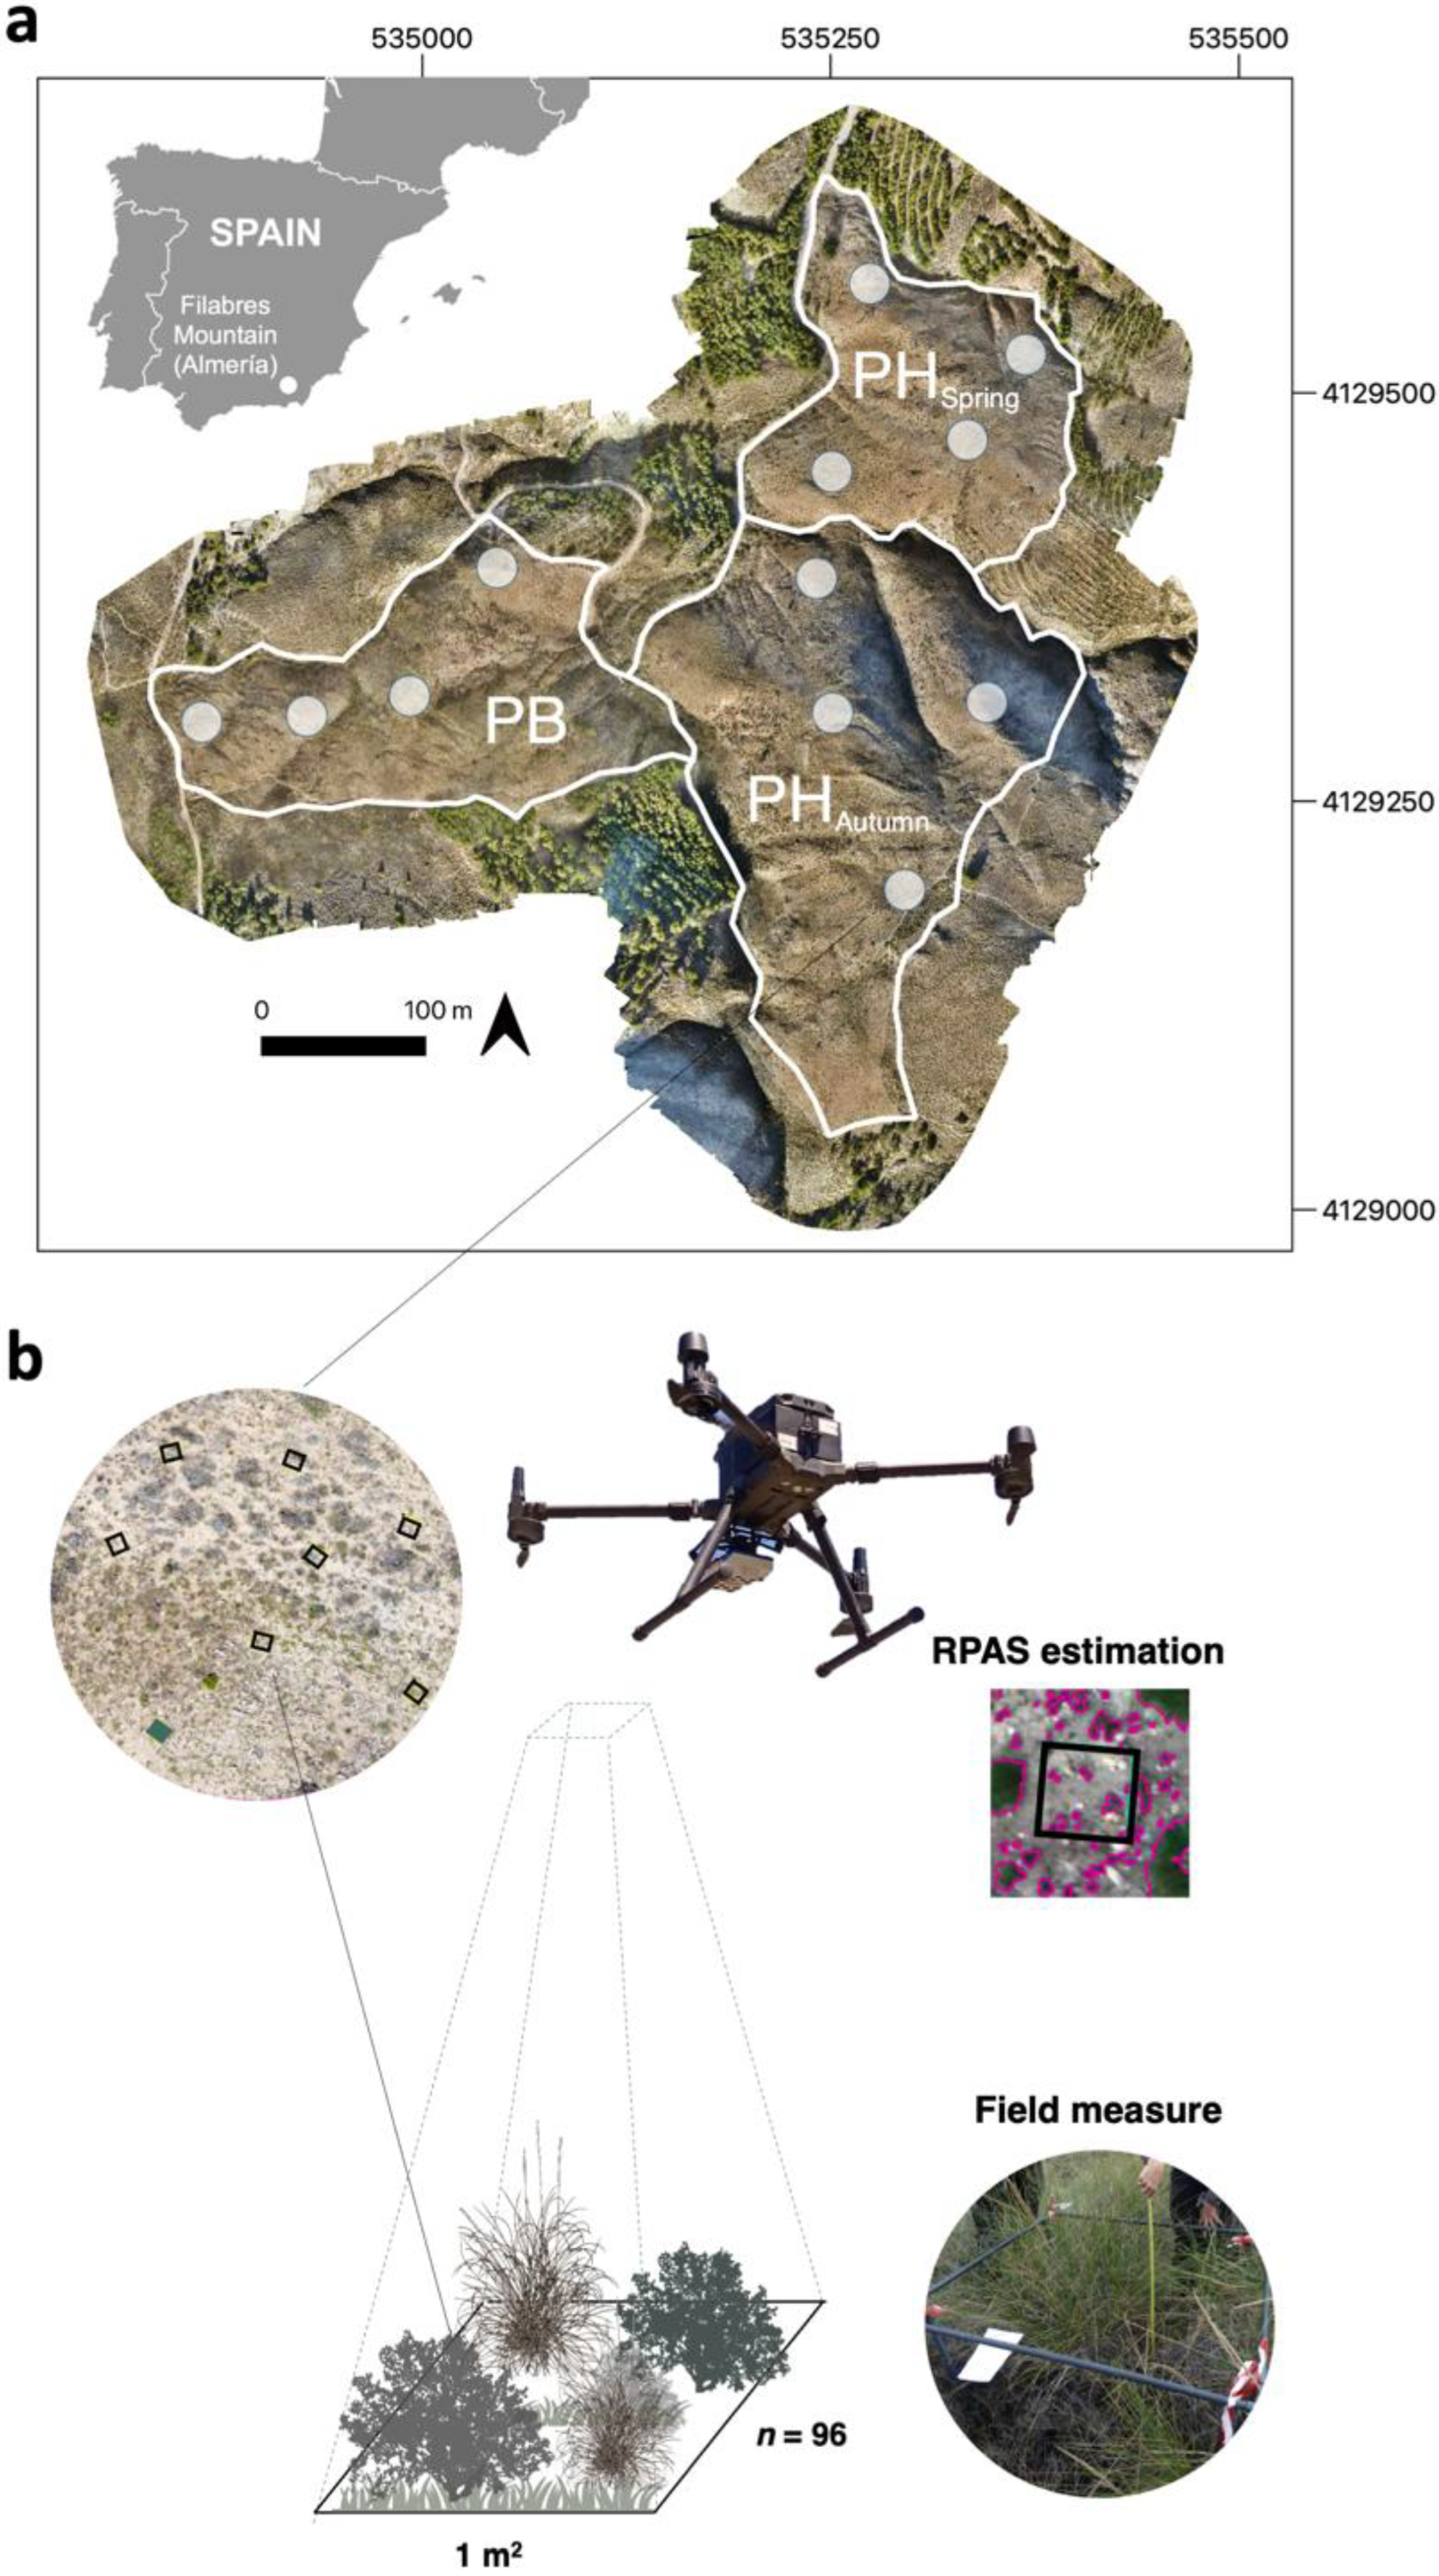
Figure 1. Location of the study area and experimental design (a). Two treatment zones were established: prescribed burning (PB), and pyric herbivory (PH; pyric herbivory: prescribed burning + grazing). Within each area, 500-m2 circular plots were selected (b), and within these, eight 1 m2-subplots were established and evaluated by field surveys and drone (RPAS).
Drones 06 00370 g001
Figure 2. Comparison of RPAS (drone)-based vs. field measurement-based estimates of vegetation cover.
Drones 06 00370 g002
Figure 3. Comparison of RPAS (drone)- vs. field measurement-based estimates of vegetation cover by vegetation type (a); and by treatment (b). The adjusted R2, normalized root mean square error (RMSE), and predictive R2 are shown.
Drones 06 00370 g003
Figure 4. Results of the variance partitioning. The CART algorithm identified two separate groups with a threshold of 36% vegetation cover.
Drones 06 00370 g004
Figure 5. Relationship between model residuals (drone-based vs. field measurement-based estimates of vegetation cover) and plant community diversity (Shannon–Wiener index) (left), plant species richness (number of species) (center), and terrain slope (in percent) (right).
Drones 06 00370 g005
Table 1. Characteristics of prescribed burn treatments.
Name Treatment Fire DateSurface (ha)Lat/Long 1Slope 2 (%)
PBPrescribed burning (PB)18 December 20183.4137°18′35.25″ N
2°36′18.00″ W
12.0–66.6
PHAutumnPyric herbivory (PH)18 December 20185.6137°18′33.83″ N
2°36′7.49″ W
17.5–82.3
PHSpringPyric herbivory (PH)7 May 20192.8537°18′41.06″ N
2°36′5.76″ W
12.0–82.3
1 Coordinates of the polygon centroid. 2 Range values.
Publisher’s Note: MDPI stays neutral with regard to jurisdictional claims in published maps and institutional affiliations.