Article

Terrestrial Megafauna Response to Drone Noise Levels in Ex Situ Areas

by
Geison Pires Mesquita
1,
Margarita Mulero-Pázmány
2,*,
Serge A. Wich
3 and
José Domingo Rodríguez-Teijeiro
4
1
Institute Baguaçu of Biodiversity Research (IBPBio), São Luís 65050849, MA, Brazil
2
Department of Animal Biology, University of Málaga, 29071 Málaga, Spain
3
School of Biological and Environmental Sciences, Liverpool John Moores University, Liverpool L3 3AF, UK
4
Department of Evolutionary Biology, Ecology and Environmental Sciences, University of Barcelona, 08028 Barcelona, Spain
*
Author to whom correspondence should be addressed.
Drones 2022, 6(11), 333; https://doi.org/10.3390/drones6110333
Submission received: 28 September 2022 / Revised: 25 October 2022 / Accepted: 26 October 2022 / Published: 30 October 2022
(This article belongs to the Special Issue Drones for Biodiversity Conservation)

Abstract

:
Drone use has significantly grown in recent years, and there is a knowledge gap on how the noise produced by these systems may affect animals. We investigated how 18 species of megafauna reacted to drone sound pressure levels at different frequencies. The sound pressure level on the low frequency generated by the drone did not change the studied species’ behavior, except for the Asian elephant. All other studied species showed higher noise sensitivity at medium and high frequencies. The Asian elephant was the most sensitive species to drone noise, mainly at low frequencies. Felines supported the highest sound pressure level before showing behavioral reactions. Our results suggest that drone sound pressure levels in different frequencies cause behavioral changes that differ among species, which is relevant to assessing drone disturbances in ex situ environments. The findings presented here can help to reduce drone impact for target species and serve as an experimental study for future drone use guidelines.

1. Introduction

Drones are becoming more ubiquitous for research and conservation of wildlife species and their habitats [1,2,3] thanks to the methodological advantages they offer compared to other monitoring techniques such as: the generation of data with high spatial and temporal resolution, low operational costs, easier logistics, and more safety for researchers, e.g., over aerial surveys performed by manned airplanes [4,5], especially for research on large mammals in large open areas or areas with restricted access [6,7]. These advantages have facilitated drone studies for wildlife detection and identification [7,8], monitoring [9,10], and habitat assessment [11,12]. However, drones for both research and recreational uses has become a new source of disturbance for many animal species [13,14]. Among animal groups, megafauna and birds are the main groups targeted for drone studies [1] and consequently are most likely to suffer such disturbance. Several studies have shown that drones cause disturbances to birds [15,16] and large mammals [17,18] and drone use guidelines have been proposed to minimize their impact on wildlife [13,19].
Although megafauna [20] is one of the preferred groups for drone studies [1,5] and a common target for recreational filming [21], there are still few works that identify or quantify the actual drone-associated factors that can negatively affect animals’ behavior. Some large African mammals have been shown to respond negatively to drones approaching, although species varied in their level of response and their tolerance of drone proximity [18]. Even in approaches at large distances, probably out of sight of the species, the drone caused some reaction, suggesting that first responses were triggered by auditory rather than visual signals. Similarly, guanacos (Lama guanicoe) perceived drones at 180 m above ground level (AGL), a distance which makes the animal’s visual detection of the drone unlikely [10]. A study focusing only on the noise stimulus suggested drone flights should be performed above 200 m to avoid aural detection by ungulates, dogs, cats, gamebirds and waterfowl in most environmental conditions [22]. More recently, another work comparing the auditory sensitivity of different species of mammals through available audiograms with the drone noise from different commercial drone models, suggested different advisable flight altitudes for each type of drone over different species, which ranged between 5 and 120 m AGL [23]. Some studies have tried to identify which drone stimulus can cause behavioral change in wildlife, either focusing on the sound [22] or on the visual stimulus [16]. More research is needed to disentangle the influence of the auditory and visual signals on drone animal disturbance. While behavioral audiograms exist for some mammal species, detailed knowledge of mammalian hearing skills is still limited. The factors determining auditory limits at low frequencies among mammalian species and auditory perception, which includes the ability of animals to recognize objects or other animals by the sounds they emit, are still to be explored [24]. The same applies for the visual acuity (i.e., the ability to perceive static spatial details) of different mammalian species, which can range from 0.4 to 1.0 cycles per degree (cdp) in microchiropteran bats and small rodents and from to 30 to 64 in anthropoid primates such as humans [25].
The aim of this study is to investigate how the sound pressure levels in the different frequencies of a custom off-the-shelf drone are associated with disturbance of terrestrial megafauna species. In this study, we recorded the sound profile of a multirotor drone, performed behavioral analysis of different specimens exposed to drone use, and compared it with audiometry using available mammalian audiograms. Our prediction is that species with a higher auditory sensitivity in the low frequencies will show more disturbance-related behavior to drone noise. To our knowledge, this is the first experiment where drone sound characteristics are related to terrestrial megafauna behavioral changes.

2. Materials and Methods

2.1. Drone Noise Profile Recording

We obtained the drone sound profile by performing two flights with a DJI Mavic Pro quadcopter with a diagonal size of 335 mm and maximum take of mass of 743 g (https://www.dji.com/br/mavic, accessed on 10 February 2021). We measured the sound pressure level (SPL) in decibels (dB) and characterized the frequencies (Hz) received at ground level when the drone was flown at different altitudes. The measurements were made in a rural open field area with sparse vegetation, at 07:00–08:30 h and 16:00–17:30 h, with an average temperature of 28 °C (SD 2.9), an average relative humidity of 60% (SD 1.7), and maximum winds of 3 on the Beaufort scale (gentle breeze).
For recording, we used the Instrutherm model DEC-7000 (São Paulo, Brazil) sound meter (https://www.instrutherm.net.br/, accessed on 15 February 2021) following the protocol outlined in ISO-3746 [26]. The DEC-7000 has class 1 accuracy, linear precision of 0.8 dB, and a measurement range of 22~136 dB (A), with frequency weights A, B, C, and Z and 36 frequency band responses from 0.0063 to 20 kHz at 1/3 octave in real time. We carried out the measurements with the DEC-7000 using the slow type weighting time, weighting in dB (A) with 1/3 octave filters, and 30 s of measurement at each altitude. We used the Instrutherm software for the DEC-7000 sound meter to obtain the exponential average of the sound pressure level (SPL) values in dB of 20 µPa during the 30 s of measurement at each altitude for the 36 frequency bands (0.0063–20 kHz). We considered the dB (A) weighting curve to be the standard for the evaluation of continuous and intermittent noise and because it is the most used in sound meter models commonly found on the market.
Before the drone take-off, we measured the ambient background noise. Then, the drone was flown to 120 m AGL, the maximum allowed by the National Civil Aviation Regulatory Agency of Brazil [27]. From 120 m AGL, we measured the noise generated by the hovering drone every 5 m AGL for 30 s, descending at a maximum speed of 3 m/s until reaching a minimum altitude of 5 m AGL. For each altitude, we collected the average values in dB (A), calculated by the DEC-7000 post-processing software of the sound pressure levels with slow response, in addition to the 36 frequency bands in the 1/3 octave mode. We performed the above procedures for each of the two flights and obtained the average values for each altitude.

2.2. Species and Mammalian Baseline Audiogram

We analyzed the behavior of 18 species of terrestrial mammals representing 14 families (Table 1).
To determine the minimum sound pressure a species can detect at a given frequency, we used the published audiograms of large terrestrial mammal species available from the Psychology Department of the University of Toleto, Ohio, USA [28], and for those not available, we used the available audiograms from a species belonging to the same family. When more than one audiogram was available for the same family, we used their average as the reference for the family. To develop the audiogram of the Bovidae family, we considered the average value in dB in each of the 36 frequency bands in the 1/3 octave of the species Bos taurus, Capra hircus, and Ovis aries. In the same way, for the development of the audiogram of the Cervidae family, we considered the average value in dB of the species Odocoileus virginianus and Rangifer tarandus. For 6 of the 18 species analyzed, there are no audiograms of the species or species of the same family available in the literature. Thus, we performed only the behavioral recording against the drone noise without relating it to the hearing ability via audiogram.
To analyze the possibility of the species reacting to the visual stimuli caused by the drone, we considered visual acuity measured in cycles per degree (cpd). We used cpd data of large terrestrial mammal species available from [25,29,30], and for those that did not have any available, we used the available cpd data from a species belonging to the same family. The greater the number of cycles per degree, the greater the visual acuity. Considering that the visual acuity of humans, up to 60 cpd, is one of the best among all mammalian species, and that none of the species analyzed have visual acuity greater than 30 cpd, we assumed that the difficulty of a human pilot to spot the drone at a given altitude in the experiment served as a proxy of the species’ detection of the drone.

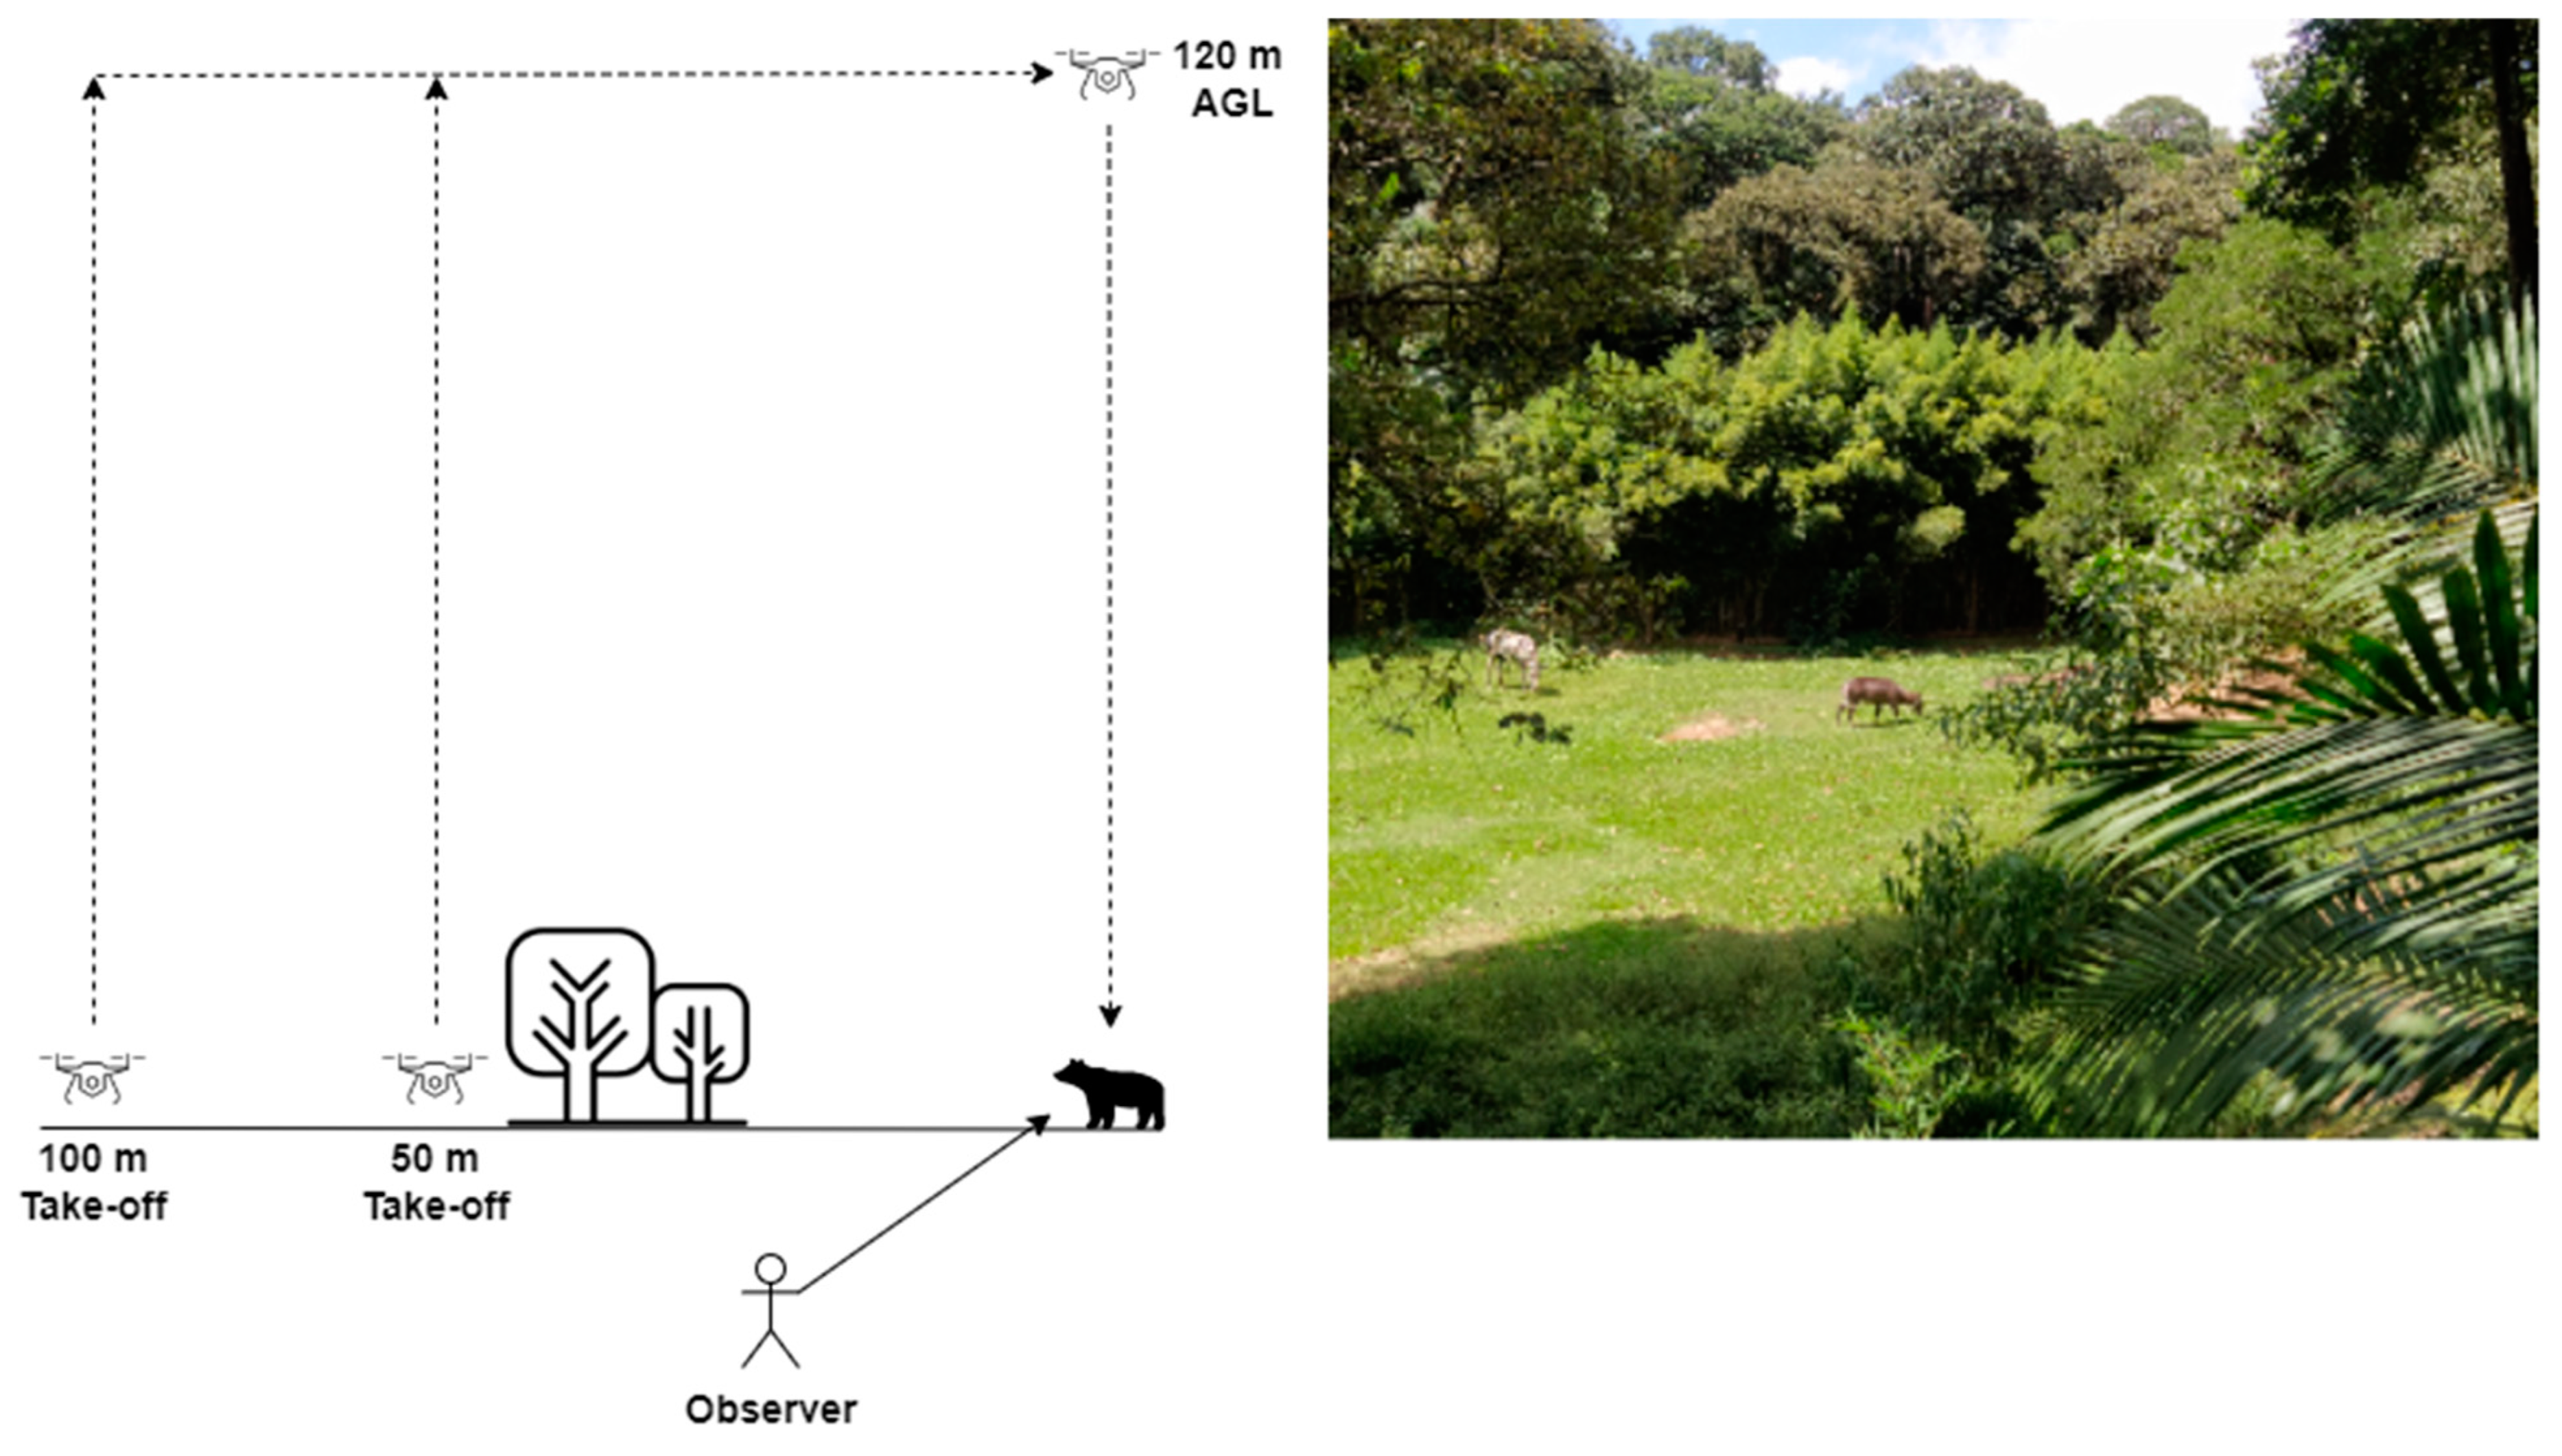
2.3. Recording Megafauna Behavior during Drone Exposure

We performed 36 drone flights in February 2021 at São Paulo Zoological Park and close surroundings in Brazil, with the same Mavic Pro model described in the previous section.
We focused the study on 18 terrestrial megafauna species. All animals were distributed in a total area of 82 ha created to simulate their respective natural habitats. All flights were carried out in an open environment and in VLOS (Visual Line-Of-Sight) mode; that is, the pilot maintained direct contact with the drone. The zoo’s technical team confirmed that none of the studied individuals had been exposed to drones in the past five years.
We performed the take-off flights against the wind and at a minimum distance of 100 m from the target location where there were no physical barriers, or 50 m away when barriers existed, to minimize potential disturbance from drone approaches before the actual experimental flights (Figure 1). Flights were performed at 07:00–08:30 h and 16:00–17:30 h and under similar environmental conditions as the control flights. After take-off, the drone ascended vertically to a maximum altitude of 120 m AGL and then horizontally at a maximum speed of 10 m/s until it was above the target animal or group of individuals. From there, the drone descended with a maximum speed of 3 m/s. Simultaneously, an observer from the zoo team, aided with binoculars and outside the line of sight of the target animal, noted the animals’ behavior as the drone descended vertically (Figure 1). Considering the atmospheric conditions of the experiment, the pilot noticed some difficulty in visualizing the drone in flights above 50 m AGL, but with the help of the pointer on the screen of the remote-control station, it was possible to position the drone over the individuals in all flights.
We considered the individual as “disturbed” when any species-specific sign of irritation or atypical behavior such as movement of the head, legs, and tail was confirmed by the experienced zoo technician. The drone descended vertically until the individual was deemed “disturbed” by the technician. To minimize external disturbance factors, all flights were conducted in the absence of visitors at the study site. During each drone flight, we recorded the altitude where the disturbance occurred. After recording the behavior, the drone was ascended back to 120 m AGL and then horizontally flown back to the take-off location and landed. For animals forming groups, a disturbance was considered to have occurred when at least one individual changed its behavior. We performed two flights over each target with an interval of at least three days between each one to avoid repetitive stimuli and obtained the average values with standard deviations for each altitude.

2.4. Data Analysis

We characterized sound pressure level in all 1/3 octave bands at 120 m, 60 m, and 5 m AGL [27]. To investigate in which frequency spectrum in all 1/3 octave bands (6.3 Hz–20,000 Hz) drone noise adds to the environment, we divided the sound pressure level (dB) into low frequency (0.02–0.25 kHz), medium frequency (0.315–2 kHz), and high frequency (3.15–20 kHz) [31].
We associated the altitude at which behavioral change was detected in flights over megafauna individuals with the sound pressure level (dB) values at different frequencies in all 1/3 octave bands recorded on drone noise profile recording flights. We then associated these dB values at the different frequencies with the available audiograms of the same family of the species analyzed and identified which dB values at the different frequencies are within or outside the hearing capacity of each species.

2.5. Ethical Note

We use the drone that was operated under license no. PP-019272726 by the National Civil Aviation Agency (ANAC). Considering that all flights were performed within VLOS (Visual Line of Sight Rules) and adhered to the requirements of the National Civil Aviation Agency (ANAC), prior authorization from ANAC was not required for the execution of drone flights at the São Paulo Zoological Park. All experimental flights followed the recommendations of the American Society of Mammologists [32] and were approved by the Technical-Scientific Directorate of the São Paulo Zoological Park Foundation under the authorization project number 545.

3. Results

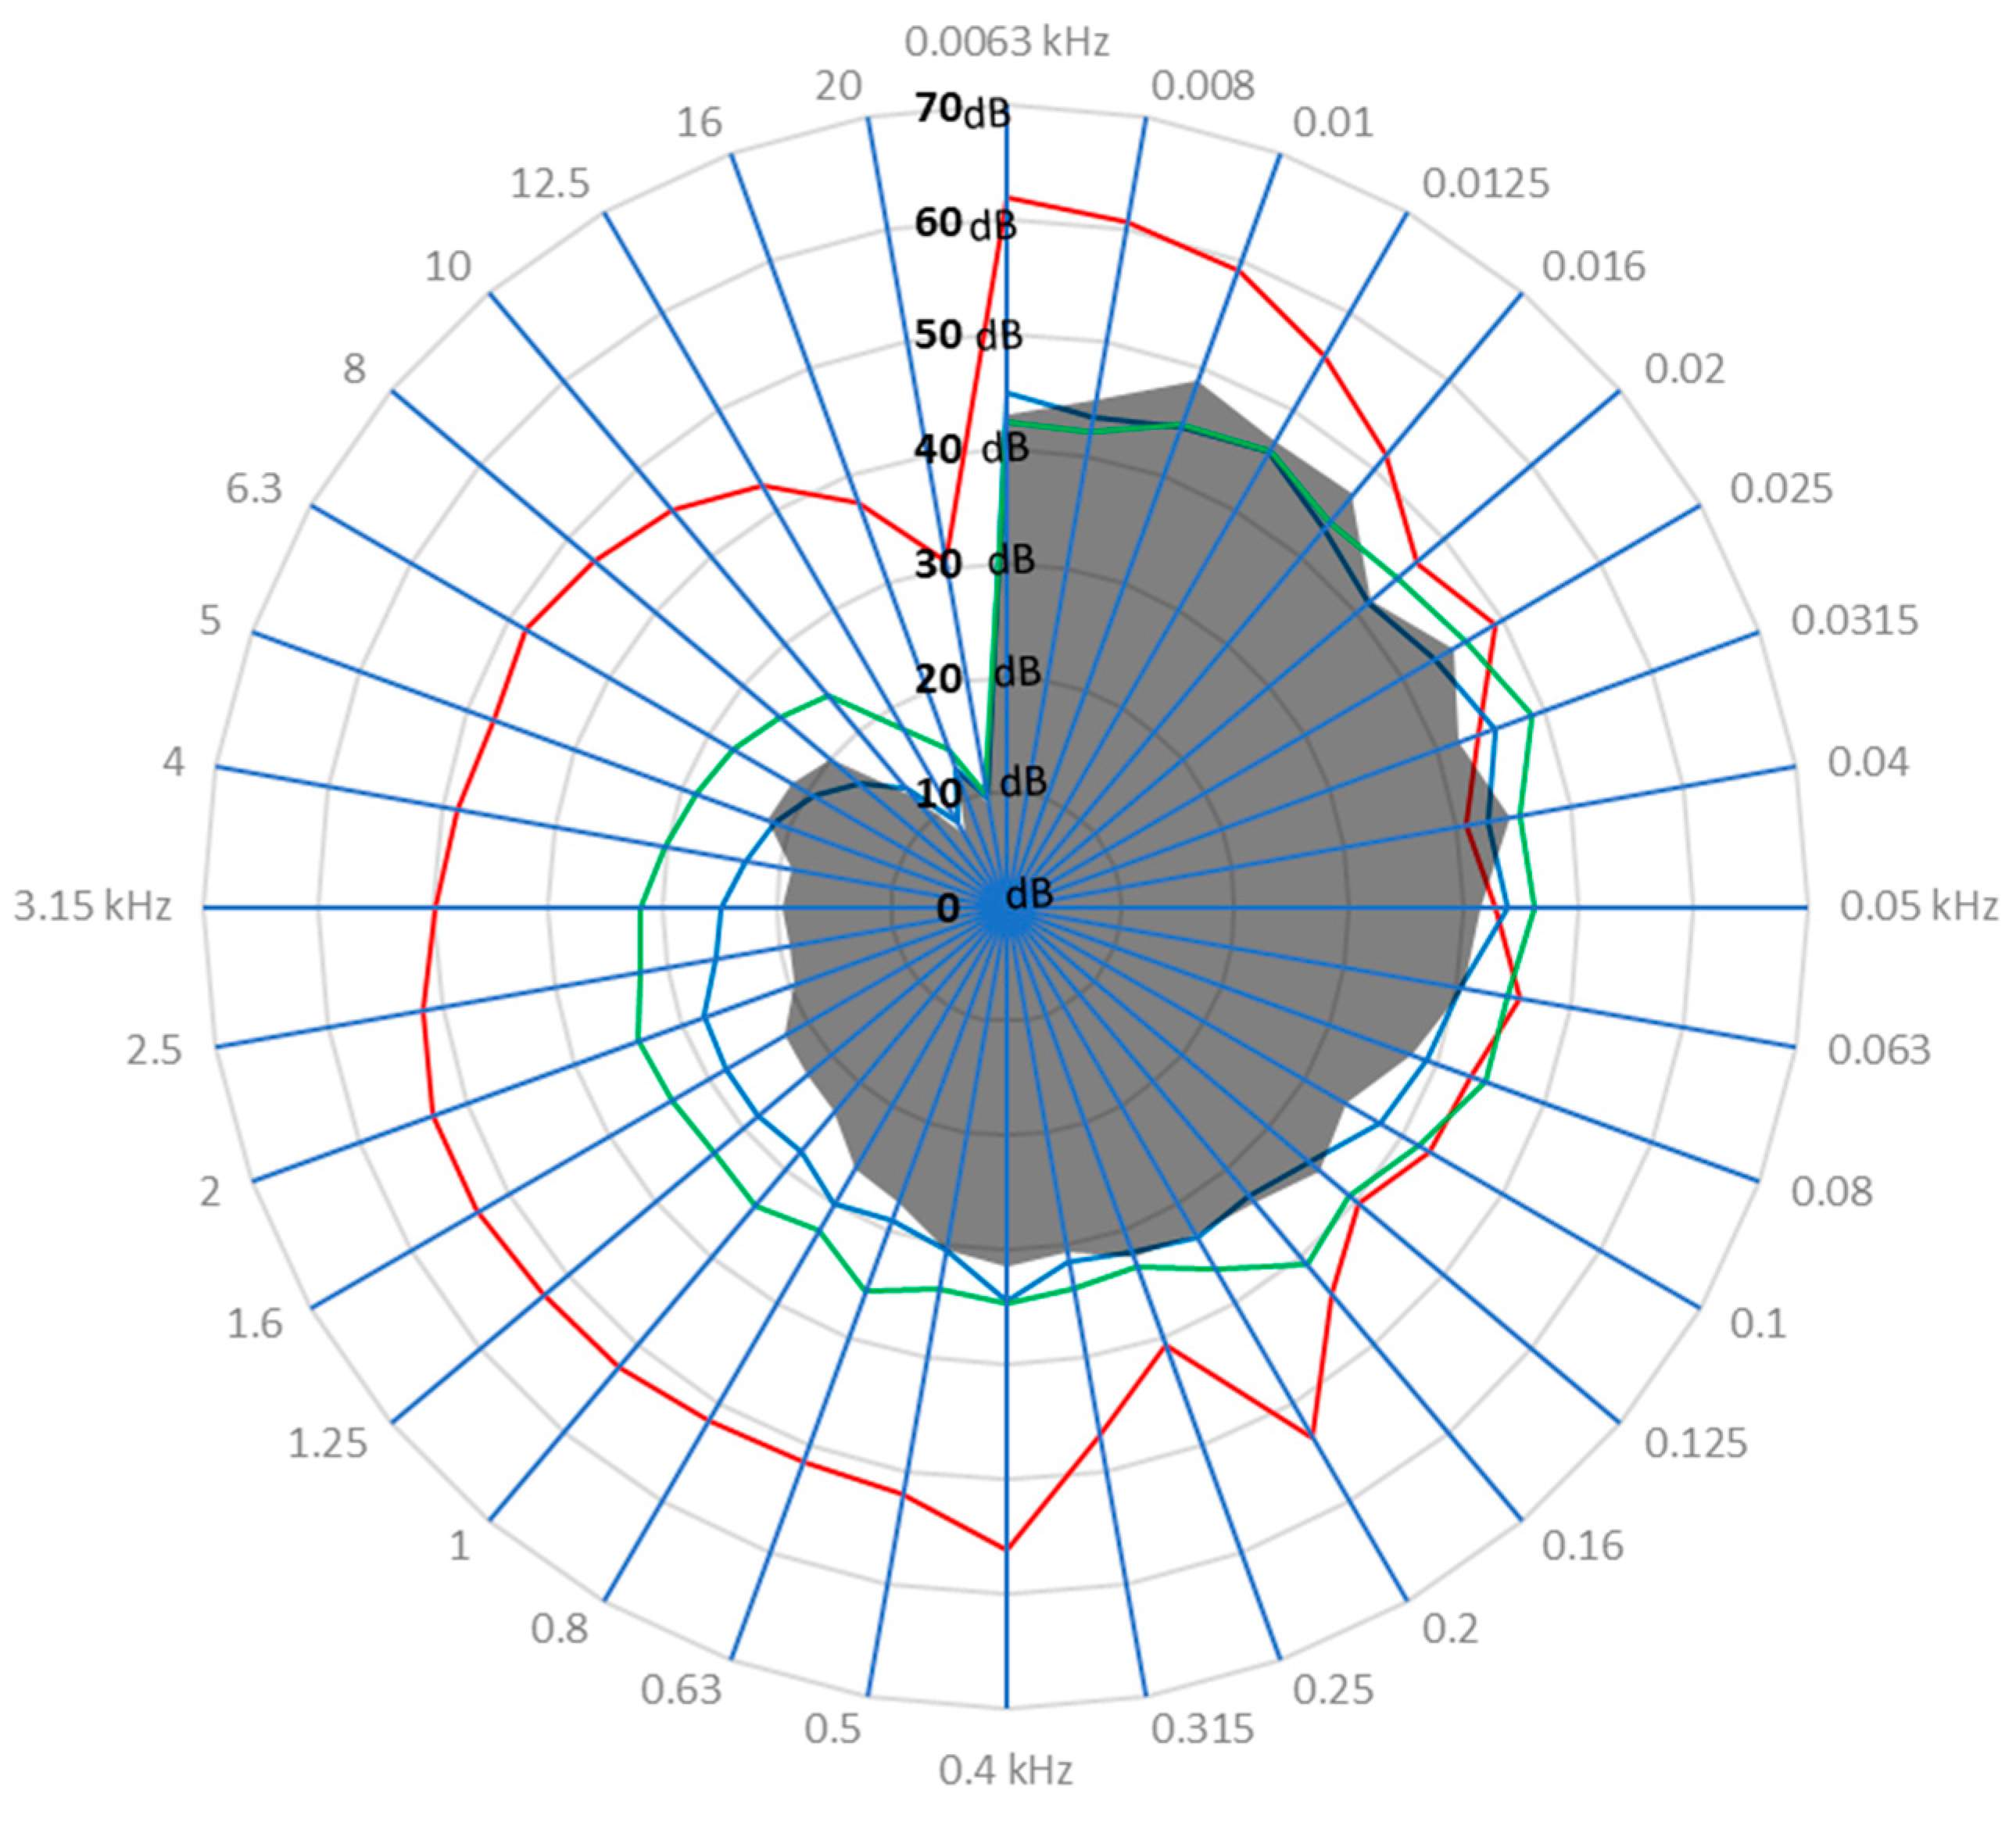
3.1. Drone Sound Profile

Within the whole spectrum of 1/3 octave bands (0.0063 to 20 kHz), the drone sound profile level was above ambient noise at 60 m AGL and the minimum altitude, 5 m AGL (Figure 2), but at the maximum altitude of 120 m AGL, the drone sound profile generated no increase in ambient noise in the low-frequency bands, an increase of 12.37% in the medium-frequency bands, and an increase of 6.55% in the high-frequency bands. At 60 m AGL, the drone sound profile caused an increase in ambient noise of 8.30% in low-frequency, 23.44% in medium-frequency, and 32.55% in high-frequency bands. In the minimum altitude of 5 m AGL, the drone generated an increase of 12.89% in low-frequency, 50.11% in medium-frequency, and 63.49% in high-frequency bands (Figure 2).

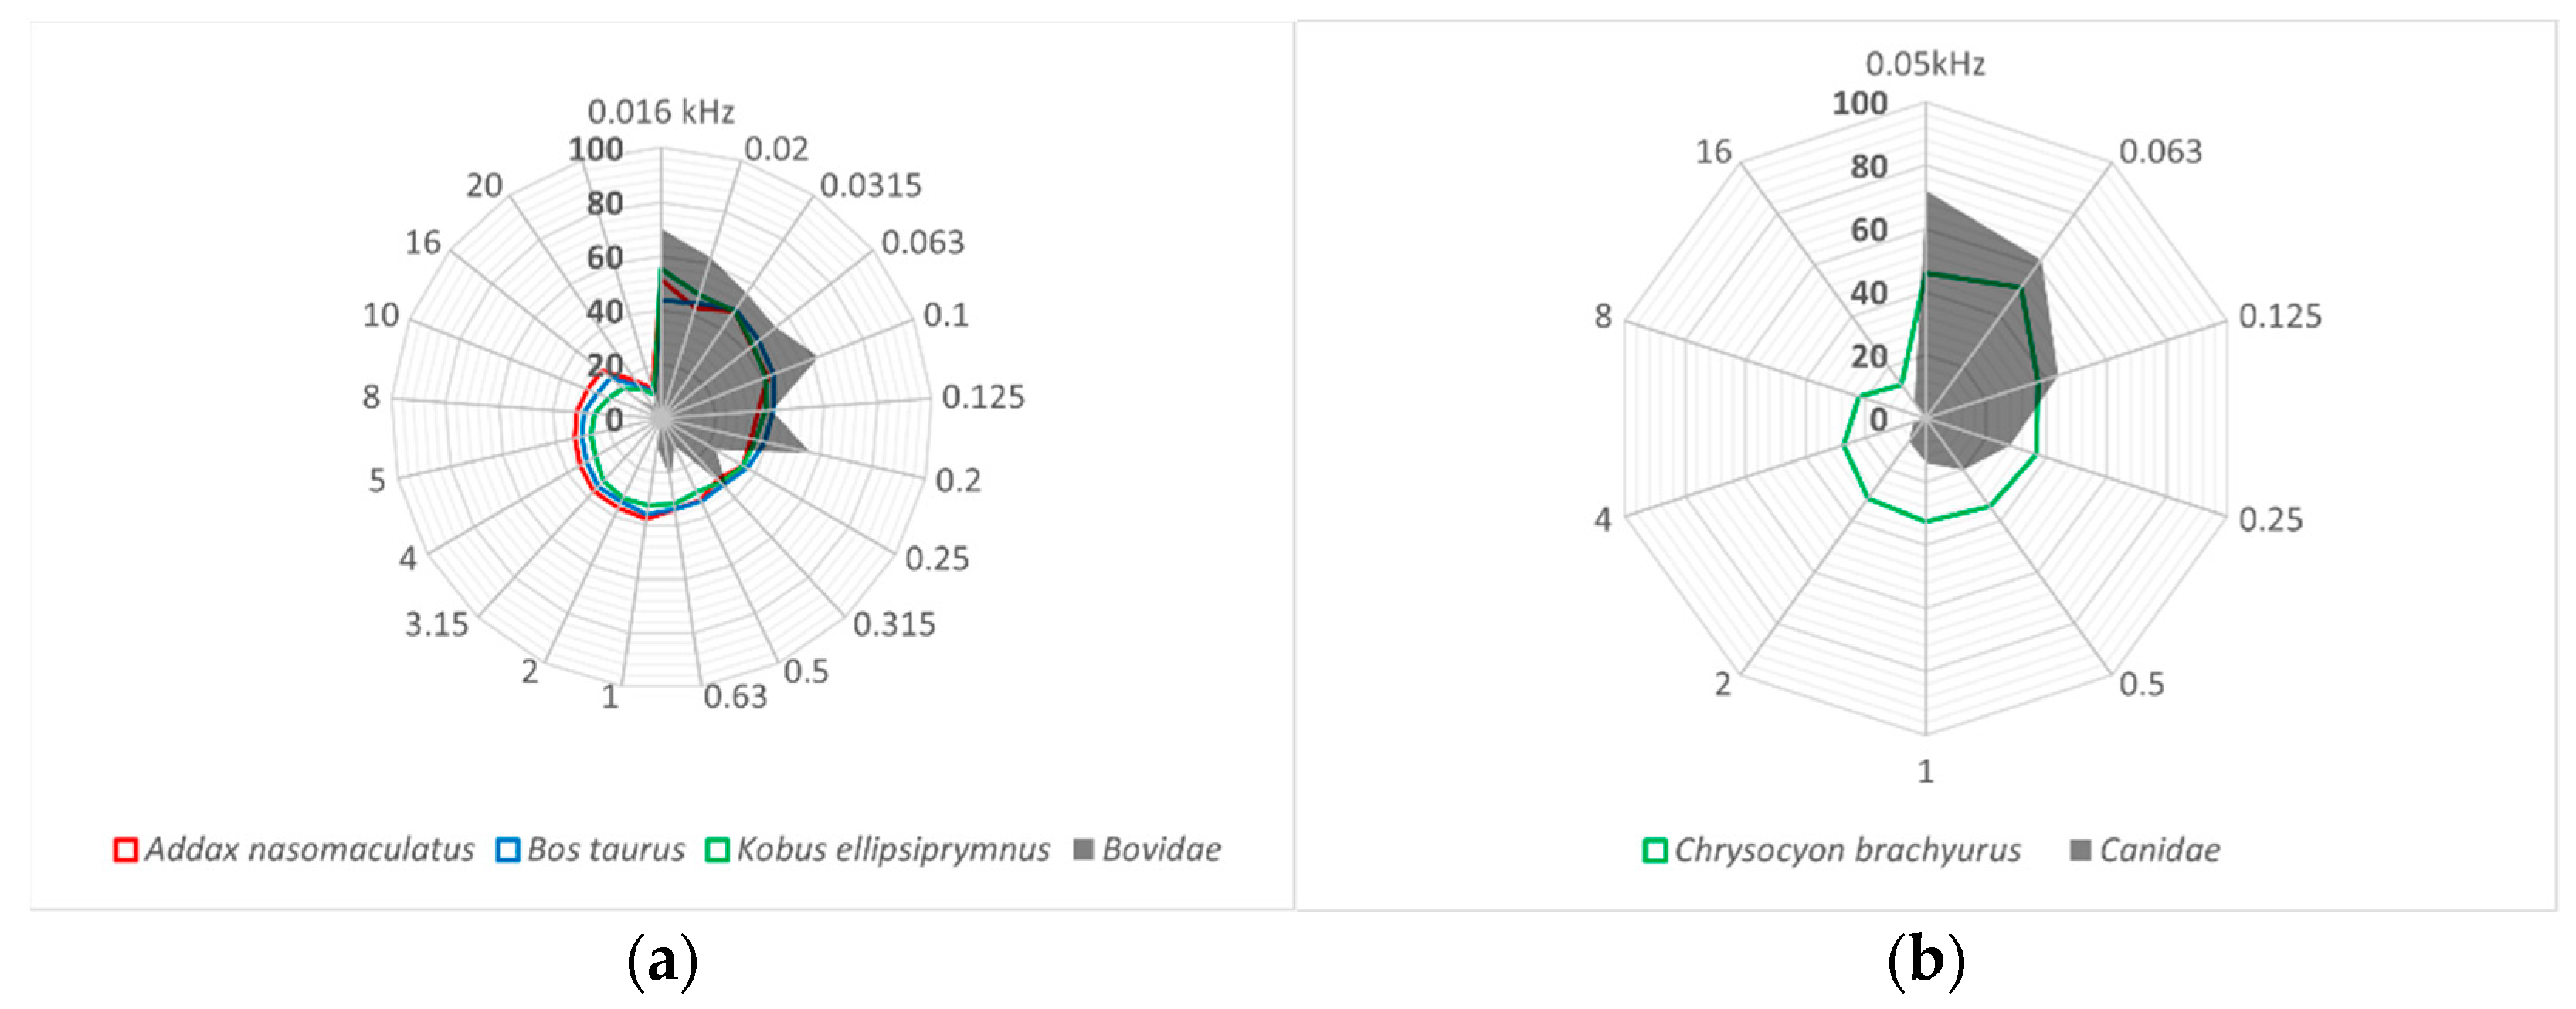
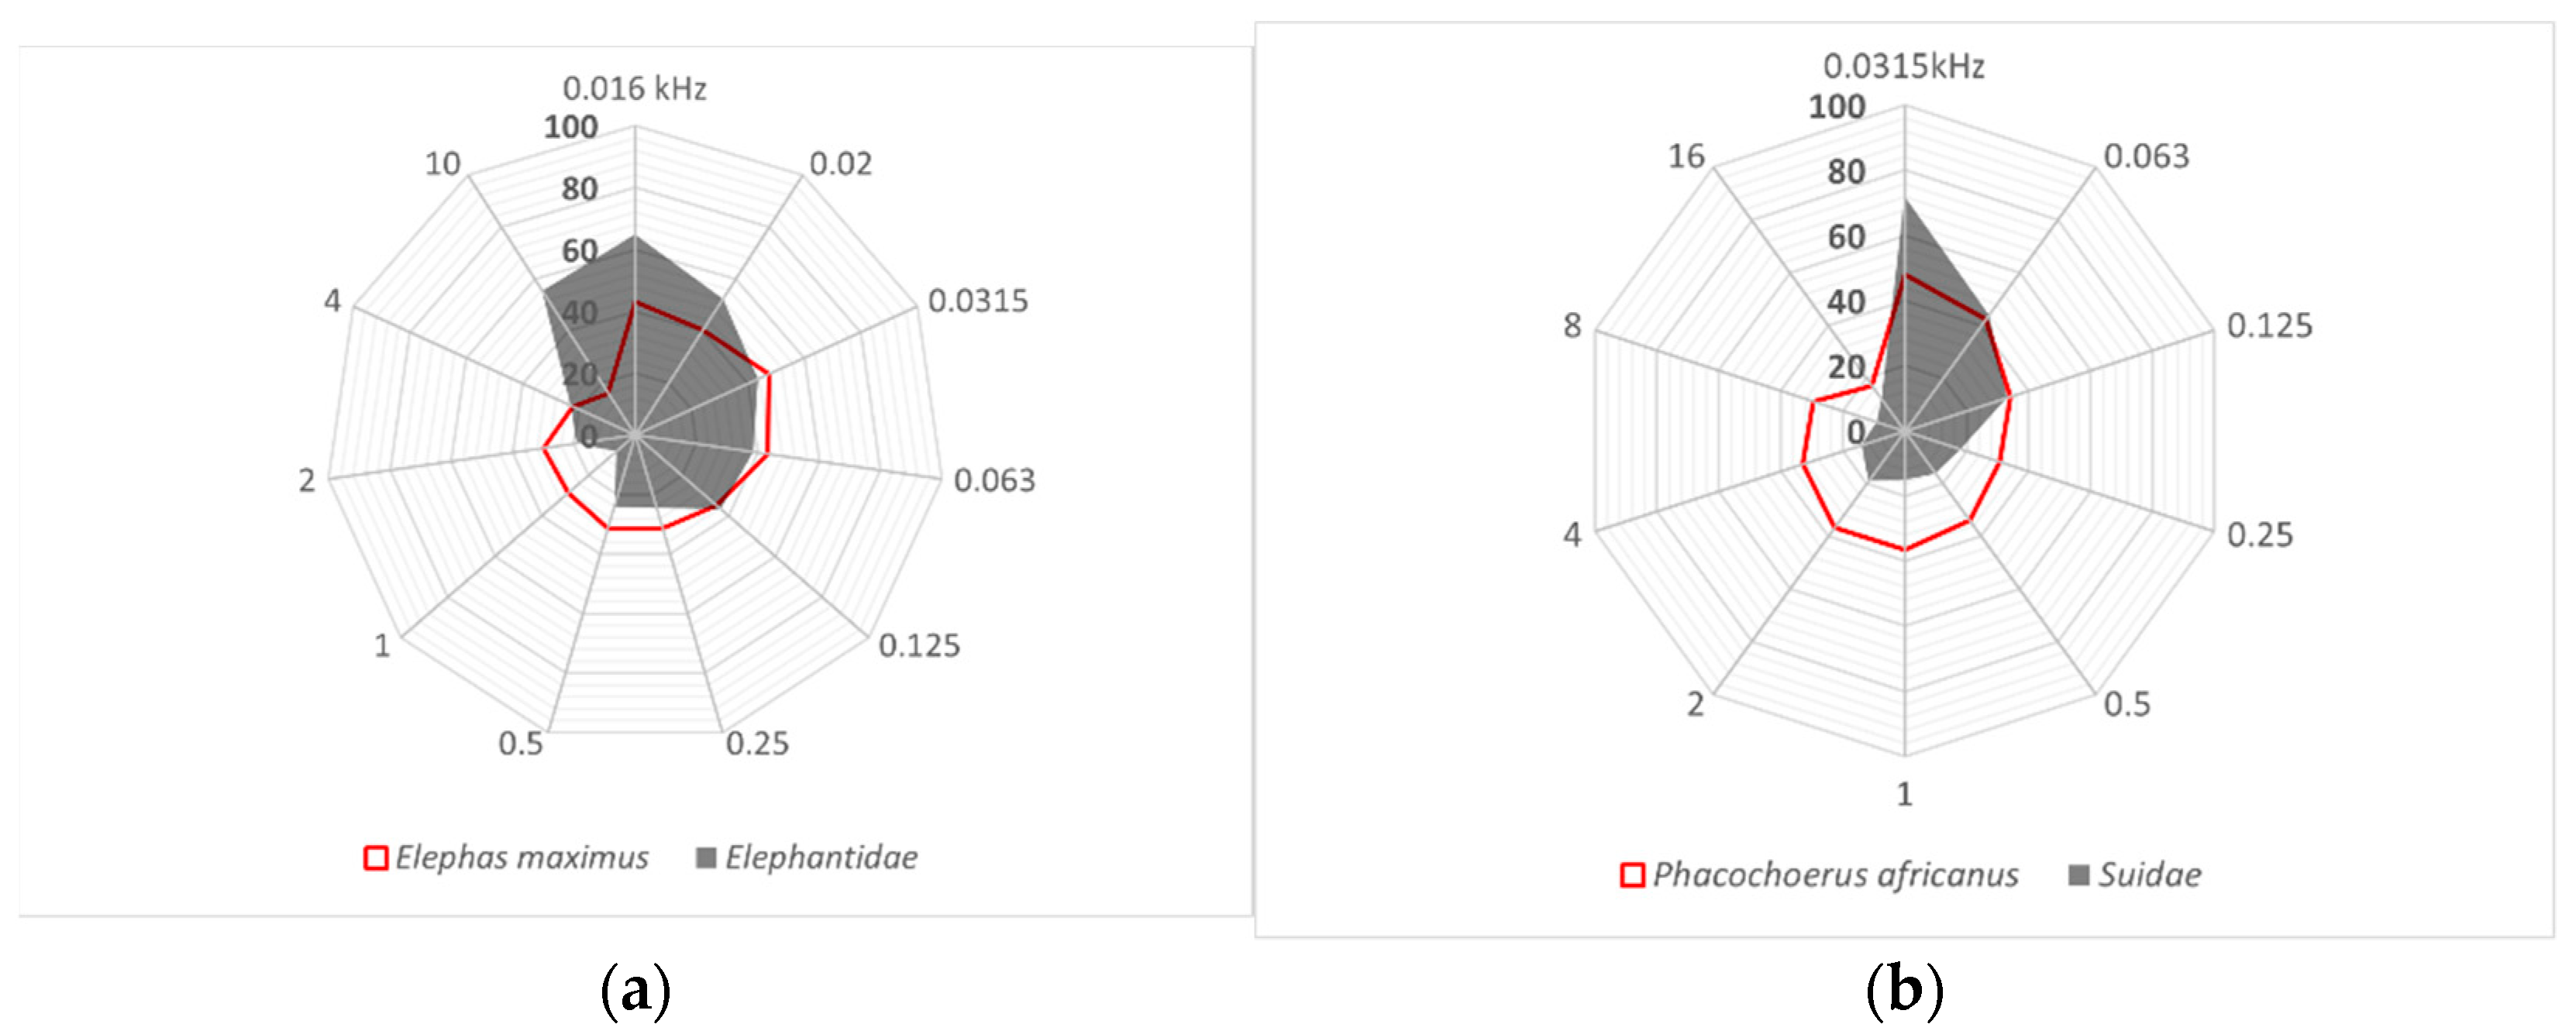
3.2. Limits of Hearing Sensitivity

The species Addax, cattle, and waterbuck from the Bovidae family showed disturbance at drone average altitudes of 46.5 m, 60 m, and 83 m AGL, respectively. At these altitudes, the species seem able to hear the sound pressures of the drone noise at all high and medium frequencies and at low frequency only in the 0.25 kHz band. The three bovid species showed similar sound sensitivity to drone noise, waterbuck being disturbed by the lowest average sound pressure, below 25 dB, in the high and medium frequencies (Figure 3a). The addition of drone noise over environmental noise that caused behavioral changes in Addax, cattle, and waterbuck species was 32.4%, 26.5%, and 16.5% respectively. The visual acuity of species from the Bovidae family is approximately 3 cpd, 95% less than humans.
The dromedary species, representing the family Camelidae, was disturbed by the drone at the average altitude of 48 m AGL. At this altitude, the drone noise was perceived by the species only at frequencies from 0.25 kHz to 16 kHz, and this noise was on average 23.23% higher than environmental noise, with more difference in the medium frequencies (46.7%) (Figure S1). The dromedary visual acuity is approximately 10 cpd, 83.3% less than humans.
The maned wolf, representing the Canidae family, was disturbed by the drone at an average altitude of 78 m AGL. At this altitude, the drone noise was 21.9% higher than the ambient noise. Similarly to bovids and camelids, at low frequencies, the species was disturbed by the noise only in the 0.25 kHz band. At medium to high frequencies, the species detected drone noise in the in all bands (Figure 3b). In the Canidae family, the visual acuity is around 12 cpd, 80% less than humans.
Representing the family Cervidae, the species red deer and sambar were disturbed by the drone at altitudes of 74 m and 65 m AGL, which correspond to noise increases of 17.6% and 27.5%, respectively, over environmental noise. At these altitudes, the drone noise at low frequencies did not seem to be detected by the species as it was below their hearing capabilities. All other sound pressures of the drone noise in the medium- and high-frequency bands were likely to be detected by the species, with the red deer showing a slightly higher sensitivity than sambar (Figure S1). The visual acuity among cervids is similar to bovids, 3 cpd.
The Asian elephant, representing the family Elephantidae, was the species that showed the highest auditory sensitivity among all species analyzed, being disturbed by the drone at an average altitude of 109 m AGL. It was also the only species reacting to the drone noise in the low-frequency bands of 0.0315 and 0.063 kHz, and the only species reacting to the drone noise at high frequencies (Figure 4a) at the altitude that presented disturbance. The drone noise was only 11% higher than the environmental noise, and if we consider only the noise perceptible by the species, this percentage falls to 8.7%. The elephants have visual acuity of approximately 14 cpd, 76.6% less than humans.
Imperial zebra, representing the family Equidae, was the second most sensitive to drone noise after the Asian elephant, showing disturbance by the drone at an average altitude of 85 m AGL, which represents a 20% increase over the environmental noise. Similarly to the species of the families Bovidae, Camelidae, and Canidae, at this altitude, the species was disturbed by the drone noise only in the 0.25 kHz low-frequency band and in the medium and in all bands of high frequency (Figure S1). The visual acuity of species from the Equidae family is approximately 23 cpd, 61.6% less than humans.
In the Felidae family, the species jaguar and Bengal tiger were the ones disturbed by the drone at the lowest mean altitude, 38 m and 40 m AGL, respectively, and consequently the ones that withstood the highest sound pressure of the drone noise before being disturbed. The species experienced behavioral change due to a 34.8% increase in drone noise over environmental noise. At these altitudes, the drone noise had high enough sound pressure to be perceived in the 0.125 and 0.25 kHz bands by both species. In all other frequency bands, the species reacted to the drone noise (Figure 4b). These two species were also the only ones that showed curiosity behavior, followed by irritation behavior. When identifying the location of the drone over their heads, they kept their gaze for about 5 s and then showed signs of irritation such as growling. The visual acuity among felines is similar to the equines, 23 cpd.
Warthog, representative of the Suidae family, was disturbed by the drone at an average altitude of 47 m AGL, which represents a 31.5% increase over the environmental noise. Like most species of other families, at this altitude, the species reacted to the drone noise only in the 0.25 kHz band within the low-frequency range and in all other bands of the medium and high frequencies (Figure S1). The species from the Suidae family have the least visual acuity, 0.03 cpd.
We performed the same analyses of behavior change against drone noise for the species Giraffe, Hippopotamus, giant anteater, white rhinoceros, tapir, and spectacled bear. However, we did not consider the hearing ability of these species as we did not find audiograms available in the literature of species of the same family. In addition to the maned wolf, the behaviors of giant anteater and tapir species towards drones were analyzed for the first time. Although we cannot define which sound pressures in each frequency of the drone noise are or are not perceived by the giant anteater and tapir, we identified that these species were disturbed by the sound profile of the Mavic Pro drone at altitudes of 34 m and 62 m AGL, respectively. Like the felines, the spectacled bear was one of the species that directly looked at the drone during the experiment. After looking directly at the drone for about 5 s, it showed signs of irritation, such as sudden movements with the head.
All the analyzed species were more sensitive to the sound pressure level from the drone noise in the high frequencies, from 0.315 to 20 KHz (Figure S1), except for the Asian elephant, which, according to its audiogram, was unable to hear sound pressure of the drone noise above 4 kHz. The elephant’s audiogram also showed that it was possibly the only species capable of perceiving the sound pressure emitted by the drone in the 1/3 octave bands of 0.0315 and 0.063 Hz (Figure 3).

4. Discussion

The increase in drone use over megafauna for different purposes requires a greater understanding of the disturbance that drones can cause to animals. Here, we analyzed the characteristics of a custom off-the-shelf drone noise against the auditory perception of 12 mammal species from different families in an ex situ area, demonstrating that the disturbance caused by the drone noise is started by different sound pressure levels that are possibly noted at different frequencies by the different species. To our knowledge, this study is the first to analyze the behavioral change of mammalian species caused by drone use with a focus on the drone noise characteristic and not on its flight altitude. Although we cannot separate here the visual stimulus from the sound stimulus coming from the drone, as performed in the quasi-experimental study with bird species [16], our results support [18] and [10] in that the drone noise is the first and possibly the main factor of behavioral change in large terrestrial mammals exposed to drone use. Our results also suggest that the mammalian auditory system, as explained by [33], responds faster than other sensory systems, causing their neural circuits to be activated more quickly, allowing a faster fight or flight response. To further reinforce that drone noise is possibly the main driver of behavioral change, we compared the visual acuity of the analyzed species with human visual acuity, finding that the low visual acuity of the species makes it unlikely that visual stimulus is the main driver of behavioral change towards drones for terrestrial megafauna.
The noise generated by this multirotor drone model when used at the maximum altitude, 120 m AGL, recommended by the main international agencies such as EASA (European Union Aviation Safety Agency) in Europe and FAA (Federal Aviation Agency) in United States, did not generate sufficiently high sound pressure in the low frequencies differing from the ambient noise, and a negligible difference in the medium and high frequencies. This aligns by the results obtained that none of the species analyzed were disturbed at this maximum altitude. This shows that flights with certain types of drones within the maximum allowed altitude can be conducted without causing noticeable disturbance to megafauna species. While another study using other multirotor and fixed-wing drone models recommends flights above 200 m to avoid auditory detection by ungulates, dogs, cats, and other species [22], we found that with the sound profile of the drone we used here, the flight altitude could be lowered to 120 m AGL without causing visible disturbance to the species. When analyzing the sound profile of seven different multirotor drone models, including the model in this study, as the drones move farther than 100 m away, the noises tend to converge to near ambient noise [23].
Among all the species analyzed based on the audiogram, the Asian elephant was the only species disturbed by the drone above 100 m AGL. Their ability to hear low-frequency noises plus their high capacity to propagate low-frequency sounds makes elephants one of the most sensitive species to drone noise. This result supports information from [34] that elephants primarily use their auditory, olfactory, and seismic senses when interacting with their environment and when communicating with conspecifics. Besides the Asian elephant, the giraffe was another species that was disturbed by the drone above 100 m AGL. Although we could not analyze the hearing sensitivity at different frequencies because there is no audiogram of species or of the same family, the giraffe can also be considered one of the species that can possibly hear low sound pressure at low frequencies, since drone models such as this one at high altitudes (>100 m) are not able to emit noise sound pressure level at high frequencies capable of differing significantly from the high frequency of the ambient sound. While in game reserve areas in Africa, the African elephant has been observed to became vigilant with the drone from 50 m and the giraffe from 80 m AGL [18], here, the Asian elephant and giraffe showed a change in behavior with the drone above 100 m AGL and sound pressure below 40 dB. In addition to the fact that the African elephant studied in Ref. [18] is a different species in a different environmental context from the one studied here, we highlight some factors that were different from those used in this study, such as drone model and its sound profile, which may explain the difference in the results. Even in studies using similar methodology to this one and using the same drone model as the one proposed by [23], the results may be different. While Ref. [23] suggested 10 m AGL as an advisable altitude to fly the Mavic Pro model over the Asian elephant, we find that at altitudes above 100 m AGL, there is already a behavioral change in the species. In relation to the giraffe’s high sensitivity, another aspect to be considered is the fact that it is the tallest terrestrial species on the planet, so its auditory system is physically closer to the drone noise, about 5 m closer compared to other species. The maned wolf is one of the threatened species analyzed in this study for the first time using drones, and was more sensitive than species of the families Bovidae, Camelidae, Cervidae, Felidae, and Suidae. This is probably compatible with its biological and ecological characteristics, being a canine species with good hearing and long ears, which are suggested to help in the hunting of small prey usually hidden in soil vegetation [35].
One of the species that was not analyzed using audiograms but studied against drones for the first time was the giant anteater, an endangered species and the largest species of the order Pilosa. Considering its reduced auditory and visual capacity [36], we confirmed that as expected, this species was be the least sensitive to drones, since it withstood the highest sound pressure before showing behavioral change. This is particularly interesting for monitoring purposes, since the giant anteater is one of the few large mammal species in the hotspot Cerrado [37] that can be identified in open areas of this biome using drones. The data collected in this study along with other data collected in nature about the giant anteater serve as preliminary parameters to define the best flight altitude for monitoring and population analysis of the species avoiding noticeable disturbance. White rhinoceros, one of the most endangered species in Africa and another species that was not analyzed using audiograms, was one of the three most sensitive species affected by the drone noise at an average altitude of 90 m AGL. These results were close to the recommendations suggesting flights with drones between 100 and 180 m AGL to avoid possible disturbances to the species while allowing the identification of possible poachers in the African savannas [38].
The Asian elephant and giraffe were the two species that showed behavioral change towards the drone above 100 m AGL. Considering that at this altitude it is difficult for a human to visually spot the drone model used in this study, and that the Asian elephant and the giraffe have visual acuity 76.6% and 58.3% lower than humans respectively, we suggest that the behavioral change was not influenced by the visual stimulus but rather the noise. The same may apply for the imperial zebra, which has a visual acuity 61.6% lower than humans and showed behavioral change with the drone at 85 m AGL. All other species, except for felines, have visual acuity over 70% lower than humans and thus are not expected to visually spot the drone above 50 m AGL. However, while the felines have 61.6% lower visual acuity than humans, they may have suffered a behavioral change also due to the drone visual stimulus, since the feline species displayed behavioral change with the drone at the lowest altitude, 38 and 40 m AGL, and at these altitudes, the visualization of the drone by humans is not difficult.
Despite having identified a sound pressure level for each altitude for which there is a change in behavior in each species, it should be considered that within the sound pressure level found, there are other values for the different frequency bands of the sound. Each species can identify different sound pressure levels at different frequencies, making them sensitive to sounds in certain frequency ranges. Although among mammals the basis of comparison is humans, with the capacity to identify sound pressure that varies between frequencies of 0.016 and 18 kHz, with a minimum of 40 dB and a maximum bearable of 70 dB [39], this range can be enlarged or reduced depending on the mammal species [28]. While the sound meter used in this study is limited to 20 kHz, some species have the highest audible frequency (in Hz, ultrasounds), reaching up to 68 kHz with sound pressure above 40 dB in some felines [40], which means that these species may have perceived lower sound pressure at higher frequencies not considered in this study. Ratifying the generalization that the highest audible frequency for a given species is negatively correlated with body, head, and ossicle sizes [41] and the hearing capacity of elephants [42], here we observed that the Asian elephant was the only species that showed signs of perceiving the drone noise at low frequencies, with the low sound pressure level. Since the attenuation of the sound with the distance in an open field is proportional to the frequency—that is, high-pitched sounds propagate only in a few meters, while low-pitched sounds can be heard from kilometers away [31]—we infer that the Asian elephant’s ability to perceive the drone noise at high altitudes is due to the perception of sounds at low frequencies emitted by the drone. In contrast, we highlight the species of the families Bovidae, Canidae, Equidae, Felida, and Suidae, which are highly sensitive to drone noise at high frequencies, which inferred greater capacity to hear lower sounds pressures over shorter distances considering the attenuation of the sound.
Although taxonomically close species are more likely to be morphologically and physiologically similar, other traits (biological, ecological, and ethological) can influence species’ ability to perceive drones. While most studies that analyze behavioral audiogram of large terrestrial mammals are based on a few individuals [24,42,43,44], we suggest increasing the sample numbers to improve the consistency of the results. Among the ethological aspects, it is worth noting that animals in ex situ environments, such as zoos, may behave differently from animals in in situ environments when exposed to drones. Prey species such as bovids, cervids, and equines studied in this experiment would possibly have more intense surveillance behavior in natural environments due to the risk of being preyed upon by other species. Similarly, predator species could also have their auditory senses more acute since they would possibly be in search of prey. In practice, considering the few studies that have analyzed the behavior of large mammal species in an ex situ environment with drone use [10,18], we cannot infer that this experiment carried out in in situ environments would bring more conservative results regarding the drone altitude. While the zebra showed behavioral change with the drone above 100 m AGL in [18], higher than in this experiment, the giraffe showed behavioral change with the drone between 50 and 80 m AGL and the African elephant showed behavioral change only with the drone between 30 and 50 m AGL, also lower than in this experiment. In [10], about 50% of llamas in in situ areas reacted with the drone at about 180 m AGL, while in this experiment, the dromedary of the same family showed behavioral change with the drone at an average altitude of 48 m AGL. It is worth noting once again that in these studies, the drone models and types of flights were different, which may further contribute to the difference in results.
There are several other sources of noise in in situ and ex situ environments such as zoos that can negatively affect species in certain situations, such as vehicles, machinery, people, and drones—if not used properly—can become unnecessary additional sources of disturbance. Animal habituation in ex situ areas is complex, but it is generally accepted that animals tend to become habituated to anthropic noise over time [45]. At the same time, as none of the studied animals had previous contact with drones, we can assume that none of the animals were habituated to these. In studies in in situ environments, such as areas in Antarctica [46], observers noticed that although polar bears exhibited increased vigilance behavior when exposed to drone use, as well as in the presence of tourist tundra vehicles, they did not exhibit the avoidance behavior common to anthropogenic disturbances, suggesting that the species was not habituated to drone presence. Based on this type of observation in the various studies conducted with drones in Antarctica, a group of researchers found that sudden changes in the intensity of drone noise are more likely to cause behavioral change in species present in Antarctica and habituation has not been observed during the existing short-term studies [47].
An important factor that led us to carry out this study is the growing diversity of drone models on the market. Different drone models have different sound profiles, and these profiles have a greater amplitude difference at lower frequencies and more intensely at lower altitudes [23]. Moreover, the numerous multi-rotor models drones available, with different sizes, shapes, and sensors’ capacities, make the flight altitude just one more factor associated with potential disturbances on wildlife. Therefore, it is important to account for drone noise characteristics of given drone models in addition to the typically investigated drone altitude. The São Paulo Zoo where this study was developed is one of several ex situ areas where there is no internal policy on the use of drones, but in practice, it is not allowed to use them without prior authorization from the managers. In the in situ areas [48], especially in remote natural areas, the regulation and inspection of the drone use on wildlife is practically inexistent, which can cause conflicts with wildlife, mainly by recreational drone users, as demonstrated in several videos [21]. Even within the scientific community, where researchers seek to consider the best conducts and protocols to reduce drone disturbance in wildlife, there is still little information regarding specific data of the target species, and existing studies focus on drone altitude as the main factor influencing wildlife disturbance.

5. Conclusions

Considering that not only drone flight altitudes but also drone sound properties affect perception by each species is fundamental to minimize the disturbance of mammal species. Despite the limitations of this study regarding the environmental context and the sample size, the information presented here, in addition to bringing unpublished data for some species, can help make the use of drones safer and with less impact on the target species. Moreover, this experimental work contributes to the creation of possible future drone user guides on wildlife based on the type of drone and its sound profile. We suggest that before establishing guidelines for drone flights over certain species of mammals, the sound pressure level emitted by the drone model to be used is considered, and the minimum flight altitude over a given species should be considered as the altitude that has the minimum sound pressure value supported by the species.

Supplementary Materials

The following supporting information can be downloaded at: https://www.mdpi.com/article/10.3390/drones6110333/s1, Figure S1: Sound pressure level (dB) at the different frequencies of 1/3 of an octave (kHz) detected by the species. The analysis graphs of the dB ratio of the drone’s noise and the frequency of 1/3 of an octave (Hz) that caused behavioral changes of all species are available online. The authors are solely responsible for the content and functionality of these materials. Queries (other than absence of the material) should be directed to the corresponding author.

Author Contributions

Conceptualization, G.P.M.; Data curation, G.P.M.; Formal analysis, G.P.M., M.M.-P., S.A.W. and J.D.R.-T.; Funding acquisition, J.D.R.-T.; Investigation, G.P.M.; Methodology, G.P.M. and J.D.R.-T.; Project administration, G.P.M.; Resources, G.P.M.; Supervision, M.M.-P., S.A.W. and J.D.R.-T.; Writing the manuscript, G.P.M., M.M.-P., S.A.W. and J.D.R.-T. All authors have read and agreed to the published version of the manuscript.

Funding

M.M.P. contract is funded by the European Union “NextGenerationEU” Programa María Zambrano, Ministerio de Universidades, Spain. Fundación Barcelona Zoo, 310557 Project (Ayuntamiento de Barcelona).

Informed Consent Statement

Not applicable.

Acknowledgments

The authors are grateful to the Neotropical Grassland Conservancy for donating the drone used in this study; Fundação de Amparo a Pesquisa e Desenvolvimento Científico (FAPEMA) and Becas Iberoamérica Santander Investigación, for funding part of the study; and the Fundação Parque Zoológico de São Paulo for providing permission and access to the park, in particular the mastofauna manager, L.H.M., for the availability and assistance in the field. This study was carried out within the framework of biodiversity program at the Autonomous University of Barcelona.

Conflicts of Interest

The authors declare no conflict of interest.

References

  1. Chabot, D.; Bird, D.M. Wildlife research and management methods in the 21st century: Where do unmanned aircraft fit in? J. Unmanned Veh. Syst. 2015, 3, 137–155. [Google Scholar] [CrossRef] [Green Version]
  2. Christie, K.S.; Gilbert, S.L.; Brown, C.L.; Hatfield, M.; Hanson, L. Unmanned aircraft systems in wildlife research: Current and future applications of a transformative technology. Front. Ecol. Environ. 2016, 14, 241–251. [Google Scholar] [CrossRef]
  3. Jiménez, L.J.; Mulero-Pázmány, M. Drones for Conservation in Protected Areas: Present and Future. Drones 2019, 3, 10. [Google Scholar] [CrossRef] [Green Version]
  4. Anderson, K.; Gaston, K.J. Lightweight unmanned aerial vehicles will revolutionize spatial ecology. Front. Ecol. Environ. 2013, 11, 138–146. [Google Scholar] [CrossRef] [Green Version]
  5. Linchant, J.; Lisein, J.; Semeki, J.; Lejeune, P.; Vermeulen, C. Are unmanned aircraft systems (UASs) the future of wildlife monitoring? A review of accomplishments and challenges. Mammal Rev. 2015, 45, 239–252. [Google Scholar] [CrossRef]
  6. Hodgson, J.C.; Mott, R.; Baylis, S.M.; Pham, T.T.; Wotherspoon, S.; Kilpatrick, A.D.; Raja Segaran, R.; Reid, I.; Terauds, A.; Koh, L.P. Drones count wildlife more accurately and precisely than humans. Methods Ecol. Evol. 2018, 9, 1160–1167. [Google Scholar] [CrossRef] [Green Version]
  7. Kellenberger, B.; Marcos, D.; Tuia, D. Detecting mammals in UAV images: Best practices to address a substantially imbalanced dataset with deep learning. Remote Sens. Environ. 2018, 216, 139–153. [Google Scholar] [CrossRef] [Green Version]
  8. Rey, N.; Volpi, M.; Joost, S.; Tuia, D. Detecting animals in African Savanna with UAVs and the crowds. Remote Sens. Environ. 2017, 200, 341–351. [Google Scholar] [CrossRef] [Green Version]
  9. Schofield, G.; Esteban, N.; Katselidis, K.A.; Hays, G.C. Drones for research on sea turtles and other marine vertebrates—A review. Biol. Conserv. 2019, 238, 108214. [Google Scholar] [CrossRef]
  10. Schroeder, N.M.; Panebianco, A.; Gonzalez, M.R.; Carmanchahi, P. An experimental approach to evaluate the potential of drones in terrestrial mammal research: A gregarious ungulate as a study model. R. Soc. Open Sci. 2020, 7, 191482. [Google Scholar] [CrossRef]
  11. Bonnin, N.; Van Andel, A.; Kerby, J.; Piel, A.; Pintea, L.; Wich, S. Assessment of Chimpanzee Nest Detectability in Drone-Acquired Images. Drones 2018, 2, 17. [Google Scholar] [CrossRef] [Green Version]
  12. Olsoy, P.J.; Shipley, L.A.; Rachlow, J.L.; Forbey, J.S.; Glenn, N.F.; Burgess, M.A.; Thornton, D.H. Unmanned aerial systems measure structural habitat features for wildlife across multiple scales. Methods Ecol. Evol. 2018, 9, 594–604. [Google Scholar] [CrossRef]
  13. Mulero-Pázmány, M.; Jenni-eiermann, S.; Strebel, N.; Sattler, T.; Jose, J. Unmanned aircraft systems as a new source of disturbance for wildlife: A systematic review. PLoS ONE 2017, 12, e0178448. [Google Scholar] [CrossRef] [PubMed] [Green Version]
  14. Van der Vliet, R.E.; Jeninga, L.; van den Burg, A. RPAS over Natura 2000 areas: Disturbance responses of wildlife and opportunities for research RPAS over Natura 2000 areas: Disturbance responses of wildlife and opportunities for research. In Proceedings of the RPAS Civil Operators & Operations Forum 8th Annual International Conference, The Hague, The Netherlands, 30 December 2019. [Google Scholar]
  15. Brisson-Curadeau, É.; Bird, D.; Burke, C.; Fifield, D.A.; Pace, P.; Sherley, R.B.; Elliott, K.H. Seabird species vary in behavioural response to drone census. Sci. Rep. 2017, 7, 17884. [Google Scholar] [CrossRef] [Green Version]
  16. Mesquita, G.P.; Rodríguez-Teijeiro, J.D.; Wich, S.A.; Mulero-Pázmány, M. Measuring disturbance at swift breeding colonies due to the visual aspects of a drone: A quasi-experiment study. Curr. Zool. 2021, 67, 157–163. [Google Scholar] [CrossRef]
  17. Ditmer, M.A.; Vincent, J.B.; Werden, L.K.; Tanner, J.C.; Laske, T.G.; Iaizzo, P.A.; Garshelis, D.L.; Fieberg, J.R. Bears Show a Physiological but Limited Behavioral Response to Unmanned Aerial Vehicles. Curr. Biol. 2015, 25, 2278–2283. [Google Scholar] [CrossRef] [Green Version]
  18. Bennitt, E.; Bartlam-Brooks, H.L.A.; Hubel, T.Y.; Wilson, A.M. Terrestrial mammalian wildlife responses to Unmanned Aerial Systems approaches. Sci. Rep. 2019, 9, 2142. [Google Scholar] [CrossRef] [Green Version]
  19. Hodgson, J.C.; Koh, L.P. Best practice for minimising unmanned aerial vehicle disturbance to wildlife in biological field research. Curr. Biol. 2016, 10, R404–R405. [Google Scholar] [CrossRef] [Green Version]
  20. Moleón, M.; Sánchez-Zapata, J.A.; Donázar, J.A.; Revilla, E.; Martín-López, B.; Gutiérrez-Cánovas, C.; Getz, W.M.; Morales-Reyes, Z.; Campos-Arceiz, A.; Crowder, L.B.; et al. Rethinking megafauna. Proc. R. Soc. B Biol. Sci. 2020, 287, 20192643. [Google Scholar] [CrossRef]
  21. Rebolo-Ifrán, N.; Graña Grilli, M.; Lambertucci, S.A. Drones as a Threat to Wildlife: YouTube Complements Science in Providing Evidence about Their Effect. Environ. Conserv. 2019, 46, 205–210. [Google Scholar] [CrossRef]
  22. Scobie, C.A.; Hugenholtz, C.H. Wildlife monitoring with unmanned aerial vehicles: Quantifying distance to auditory detection. Wildl. Soc. Bull. 2016, 40, 781–785. [Google Scholar] [CrossRef]
  23. Duporge, I.; Spiegel, M.P.; Thomson, E.R.; Chapman, T.; Lamberth, C.; Pond, C.; Macdonald, D.W.; Wang, T.; Klinck, H. Determination of optimal flight altitude to minimise acoustic drone disturbance to wildlife using species audiograms. Methods Ecol. Evol. 2021, 12, 2196–2207. [Google Scholar] [CrossRef]
  24. Heffner, H.E.; Heffner, R.S. The Behavioral Study of Mammalian Hearing. In Springer Handbook of Auditory Research; Springer: Berlin/Heidelberg, Germany, 2014; pp. 269–285. [Google Scholar]
  25. Veilleux, C.C.; Kirk, E.C. Visual Acuity in Mammals: Effects of Eye Size and Ecology. Brain Behav. Evol. 2014, 83, 43–53. [Google Scholar] [CrossRef] [PubMed]
  26. ISO-3746; Acoustics—Determination of Sound Power Levels and Sound Energy Levels of Noise Sources Using Sound Pressure—Survey Method Using an Enveloping Measurement Surface over a Reflecting Plane. International Organization for Standardization: Geneva, Switzerland, 2010.
  27. ANAC—Agência Nacional de Aviação Civil. Regulamento Brasileiro de Aviação Civil Especial RBAC-E nº 94. Requisitos Gerais para Aeronaves Não Tripuladas de Uso Civil. Resolução nº 419. 2017. Available online: https://www.anac.gov.br/assuntos/legislacao/legislacao-1/rbha-e-rbac/rbac/rbac-e-94/@@display-file/arquivo_norma/RBACE94EMD00.pdf (accessed on 20 January 2021).
  28. Behavioral Audiograms of Mammals. Available online: https://www.utoledo.edu/al/psychology/research/psychobio/audiograms2.html (accessed on 15 July 2018).
  29. Da Silva Souza, G.; Gomes, B.D.; Silveira, L.C.L. Comparative neurophysiology of spatial luminance contrast sensitivity. Psychol. Neurosci. 2011, 4, 29–48. [Google Scholar] [CrossRef] [Green Version]
  30. Caves, E.M.; Brandley, N.C.; Johnsen, S. Visual Acuity and the Evolution of Signals. Trends Ecol. Evol. 2018, 33, 358–372. [Google Scholar] [CrossRef]
  31. Peixoto, N.H.; Ferreira, L.S. Higiene Ocupacional III; UFSM/CTISM: Santa Maria, Brazil; Rede e-Tec: Brasilia, Brazil, 2013. [Google Scholar]
  32. Sikes, R.S.; Gannon, W.L. Guidelines of the American Society of Mammalogists for the use of wild mammals in research. J. Mammal. 2011, 92, 235–253. [Google Scholar] [CrossRef] [Green Version]
  33. Turner, J.G.; Bauer, C.A.; Rybak, L.P. Noise in animal facilities: Why it matters. J. Am. Assoc. Lab. Anim. Sci. 2007, 1, 10–13. [Google Scholar]
  34. Moss, C.J.; Croze, H.J. (Eds.) The Amboseli Elephants: A Long-Term Perspective on a Long-Lived Mammal; Chicago University Press: Chicago, IL, USA, 2008. [Google Scholar]
  35. Paula, R.C.; Gambarini, A. Histórias de um Lobo; Avis Brasilis Editora Vinhedo: São Paulo, Brazil, 2013; p. 264. [Google Scholar]
  36. Nowak, R.M. Walker’s Mammals of the World; The Johns Hopkins University Press: Baltimore, MD, USA; London, UK, 1999; p. 836. [Google Scholar]
  37. Sawyer, D.; Coutinho, B.; Figueiredo, I.; Navega, R. Perfil do Ecossistema Hotspot de Biodiversidade do Cerrado. 2017. Available online: http://cepfcerrado.iieb.org.br/wp-content/uploads/2017/09/PR_Cerrado-Perfildo-Ecossistema_TEXTOAPENDICES_port_revisada-20170804.compressed.pdf (accessed on 15 July 2018).
  38. Mulero-Pázmány, M.; Stolper, R.; van Essen, L.D.; Negro, J.J.; Sassen, T. Remotely Piloted Aircraft Systems as a Rhinoceros Anti-Poaching Tool in Africa. PLoS ONE 2014, 9, e83873. [Google Scholar] [CrossRef] [Green Version]
  39. ISO-R-226:2003; Normal Equal-Loudness Level Contours. International Organization for Standardization: Geneva, Switzerland, 2003. Available online: https://www.iso.org/standard/34222.html (accessed on 15 July 2018).
  40. Heffner, R.S.; Heffner, H.E. Hearing range of the domestic cat. Hear. Res. 1985, 19, 85–88. [Google Scholar] [CrossRef]
  41. Rosowski, J.J. Outer and Middle Ears. In Comparative Hearing: Mammals; Springer: Berlin/Heidelberg, Germany, 1994; pp. 172–247. [Google Scholar]
  42. Heffner, R.S.; Heffner, H.E. Hearing in the elephant (Elephas maximus): Absolute sensitivity, frequency discrimination, and sound localization. J. Comp. Physiol. Psychol. 1982, 96, 926–944. [Google Scholar] [CrossRef]
  43. Heffner, R.; Heffner, H. Hearing in large mammals: The horse (Equus caballus) and cattle (Bos taurus). Behav. Neurosci. 1983, 97, 299–309. [Google Scholar] [CrossRef]
  44. Heffner, H., Jr.; Heffner, H.E. The behavioral audiogram of whitetail deer (Odocoileus virginianus). J. Acoust. Soc. Am. 2010, 127, EL111–EL114. [Google Scholar] [CrossRef] [PubMed] [Green Version]
  45. Hosey, G.; Melfi, V.; Pankhurst, S. Zoo Animals: Behaviour, Management, and Welfare, 2nd ed.; Oxford University Press: Oxford, UK, 2013. [Google Scholar]
  46. Barnas, A.F.; Felege, C.J.; Rockwell, R.F.; Ellis-Felege, S.N. A pilot(less) study on the use of an unmanned aircraft system for studying polar bears (Ursus maritimus). Polar Biol. 2018, 41, 1055–1062. [Google Scholar] [CrossRef]
  47. Mustafa, O.; Barbosa, A.; Krause, D.J.; Peter, H.-U.; Vieira, G.; Rümmler, M.-C. State of knowledge: Antarctic wildlife response to unmanned aerial systems. Polar Biol. 2018, 41, 2387–2398. [Google Scholar] [CrossRef]
  48. Braverman, I. Conservation without nature: The trouble with in situ versus ex situ conservation. Geoforum 2014, 51, 47–57. [Google Scholar] [CrossRef]
Figure 1. Design of the experimental flight on the left, and the observer’s view on the right.
Drones 06 00333 g001
Figure 2. Sound pressure level (dB) at the 36 different frequencies of 1/3 of an octave (Hz). In gray is the spectrum of ambient sound, red is the drone noise at 5 m AGL, green is the drone noise at 60 m AGL, and blue is the drone noise at 120 m AGL.
Drones 06 00333 g002
Figure 3. Sound pressure level (dB) at the different frequencies of 1/3 of an octave (kHz) detected by the species. In gray is the spectrum of sound pressure not detected by the species considering the family audiogram. (a) Species from Bovidae family; (b) species from Canidae family.
Drones 06 00333 g003
Figure 4. Sound pressure level (dB) at the different frequencies of 1/3 of an octave (kHz) detected by the species. In gray is the spectrum of sound pressure not detected by the species considering the family audiogram. (a) Species from Equidae Elephantidae family; (b) species from Suidae family.
Drones 06 00333 g004
Table 1. Terrestrial megafauna species analyzed.
Common NameSpeciesFamily
AddaxAddax nasomaculatusBovidae
CattleBos taurusBovidae
WaterbuckKobus ellipsiprymnusBovidae
DromedaryCamelus dromedariusCamelidae
Maned wolf Chrysocyon brachyurusCanidae
Red deer Cervus elaphusCervidae
SambarRusa unicolorCervidae
Asian elephant Elephas maximusElephantidae
Imperial zebra Equus grevyiEquidae
JaguarPanthera oncaFelidae
Bengal tigerPanthera tigris tigrisFelidae
GiraffeGiraffa camelopardalisGiraffidae
HippopotamusHippopotamus amphibiusHippopotamidae
Giant anteater Myrmecophaga tridactylaMyrmecophagidae
White rhinoceros Ceratotherium simum simumRhinocerotidae
WarthogPhacochoerus africanusSuidae
TapirTapirus terrestrisTapiridae
Spectacled bearTremarctos ornatusUrsidae
Publisher’s Note: MDPI stays neutral with regard to jurisdictional claims in published maps and institutional affiliations.

