Article

GPS-Spoofing Attack Detection Technology for UAVs Based on Kullback–Leibler Divergence

1
Institute for Computer Technologies and Information Security, Southern Federal University, Chekhova 2, 347922 Taganrog, Russia
2
Faculty of Science, Gardens Point Campus, Queensland University of Technology (QUT), Brisbane, QLD 4001, Australia
*
Author to whom correspondence should be addressed.
Submission received: 30 November 2021 / Revised: 25 December 2021 / Accepted: 26 December 2021 / Published: 29 December 2021
(This article belongs to the Special Issue Conceptual Design, Modeling, and Control Strategies of Drones)

Abstract

:
Here, we developed a method for detecting cyber security attacks aimed at spoofing the Global Positioning System (GPS) signal of an Unmanned Aerial Vehicle (UAV). Most methods for detecting UAV anomalies indicative of an attack use machine learning or other such methods that compare normal behavior with abnormal behavior. Such approaches require large amounts of data and significant “training” time to prepare and implement the system. Instead, we consider a new approach based on other mathematical methods for detecting UAV anomalies without the need to first collect a large amount of data and describe normal behavior patterns. Doing so can simplify the process of creating an anomaly detection system, which can further facilitate easier implementation of intrusion detection systems in UAVs. This article presents issues related to ensuring the information security of UAVs. Development of the GPS spoofing detection method for UAVs is then described, based on a preliminary study that made it possible to form a mathematical apparatus for solving the problem. We then explain the necessary analysis of parameters and methods of data normalization, and the analysis of the Kullback—Leibler divergence measure needed to detect anomalies in UAV systems.

1. Introduction

Here, we address the need for a method of detecting cyber security attacks that begins by spoofing the GPS signal of an Unmanned Aerial Vehicle (UAV) [1,2,3]. A significant number of previous methods for detecting UAV system anomalies are based on machine learning or similar methods that distinguish normal and abnormal behaviors but need large amounts of training data and significant time to prepare and implement the system [4,5].
Methods of signal quality monitoring detect false signals by distorting the correlation peak [1]. However, they can erroneously treat multipath signals as spurious because multipath signals can also distort the correlation peak. Receiver Autonomous Integrity Monitoring (RAIM) can verify measurement consistency; therefore, it can eliminate one or two spoofing signals, but many spoofing signals can still invalidate the method [2]. Spread Spectrum Security Codes (SSSCs) and Navigation Message Authentication (NMA) can recognize false signals by encrypting the signal. However, these methods are impractical as they require modifications to the existing system [3]. Methods with additional sensors such as multiple antennas, power measurement equipment, and inertial navigation systems (INS) are usually reliable, but the cost of precision sensors is prohibitive [6,7]. A few previous studies have been devoted to various ways of improving the noise immunity of equipment, such as in the operating frequency band of a radio receiver relating to the higher harmonic components of the radiation of transmitters of communication systems [8].
Anti-spoofing methods are based on two principles: encryption and non-encryption. Encryption-based methods use unpredictable security codes contained in navigation signals; thus, they are more complex and require changes in the structure of the GPS [9]. In non-encryption methods, such codes are not used; instead, they are based on observable changes or various properties of the received signals. Such methods typically use multi-antenna and multi-frequency receivers, as well as differential stations [10].
The following techniques are commonly used to mitigate spoofing in non-encryption methods:
  • Monitoring the average GPS signal level. The average level of the received signal is monitored, and high or low values make it possible to judge the likelihood of spoofing [11,12,13].
  • Monitoring step changes in the GPS signal level. The changes in the signal level are monitored, recorded and compared with the previous recorded value. Large changes in these dimensions may indicate a spoofing attack [14].
  • Controlling the rate of change of the pseudo-range. Any significant and unexpected changes in the values of the pseudo-range may indicate the presence of a spoofing attack [15].
  • Recording time shifts. GPS receivers have accurate clocks. Time data can be used to understand if the GPS signal is being spoofed. A large time difference between the clock readings of the receiver and the satellite may indicate spoofing. However, this method requires further study [13,16].
  • The simultaneous use of two Global Navigation Satellite System (GNSS) signals. The Russian Global Navigation Satellite System (GLONASS) and the American GPS [17,18,19,20,21] contribute to an increase in the noise immunity and accuracy of the users’ GNSS equipment.
One issue that requires special attention when combining GPS and GLONASS is the structural differences between the systems. Some differences relate to coordinate and time systems. For example, GPS uses WGS 1984 (WGS-84), while GLONASS uses Earth Parameters 1990 (PZ-90.02). This is an inevitable and important problem for all integrated systems [12,19].
With the development of anti-interference technology, a new generation of satellite navigation receivers has adopted several interference suppressions measures, including the use of wave packet transform (WPT) [20], neural network suppression [21], and an adaptive notch filter [22,23] to suppress narrowband interference, but these methods are not suitable for broadband interference cancellation.
Many receivers for interference avoidance use an array power inversion (PI) algorithm to eliminate broadband interference [24,25] or an adaptive beamforming algorithm to improve the output signal-to-noise ratio (SNR) of the array by eliminating interference directions in the formation of a directed beam of the useful GNSS signal [26]. However, an antenna’s degrees of freedom are limited by the number of antenna elements, and space-time adaptive processing (STAP) increases the degrees of freedom without increasing the array elements. This method also has the best performance against interference in a highly dynamic environment [27,28,29].
Some researchers [30,31,32] have proposed an algorithm for detecting spatial correlation when moving a single antenna receiver to reduce the possibility of spoofing by dynamic receivers and have proposed an algorithm for canceling the spoofing. However, due to the widespread use of adaptive antenna array technology in anti-interference receivers, it is currently difficult to interfere with a receiver using only interference or spoofing.
There are also a few fundamentally different methods that relate to visual odometry. These methods are effective in detecting spoofing attacks. A method that allows detecting an attack in real time has been presented in [33]. It does not require additional training or initial data. In addition, some detection methods using a system based on visual and inertial odometry are presented in [34]. The authors propose a method that allows, due to the correlation between the technical vision system and the navigation system, to increase the resistance of the UAV to attacks. Nevertheless, for their implementation, a video camera is required. A UAV, of course, usually has a camera on board, but nevertheless, it is not a mandatory component of a UAV, and thus the method has minor limitations in its application. In addition, questions remain about the impact on the performance of the UAV, how such data processing affects the CPU load, and the consumption of other resources.
The main challenge in this research field is that anomaly detection methods for UAVs should be universal and easily scalable, but due to the wide variety of UAV models and the lack of a standards for their production, development of a scalable and easily adaptable solution becomes difficult. We therefore contend that there is a need to develop a new approach based on other mathematical methods for detecting UAV anomalies without the need to first collect a large amount of data and describe normal behavior patterns. Such an approach would simplify the process of creating an anomaly detection system and facilitate easier implementation of intrusion detection systems in UAVs.
In this article, we first present several issues related to ensuring the information security of UAVs and self-organizing groups of UAVs necessary to achieve this goal. An analytical review of analogues of the developed anti-spoofing GPS technology for UAVs has been completed:
  • The main directions of research in the field of anti-spoofing for satellite navigation systems were analyzed;
  • We have considered the existing methods of detecting and preventing spoofing attacks on navigation systems.
Next, we describe how the development of our new GPS spoofing detection method for detecting attacks based on the parameters of the sensor system of an unmanned vehicle was devised, which allows the UAV to detect an attack without the need for prior knowledge about the reference change of sensor sensors, in real time, autonomously.

2. Materials and Methods

2.1. Preliminary Research

The open nature of GPS signals makes them vulnerable to GPS spoofing attacks, which can be performed overtly or covertly. In the first case, a powerful signal produced by the attacker overwhelms the signal coming from the satellites. This attack is easy to perform but requires considerable energy [33]. When implementing a covert attack, the signal power gradually increases until the target system completely switches to the signal broadcast by the attacker. This approach is more complex and requires more components and more detailed preparation but uses less energy and ensures a smooth transition of the target system. If the UAV is fully automated, then the airborne guidance system will lead the UAV to a false target location or ground station. This type of attack will result in mission failure and the possible loss of the UAV. However, if the position of the UAV is not chosen accurately enough by the attacker, then the UAV security system can detect the anomaly, and the UAV can switch to manual control or change the trajectory according to a preset behavior scenario [35]. Inaccurate timing can also lead to the detection of an attack or failure of internal system synchronization.
To obtain experimental data for our research and simulate the behavior of the UAV under normal conditions and during an attack, a method of full-scale simulation was chosen. To implement full-scale modeling, a UAV was developed, which includes the components shown in Figure 1.
A QGroundControl planner was used to control the UAV’s flight. QGroundControl provides full flight control and mission planning for any UAV with MAVLink protocol support. Based on the results of the mission, two types of journals were formed, which were further analyzed. To carry out the attack, a specialized radio frequency module HackRF One was used. During the tests involving an attack, the UAV was not attacked for 3–5 min, and then the attack was carried out for 10 min. During the attack, the attacker set a fake UAV location. Consequently, a change in the height of the UAV was observed, as well as a smooth displacement of the UAV to the point set by the attacker. In several experiments, when the attack was abruptly interrupted, a fall of the UAV was observed.
The number of false satellites created depends on the capabilities of the intruder. With a powerful transmitting antenna, an attacker can create many satellite signals. At the same time, the number of satellites on which the UAV is fixed can change, especially in the early stages of an attack. Conversely, the attacker cannot know exactly how many satellites the UAV sees and how many satellites it has fixed. The number of satellites fixed by a UAV is influenced by several factors: weather conditions, flight altitude, and the terrain where the UAV is located.
Below, we analyze several experiments that were performed using the UAV described above. Table 1 presents an estimate of the number of satellites for a UAV and for a mobile phone. The UAV and mobile phone were in equal conditions: they were at the same distance from the earth’s surface, in the same environmental conditions and geographic location, and close to each other. However, they had different GPS receivers. On the day of the experiment, the weather was fine but cloudy.
At the time of data collection, the mobile phone fixed 11 GPS satellites. At the same time, the UAV fixed 14 satellites. It can be seen from the table that the UAV usually fixed about 15 satellites, but sometimes this value changed. In the second case, it increased to 16, and then returned to the original value 15. These data were obtained when the UAV took off slightly, whereas during the first experiment, where the number of satellites was estimated as 14, the UAV was on the ground. That is, when the UAV’s altitude is a little higher, literally only a meter or two, there were already changes. Next, consider the third experiment. The difference between the experiments was only in the weather conditions.
In the second experiment, partly cloudy weather and strong winds were observed. The number of satellites detected by the UAV was 16, which was more than during the first experiment. During the fourth experiment, the number of satellites fixed became 17. Table 1 shows that the number of satellites determined by a mobile phone is significantly fewer than that recorded by the UAV. Thus, it is quite difficult for an attacker relying on another device to determine how many satellites the UAV sees to fake this value. In the case of the attack carried out during the fifth experiment, the attacker did not have sufficient power to complete the attack; thus, the number of satellites fixed kept changing dramatically. The result of fixing the number of satellites during the third experiment for the UAV is shown in Figure 2.
It can be seen from Figure 2 that when the attack began, the number of satellites fixed began to change dramatically as shown by the gray line. At the point the attack begins, the graph takes on a completely different look than previously recorded.
The Kullback–Leibler divergence (KLD) measure of the difference between two statistical distributions is ideal for solving the problem of comparing two probability distributions at different time intervals. It is a simple and versatile tool that reduces the task of describing the statistical difference between two datasets to a single number. Any discrete process or dataset can be modeled using the Probability Mass Function (PMF) [16]. Given data samples without anomalies, the empirical PMF characterizing “normal” behavior can be estimated using a histogram. Subsequent PMF estimates of the observed data can then be compared to “normal” behavior using the KLD to establish the presence of an anomaly. Real-time implementation and integration into existing devices are possible due to low computational costs [36].
Xiang et al. [37] proposed two approaches based on generalized entropy and an information distance metric for detecting low-speed Distributed Denial-of-Service (DdoS) attacks. However, the implementation of these approaches requires all routers in the networks to work together to detect low-speed DdoS attacks, which complicates their implementation in practice. Bhatia [38] presented an ensemble-based model with an exponentially weighted moving average (EWMA) scheme for detecting DdoS attacks in network traffic and isolating flash events. This approach takes advantage of traffic characteristics (that is, packets and IP address), server load (CPU and memory), and the relationship between them. Bouyeddou et al. [39] proposed an efficient KLD-based approach for detecting DoS/DdoS ICMP flooding attacks. KLD is a well-known metric for quantifying the distance between two probability distributions, widely used in several fields, including information theory, statistical inference, and data mining. It is used in fields such as classification, speech and image recognition, telecommunications, industry, and medicine.
Our approach relies on the Kullback–Leibler divergence measure. A disadvantage of most previous studies into detecting anomalies using this measure is the need for a normal-operation reference state to compare to the current state. If it is necessary to evaluate a certain signal or changes in the indicators of sensors for the presence of an anomaly, then the normal state is extracted from the model or the normal operation of the system or device, and then the subsequent states of the system or device is compared with this normal state. For a system with features as complex as those in a UAV, this may not be possible.
First, there is the problem of multiple vendors using non-standardized equipment. There are several global navigation systems, and each has its own number of available satellites. In addition, there is equipment that allows combinations of several navigation systems. Second, the system behavior depends not only on the equipment but also on what goals and objectives the UAV performs, e.g., whether it is in observation or cargo delivery mode, hovering over an object, or on a full-fledged flight over long distances. If a UAV performs a long-term mission it needs to save resources, but if it is conducting video surveillance then it needs to quickly navigate, etc. Third, much also depends on the architecture of the UAV system. It can be an autonomous device, part of a UAV group, or be a UAV group, but the program for each has been defined earlier. The UAV can also be controlled remotely by the operator. All these factors make it difficult to search for anomalies by comparing the current state with an assumed “normal” one.
Further, to determine the presence of an anomaly or a change in state, it is necessary to determine to what extent the distributions differ from each other. It is the comparison of functions of probability distributions, rather than raw data, that gives a more accurate result. The absolute values can be different, but the changes observed in the analysis of such raw data will not necessarily indicate an anomaly or attack [22]. For example, when the UAV resists the wind, the engine speed and flight altitude can also change abruptly, but these changes will not be the same as during an attack. Some approaches, which are mainly applicable to wireless sensor networks, rely on a node evaluating its own behavior based on the behavior of its neighbors. As a rule, in such approaches, the average or median is calculated for a given parameter for all nodes (or neighboring nodes), and the change in the current parameters of the node is compared with the average for the entire group.
These previous approaches [36,37,38,39] also have advantages and characteristics that confirm the validity of the approach used in our current study. First, the concept of a sliding window is used throughout, where the divergence is calculated not only for newly received values but also for those values that were previously present in the sample. Second, Xiang et al. consider detection of low-intensity Denial-of-Service attacks [40]. Consequently, they also assume that even insignificant new changes affecting the parameters of the environment of the system can be fixed in an atypical way. Third, in all approaches, discrete events are considered, and analysis is performed for them. Fourth, even though, by definition, the value of entropy should be positive, this is not always observed in practice [4].

2.2. Analysis of Cyber-Physical Parameters and Data Normalization Methods

To detect an attack, we determined to use the following cyber-physical parameters:
  • UAV flight altitude (ha);
  • The number of satellites that the UAV sees (Ns);
  • GPS speed (Gs);
  • Flight angle (A);
  • Latitude (Lat);
  • Longitude (Lon);
  • With the help of appropriate statistics, we can estimate these parameters in the sampled data. Depending on whether the random variable is discrete or continuous, the probability distribution can be either discrete or continuous. In this case, the quantities are discrete.
Assume we are interested in the number of occurrences of certain random events per unit of time. In addition, assume this event occurrence in an experiment does not depend on how many times and at what points in time it happened in the past and does not affect the future, and tests are carried out under stationary conditions. Then Poisson’s law can be used to describe such a quantity. Poisson’s law is also called the law of rare events. In our study, we need to detect the rare occurrence of cyber-physical parameter peak values that do not occur during normal operation of a UAV. Therefore, we also used the Poisson distribution [16,41]. The Poisson model usually describes a scheme of rare events [40,41]. Under certain assumptions about the nature of random events, the number of events that occur over a fixed period or in a fixed region of space can obey the following Poisson distributions,
P ( h a ) = λ h a h a ! e λ ,
P ( G s ) = λ G s G s ! e λ ,
P ( A ) = λ A A ! e λ ,
P ( L a t ) = λ L a t L a t ! e λ ,
P ( L o n ) = λ L o n L o n ! e λ ,
P ( N s ) = λ N s N s ! e λ ,
where P is the probability function of the distribution of a random variable according to the Poisson distribution law, e is Euler’s number, and λ is the mathematical expectation, the average number of occurrences of the event of interest in a unit of time.
We estimated the graph of the change in the current value of the cyber-physical parameter for each time interval when the Poisson probability function is calculated. The value of the cyber-physical parameter, that is, the quantitative indicator for each parameter (the number that is obtained for each cyber-physical parameter over the past period), is used as the variable x. In the case of Equations (4) and (5), the longitude and latitude are the values of the cyber-physical parameters received from the global navigation system. The average value for the last n time intervals is taken for the λn variable; the value of 10 was used in the study. The higher the probability value, the closer the current value of the cyber-physical parameter to the average value. This estimate allows building a probability distribution for the different time intervals. If the number of deviations from the mean is higher at different time intervals, the entropy between the distributions is higher. Such a situation would mean that the UAV has changed its behavior to a large extent. That is, in essence, we process information about the value. Equations (1)–(6) are needed to normalize the original raw data and represent them in the form of a probability distribution. We analyzed different types of probability distributions for discrete quantities and decided that the Poisson distribution is the most appropriate. Accordingly, Equations (1)–(6) correspond to the Poisson distribution for each parameter.
Here, we consider some of the results of converting raw data using the distribution function of the Poisson random variable. First, assume a situation where the UAV is not attacked, and it functions under normal conditions. Figure 3 shows the result of calculating the Poisson distribution for the number of satellites that the UAV sees and fixes.
Figure 3a shows that the obtained data are close to each other in different trials. The color-coded distributions were obtained from four different UAV experiments. The proximity to each other means that the parameter changed in the same way in different cases. It was either uniform or gradually increased, perhaps with gradual decreases and increases in the parameter.
Now consider the graph presented in Figure 3b where an attack takes place. The first line, marked in blue, is the first trial and corresponds to the graph when the attack had not started yet, and the data changed in normal operating mode. The second line, which is marked in orange, corresponds to the beginning of the attack, when the values began to change, which correlates with the graph where the raw data are presented. The third line, which shows even larger changes, corresponds to the middle of the graph, where the raw data are presented. Line four, marked in yellow, moves closer to the first line. Thus, from the figure, which displays the Poisson distribution for normalizing the attack data, the type of distribution changes significantly when the raw data also change. At the same time, it does not matter to us at all which absolute values the raw data take. The key goal is to understand whether the statistics for a series of data have changed, and the type of distribution accordingly.

2.3. Intrusion Detection Method for UAVs

Compared to the prior work cited above, the approach we present below has one fundamental difference. To calculate the divergence, we do not look for the average value of the parameter and do not determine the normal value against which we compare the rest. This is not possible for a UAV, as stated earlier. The main task that needs to be performed is fast, inexpensive detection of anomalies, but without initial conditions or assumptions.
This is why it is necessary to analyze the data “on the fly”. In our concept, we calculate two types of Kullback–Leibler divergence, forward and backward, as explained below. In addition, we calculate the divergence value for individual time intervals and then sum them over the entire time series. This is necessary to accumulate values and improve detection accuracy.
For each value obtained for the current time interval, the divergence value is calculated. Then the total divergence value for the time series needs to be calculated. In this case, it is necessary to use not an integral value, but a sum, since we are talking about discrete quantities:
D K L s t r ( P ( h a n ) t n k | | P ( h a n ) t n ( k 1 ) = h a i h a P ( h a n ) t × ln P ( h a n ) t n k P n ( h a n ) t n ( k 1 ) ,
D K L s t r ( P ( G s n ) t n k | | P ( G s n ) t n ( k 1 ) ) = G s i G s P ( G s n ) t × ln P ( G s n ) t n k P ( G s n ) t n ( k 1 ) ,
D K L s t r ( P ( L o n n ) t n k | | P ( L o n n ) t n ( k 1 ) = L o n i L o n P ( L o n n ) t n k × ln P ( L o n n ) t n k P ( L o n n ) t n ( k 1 ) ,
D K L s t r ( P ( A n ) t n k | | P ( A n ) t n ( k 1 ) = A i A P ( A n ) t n k × ln P ( A n ) t n k P ( A n ) t n ( k 1 ) ,
D K L s t r ( P ( L a t n ) t n k | | P ( L a t n ) t n ( k 1 ) = L a t i L a t P ( L a t n ) t n k × ln P ( L a t n ) t n k P ( L a t n ) t n ( k 1 ) ,
D K L s t r ( P ( N s n ) t n k | | P ( N s n ) t n ( k 1 ) = N s i N s P ( N s n ) t n k × ln P ( N s n ) t n k P ( N s n ) t n ( k 1 ) ,
where Pnn)tnk is the Poisson distribution for a given exponent n for the current time period t, k is the row of new values, Pnn)tn(k−1) is the Poisson distribution for a given exponent n for the previous time series, and ln is the natural logarithm.
The formulas given above characterize the direct value of the Kullback–Leibler divergence. This value will effectively assess the situation when there is a sharp decrease in indicators. The most effective is just the opposite value of the divergence, when we take fresh values and compare them with the previous ones, and not vice versa. Such a calculation will be especially effective with a sharp increase in values.
D K L b a c k ( P ( h a n ) t n ( k 1 ) | | P ( h a n ) t n k ) = h a i h a P ( h a n ) t n ( k 1 ) × ln P ( h a n ) t n ( k 1 ) P ( h a n ) t n k .
Next, entropy calculations were carried out for the collected values of cyber-physical parameters, and the effectiveness of the method was evaluated.
Thus, it was found that the higher the entropy value, the more likely it is that a change in the cyber-physical parameter indicates the presence of anomalous behavior. Abnormal behavior can occur not only due to an attack but also due to environmental influences. Thus, for example, the speed of the engines and the flight altitude may not be related to the attack but may change due to gusts of wind. For an unambiguous definition of an attack, it is necessary to analyze several cyber-physical parameters at once and determine the degree of their deviation [42].

3. Results and Discussion

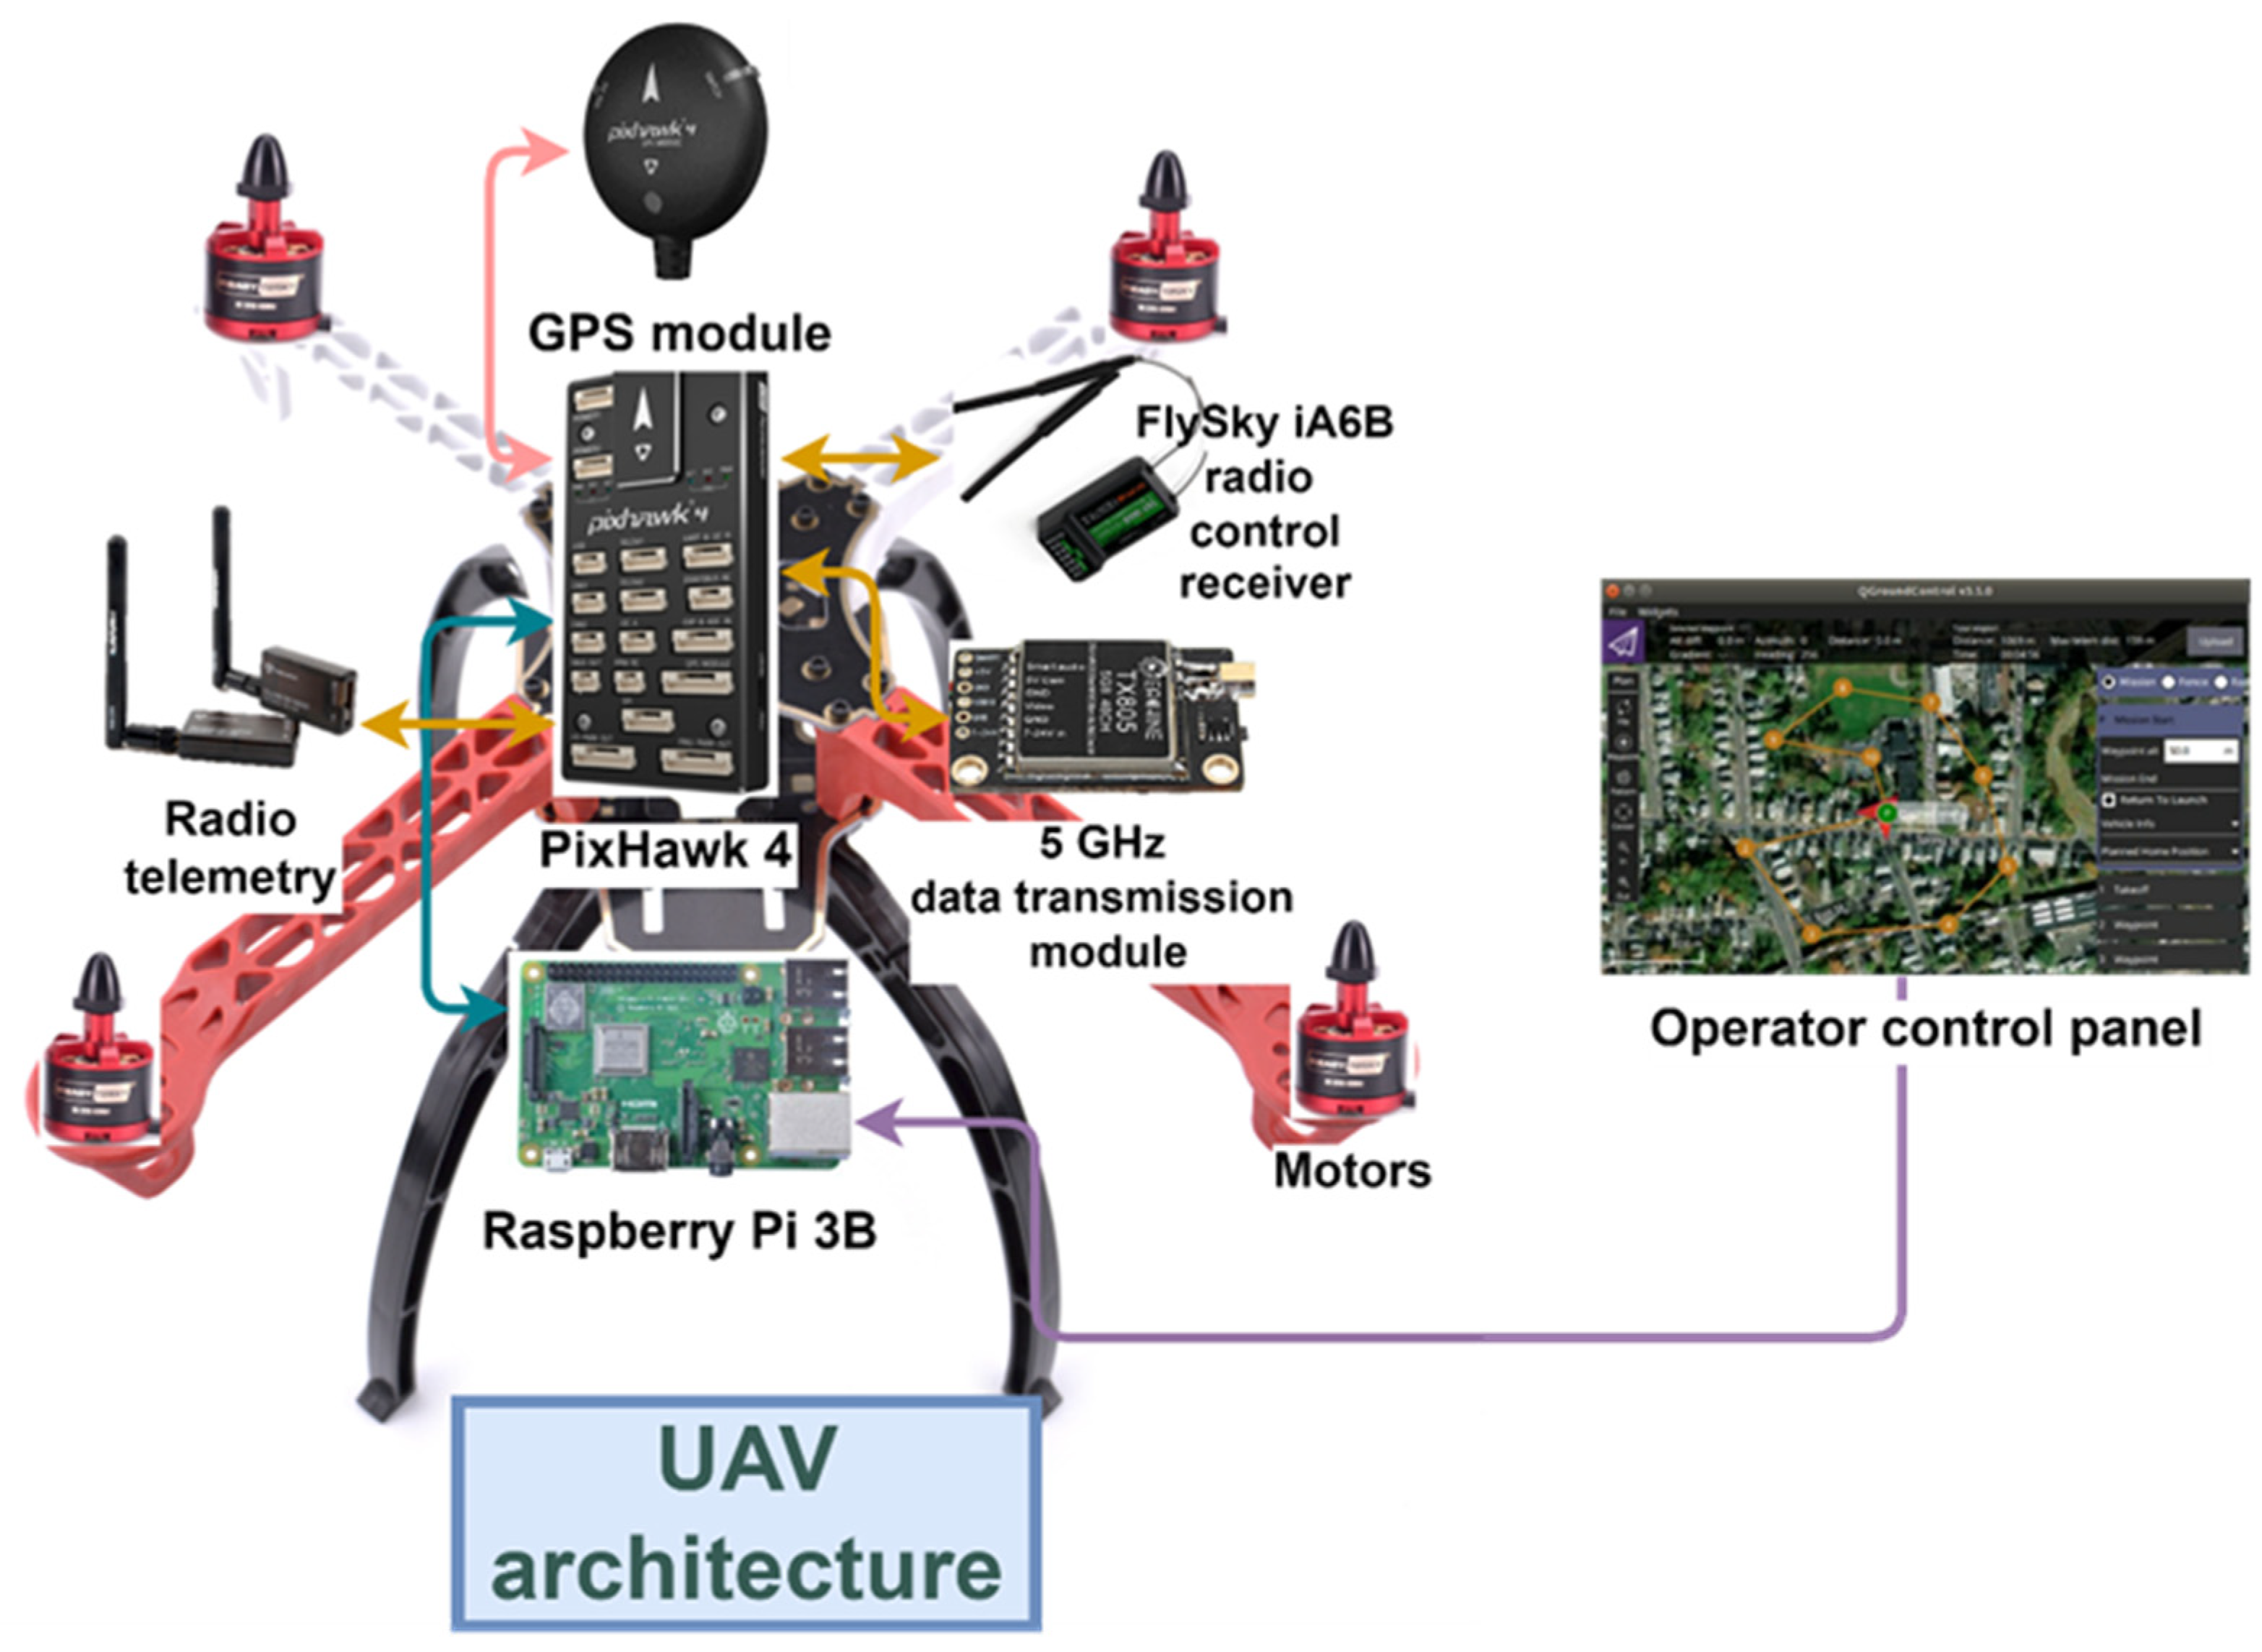
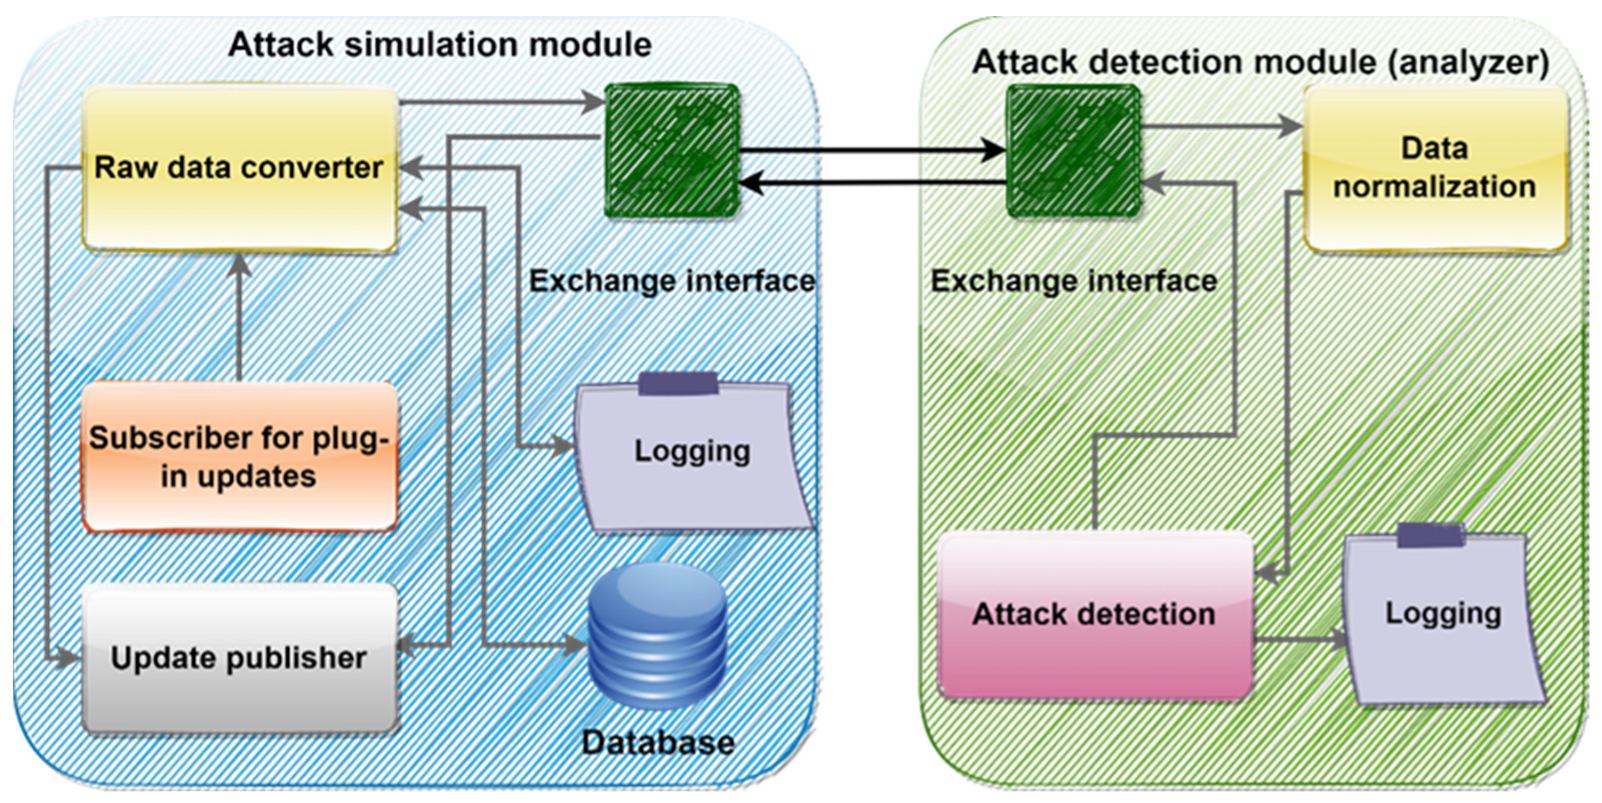
3.1. Development of GPS Anti-Spoofing Technology Components for UAVs

In this section, we consider the internal architecture of a software package that implements our GPS anti-spoofing technology. The internal architecture includes two main modules that were mentioned earlier. They are a software module for simulating attacks, and an attack detection module (analyzer).
To begin with, consider the general architecture of the software package, which is shown in Figure 4.
As can be seen from the figure, the full functionality that allows an exchange of data with external modules is provided by the attack simulation software module on the left. It also stores the data received from the navigation system in a database. This is necessary to provide additional redundancy. In the case of problems with communication between the attack simulation software module and the attack detection module (analyzer), the data are not lost. The green square means the interface through which data are transferred between the attack analysis module and the simulation module. The module for updating publications, marked with a gray rectangle, is intended to send information about the attack to the control system. The updated subscriber (marked with an orange rectangle) receives data from the field controller and transmits it to the raw data processing module (yellow rectangle) for normalization. When the raw data are converted, it is sent via the interface (indicated by a green square) to the analyzer module. Here, the data are normalized (the module is marked with a yellow rectangle) and transmitted to the attack detection module (pink rectangle). The attack detection module keeps a logging log, which is needed for debugging. When an attack is detected or if the behavior is normal, the data are transmitted via the interface to the publication module to notify the control system about the current state of the UAV.
Since the attack detection module is external to the attack simulation software module and there is a client/server connection between them, it is necessary to foresee possible risks associated with this connection. Any external interaction between modules, as a rule, is associated with the possibility of a connection breakdown, delays, data loss, blocking of communication, or a break in the channel, even if such interaction is implemented at the software level. ROS2 was chosen as an interlayer between the flight controller and the control board for collecting data and sending control commands. The GPS spoofing attack simulation software module receives updates from the flight controller. The attack simulation module is a subscriber to the control module and receives commands from it for setting or adjusting parameters. The set of parameters obtained from external systems for analysis is presented in Table 2. The attack simulation module sends data to the analyzer sequentially as soon as it receives an update. In this case, the attack simulation module waits for the analyzer to respond to the received data every time. Thus, the attack simulation module not only falsifies data, but also acts as a layer between ROS2, external UAV modules, and the attack analyzer. This solution reduces the load on the attack analyzer and increases the computational speed for detecting an attack.
Thus, the main information coming from the flight controller will be transferred to a separate topic for subscribers, and information about the flight speed will also form a separate topic. The software module for simulating a GPS spoofing attack subscribes to both topics.
The attack simulation software module allows generating datasets by parameters. At the same time, depending on the degree of attack intensity, there are three modes of operation of the module. The first mode describes a situation when there is no attack. No data are generated in this mode. This mode can be turned on to stop the attack simulation. The second mode is intense attack. This mode describes a situation when the data of all parameters, without exception, are subject to change. The third mode is a light attack. This mode corresponds to a situation when data of only basic parameters are forged: GPS noise level, number of GPS satellites, GPS flight altitude.

3.2. Experimental Research Methodology

The key desirable characteristics of a system for counteracting GPS spoofing attacks by simulating their impact on the UAV are:
  • Timely notification of the start of an attack;
  • Accuracy of attack detection;
  • The plausibility of the forged attack data;
  • The time spent on simulating the data.
Timely notification of the start of an attack is determined by the time relative to the start of the attack and the time when the notification was sent to the operator. Moreover, for a given period, there should be no critical consequences for the UAV itself.
The accuracy of attack detection is assessed using errors of the first and second kind, estimates of the confidence interval, and testing hypotheses against confidence intervals.
Type I error is the probability of incorrect rejection of the null hypothesis, that is, rejection of the null hypothesis when it is correct (“false alarm”). In this case, we are talking about signaling an attack, while no changes associated with the attack are observed.
Type II error is the likelihood of remaining within the null hypothesis, when it is not true (“missing a target”). In this case, we are talking about a situation when, an attack is carried out, but the system perceives the state as normal.
To test the null hypothesis, a statistical test is used, which is indicated by the value K. The set of K values at which the null hypothesis is rejected is denoted by the critical area D. The probability of Type I error is
P ( K D / H 0 ) = α ,
where H0 is the null hypothesis, and α is the significance level. The probability of Type II error is
P ( K D / H 1 ) = β ,
where β is the error rate. The conditions for the occurrence of errors of Type I and Type II are presented in Table 3.
The likelihood of the forged attack data are estimated using the method of maximum likelihood for a discrete random variable.
Since the Poisson distribution is used to normalize the data, the likelihood method is applicable for it. To estimate the parameter λ, the mathematical expectation of a random variable (the average number of events over a fixed period) is
P m = ( X = x 1 ) = λ x i e λ x i ! ,
where m is the number of tests performed, and xi is the number of occurrences of the event in the ith experiment (the experiment consists of m tests).
The likelihood function is:
L = p ( x 1 ; λ )   p ( x 2 ; λ )     p ( x n ; λ ) = = λ x 1 e λ x 1 ! × λ x 2 e λ x 2 ! × × λ x n e λ x n ! = λ x i e λ x 1 ! x 2 !     x n ! .
To assess the likelihood, the standard deviation parameter was also used to estimate the degree of variation in the parameter values.
The time it takes to simulate data are measured both for one data unit and one parameter, and for incrementing parameters one at a time, and ultimately for all parameters.

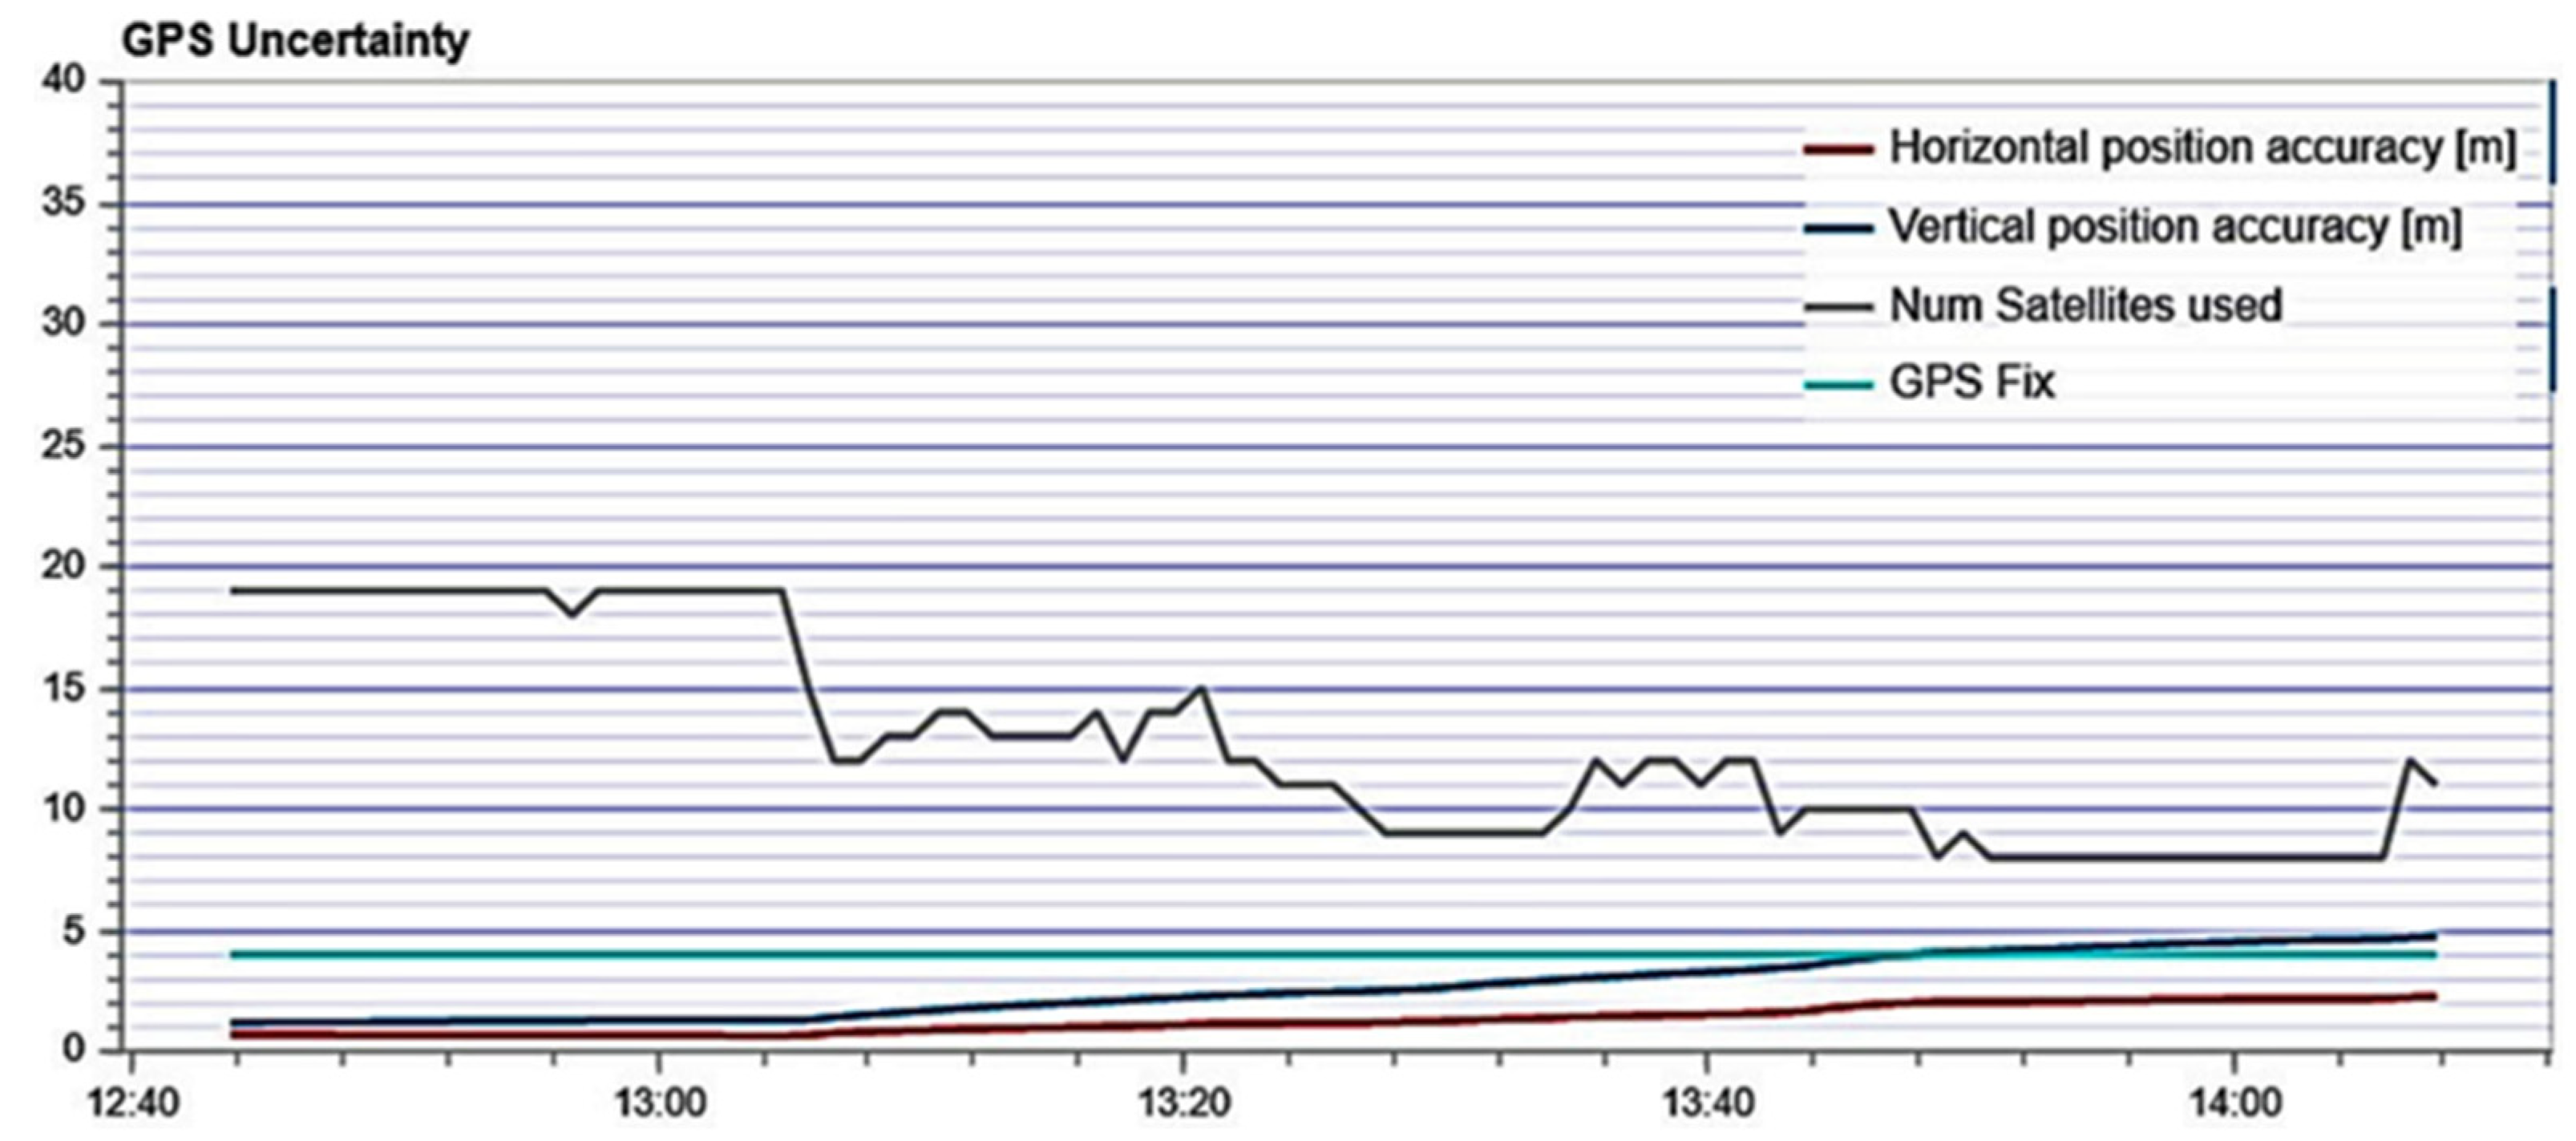
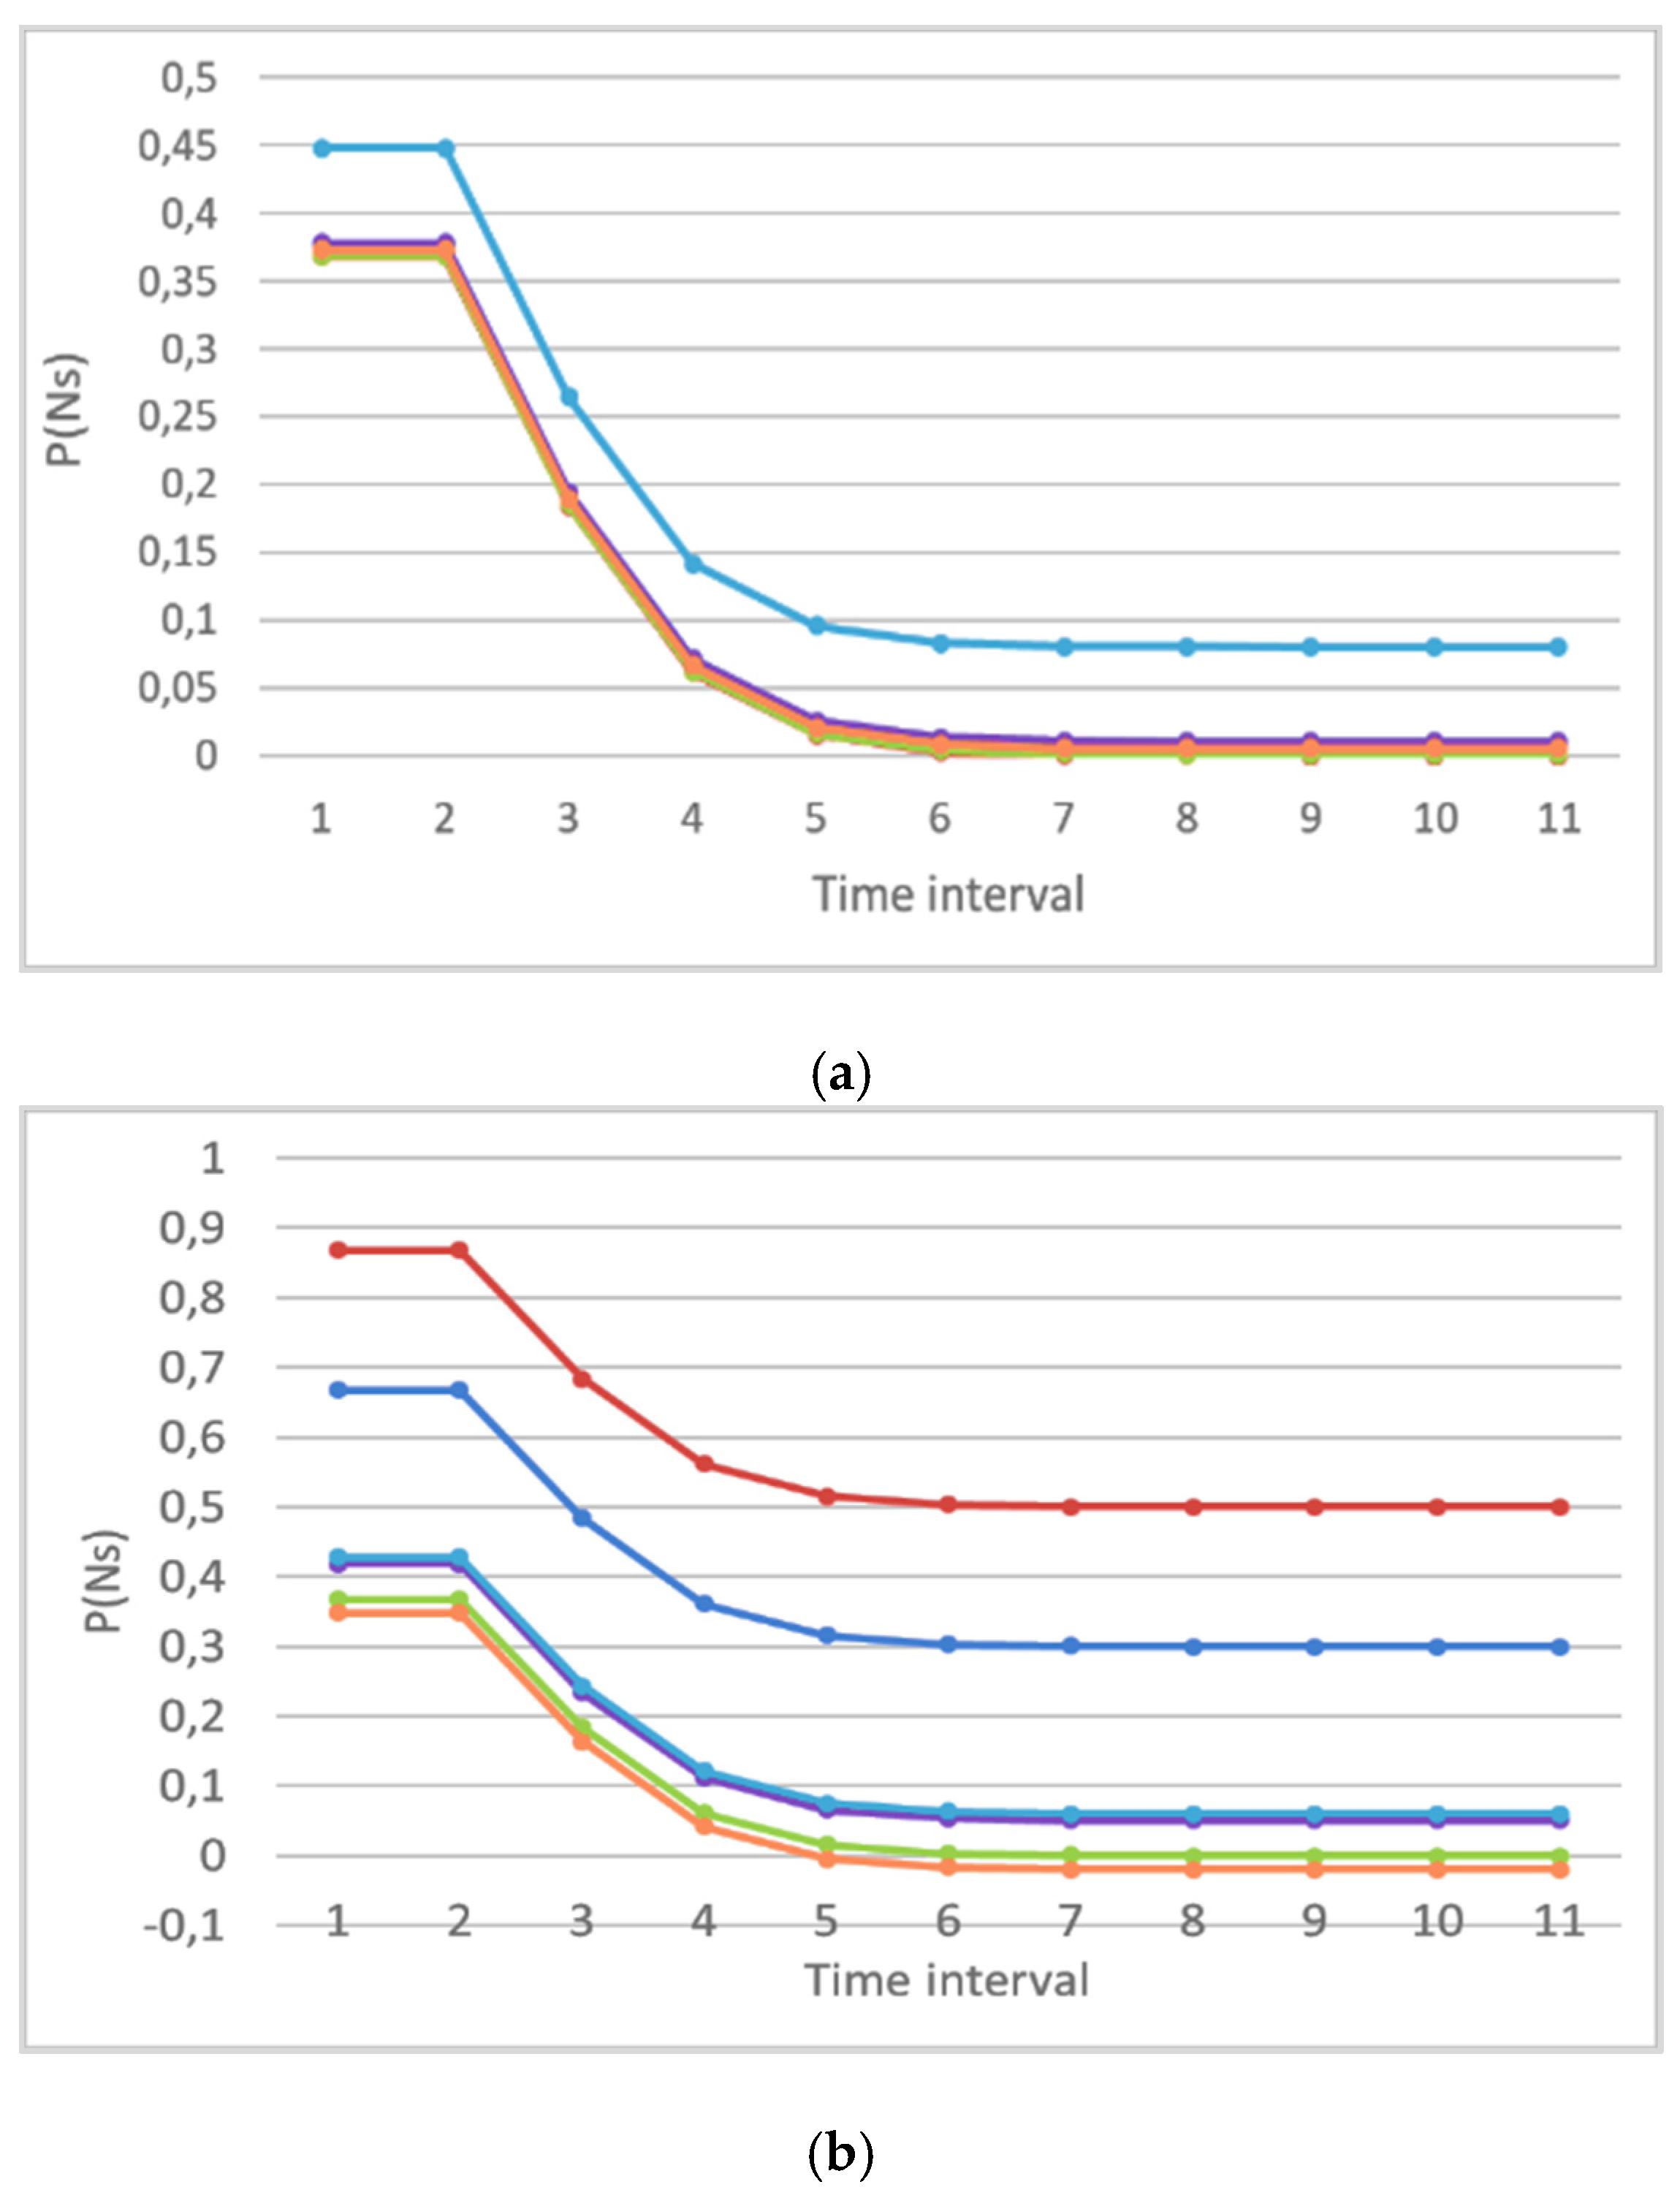
3.3. Experimental Results

In our experiments there were two scenarios for an attack on a UAV. In the first, the attack on a real UAV was carried out in a soft mode and the UAV smoothly shifted towards the attacker’s set point. The UAV, having determined its current position, receives the static coordinates of the target. The UAV moves to a given location and fixes its position in space while maintaining its height.
In the case of external physical impact, e.g., the impact of natural factors, as well as what can be performed by physical or informational impact from another object, the UAV autopilot system increases the engine speed and sets the direction opposite to the direction of impact to maintain a given position.
During the attack, a displacement of the UAV from a given position was observed, while the position preservation system increased the engine speed depending on the distance between the given and the actual location of the UAV. When returning to the set point, the operation of the engines goes into the normal mode of maintaining a fixed altitude.
In the second scenario, the attack was in hard mode and the UAV crashed. The UAV receives a completely built route in advance, and when performing a mission, it moves according to this trajectory. In the case of deviation from the specified trajectory, as in the case of static fixation, the UAV automatically takes action to return to the route. In addition to using this scenario to perform a given mission or solve problems while moving along a route, this scenario is also typical in the case of detecting attacks on the control channel or loss of the control signal.
By broadcasting a fake geolocation, we can set the direction vector and speed of the attacked device. Using the fact that the UAV is trying to counteract the displacement, and is starting to move towards the initial position, it is possible to set the direction of movement for the UAV necessary for the attacker. By changing the distance from the fake geolocation to the specified one, we can increase or decrease the speed of movement, for a more accurate direction and control of the attacked UAV.
During the experiment, the UAV must change its trajectory and deviate from the one that was assigned to its autopilot. During tests under normal flight conditions, the operator sets a flight task for the UAV, and the UAV performs it for a certain number of minutes. While testing during an attack on a UAV, an attacker sets a fake UAV location.
During the experiments, a change in the height of the UAV should be observed, as well as a smooth displacement of the UAV to the point specified by the attacker. If, during the tests, the location of the UAV is changed, unexpected behavior not established by the planner is observed, there are sharp displacements along the trajectory, or an emergency fall/landing, then the attack can be considered successful.
The attack was also emulated in the software module, also in two modes.
Here, we analyze the indices of the standard deviation and the likelihood function for the flight altitude parameter. The lower the value of the likelihood function, the weaker the change in the value. This function also depends on the number of values that are analyzed.
No Type I errors were found when conducting an experimental study to work with parameters flight altitude, longitude, latitude, flight speed, and device temperature. For the analysis of other parameters, the method must be modified since the changes in the parameters obey a different distribution law, and it is necessary to conduct additional research in relation to them.
To determine when the attack was detected, an analysis of the logs was carried out. The first event was marked as SIMULATE DATA. The simulated data occurred at time 19:01:27, and the timestamp was as follows: 1634024665.093750. The analyzer received an event with such a timestamp at 19:01:48, as can been seen in Figure 5. That is, the delay in the notification was 21 s. Although long, this response time to an attack is considered acceptable in the simulation environment. The delay occurs due to the simulator because the event must first be sent to the database, and then it takes time to read from it.
Figure 5 shows that as soon as an event with a corresponding timestamp arrived at the analyzer, the attack was detected instantly. Before this, the analyzer received events that reflected a real flight, and not fake data. That is, the main time spent was not spent on detection, but on data falsification. Error code 111 indicates an attack was detected. Error code 110 means there was no attack.
The evaluation of the quality of forged data are presented in Table 4.
It can be seen from the table that the value of the likelihood function for a scenario of a hard attack mode for a real UAV and for a simulation is close. The indicator for the simulation is even lower, that is, the flight altitude parameter changed less with respect to normal data. The likelihood function for a situation where there is no attack is zero, because the normal data served to estimate the degree of change in the parameter value during the attack (that is λ). The standard deviation determines how strong the variation in parameter values was observed. The more effective the attack is, the more it affects the UAV. If the UAV crashed, then the range of the flight altitude parameter was the strongest. This is due to the fact that the flight altitude from the given one has changed to zero. In a real attack, this value reached 11, we managed to achieve a value of 8 when simulating the attack. The likelihood function value also grows with the increasing influence of the attack on the UAV. In this assessment, the main thing is how the attack affects the bier-physical parameter. We should not simulate the attack itself, that is, not the data that the attacker falsifies, but the effect of the attack on the UAV. Therefore, the implementation of this task is a rather complex problem that requires detailed study.
The result of calculating errors of Type II and the probability of detecting an attack during an attack are shown in Table 5.
Thus, the probability of detecting an attack is 0.9 (or 90%). The probability of a Type II error is 0.09 (or 9%). The detection targets have been met. Errors of Type I were not observed during the experimental study. The average speed of notification is from 5 to 30 s, depending on the type of attack. As a rule, the occurrence of errors of Type II was observed after some time, while the attack was still going on. However, if the response system reacts to an attack in the first seconds of its detection, then the quality of the ability to detect, identify and eliminate the attack will increase.

4. Conclusions

We have presented the basis of a new approach for detecting potential cyber security attacks on UAVs that does not require large amounts of training data. To do so, contributions were made in understanding the problem, defining a mathematical solution, and designing an implementation architecture.
As part of solving the problem of selecting and analyzing analogs of the new GPS anti-spoofing technology, an analytical review was carried out, in which:
  • The features of spoofing attacks that facilitate their detection and blocking were described, and the following set of features was highlighted: the relative position of the spoofer, variations in the spoofer distance, hardware features of navigation receivers, and the angle of arrival of the signal.
  • The main directions of research in the field of anti-spoofing for satellite navigation systems were analyzed, which allowed classifying approaches to detecting and preventing spoofing attacks and highlighting their common features and differences.
  • The existing methods of detecting and preventing spoofing attacks on navigation systems for software and hardware solutions were considered, and their advantages and disadvantages were highlighted [4,5,43,44].
  • The existing software and hardware solutions for the GPS anti-spoofing problem were described.
As part of solving the problem of developing a GPS spoofing detection method for UAVs, the following was achieved:
  • A preliminary study was carried out, which made it possible to form a mathematical apparatus for solving the problem.
  • The analysis of parameters and methods of data normalization was carried out, as a result of which a set of cyber-physical parameters was formed that can be used to detect an attack.
  • The analysis of the Kullback–Leibler divergence measure for the search for anomalies was carried out, which makes it possible to improve the quality of anomaly detection.
  • A new method for detecting attacks based on the parameters of the sensor system of an unmanned vehicle was described, which allows the UAV to detect an attack without the need for prior knowledge about the reference change of sensor values, in real time, autonomously. This method is based on calculating the value of entropy, that is, the difference between the probability distributions of cyber-physical parameters.
As part of solving the problem of developing the architecture of anti-spoofing technology, the architecture of anti-spoofing technology for OS ROS2 was developed and described, built because of the publisher-subscriber concept, which can be characterized by the following features:
  • This technology should provide detection of an attack, notifying the operator and the necessary subsystems of the UAV about the fact of an attack. After notification of an attack, UAV control mechanisms must ensure that measures are taken to counter the attack.
  • A feature of this technology is that, to detect an attack, there is no need to establish and record changes in indicators during normal operation, the system must ensure recording of anomalies in real time by analyzing the degree of change in indicators obtained over the past period of time and for the current period of time.
  • To implement the technology, the following tasks must be completed: an interface has been developed for collecting data on the state of the navigation system, which is necessary to detect a change in its state, from the flight controller or any other subsystem that can provide the required data set, the format and types of values transmitted parameters, the possibility of implementing a GPS spoofing attack on the simulation model is provided, its effective parameters are determined; the possibility of transmitting a signal about the fact of an attack on the ground control point and on-board computer of the UAV in the established format was provided.
  • Our method, in comparison with analogs, gives a higher accuracy of attack detection. In addition, it is easier to implement and does not require a large amount of data to train a neural network or create a decision-making system. For example, Support Vector Machines provide detection accuracy of up to 80%. The deep learning method together with the support vector machine has a detection accuracy of up to 90% [41]. Our attack detection method for a group of UAVs provides up to 96% accuracy of attack detection, but at the same time produces 3.5% false positives. In addition, in our scheme, UAVs do not operate autonomously, and the method works at the level of UAVs and ground stations to detect harmful anomalies.

Author Contributions

Conceptualization, E.B. and A.B.; methodology, E.B., A.B. and A.N.; software, E.B. and N.S.; validation, E.B., A.B., A.N., C.F., N.S. and O.P.; formal analysis, E.B. and A.B.; investigation, E.B., A.B., A.N., N.S. and O.P.; resources, E.B.; data curation, E.B., A.B., A.N., C.F. and O.P.; writing—original draft preparation, E.B., A.B., A.N., C.F. and O.P.; writing—review and editing, E.B., A.B., A.N. and C.F.; visualization, E.B.; supervision, E.B., A.N. and C.F.; project administration, E.B.; funding acquisition, E.B. All authors have read and agreed to the published version of the manuscript.

Funding

This research was funded by the Russian Science Foundation grant number 21-79-00194, https://rscf.ru/project/21-79-00194/ (accessed on 30 November 2021). The APC was funded by the Russian Science Foundation grant number 21-79-00194.

Institutional Review Board Statement

Not applicable.

Informed Consent Statement

Not applicable.

Data Availability Statement

Data sharing not applicable.

Conflicts of Interest

The authors declare no conflict of interest.

References

  1. Sun, C.; Cheong, J.W.; Dempster, A.G.; Zhao, H.; Feng, W. GNSS spoofing detection by means of signal quality monitoring (SQM) metric combinations. IEEE Access 2018, 6, 66428–66441. [Google Scholar] [CrossRef]
  2. Han, S.; Luo, D.; Meng, W.; Li, C. Antispoofing RAIM for dual-recursion particle filter of GNSS calculation. IEEE Trans. Aerosp. Electron. Syst. 2016, 52, 836–851. [Google Scholar] [CrossRef]
  3. Kerns, A.J.; Wesson, K.D.; Humphreys, T.E. A blueprint for civil GPS navigation message authentication. In Proceedings of the 2014 IEEE/ION Position, Location and Navigation Symposium—PLANS 2014, Monterey, CA, USA, 5–8 May 2014; pp. 262–269. [Google Scholar] [CrossRef]
  4. Afgani, M.; Sinanovic, S.; Haas, H. Hardware implementation of a Kullback-Leibler Divergence based signal anomaly detector. In Proceedings of the 2nd International Symposium on Applied Sciences in Biomedical and Communication Technologies, Bratislava, Slovakia, 24–27 November 2009; pp. 1–6. [Google Scholar] [CrossRef]
  5. Arthur, M.P. Detecting signal spoofing and jamming attacks in UAV networks using a lightweight IDS. In Proceedings of the 2019 International Conference on Computer, Information and Telecommunication Systems (CITS), Beijing, China, 28–31 August 2019; pp. 1–5. [Google Scholar] [CrossRef]
  6. Wang, F.; Li, H.; Lu, M. GNSS spoofing detection based on unsynchronized double-antenna measurements. IEEE Access 2018, 6, 31203–31212. [Google Scholar] [CrossRef]
  7. Xu, R.; Ding, M.; Qi, Y.; Yue, S.; Liu, J. Performance analysis of GNSS/INS loosely coupled integration systems under spoofing attacks. Sensors 2018, 18, 4108. [Google Scholar] [CrossRef] [Green Version]
  8. Akos, D.M. Who’s afraid of the spoofer? GPS/GNSS spoofing detection via automatic gain control (AGC). Navigation 2012, 59, 281–290. [Google Scholar] [CrossRef]
  9. Angrisano, A.; Gaglione, S.; Gioia, C. Performance assessment of GPS/GLONASS single point positioning in an urban envi-ronment. Acta Geod. Geophys. 2013, 48, 149–161. [Google Scholar] [CrossRef]
  10. Jin, M.H.; Han, Y.H.; Choi, H.H.; Park, C.; Heo, M.B.; Lee, S.J. GPS spoofing signal detection and compensation method in DGPS reference station. In Proceedings of the 11th International Conference on Control, Automation and Systems, Goyang, Korea, 26–29 October 2011; pp. 1616–1619. [Google Scholar]
  11. Blanch, J.; Walter, T.; Enge, P. Satellite navigation for aviation in 2025. Proc. IEEE 2012, 100, 1821–1830. [Google Scholar] [CrossRef]
  12. Angrisano, A.; Gaglionend, S.; Gioia, C. Performance assessment of aided global navigation satellite system for land navigation. IET Radar Sonar Nav. 2013, 7, 671–680. [Google Scholar] [CrossRef]
  13. Bakuła, M.; Przestrzelski, P.; Kaźmierczak, R. Reliable technology of centimeter GPS/GLONASS surveying in forest environments. IEEE Trans. Geosci. Remote Sens. 2015, 53, 1029–1038. [Google Scholar] [CrossRef]
  14. Jafarnia-Jahromi, A.; Broumandan, A.; Nielsen, J.; Lachapelle, G. GPS vulnerability to spoofing threats and a review of anti -spoofing techniques. Int. J. Navig. Obs. 2012, 2012, 127072. [Google Scholar] [CrossRef]
  15. Baziar, A.R.; Moazedi, M.; Mosavi, M.R. Analysis of single frequency GPS receiver under delay and combining spoofing algorithm. Wirel. Pers. Commun. 2015, 83, 1955–1970. [Google Scholar] [CrossRef]
  16. Basan, E.; Basan, A.; Makarevich, O. Detection of anomalies in the robotic system based on the calculation of Kullback-Leibler divergence. In Proceedings of the 2019 International Conference on Cyber-Enabled Distributed Computing and Knowledge Discovery (CyberC), Guilin, China, 17–19 October 2019; pp. 337–340. [Google Scholar] [CrossRef]
  17. Marais, J.; Nahimana, D.-F.; Viandier, N.; Duflos, E. GNSS accuracy enhancement based on pseudo range error estimation in an urban propagation environment. Expert Syst. Appl. 2013, 40, 5956–5964. [Google Scholar] [CrossRef] [Green Version]
  18. Kuusniemi, H.; Lachapelle, G. GNSS signal reliability testing in urban and indoor environments. In Proceedings of the 2004 National Technical Meeting of The Institute of Navigation, San Diego, CA, USA, 26–28 January 2004; pp. 210–224. [Google Scholar]
  19. Cai, C.; Gao, Y. A combined GPS/GLONASS navigation algorithm for use with limited satellite visibility. J. Navig. 2009, 62, 671–685. [Google Scholar] [CrossRef]
  20. Mosavi, M.R.; Rezaei, M.J.; Pashaian, M.; Moghaddasi, M.S. A fast and accurate anti-jamming system based on wavelet packet transform for GPS receivers. GPS Solut. 2017, 21, 415–426. [Google Scholar] [CrossRef]
  21. Mosavi, M.R.; Shafee, F. Narrowband interference suppression for GPS navigation using neural networks. GPS Solut. 2016, 20, 341–351. [Google Scholar] [CrossRef]
  22. Kang, C.H.; Kim, S.Y.; Park, C.G. A GNSS interference identification using an adaptive cascading IIR notch filter. GPS Solut. 2014, 18, 605–613. [Google Scholar] [CrossRef]
  23. Chien, Y.-R. Design of GPS anti-jamming systems using adaptive notch filters. IEEE Syst. J. 2015, 9, 451–460. [Google Scholar] [CrossRef]
  24. Daneshmand, S.; Marathe, T.; Lachapelle, G. Millimetre level accuracy GNSS positioning with the blind adaptive beamforming method in interference environments. Sensors 2016, 16, 1824. [Google Scholar] [CrossRef] [Green Version]
  25. Wan, Y.; Chen, F.; Nie, J.; Sun, G. Optimum reference element selection for GNSS power-inversion adaptive arrays. Electron. Lett. 2016, 52, 1723–1725. [Google Scholar] [CrossRef]
  26. Arribas, J.; Prades, C.; Closas, P. Multi-antenna techniques for interference mitigation in GSS signal acquisition. EURASIP J. Adv. Signal. Process. 2013, 2013, 143. [Google Scholar] [CrossRef] [Green Version]
  27. Chen, L.-W.; Zheng, J.-S. A broadened and deepened anti-jamming technology for high-dynamic GNSS array receivers. IEICE Trans. Commun. 2016, E99.B, 2055–2061. [Google Scholar] [CrossRef]
  28. Zhang, B.; Ma, H.; Sun, X.-L.; Tan, Q.; Pan, H. Robust anti-jamming method for high dynamic global positioning system receiver. IET Signal. Process. 2016, 10, 342–350. [Google Scholar] [CrossRef]
  29. Chen, F.; Nie, J.; Li, B.; Wang, F. Distortionless space-time adaptive processor for global navigation satellite system receiver. Electron. Lett. 2015, 51, 2138–2139. [Google Scholar] [CrossRef]
  30. Broumandan, A.; Jahromi, A.J.; Lachapelle, G. Spoofing detection, classification and cancelation (SDCC) receiver architecture for a moving GNSS receiver. GPS Solut. 2015, 19, 475–487. [Google Scholar] [CrossRef]
  31. Wang, F.; Li, H.; Lu, M. GNSS spoofing countermeasure with a single rotating antenna. IEEE Access 2017, 5, 8039–8047. [Google Scholar] [CrossRef]
  32. Hu, Y.; Bian, S.; Li, B.; Zhou, L. A novel array-based spoofing and jamming suppression method for GNSS receiver. IEEE Sens. J. 2018, 18, 2952–2958. [Google Scholar] [CrossRef]
  33. Varshosaz, M.; Afary, A.; Mojaradi, B.; Saadatseresht, M.; Ghanbari Parmehr, E. Spoofing detection of civilian UAVs using visual odometry. ISPRS Int. J. Geo-Inf. 2020, 9, 6. [Google Scholar] [CrossRef] [Green Version]
  34. Bekmezci, İ.; Şentürk, E.; Türker, T. Security issues in flying ad-hoc networks (FANETs). J. Aeronaut. Space Technol. 2016, 9, 13–21. [Google Scholar]
  35. Li, C.; Wang, X. Jamming research of the UAV GPS/INS integrated navigation system based on trajectory cheating. In Proceedings of the 9th International Congress on Image and Signal Processing, BioMedical Engineering, and Informatics (CISP-BMEI 2016), Datong, China, 15–17 October 2016; pp. 1113–1117. [Google Scholar] [CrossRef]
  36. Kiessé, T.S.; Zougab, N.; Kokonendji, C.C. Bayesian estimation of bandwidth in semiparametric kernel estimation of unknown probability mass and regression functions of count data. Comput. Stat. 2016, 31, 189–206. [Google Scholar] [CrossRef] [Green Version]
  37. Xiang, Y.; Li, K.; Zhou, W. Low-rate DDoS attacks detection and traceback by using new information metrics. IEEE Trans. Inf. Forensics Secur. 2011, 6, 426–437. [Google Scholar] [CrossRef]
  38. Bhatia, S. Ensemble-based model for DDoS attack detection and flash event separation. In Proceedings of the 2016 Future Technologies Conference (FTC), San Francisco, CA, USA, 6–7 December 2016; pp. 958–967. [Google Scholar] [CrossRef]
  39. Bouyeddou, B.; Harrou, F.; Sun, Y.; Kadri, B. Detection of smurf flooding attacks using Kullback-Leibler-based scheme. In Proceedings of the 4th International Conference on Computer and Technology Applications (ICCTA), Istanbul, Turkey, 3–5 May 2018; pp. 11–15. [Google Scholar] [CrossRef] [Green Version]
  40. Gamec, J.; Basan, E.; Basan, A.; Nekrasov, A.; Fidge, C.; Sushkin, N. An adaptive protection system for sensor networks based on analysis of neighboring nodes. Sensors 2021, 21, 6116. [Google Scholar] [CrossRef]
  41. Basan, E.; Lapina, M.; Mudruk, N.; Abramov, E. Intelligent intrusion detection system for a group of UAVs. In Advances in Swarm Intelligence; Tan, Y., Shi, Y., Eds.; ICSI 2021; Springer: Cham, Denmark, 2021; Volume 12690, pp. 230–240. [Google Scholar] [CrossRef]
  42. Basan, E.; Basan, A.; Nekrasov, A.; Fidge, C.; Gamec, J.; Gamcová, M. A self-diagnosis method for detecting UAV cyber attacks based on analysis of parameter changes. Sensors 2021, 21, 509. [Google Scholar] [CrossRef]
  43. Sedjelmaci, H.; Senouci, S.M.; Ansari, N. A hierarchical detection and response system to enhance security against lethal cyber-attacks in UAV networks. IEEE Trans. Syst. Man Cybern. Syst. 2018, 48, 1594–1606. [Google Scholar] [CrossRef] [Green Version]
  44. Sorbelli, F.B.; Conti, M.; Pinotti, C.M.; Rigoni, G. UAVs path deviation attacks: Survey and research challenges. In Proceedings of the 2020 IEEE International Conference on Sensing, Communication and Networking (SECON Workshops), Como, Italy, 22–26 June 2020; pp. 1–6. [Google Scholar] [CrossRef]
Figure 1. The architecture of the experimental stand.
Drones 06 00008 g001
Figure 2. A graph of the change in the strength of the satellites, Num Satellites Used, which were recorded and used by the UAV during the fifth experiment.
Drones 06 00008 g002
Figure 3. Distribution of a random variable using the Poisson probability distribution function for the parameter number of GPS satellites: (a) without attack; and (b) during an attack.
Drones 06 00008 g003
Figure 4. Architecture of the software package that implements the anti-spoofing GPS technology.
Drones 06 00008 g004
Figure 5. Analysis of attack logs: (a) for the attack simulator; (b) for the analyzer.
Drones 06 00008 g005
Table 1. Estimation of the number of satellites recorded by the UAV and a mobile phone.
Number of
Experiments
The Number of GPS Satellites Fixed by the Mobile PhoneThe Number of GPS Satellites Fixed by the UAV
11114
21015–16
3916–17
4917
519–9
Table 2. The set of parameters for analysis.
NumberDescriptionRange of Values
1The speed after GPS satellite positioning(0;40),
0.1 m/s
2GPS track angle(−180,180),
degrees
3GPS satellite number(0;34)
4GPS altitude(0;1000),
unit 0.1 meters
5Integrated navigation latitude(−90;90),
0.0000001 degree
6Integrated navigation longitude(−180;180),
0.0000001 degree
Table 3. The conditions for the occurrence of errors of Type I and Type II.
Hypothesis H0AcceptedRejected
True K D / H 0 , Type I error,
K D / H 0 ,
FalseType II error,
K D / H 1 ,
K D / H 1 ,
Table 4. Evaluating the quality of forged data.
ExperimentLikelihood FunctionStandard Deviation
No attack real UAV00.360014
Soft mode real UAV7.5676562.091605
Hard mode real UAV0.1667786.596098
Hard mode real UAV crashed–9.3536611.4978
No attack simulation00.559889
Soft mode simulation0.0602934.214443
Hard mode simulation 10.6400725.51863
Hard mode simulation 2−0.060968.342719
Table 5. Assessment of attack detection.
ExperimentType II ErrorAttack Detection
Probability
Soft mode simulation0.010.99
Hard mode simulation 10.050.94
Hard mode simulation 20.090.9
Publisher’s Note: MDPI stays neutral with regard to jurisdictional claims in published maps and institutional affiliations.

