Estimating Tree Height and Volume Using Unmanned Aerial Vehicle Photography and SfM Technology, with Verification of Result Accuracy


Abstract

1. Introduction
2. Materials and Methods
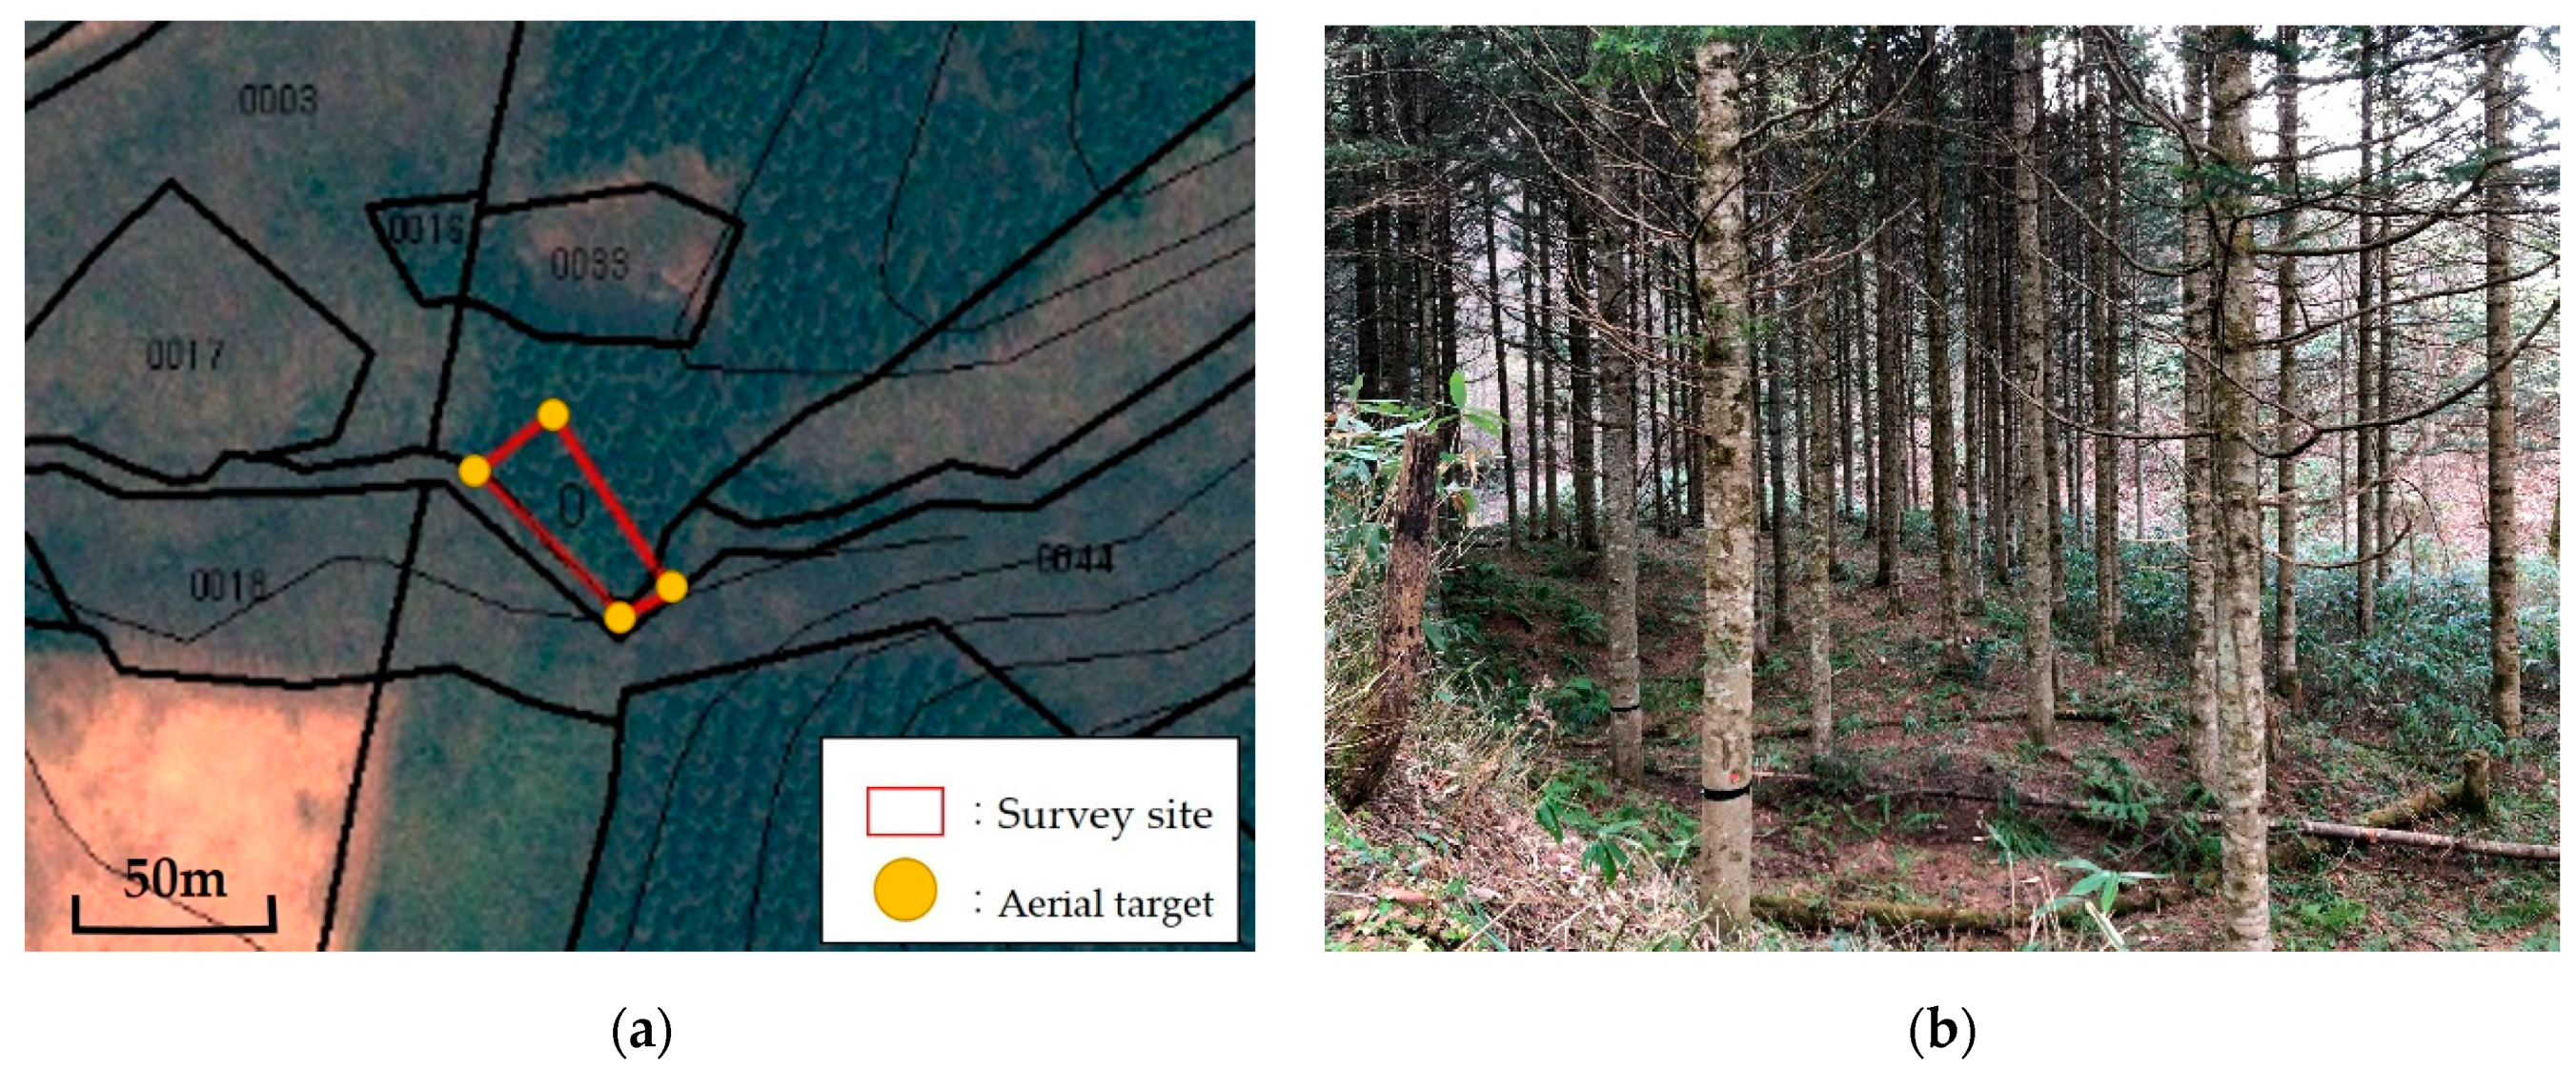
2.1. Survey Site
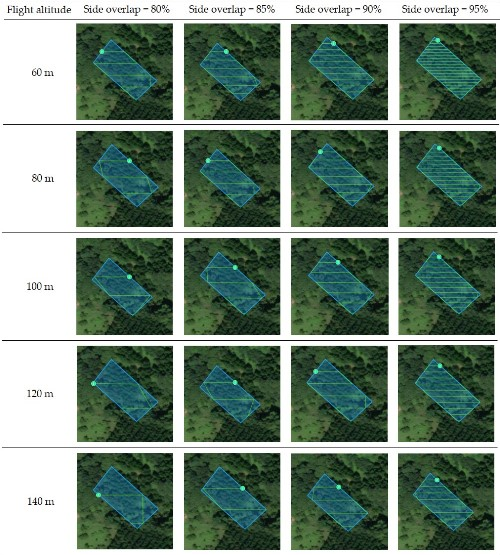
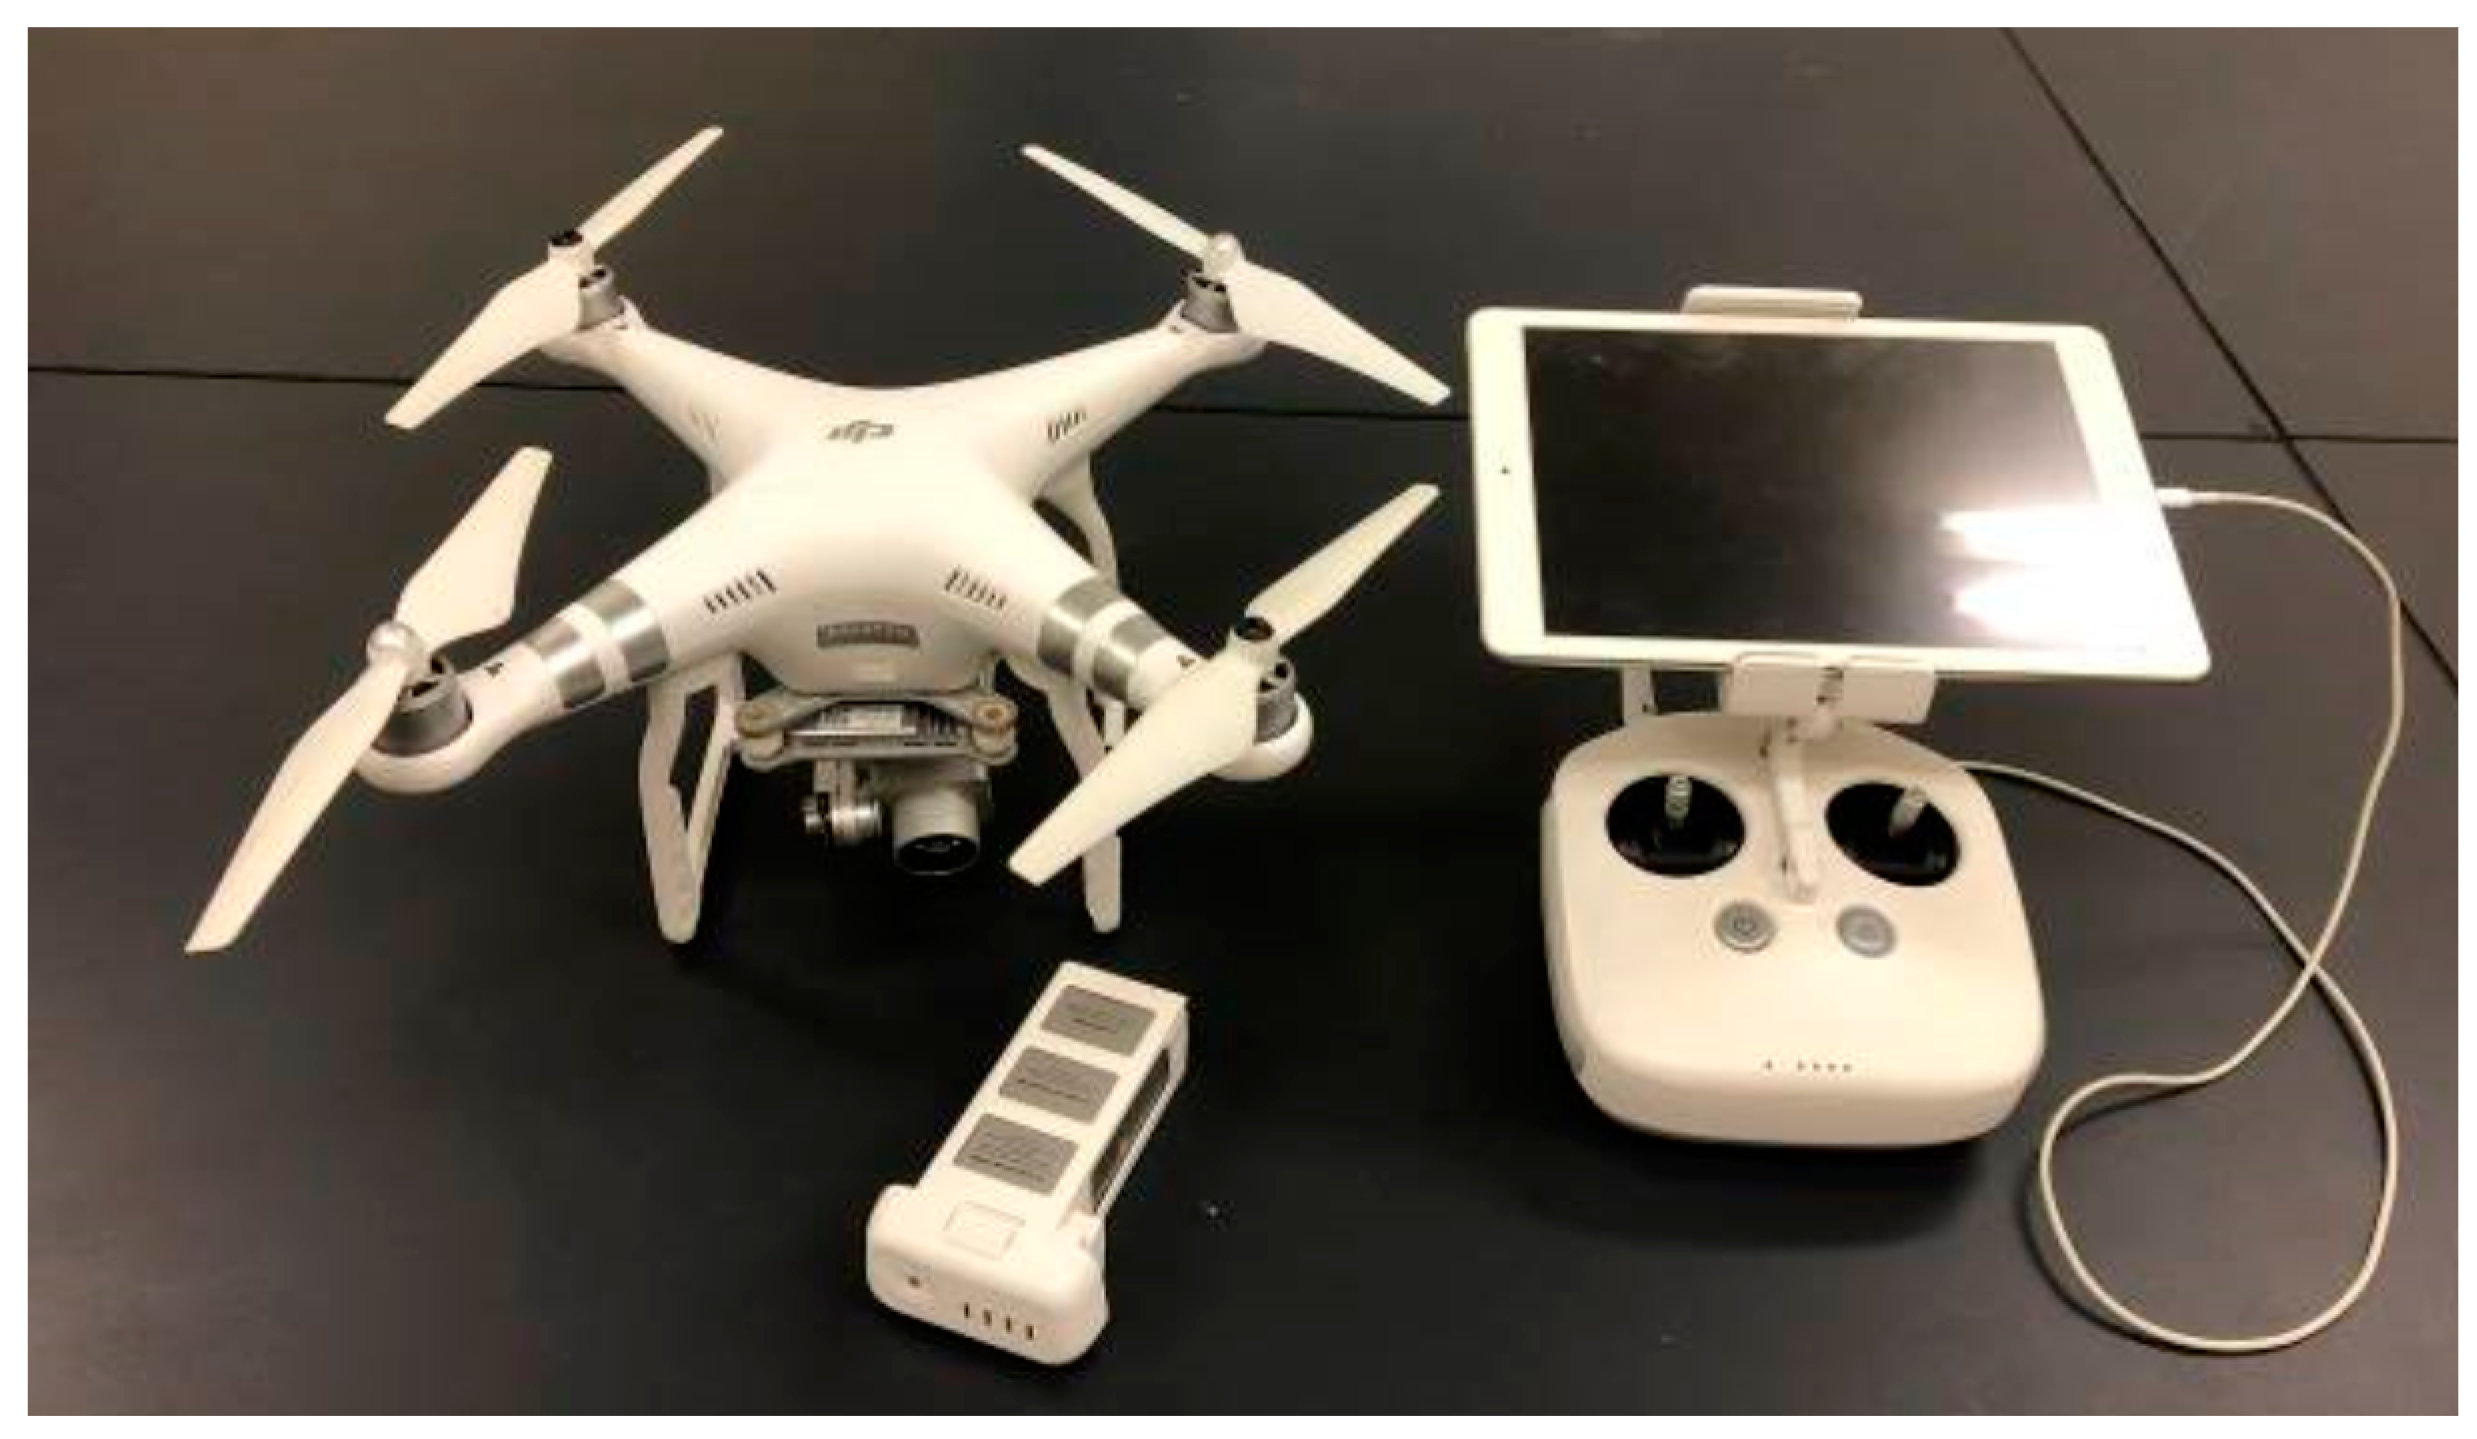
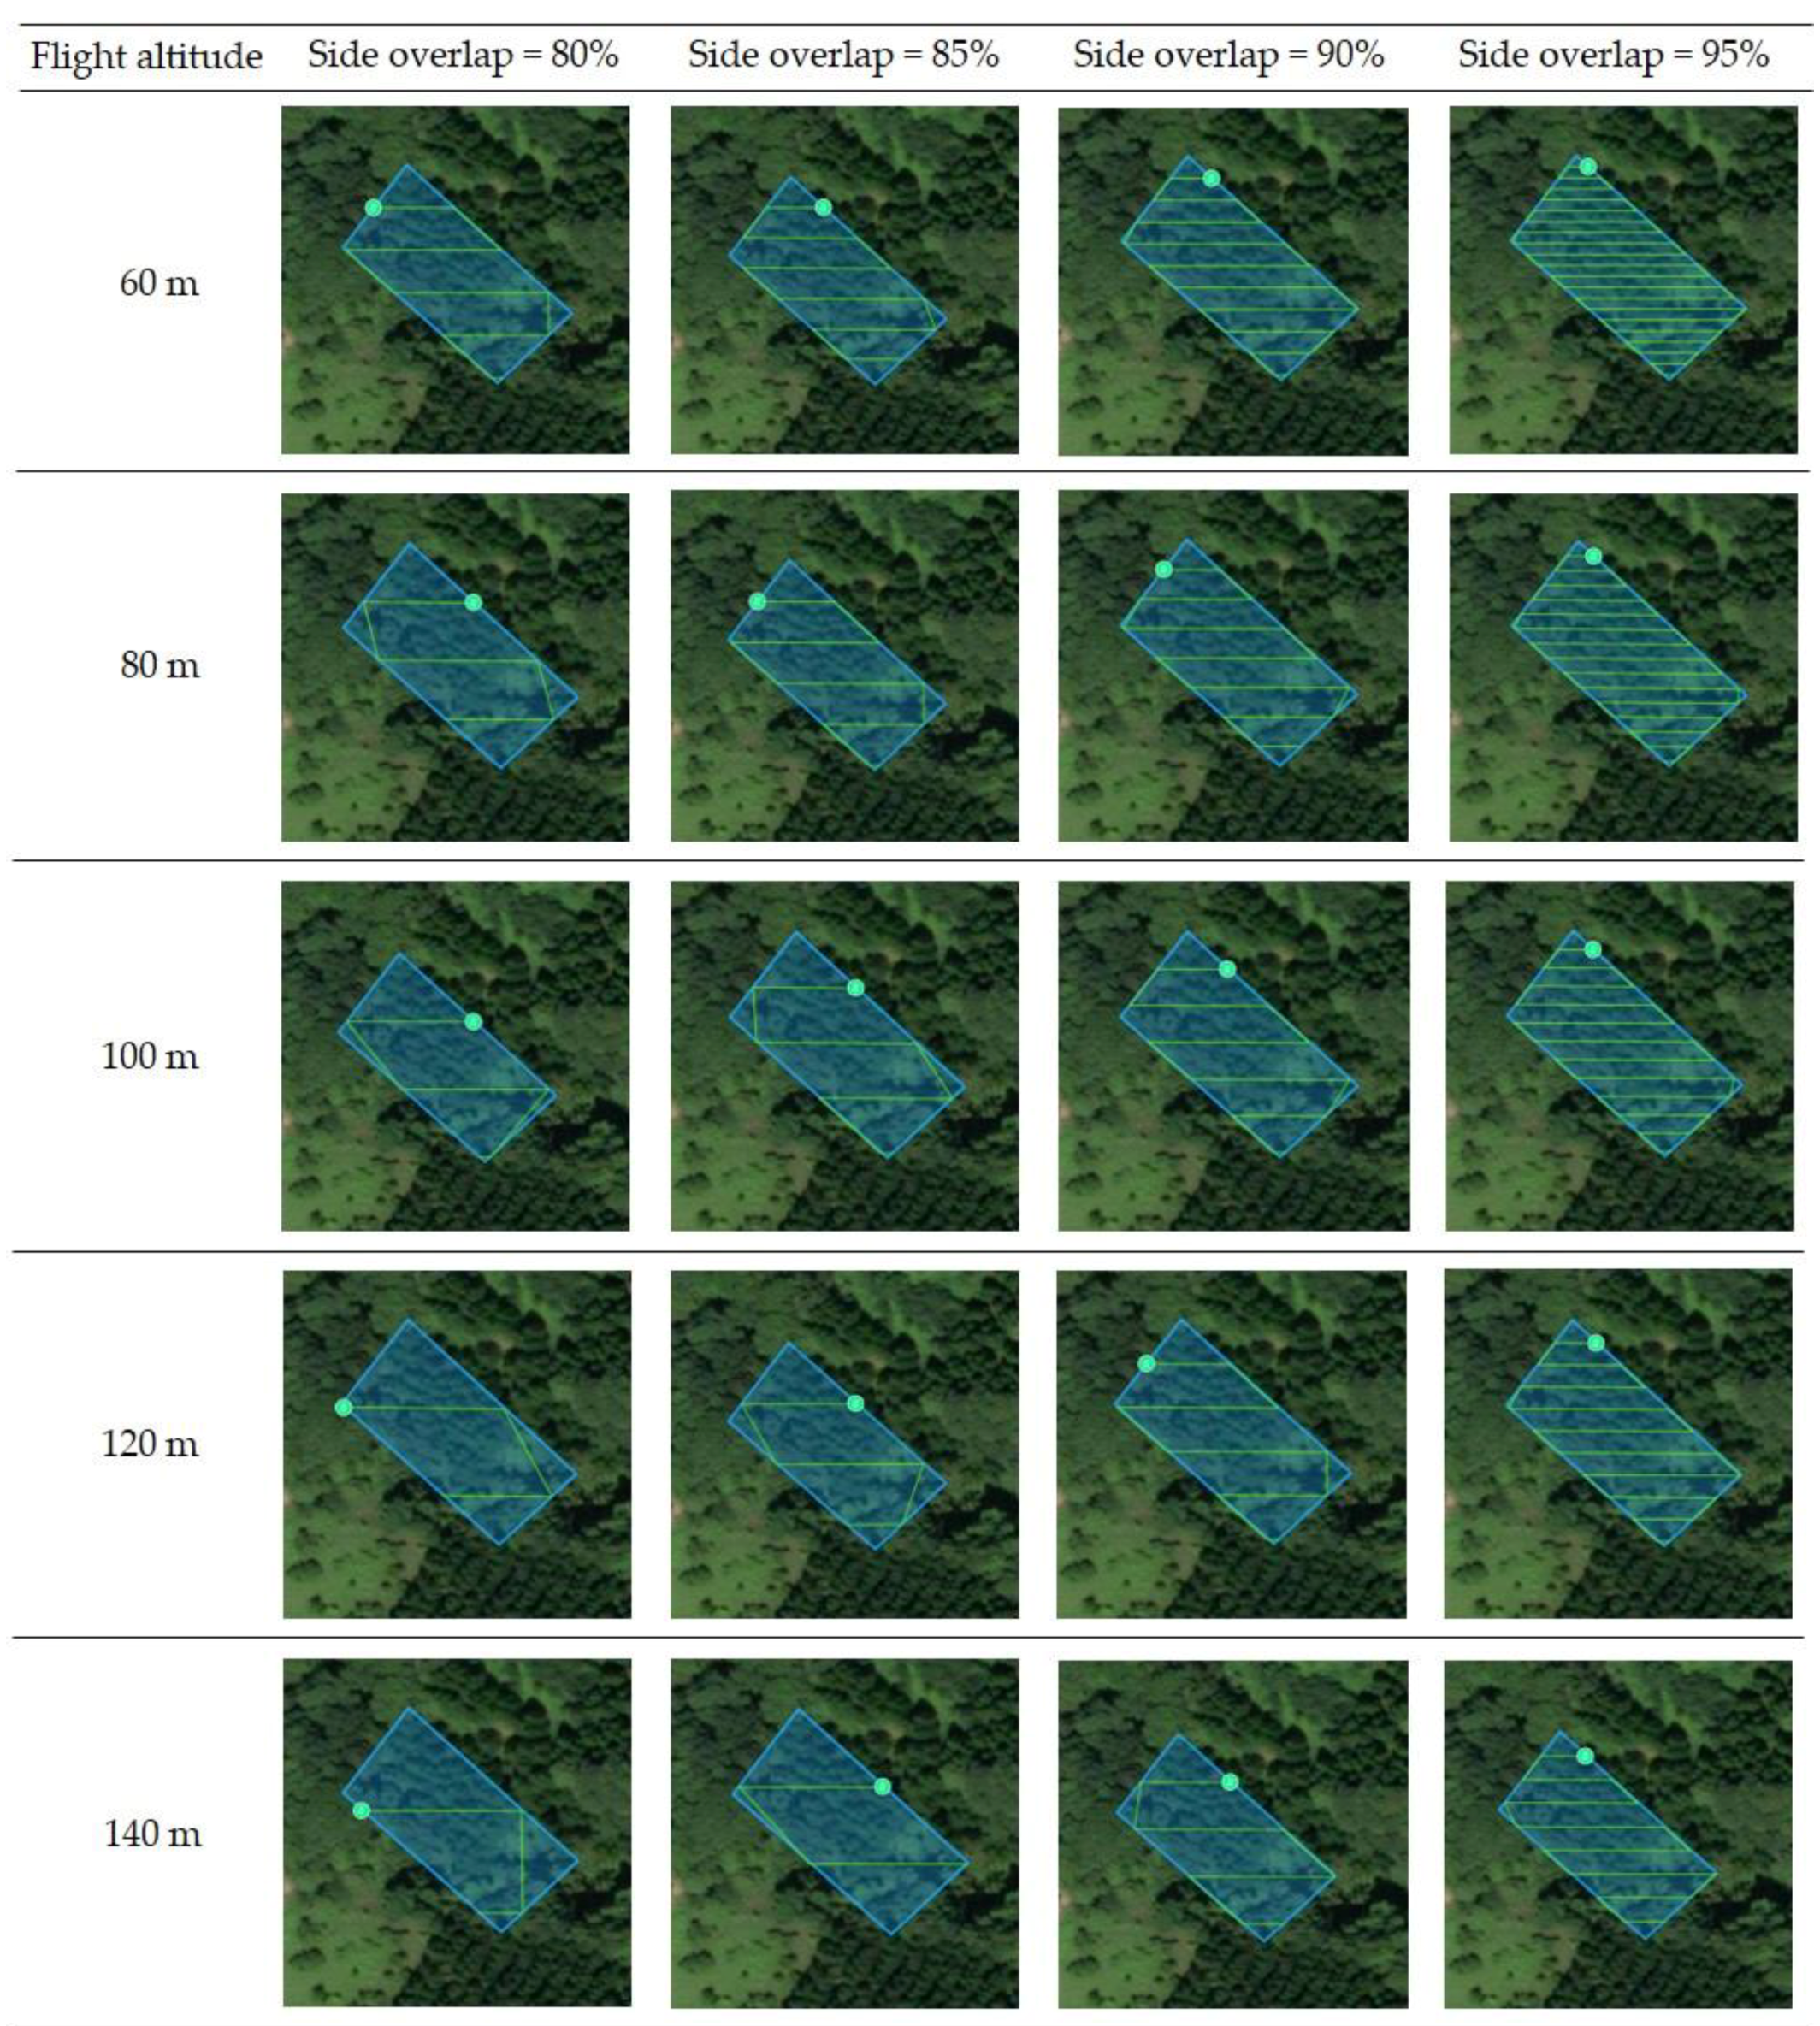
2.2. Flight Conditions of the UAV
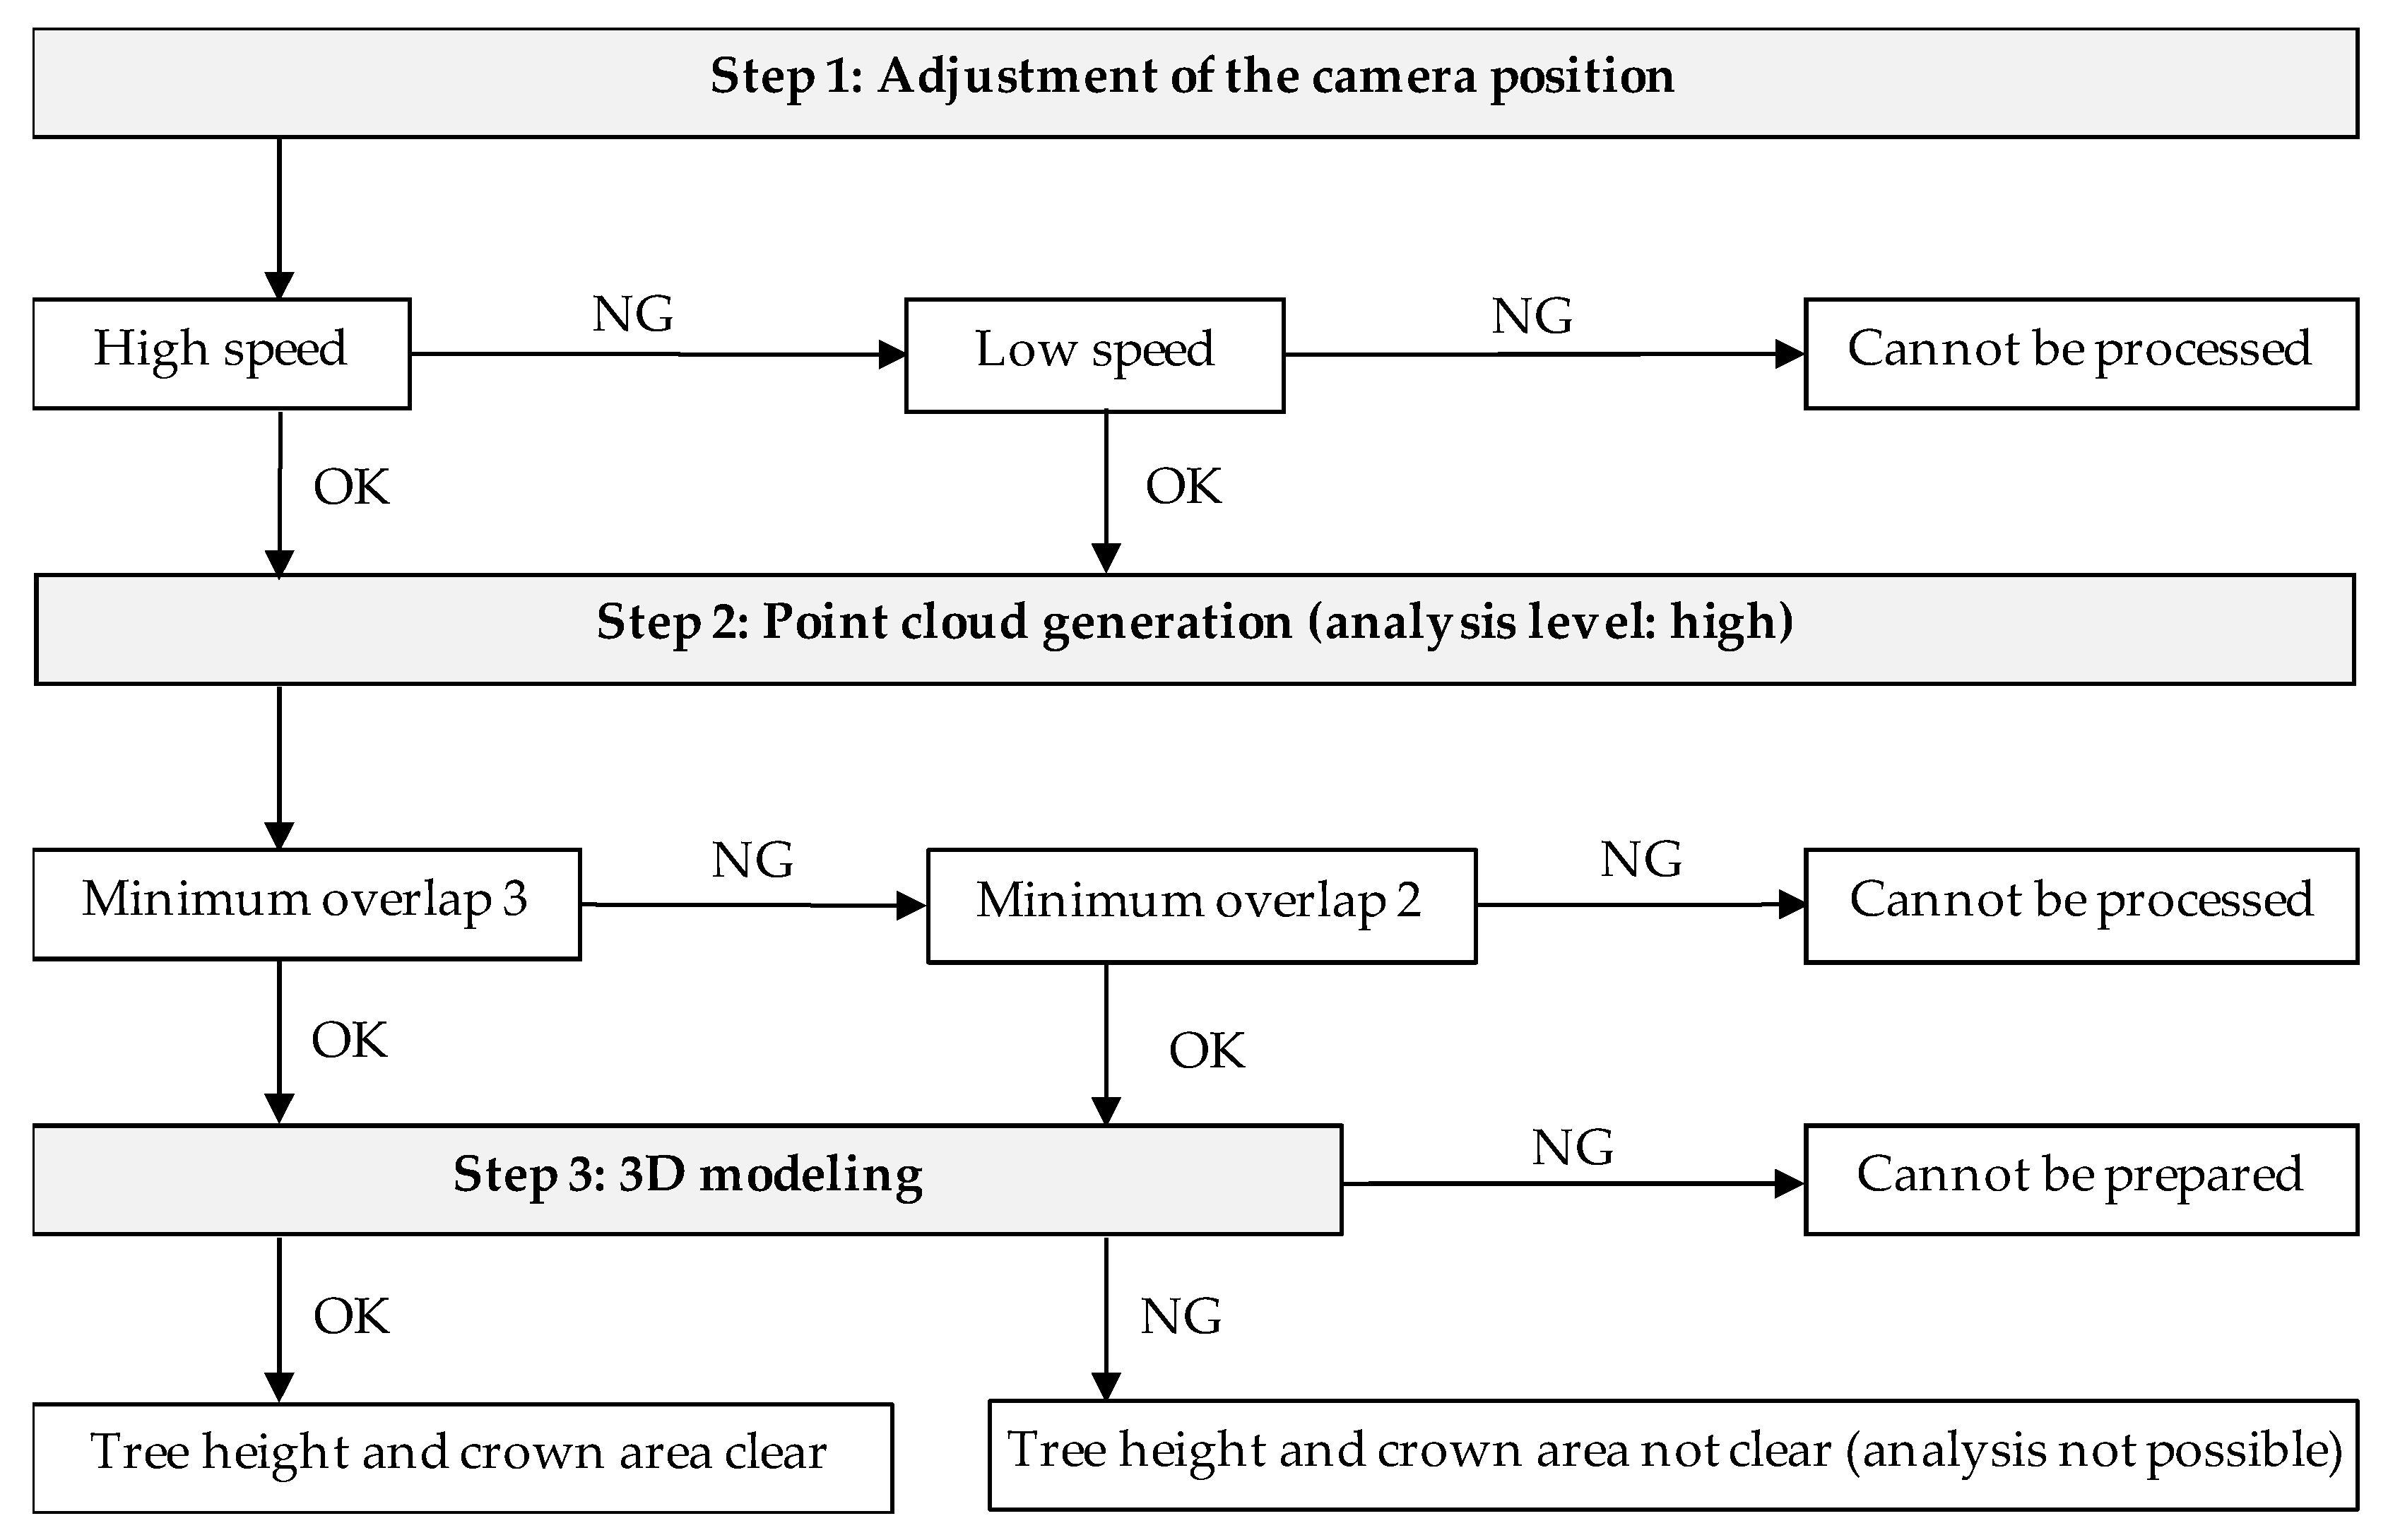
2.3. Processing of Aerial Images and Measurements/Estimate Methods
2.4. Verification of Accuracy of Measured and Estimated Values
3. Results
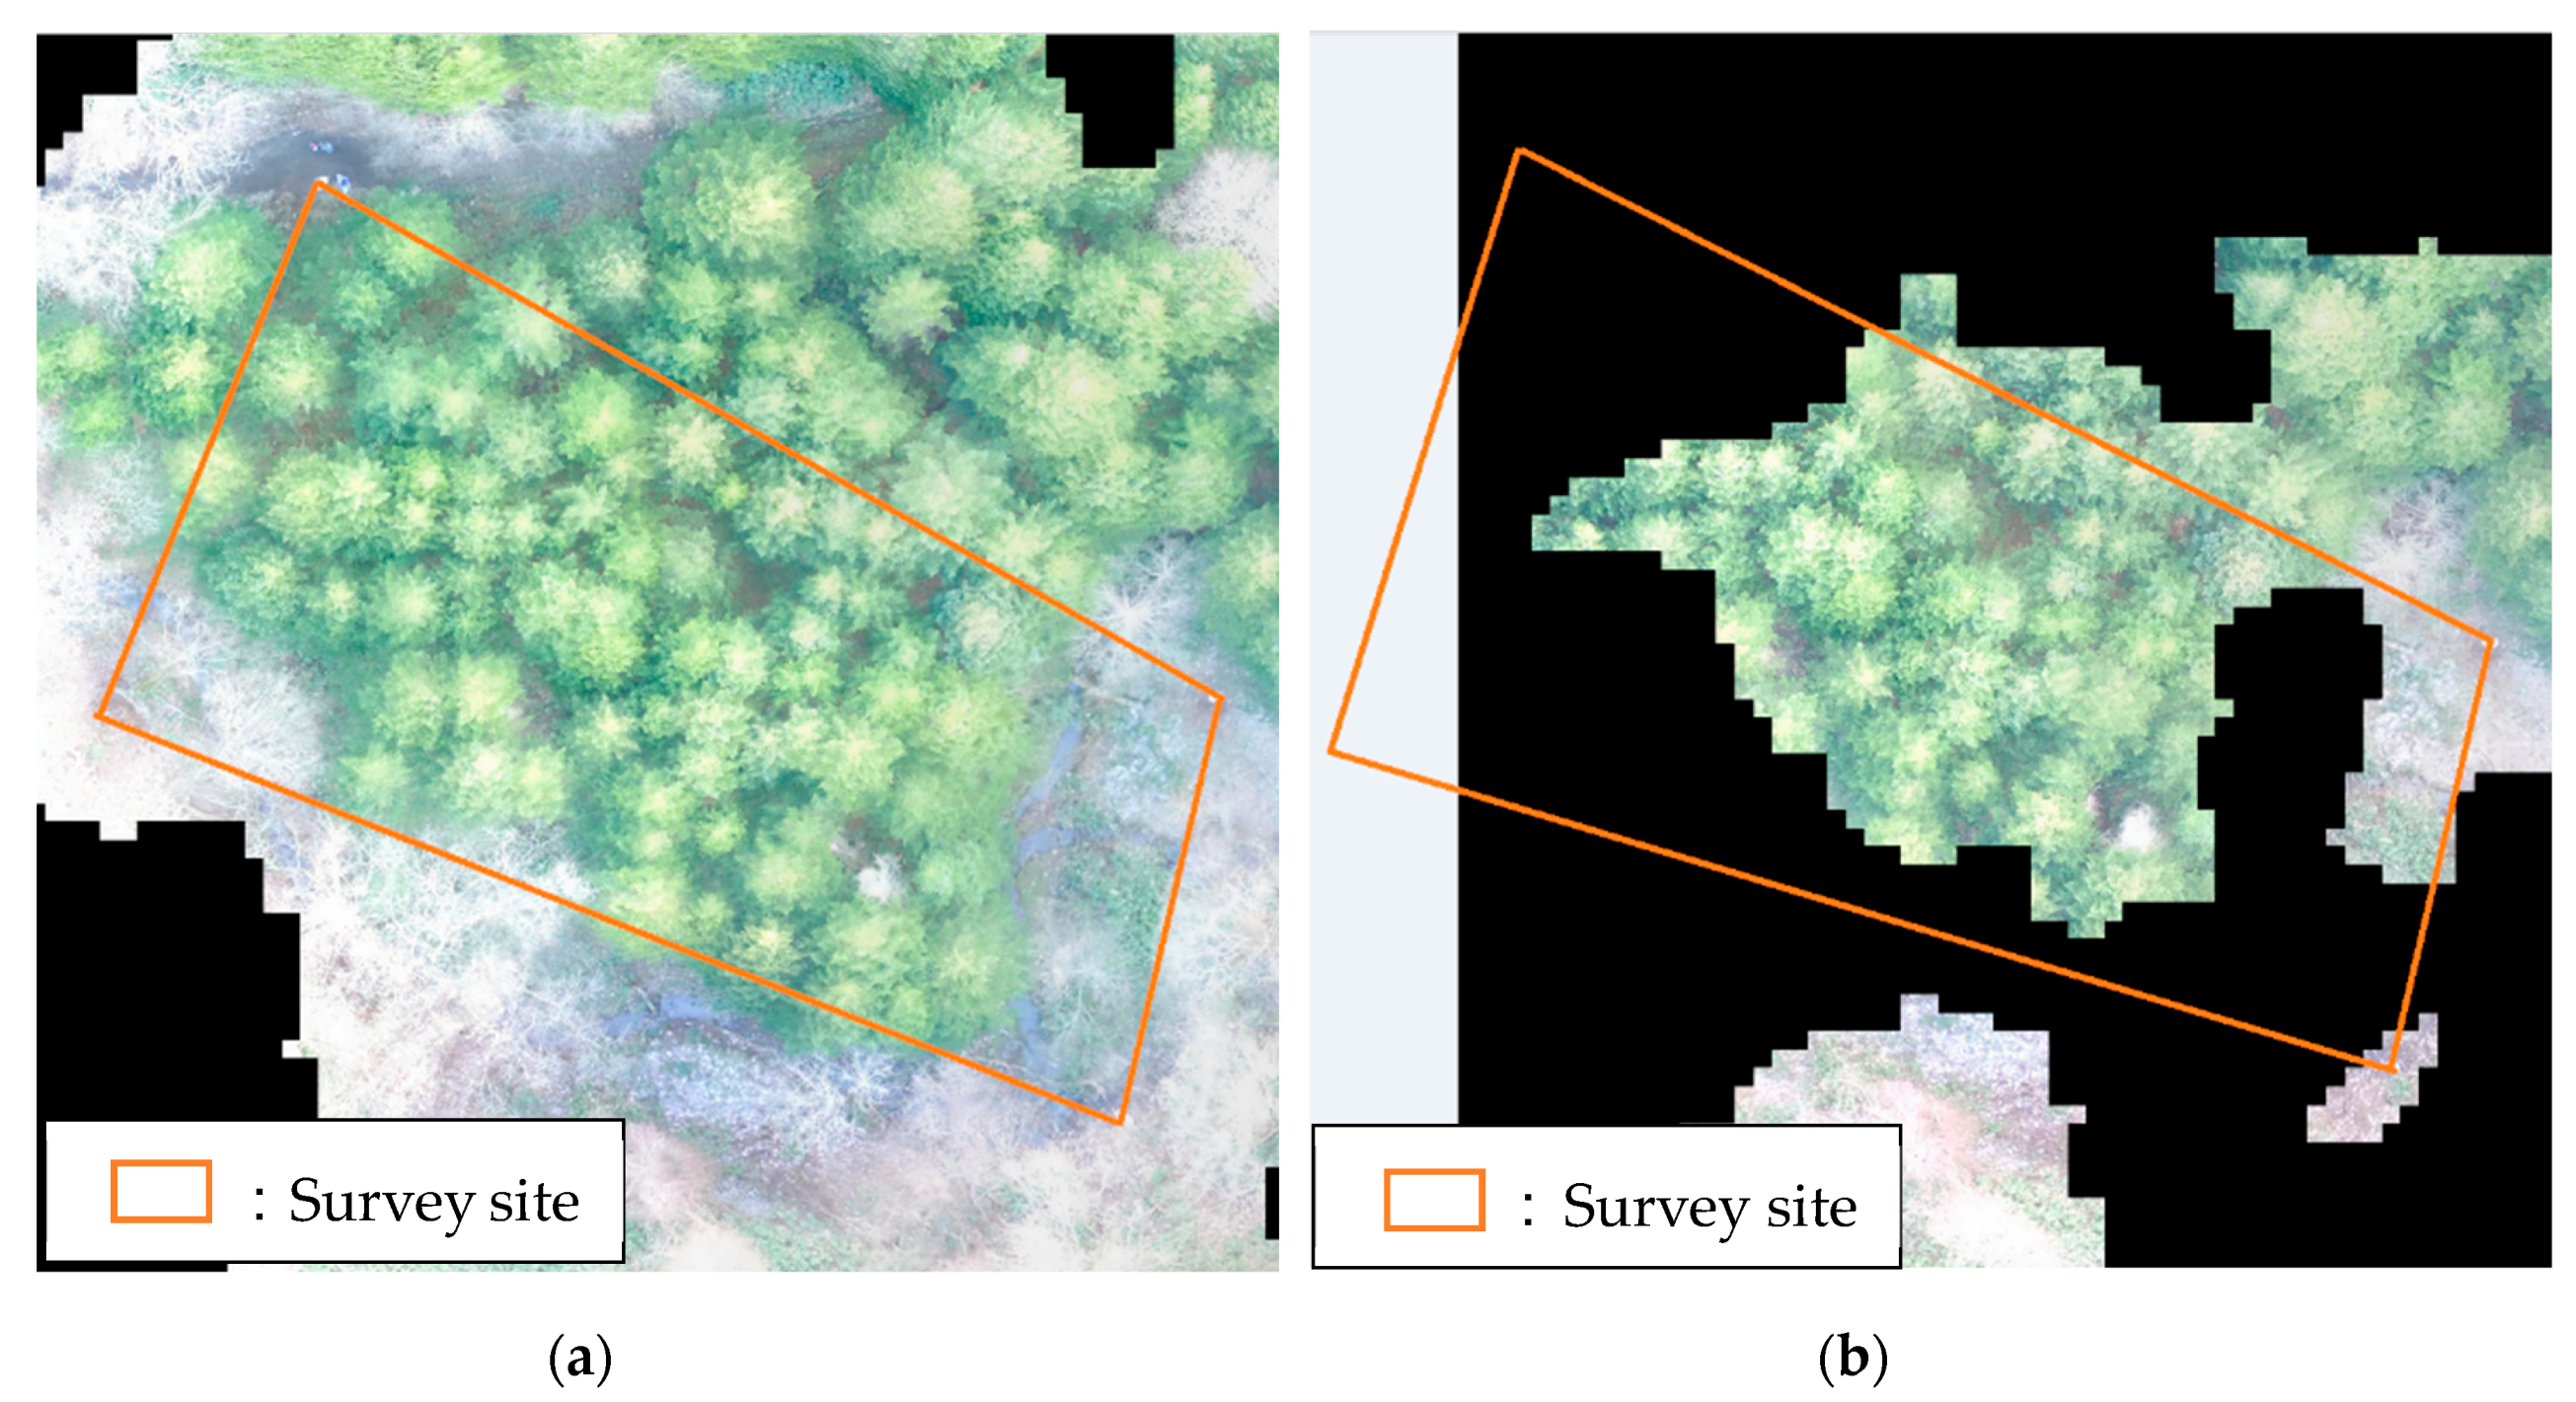
3.1. Aerial Images and Their Clarity
3.2. Crown Area Measurement
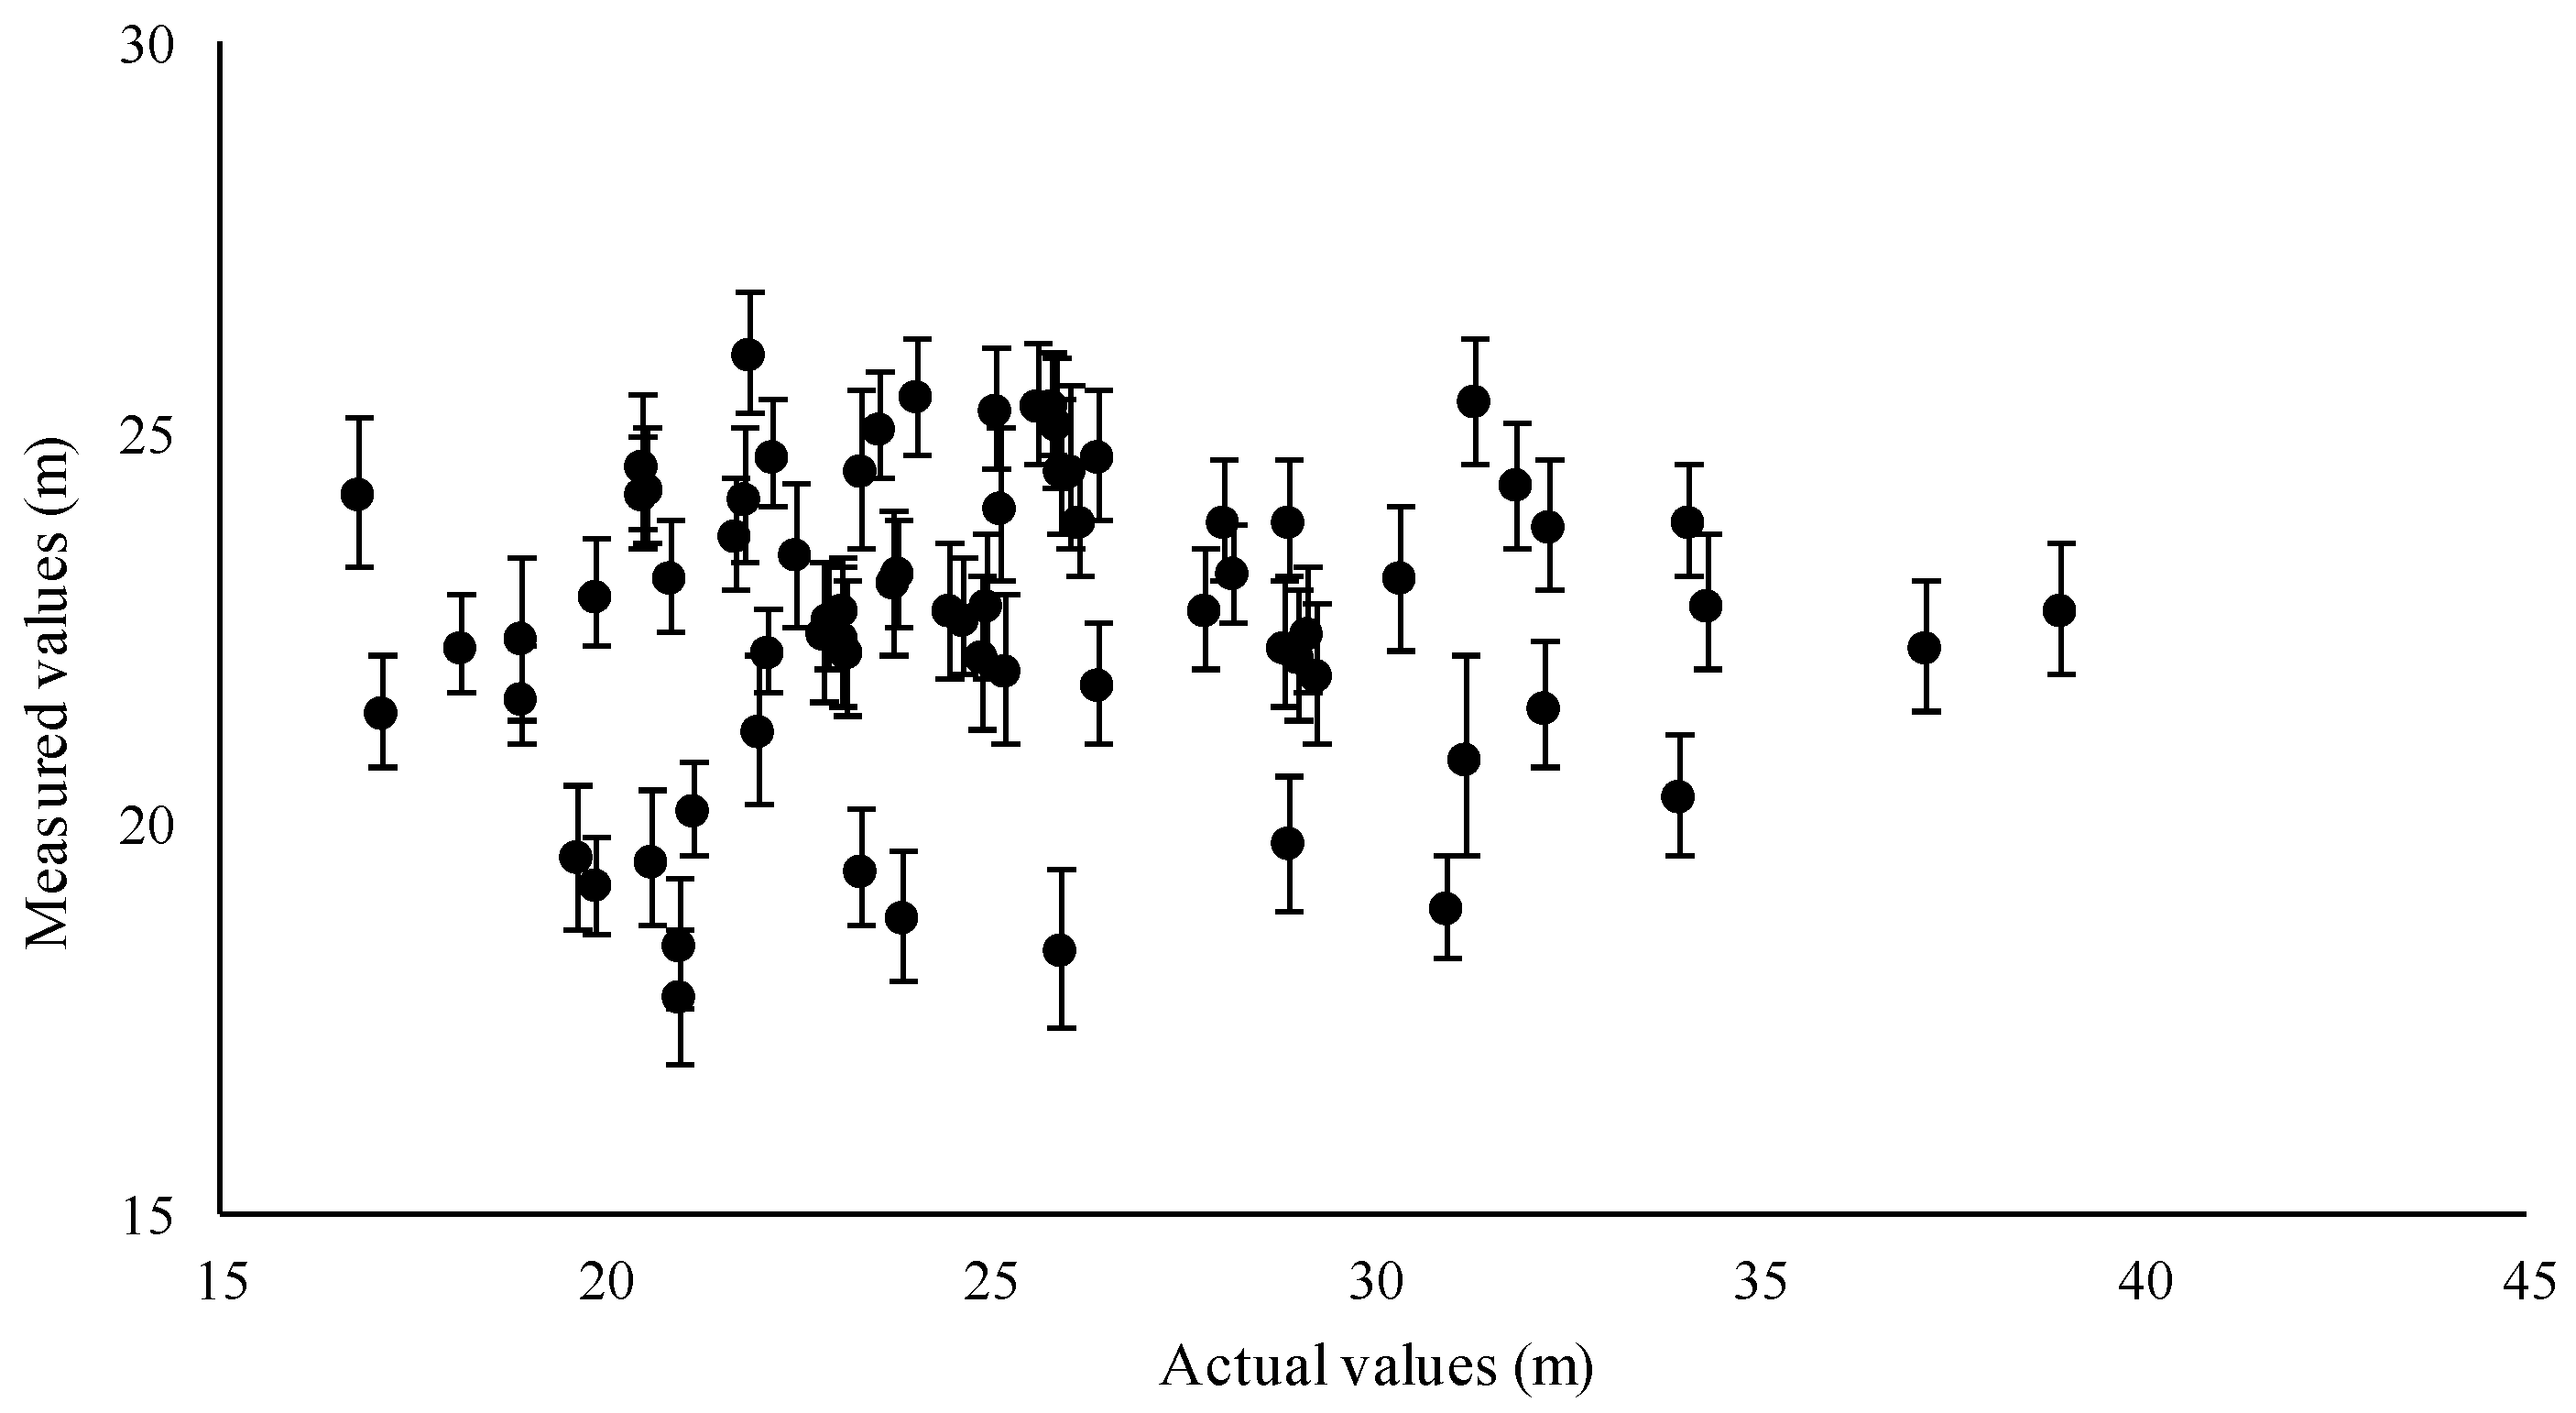
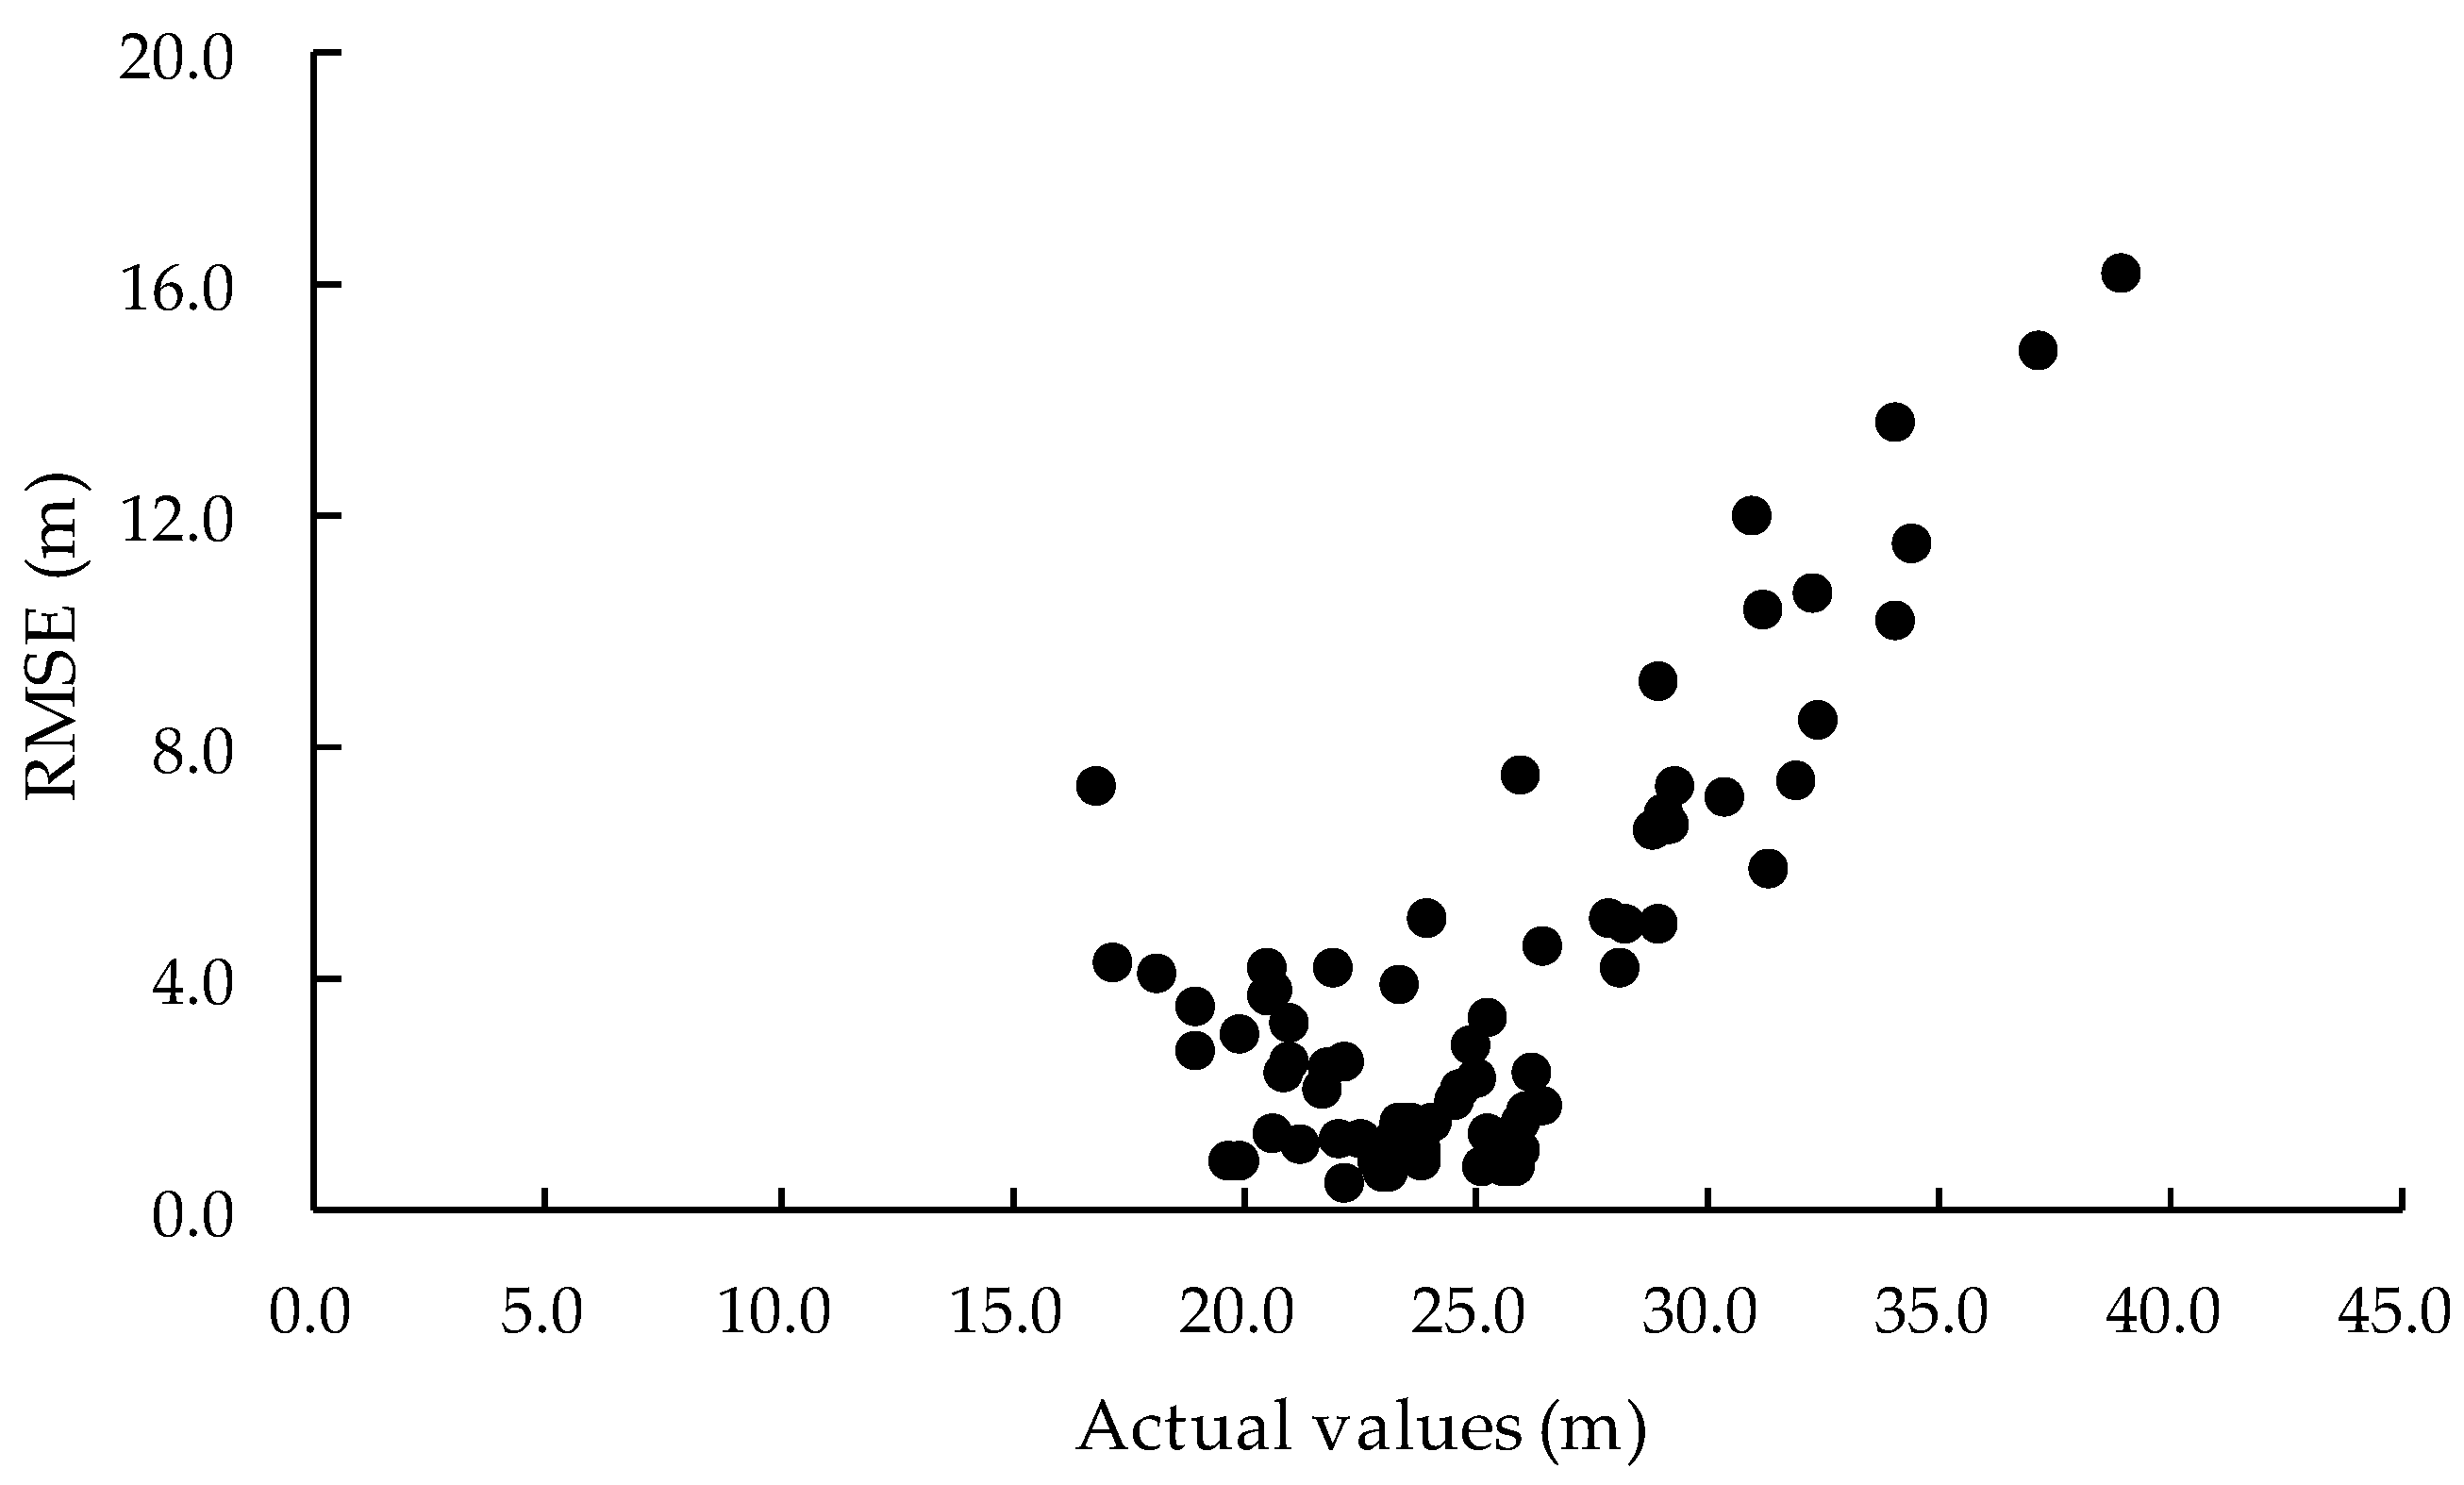
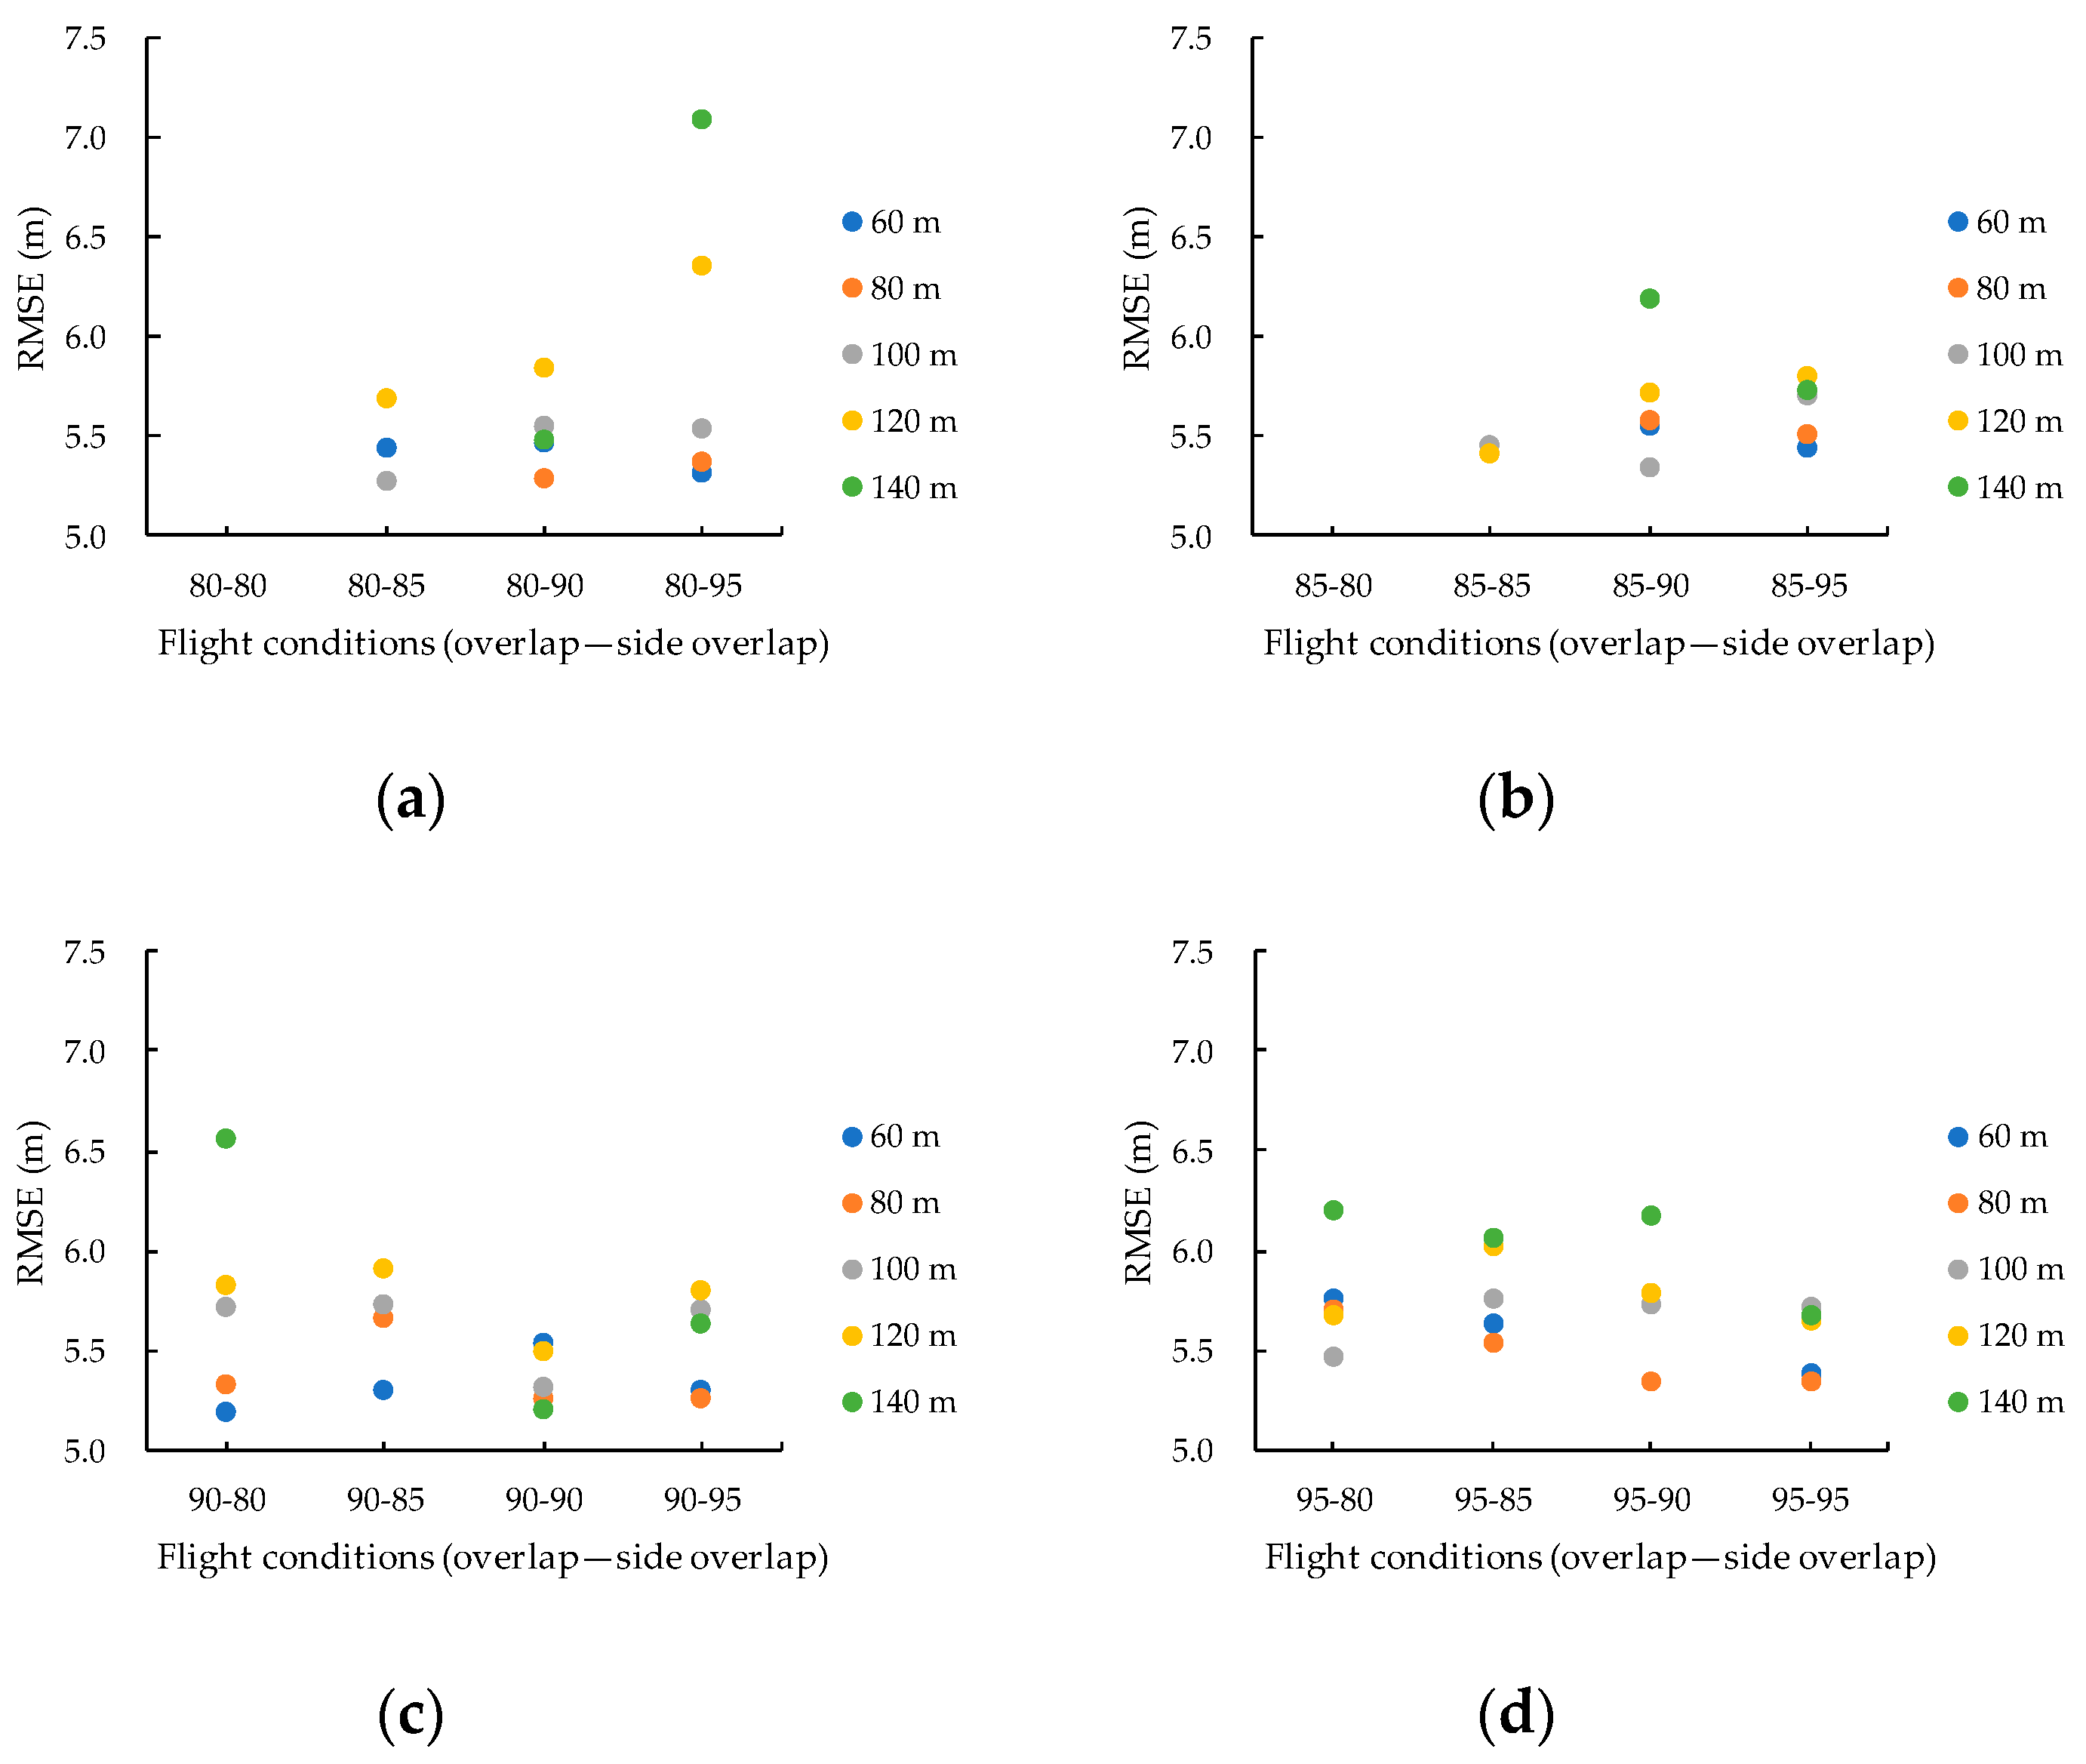
3.3. Tree Height
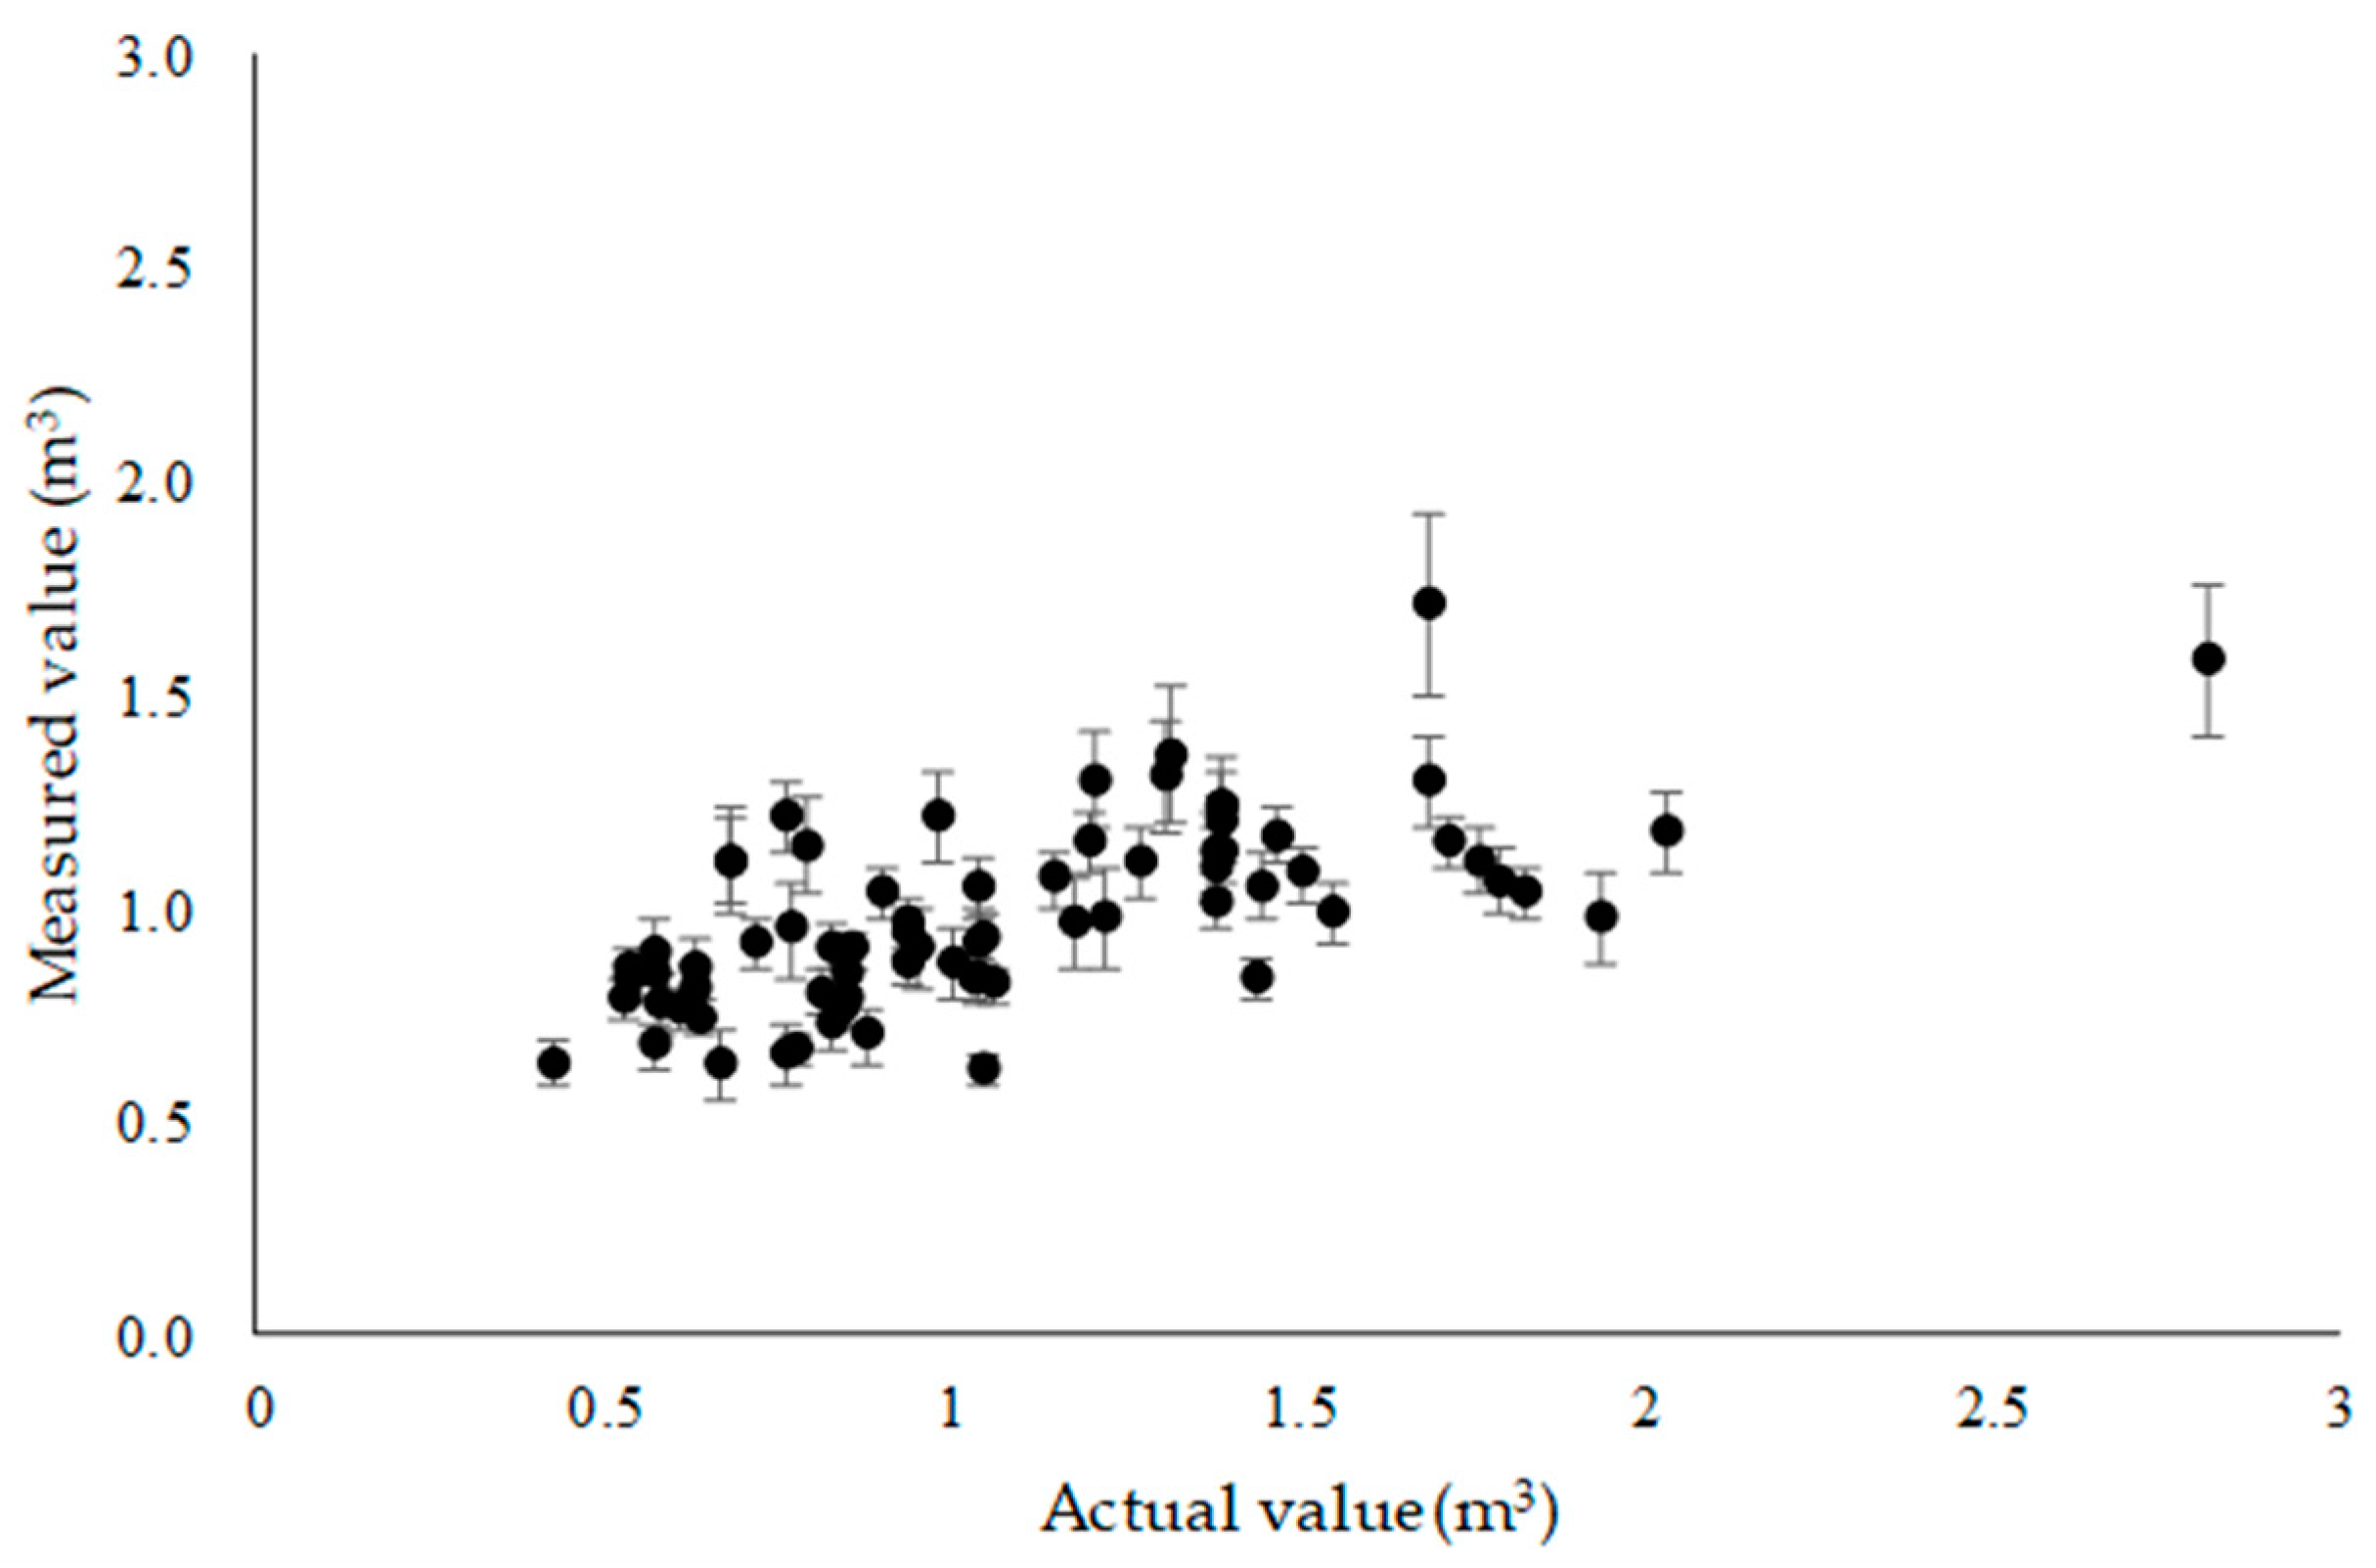
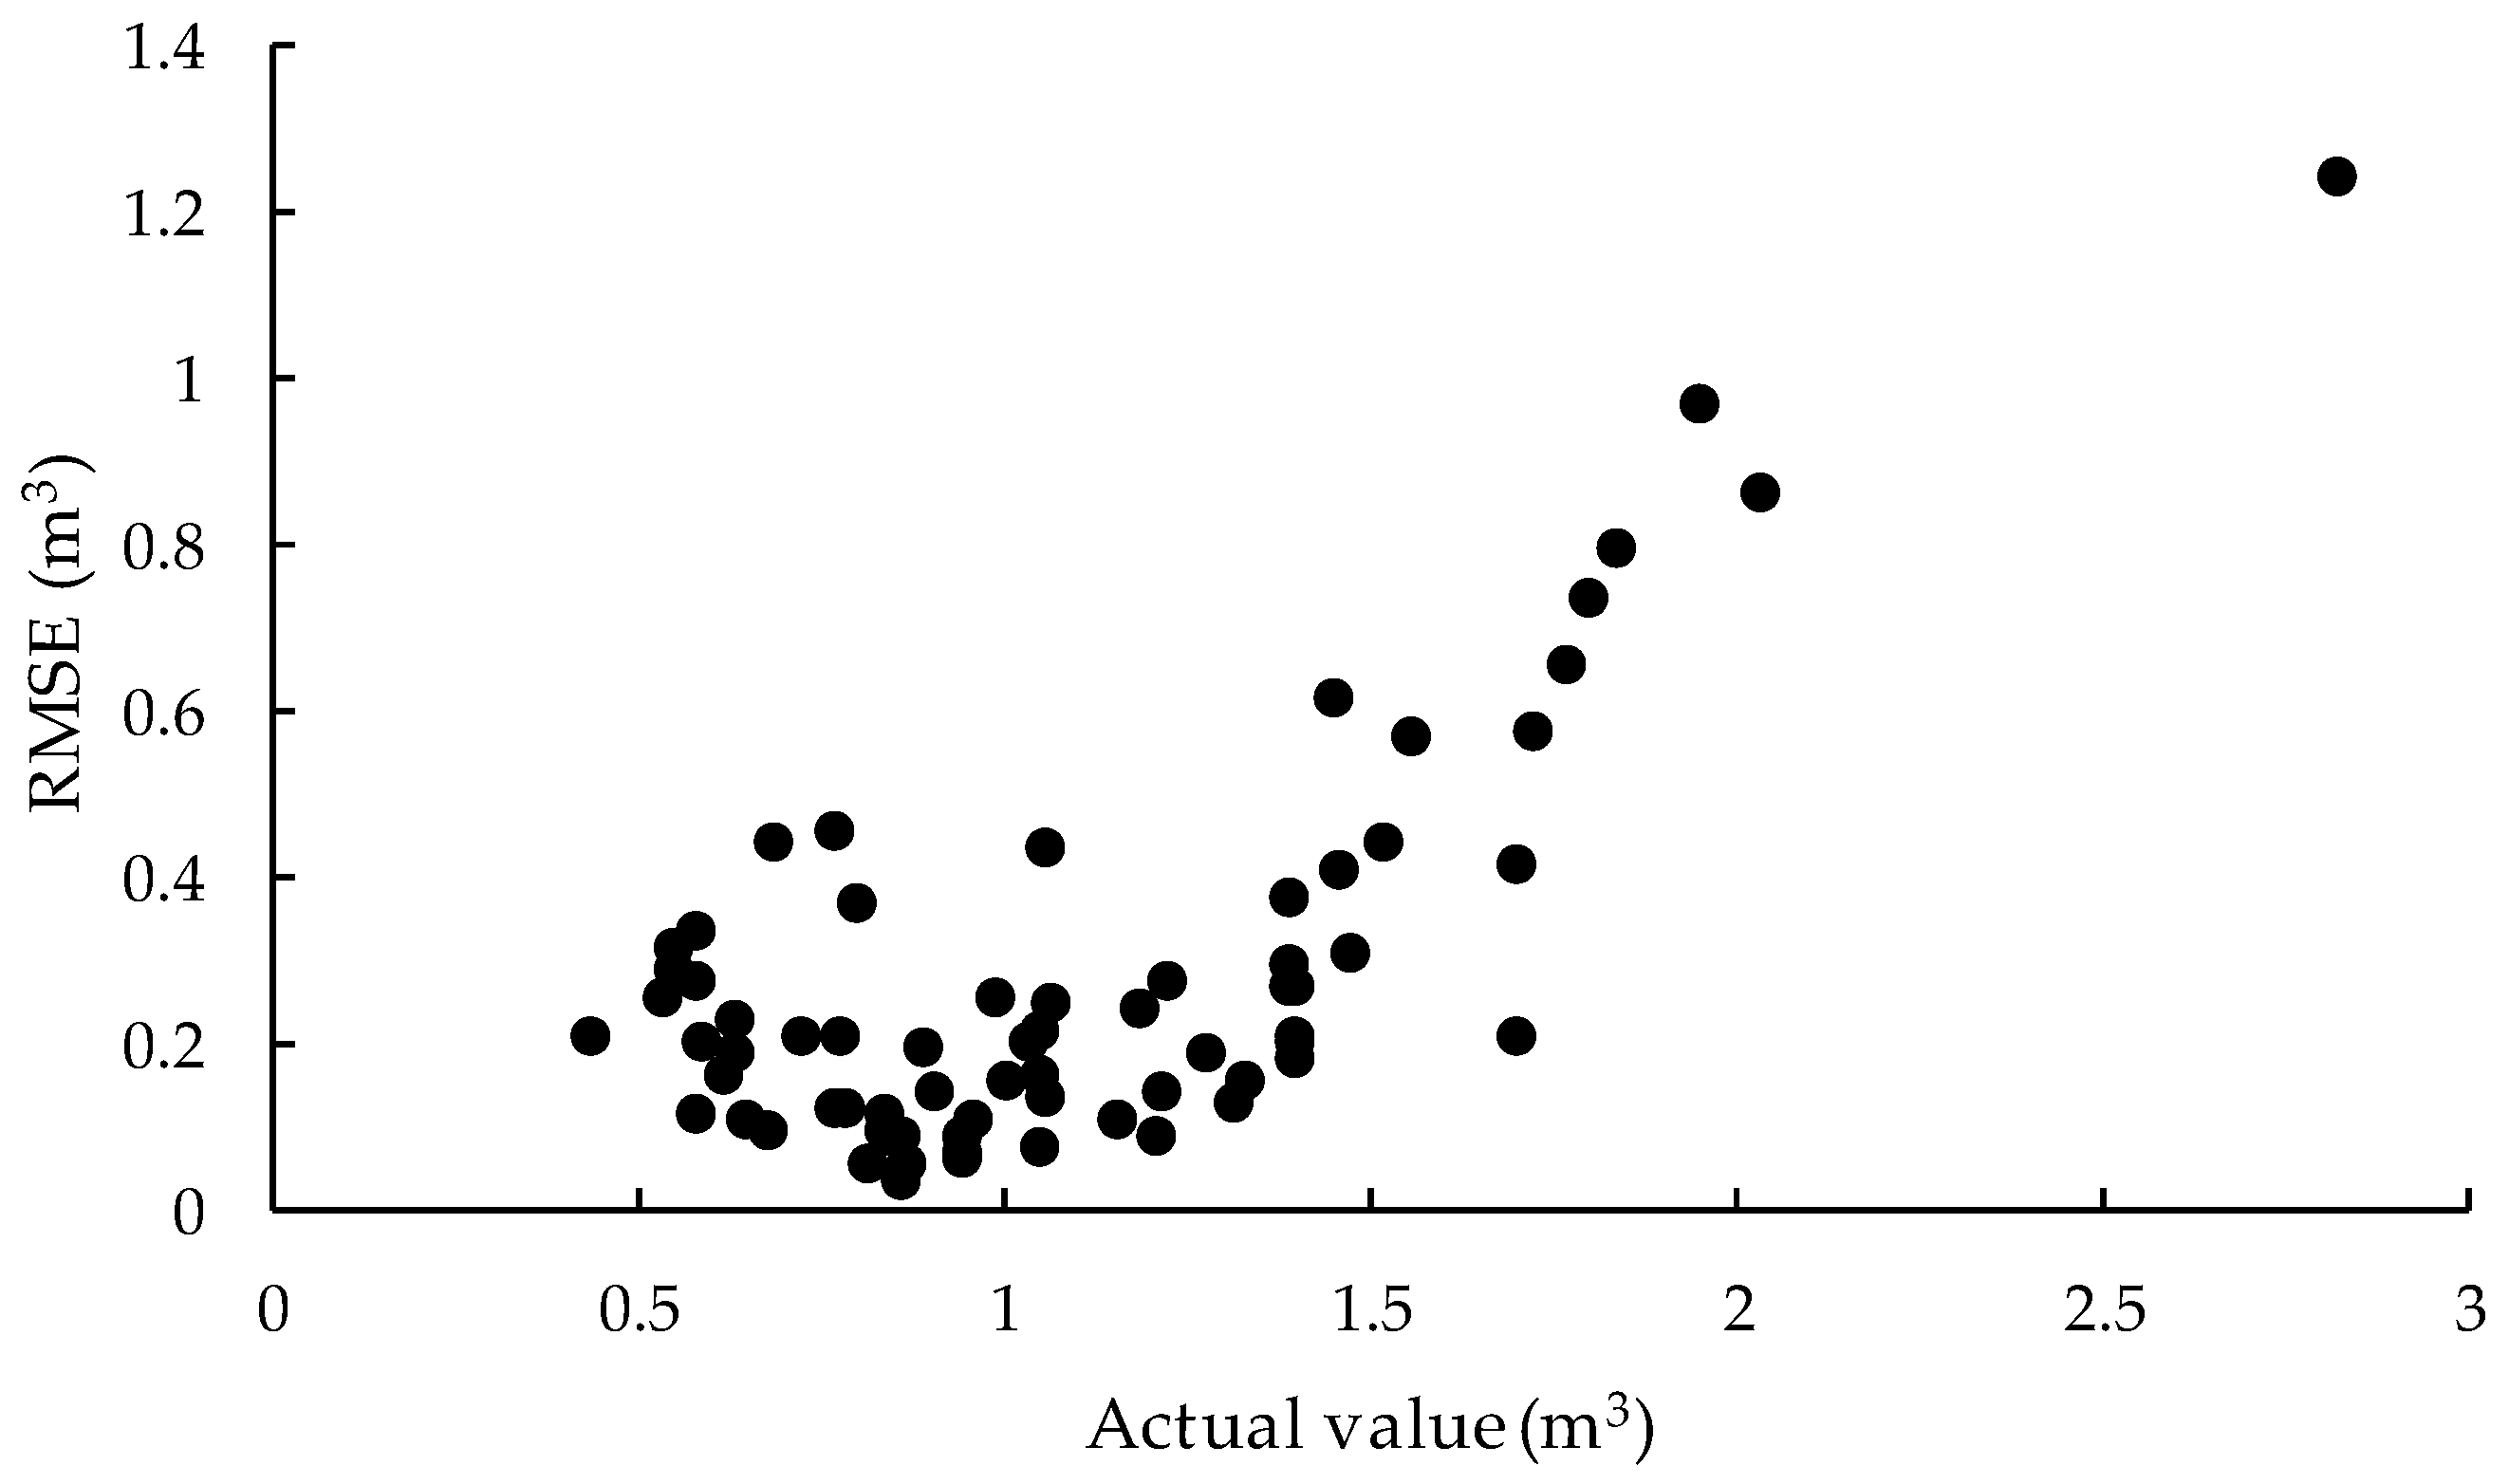
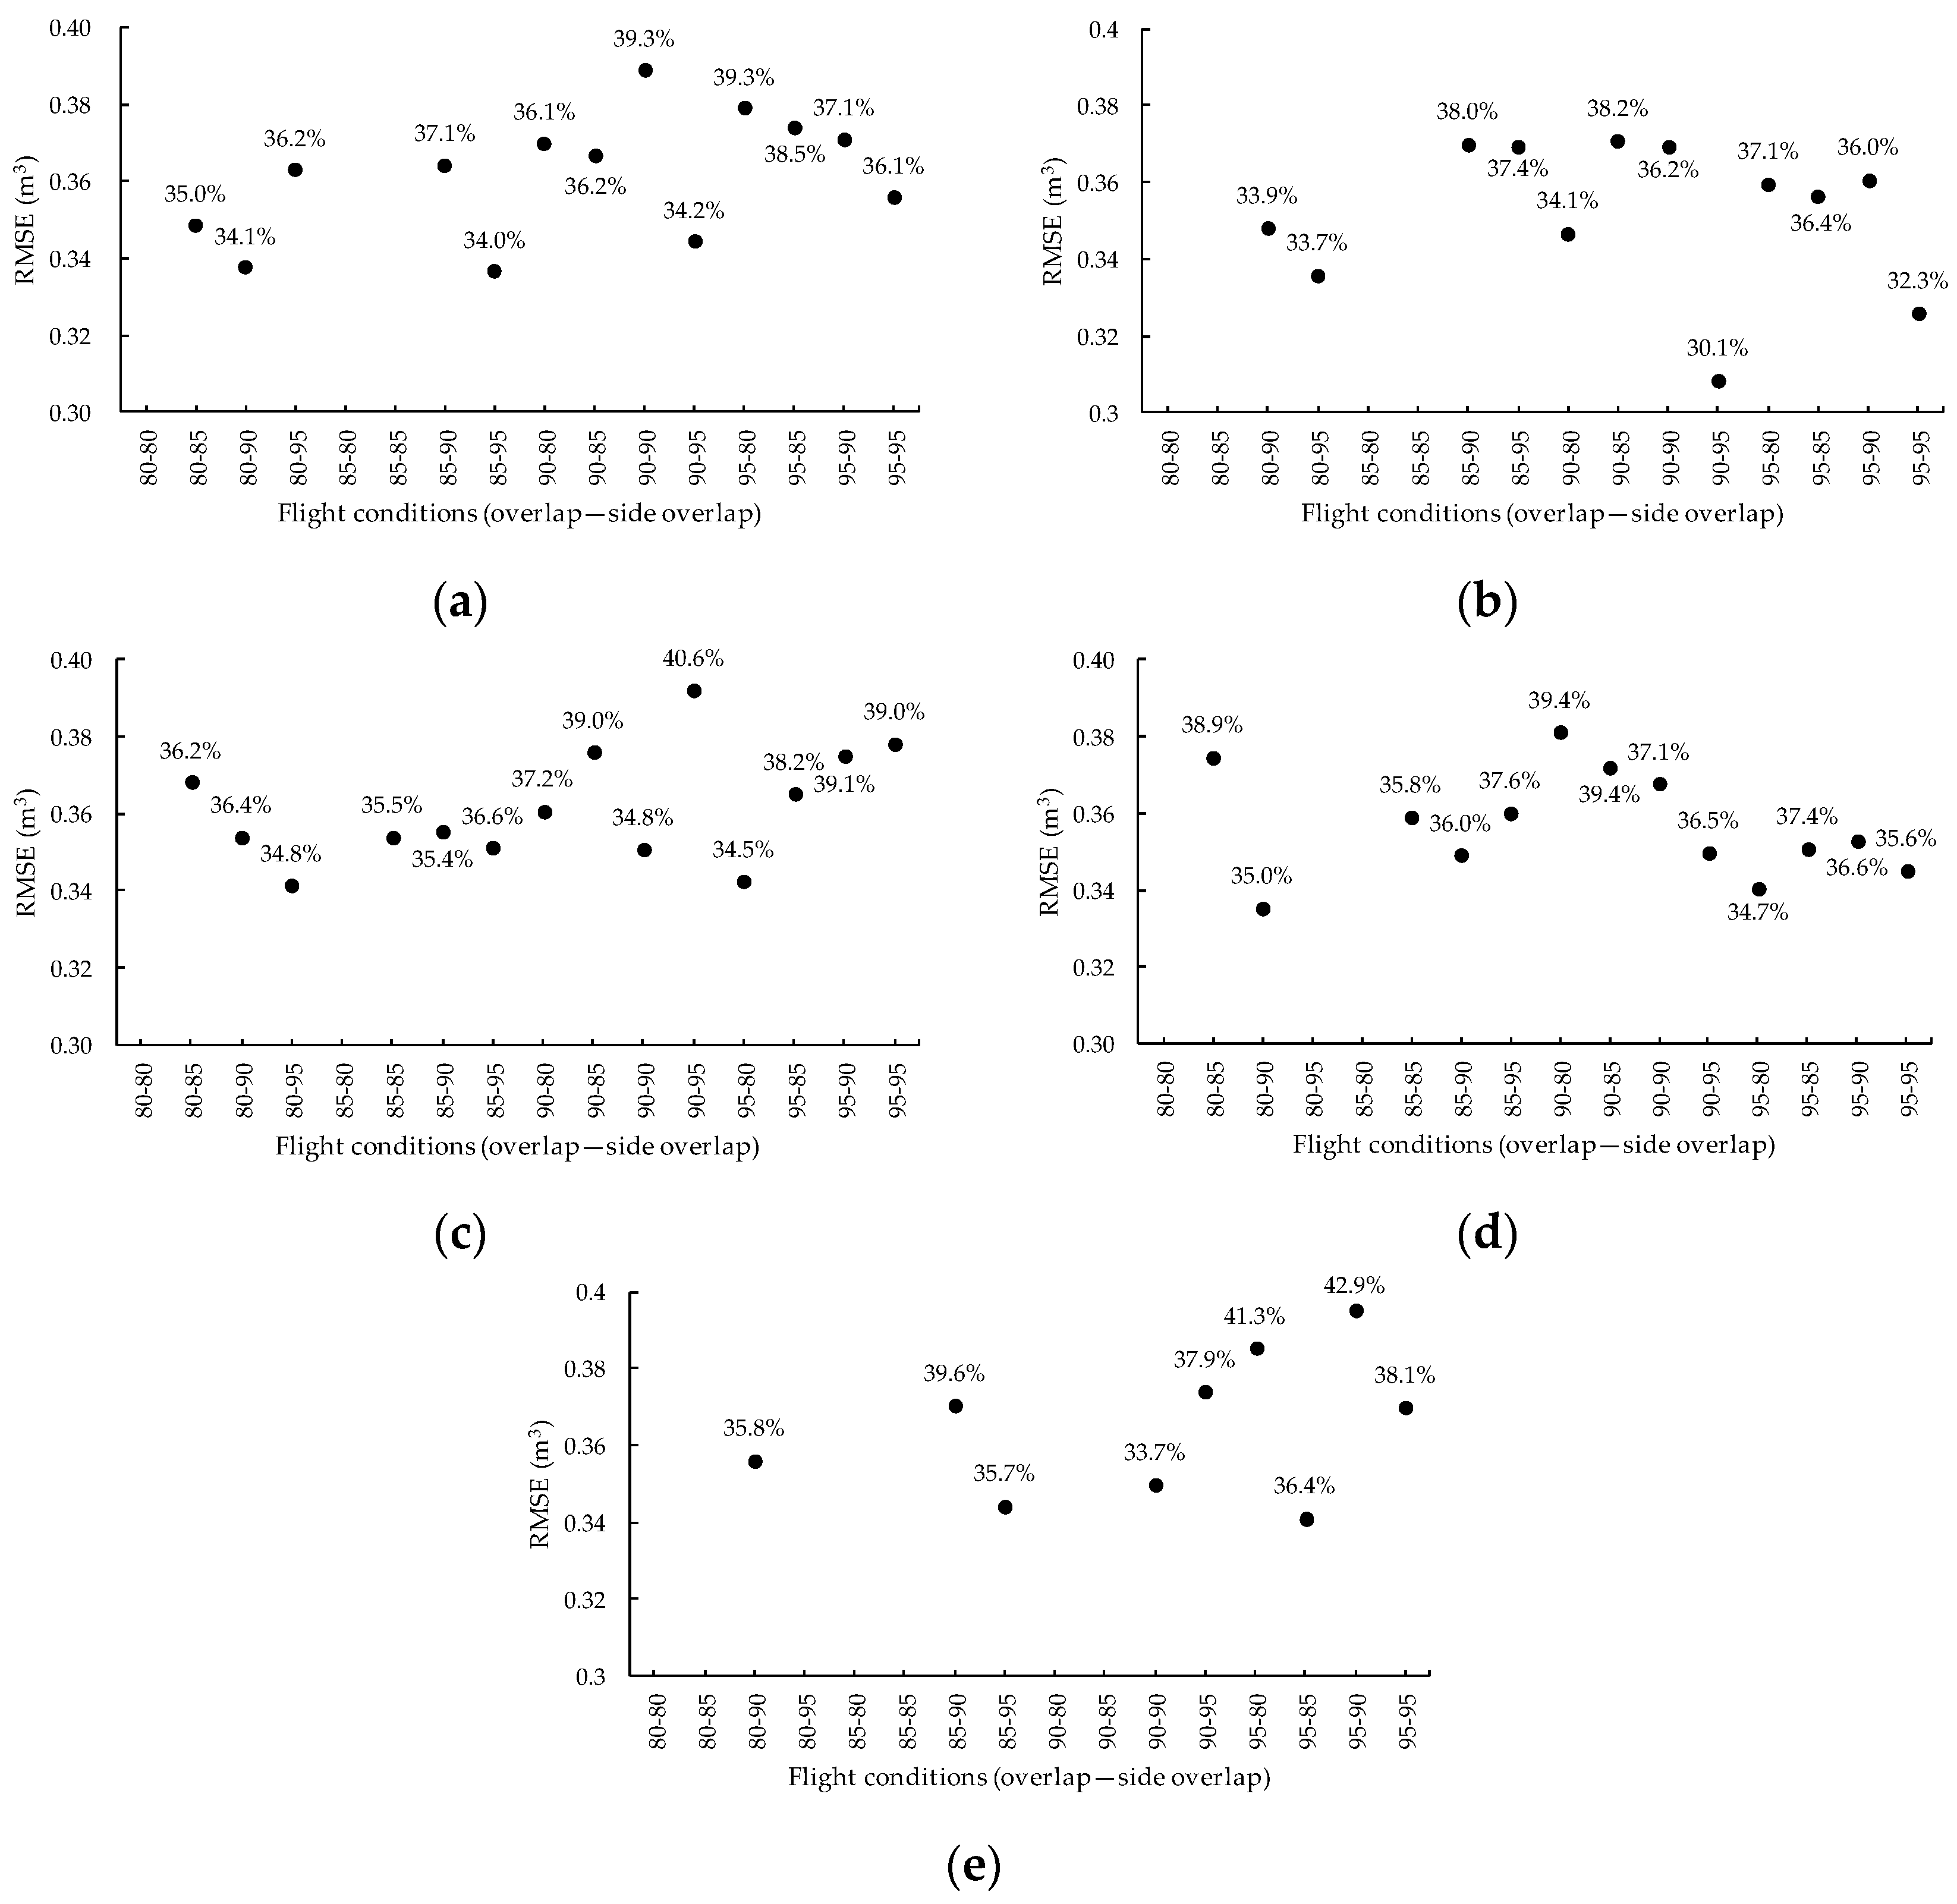
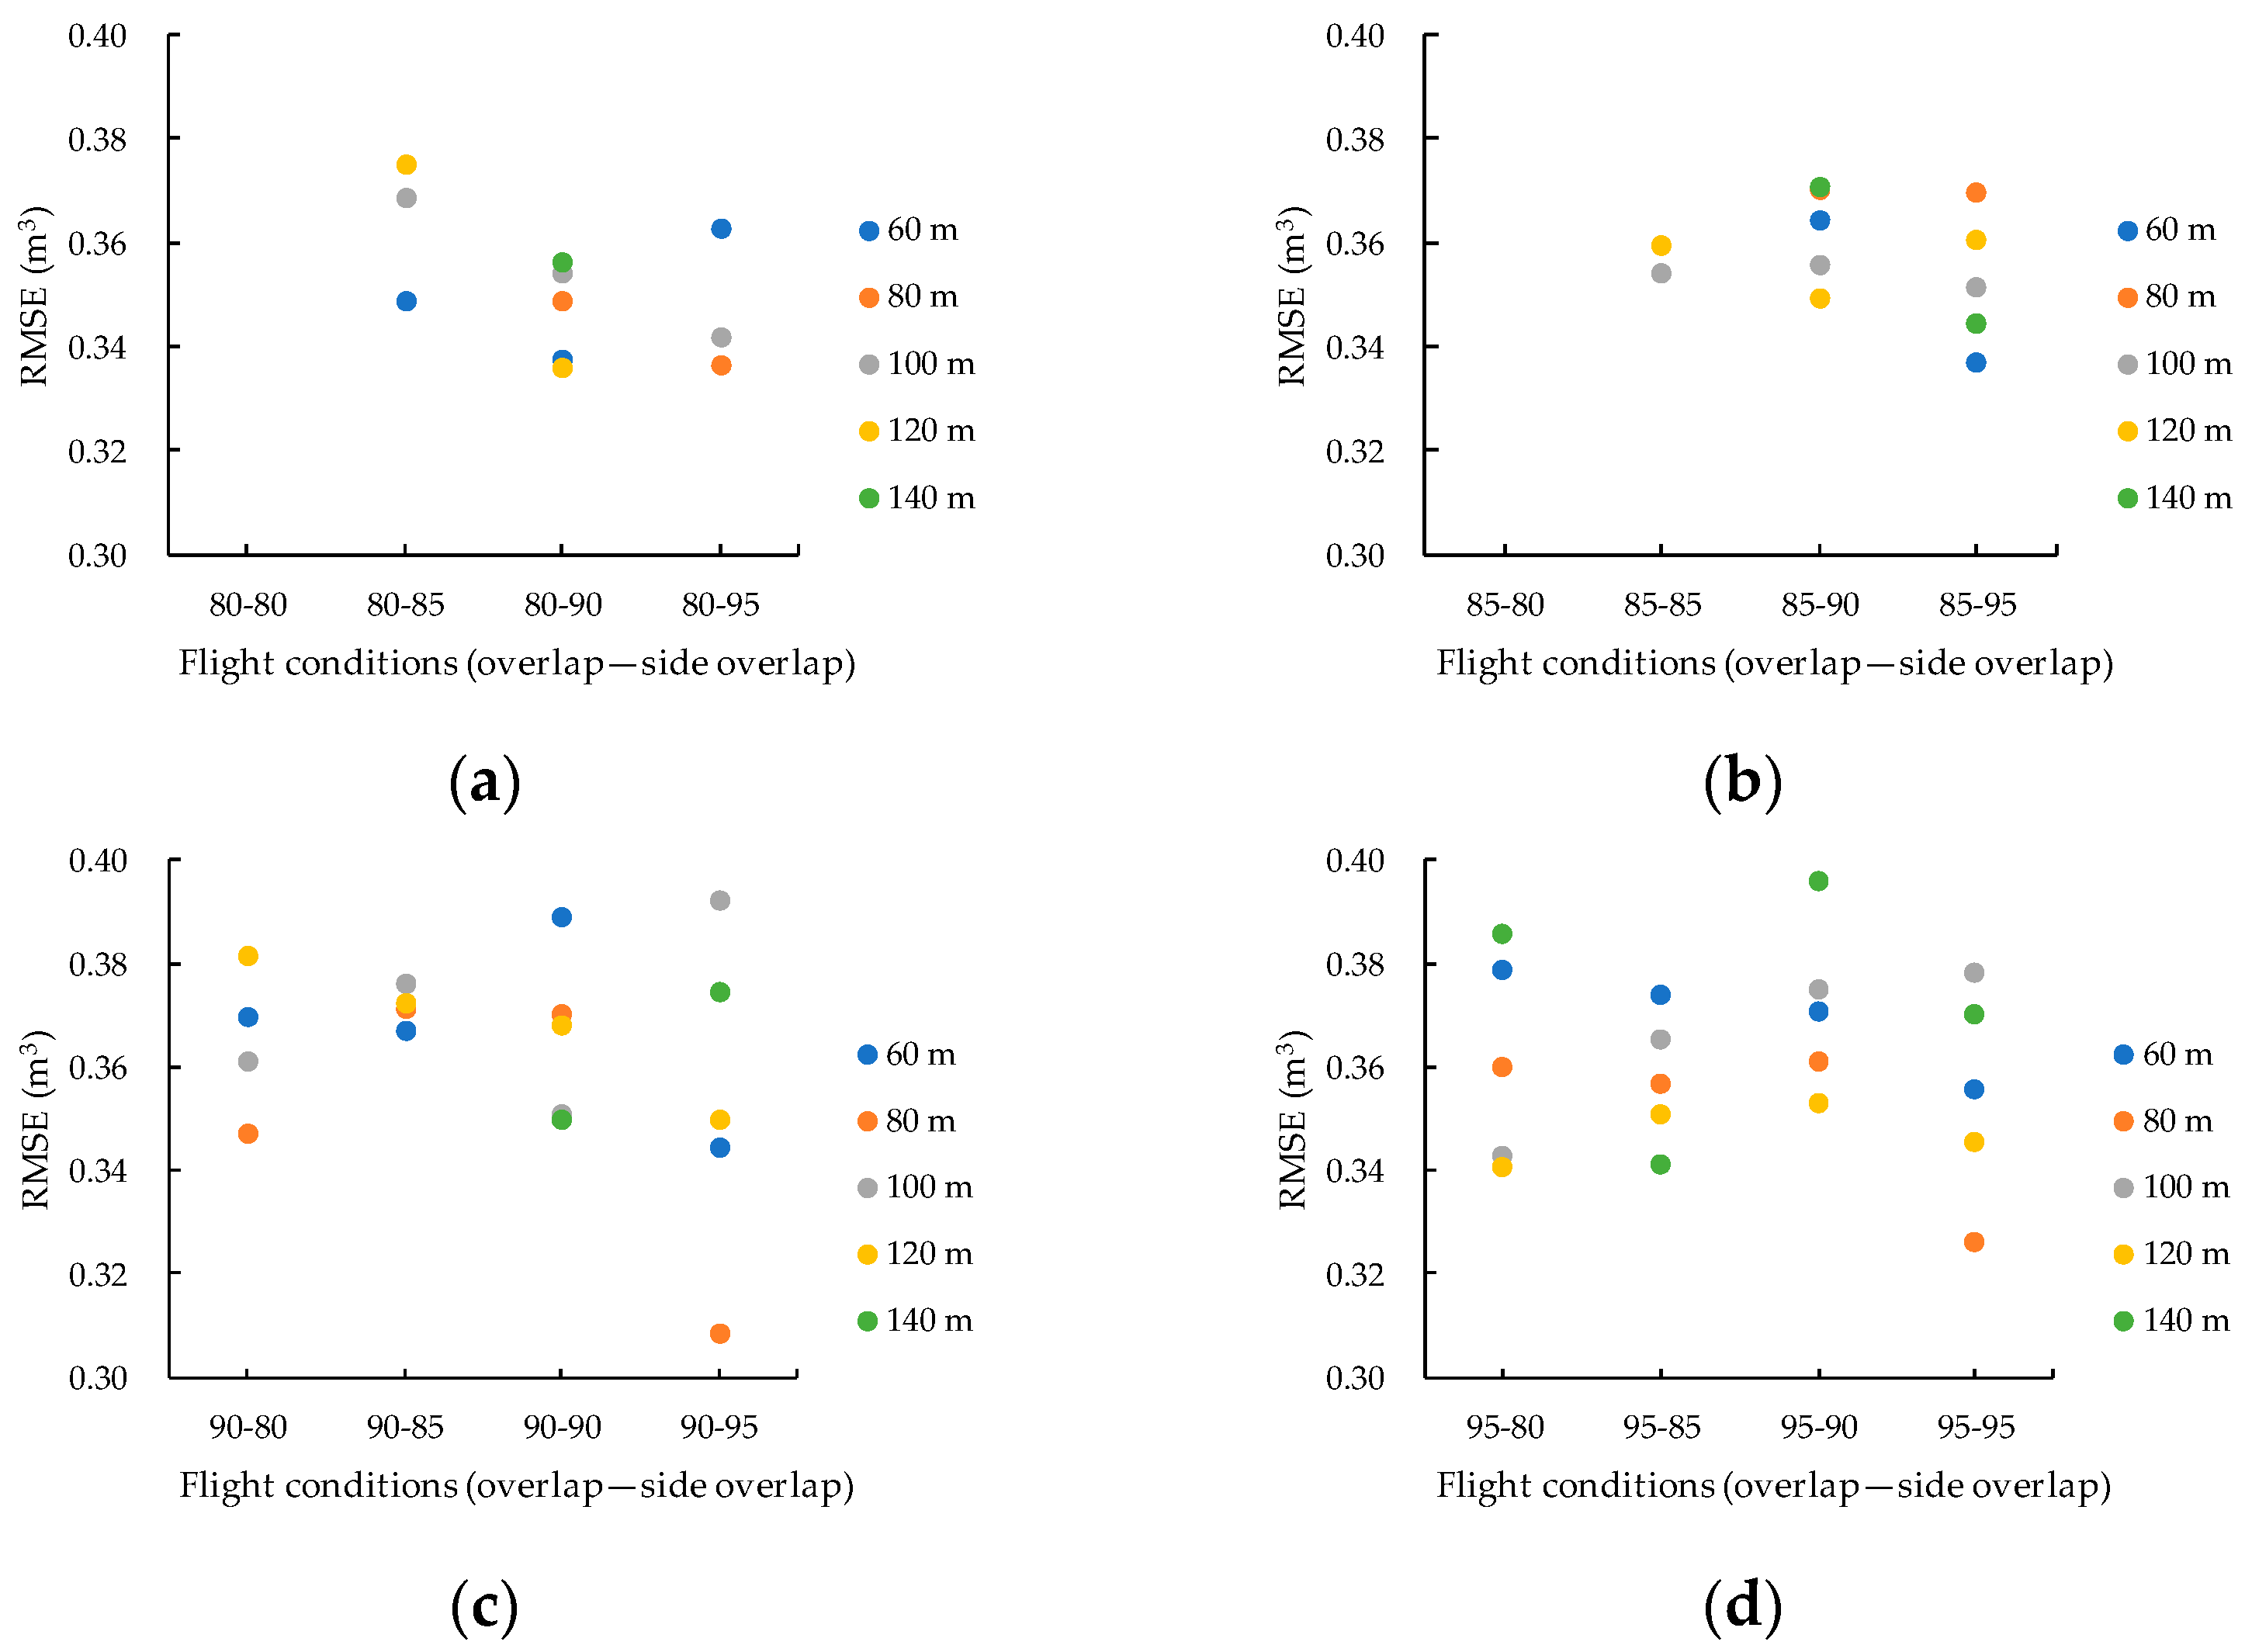
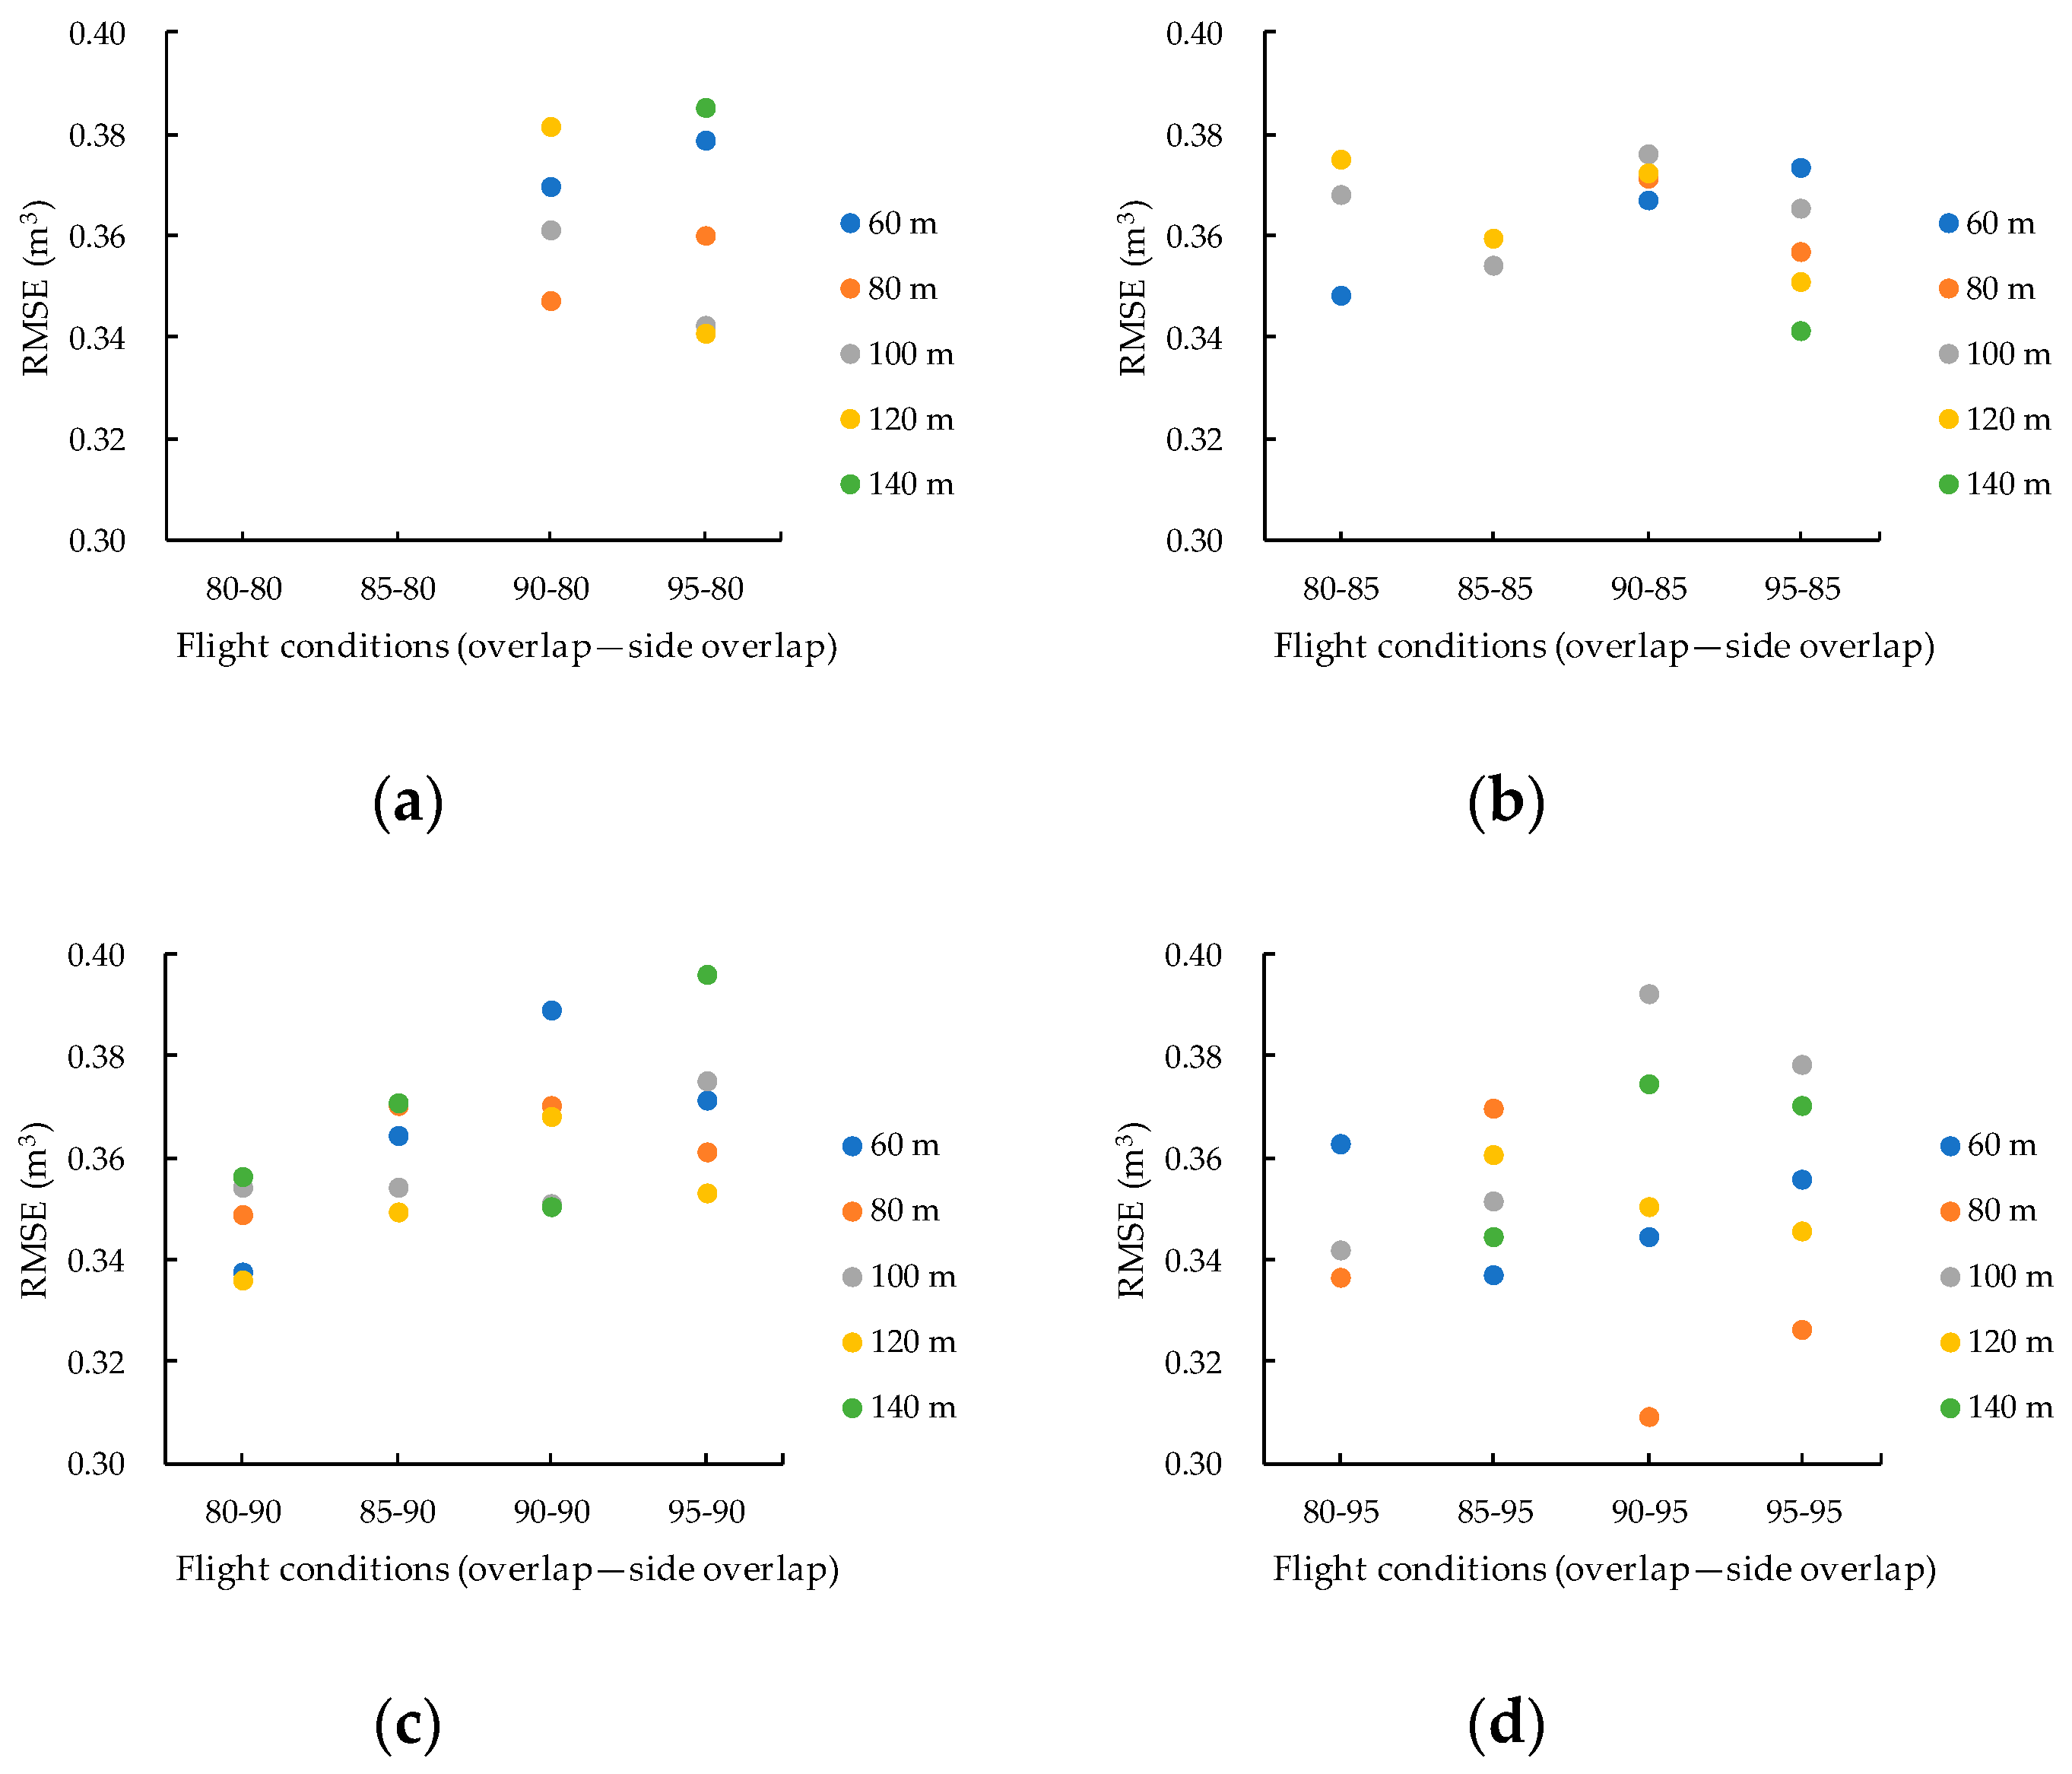
3.4. Tree Volume
3.5. Analyzing Comprehensive Results
3.6. Points to Note Regarding UAV Use
4. Conclusions
Author Contributions
Funding
Conflicts of Interest
References
- Ministry of Agriculture, Forestry and Fisheries. The 2018 “Commissioned Project to Build a System to Improve Efficiency of Methods Such as Harvest Survey in National Forests” UAV Stand Inventory Manual. Available online: http://www.rinya.maff.go.jp/j/gyoumu/gijutu/attach/pdf/syuukaku_kourituka-2.pdf (accessed on 17 September 2019).
- Kobayashi, H. Automated aerial shooting, counting tree numbers and measuring tree heights for Sugi stands with a UAV. Chubu For. Res. 2019, 67, 57–60. [Google Scholar]
- Yada, Y.; Kimura, K.; Atsumi, K.; Aoki, M.; Yamaji, K.; Kawasaki, M.; Shirai, N.; Mitani, N. Estimation of stand volume using UAV in Ishikawa Prefecture’s Sugi plantation forest: Validation of 2017 version volume estimation model. Chubu For. Res. 2018, 66, 81–82. [Google Scholar]
- Arita, T.; Hirose, Y.; Numamoto, S.; Matsumura, N.; Shimada, H.; Nomura, H. Precision inspection of the latest measuring instrument for practical use and acquisition of forest information resources. Chubu For. Res. 2018, 66, 77–80. [Google Scholar]
- Asaka, T.; Aoyama, S.; Iwashita, K.; Kudo, K.; Fujii, H. A height measurement method for coastal forests using aerial photos taken with a small unmanned airborne vehicle. J. Jpn. Soc. Coastal For. 2010, 9, 91–96. [Google Scholar]
- Tamura, T.; Kato, A.; Obanawa, H.; Yoshida, T. Tree height measurement from aerial images taken by a small unmanned aerial vehicle and structure from motion. J. Jpn. Soc. Reveg. Technol. 2015, 41, 163–168. [Google Scholar] [CrossRef][Green Version]
- Krause, S.; Sanders, T.G.M.; Mund, J.; Greve, K. UAV-Based Photogrammetric Tree Height Measurement for Intensive Forest Monitoring. Remote Sens. 2019, 11, 758. [Google Scholar] [CrossRef]
- Swinfield, T.; Lindsell, J.A.; Williams, J.V.; Harrison, R.D.; Agustiono, H.; Gemita, E.; Schönlieb, E.G.; Coomes, D.A. Accurate Measurement of Tropical Forest Canopy Heights and Aboveground Carbon Using Structure From Motion. Remote Sens. 2019, 11, 928. [Google Scholar] [CrossRef]
- Iizuka, K.; Yonehara, T.; Itoh, M.; Kosugi, Y. Estimating Tree Height and Diameter at Breast Height (DBH) from Digital Surface Models and Orthophotos Obtained with an Unmanned Aerial System for a Japanese Cypress (Chamaecyparis obtusa) Forest. Remote Sens. 2018, 10, 13. [Google Scholar] [CrossRef]
- Birdal, A.C.; Avdan, U.; Turk, T. Estimating tree heights with images from an unmanned aerial vehicle. Geomat. Nat. Hazards Risk 2017, 8, 1144–1156. [Google Scholar] [CrossRef]
- Panagiotidis, D.; Abdollahnejad, A.; Surový, P.; Chiteculo, V. Determining tree height and crown diameter from high-resolution UAV imagery. Int. J. Remote Sens. 2017, 38, 8–10. [Google Scholar] [CrossRef]
- Jayathunga, S.; Owari, T.; Tsuyuki, S. Evaluating the Performance of Photogrammetric Products Using Fixed-Wing UAV Imagery over a Mixed Conifer–Broadleaf Forest: Comparison with Airborne Laser Scanning. Remote Sens. 2018, 10, 187. [Google Scholar] [CrossRef]
- Bonnet, S.; Lisein, J.; Lejeune, P. Comparison of UAS photogrammetric products for tree detection and characterization of coniferous stands. Int. J. Remote Sens. 2017, 38, 5310–5337. [Google Scholar] [CrossRef]
- Warfield, A.D.; Leon, J.X. Estimating Mangrove Forest Volume Using Terrestrial Laser Scanning and UAV-Derived Structure-from-Motion. Drones 2019, 3, 32. [Google Scholar] [CrossRef]
- Gülci, S. The determination of some stand parameters using SfM-based spatial 3D point cloud in forestry studies: An analysis of data production in pure coniferous young forest stands. Environ. Monit. Assess. 2019, 191, 495. [Google Scholar] [CrossRef] [PubMed]
- Chen, S.; McDermid, G.J.; Castilla, G.; Linke, J. Measuring Vegetation Height in Linear Disturbances in the Boreal Forest with UAV Photogrammetry. Remote Sens. 2017, 9, 1257. [Google Scholar] [CrossRef]
- Sakai, K.; Yamamoto, R.; Hasegawa, K.; Izumi, T.; Matsuyama, H. Generation of a DSM of the forest crown generated by vertical + oblique stereo pair images taken by a small-sized UAV. J. Remote Sens. Soc. Jpn. 2016, 36, 388–397. [Google Scholar]
- Lin, J.; Wang, M.; Ma, M.; Lin, Y. Aboveground Tree Biomass Estimation of Sparse Subalpine Coniferous Forest with UAV Oblique Photography. Remote Sens. 2018, 10, 1849. [Google Scholar] [CrossRef]
- Huang, H.; He, S.; Chen, C. Leaf Abundance Affects Tree Height Estimation Derived from UAV Images. Forests 2019, 10, 931. [Google Scholar] [CrossRef]
- Teng, P.; Fukumaru, Y.; Zhang, Y.; Aono, M.; Shimizu, Y.; Hosoi, F.; Omasa, K. Accuracy Assessment in 3D Remote Sensing of Japanese Larch Tree using a Small UAV. Eco-Engineering 2018, 30, 1–6. [Google Scholar]
- Torres-Sánchez, J.; López-Granados, F.; Borra-Serrano, I.; Peña, J.M. Assessing UAV-collected image overlap influence on computation time and digital surface model accuracy in olive orchards. Precis. Agric. 2018, 19, 115–133. [Google Scholar] [CrossRef]
- Domingo, D.; Ørka, H.O.; Næsset, E.; Kachamba, D.; Gobakken, T. Effects of UAV Image Resolution, Camera Type, and Image Overlap on Accuracy of Biomass Predictions in a Tropical Woodland. Remote Sens. 2019, 11, 948. [Google Scholar] [CrossRef]
- Dandois, J.; Olano, M.; Ellis, E. Optimal Altitude, Overlap, and Weather Conditions for Computer Vision UAV Estimates of Forest Structure. Remote Sens. 2015, 7, 13895–13920. [Google Scholar] [CrossRef]
- Seifert, E.; Seifert, S.; Vogt, H.; Drew, D.; Aardt, J.V.; Kunneke, A.; Seifert, T. Influence of Drone Altitude, Image Overlap, and Optical Sensor Resolution on Multi-View Reconstruction of Forest Images. Remote Sens. 2019, 11, 1252. [Google Scholar] [CrossRef]
- Ni, W.; Sun, G.; Pang, Y.; Zhang, Z.; Liu, J.; Yang, A.; Wang, Y.; Zhang, D. Mapping Three-Dimensional Structures of Forest Canopy Using UAV Stereo Imagery: Evaluating Impacts of Forward Overlaps and Image Resolutions With LiDAR Data as Reference. IEEE J. Sel. Topics Appl. Earth Observ. Remote Sens. 2018, 11, 3578–3589. [Google Scholar] [CrossRef]
- DJI. Phantom3 Advanced User Manual (Japanese Version) V1.2. Available online: https://dl.djicdn.com/downloads/phantom_3/jp/Phantom_3_Advanced_User_Manual_v1.2_jp_160406.pdf (accessed on 17 November 2018).
- Ministry of Land, Infrastructure, Transport and Tourism. Guidelines for Safe Flight of Unmanned Aerial Vehicles (Drones, Radio-Controlled Vehicles, etc.). Available online: https://www.mlit.go.jp/common/001303818.pdf (accessed on 17 September 2019).
- Terra Mapper User Manual. Available online: https://drive.google.com/drive/folders/1s5oVb7JpCEomynYx6vLoYrI4CC15CLEx (accessed on 2 April 2020).
- Geospatial Information Authority of Japan. The manual for public survey using UAV (Proposed) March 2017 Version. Available online: https://www.gsi.go.jp/common/000186712.pdf (accessed on 7 October 2018).
- DJI GS PRO User Manual (Japanese Version) V2.0. Available online: https://dl.djicdn.com/downloads/groundstation_pro/JP/GS_Pro_User_Manual_v2.0_JP_201811.pdf (accessed on 17 November 2018).
- Ministry of Agriculture, Forestry and Fisheries. The 2014 Survey on Disaster Countermeasures In Watersheds and Mountainous Areas (A Study on Driftwood Countermeasures) Commissioned Project Report 3. Examination of Methods to Assess Landslide Prevention Function of Forests and Risk of Driftwood. Available online: http://www.maff.go.jp/j/budget/yosan_kansi/sikkou/tokutei_keihi/seika_h26/ippan/pdf/ippan263_03.pdf (accessed on 7 October 2018).
- Zhang, Y.; Wu, H.; Yang, W. Forests Growth Monitoring Based on Tree Canopy 3D Reconstruction Using UAV Aerial Photogrammetry. Forests 2019, 10, 1052. [Google Scholar] [CrossRef]
- Sugai, S.; Miyaji, K.; Nakamura, T.; Minami, H.; Tachibana, K. Accuracy verification of photogrammetry using UAV. J. Geospat. Info. Auth. Jpn. 2017, 129, 147–157. [Google Scholar]
- Obanawa, H.; Hayakawa, Y.; Gomez, Y. 3D Modelling of inaccessible areas using UAV-based aerial photography and structure from motion. Transact. Jpn. Geomorphol. Union 2014, 35, 283–294. [Google Scholar]
- Murakami, T. Forest Remote Sensing Using UAVs. J. Remote Sens. Soc. Jpn. 2018, 38, 258–265. [Google Scholar]
- Tang, L.; Shao, G. Drone Remote Sensing for Forestry Research and Practices. J. Forestry Res. 2015, 26, 791–797. [Google Scholar] [CrossRef]
- Paneque-Gálvez, J.; McCall, M.K.; Napoletano, B.M.; Wich, S.A.; Koh, L.P. Small Drones for Community-Based Forest Monitoring: An Assessment of Their Feasibility and Potential in Tropical Areas. Forests 2014, 5, 1481–1507. [Google Scholar] [CrossRef]
- Kameyama, S.; Yoshioka, T. UAV (Drone). J. For. Mech. Soc. 2019, 786, 34–36. [Google Scholar]
- Chikatsu, H.; Odaka, A.; Yanagi, H.; Yokoyama, H. Performance Evaluation of 3D Modeling Software for UAV Photogrammetry. J. Jpn. Soc. Photogram. Remote Sens. 2016, 55, 117–127. [Google Scholar]
- Kitagawa, E.; Muraki, H.; Yoshinaga, K.; Yamagishi, J.; Tsumura, Y. Research on Shape Characteristic of 3D Modeling Software (SfM/MVS) in UAV Aerial Images. J. Jpn. Soc. Civil Eng. 2018, 74, 143–148. [Google Scholar] [CrossRef]


| Model Name | Phantom3 Advanced |
|---|---|
| Weight | 1280 g |
| Dimensions | 350 mm (excluding the propellers) |
| Maximum flight speed | 16 m/s |
| Maximum flight time | Approximately 23 min |
| Sensor | SONY EXMOR 1/23″ |
| Lens | FOV94°20 mm (35 mm conversion) |
| Maximum still image size | 4000 × 3000 |
| Item | Value(s) | Condition |
|---|---|---|
| Flight altitude (m) | 60, 80, 100, 120, 140 | 5 |
| Overlap (%) | 80, 85, 90, 95 | 4 |
| Side overlap (%) | 80, 85, 90, 95 | 4 |
| Flight speed | 15.0 m/s | 1 |
| Photography method | Hovering | 1 |
| Total | 80 |
| Flight Altitude (m) | Overlap 80% | Overlap 85% | Overlap 90% | Overlap 95% |
|---|---|---|---|---|
| 60 | 0.347 | 0.260 | 0.173 | 0.087 |
| 80 | 0.346 | 0.260 | 0.173 | 0.086 |
| 100 | 0.346 | 0.260 | 0.173 | 0.087 |
| 120 | 0.346 | 0.260 | 0.173 | 0.087 |
| 140 | 0.346 | 0.260 | 0.173 | 0.086 |
| 60/80/80 | 60/85/80 | 60/85/85 | 80/80/80 |
| 80/80/85 | 80/85/80 | 80/85/85 | 100/80/80 |
| 100/85/80 | 120/80/80 | 120/85/80 | 140/80/80 |
| 140/80/85 | 140/85/80 | 140/85/85 | 140/90/85 |
| Flight Altitude | Overlap (%)/Side Overlap (%) | |||||||
|---|---|---|---|---|---|---|---|---|
| (m) | 80/80 | 80/85 | 80/90 | 80/95 | 85/80 | 85/85 | 85/90 | 85/95 |
| 60 | ― | 0.48 | 0.56 | 0.50 | ― | ― | 0.66 | 0.45 |
| 80 | ― | ― | 0.27 | 0.45 | ― | ― | 0.44 | 0.43 |
| 100 | ― | 0.24 | 0.49 | 0.34 | ― | 0.41 | 0.26 | 0.87 |
| 120 | ― | 0.34 | 0.31 | 0.21 | ― | 0.30 | 0.76 | 0.27 |
| 140 | ― | ― | 0.23 | 0.60 | ― | ― | 0.83 | 0.50 |
| Flight Altitude | Overlap (%)/Side Overlap (%) | |||||||
| (m) | 90/80 | 90/85 | 90/90 | 90/95 | 95/80 | 95/85 | 95/90 | 95/95 |
| 60 | 0.65 | 0.61 | 0.43 | 0.31 | 0.42 | 0.53 | 0.35 | 0.40 |
| 80 | 0.18 | 0.19 | 0.58 | 0.37 | 0.32 | 0.31 | 0.31 | 0.31 |
| 100 | 0.78 | 0.63 | 0.46 | 0.28 | 0.33 | 0.59 | 0.49 | 0.42 |
| 120 | 0.09 | 0.15 | 0.66 | 0.50 | 0.91 | 0.38 | 0.31 | 0.48 |
| 140 | 0.71 | ― | 0.58 | 0.71 | 0.53 | 0.60 | 0.27 | 0.53 |
| Flight Altitude | Overlap (%)/Side Overlap (%) | |||||||
|---|---|---|---|---|---|---|---|---|
| (m) | 80/80 | 80/85 | 80/90 | 80/95 | 85/80 | 85/85 | 85/90 | 85/95 |
| 60 | ― | <0.001 *** | <0.001 *** | <0.001 *** | ― | ― | <0.001 *** | <0.001 *** |
| 80 | ― | ― | 0.014 * | <0.001 *** | ― | ― | <0.001 *** | <0.001 *** |
| 100 | ― | 0.004 ** | <0.001 *** | <0.001 *** | ― | <0.001 *** | 0.001 ** | <0.001 *** |
| 120 | ― | <0.001 *** | <0.001 *** | <0.001 *** | ― | 0.002 ** | <0.001 *** | <0.001 *** |
| 140 | ― | ― | <0.001 *** | <0.001 *** | ― | ― | <0.001 *** | <0.001 *** |
| Flight Altitude | Overlap (%)/Side Overlap (%) | |||||||
| (m) | 90/80 | 90/85 | 90/90 | 90/95 | 95/80 | 95/85 | 95/90 | 95/95 |
| 60 | 0.012 * | 0.004 ** | <0.001 *** | <0.001 *** | <0.001 *** | <0.001 *** | 0.001 ** | <0.001 *** |
| 80 | 0.005 ** | <0.001 *** | 0.012 * | 0.004 ** | <0.001 *** | <0.001 *** | 0.001 ** | 0.002 ** |
| 100 | <0.001 *** | <0.001 *** | 0.003 ** | <0.001 *** | <0.001 *** | <0.001 *** | <0.001 *** | <0.001 *** |
| 120 | <0.001 *** | <0.001 *** | <0.001 *** | <0.001 *** | <0.001 *** | <0.001 *** | <0.001 *** | <0.001 *** |
| 140 | <0.001 *** | ― | 0.04 * | <0.001 *** | <0.001 *** | <0.001 *** | <0.001 *** | <0.001 *** |
| Flight Altitude | Overlap (%)/Side Overlap (%) | |||||||
|---|---|---|---|---|---|---|---|---|
| (m) | 80/80 | 80/85 | 80/90 | 80/95 | 85/80 | 85/85 | 85/90 | 85/95 |
| 60 | ― | 0.52 | 0.69 | 0.56 | ― | ― | 0.45 | 0.89 |
| 80 | ― | ― | 0.73 | 0.29 | ― | ― | 0.74 | 0.75 |
| 100 | ― | 0.34 | 0.73 | 0.68 | ― | 0.32 | 0.43 | 0.49 |
| 120 | ― | 0.20 | 0.62 | 0.31 | ― | 0.69 | 0.44 | 0.37 |
| 140 | ― | ― | 0.46 | 0.19 | ― | ― | 0.32 | 0.35 |
| Flight Altitude | Overlap (%)/Side Overlap (%) | |||||||
| (m) | 90/80 | 90/85 | 90/90 | 90/95 | 95/80 | 95/85 | 95/90 | 95/95 |
| 60 | 0.63 | 0.73 | 0.65 | 0.31 | 0.56 | 0.51 | 0.37 | 0.72 |
| 80 | 0.63 | 0.63 | 0.74 | 0.66 | 0.34 | 0.76 | 0.93 | 0.73 |
| 100 | 0.41 | 0.74 | 0.56 | 0.53 | 0.87 | 0.26 | 0.12 | 0.85 |
| 120 | 0.44 | 0.40 | 0.37 | 0.85 | 0.73 | 0.73 | 0.58 | 0.87 |
| 140 | 0.86 | ― | 0.20 | 0.21 | 0.50 | 0.73 | 0.37 | 0.22 |
| Flight Altitude | Overlap (%)/Side Overlap (%) | |||||||
|---|---|---|---|---|---|---|---|---|
| (m) | 80/80 | 80/85 | 80/90 | 80/95 | 85/80 | 85/85 | 85/90 | 85/95 |
| 60 | ― | 0.02 * | 0.012 * | 0.04 * | ― | ― | 0.012 * | 0.012 * |
| 80 | ― | ― | 0.13 | 0.019 * | ― | ― | 0.008 ** | 0.02 * |
| 100 | ― | 0.10 | 0.005 ** | 0.007 ** | ― | 0.026 * | 0.04 * | 0.001 ** |
| 120 | ― | 0.004 ** | <0.001 *** | <0.001 *** | ― | 0.04 * | 0.003 ** | 0.002 ** |
| 140 | ― | ― | 0.025 * | <0.001 *** | ― | ― | <0.001 *** | 0.002 ** |
| Flight altitude | Overlap (%)/Side overlap (%) | |||||||
| (m) | 90/80 | 90/85 | 90/90 | 90/95 | 95/80 | 95/85 | 95/90 | 95/95 |
| 60 | 0.14 | 0.08 | 0.03 * | 0.04 * | 0.004 ** | 0.007 ** | 0.04 * | 0.014 * |
| 80 | 0.08 | 0.007 ** | 0.13 | 0.07 | 0.004 ** | 0.008 ** | 0.04 * | 0.04 * |
| 100 | 0.005 ** | 0.004 ** | 0.05 | 0.007 ** | 0.015 * | 0.001 ** | 0.003 ** | 0.006 ** |
| 120 | 0.006 ** | <0.001 *** | 0.02 * | 0.0014 ** | 0.007 ** | <0.001*** | 0.002 ** | 0.003 ** |
| 140 | <0.001 *** | ― | 0.2 | 0.019 * | <0.001 *** | <0.001 *** | <0.001 *** | 0.006 ** |
© 2020 by the authors. Licensee MDPI, Basel, Switzerland. This article is an open access article distributed under the terms and conditions of the Creative Commons Attribution (CC BY) license (http://creativecommons.org/licenses/by/4.0/).
Share and Cite
Kameyama, S.; Sugiura, K. Estimating Tree Height and Volume Using Unmanned Aerial Vehicle Photography and SfM Technology, with Verification of Result Accuracy. Drones 2020, 4, 19. https://doi.org/10.3390/drones4020019
Kameyama S, Sugiura K. Estimating Tree Height and Volume Using Unmanned Aerial Vehicle Photography and SfM Technology, with Verification of Result Accuracy. Drones. 2020; 4(2):19. https://doi.org/10.3390/drones4020019
Chicago/Turabian StyleKameyama, Shohei, and Katsuaki Sugiura. 2020. "Estimating Tree Height and Volume Using Unmanned Aerial Vehicle Photography and SfM Technology, with Verification of Result Accuracy" Drones 4, no. 2: 19. https://doi.org/10.3390/drones4020019
APA StyleKameyama, S., & Sugiura, K. (2020). Estimating Tree Height and Volume Using Unmanned Aerial Vehicle Photography and SfM Technology, with Verification of Result Accuracy. Drones, 4(2), 19. https://doi.org/10.3390/drones4020019