Article

Morpho–Sedimentary Monitoring in a Coastal Area, from 1D to 2.5D, Using Airborne Drone Imagery

EPHE, PSL Université Paris, CNRS LETG, 35800 Dinard, France
*
Author to whom correspondence should be addressed.
Drones 2019, 3(3), 62; https://doi.org/10.3390/drones3030062
Submission received: 29 June 2019 / Revised: 9 August 2019 / Accepted: 12 August 2019 / Published: 14 August 2019

Abstract

:
Coastal areas are among the most endangered places in the world, due to their exposure to both marine and terrestrial hazards. Coastal areas host more than two-thirds of the world’s population, and will become increasingly affected by global changes, in particular, rising sea levels. Monitoring and protecting the coastlines have impelled scientists to develop adequate tools and methods to spatially monitor morpho-sedimentary coastal areas. This paper presents the capabilities of the aerial drone, as an “all-in-one” technology, to drive accurate morpho-sedimentary investigations in 1D, 2D and 2.5D at very high resolution. Our results show that drone-related fine-resolution, high accuracies and point density outperform the state-of-the-science manned airborne passive and active methods for shoreline position tracking, digital elevation model as well as point cloud creation. We further discuss the reduced costs per acquisition campaign, the increased spatial and temporal resolution, and demonstrate the potentialities to carry out diachronic and volumetric analyses, bringing new perspectives for coastal scientists and managers.

1. Introduction

1.1. Interest of Morpho-Sedimentary Monitoring in the Global Change Context

Due to their location at the land-sea interface and the increase of the human activity they have undergone for decades, coastal areas are among the most exposed areas worldwide to the effects of global change, especially to the ongoing and predicted sea level rise [1] as well as to the potential increase of storm intensity [2]. In this context, coastal sediment deposits, like beaches, sand dunes, gravel barriers or tidal ridges, have an important role to play to protect human stakes, by acting as a natural buffer zone, thanks to their wave attenuation ability [3,4,5]. The morpho-sedimentary monitoring of these sediment structures across time series is crucial to understand their dynamics in order to account for them into an integrated coastal management.

1.2. Common Data Acquisition and Monitoring Methods

To date, several monitoring methods, in situ (handborne) and ex situ (airborne and spaceborne), exist to examine the geomorphology of coastal sediments.

1.2.1. Handborne Monitoring Methods

The most widely used (and oldest) method for morpho-sedimentary monitoring in coastal areas is the manned acquisition of data on the field. This method can be divided into two categories: position tracking of the sediment deposit, and topographic monitoring.
The position tracking of the sediment deposit consists of the recording of the position of a previously determined indicator (shoreline, slope failure, vegetation line, etc.), across several measurement campaigns, using a global navigation satellite system (GNSS) or a more accurate differential GNSS (DGNSS). The accuracy of this monitoring method depends on the precision induced by the material used. This method cannot get information about the topography, the subsequent deposit’s volume and its evolution.
The handborne topographic monitoring can be carried out through several methods and the use of different tools. Firstly, some topographic profiles can be surveyed with a tachometer or a DGNSS (Table 1). These topographic profiles allow observation of the surface elevation evolution of the entities along some punctual cross- or long-shore transects [6]. Handborne topographic monitoring can also be done in 2D through a digital elevation model (DEM) using a DGNSS figure field, which enables the volume evolution of the sediment deposit to be estimated, in addition to the topographic profiles [6].

1.2.2. Airborne (Manned Aerial Vehicle, MAV) Monitoring Method

Airborne data source can be used to monitor the coastal areas and its sediment deposit. These data can be used for 1D, 2D and 2.5D coastal monitoring depending on the passive or active nature of the sourced data.
In the case of airborne imagery data, the monitoring methodology consists in a 1D position tracking using a photointerpretation method. This kind of data can be used in the same way as handborne data to study the spatiotemporal evolution of sediment deposit and their shape evolution [7]. Passive imagery presents the advantage to cover a large scale study site, in contrast to handborne methods, and is relatively cost-effective in terms of time and effort. However, the airborne imagery resolution does not allow neither a very high spatial resolution monitoring due to the pixel resolution (Table 1), nor a very high temporal resolution due to the weather constraints.
In the case of airborne light detection and ranging (LiDAR) data, 2D and 2.5D morpho-sedimentary monitoring can be achieved using the DEM [8] product or the raw data in the form of the point cloud. LiDAR data leverage a very high spatial accuracy (Table 1) and a large area covered during the acquisition, but this acquisition method is also very expensive, resulting in a low temporal resolution.

1.2.3. Spaceborne Monitoring Method

The monitoring methods using spaceborne data (satellite imagery and IceSat-2 LiDAR), echoing the airborne data, consist of 1D, 2D and 2.5D monitoring of the sediment deposit through imagery data using a photointerpretation method for 1D position tracking [7,9] and LiDAR data to generate a DEM (2D) or a point cloud (2.5D). The spatial accuracy and resolution of the spaceborne method is negatively correlated with the acquisition altitude of the imagery data (Table 1). The latter one is significantly higher for satellite imagery than for airborne imagery. The digitalization precision used for the monitoring is of a lower quality, but the area covered by a single satellite image remains larger. Disadvantages of the spaceborne method are the same as for airborne imagery data acquired using a MAV (Table 1).

1.3. Interest of the Use of Drone (or Unmanned Aerial Vehicle) Imagery for Coastal Monitoring

The drone development for civilian use [10,11] opens new perspectives for coastal expertise by overcoming the limits observed with the previous monitoring methods. This technology offers the possibility of a very high spatial (VHR, <0.05 m) and temporal resolution (<1 month) monitoring of sedimentary structures [12,13,14].
The purposes of this study are to evaluate the airborne drone technology to achieve morpho-sedimentary products in coastal areas, by resolution and accuracy comparisons with those of other state-of-the-science airborne monitoring methods. This work will investigate the drone capabilities for (1) the 1D morpho-sedimentary monitoring (shoreline position tracking) in comparison with VHR airborne passive imagery, (2) the 2D DEM creation (DEM) and (3) the 2.5D point cloud analysis, both latter in comparison with VHR airborne LiDAR data. Furthermore, the potential of drone technology to perform diachronic analyses of the shoreline evolution, topographic profiles and sediment volume change induced by winter storms, will be discussed.

2. Materials and Methods

2.1. Study Site Presentation

In order to illustrate the use of drone imagery for morpho-sedimentary monitoring, the study will focus on some sedimentary deposits mainly composed of siliceous sand and calcareous shells that play an active role into the coastal protection in the bay of Mont-Saint-Michel, France (BMSM).

General Context of the Bay of Mont-Saint-Michel

The BMSM is located deep in the Normandy–Brittany Gulf between the Cotentin peninsula and the northern coast of Brittany called “Emerald Coast” (Figure 1). This bay, subjected to a strong tidal regime, belongs to the top six areas hosting the world’s highest tide [15]. Provided with a tidal range of approximately 14 m, the intertidal zone extends over an important area of 250 km2. The bay is bounded in the South from the lowlands of the Dol Marsh polder by the Duchess Anne’s dyke, in front of which numerous sediment deposits can be observed, contributing to the coastal protection as natural barriers against waves [3,4]. Due to its lowland feature, the Dol Marsh area is particularly exposed to marine flood risk. The monitoring of this protective geomorphic feature is thereby a key element for the local coastal risk management [3].

2.2. Data Acquisition

2.2.1. Ground Control Points’ Positioning

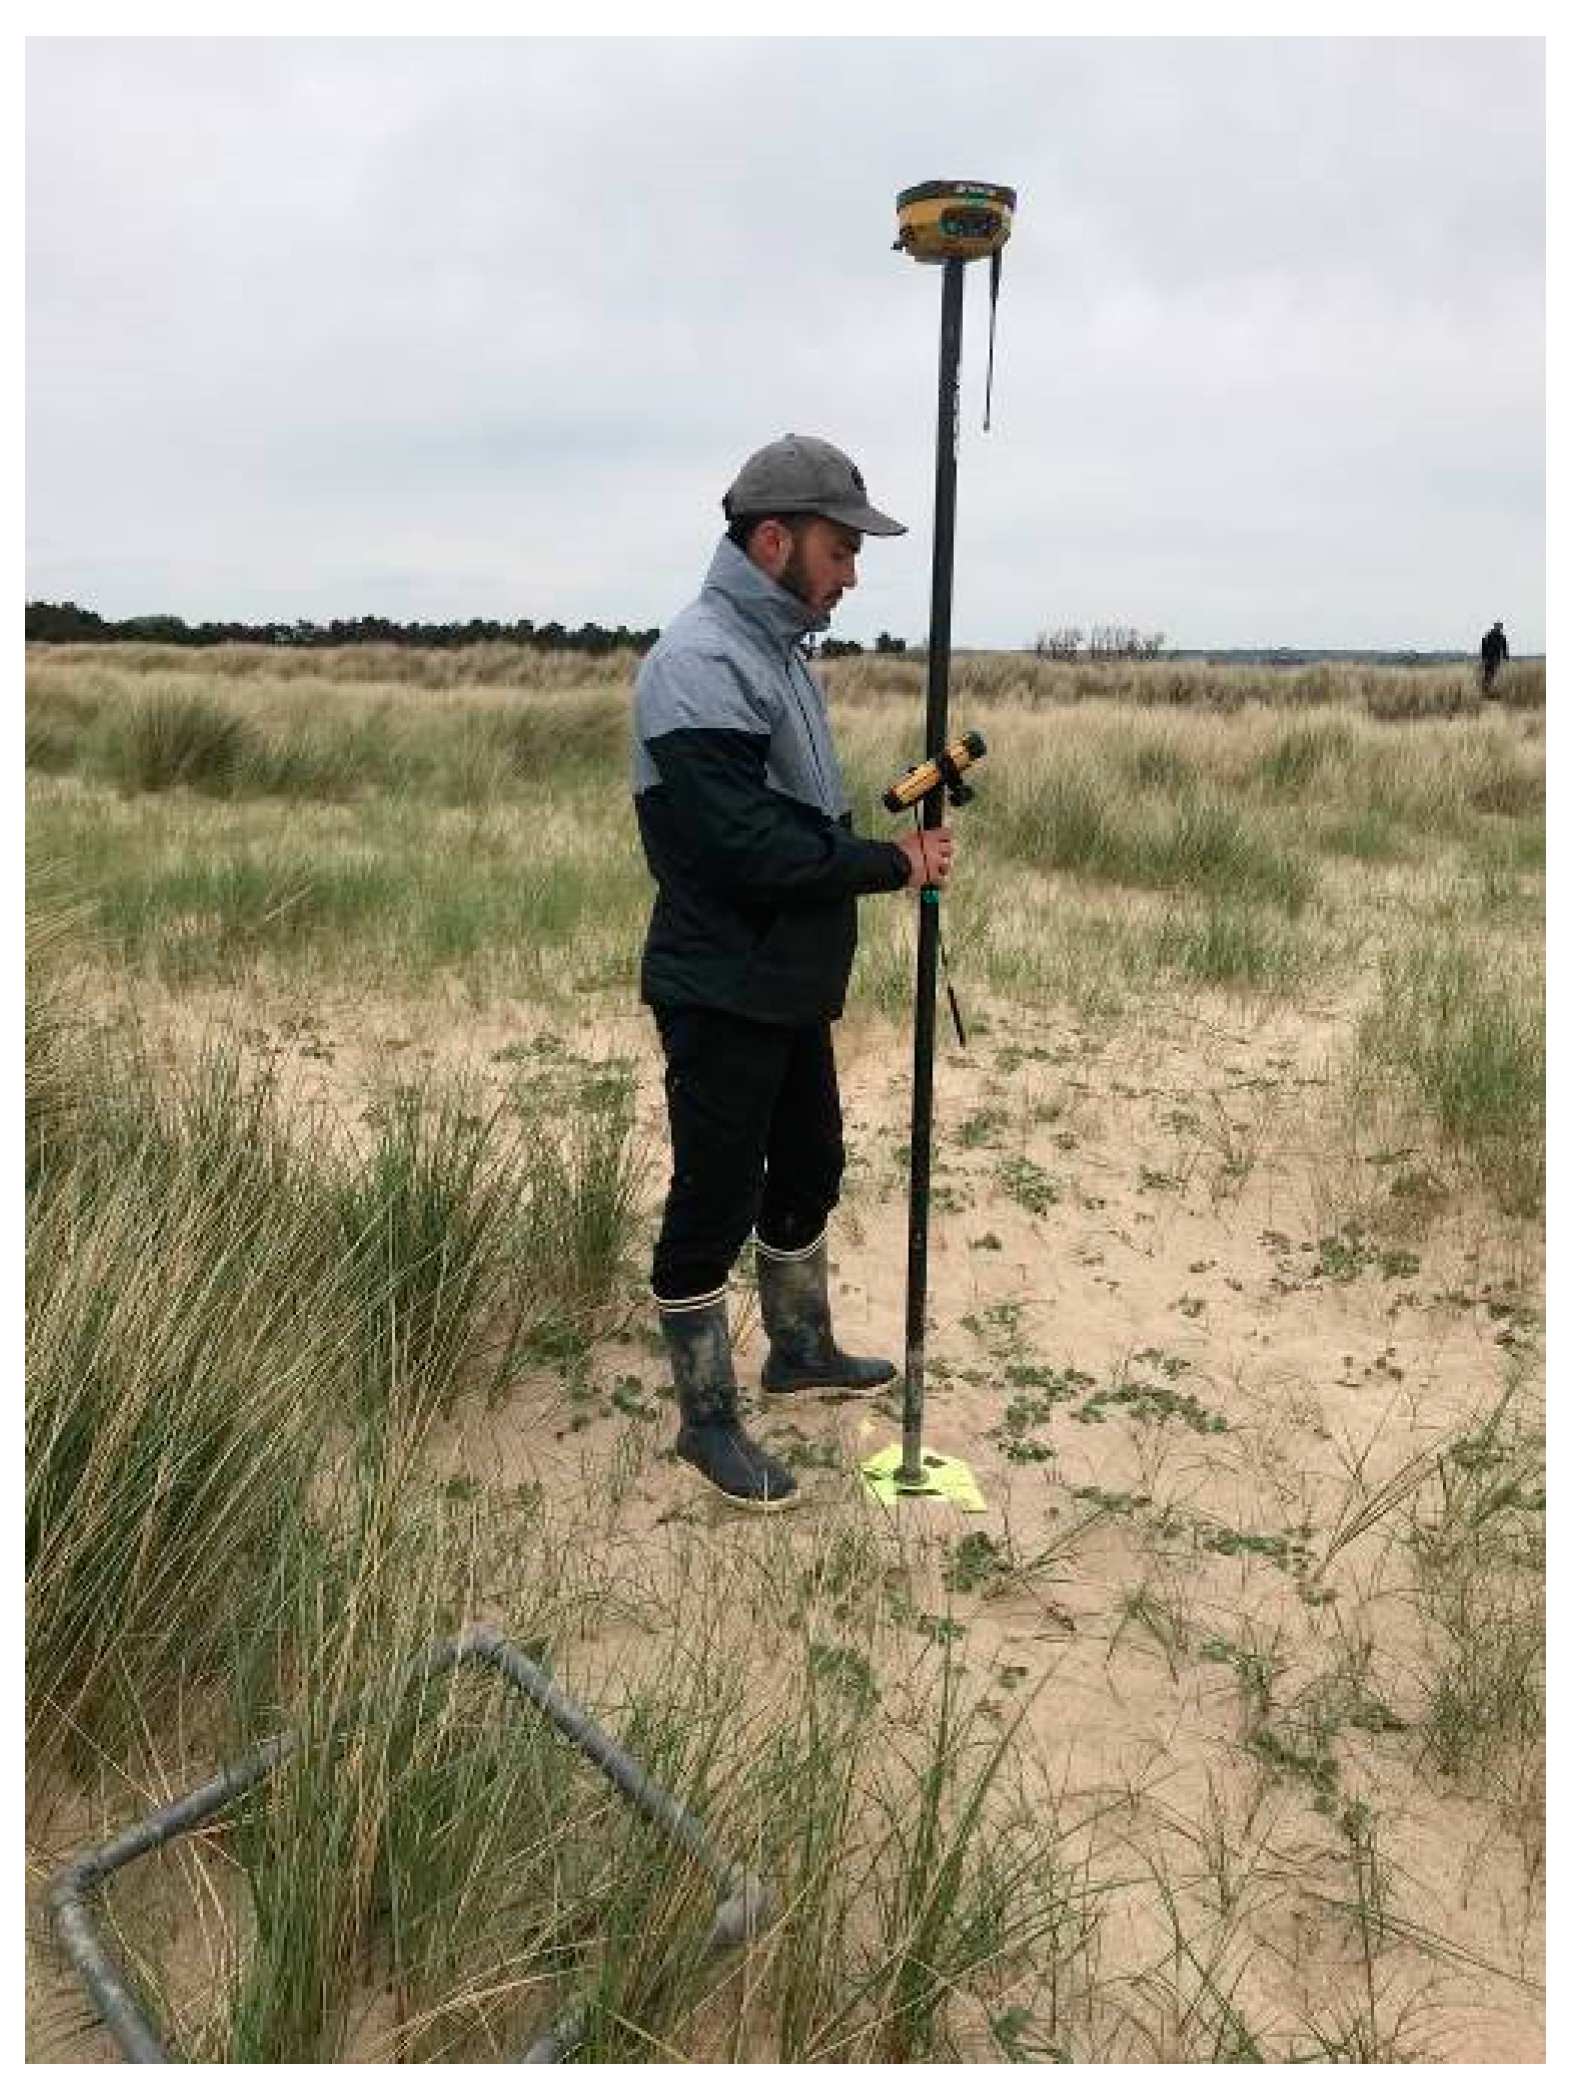
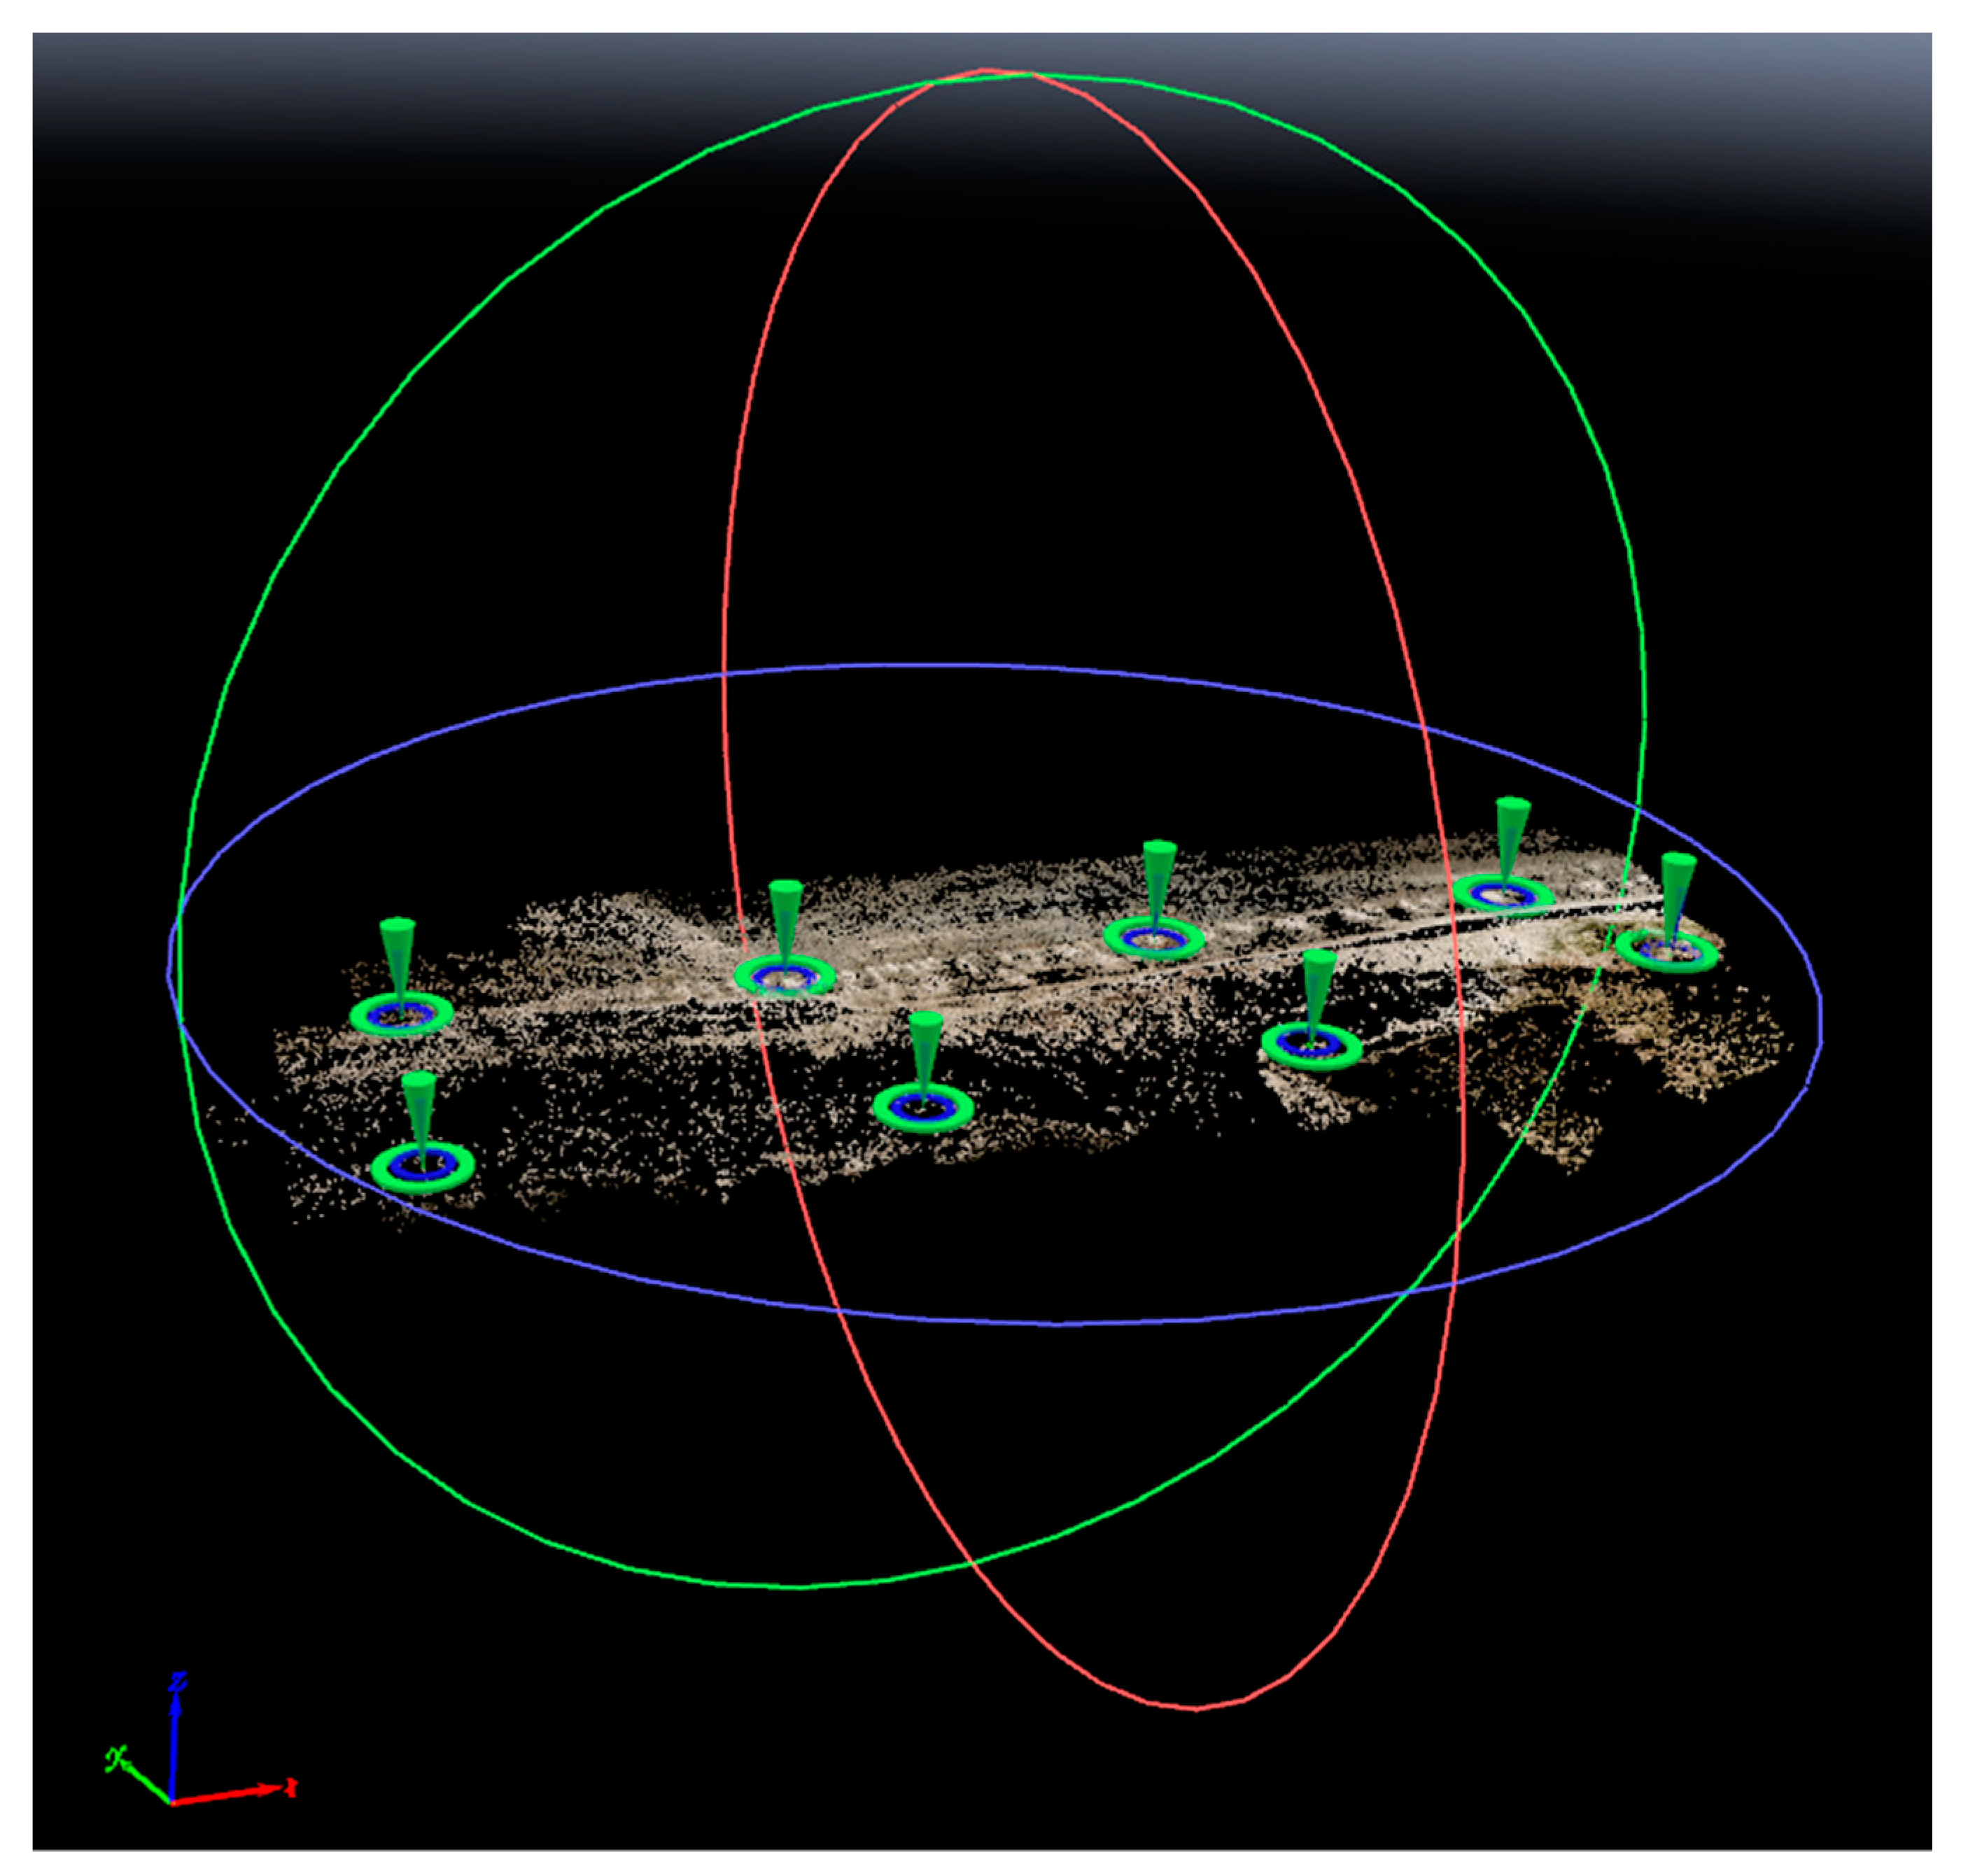
Prior to the imagery data acquisition using a drone, it is necessary to take some ground control points (GCPs), needed for the georeferencing (in x, y, z) of the raw data and by-products. GCPs were distributed in different locations across the study field (Figure 2 and Figure 3). Their spatial reference was recorded using a DGNSS (Topcon hiper V) and then postprocessed using the RTK Lib software, to obtain data with a horizontal accuracy (xy) of 0.05 m and a vertical accuracy around 0.1 m. For this study, 8 GCPs were taken into account on the field (GCPs’ root mean square error (RMSE) for this study case: x = 0.03 m, y = 0.05 m, z = 0.08 m).

2.2.2. Imagery Acquisition Material

The drone platform was a quadcopter DJI Mavic Pro Platinum with a 3-axis stabilized gimbal system and a 3-channel Red Green Blue (RGB) camera (Table 2).
In order to compare the monitoring methods achieved using the drone to the common methods, this paper will refer to two other state-of-the-science data sources (Table 3).

2.2.3. Data Acquisition Method

Drone data were collected using a flight plan following previously determined parameters (Table 4).

2.3. Data Processing

All drone data processing steps presented here were carried out using the photogrammetry software Pix4D, the total duration of data processing is approximately one hour.
  • The first step of the raw data processing consists into image calibration and image pair matching. A data set of 63 images calibrated with a median of 21,483 key points per images. Pair matching is calibrated using an exact geolocation and orientation method. It was achieved using the original image scale, and correspondence between images was conducted using the acquisition time and triangulation of the image’s geolocation.
  • Previously recorded GCPs (see Section 2.2.1) are added to the result of image pair matching to correctly georeference the data set.
  • Dense point cloud is generated with a high point density (number of densified points on the study area: 72 578 307).
  • 2.5D textured mesh is produced at VHR from the dense point cloud. This mesh is made using a triangulated irregular network.
LiDAR data processing steps were done using the software ENVI LiDAR. The 2.5D mesh is created using a triangulated irregular network (TIN) from the raw point cloud and then DEM is performed by converting this TIN into a raster.

3. Results

3.1. 1D Monitoring

The shoreline delineation was based on visual inspection of the seaward foot of vegetation at the same site for both UAV and MAV datasets.
Overlapped drone imageries allow the creation of an orthomosaic, geometrically corrected representation of the Earth’s surface adjusted for topographic relief, lens distortion and camera tilt.
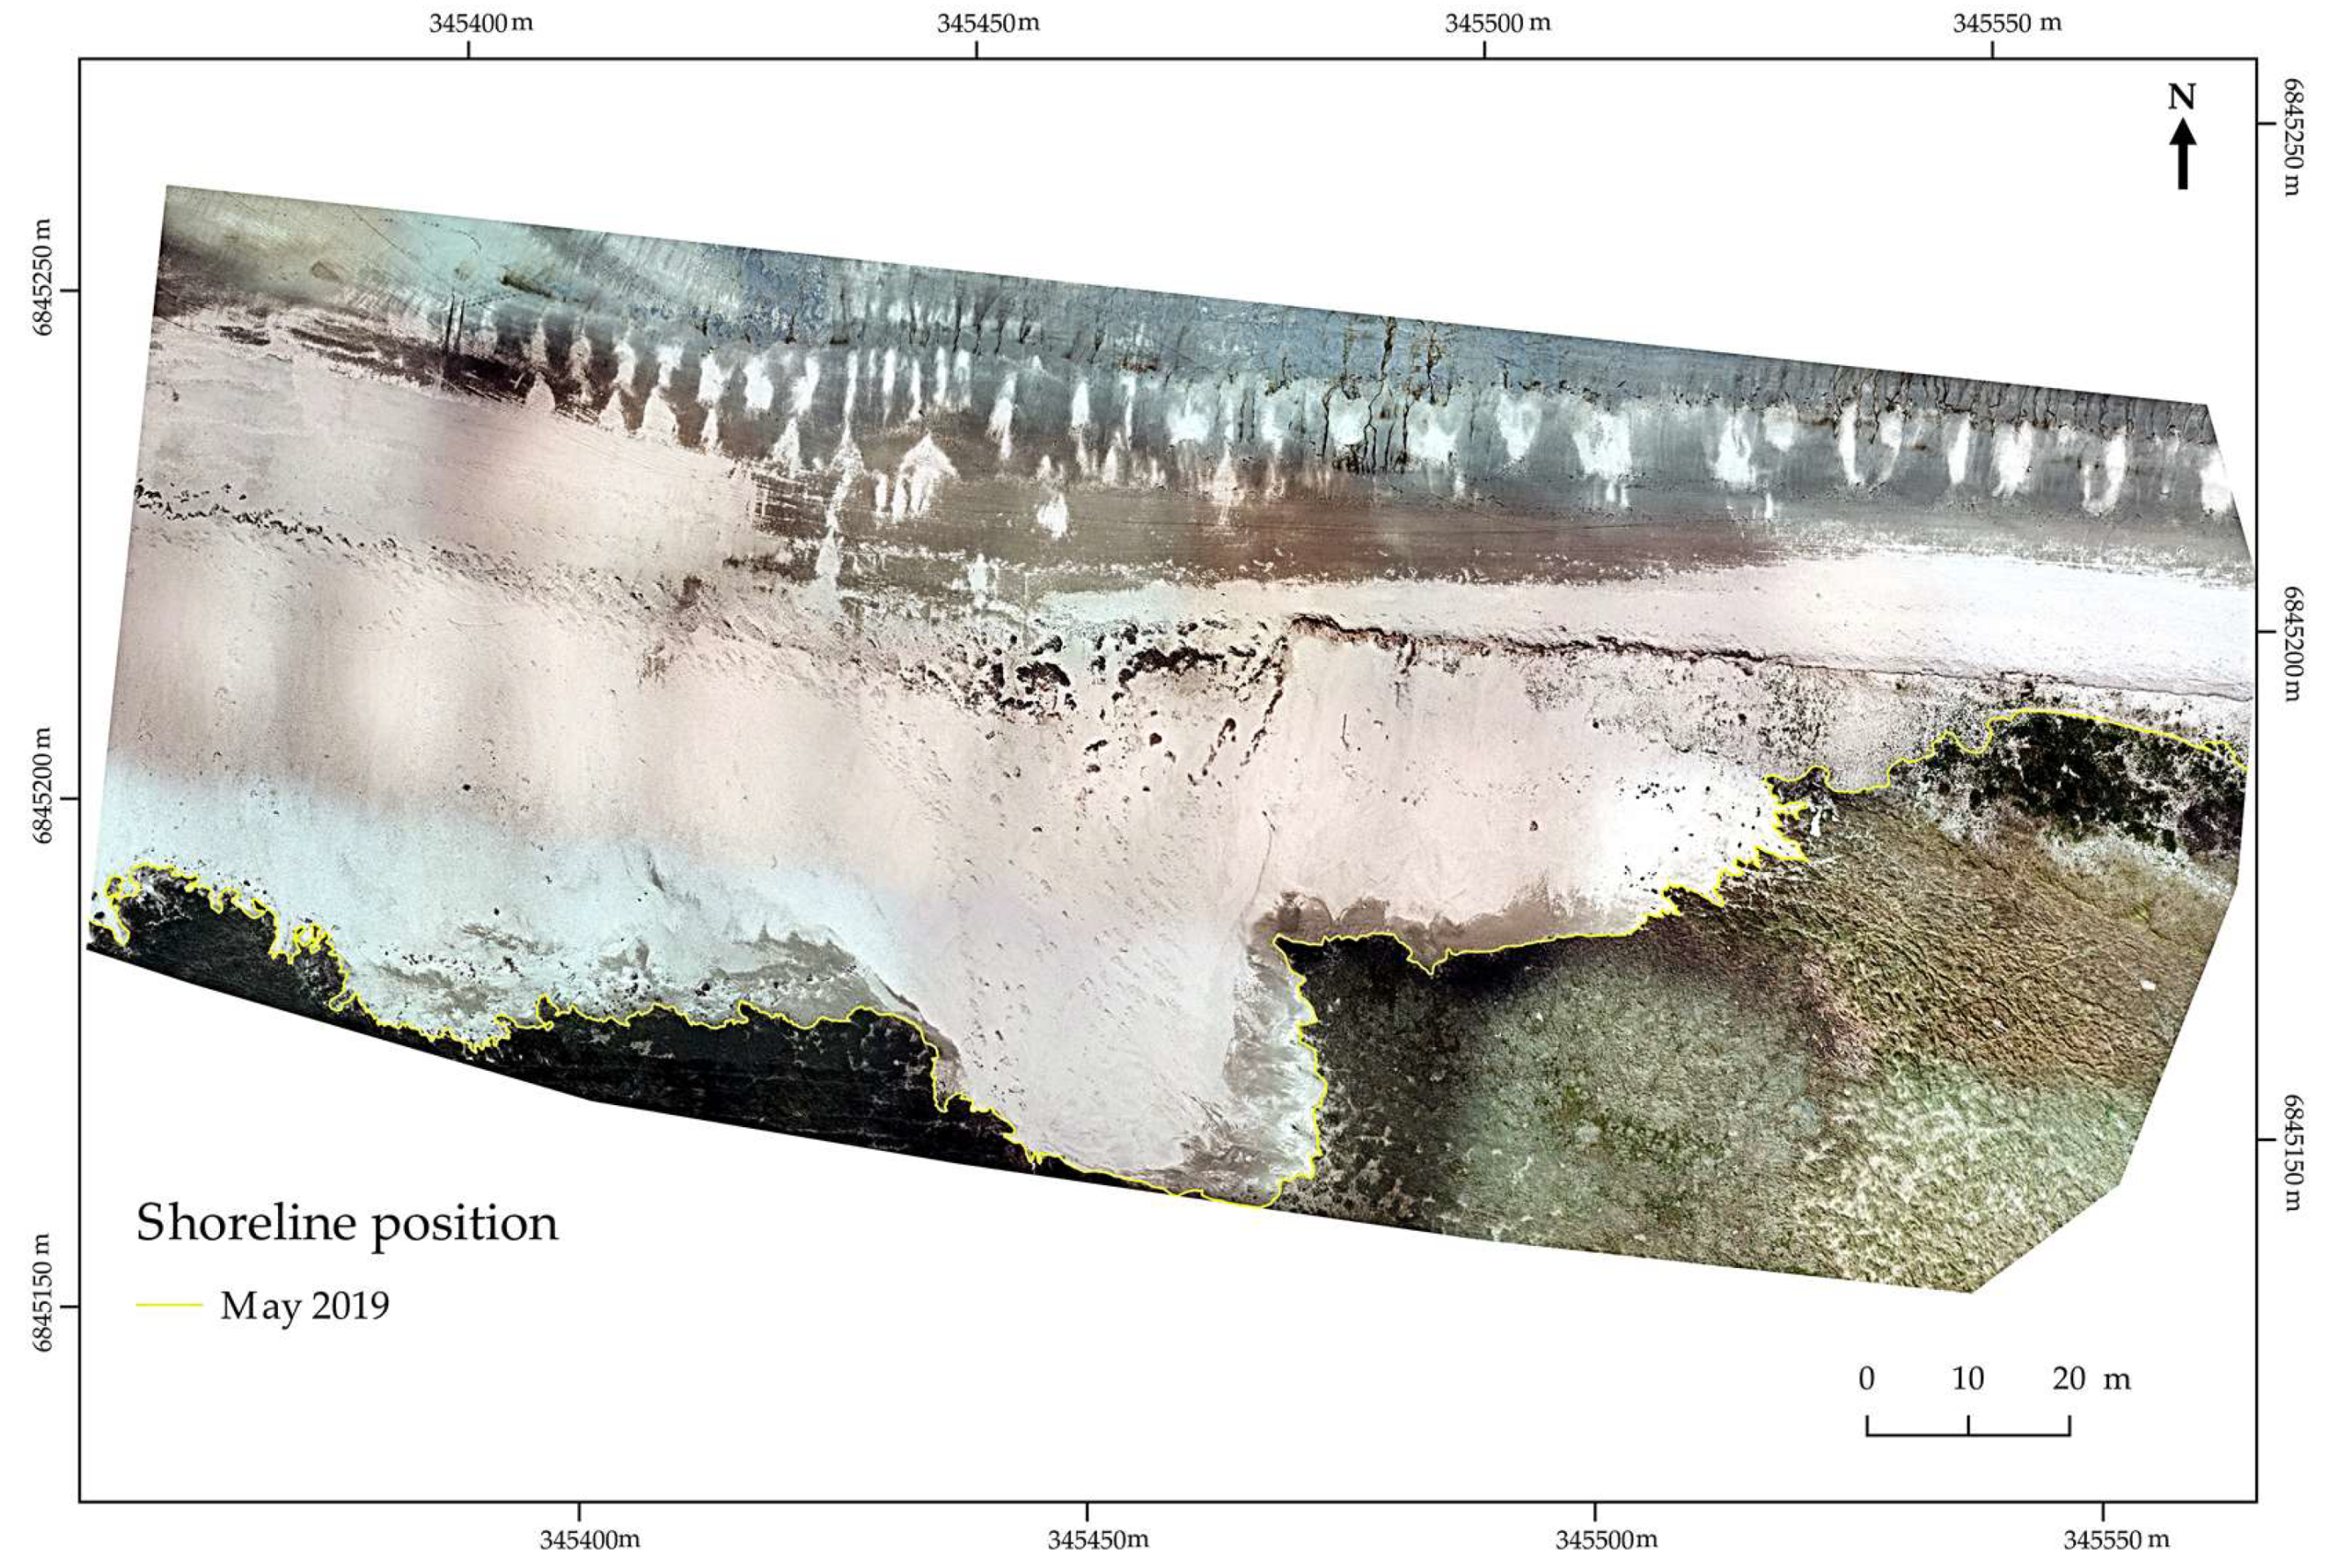
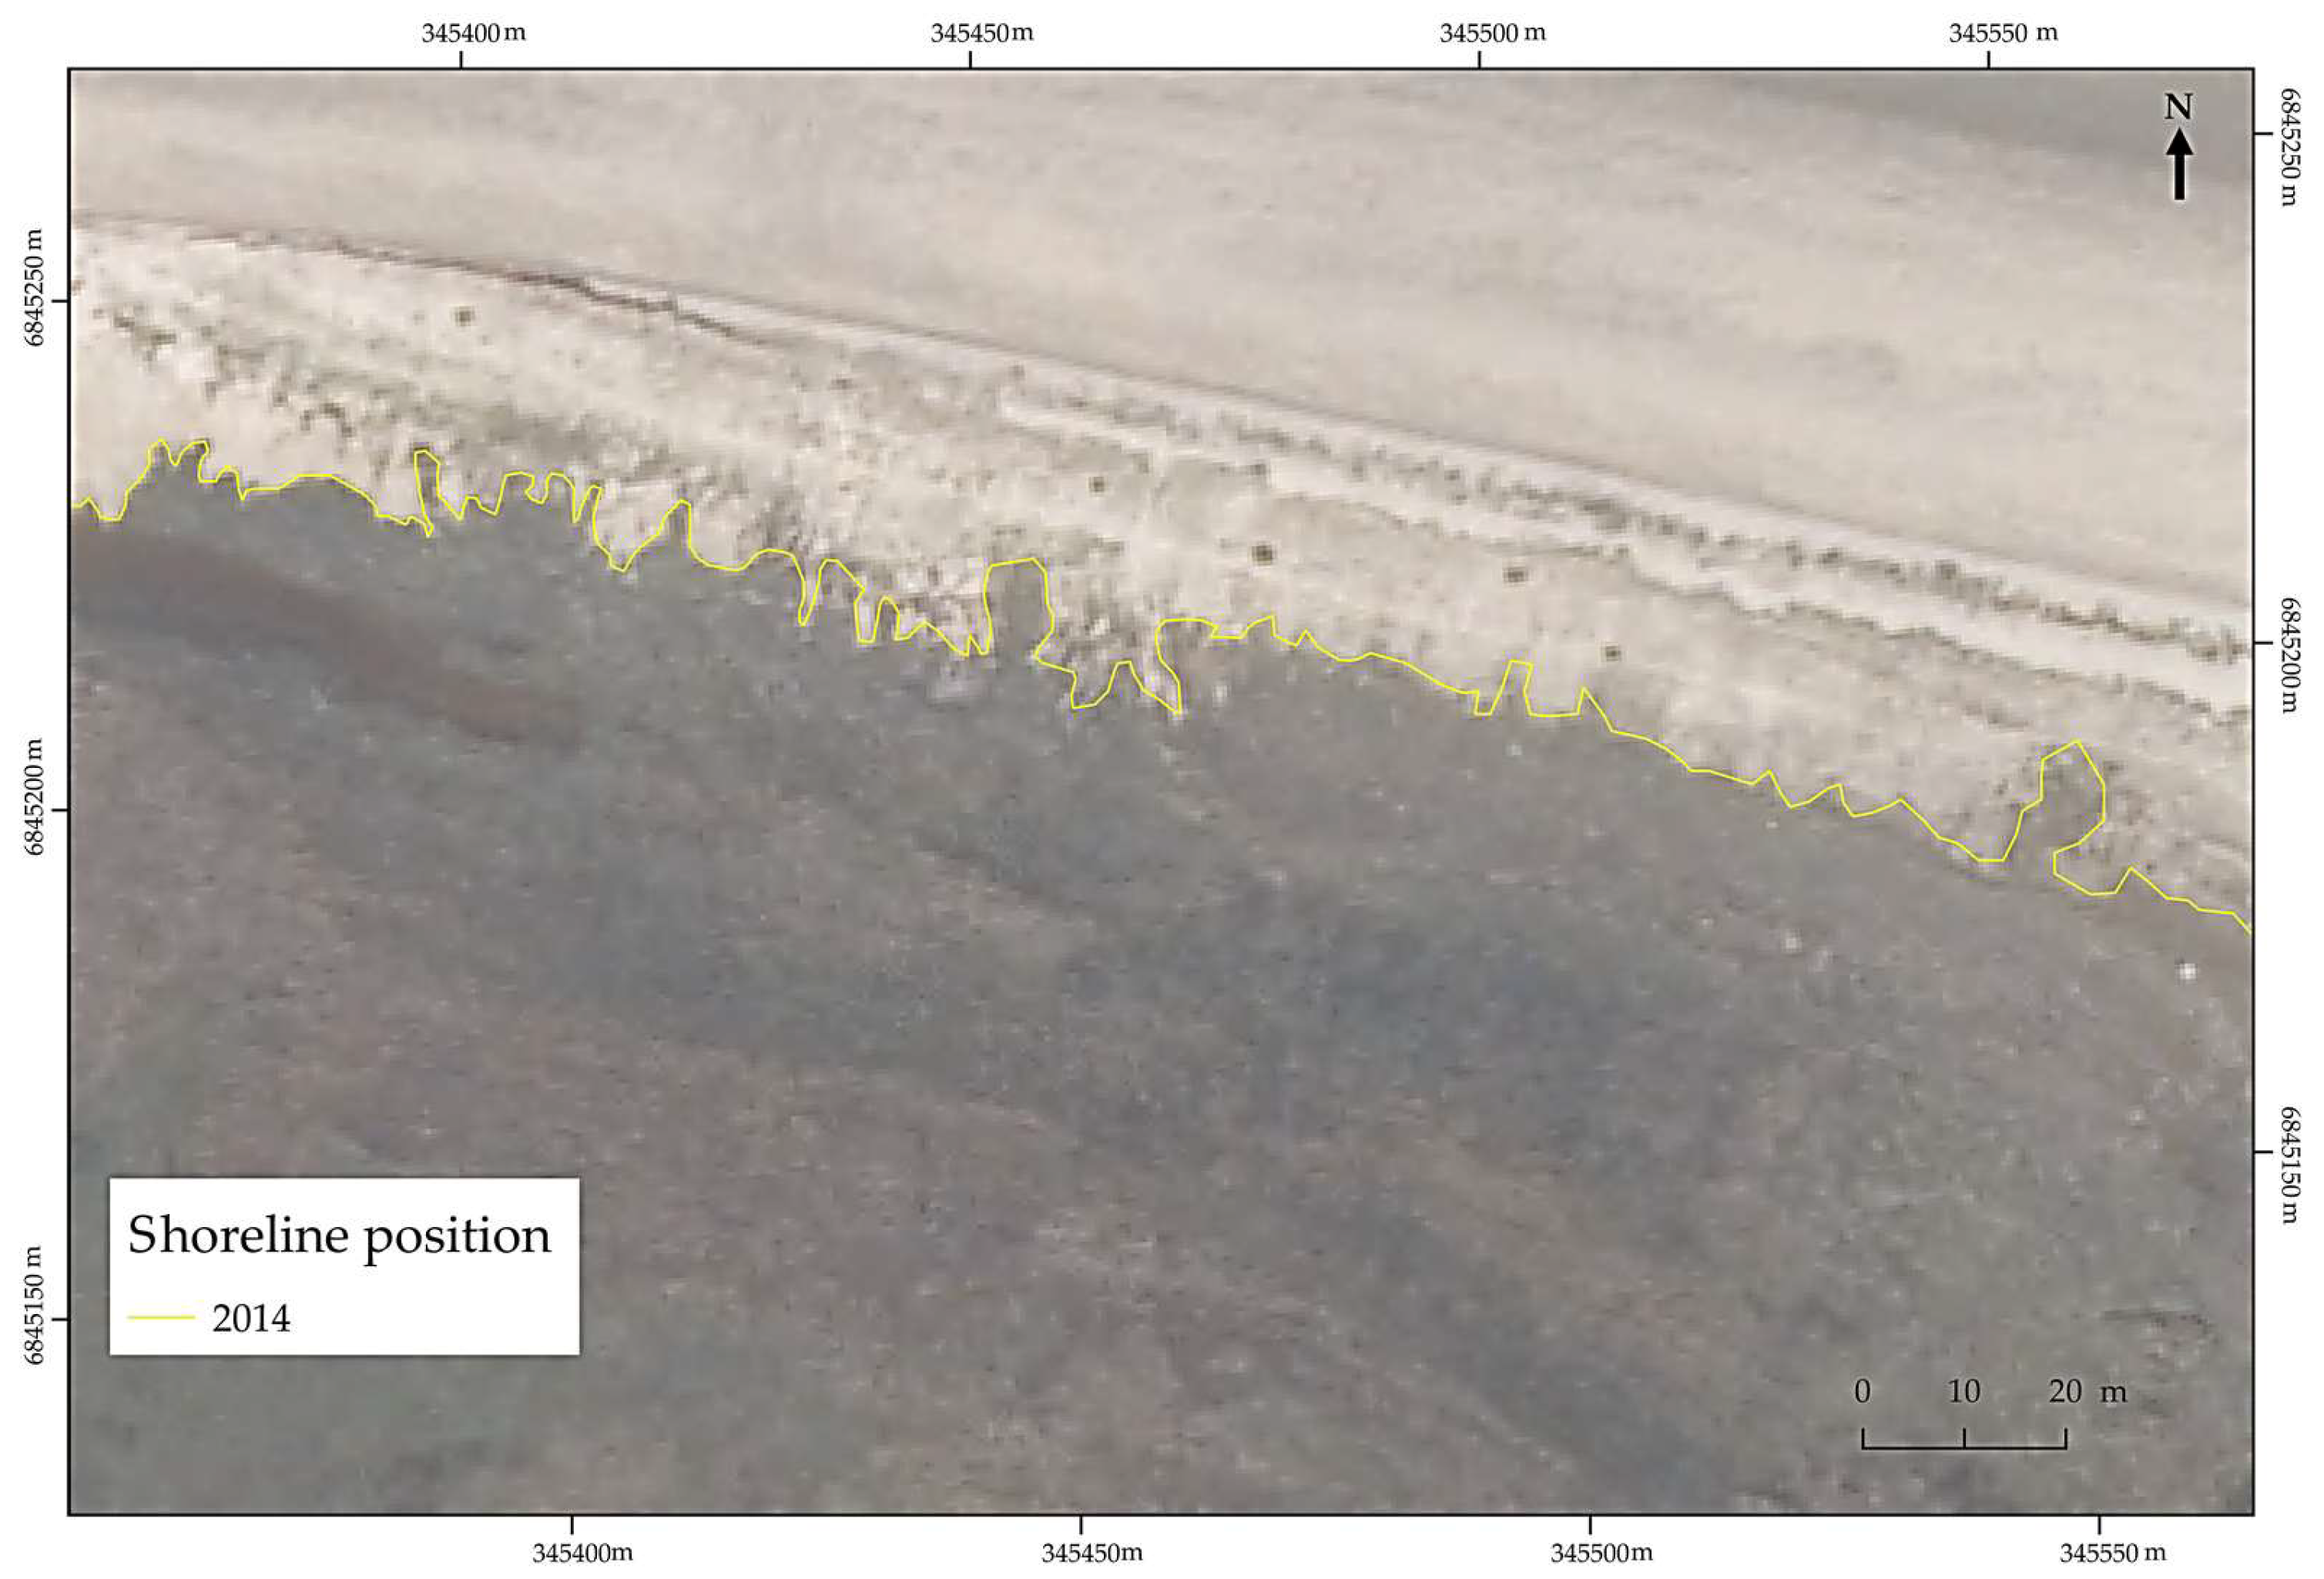
The position tracking method by photointerpretation using the drone orthomosaic (Figure 4) is strictly the same as the common position tracking methods using airborne passive imagery (Figure 5). The drone orthomosaic permitted to delineate the shoreline with a VHR [16,17], leveraging a pixel size of 0.016 m, whereas the 0.5 m passive airborne imagery (Ortho-littorale v2) impeded an easy visual extraction.

3.2. 2D Monitoring and Derived Product

The assessment of the DEM creation was made possible by comparing the horizontal and vertical accuracies derived from the 2019 drone and 2018 LiDAR surveys.
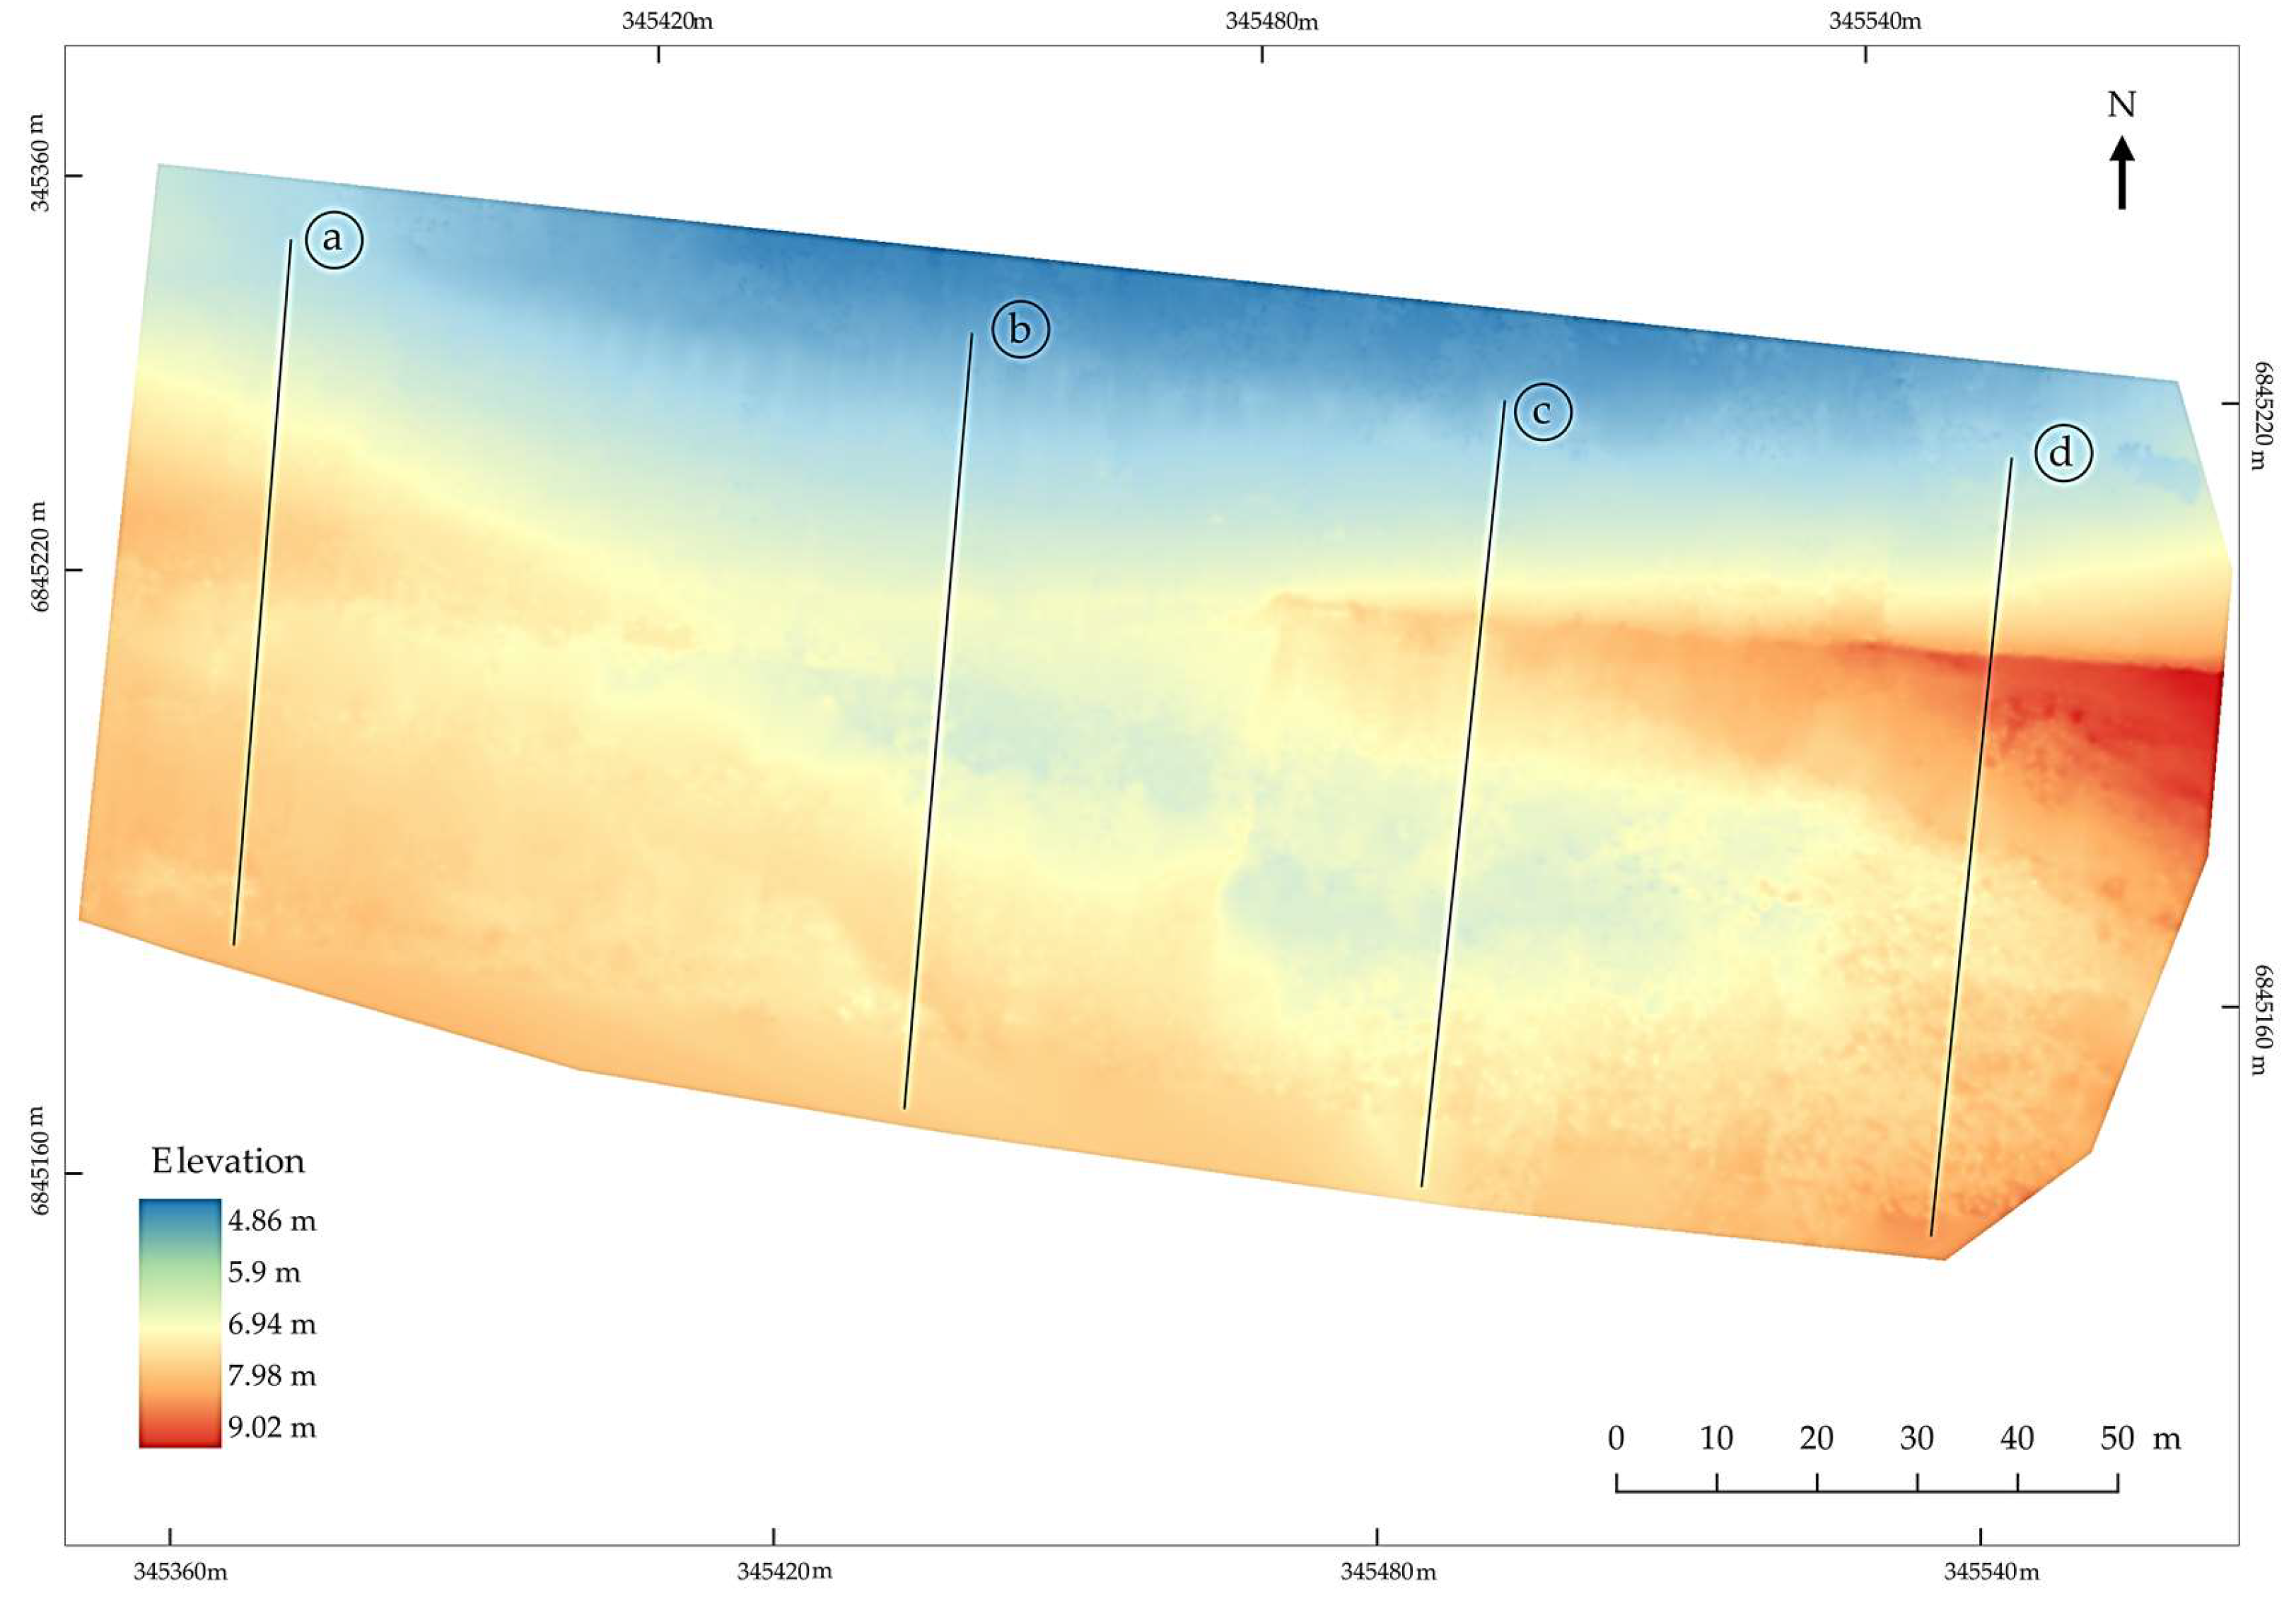
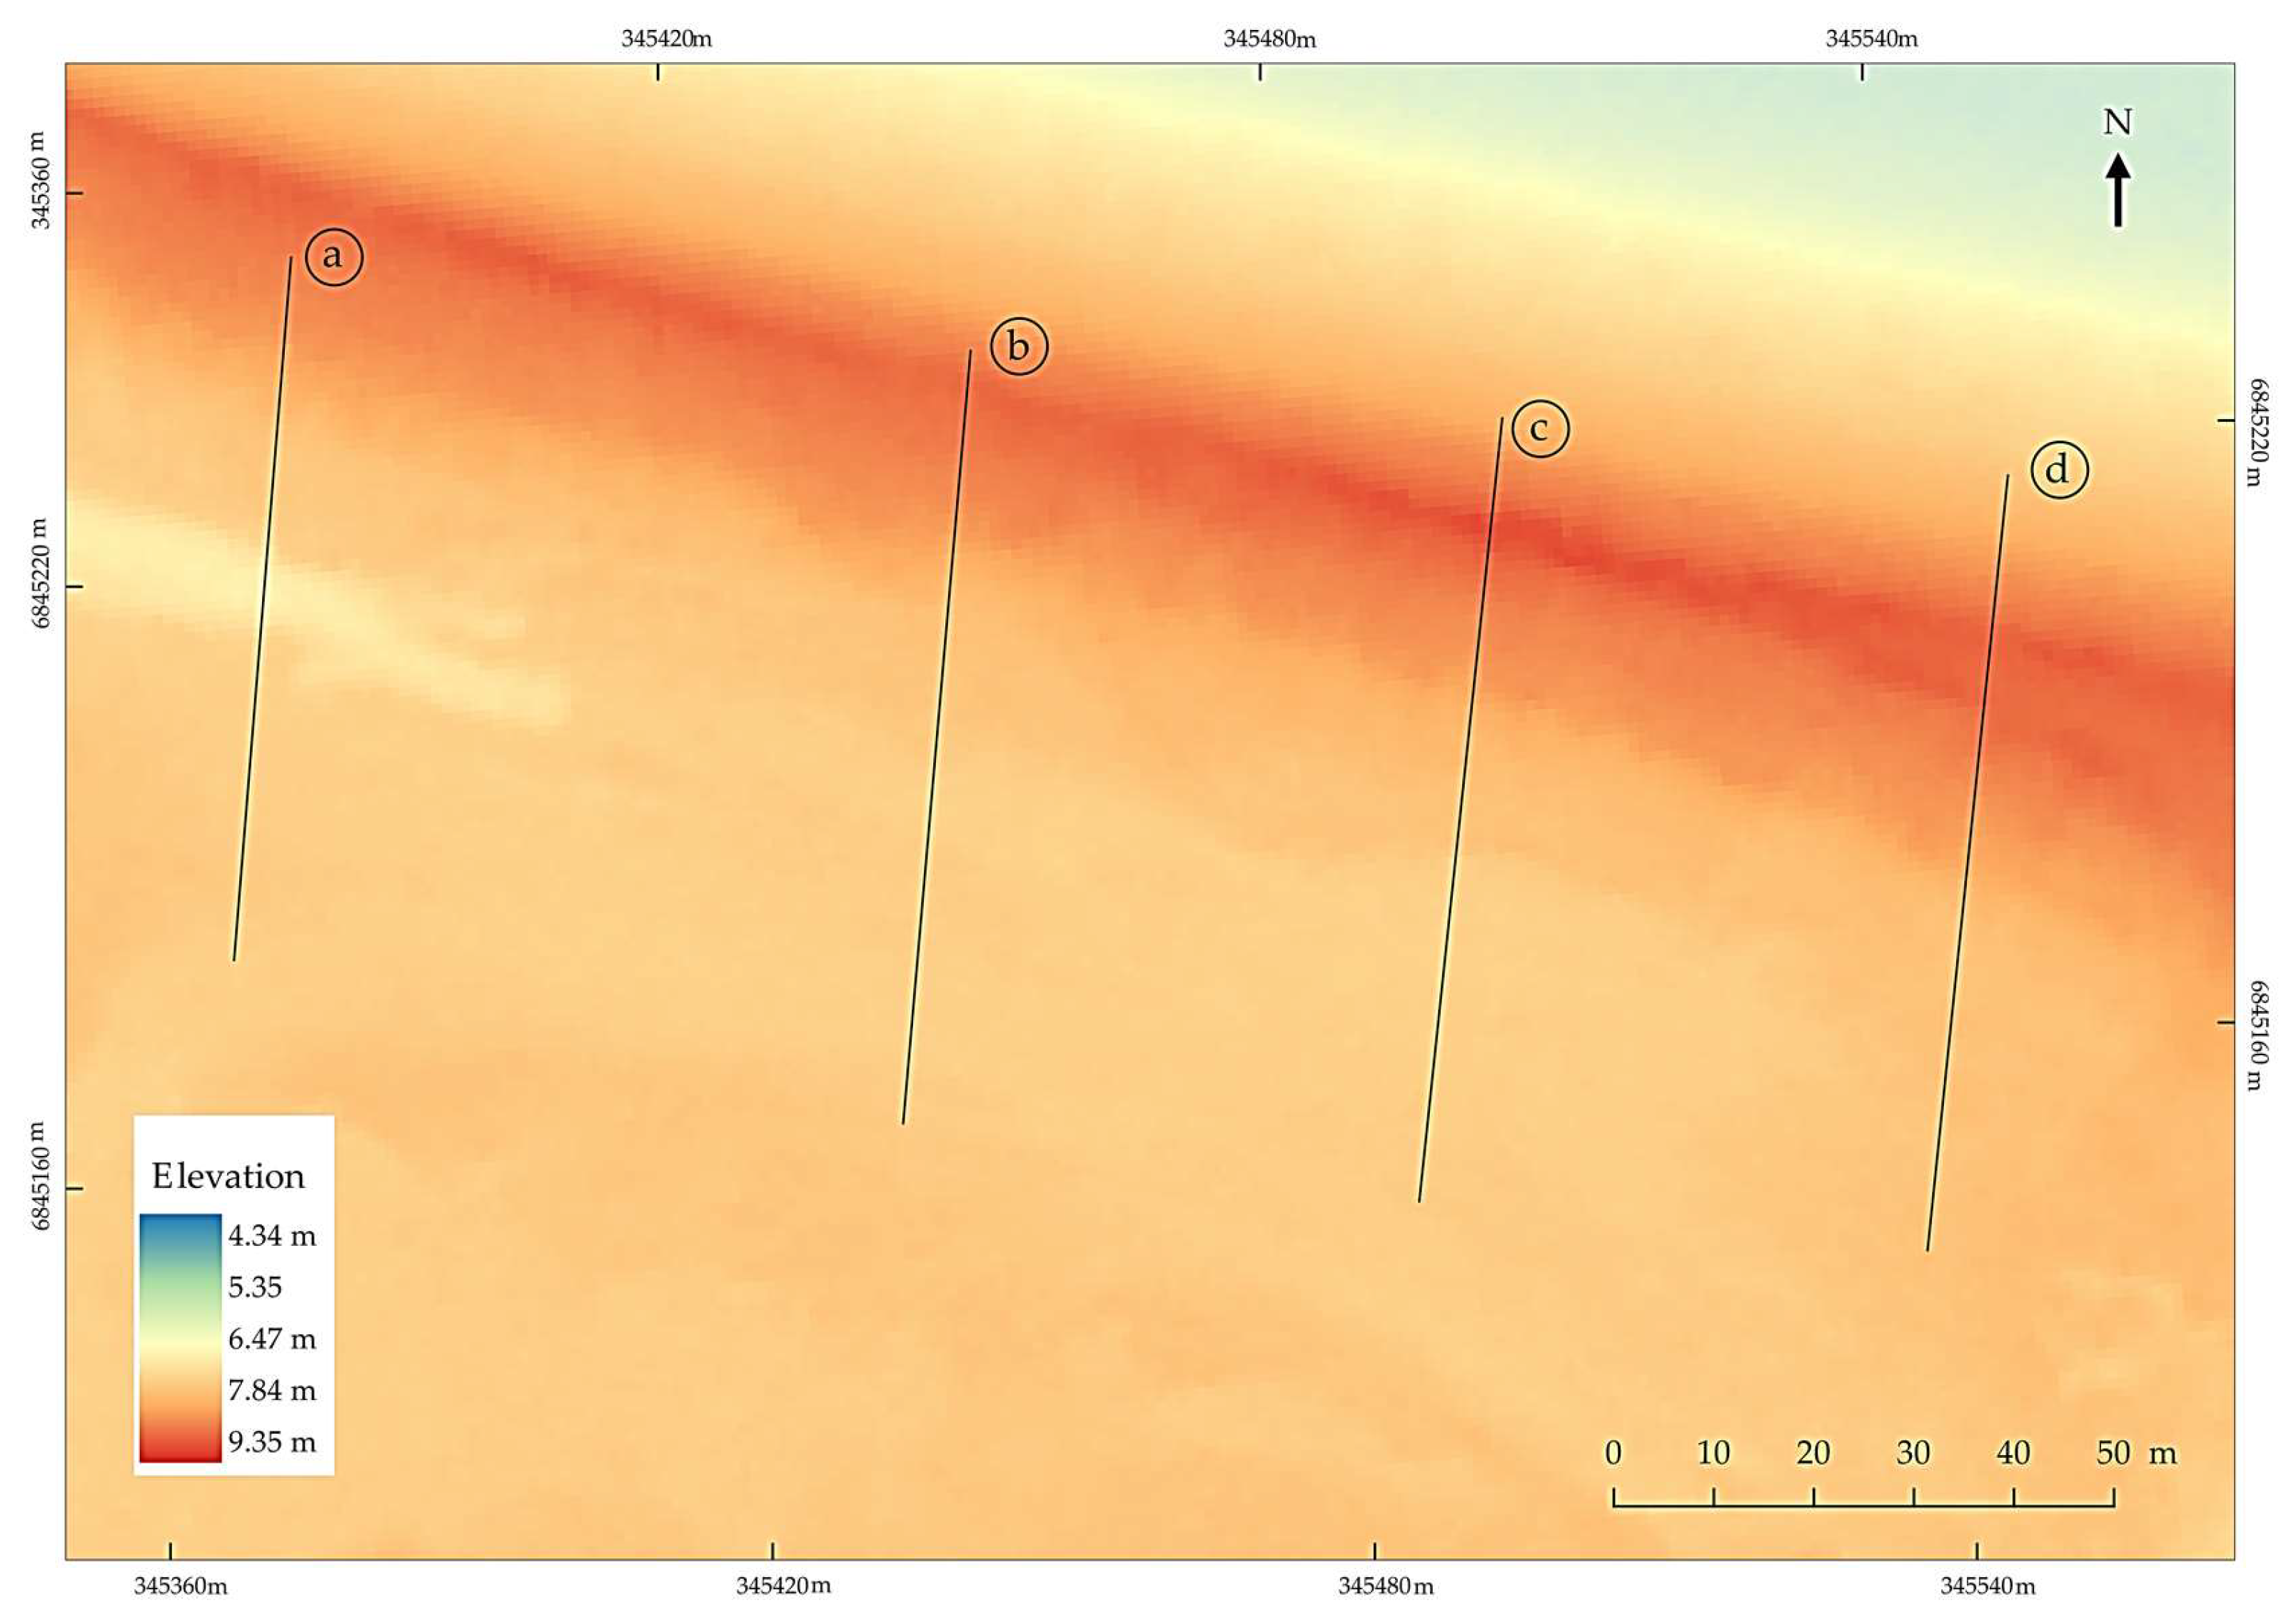
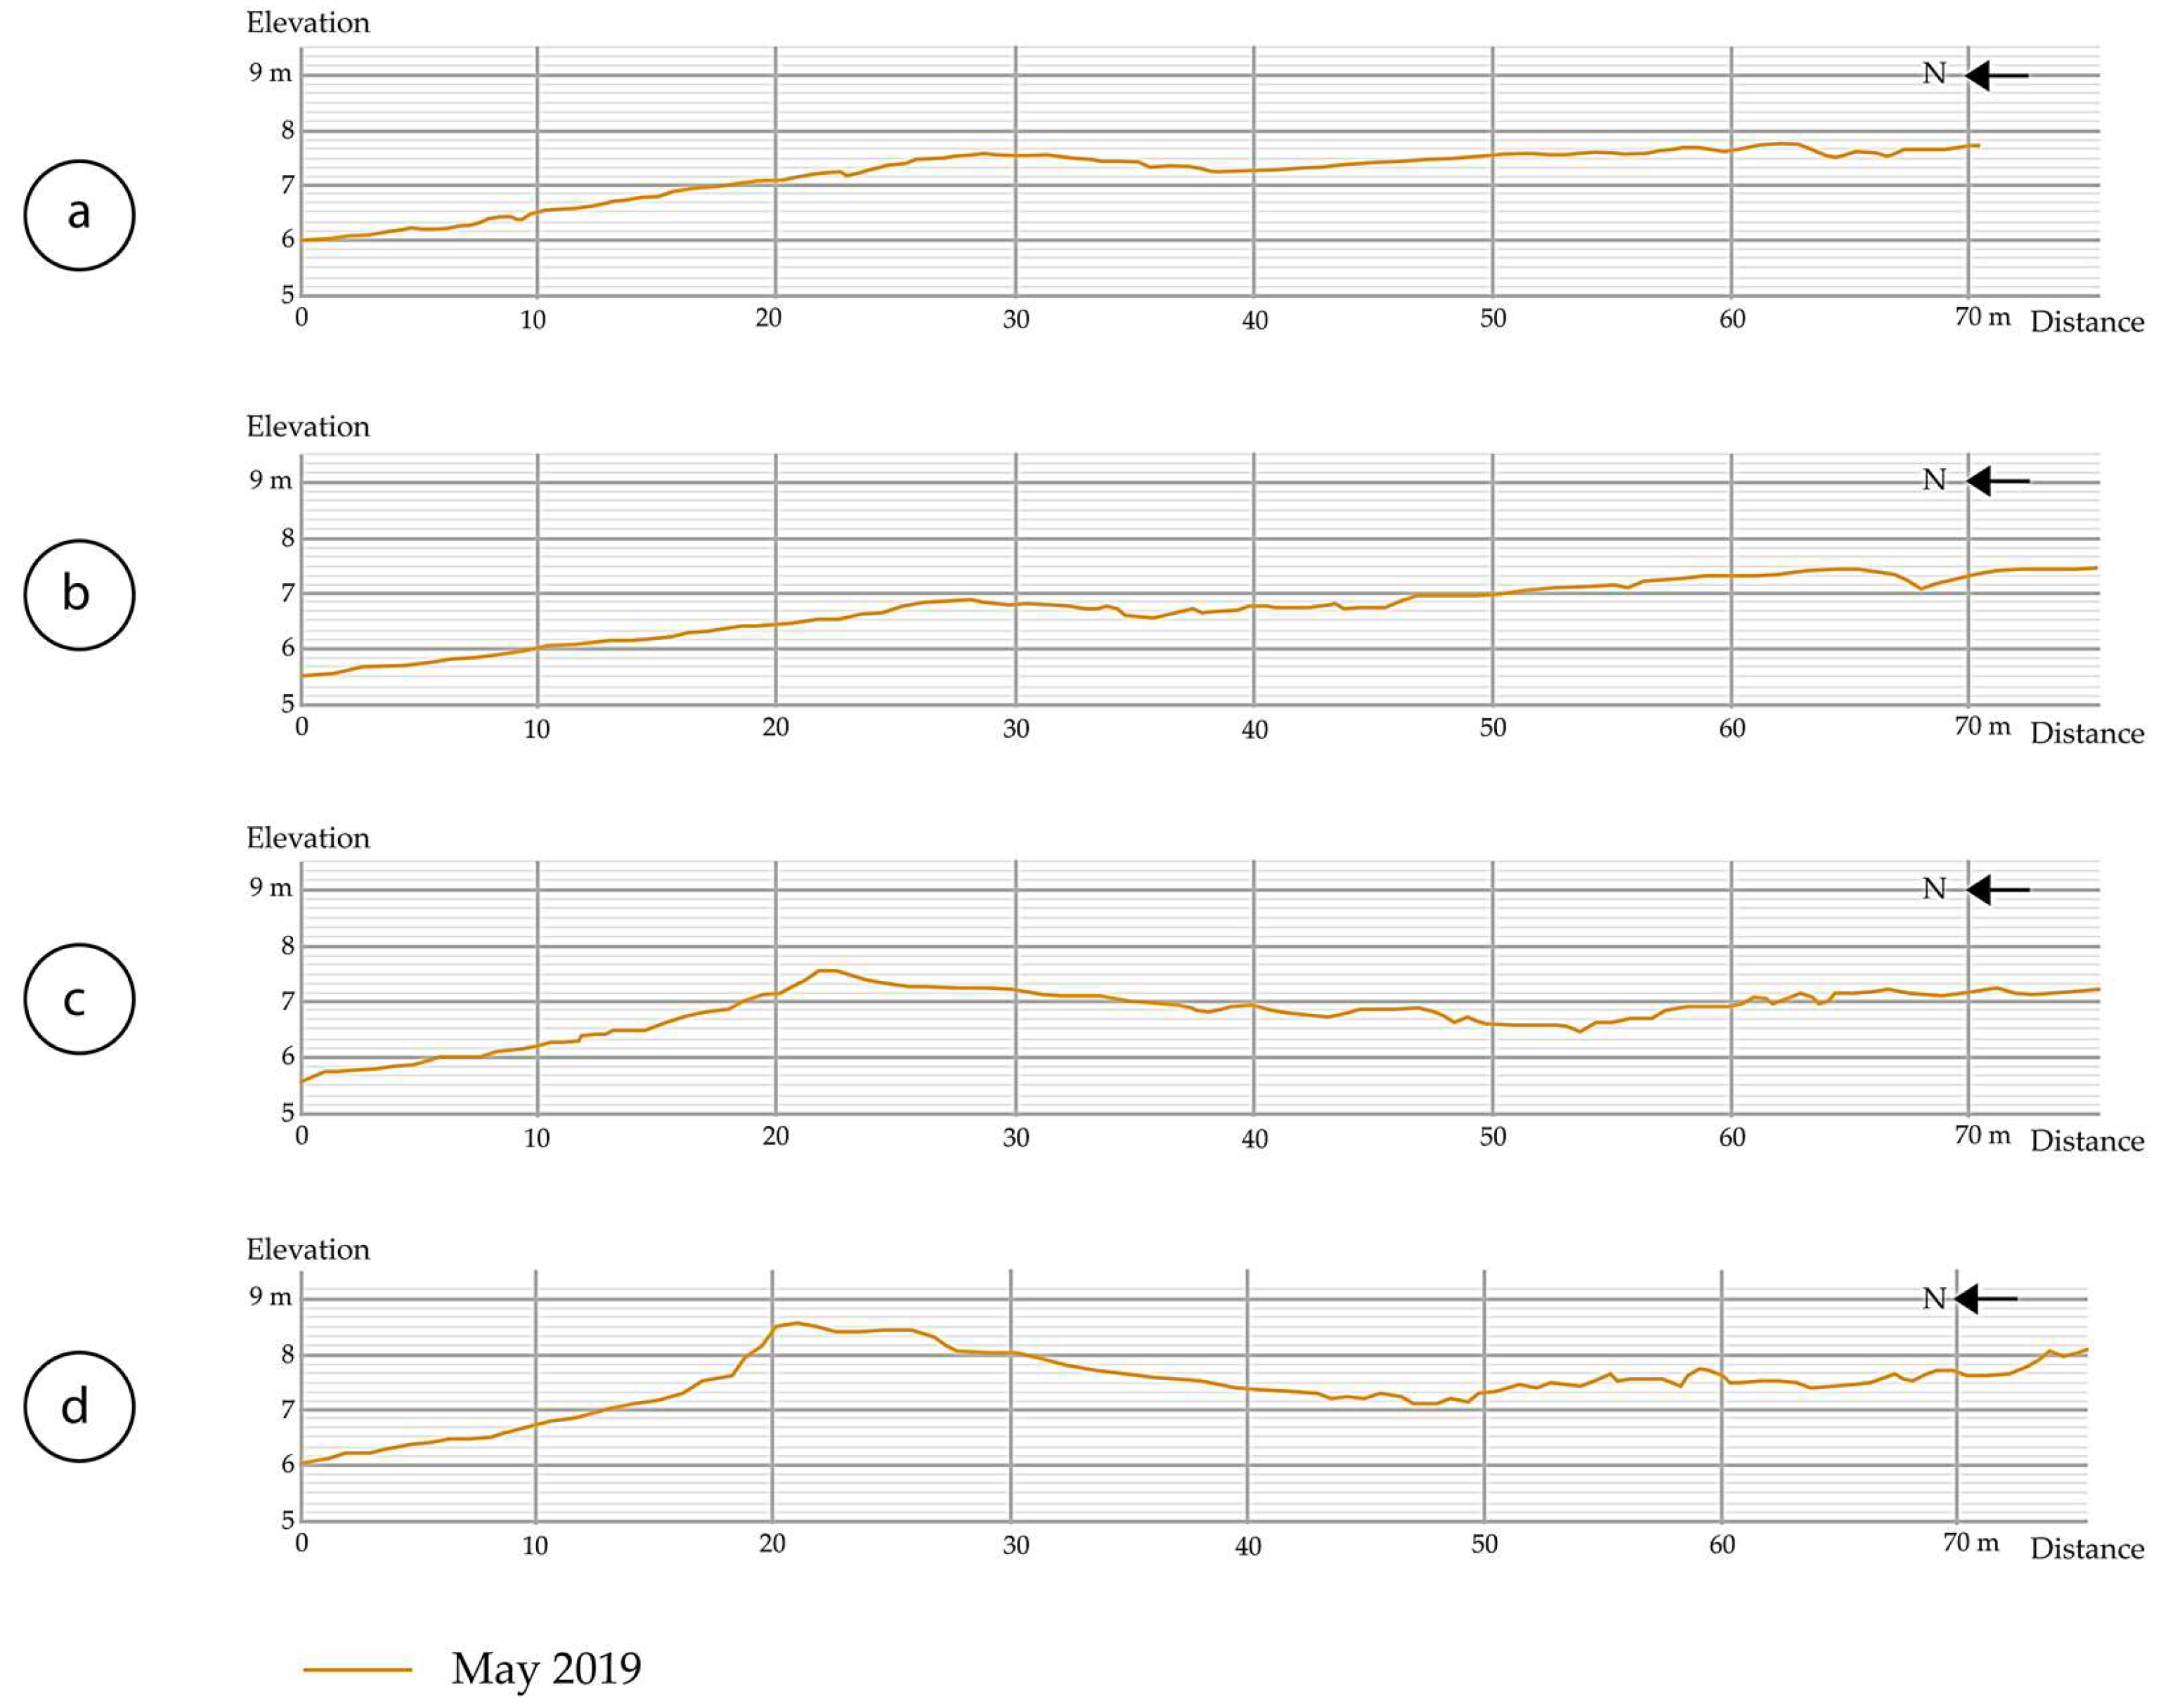
The drone-based DEM (Figure 6) showed higher accuracy and spatial resolution (horizontal accuracy: 0.032 m; vertical accuracy: 0.048 m; spatial resolution: 0.016 m) than the LiDAR-based DEM (Figure 7; horizontal accuracy: < 2 m; vertical accuracy: < 0.40 m; spatial resolution: < 0.20 m, [18]). Derived topographic profiles (Figure 8 and Figure 9, respectively), important for understanding the cross-shore morpho-sedimentary mechanisms, displayed continuous lines for the drone dataset, contrasting with terrace-like segments for LiDAR.

3.3. 2.5D Monitoring

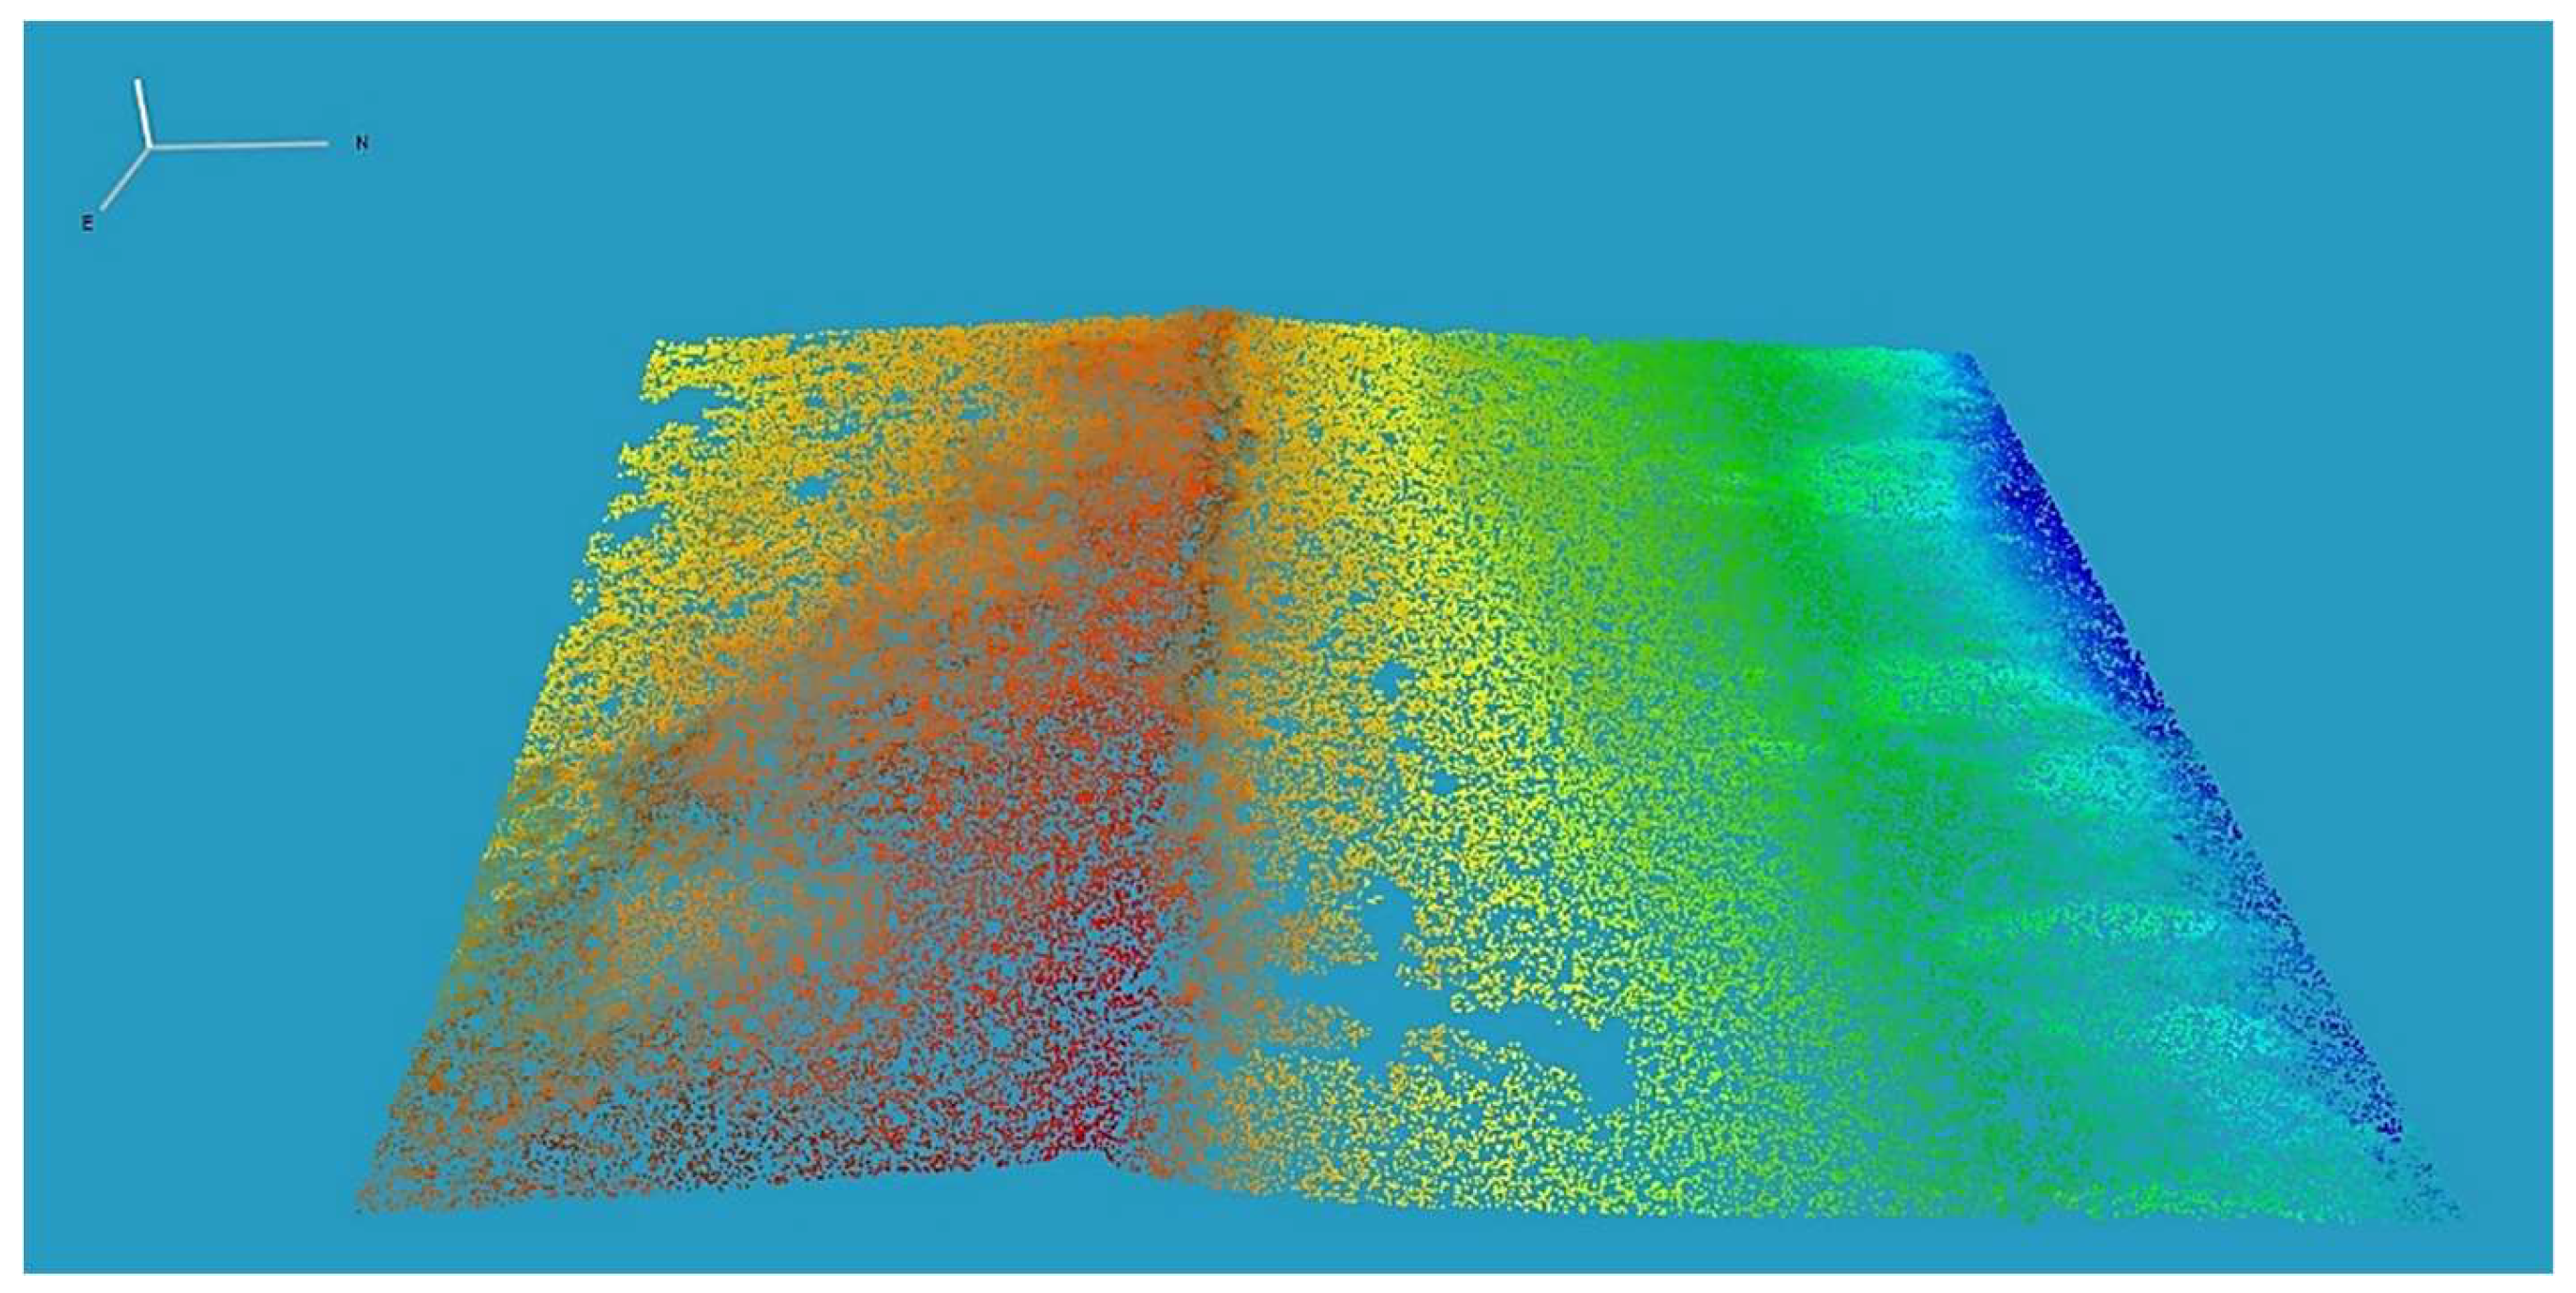
In addition to topographic measurements using the 2D products, the drone data allowed the achievement of a point cloud (Figure 10) with a very high point density (~2.572 points/m2, Table 5) in comparison with the point cloud made from the LiDAR (Figure 11; ~30 points/m2, Table 5).

4. Discussion

4.1. Shoreline Analysis

Because of its centimetre-scale spatial resolution, the orthomosaic created using drone data is a better data source (31 times finer) to achieve more accurate shoreline monitoring, based on the foot of vegetation, compared to the decimetre-scale passive airborne imagery. The use of the orthomosaic created by drone data is also very interesting for pixel-based shoreline identification (e.g., the “wet” and “dry” parts of the beach) because of its centimetre-scale spatial resolution [19].
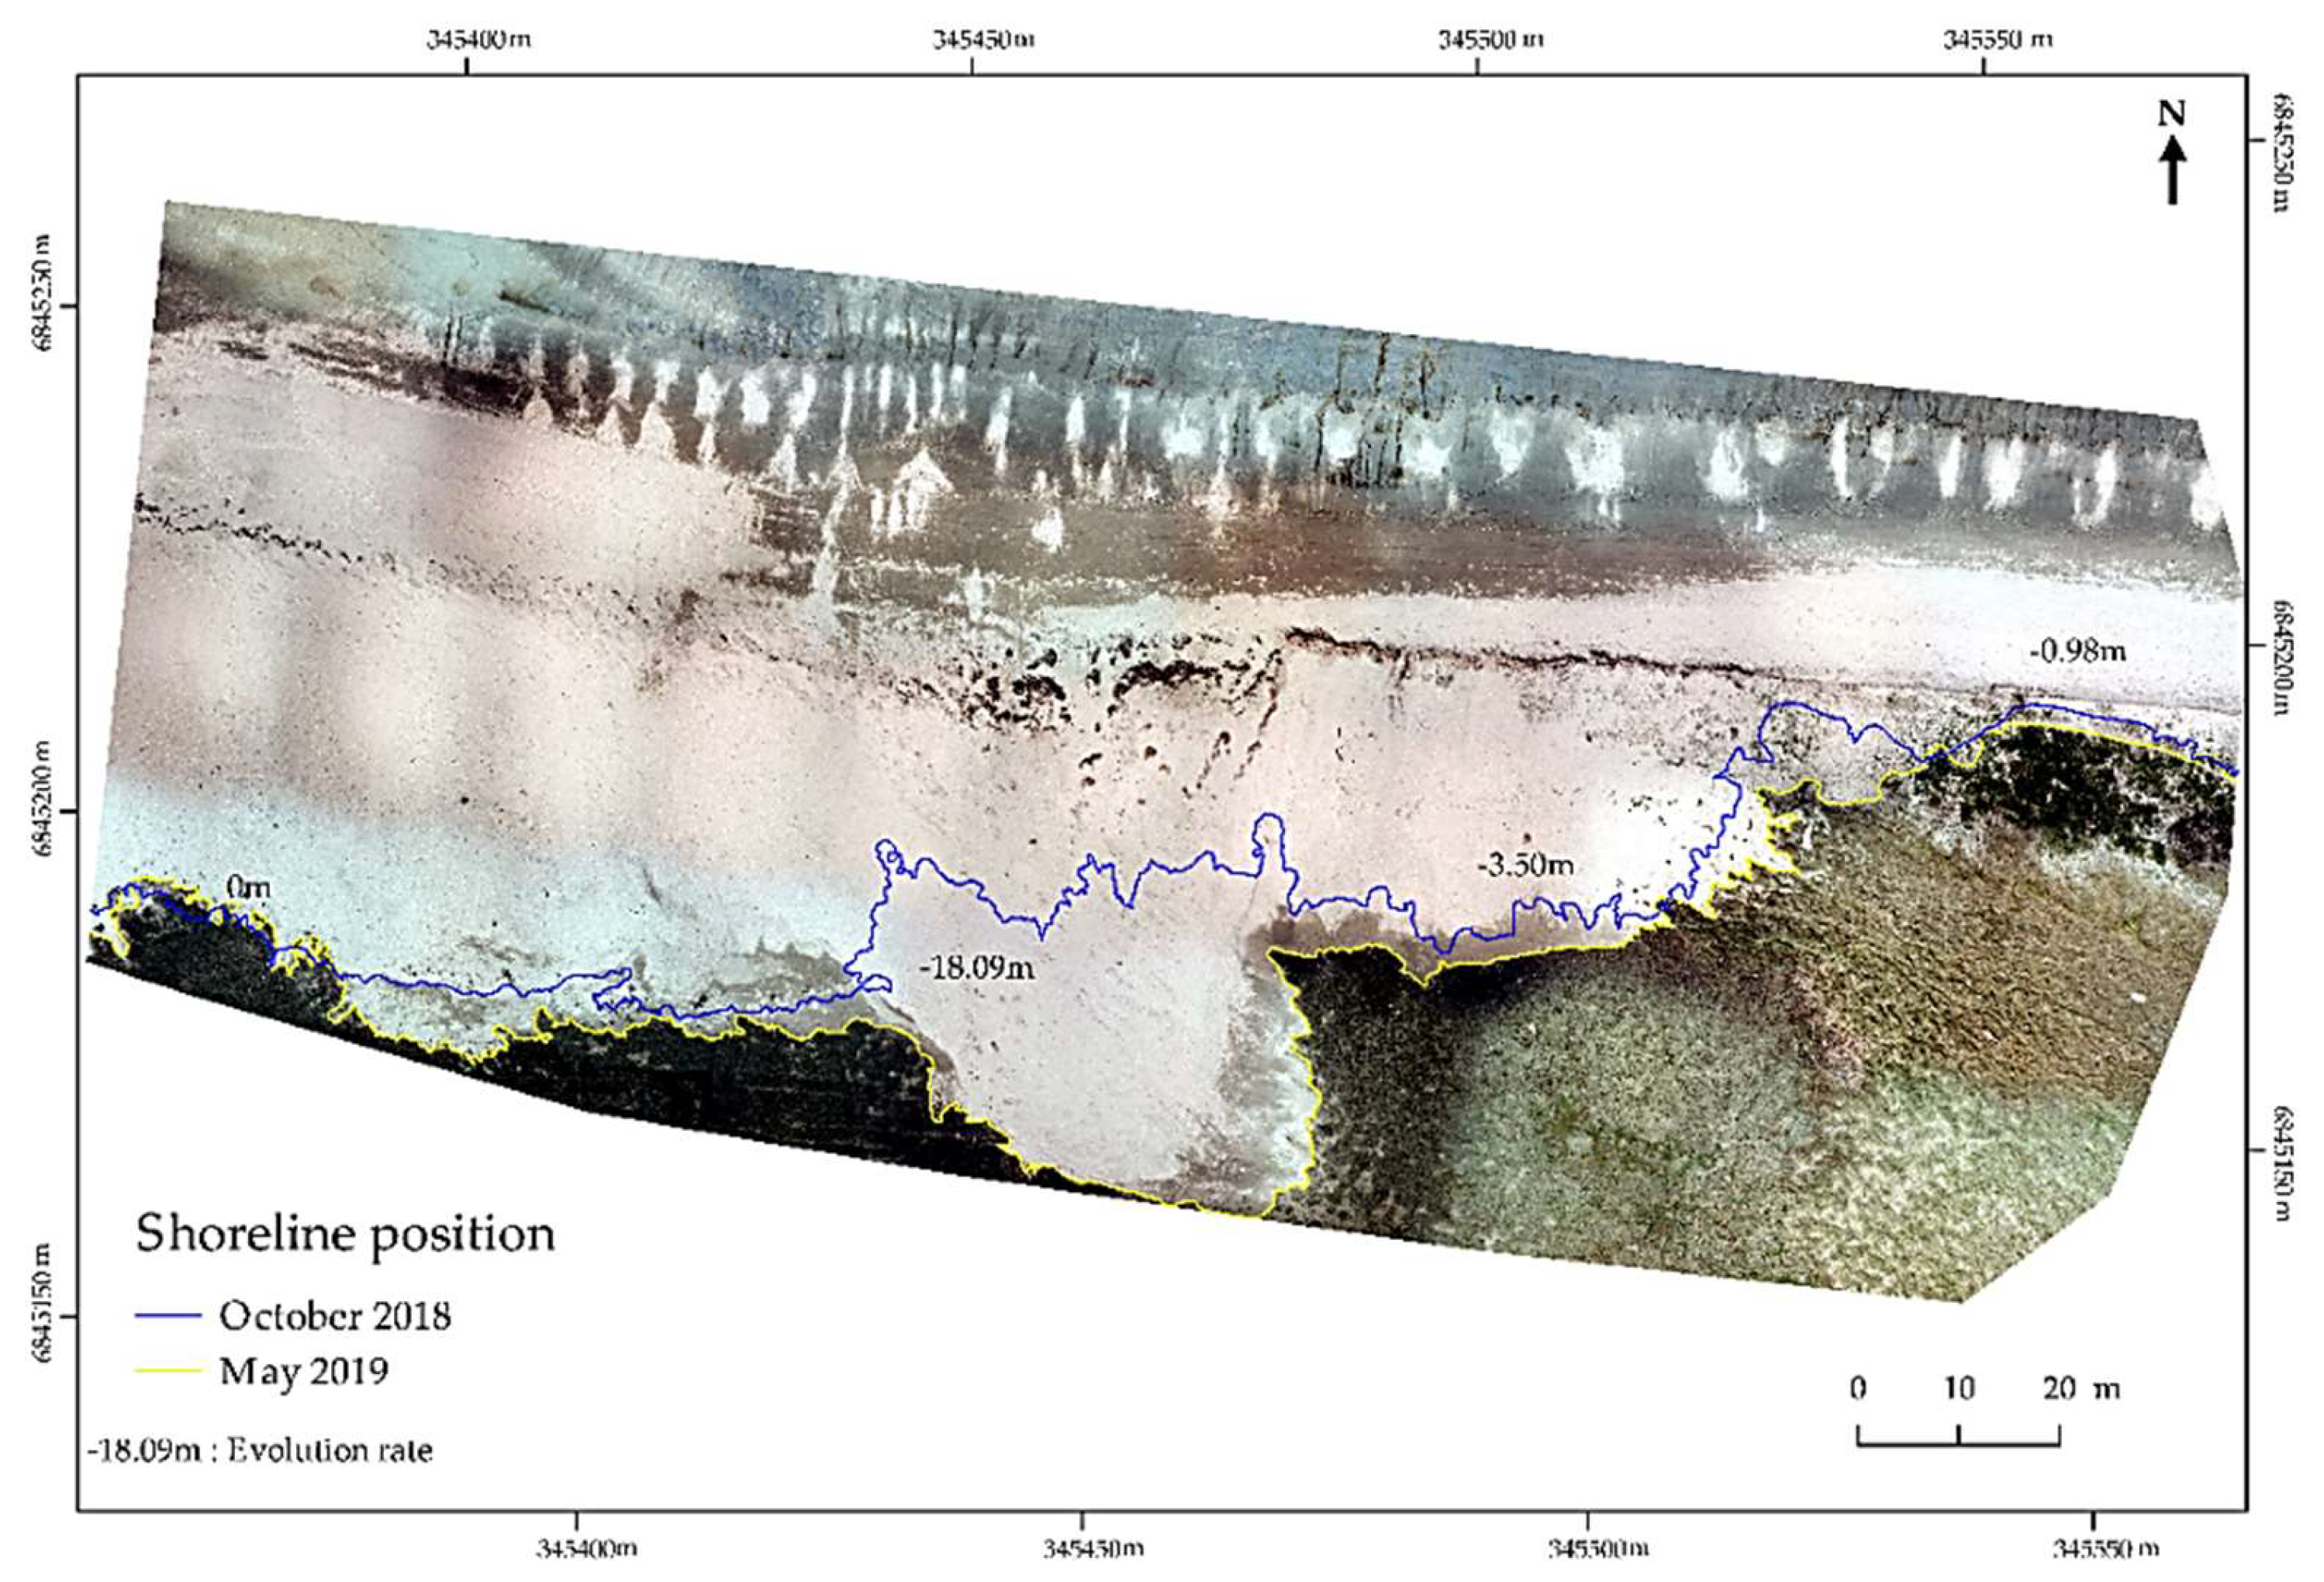
Furthermore, the drone imagery has also the potential to easily achieve a diachronic monitoring by spatially estimating the shoreline retreat value with a potential high to very high temporal resolution (Figure 12; here the two shorelines were timely separated by seven months).

4.2. Topographic Profiles’ Analysis

Owing to the better accuracies (62 and 8 times for XY and Z, respectively) and spatial resolution (25 times better) of the DEM achieved using drone data compared to the DEM created from LiDAR data, the drone achieved better topographic analyses through sliced topographic profiles than LiDAR-based DEM by showing the microtopography along the topographic profiles [20].
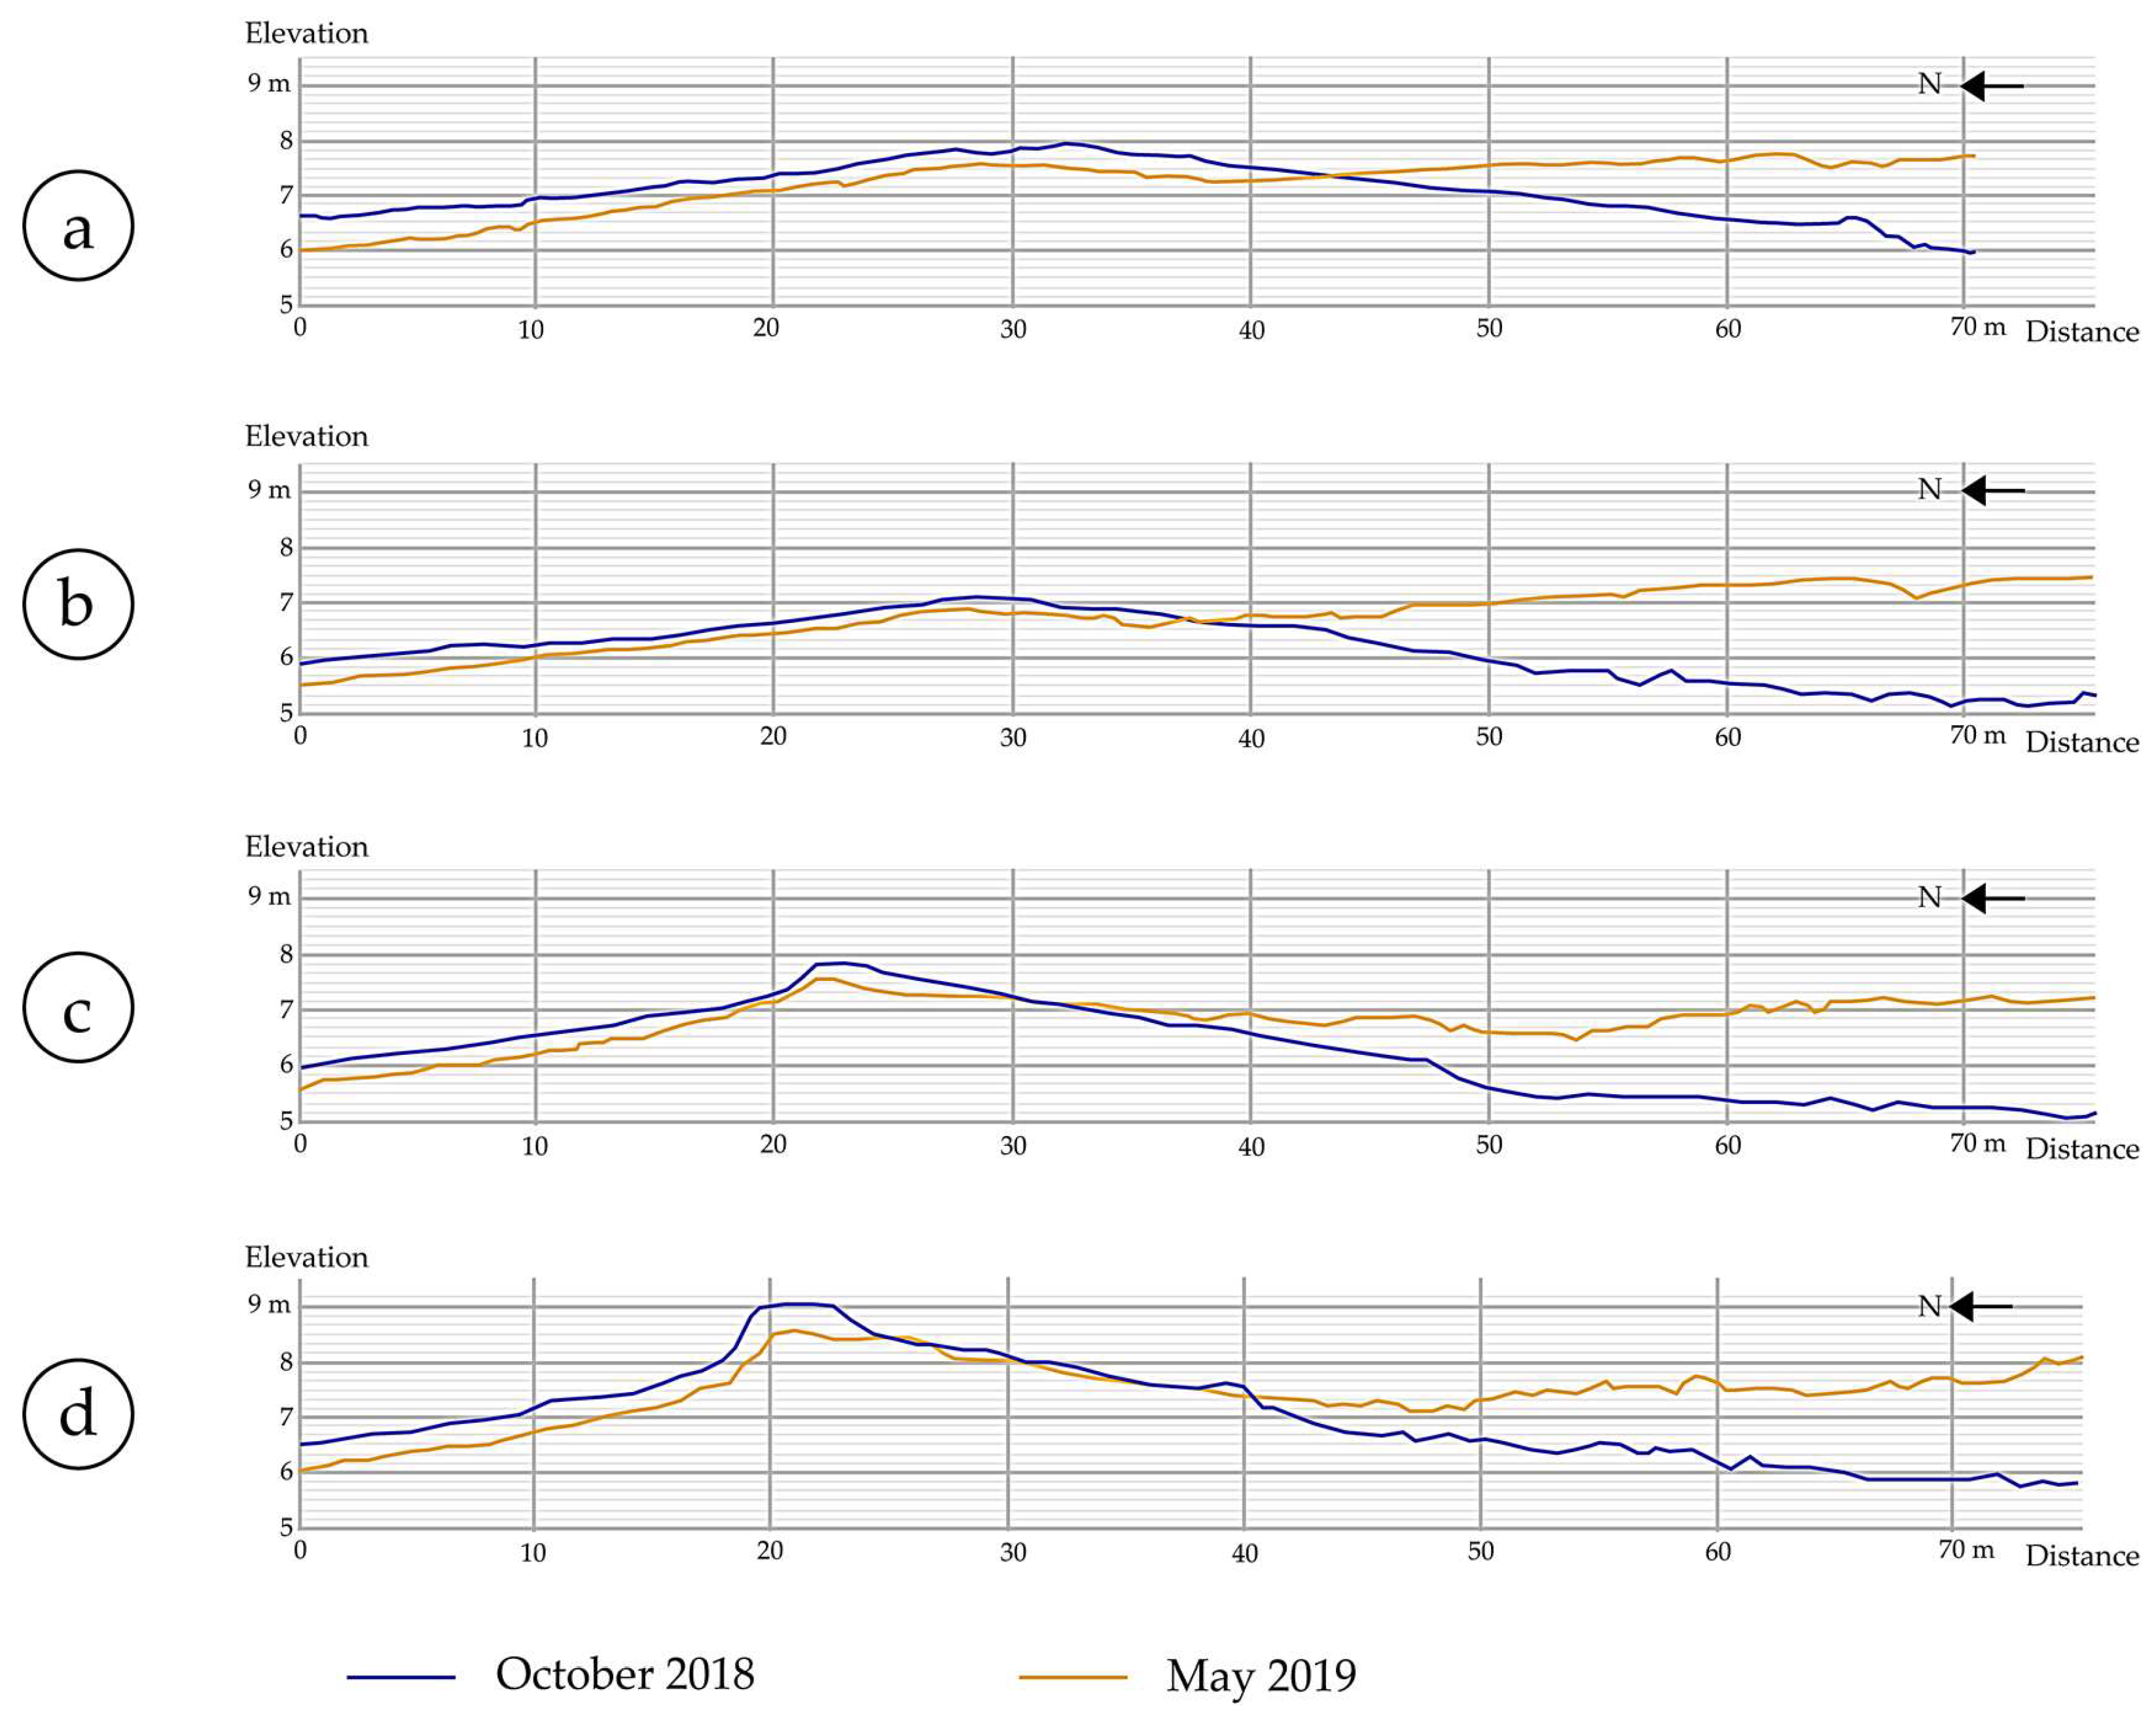
Moreover, the drone data has the potential to implement a very high temporal resolution monitoring, making it possible to observe subtle changes after each tide or storm event (Figure 13).
The analysis of distinct topographic transects highlights the cross-shore sediment dynamics in action in the BMSM during the winter season. On the four measurement transects previously presented, a North-South sediment movement can be observed, from the foreshore to the saltmarsh area. This spatiotemporal pattern corroborates the findings of [21].
A significant elevation levelling of what constituted the crest of the sediment deposit in October 2018 was observed, in favour of the low zone located on the South part of the study area, whose surface rose considerably between the two measurement periods. This might be due to the sediment remobilization under the influence of the 18 tides, combined with wind-driven waves and currents.

4.3. Point Cloud and DEM Analyses

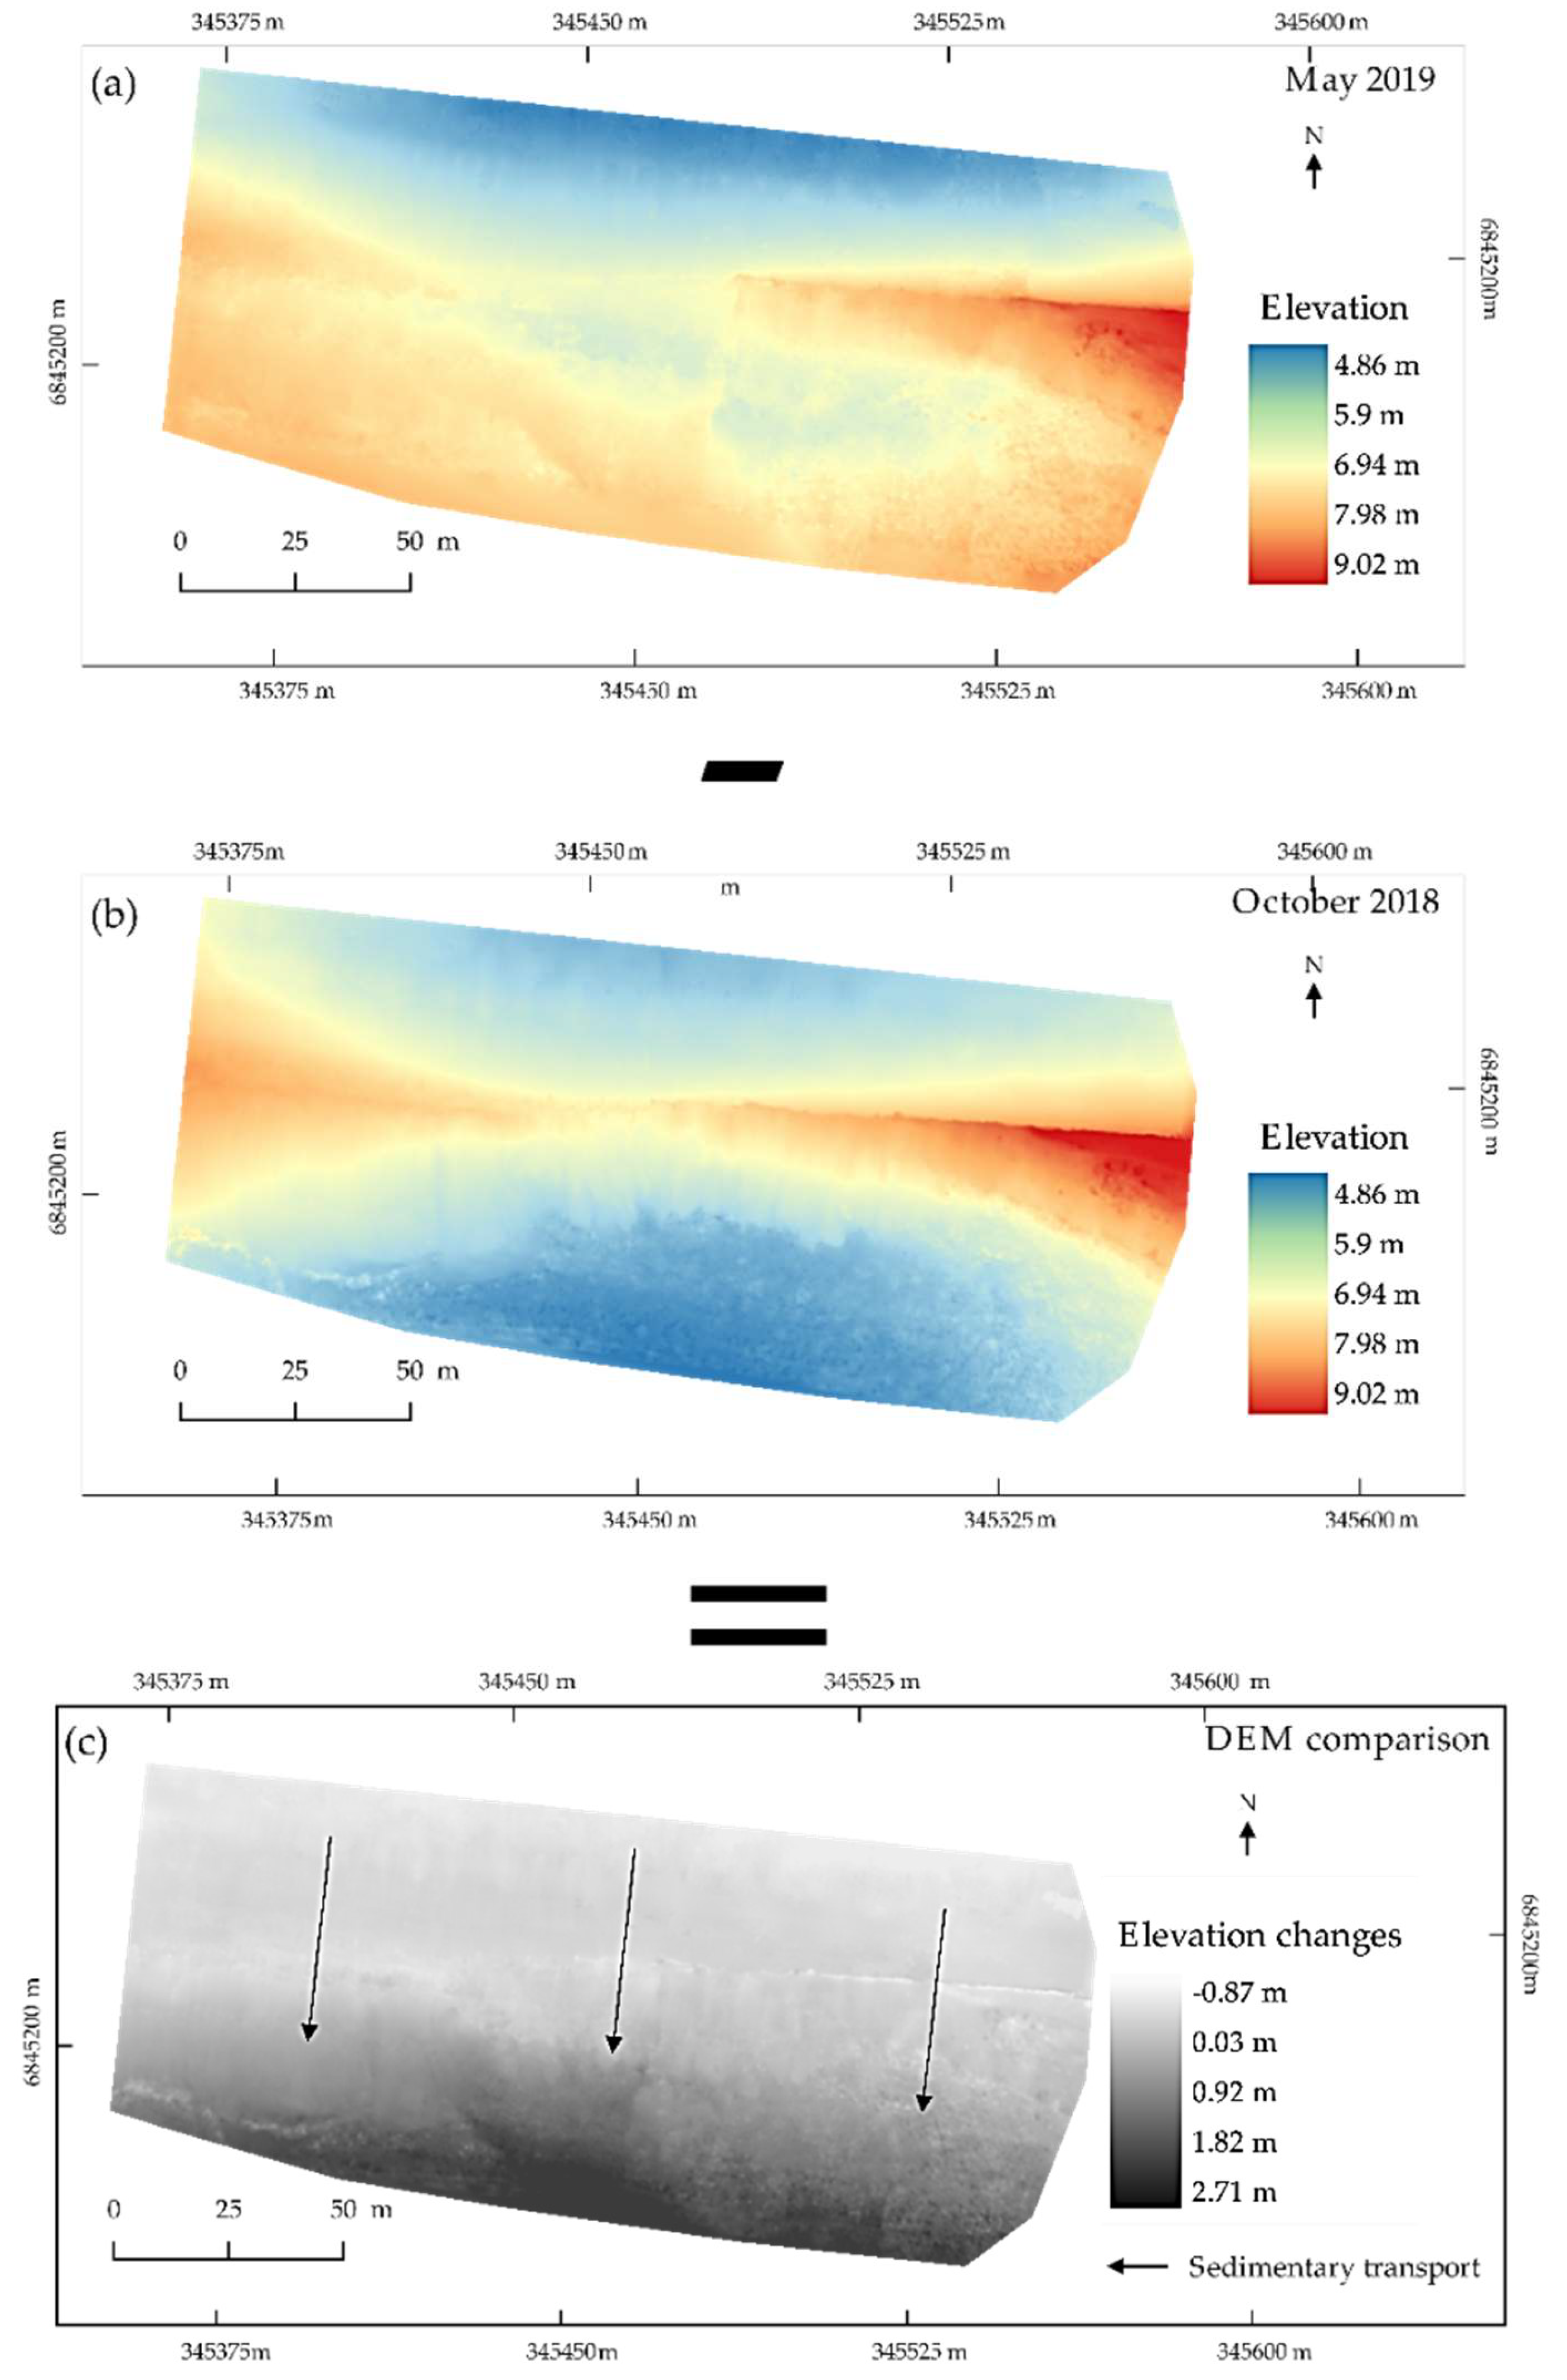
Stemming from a point cloud 86 times denser, the drone-based DEM leverages better spatial resolution and accuracies than the DEM extracted from LiDAR data. It is, once again, more interesting to use it instead of the LiDAR-DEM to evaluate the spatially-explicit morphological changes of a coastal study area between several periods or events (Figure 14).
For example, the DEM comparison, easily achieved by subtracting the October 2018 DEM to the May 2019 DEM, confirms the topographic transects’ analyses. A sediment movement from the North to the South part of the study area was observed, from the foreshore to the area located behind the initial sediment deposit.

4.4. Possible Improvements in Drone Data Acquisition

From a technical point of view concerning the experimental monitoring using the drone imagery, it appears that the overlap ratio, between images, opted for the flight plan has to be improved for the next data acquisition. Indeed, the 60% overlap ratio necessitated a long processing time and an important computation capacity, especially for the image pair matching. It will be facilitated with an 80% to 90% overlap ratio, knowing that an increase of the overlap ratio in the range 80% to 90% will also lead to an increase of the accuracy of the 2.5D modelling software used for the data processing [22]. However, this change would generate the disadvantage of increasing the data processing time, thus the need for high computation capacities.

5. Conclusions

The data acquisition using an airborne drone, purposed to monitor morpho-sedimentary patterns in a coastal area, presents many interests and advantages in comparison to MAV passive imagery, active LiDAR data, but also other common source data (Figure 15).
Considering the 1D position tracking method using the imagery-based vegetation line (see Section 1.2.2, Section 1.2.3 and Section 3.1), the drone orthomosaic strongly outperformed (31 times finer) the MAV imagery, while being the least expensive source of data. Furthermore, because of its easy deployment, the drone potentially permits a very high temporal resolution (which was only presented here with a seven-month resolution). This capability to finely record changes between two close events is not possible using spaceborne or airborne imagery due to the low acquisition frequency and related cost, respectively. However, spaceborne and airborne imagery can cover larger areas (for a single acquisition campaign) than those of the drone and thus can be useful to monitor some regional scenes.
Regarding the 2D and the 2.5D morpho-sedimentary monitoring, the drone approach greatly surpassed the LiDAR one, with horizontal and vertical accuracies 62 and 8 times better, spatial resolution 25 times better, and point cloud density 86 denser (Table 5). Being much more cost-efficient than a LiDAR campaign (100 times cheaper), the drone holds great promise to survey a very frequent coverage of sites.

Author Contributions

Conceptualization, A.M.; Data curation, A.M.; Formal analysis, A.M.; Investigation, A.M.; Methodology, A.M.; Project administration, A.C.; Software, A.M. and D.J.; Supervision, A.C.; Validation, A.C.; Writing—original draft, A.M.; Writing—review and editing, A.M., A.C. and D.J.

Funding

This research received no external funding.

Acknowledgments

The authors acknowledge the Naval Hydrographic and Oceanographic Service for the LiDAR data supply, the three anonymous reviewers for their valuable advices and Smith A.M. for his invaluable assistance in revising this paper.

Conflicts of Interest

The authors declare no conflicts of interest.

References

  1. IPCC. Climate Change 2014: Synthesis Report; Contribution of Working Groups I, II and III to the Fifth Assessment Report of the Intergovernmental Panel on Climate Change Figure Core Writing Team; Pachauri, R.K., Meyer, L.A., Eds.; IPCC: Geneva, Switzerland, 2014; p. 151. [Google Scholar]
  2. Knutson, T.R.; McBride, J.L.; Chan, J.; Emanuel, K.; Holland, G.; Landsea, C.; Held, I.; Kossin, J.P.; Srivastava, A.K.; Sugi, M. Tropical cyclones and climate change. Nat. Geosci. 2010, 3, 157–163. [Google Scholar] [CrossRef] [Green Version]
  3. Etienne, S.; Jeanson, M.; Collin, A. Les services écosystémiques de protection des dépôts sédimentaires en baie du Mont-Saint-Michel; Rapport de Recherché; Conseil Général d’Ille-et-Vilaine: La Selle-en-Luitré, France, 2015; p. 75. [Google Scholar]
  4. Jeanson, M.; Etienne, S.; Collin, A. Wave attenuation and coastal protection by shelly ridges: Mont-Saint-Michel Bay, France. J. Coast. Res. 2016, 75, 398–402. [Google Scholar] [CrossRef]
  5. Mury, A.; Collin, A.; Etienne, S. Wave attenuation service of saltmarshes and shelly cheniers: A spatio-temporal study in Mont-Saint-Michel Bay, France. In Proceedings of the EGU General Assembly Conference, Vienna, Austria, 8–13 April 2018. [Google Scholar]
  6. Stéphan, P.; Suanez, S.; Fichaut, B.; Autret, R.; Blaise, E.; Houron, J.; Ammann, J.; Grandjean, P. Monitoring the medium-term retreat of a gravel spit barrier and management strategies, Sillon de Talbert (North Brittany, France). Ocean Coast. Manag. 2018, 158, 64–82. [Google Scholar] [CrossRef]
  7. Mury, A.; Jeanson, M.; Collin, A.; James, D.; Etienne, S. High Resolution Shoreline and Shelly Ridge Monitoring over Stormy Winter Events: A Case Study in the Megatidal Bay of Mont-Saint-Michel (France). J. Mar. Sci. Eng. 2019, 7, 97. [Google Scholar] [CrossRef]
  8. Gens, R. Remote sensing of coastlines: Detection, extraction and monitoring. Int. J. Remote Sens. 2010, 31, 1819–1836. [Google Scholar] [CrossRef]
  9. Ford, M. Shoreline changes interpreted from multi-temporal aerial photographs and high-resolution satellite images: Wotje Atoll, Marshall Islands. Remote Sens. Environ. 2013, 135, 130–140. [Google Scholar] [CrossRef]
  10. Vergouw, B.; Nagel, H.; Bondt, G.; Custers, B. Drone technology Types, payloads, applications, frequency spectrum issues and future developments. In The Future of Drone Use; Information Technology and Law Series; Custer, B., Ed.; T.M.C Asser Press: The Hague, The Netherlands, 2016; Volume 27, pp. 21–45. [Google Scholar]
  11. Raparelli, E.; Bajocco, S. A bibliometric analysis on the use of unmanned aerial vehicles in agricultural and forestry studies. Int. J. Remote Sens. 2019. [Google Scholar] [CrossRef]
  12. Gonçalves, J.A.; Henriques, R. UAV photogrammetry for topographic monitoring of coastal areas. ISPRS J. Photogramm. Remote Sens. 2015, 104, 101–111. [Google Scholar] [CrossRef]
  13. Mancini, F.; Dubbini, M.; Gattelli, M.; Stecchi, F.; Fabbri, S.; Gabbianelli, G. Using Unmanned Aerial Vehicles (UAV) for High-Resolution Reconstruction of Topography: The Structure from Motion Approach on Coastal Environments. Remote Sens. 2013, 5, 6880–6898. [Google Scholar] [CrossRef] [Green Version]
  14. Scarelli, F.M.; Cantelli, L.; Barboza, E.G.; Rosa, M.L.C.C.; Gabbianelli, G. Natural and Anthropogenic Coastal System Comparison Using DSM from a Low Cost UAV Survey (Capão Novo, RS/Brazil). J. Coast. Res. 2016, 75, 1232–1236. [Google Scholar] [CrossRef]
  15. Archer, A.W. World’s highest tides: Hypertidal coastal systems in North America, South America and Europe. Sediment. Geol. 2013, 284, 1–25. [Google Scholar] [CrossRef]
  16. Tonkin, T.N.; Midgley, N.G. Ground-Control Networks for Image Based Surface Reconstruction: An Investigation of Optimum Survey Designs Using UAV Derived Imagery and Structure-from-Motion Photogrammetry. Remote Sens. 2016, 8, 786. [Google Scholar] [CrossRef]
  17. Lejot, J.; Delacourt, C.; Piegay, H.; Fournier, T.; Tremelo, M.L.; Allemand, P. Very high spatial resolution imagery for channel bathymetry and topography from an unmanned mapping controlled platform. Earth Surf. Process. Landf. 2007, 32, 1705–1725. [Google Scholar] [CrossRef]
  18. Diffusion SHOM. Lidar NHDF 2016–2017 Produit Partiel “Partie Maritime”. Available online: https://diffusion.shom.fr/media/wysiwyg/pdf/Readme-Produit-maritime-partiel-LidarNHDF-V20180501total.pdf (accessed on 26 July 2019).
  19. Boak, E.H.; Turner, I.L. Shoreline Definition and Detection: A Review. J. Coast. Res. 2005, 214, 688–703. [Google Scholar] [CrossRef]
  20. Lucieer, A.; Turner, D.; King, D.H.; Robinson, S.A. Using and unmanned aerial vehicle (UAV) to capture micro-topography of Antartic moss beds. Int. J. Appl. Earth Obs. Geoinf. 2014, 27, 53–62. [Google Scholar] [CrossRef]
  21. Bonnot-Courtois, C.; Fournier, J.; Dréau, A. Recent morphodynamics of shell banks in the western part of the Bay of Mont-Saint-Michel (France). Géomorphol. Relief Process. Environ. 2004, 10, 65–79. [Google Scholar] [CrossRef]
  22. Yanagi, H.; Chikatsu, H. Performance evaluation of 3D modelling software for UAV photogrammetry. Int. Arch. Photogramm. Remote Sens. Spat. Inf. Sci. 2016, XLI-B5, 147–152. [Google Scholar] [CrossRef]
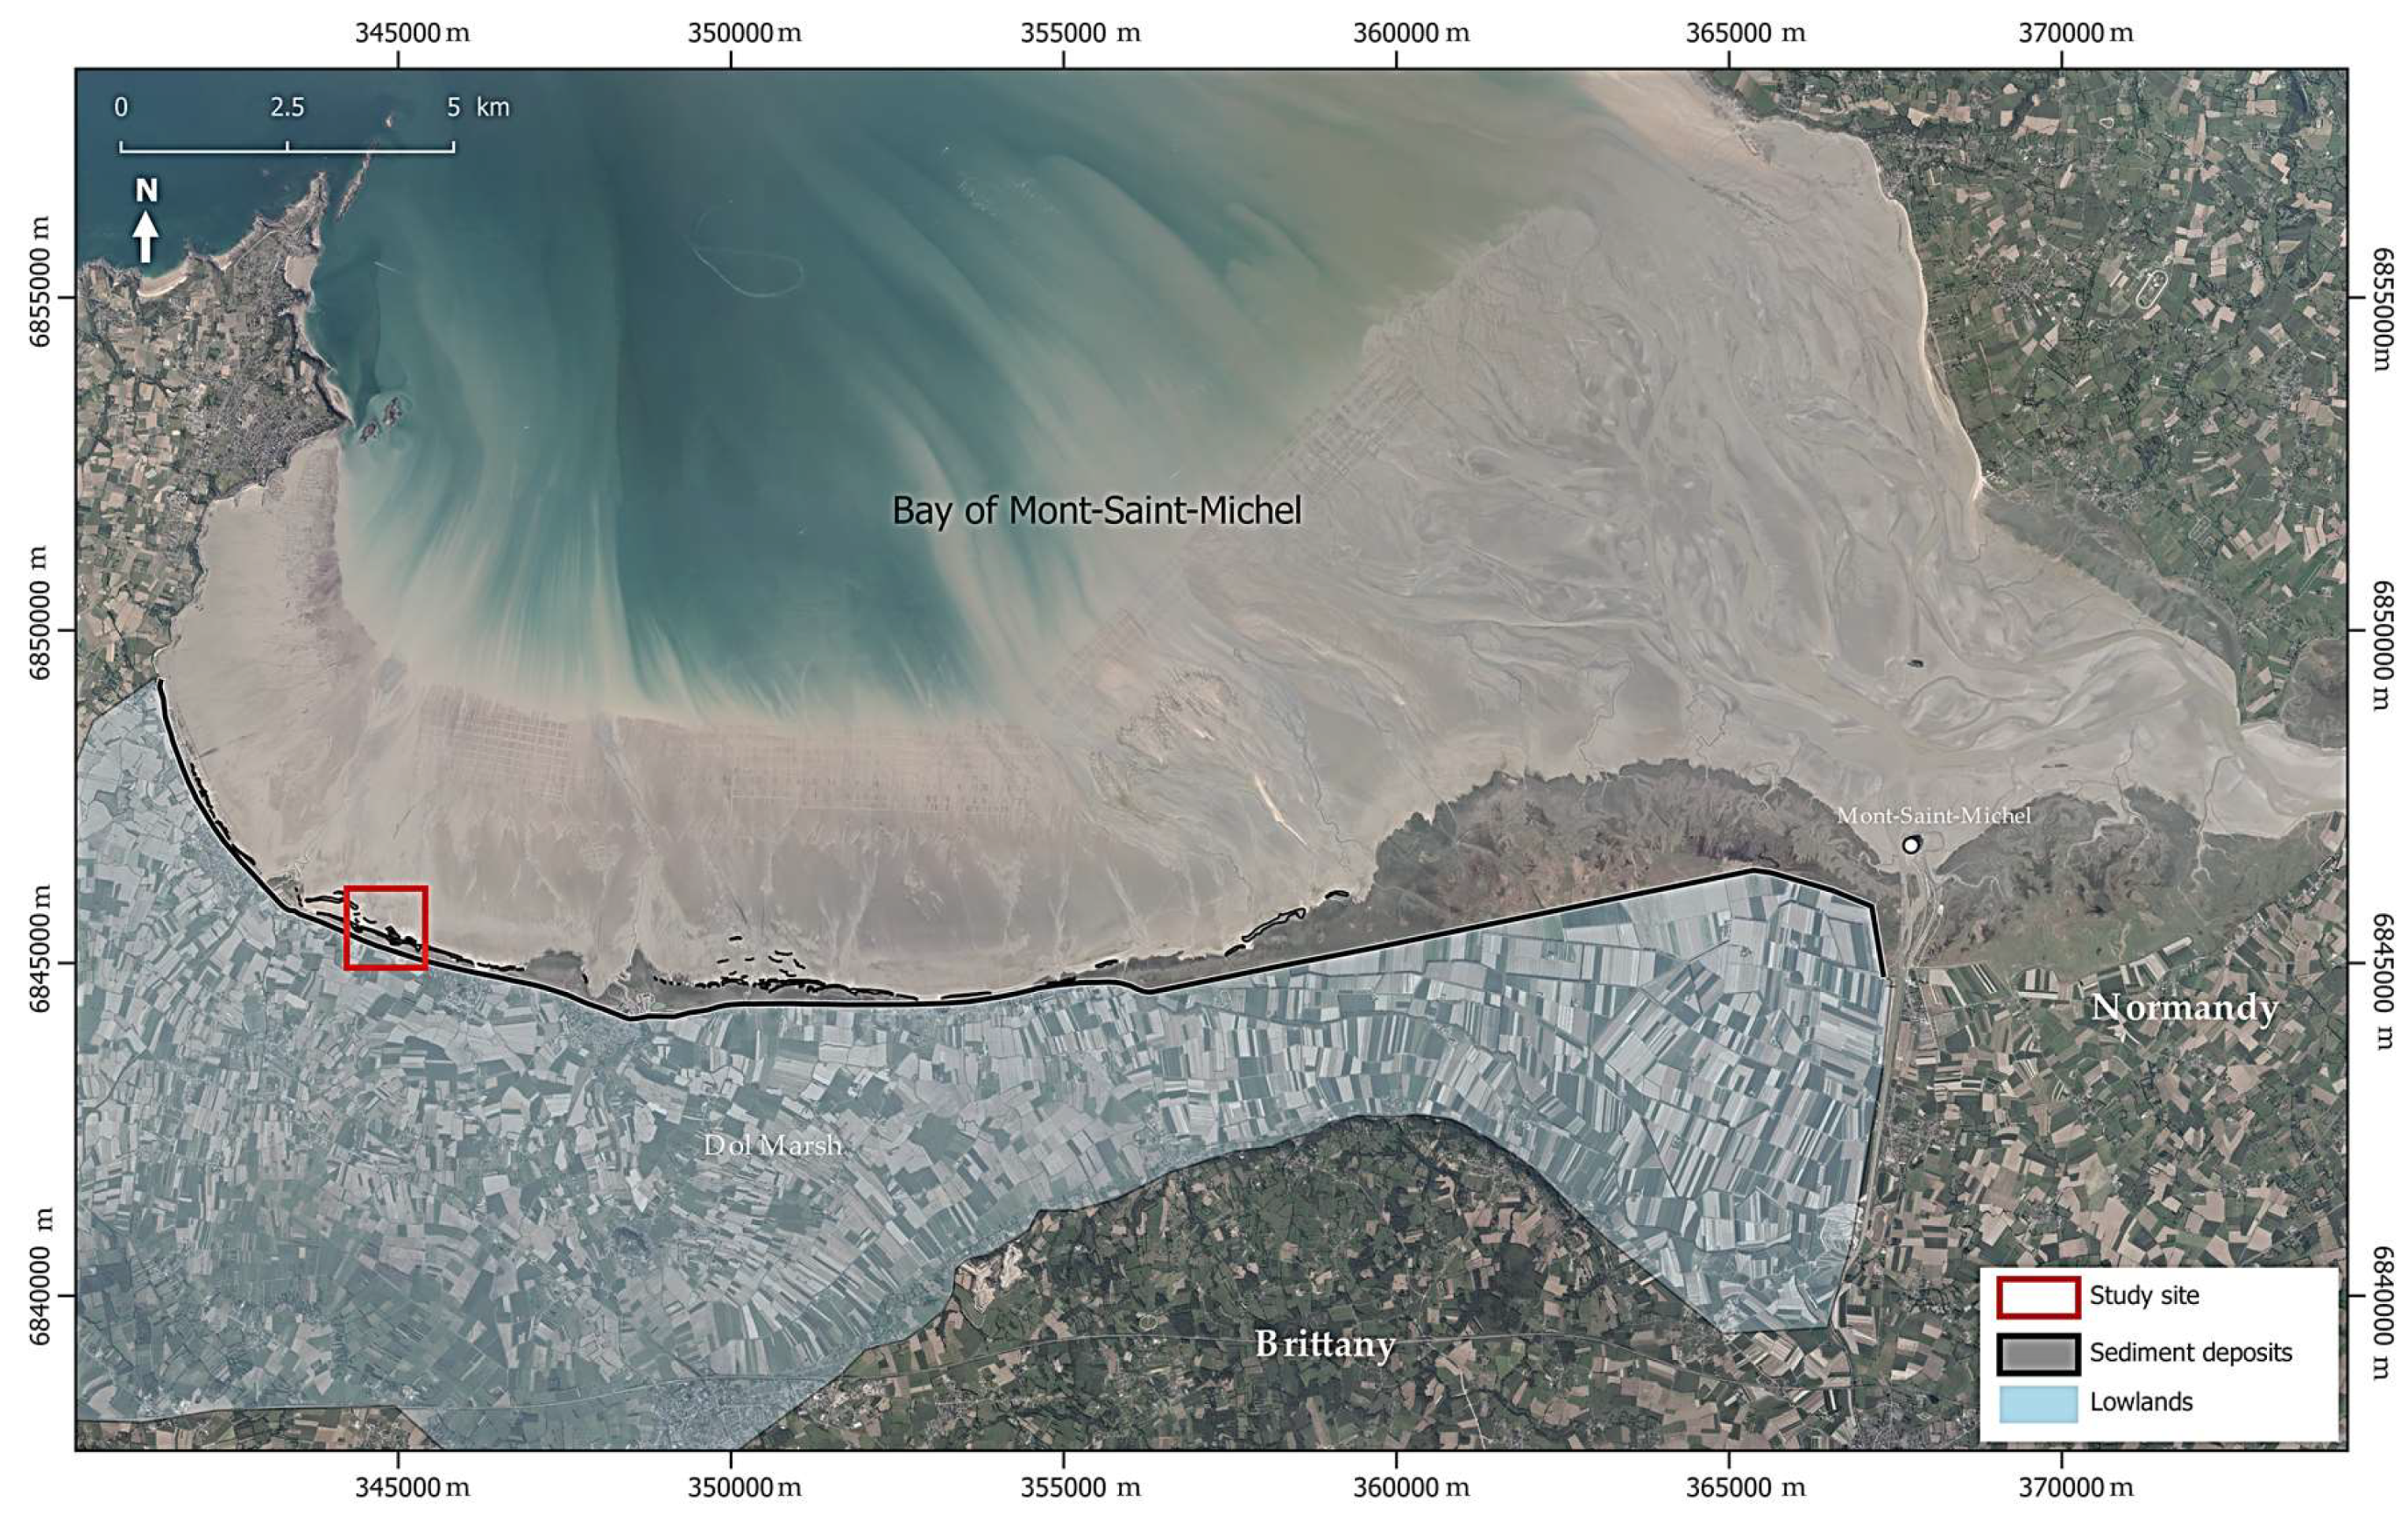
Figure 1. Overview of the study site in the Bay of Mont-Saint-Michel.
Drones 03 00062 g001
Figure 2. Ground control point acquisition using a DGNSS.
Drones 03 00062 g002
Figure 3. Ground control point location on the study site.
Drones 03 00062 g003
Figure 4. Shoreline position tracking derived from UAV imagery in May 2019.
Drones 03 00062 g004
Figure 5. Shoreline position tracking derived from MAV imagery in 2014 (Ortho-littorale v2).
Drones 03 00062 g005
Figure 6. The DEM derived from the UAV drone imagery using the photogrammetry technique with the location of the topographic profiles (elevation datum: RAF09).
Drones 03 00062 g006
Figure 7. The DEM derived from the MAV light detection and ranging (LiDAR) data with the location of the topographic profiles (elevation datum: RAF09).
Drones 03 00062 g007
Figure 8. Topographic profiles extracted from the drone DEM (elevation datum: RAF09). (ad) correspond respectively to the location of topographic profiles presented in Figure 6.
Drones 03 00062 g008
Figure 9. Location of the topographic profiles sliced in the DEM derived from LiDAR data (elevation datum: RAF09). (ad) correspond respectively to the location of topographic profiles presented in Figure 6.
Drones 03 00062 g009
Figure 10. Point cloud achieved using the UAV drone imagery.
Drones 03 00062 g010
Figure 11. Point cloud using the MAV LiDAR data.
Drones 03 00062 g011
Figure 12. Shoreline change measurement derived from the UAV drone orthomosaics between October 2018 and May 2019.
Drones 03 00062 g012
Figure 13. Topographic profiles monitoring between October 2018 and May 2019 extracted from the drone-based DEM, computed using the photogrammetry technique. (ad) correspond respectively to the location of topographic profiles presented in Figure 6.
Drones 03 00062 g013
Figure 14. (a) Drone-based DEM of October 2018, (b) drone-based DEM of May 2019 and (c) difference between them (elevation datum: RAF09).
Drones 03 00062 g014
Figure 15. Synthesis diagram of the advantages and disadvantages of various acquisition methods used for morpho-sedimentary monitoring. The more eccentric the curve is, the better the method is in the concerned criterion.
Drones 03 00062 g015
Table 1. Spatial specifications of several data sources.
Data SourceSpatial Resolution/Point Distance (m)Accuracy (m)
HorizontalVertical
Handborne
DGNSSN/A<0.1<0.1
TachometerN/A<0.1 (under 300 m distance)<0.1 (under 300 m distance)
Airborne (manned aerial vehicle)
Optical imagery>0.2N/AN/A
LiDAR>0.2<0.10.15–0.2
Spaceborne
Landsat 815 (panchromatic)/30 (multispectral)12 (CE90)N/A
SPOT 6–71.5 (panchromatic)/6 (multispectral)10 (CE90)N/A
WorldView-20.46 (panchromatic)/1.84 (multispectral)3.5 (CE90)N/A
WorldView-30.31 (panchromatic)/1.24 (multispectral)3.5 (CE90)N/A
Pleiades-10.5 (panchromatic)/2 (multispectral)3 (CE90)N/A
GeoEye-10.41 (panchromatic)/1.65 (multispectral)5 (CE90)N/A
Table 2. Specifications of the rotary-wing unmanned aerial vehicle (UAV) used.
UAV modelDJI Mavic Pro Platinum
Sensor1/2.3” (CMOS)
No. of pixelTotal pixels: 12.71 MP
Effective pixels: 12.35 MP
LensFOV 78.8°,
Focus: 28 mm (35 mm format equivalent)
Aperture: f/2.2
Flight planning and control softwareDJI GS Pro
Table 3. Specifications of data sources used for comparison.
NameOrtho-littorale v2LiDAR 2018
Type of dataMAV orthomosaicMAV point cloud
Production date20142018
Data producer(s)MEDDE-CEREMASHOM
Spatial resolution0.5 m × 0.5 m<0.20 m
Horizontal accuracy<1.2 m2.0 m
Vertical accuracy-<0.40 m
Table 4. Specifications of the flight plan used.
Flight planning softwareDJI GS Pro
Front overlap ratio60%
Side overlap ratio60%
Height50 m
Gimbal pitch angle−90°
Shutter interval2.0 s
Flying time12 mn
Table 5. Point density comparison between point cloud generated by UAV drone and MAV LiDAR.
Data SourcePoint Density
Min.Max.MeanStd dev.
UAV Drone786.063504.772571.86805.26
MAV LiDAR11.5253.6929.9814.02