Using Object-Oriented Classification for Coastal Management in the East Central Coast of Florida: A Quantitative Comparison between UAV, Satellite, and Aerial Data


Abstract
1. Introduction
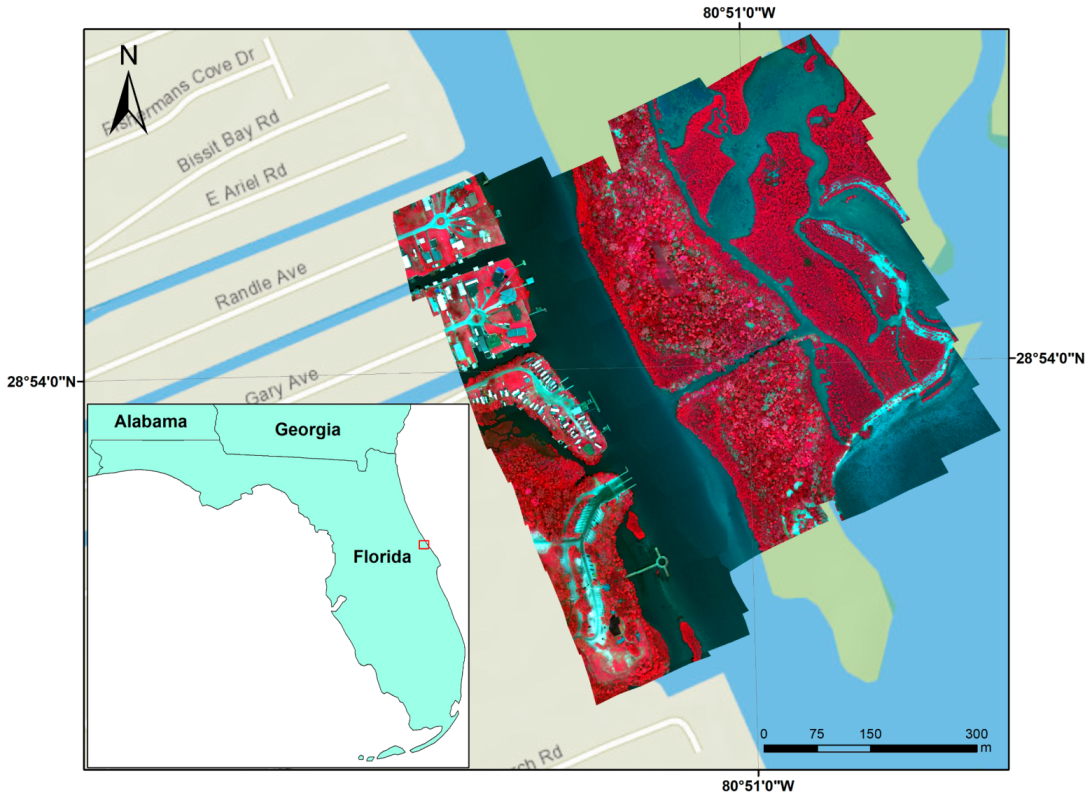
2. Study Area
3. Data and Methods
3.1. Data
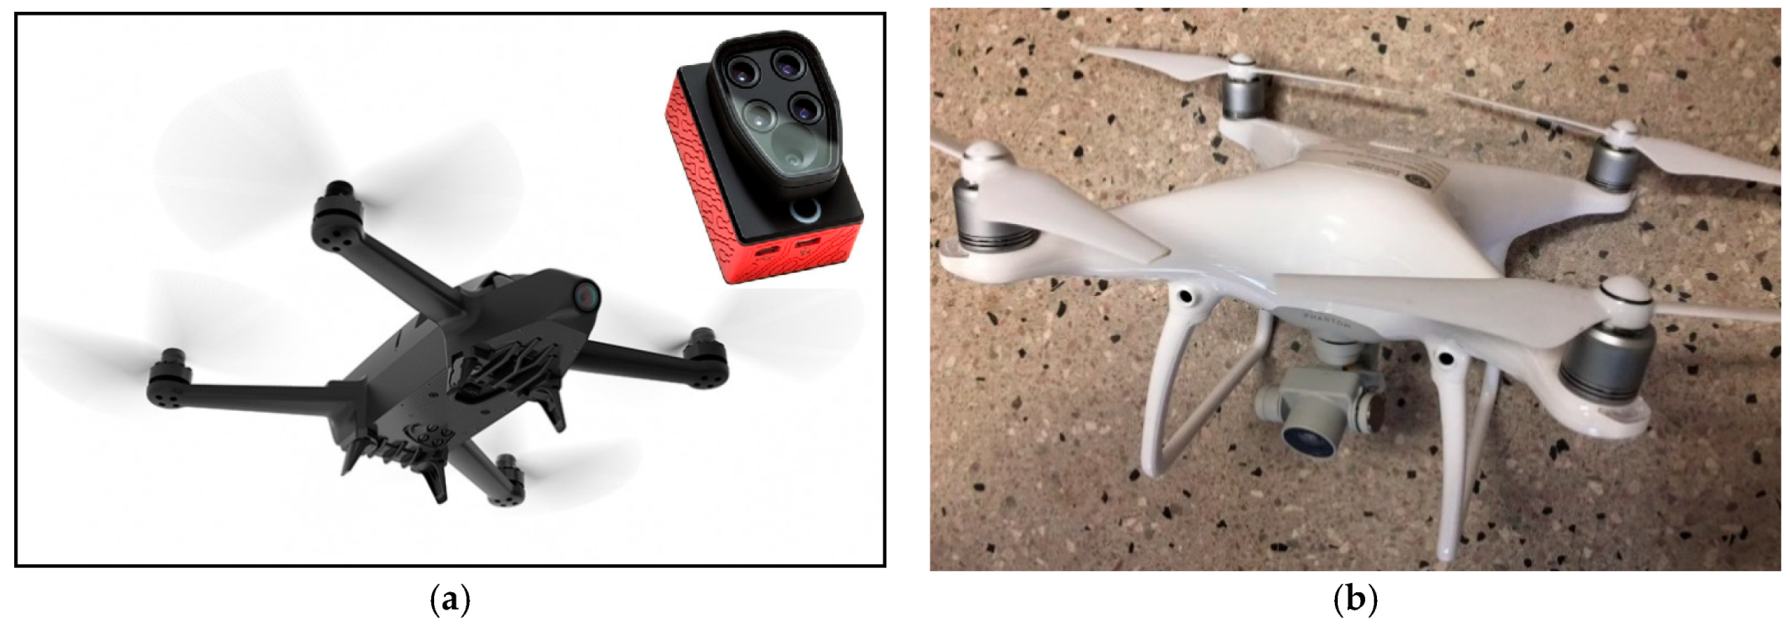
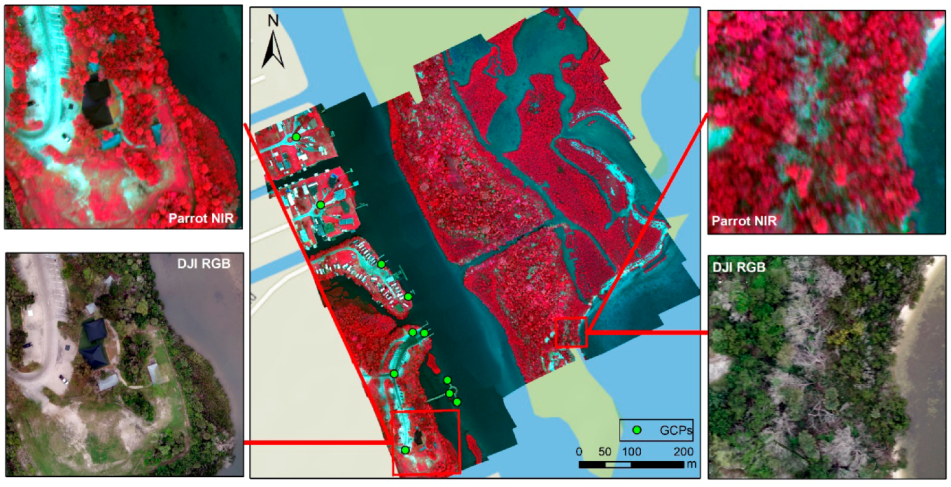
3.1.1. UAV Data Acquisition
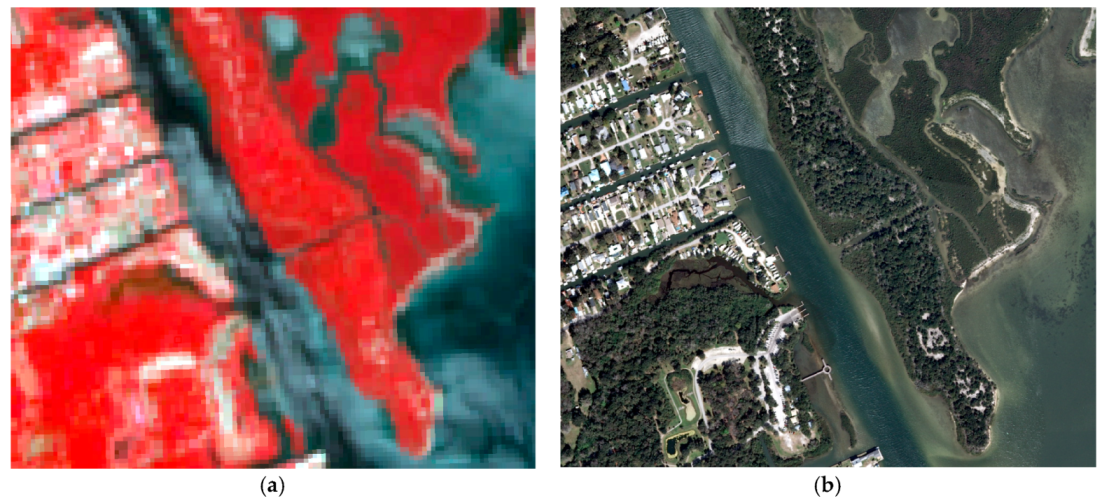
3.1.2. Satellite and Aerial Remote Sensing Data
3.2. Methods
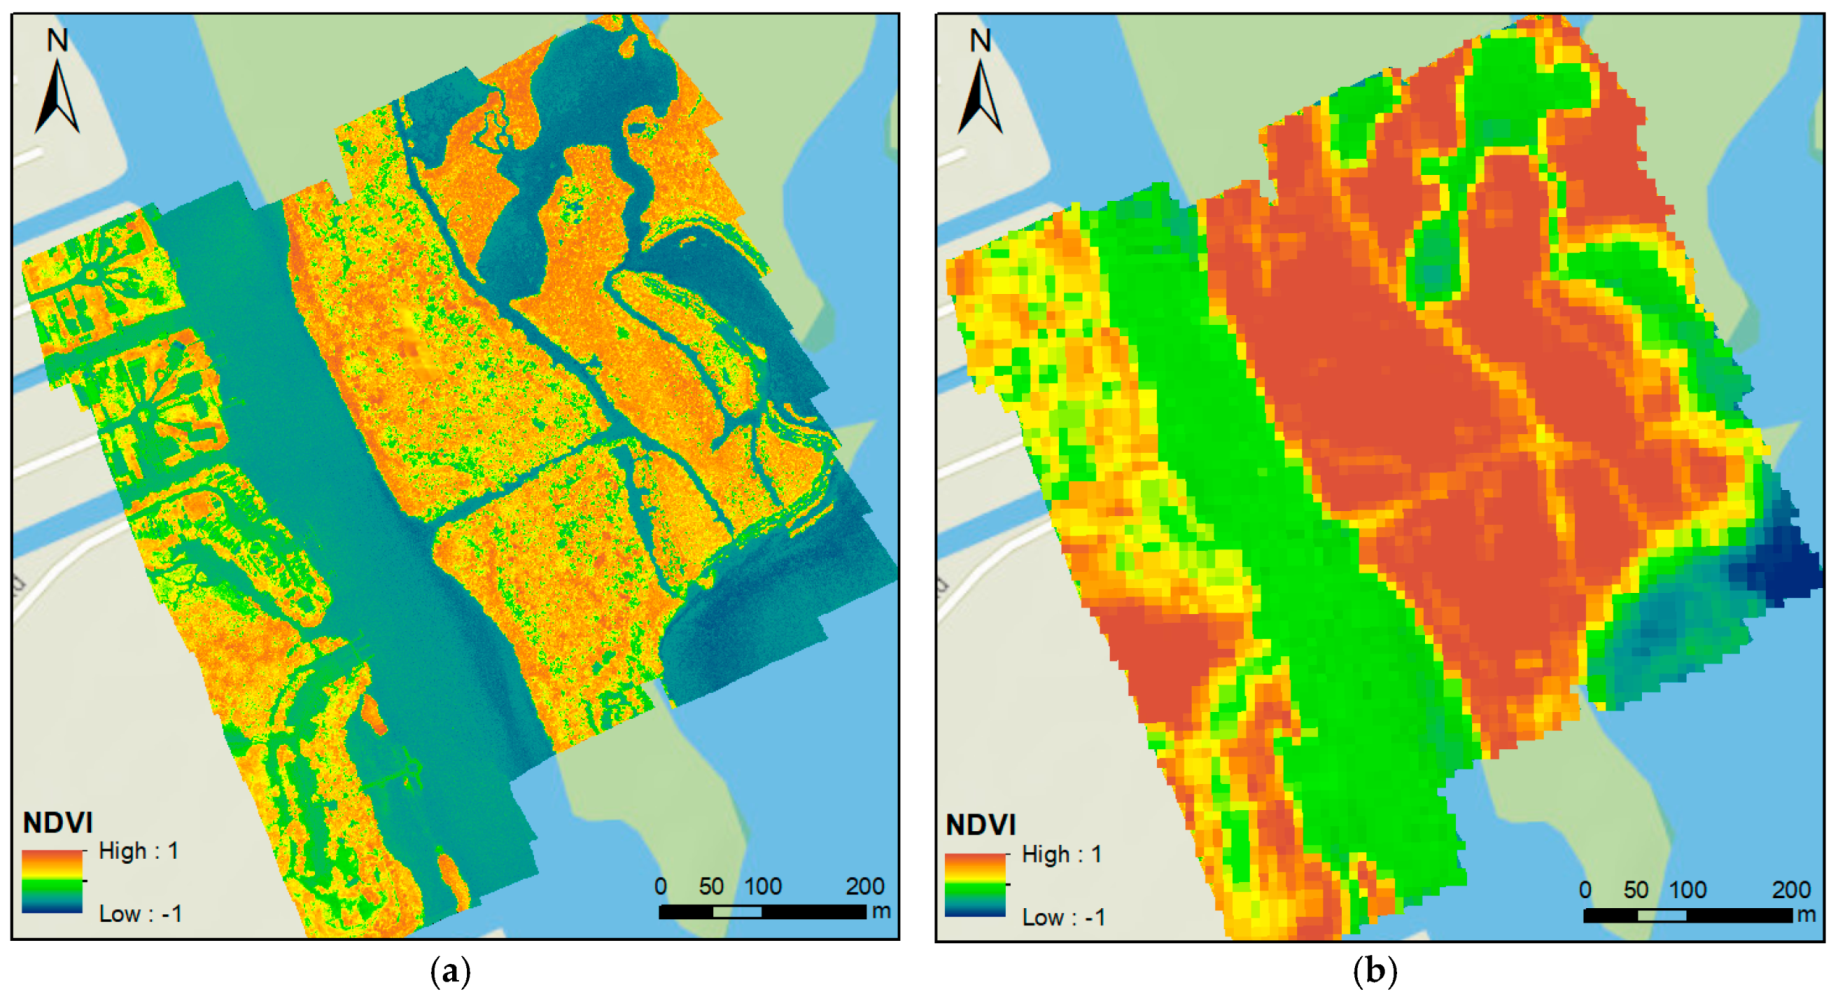
3.2.1. The Use of Vegetation Indices
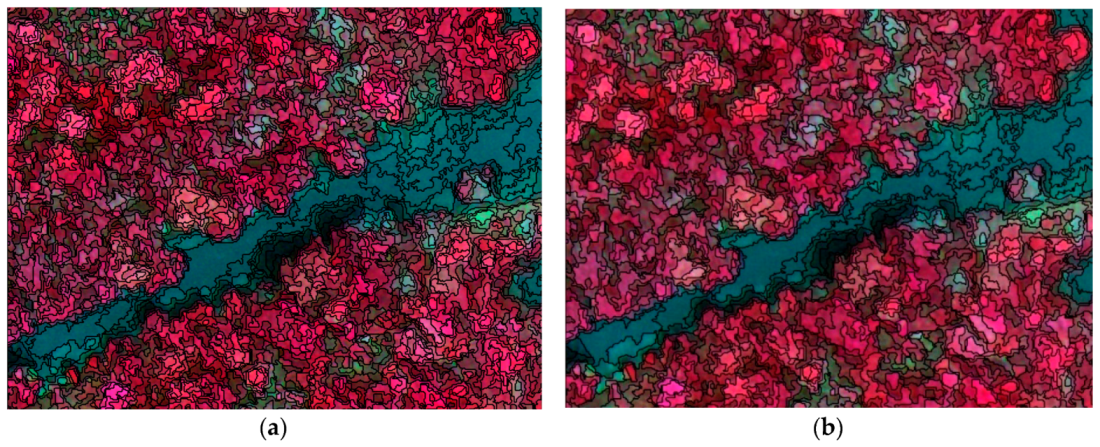
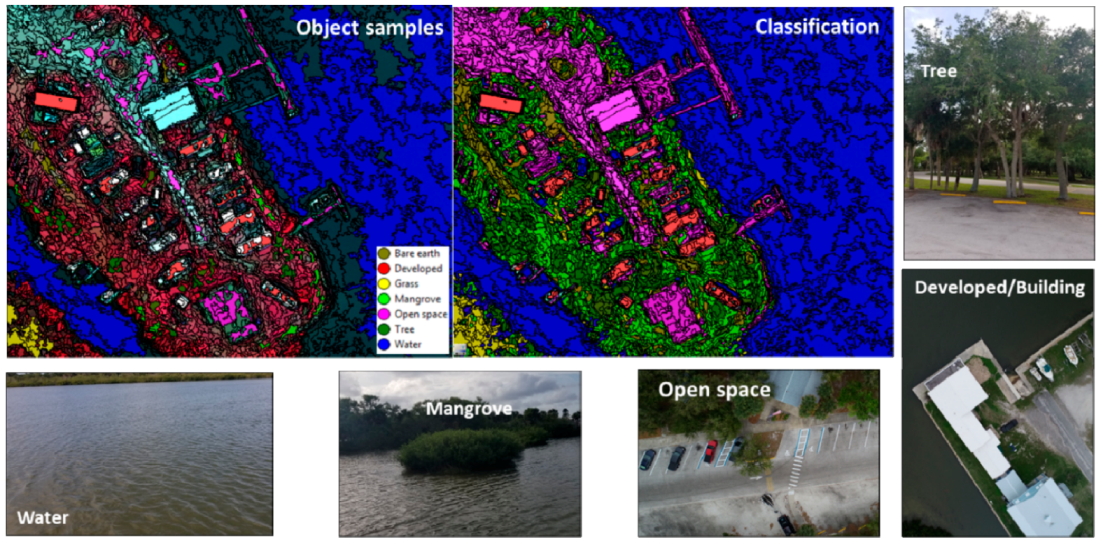
3.2.2. Object-Oriented Classification Method
4. Results
4.1. UAV Mapping Products and Calibration
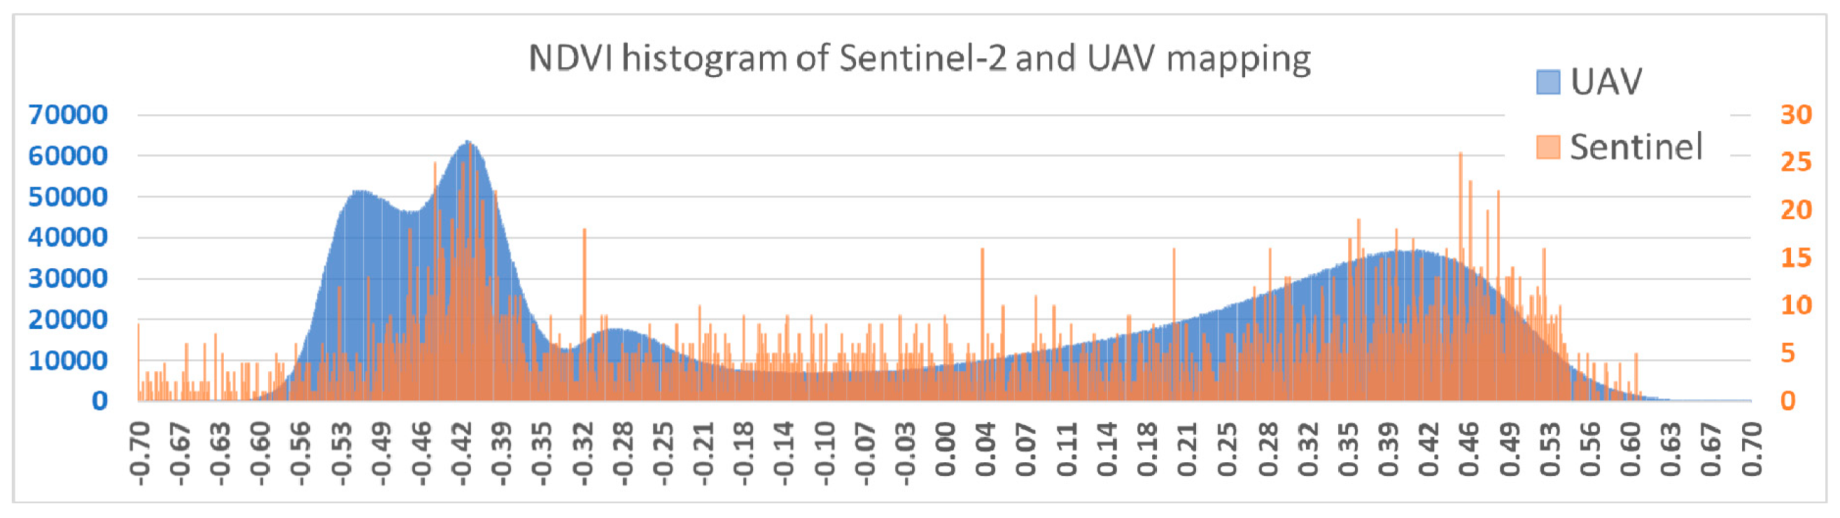
4.2. NDVI Comparison between UAV and Satellite Mapping
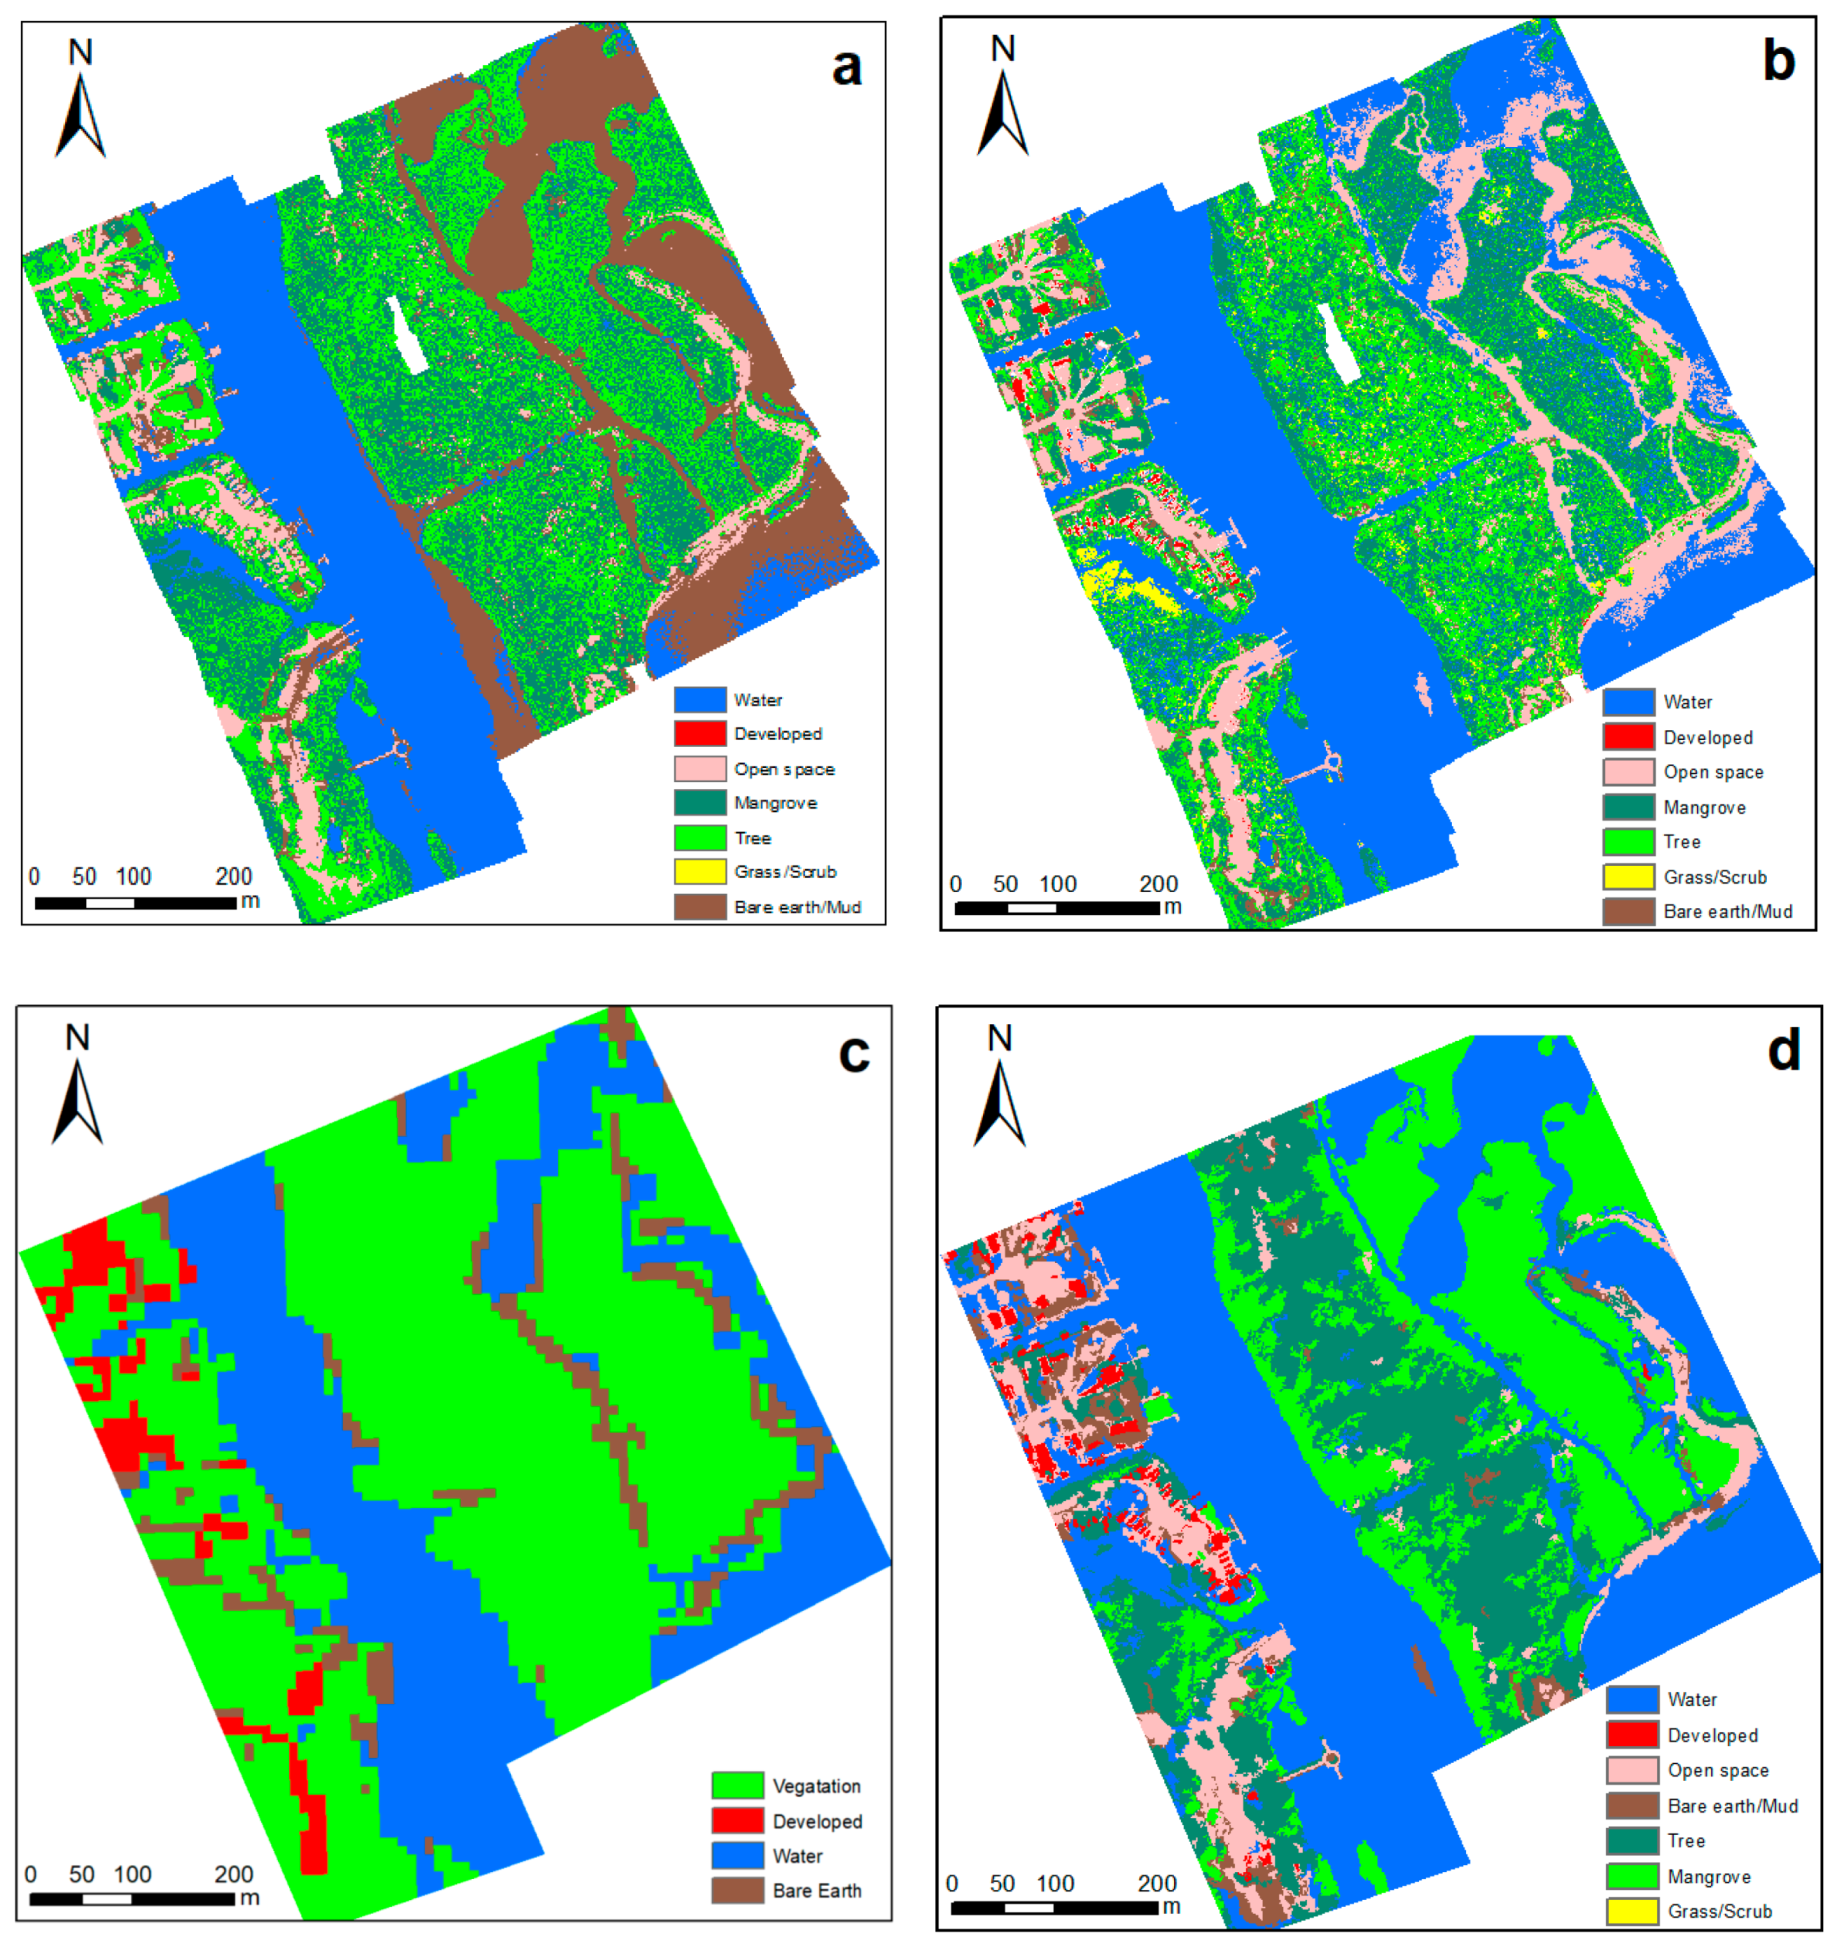
4.3. Comparison of Object-Oriented Classification Results
4.4. Examining the Benefits of Finer Resolution Data
5. Conclusion
Author Contributions
Funding
Acknowledgments
Conflicts of Interest
References
- Pujiono, E.; Kwak, D.-A.; Lee, W.-K.; Kim, S.-R.; Lee, J.Y.; Lee, S.-H.; Park, T.; Kim, M.-I. RGB-NDVI color composites for monitoring the change in mangrove area at the Maubesi Nature Reserve, Indonesia. For. Sci. Technol. 2013, 9, 171–179. [Google Scholar] [CrossRef]
- Zhang, K.; Thapa, B.; Ross, M.; Gann, D. Remote sensing of seasonal changes and disturbances in mangrove forest: A case study from South Florida. Ecosphere 2016, 7, 1–23. [Google Scholar] [CrossRef]
- Pu, R.; Bell, S. A protocol for improving mapping and assessing of seagrass abundance along the West Central Coast of Florida using Landsat TM and EO-1 ALI/Hyperion images. ISPRS J. Photogramm. Remote Sens. 2013, 83, 116–129. [Google Scholar] [CrossRef]
- Tucker, C. Red and photographic infrared linear combinations for monitoring vegetation. Remote Sens. Environ. 1979, 8, 127–150. [Google Scholar] [CrossRef]
- Kerr, J.T.; Ostrovsky, M. From space to species: Ecological applications for remote sensing. Trends Ecol. Evolut. 2003, 18, 299–305. [Google Scholar] [CrossRef]
- Colomina, I.; Molina, P. Unmanned aerial systems for photogrammetry and remote sensing: A review. ISPRS J. Photogramm. Remote Sens. 2014, 92, 79–97. [Google Scholar] [CrossRef]
- Wyngaard, J.; Barbieri, L.; Thomer, A.; Adams, J.; Sullivan, D.; Parr, C.; Raj Shrestha, S.; Crosby, C.; Klump, J.; Bell, T. Emergent Challenges for Science Suas Data Management: Fairness through Community Engagement and Best Practices Development. Preprints 2019, 2019050274. [Google Scholar] [CrossRef]
- Guo, M.; Li, J.; Sheng, C.; Xu, J.; Wu, L. A review of wetland remote sensing. Sensors 2017, 17, 777. [Google Scholar] [CrossRef]
- Klemas, V.V. Coastal and environmental remote sensing from unmanned aerial vehicles: An overview. J. Coast. Res. 2015, 315, 1260–1267. [Google Scholar] [CrossRef]
- Lottes, P.; Khanna, R.; Pfeifer, J.; Siegwart, R.; Stachniss, C. UAV-based crop and weed classification for smart farming. In Proceedings of the 2017 IEEE International Conference on Robotics and Automation (ICRA), Singapore, 29 May–3 June 2017; IEEE: Piscataway, NJ, USA, 2017; pp. 3024–3031. [Google Scholar]
- Cruzan, M.B.; Weinstein, B.G.; Grasty, M.R.; Kohrn, B.F.; Hendrickson, E.C.; Arredondo, T.M.; Thompson, P.G. Small unmanned aerial vehicleS (micro-uavS, droneS) in plant ecology. Appl. Plant Sci. 2016, 4, 1600041. [Google Scholar] [CrossRef]
- Mitchell, J.J.; Glenn, N.F.; Anderson, M.O.; Hruska, R.C.; Halford, A.; Baun, C.; Nydegger, N. Unmanned aerial vehicle (UAV) hyperspectral remote sensing for dryland vegetation monitoring. In Proceedings of the 2012 4th Workshop on Hyperspectral Image and Signal Processing (WHISPERS), 4–7 June 2012; IEEE: Shanghai, China, 2012; pp. 1–10. [Google Scholar]
- Uto, K.; Seki, H.; Saito, G.; Kosugi, Y. Characterization of rice paddies by a UAV-Mounted miniature Hyperspectral sensor system. IEEE J. Sel. Top. Appl. Earth Obs. Remote Sens. 2013, 6, 851–860. [Google Scholar] [CrossRef]
- Cao, J.; Leng, W.; Liu, K.; Liu, L.; He, Z.; Zhu, Y. Object-Based mangrove species classification using unmanned aerial vehicle hyperspectral images and digital surface models. Remote Sens. 2018, 10, 89. [Google Scholar] [CrossRef]
- Berni, J.A.J.; Zarco-Tejada, P.J.; Suárez, L.; González-Dugo, V.; Fereres, E. Remote sensing of vegetation from UAV platforms using lightweight multispectral and thermal imaging sensors. Int. Arch. Photogramm. Remote Sens. Spat. Inform. Sci. 2009, 38, 6. [Google Scholar]
- Zarco-Tejada, P.J.; González-Dugo, V.; Berni, J.A.J. Fluorescence, temperature and narrow-band indices acquired from a UAV platform for water stress detection using a micro-hyperspectral imager and a thermal camera. Remote Sens. Environ. 2012, 117, 322–337. [Google Scholar] [CrossRef]
- Harvey, M.C.; Pearson, S.; Alexander, K.B.; Rowland, J.; White, P. Unmanned aerial vehicles (UAV) for cost effective aerial orthophotos and digital surface models (DSMs). In Proceedings of the 2014 New Zealand Geothermal Workshop, Auckland, New Zealand, 24–26 November 2014. [Google Scholar]
- Rock, G.; Ries, J.; Udelhoven, T. Sensitivity analysis of UAV-photogrammetry for creating digital elevation models (DEM). In Proceedings of the Conference on Unmanned Aerial Vehicle in Geomatics, Zurich, Switzerland, 14–16 September 2011. [Google Scholar]
- Uysal, M.; Toprak, A.; Polat, N. DEM generation with UAV Photogrammetry and accuracy analysis in Sahitler hill. Measurement 2015, 73, 539–543. [Google Scholar] [CrossRef]
- Liu, H. Algorithmic foundation and software tools for extracting shoreline features from remote sensing imagery and LiDAR data. J. Geogr. Inf. Syst. 2011, 03, 99–119. [Google Scholar] [CrossRef]
- Brockmeyer, R.; Rey, J.; Virnstein, R.; Gihnore, R. Rehabilitation of impounded estuarine wetlands by hydrologic reconnection to the Indian River Lagoon, Florida (USA). Wetl. Ecol. Manag. 1996, 4, 93–109. [Google Scholar] [CrossRef]
- Virnstein, R.W. Seagrass landscape diversity in the Indian River Lagoon, Florida: The importance of geographic scale and pattern. Bull. Mar. Sci. 1995, 57, 67–74. [Google Scholar]
- Stroppiana, D.; Migliazzi, M.; Chiarabini, V.; Crema, A.; Musanti, M.; Franchino, C.; Villa, P. Rice yield estimation using multispectral data from UAV: A preliminary experiment in northern Italy. In Proceedings of the 2015 IEEE International Geoscience and Remote Sensing Symposium (IGARSS), 26–31 July 2015; IEEE: Milan, Italy, 2015; pp. 4664–4667. [Google Scholar]
- Themistocleous, K. The use of UAV platforms for remote sensing applications: Case studies in Cyprus. In Proceedings of the Second International Conference on Remote Sensing and Geoinformation of the Environment (RSCy2014), 12 August 2014. [Google Scholar]
- Xu, M.; Liu, H.; Beck, R.; Lekki, J.; Yang, B.; Shu, S.; Liu, Y.; Benko, T.; Anderson, R.; Tokars, R.; et al. Regionally and Locally Adaptive Models for Retrieving Chlorophyll-a Concentration in Inland Waters From Remotely Sensed Multispectral and Hyperspectral Imagery. IEEE Trans. Geosci. Remote Sens. 2019, 57, 4758–4774. [Google Scholar] [CrossRef]
- Toming, K.; Kutser, T.; Laas, A.; Sepp, M.; Paavel, B.; Nõges, T. Undefined First experiences in mapping lake water quality parameters with Sentinel-2 MSI imagery. Remote Sens. 2016, 8, 640. [Google Scholar] [CrossRef]
- Chen, J.; Zhu, W.; Tian, Y.Q.; Yu, Q.; Zheng, Y.; Huang, L. Remote estimation of colored dissolved organic matter and chlorophyll-a in Lake Huron using Sentinel-2 measurements. J. Appl. Remote Sens. 2017, 11, 1. [Google Scholar] [CrossRef]
- Rouse, J.W., Jr.; Haas, R.H.; Schell, J.A.; Deering, D.W. Monitoring the Vernal Advancement and Retrogradation (Green Wave Effect) of Natural Vegetation; NASA: Washington, DC, USA, 27 May 1974.
- Zhou, Y.; Michalak, A.M. Characterizing attribute distributions in water sediments by geostatistical downscaling. Environ. Sci. Technol. 2009, 43, 9267–9273. [Google Scholar] [CrossRef] [PubMed][Green Version]
- Jacquin, A.; Misakova, L.; Gay, M. A hybrid object-based classification approach for mapping urban sprawl in periurban environment. Landsc. Urb. Plan. 2008, 84, 152–165. [Google Scholar] [CrossRef]
- Li, C.; Wang, J.; Wang, L.; Hu, L.; Gong, P. Comparison of classification algorithms and training sample sizes in urban land classification with landsat thematic mapper imagery. Remote Sens. 2014, 6, 964–983. [Google Scholar] [CrossRef]
- Benz, U.C.; Hofmann, P.; Willhauck, G.; Lingenfelder, I.; Heynen, M. Multi-resolution, object-oriented fuzzy analysis of remote sensing data for GIS-ready information. ISPRS J. Photogramm. Remote Sens. 2004, 58, 239–258. [Google Scholar] [CrossRef]
- Liu, H.; Wang, L.; Sherman, D.; Gao, Y.; Wu, Q. An object-based conceptual framework and computational method for representing and analyzing coastal morphological changes. Int. J. Geogr. Inf. Sci. 2010, 24, 1015–1041. [Google Scholar] [CrossRef]
- Zhang, Q.; Liu, C.; Zhang, G.; Zhou, A. Adaptive image segmentation by using mean-shift and evolutionary optimisation. IET Image Process. 2014, 8, 327–333. [Google Scholar]
- Wang, R.; Wan, B.; Guo, Q.; Hu, M.; Zhou, S. Mapping regional urban extent using NPP-VIIRS DNB and MODIS NDVI data. Remote Sens. 2017, 9, 862. [Google Scholar] [CrossRef]
- Makkeasorn, A.; Chang, N.-B.; Li, J. Seasonal change detection of riparian zones with remote sensing images and genetic programming in a semi-arid watershed. J. Environ. Manag. 2009, 90, 1069–1080. [Google Scholar] [CrossRef]
- Stehman, S.V. Selecting and interpreting measures of thematic classification accuracy. Remote Sens. Environ. 1997, 62, 77–89. [Google Scholar] [CrossRef]
- Pontius, R.G.; Cornell, J.D.; Hall, C.A. Modeling the spatial pattern of land-use change with GEOMOD2: Application and validation for Costa Rica. Agric. Ecosyst. Environ. 2001, 85, 191–203. [Google Scholar] [CrossRef]
- Ben-David, A. Comparison of classification accuracy using Cohen’s Weighted Kappa. Expert Syst. Appl. 2008, 34, 825–832. [Google Scholar] [CrossRef]
- Cohen, J. A Coefficient of Agreement for Nominal Scales. Educ. Psychol. Meas. 1960, 20, 37–46. [Google Scholar] [CrossRef]
- Fleiss, J.L.; Cohen, J.; Everitt, B.S. Large sample standard errors of kappa and weighted kappa. Psychol. Bull. 1969, 72, 323. [Google Scholar] [CrossRef]
- McEvoy, J.F.; Hall, G.P.; McDonald, P.G. Evaluation of unmanned aerial vehicle shape, flight path and camera type for waterfowl surveys: Disturbance effects and species recognition. PeerJ 2016, 4, e1831. [Google Scholar] [CrossRef]


© 2019 by the authors. Licensee MDPI, Basel, Switzerland. This article is an open access article distributed under the terms and conditions of the Creative Commons Attribution (CC BY) license (http://creativecommons.org/licenses/by/4.0/).
Share and Cite
Yang, B.; Hawthorne, T.L.; Torres, H.; Feinman, M. Using Object-Oriented Classification for Coastal Management in the East Central Coast of Florida: A Quantitative Comparison between UAV, Satellite, and Aerial Data. Drones 2019, 3, 60. https://doi.org/10.3390/drones3030060
Yang B, Hawthorne TL, Torres H, Feinman M. Using Object-Oriented Classification for Coastal Management in the East Central Coast of Florida: A Quantitative Comparison between UAV, Satellite, and Aerial Data. Drones. 2019; 3(3):60. https://doi.org/10.3390/drones3030060
Chicago/Turabian StyleYang, Bo, Timothy L. Hawthorne, Hannah Torres, and Michael Feinman. 2019. "Using Object-Oriented Classification for Coastal Management in the East Central Coast of Florida: A Quantitative Comparison between UAV, Satellite, and Aerial Data" Drones 3, no. 3: 60. https://doi.org/10.3390/drones3030060
APA StyleYang, B., Hawthorne, T. L., Torres, H., & Feinman, M. (2019). Using Object-Oriented Classification for Coastal Management in the East Central Coast of Florida: A Quantitative Comparison between UAV, Satellite, and Aerial Data. Drones, 3(3), 60. https://doi.org/10.3390/drones3030060