Article

A UAV-Based Sensor System for Measuring Land Surface Albedo: Tested over a Boreal Peatland Ecosystem

1
Canada Center for Remote Sensing, Natural Resources Canada, Ottawa, ON K1S 5K2, Canada
2
University of Toronto, Department of Geography, Toronto, ON M5S 3G3, Canada
3
Geology Survey of Canada, Natural Resources Canada, Ottawa, ON K1A 0E8, Canada
*
Authors to whom correspondence should be addressed.
Drones 2019, 3(1), 27; https://doi.org/10.3390/drones3010027
Submission received: 22 February 2019 / Revised: 4 March 2019 / Accepted: 12 March 2019 / Published: 16 March 2019
(This article belongs to the Special Issue Drones for Biodiversity Conservation and Ecological Monitoring)

Abstract

:
A multiple sensor payload for a multi-rotor based UAV platform was developed and tested for measuring land surface albedo and spectral measurements at user-defined spatial, temporal, and spectral resolutions. The system includes a Matrice 600 UAV with an RGB camera and a set of four downward pointing radiation sensors including a pyranometer, quantum sensor, and VIS and NIR spectrometers, measuring surface reflected radiation. A companion ground unit consisting of a second set of identical sensors simultaneously measure downwelling radiation. The reflected and downwelling radiation measured by the four sensors are used for calculating albedo for the total shortwave broadband, visible band and any narrowband at a 1.5 nm spectral resolution within the range of 350–1100 nm. The UAV-derived albedo was compared with those derived from Landsat 8 and Sentinel-2 satellite observations. Results show the agreement between total shortwave albedo from UAV pyranometer and Landsat 8 (R2 = 0.73) and Sentinel-2 (R2 = 0.68). Further, total shortwave albedo was estimated from spectral measurements and compared with the satellite-derived albedo. This UAV-based sensor system promises to provide high-resolution multi-sensors data acquisition. It also provides maximal flexibility for data collection at low cost with minimal atmosphere influence, minimal site disturbance, flexibility in measurement planning, and ease of access to study sites (e.g., wetlands) in contrast with traditional data collection methods.

1. Introduction

Surface albedo, the fraction of the incident solar radiation that the surface reflects, controls the radiation absorption and microclimate conditions of soil and vegetation canopies, which affect physical, physiological, and biogeochemical processes such as evapotranspiration and ecosystem carbon cycle [1,2]. Albedo of vegetated land surfaces vary largely because of the seasonal changes of the land surface conditions and persistence changes of land use and land cover. Plant phenological cycles, including leaf growth and leaf fall, and temporal variations in foliar water and chlorophyll content control leaf optical characteristics modify the seasonal distribution of surface albedo [3,4,5,6]. Further, seasonal variations in snow cover cause large variations in surface albedo [7]. Clear-sky days tend to have lower surface albedo values than cloudy days in winter [8]. These changes can result in dynamic effects in surface albedo and ultimately ecological processes.
There are several operational surface albedo products from satellite remote sensing with spatial resolution ranging from approximately 0.5–25 km and temporal frequencies of daily to monthly [9]. Most notably these products include Moderate Resolution Imaging Spectroradiometer [10], Advanced Very High Resolution Radiometer [11], Polarization and Directionality of the Earth Reflectance [12] and Meteosat [13]. However, coarse resolution products are not detailed enough for studying ecological processes in small dynamic ecosystems such as wetlands. Retrieving surface albedo from high spatial resolution remotely sensed data (e.g., Landsat 8 and Sentinel-2) is methodologically challenging, in part because of the narrow angular sampling and the incomplete spectral sampling from a limited number of wavebands [2] and demands in-situ calibration and validation datasets. In-situ albedo measurements have long been using sensors mounted on research towers. These measurements, though, demand a high logistical requirement and only a few surfaces can be characterized and measured [2]. In order to account for a wide range of surface cover types, aerial based sensor system can play an important role in measuring surface albedo. Measurements from unmanned aerial platforms effectively bridges the observational scale between point-based tower measurements and satellite imageries [14].
Unmanned aircraft systems (UAS) are small planes capable of carrying small-sized sensors [15] and [14,16] use UAS mounted spectrometers or cameras to measure reflectance, which is used to calculate surface albedo or compare to MODIS products. The deployment of multi-rotor based UAV systems for remote sensing applications has been made possible by the miniaturization of technology, including accurate GPS systems, accelerometers, flight control systems and very light weight sensors [17]. To-date the emerging UAV technology has had only a few studies using UAVs to estimate surface albedo [14,16,18]. This paper describes multi-rotor based UAV system integrated with multiple small sensors, which are available in the market. The relatively low-cost UAV system carries multiple sensors that provide land surface parameters such as land cover, vegetation structure, total shortwave albedo, visible albedo, hyperspectral reflectance and vegetation indices at a particular time in different spatial sampling. System can acquire measurements over an area with multiple measurements that are comparable to the pixel size of high-resolution remote sensing (Landsat 8 and Sentinel-2) derived products. In order to demonstrate its capabilities, test albedo measurements were made in a protected wetland region where access is limited to study the local-scale variations in tandem with a ground based upward looking system and compared with the satellite derived albedo estimates of Landsat 8 and Sentinel-2. The comparison provides the necessary data for understanding the consistency between sensor measurements and satellite based estimates. This UAV system can help to recommend the in-situ albedo measurement protocol, which includes environmental conditions, viewing geometry, illumination geometry, properties of the target, measurement timing, instrument calibration and experimental design, for different land covers.

2. System Development

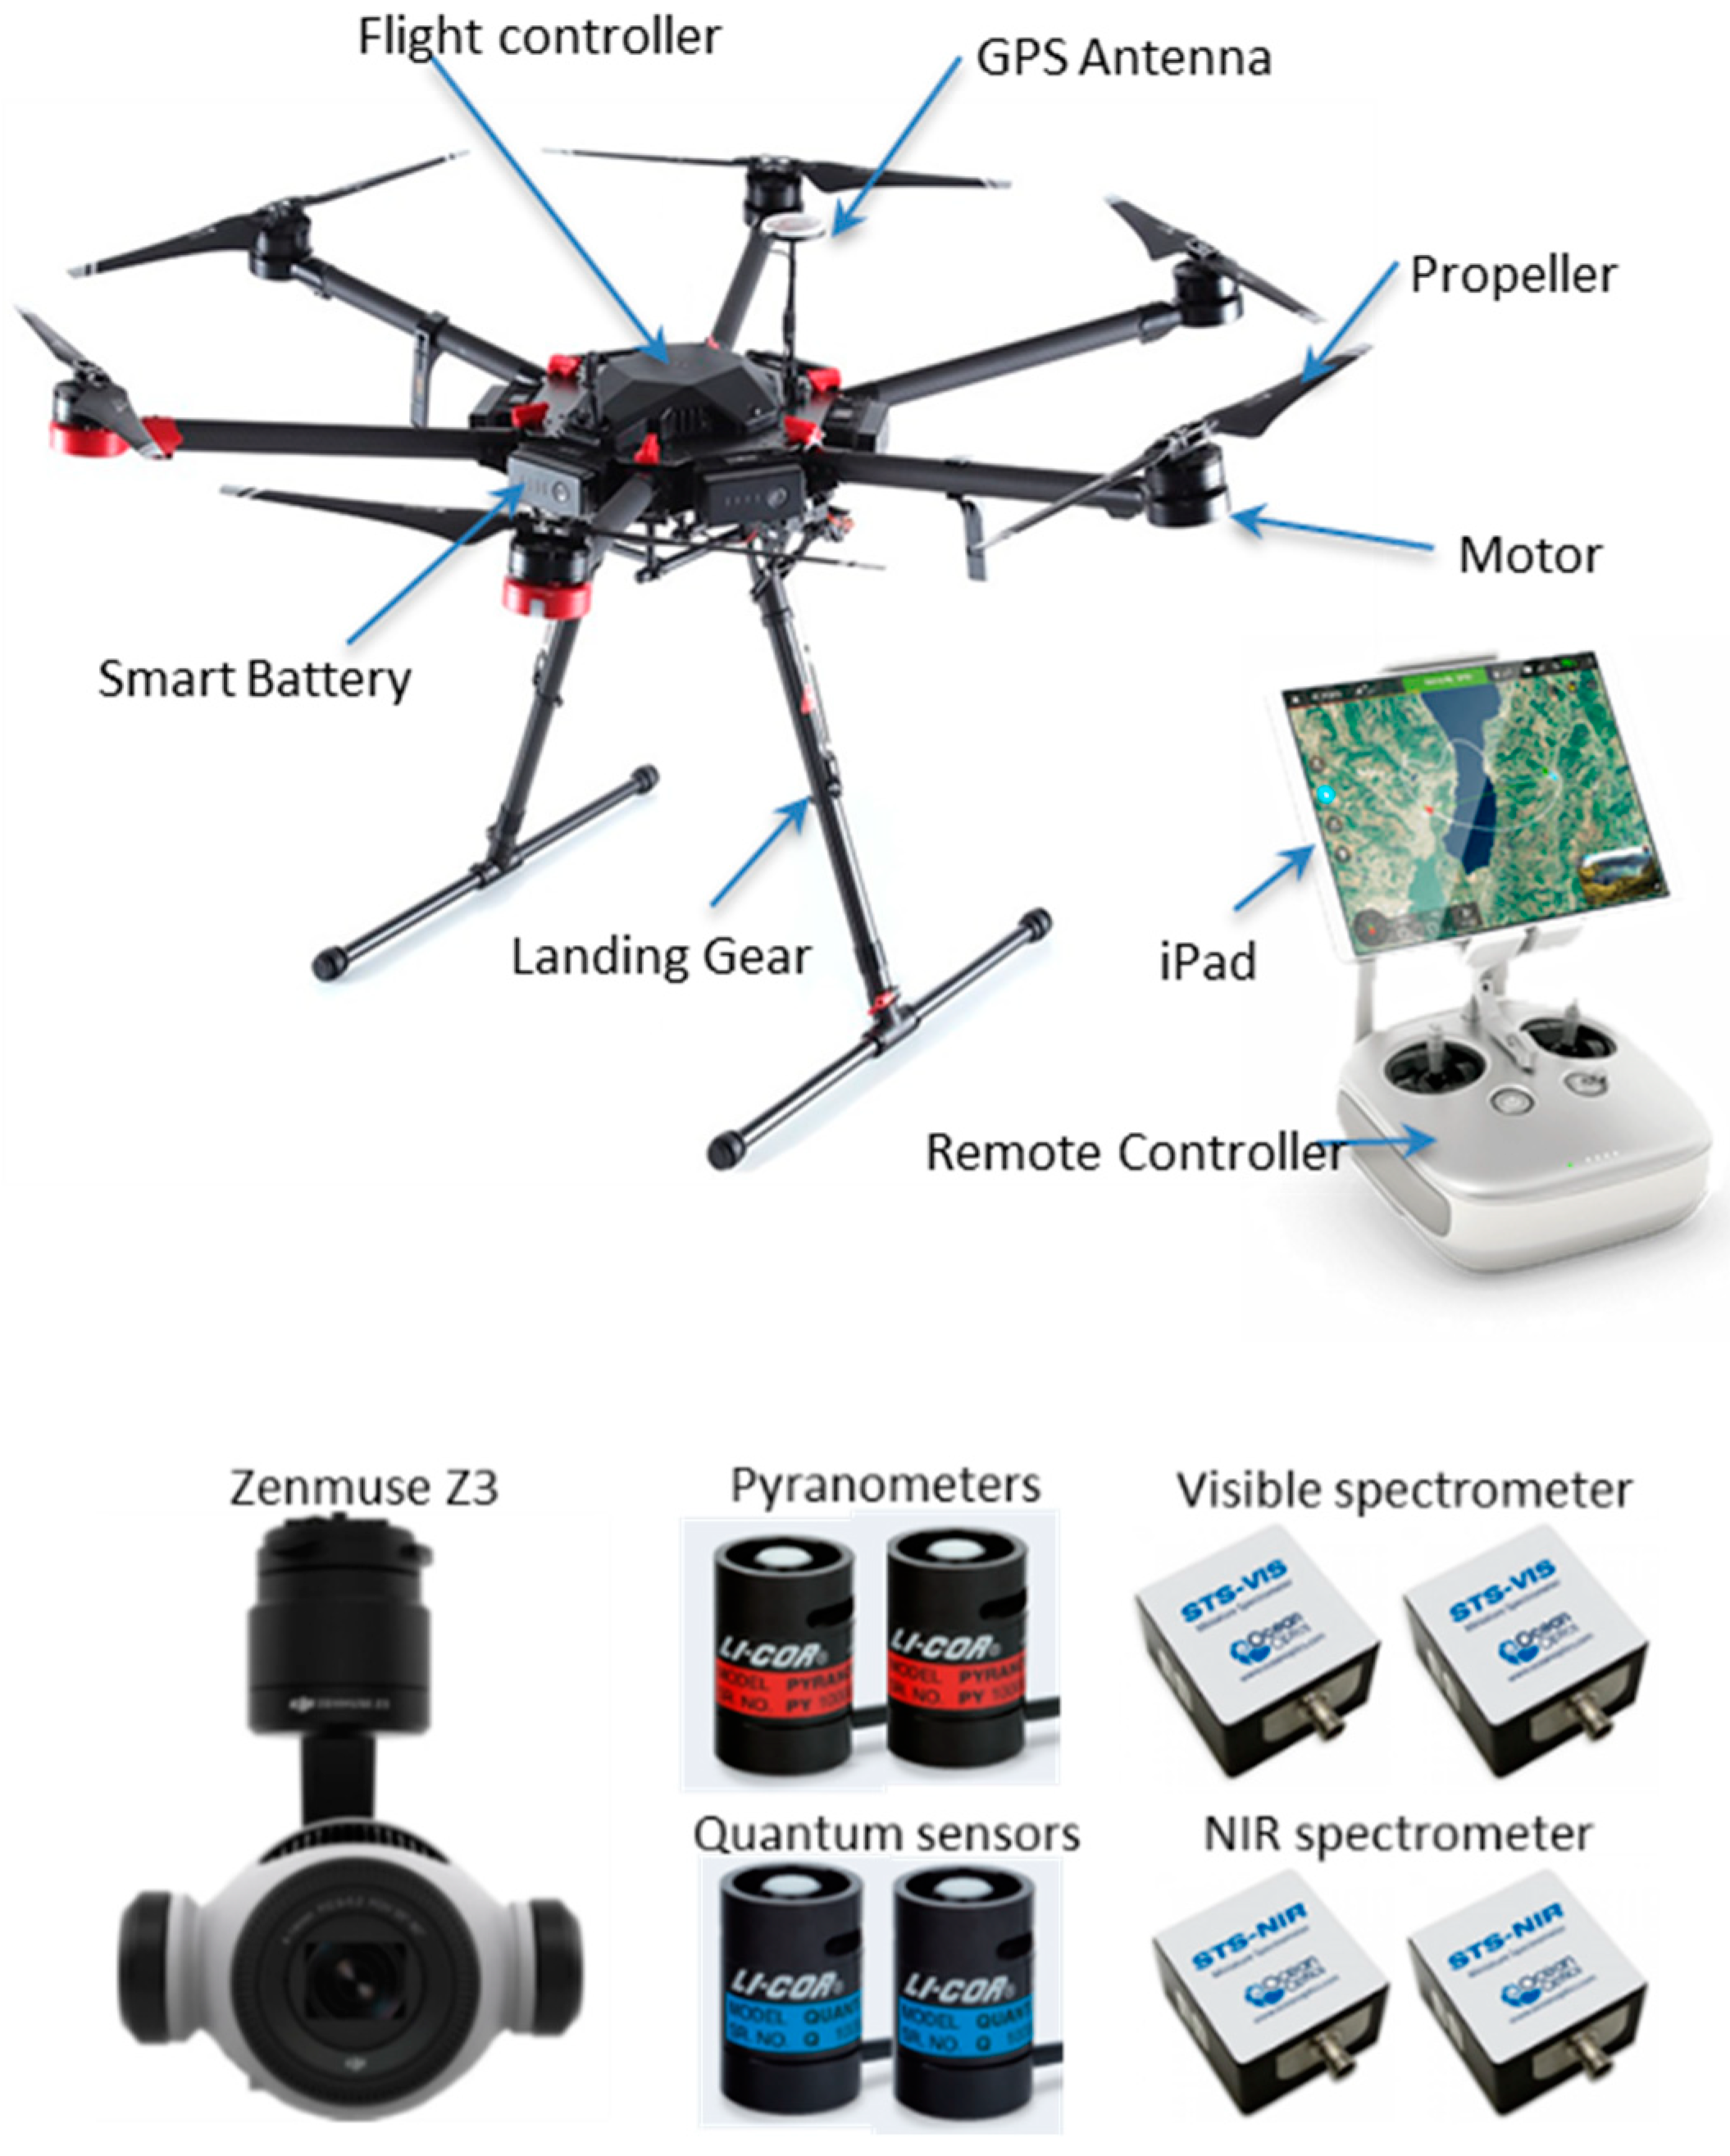
2.1. UAV Platform and Instruments
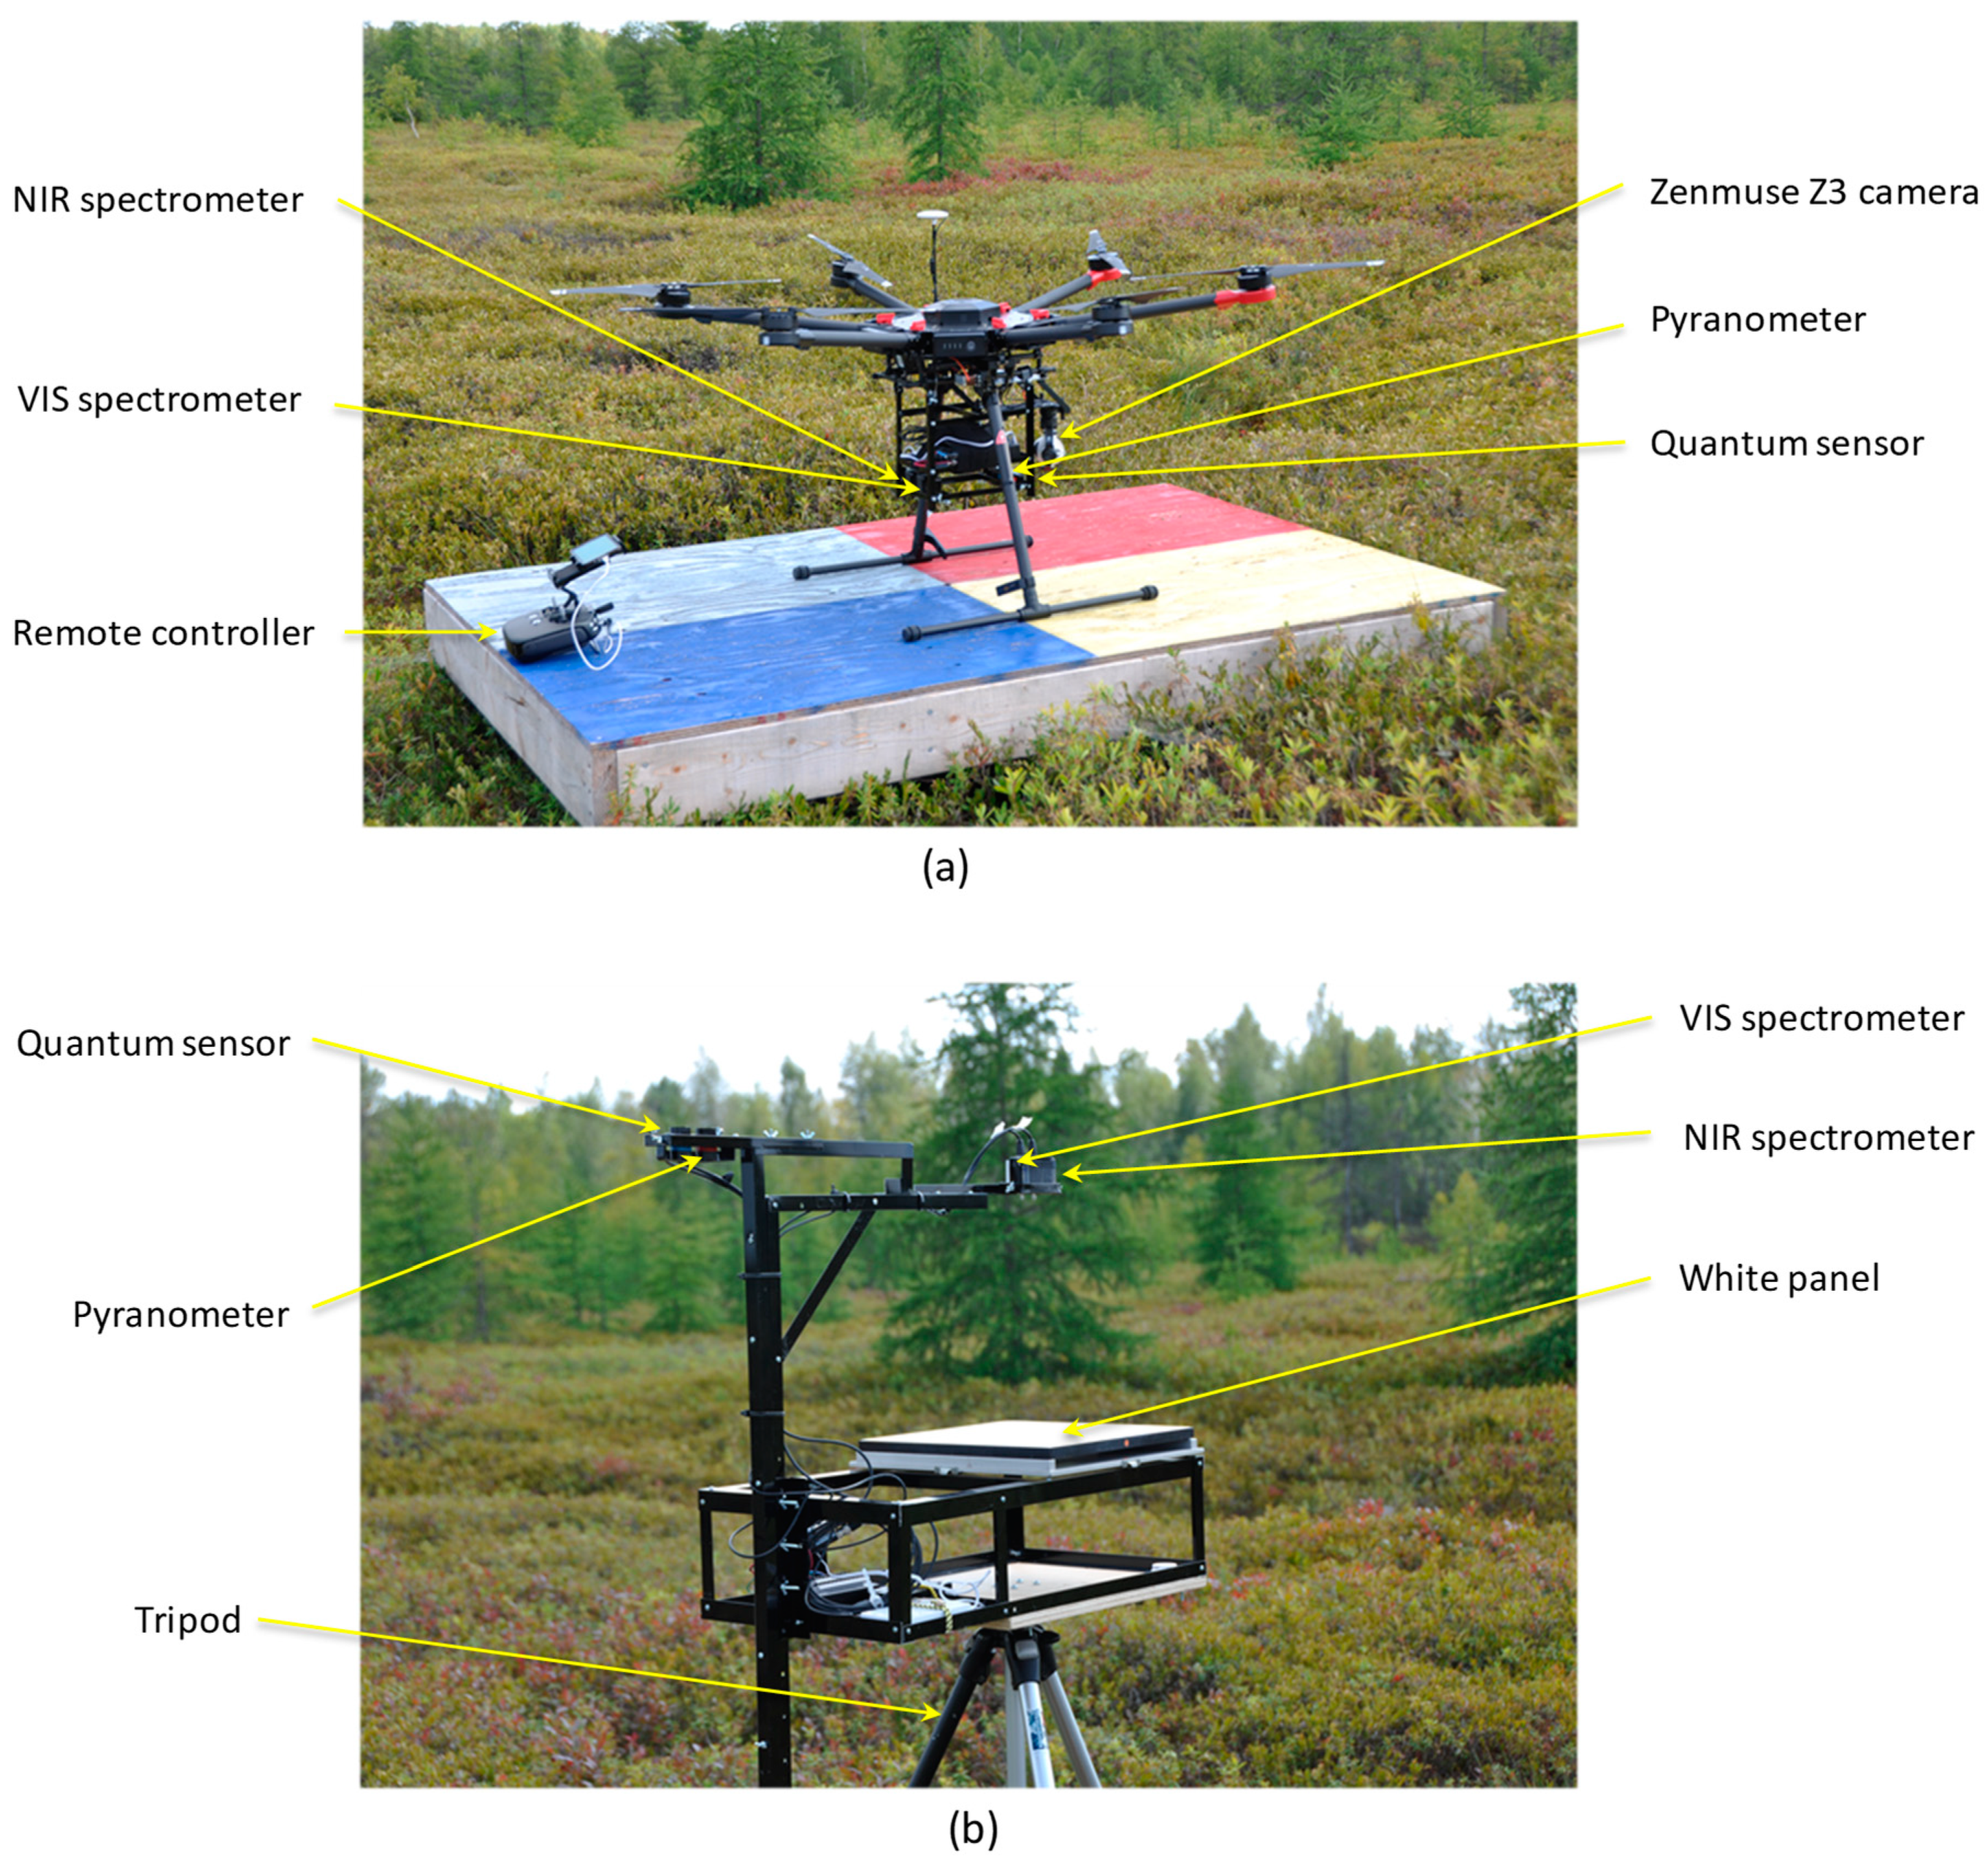
The UAV chosen for this system is the Matrice 600 (M600), DJI’s new flying platform [19] designed for professional aerial photography and industrial applications (Figure 1). The Matric 600 was chosen as it has a number of mission critical features that are favorable for our research requirements. It has six rotors providing redundancy in case of rotor failure and enhanced stability. The UAV can recover itself from failure of a single battery because of its smart battery management system. The Matrice 600 is comparatively larger than many other drones; however, it is built of light-weight stiff carbon fibre and it is able to fold up for transportation. It has an approximately 40 minute hover time without a payload and 18 minutes with maximum payload (5.5kg). There is sufficient room for mounting of sensors. It has retractable landing gear, which ensures that the legs do not disturb sensor measurements. The Matrice 600 has a powerful operating system, which optimized flight control performance, operated by revolutionary A3 flight controller [19]. The flight control system has a transmitter and a mobile device, such as a tablet or smartphone, can be used to design flight paths and operate the drone. The Matrice 600 supports the DJI Go, the DJI Assistant 2 and the Litchi apps that give users a built-in flight simulator, HD view, battery level status, redundancy status, transmission strength, etc. Data regarding the use and operation of the UAV, flight telemetry data such as speed, altitude, compass, pitch, roll, battery life and information about the gimbal and camera and operation records are recorded in the system.
Instruments that were used in the system include a digital camera, a pair of broadband pyranometers, a pair of broadband quantum sensors, a pair of narrowband visible (VIS) spectrometers and a pair of narrowband near infra red (NIR) spectrometers (Figure 1). The Zenmuse Z3 digital camera supports 4K video recording (equivalent of 8.9 MP) at 30 frames per second and 12MP still photographs every 3 seconds. For high along track overlap, the 4K video is preferable as it has similar ground pixel resolution as the still photographs, but with a much high frequency. Zenmuse Z3 supports Micro SD cards with a capacity of up to 64GB to store high-resolution video data, photos and flight telemetry data.
The LI-200R Pyrometer (Li-Cor Inc., Lincoln, Nebraska USA, www.licor.com) measures global solar radiation (direct and diffuse) in the 400 nm to 1100 nm broadband range. It measures solar irradiance (the radiant flux incident on a receiving surface from all direction) received on a horizontal surface with a silicon photodiode mounted under a cosine-corrected acrylic diffuser [20]. The sensor output is a current (μA) signal that is directly proportional to hemispherical solar radiation (Wm−2). The LI-190R Quantum sensor (Li-Cor Inc., Lincoln, Nebraska USA, www.licor.com) measures Photosynthetically Active Radiation (PAR) in μmol of photons m−2s−1 [20]. It measures PAR between 400 nm to 700 nm broadband range, which vegetation uses for photosynthesis [20]. The sensors are connected to data loggers, which are programmed to collect data every 3 s. A calibration constant, which can be found in certificate of calibration, is used to convert the current signal into units of radiation (Wm−2).
The spectral response functions of the LI-200R pyranometer and LI-190R quantum sensor in relation to Landsat 8 and Sentinel-2 satellite sensors are shown in Figure 2. The spectral response functions for the spectral bands sampled by the satellite sensors show a broad similarity in both position and bandwidth. The spectral response function of the quantum sensor is wide enough to cover the blue green and red spectral bands sampled in the visible range by the satellite sensors. The large difference, however, is between the satellite sensors and the pyranometer, and whilst the broadband pyranometer samples across the entire VIS-NIR spectrum, the contributions are weighted towards the NIR, with relatively less signals coming from shorter visible wavelengths, particularly in the blue-green region.
The STS-VIS Spectrometer (Ocean Optics, Largo, FL, USA, www.oceanoptics.com) measures the radiation within the visible range of 350 nm to 800 nm and the STS-NIR Spectrometer (Ocean Optics, Largo, FL, USA, www.oceanoptics.com) measures the radiation in the infrared region of 650 nm to 1100 nm with 1.5 nm spectral resolution. It is recommended to “warm up” the spectrometers prior to use for spectral measurement collection because the VIS and NIR spectrometers’ arrays warm up at different rates that can cause spectral steps in the overlap region between VIS and NIR [21]. The spectrometers are connected to STS Developer’s Kit [22] that contains a Raspberry Pi B+ microcomputer, a Wi-Fi™ dongle, a SD card containing all the software, a clock and a Lithium-Ion battery. The battery is able to provide 5 Volts and at least 1000 mA through a micro-USB connection. A laptop is used to communicate with the spectrometers and to setup the spectrometer parameters. OceanView allows complete control of setting the parameters for all system functions, such as: acquiring data, electrical dark-signal correction, boxcar pixel smoothing, and signal averaging. Integration time is an important parameter and it is recommended to adjust the integration time to acquire the maximum amount of light up to 85% of the spectrometer’s capability [23]. Other advanced features support several data-collection options such as independently store and retrieve spectral data as ASCII files to disk using auto-incremented filenames.

2.2. Systems Set-Up

The system is composed of a UAV sub-system (Figure 3a) and a ground sub-system. The UAV sub-system includes a camera and four radiations sensors (Figure 3): one from each pair mentioned above. The camera is mounted using DJI 3-axis gimbal system onto the Matrice 600 and stream live HD video to the DJI or Litchi apps. One pyranometer and one quantum sensor are connected with a CR300 data logger and mounted on the UAV. Similarly, one VIS spectrometer and one NIR spectrometer are connected to a microcomputer and mounted on the UAV. The data logger and the microcomputer are powered by a separate Lithium-Ion battery. All the sensors are mounted on the UAV using a light-firm aluminum frame and are pointing down for measuring reflected radiation from the land surface.
In addition to flight control system, the ground unit includes the second set of pyranometer and quantum sensor that are connected with a CR300 data logger and the second set of VIS and NIR spectrometers that are connected to a microcomputer. The ground pyranometer and the quantum sensor are pointed vertically upward to record downwelling solar radiation (direct radiation from the sun and diffuse radiation from the sky). The VIS and NIR spectrometers are set to face the calibrated white panel (~100% reference standard) to measure downwelling radiation. The ground unit is mounted on a tripod that helps to precisely level the system with a clear view of the sky or surface to ensure accurate measurements. Because the downwelling and reflected radiation measured by the sensors are used to estimate the surface albedo, it is recommended to operate the two system close to each other in order to minimize the differences between their respective ground footprints. The laptop is used to communicate with the UAV and ground sensors, and to set up clock time and the spectrometer parameters, such as integration time and acquisition timing before a flight. The spectrometers’ microcomputer can be communicated with the laptop via wireless network to start, stop, and view the spectrometer data in real time.

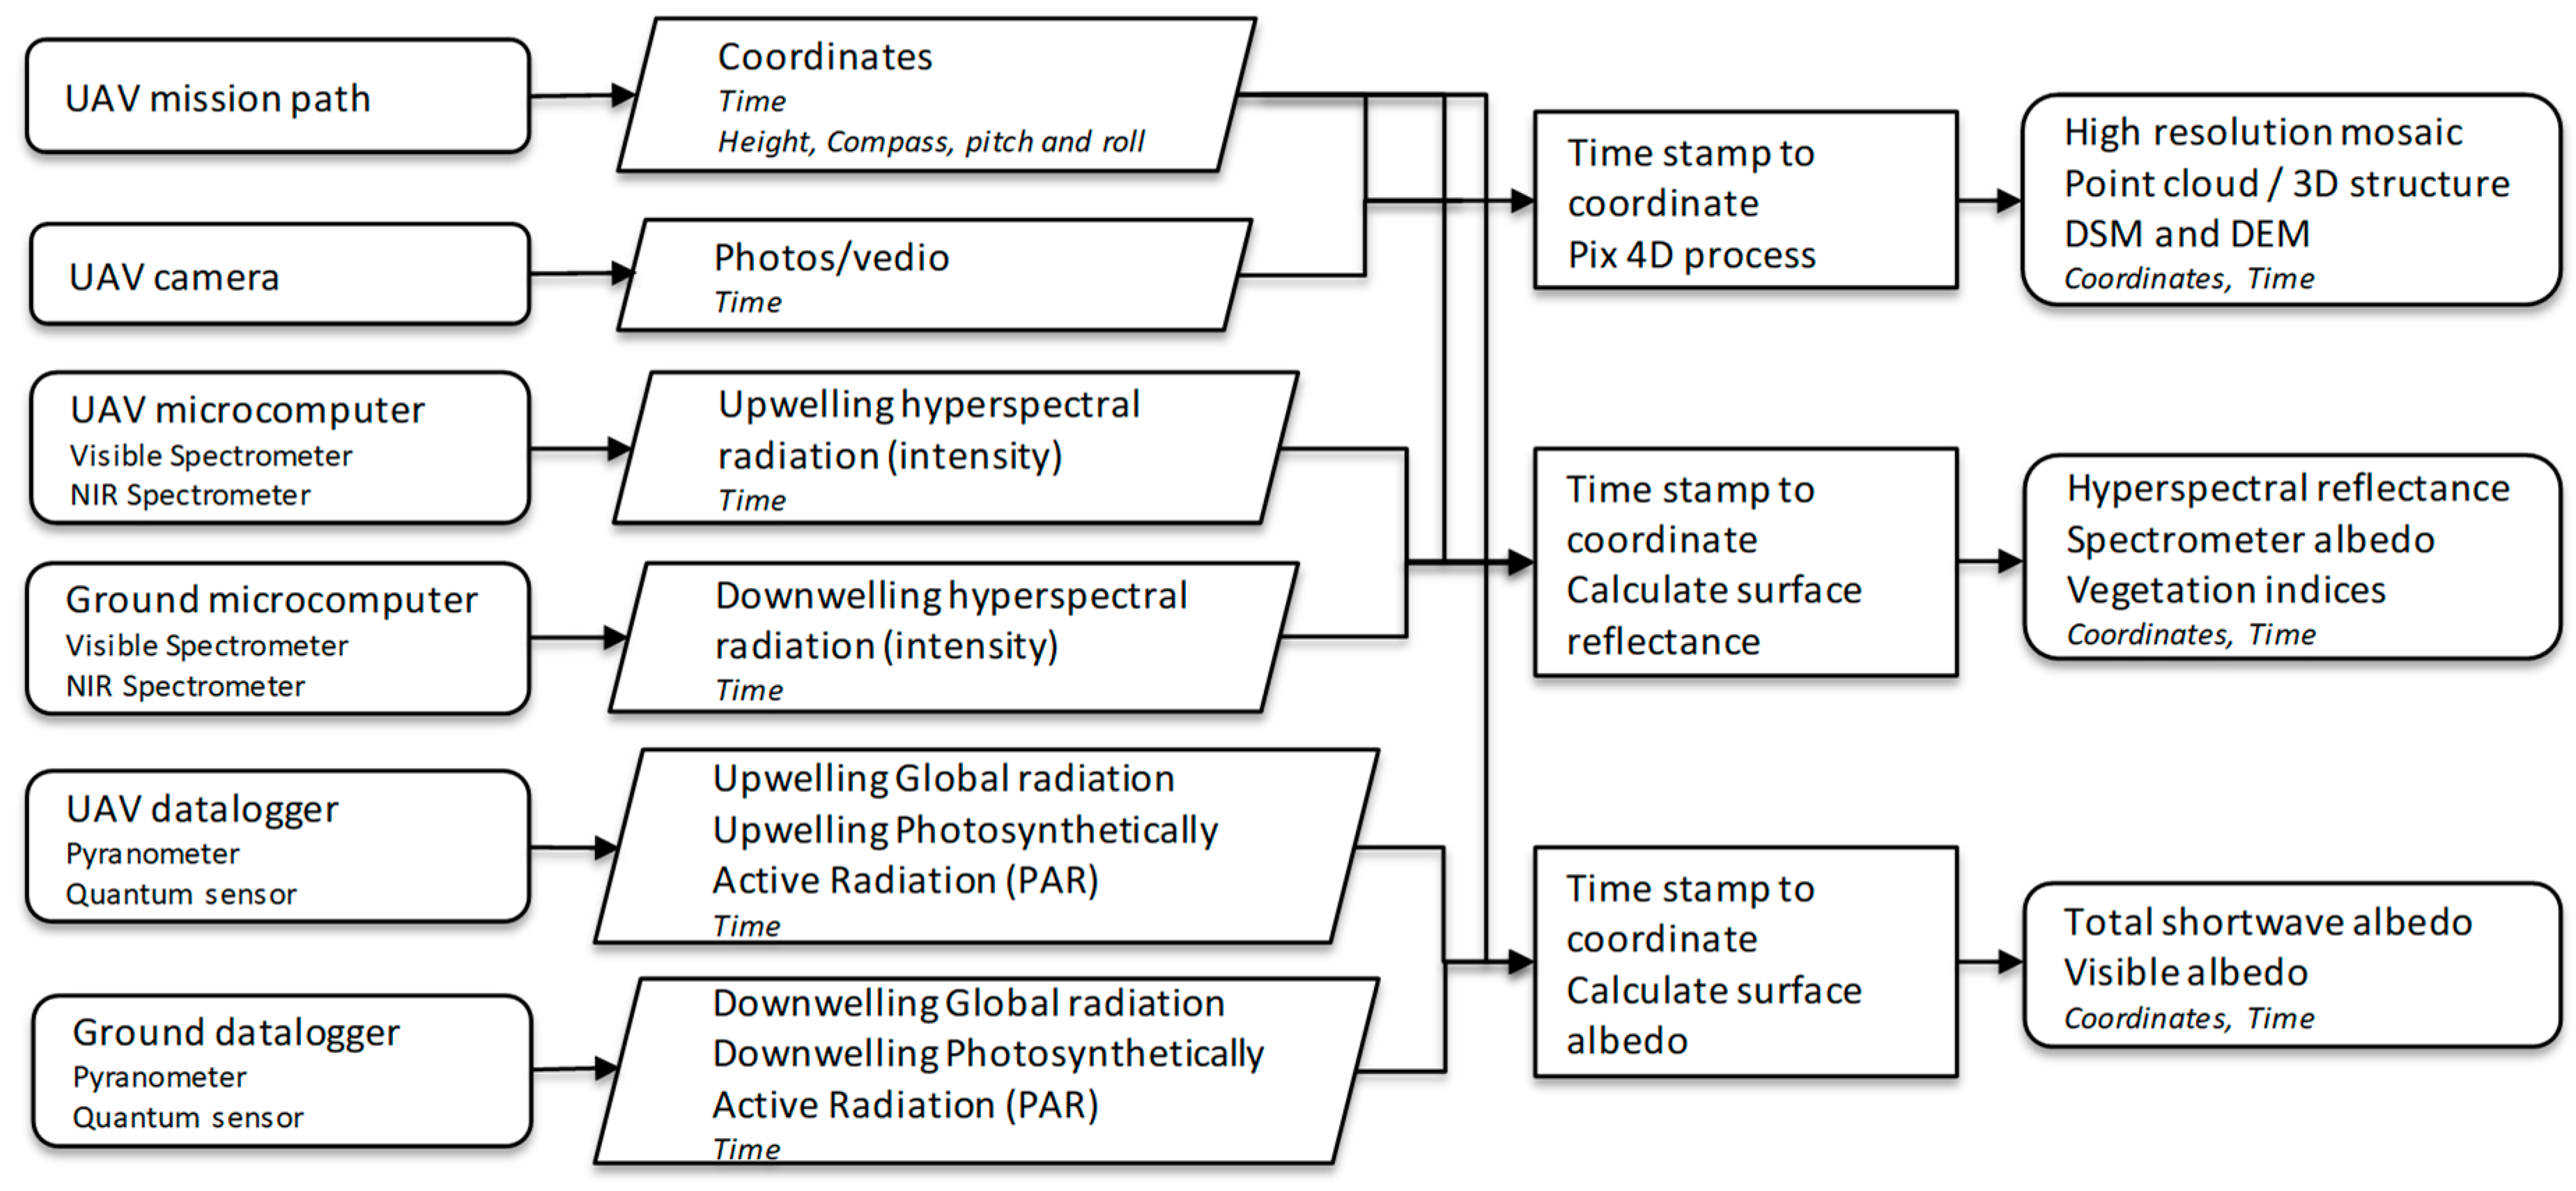
2.3. Data Processing Chain

The data is processed using the workflow described in Figure 4. Data regarding the operation of the UAV including time, coordinates, speed, altitude, compass, pitch, roll, and information about the gimbal and camera are recorded in the system mission path file. Multispectral camera, ground and UAV data loggers (pyranometers and quantum sensors are connected) and ground and UAV microcomputers (VIS and NIR spectrometers are connected) write a millisecond level timestamp (from turn on time) and a real-world timestamp, based on their system’s time, in their data files. Therefore, it is very important to synchronize the internal clocks to an accuracy of 1 second on all devices such as, the iPad, laptop, ground and UAV data loggers, and ground and UAV microcomputers. The timestamp is the common field (link) of all the datasets from the camera and the sensors, and is used to get the coordinates of the photos and sensor readings. The downward sensors are aligned within the airframe so that they are level when the UAV is in stable flight. Though the M600 is comparatively a stable platform, having stable flight is not always possible as the UAV platform orientation varies due to wind, its own rotation, and instability during acceleration and deceleration. Errors due to instrument tilting can be limited by omitting radiation data recorded when the pitch or roll of the UAV exceeded 3° [14].
The 4K videos are imported into Pix4D Mapper (www.pix4d.com) and one frame per second is extracted. The flight path information is used for georeferencing the extracted frames. This can be done without GPS-surveyed ground control points because the software pre-aligns the images based on the image matching technique to achieve accurate image alignment. The technique used by Pix4D to obtain a point cloud is a combination of Structure from Motion and photogrammetry [24]. These two techniques combined allow the retrieval of camera and target positions in a three dimensional system for all photographs. Geographic information can be added to the 3D scenes with ground control point and/or photographs with geo-information. The initial step creates a set of 3D matching points and the second steps densified that point cloud. A final step creates a high-resolution orthomosaics used to identify detailed land cover which will be used for the interpretation of spectral data and understanding the BRDF effects. Orthomosaics only create maps with 2D information, whereas point cloud gives 3D information such as DSM, DEM and structure of vegetation.
Spectrometer data is acquired in raw format as intensity value that depends on the integration time. First, the ground sensor measurements are adjusted with the calibration coefficients of the white panel for each wavelength. Dark noise (measured with the lens cap on) is subtracted from both intensity readings at each wavelength. The data from the UAV and ground sensors need to be aligned based on time/coordinate prior to calculation of reflectance. Reflectance of ground targets is calculated as stated in [25].
ρ ( λ ) = I ( S , λ ) I ( R ,   λ )
where ρ’ is nominal surface reflectance, λ is wavelength, I is the intensity recorded by the spectrometer for target surfaces (S) and the intensity adjusted with the calibration coefficients of the white reference (R), respectively. From the reflectance, different vegetation indices can be calculated.
The final stage in the workflow is to calculate albedo using coincident measurements obtained from upward and downward facing pyranometer and quantum measurements, respectively. Upward and downward hemispherical reflectance are measured using broadband pyranometers, the ratio of which provides an estimate of the total shortwave albedo. Similarly, upward and downward hemispherical PAR are measured using quantum sensors and the ratio is an estimate of the visible albedo. Here, downward radiation is measured at a fixed ground station and it is recommended to keep the ground unit within the vicinity to keep the upward and downward facing sensors under the same illumination condition, especially when the illumination conditions rapidly vary with variable cloud cover.

3. Test Measurements at Mer Bleue Wetland

A test case study was conducted in Mer Bleue wetland area (Figure 5) which is a boreal peatland ecosystem that is commonly found in northern Canada.

3.1. Study Area

The Mer Bleue Conservation Area (Figure 5) is a 33.43 km2 protected area (45°24′34″N, 75°31′07″W) in Eastern Ontario, Canada. The conservation area is about 70 m elevation from mean sea level and is covered mostly by bog, marsh and bordered by patches of forests. The sphagnum bog contains treed bog (black spruce forest) and the open bog vegetation. The species composition of wetland types are described based on [26]. The forest is dominated by black spruce (Picea mariana) with some larch (Larix laricina), trembling white aspen (Populus tremuloides) and grey or white birch (Betula spp.). The bog has a complete ground cover of mosses (Sphagnum capillifo-lium, Sphagnum magellanicum), with a shrub canopy dominated by evergreen shrubs (Chamaedaphne calyculata, Kalmia angustifolia, and Ledum groenlandicum), with some deciduous shrubs (Vaccinium myrtilloides) and scattered sedges. The marsh areas around Mer Bleue are covered by plants such as cattails (Typha latifolia), alders (Alnus rugosa), willows (Salix spp.), and a variety of sedges (Carex spp.). The upland area at the boundary of the bog is covered with mixed forest of conifers and deciduous species. The predominant species in the mixed forest included white pine (Pinus strobus), hemlock (Tsuga canadensis), sugar maple (Acer saccharum) and beech (Fagus spp.).

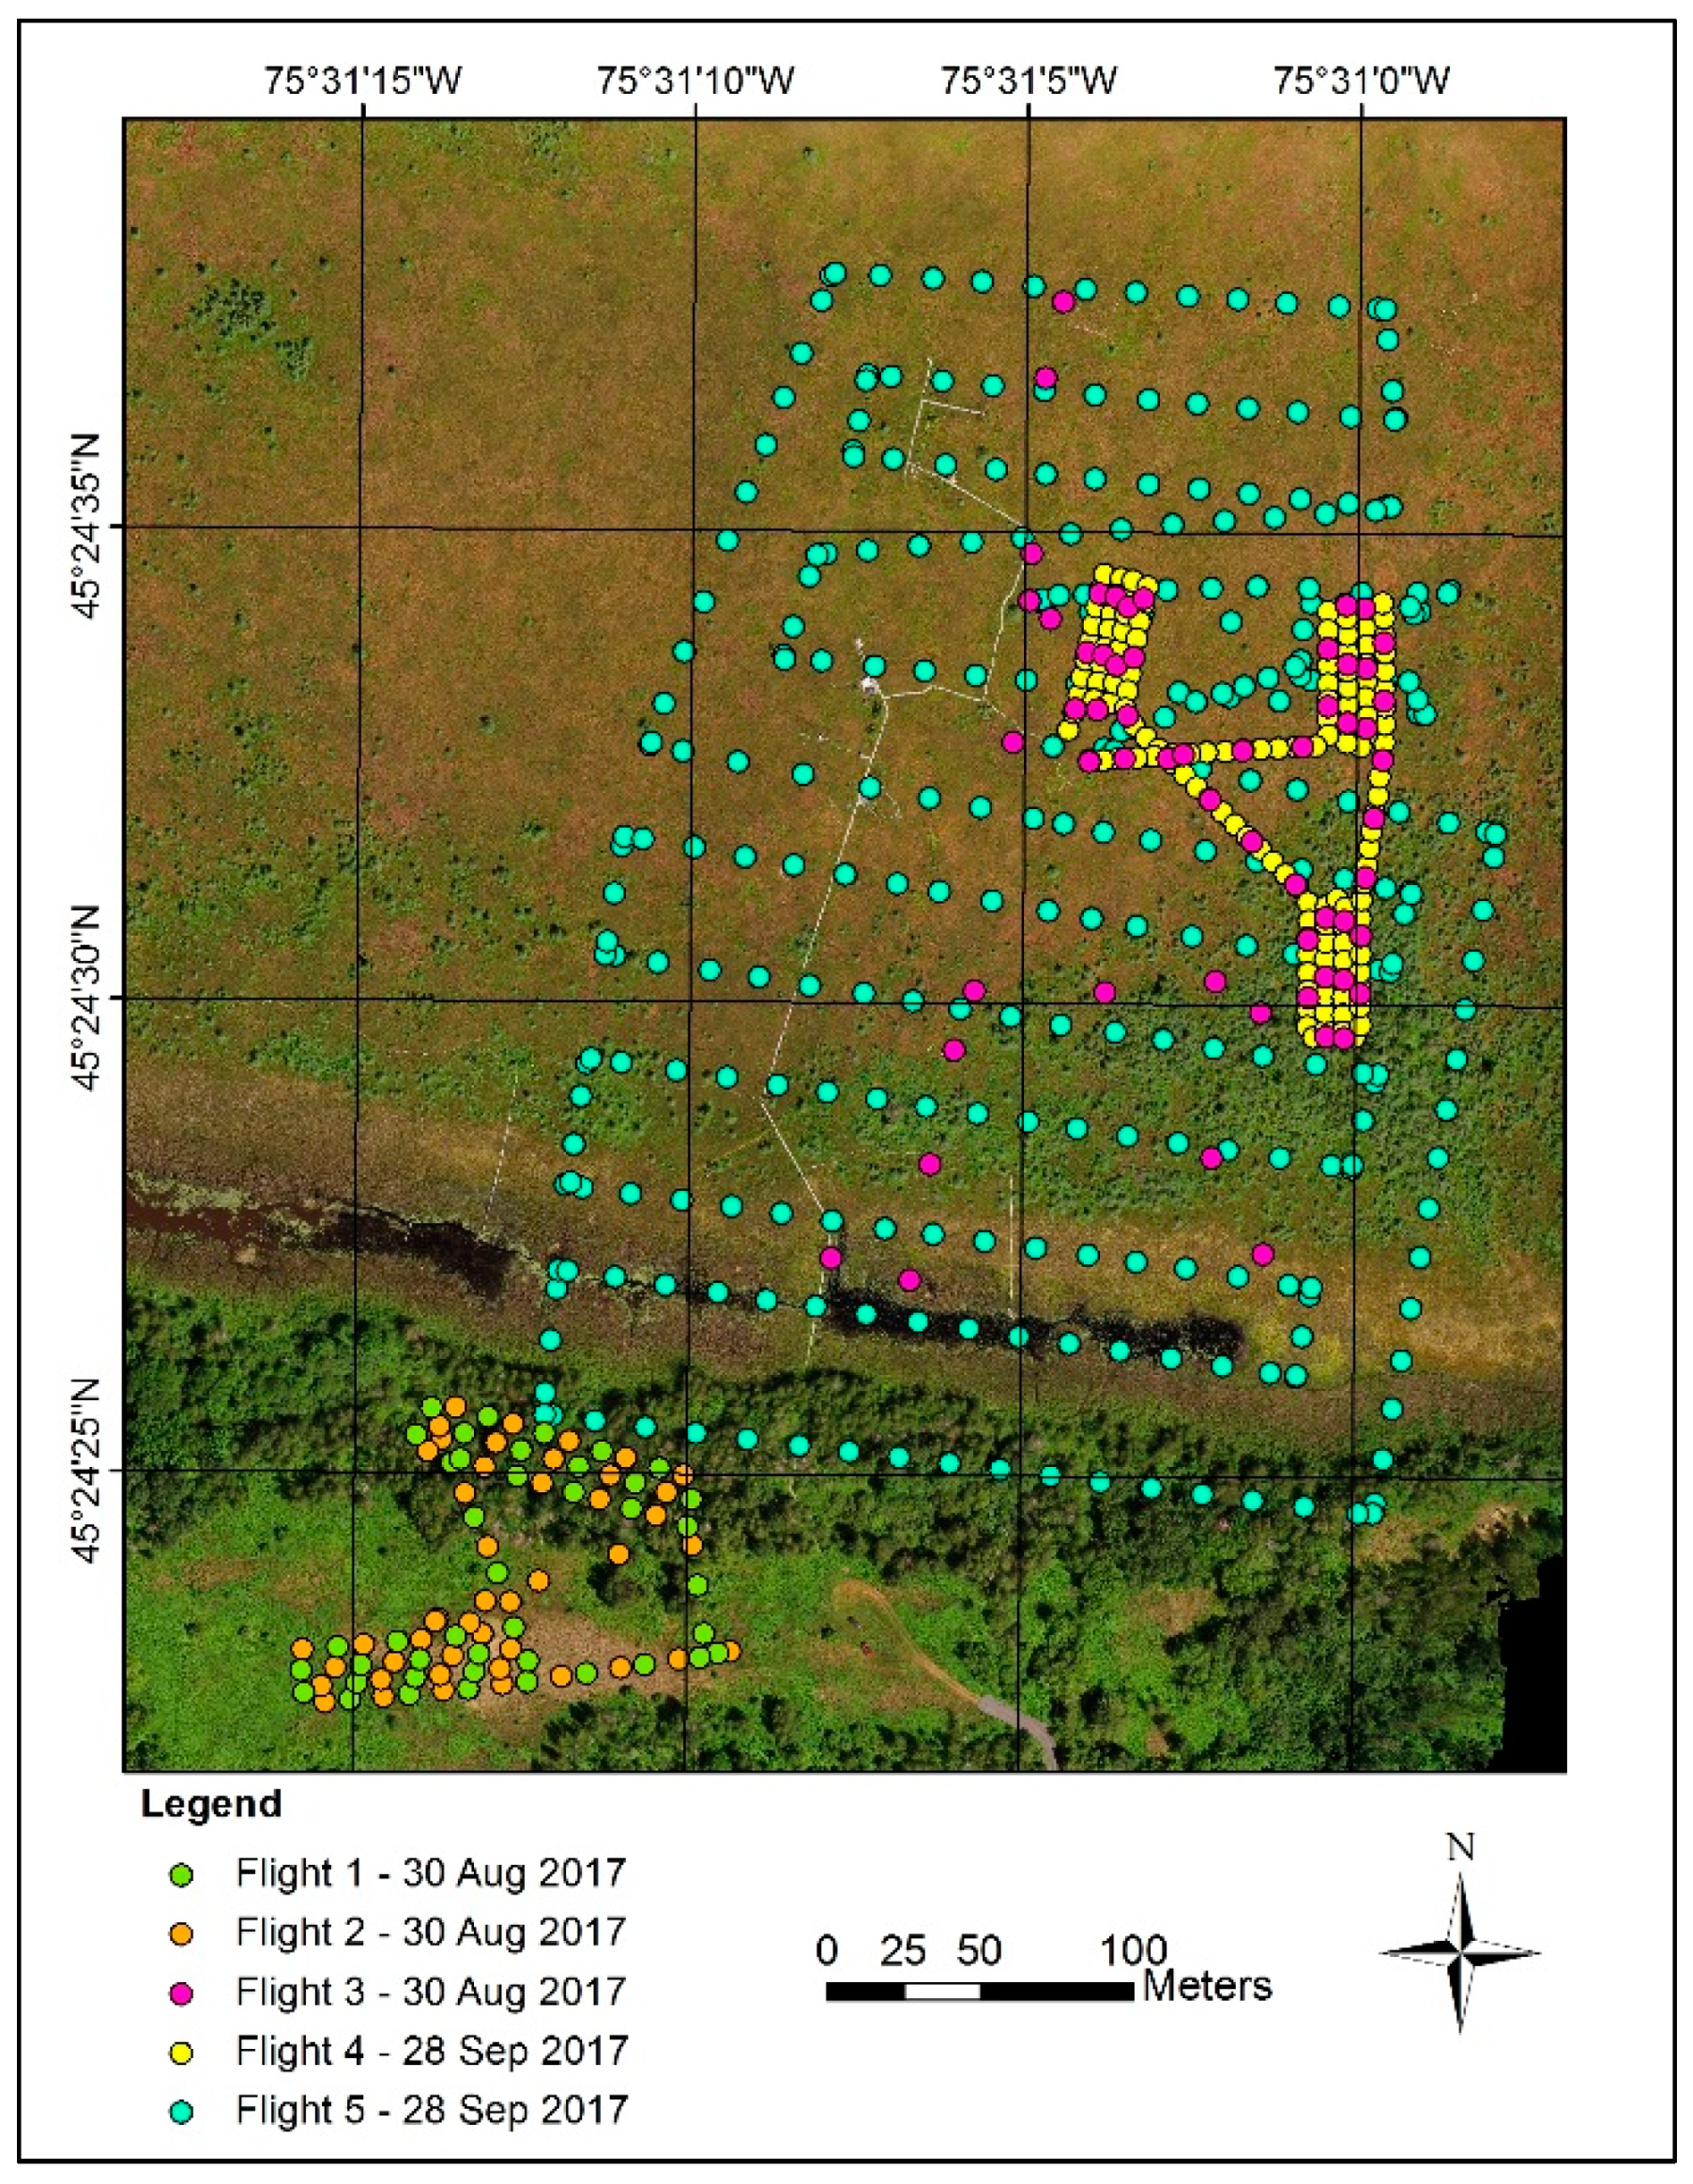
3.2. UAV Data Acquisition

Flight planning was done with the Litchi for DJI (app), which is used to execute full autonomous flight. The UAV is then controlled automatically with the pre-defined mission path according to the given flying altitude of 30 m and waypoint coordinates. Five flights (3 flights on 30 August 2017 and 2 flights on 28 September 2017) with different UAV mission paths have been tested (Figure 5). All five flights were operated between 1:00pm to 3:00pm under variable cloud conditions. Out of 5, four were planned to cover small area with low speed (7 km/h) suitable for mosaic, point cloud and sensor measurements purposes. The overlap is more important for the creation of point clouds than the mosaics and along path overlap exceeded 90% while the across overlap was set to more than 60% for accurate photogrammetric processing. A mission path (Flight 5) was designed to collect sensor measurement and mosaic over large area (about a MODIS pixel size ~500 m) within the battery life (about 17 min). In this survey, the relatively high speed (20 km/h), sometimes resulted in UAV’s roll and pitch exceeding the limit (roll and pitch <3O). The cosine-response error increases as solar zenith angle increases [14] so measurements were acquired as close as possible to solar noon. Flying altitude is optimized to 30 m above ground level to flyover the forest as well as to sample a large footprint. Further, a homogenous bog area was monitored from different heights under clear sky or cloudy conditions. All the acquired data were processed following the standard processing chain described in Section 2.3 and the land surface parameters such as total shortwave albedo from pyranometer and visible albedo from quantum sensor were estimated.

3.3. Spectrometer Albedo Estimation

Total shortwave albedo was estimated from spectrometer surface reflection measurements. Usually, spectrometer albedo estimation underestimates surface albedo [27] because the spectrometer cannot record the anisotropic characteristics of land surface. Since the pyranometer measures the hemispherical reflectance and contains the information of surface anisotropy [14], albedo from pyranometer measurements can be used to correct surface reflectance measured by the spectrometer. The calculation of albedo from spectrometer measurements was done in four steps: (1) the ratio of pyranometer albedo to the spectrometer reflectance (for both Green and NIR bands) within the footprint of pyranometer was calculated; (2) the mean ratios of all pyranometer sampling points on two dates, August 30 and September 28, were calculated; (3) the reflectance (Green/NIR) for each sampling point was multiplied by the mean ratio to get the spectral albedo in Green and NIR bands; (4) the empirical equation (Equation (2)) by [28] was used to convert the spectral albedo in Green and NIR bands to broadband shortwave albedo.
α = 0.726 · α G r e e n 0.322 · α G r e e n 2 0.051 · α N I R +   0.581 · α N I R 2

3.4. Satellite Based Albedo Estimation

Satellite-based albedo was estimated using Landsat 8 and Sentinel-2 data for comparison with the UAV-based albedo measurements. Ten Landsat 8 [29] OLI Level 2 (L2) images throughout the growing seasons were downloaded from earthexplorer.usgs.gov and met the requirements of being predominately cloud-free. The Landsat 8 OLI data is of high radiometric quality and 30 m spatial resolution. Landsat 8 L2 data are atmospherically corrected ‘Science Products’, using the Landsat Surface Reflectance Code (LaSRC) to give surface reflectance. This atmospheric correction algorithm differs from previous Landsat 4/5 TM data which used the 6S radiative transfer model. Isolated cumulus clouds are visible but the images could still be used in conjunction with the UAV flights, where the relevant pixels are cloud-free.
Sentinel-2 [30] is the newest generation Earth Observation (EO) satellite which has 13 spectral bands with 10 to 60 m spatial resolution. This is an advantage of higher spatial and spectral resolutions over its counterpart Landsat 8 OLI. Six Sentinel-2 Level-1C (L1C) Top of Atmosphere (TOA) images that are closest to the time of UAV flights and with cloud cover less than 10% were downloaded from the European Space Agency (ESA) Copernicus Open Access Hub (https://scihub.copernicus.eu/dhus/#/home). The Sen2Cor processor was used to perform atmospheric, terrain, and cirrus correction of the L1C product to produce the ortho-image Bottom-Of-Atmosphere (BOA) reflectance product (Level-2A). Since not all the bands are at the same spatial resolution, all bands were atmospherically corrected at 60 m and resampled to 30 m in order to match the spatial resolution of the Landsat images. SNAP software was used to convert the product to a GeoTIFF.
BRDF-based algorithms for estimating broadband surface albedo/total shortwave albedo from satellite observations involve an explicit procedure for the spectral and angular integration of reflectance data. However, due to the narrow field of view of Landsat 8 and Sentinel-2 sensors, it is not possible to acquire directional reflectance under different solar-view geometry and therefore they fail to capture the anisotropy characteristics of most land surfaces [31]. Many BRDF-based methods use external BRDF information from the 8-day 500 m MODIS BRDF model parameter product (MCD43A1) [10] to compute the directional reflectance across all viewing and solar zenith angles, for a given scene [32]. The integrated shortwave MODIS BRDF isotropic, volumetric and geometric parameters were used to calculate surface reflectance at the view and solar zenith angles of each Landsat 8 and Sentinel 2 scene [33] (Equation (3)):
A = ( α / r ( Ω l ) ) · r l
where A is Landsat/Sentinel narrowband albedo to be calculated, r l is observed Landsat/Sentinel reflectance, Ω l is viewing and solar geometry of Landsat/Sentinel data, α is albedo, and r ( Ω l ) is the reflectance at Landsat/Sentinel sun view geometry. Both α and r ( Ω l ) are derived by the MODIS BRDF parameters [33].
The narrowband surface albedo calculated using the algorithm above is then used to calculate total shortwave albedo using the coefficients (Equation (4)) formulated by [34]. The weights were originally developed for Landsat 5 and 7, and converted to Sentinel-2 bands (Equation (5)) by [35], where bn represents the sensor band number.
α L i a n g L 8 = 0.356 · ρ b 2 + 0.130 · ρ b 4 + 0.373 · ρ b 5 +   0.085 · ρ b 6 + 0.072 · ρ b 7 0.0018
α L i a n g S 2 = 0.356 · ρ b 2 + 0.130 · ρ b 4 + 0.373 · ρ b 8 A +   0.085 · ρ b 11 + 0.072 · ρ b 12 0.0018
Whilst the weighting functions in Equations (4) and (5) were developed for Landsat 5 TM bands, corresponding bands over the same spectral range from Landsat 8 and Sentinel-2 data have similar characteristics, including centre wavelength position and the full width half maximum. Nonetheless, this may impact on the overall absolute accuracy of derived albedo products and their agreement [35].

3.5. Scaling between Observations

The field of view (FOV) specifications vary considerably between the UAV mounted camera and sensors and the satellite sensors, which leads to differences in the measured instantaneous field of view or ground sampling footprint. Table 1 gives an overview of the spatial resolution sampled by the instruments.
The comparative differences between the sampling footprints for the UAV mounted instruments versus Landsat 8 OLI 30 m pixels are shown in Figure 6. As the pyranometer FOV of 180°, which gives a sampling footprint reaching infinity, is not practical for comparison against other albedo products, we use a FOV of 90°. This FOV represents 50% of the contributing ground albedo signal [36]. The spectrometer has a FOV of 25°, which leads to a ground sampling footprint radius of 13.3 m and is comparable to high-resolution pixel size (Figure 6).

4. Results

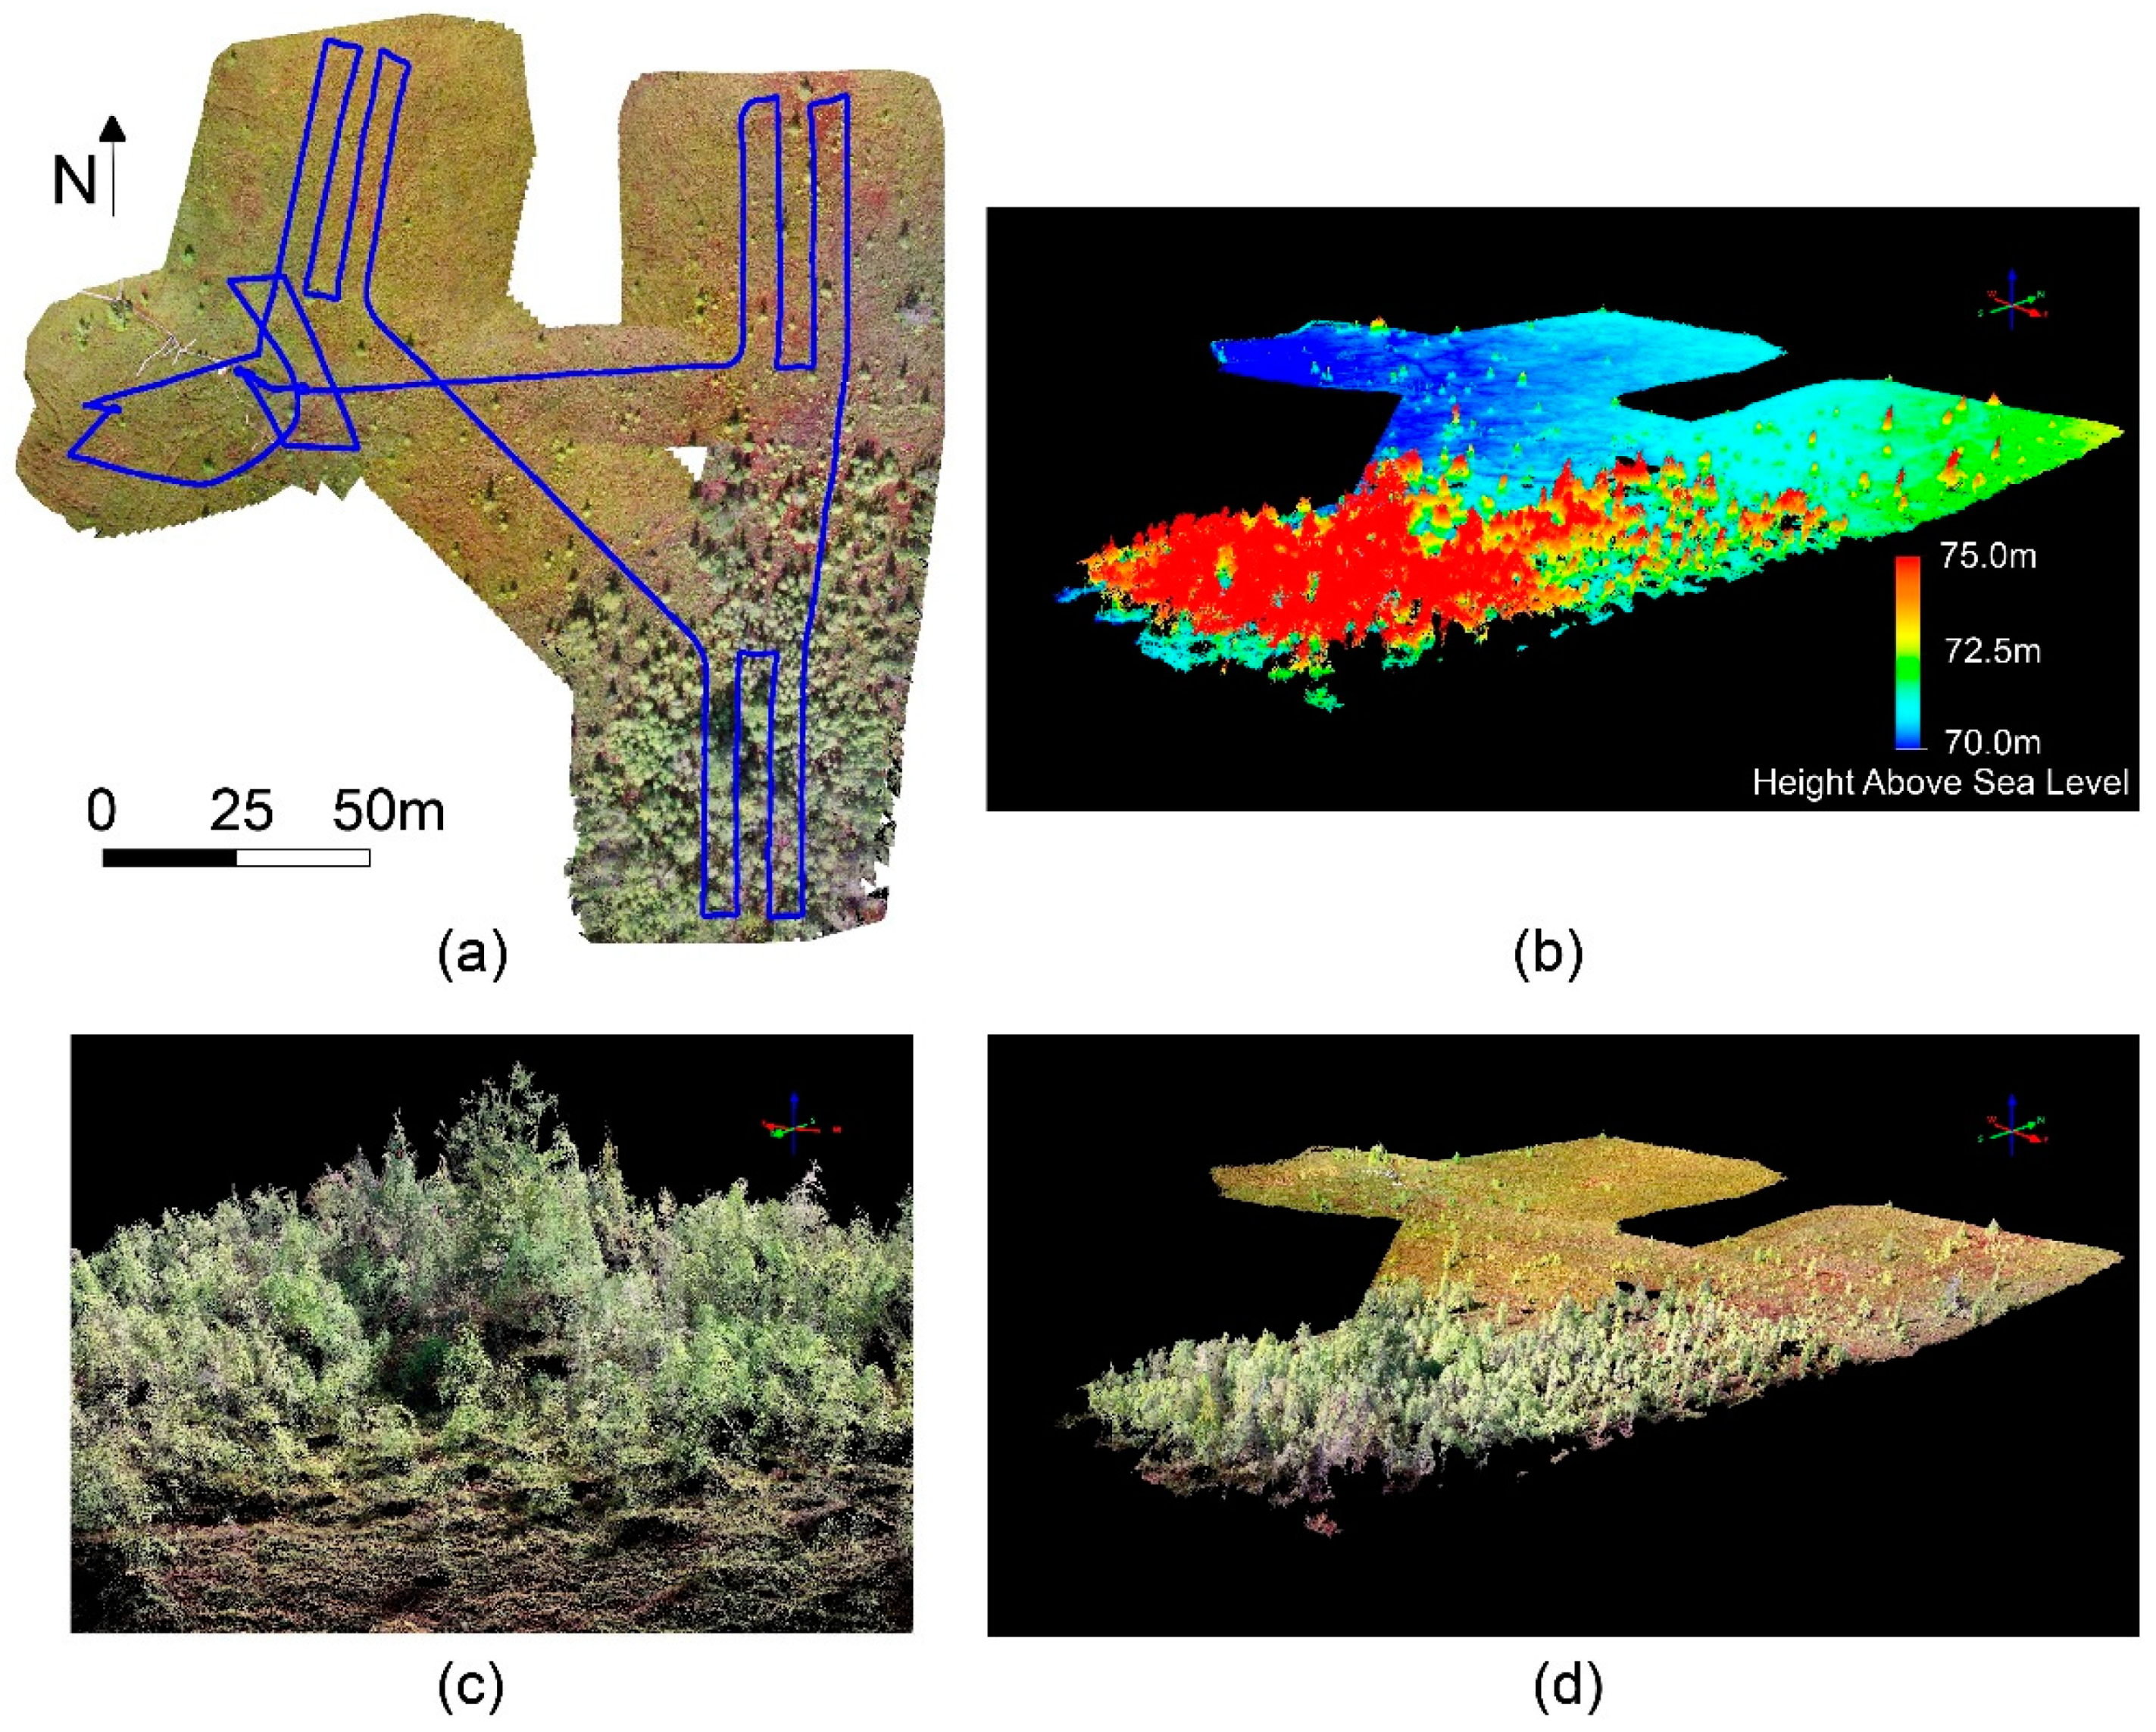
4.1. Orthomosaic and Point Cloud

An orthomosaic and point cloud for the Mer Bleue wetland from a mission on 28 September 2017 provides a characterization of the area (Figure 7). The orthomosaic with 1cm spatial resolution provides information on surface texture and land cover type with high accuracy at locations where surface albedo was measured. The point cloud contains 24.5 million points over 1.85 ha and are visualized with natural (visible) colors and color coded for height. All points in the cloud are between 69.8 m (blue) and 75.4 m (red) above sea level (ASL). This gives detailed vegetation density and structural information. Vegetation at the Earth’s surface has various levels of structural formation. Open canopies (grass, marsh, open bog) generally have simple structures with leaves more or less randomly distributed in space, whereas foliage in closed canopies (treed bog, forest) are often organized in structures at various hierarchical levels, such as shoots, branches, whorls, tree crowns, and tree groups [37]. This structural information is useful to understand and interpret surface anisotropic and BRDF characteristics, which directly influence surface albedo estimates.

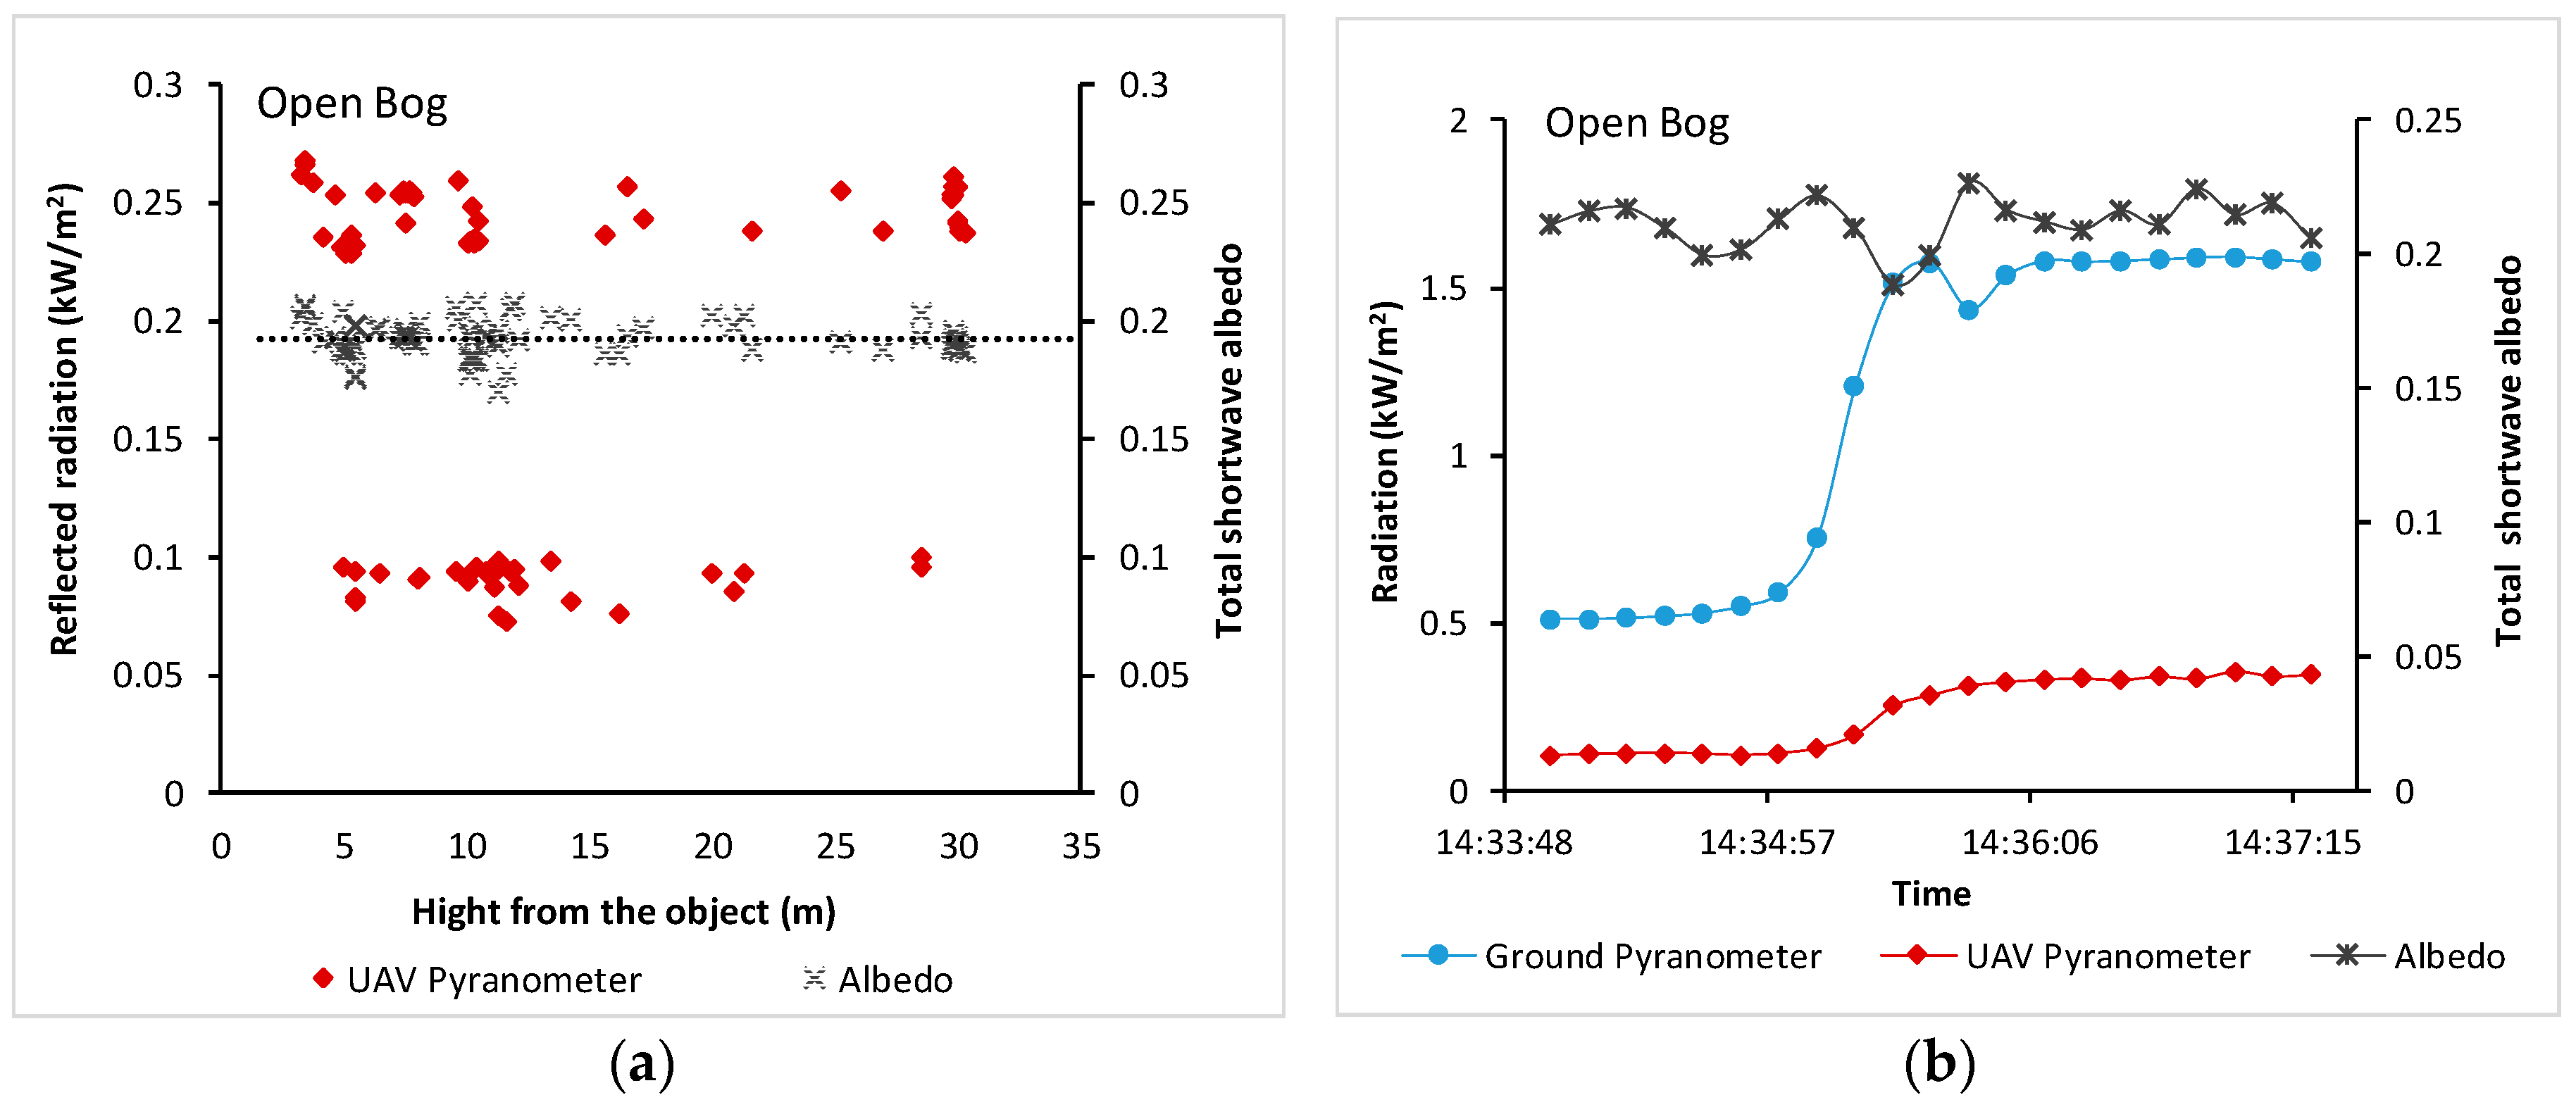
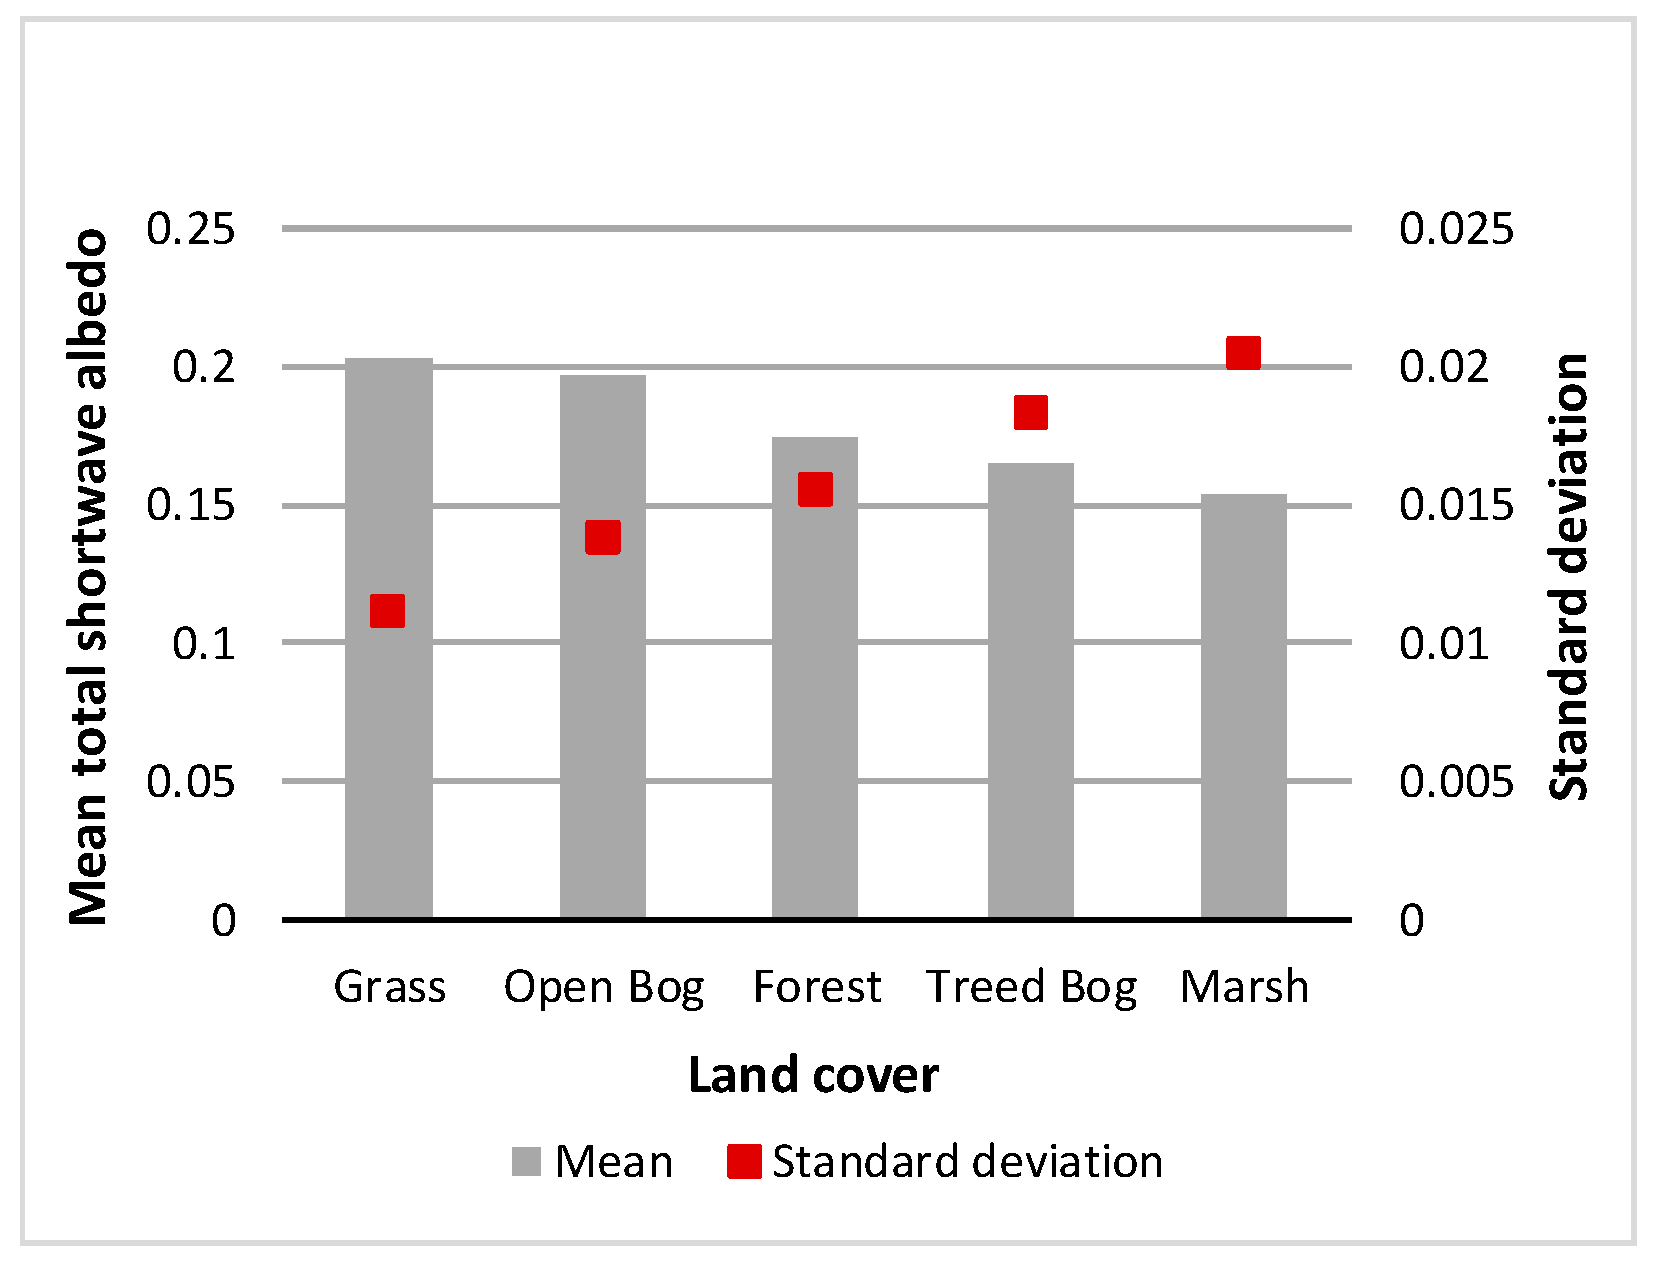
4.2. Total Shortwave Albedo from Pyranometer

The total shortwave albedo measurements have been made using instruments such as pyrometers, positioned either on tripods (~3 m in height) or on towers, of 20 m or greater in height [38]. With this stable UAV system, we could measure the surface albedo at different heights (~3 m and higher). The surface albedo measured using the UAV pyranometer is not influenced by the observation height where the land surface is homogenous. Total shortwave albedo measurements over a homogenous bog area at different heights under clear sky or cloudy conditions gives very consistent albedo values (Figure 8a). Further, total shortwave albedos under clear-sky conditions and those under cloudy conditions are almost equal and stable (see Figure 8a,b). Liang et al. [39] stated that under cloudy conditions, the total shortwave albedo is different from that of the clear-sky conditions since the spectral distributions of the downward irradiance at the surface are different. In this study, the differences (Figure 8a,b) were found to be insignificant, which is partially due to minimal atmospheric influences in the measurements.
Thus, the land cover appears to dominate the spatial variability of total shortwave albedo in the Mer Bleue wetland, having a highest mean albedo for grass (0.2) and lowest mean albedo for marsh (0.15) (Figure 9). The standard deviation of the five land cover classes have a standard deviation increase with declining mean value (Figure 9). The treed bog has a lower mean albedo with higher standard deviation compare to open bog and forest because isolated trees increase shading effect (see Figure 7). Additionally, in some places marsh appear to be darker (see Figure 5) because of the water level and open water gaps that brings the albedo value lowest with high standard deviation.

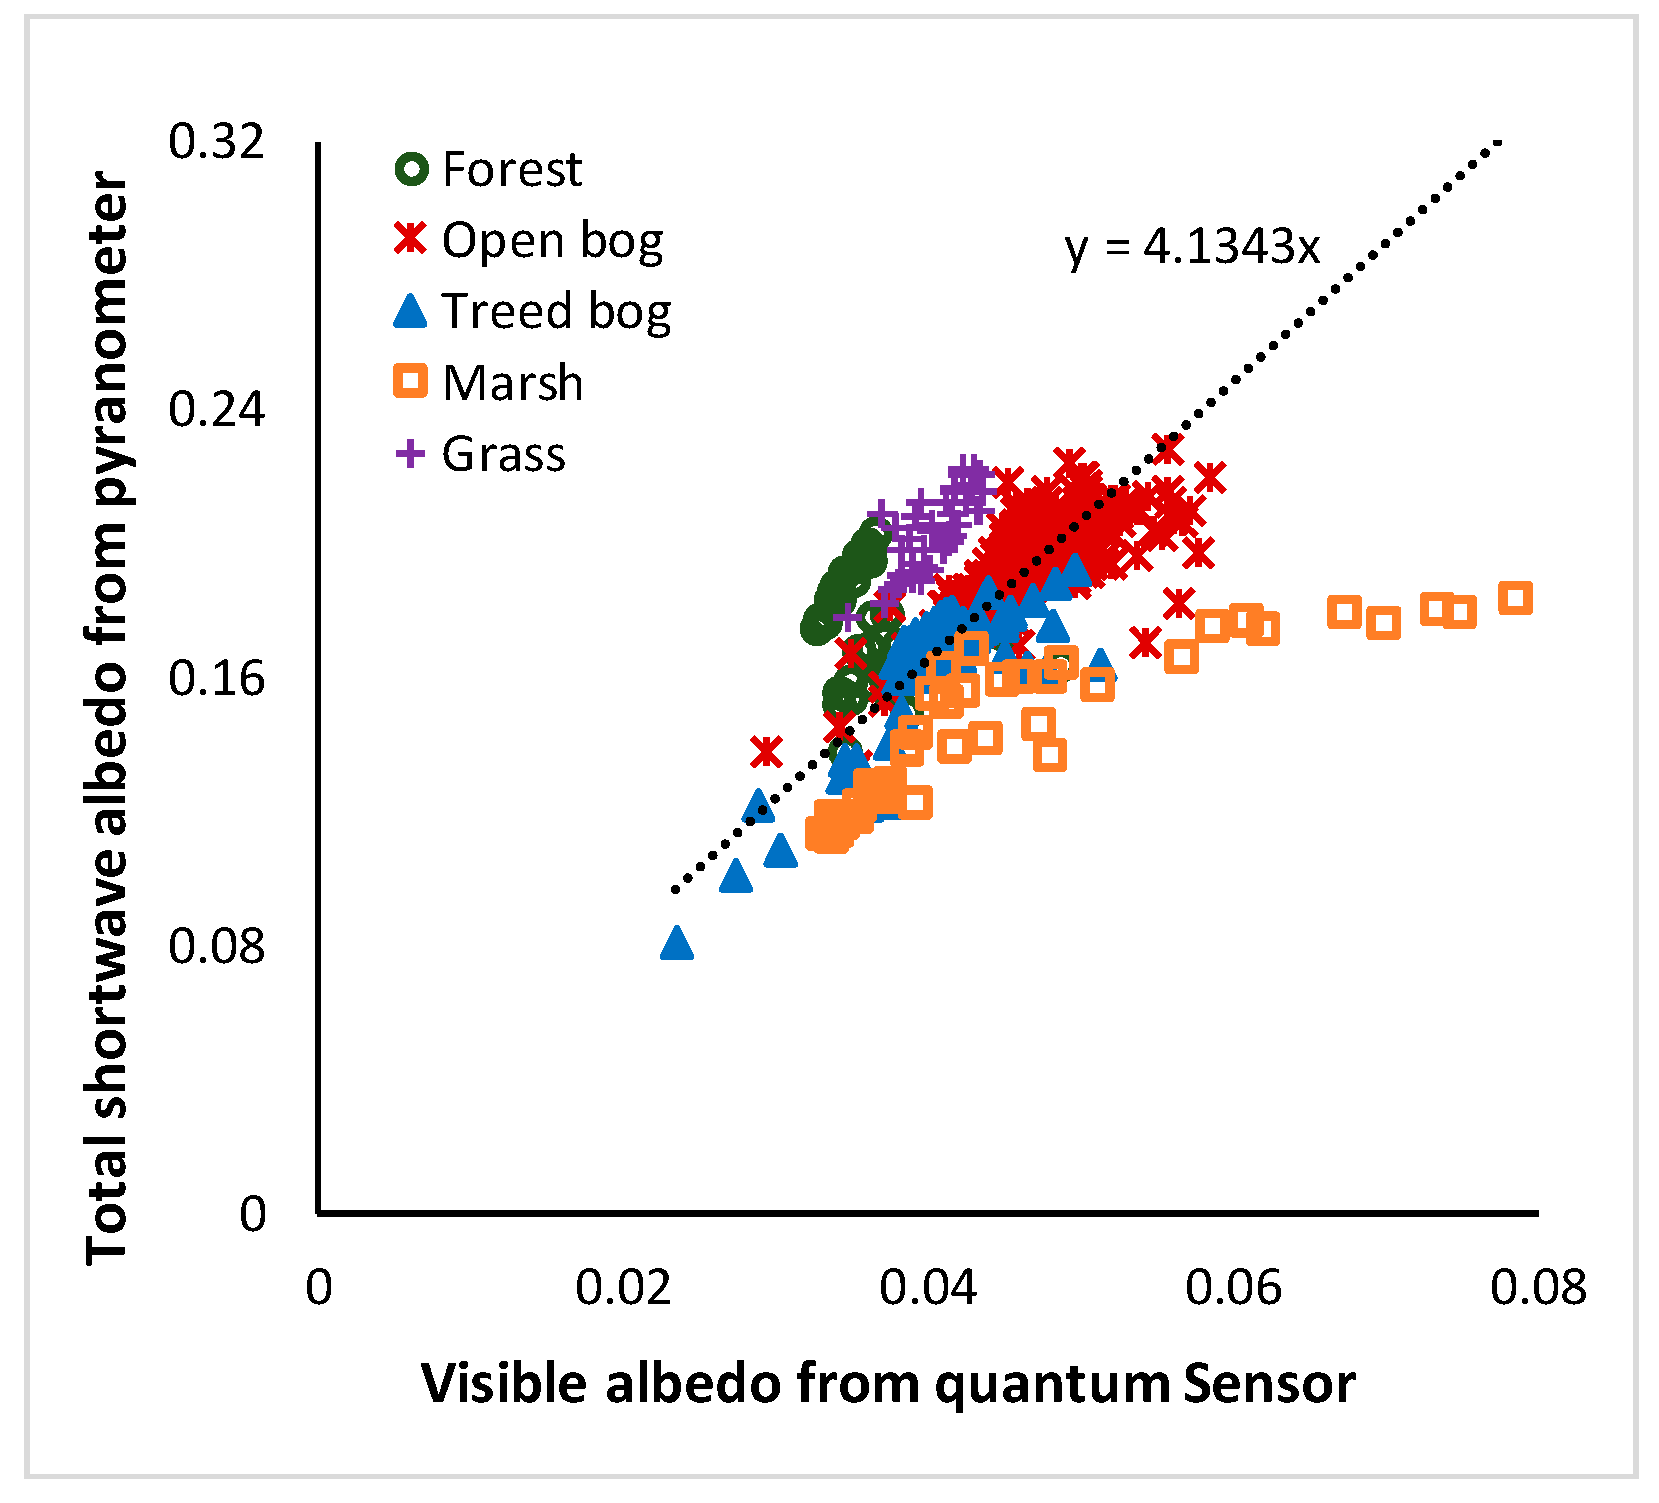
4.3. Visible Albedo from Quantum Sensor

The differences in total shortwave albedo and visible albedo from different land covers can be resolved with some overlap present (Figure 10). Land cover with high green leaf coverage has relatively high total shortwave albedo because of high NIR reflection and low visible albedo as the visible energy is absorbed for photosynthesis. Marsh with dry cattails exhibits relatively high total shortwave albedo compared to wet marsh due to the NIR reflectance as well as high visible albedo due to their low photosynthetic activity. Some of the treed bog have low total shortwave albedo and visible albedo values as a result of the shadow casted by isolated trees. However, based on the measurements from all the landcovers of Mer Bleue wetland, visible albedo from the quantum sensor is about one-fourth of the total shortwave albedo from the pyranometer, because of the difference in spectral response functions (see Figure 2).

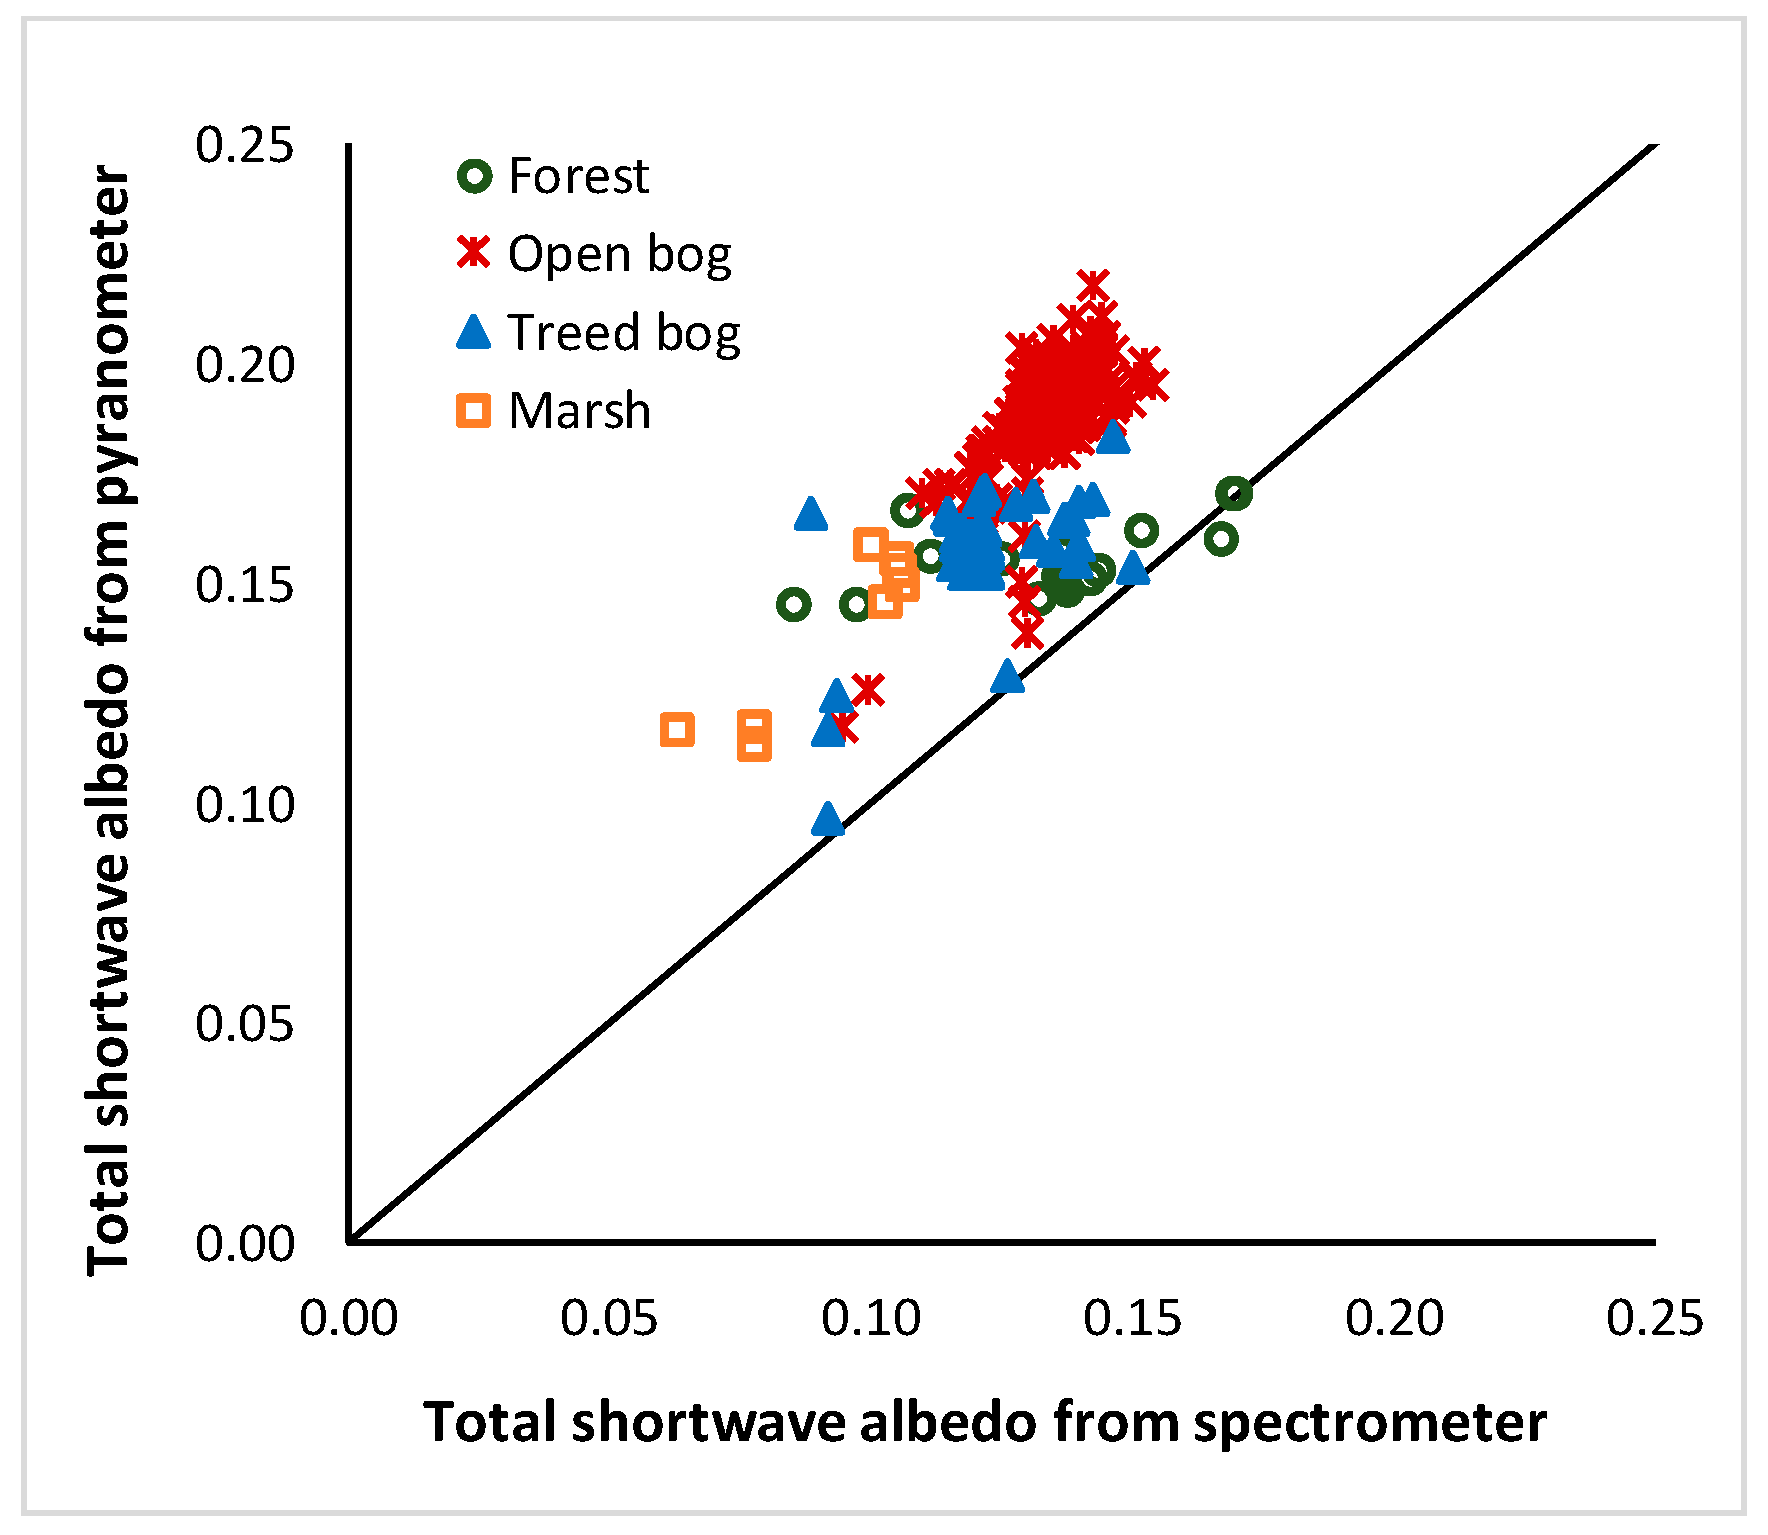
4.4. Hyperspectral Reflectance and Total Shortwave Albedo from Spectrometer

Measurements of vegetated land surfaces are a mixture of different components including dominant plants, other plants, soils, water, shadows, etc [40]. Based on the surface heterogeneity the land surfaces absorb and reflect different amounts of energy at different wavelengths that can be characterized by their spectral response pattern. Due to the growing demand on more accurate prediction of land surface properties for advanced models based on remotely sensed data, spectral response pattern of different land cover types are very demanding. From the hyperspectral reflectance measurements, one can calculate any user-defined vegetation or surface indices [41]. Indices have been used widely for various land surface characterization, such as the Normalized Difference Vegetation Index (NDVI) as an indicator of green biomass, the Photochemical Reflectance Index (PRI) as a good predictor for photosynthetic efficiency or related variables [42], among others. Moreover, hyperspectral reflectance can be converted to total shortwave albedo as described in the methodology. A comparison between total shortwave albedo directly measured from pyranometer and that derived from spectrometer highlights the separation and overlap in response (Figure 11).
The difference between the total shortwave albedo from the pyranometer and spectrometer may be because of 3 reasons: (1) spectral response function of LI-200R Pyrometer, (2) the empirical equation (Equation (2)), which was used to derive the total shortwave albedo of vegetation from spectrometer data, was based on a study of glaciers, and (3) difference in their FOVs. This bias is observable in the data where the pyranometer data has higher values than the spectrometer data (Figure 11). The pyranometer and spectrometer instruments are mounted on board the same platform; however, the differences in their FOVs introduce variations in the ground area that is measured by each sensor. The spectrometer-derived albedo estimates are aggregated to 60 m footprint diameter, which represents about 50% of the actual ground albedo contribution that is measured by the pyranometer. Due to limited spatial extent sampled during the UAV flight, it was not feasible to ‘upscale’ the spectrometer albedo measurements to represent 80% of the pyranometer FOV (850 m) because it would have included all spectrometer albedo ground points.

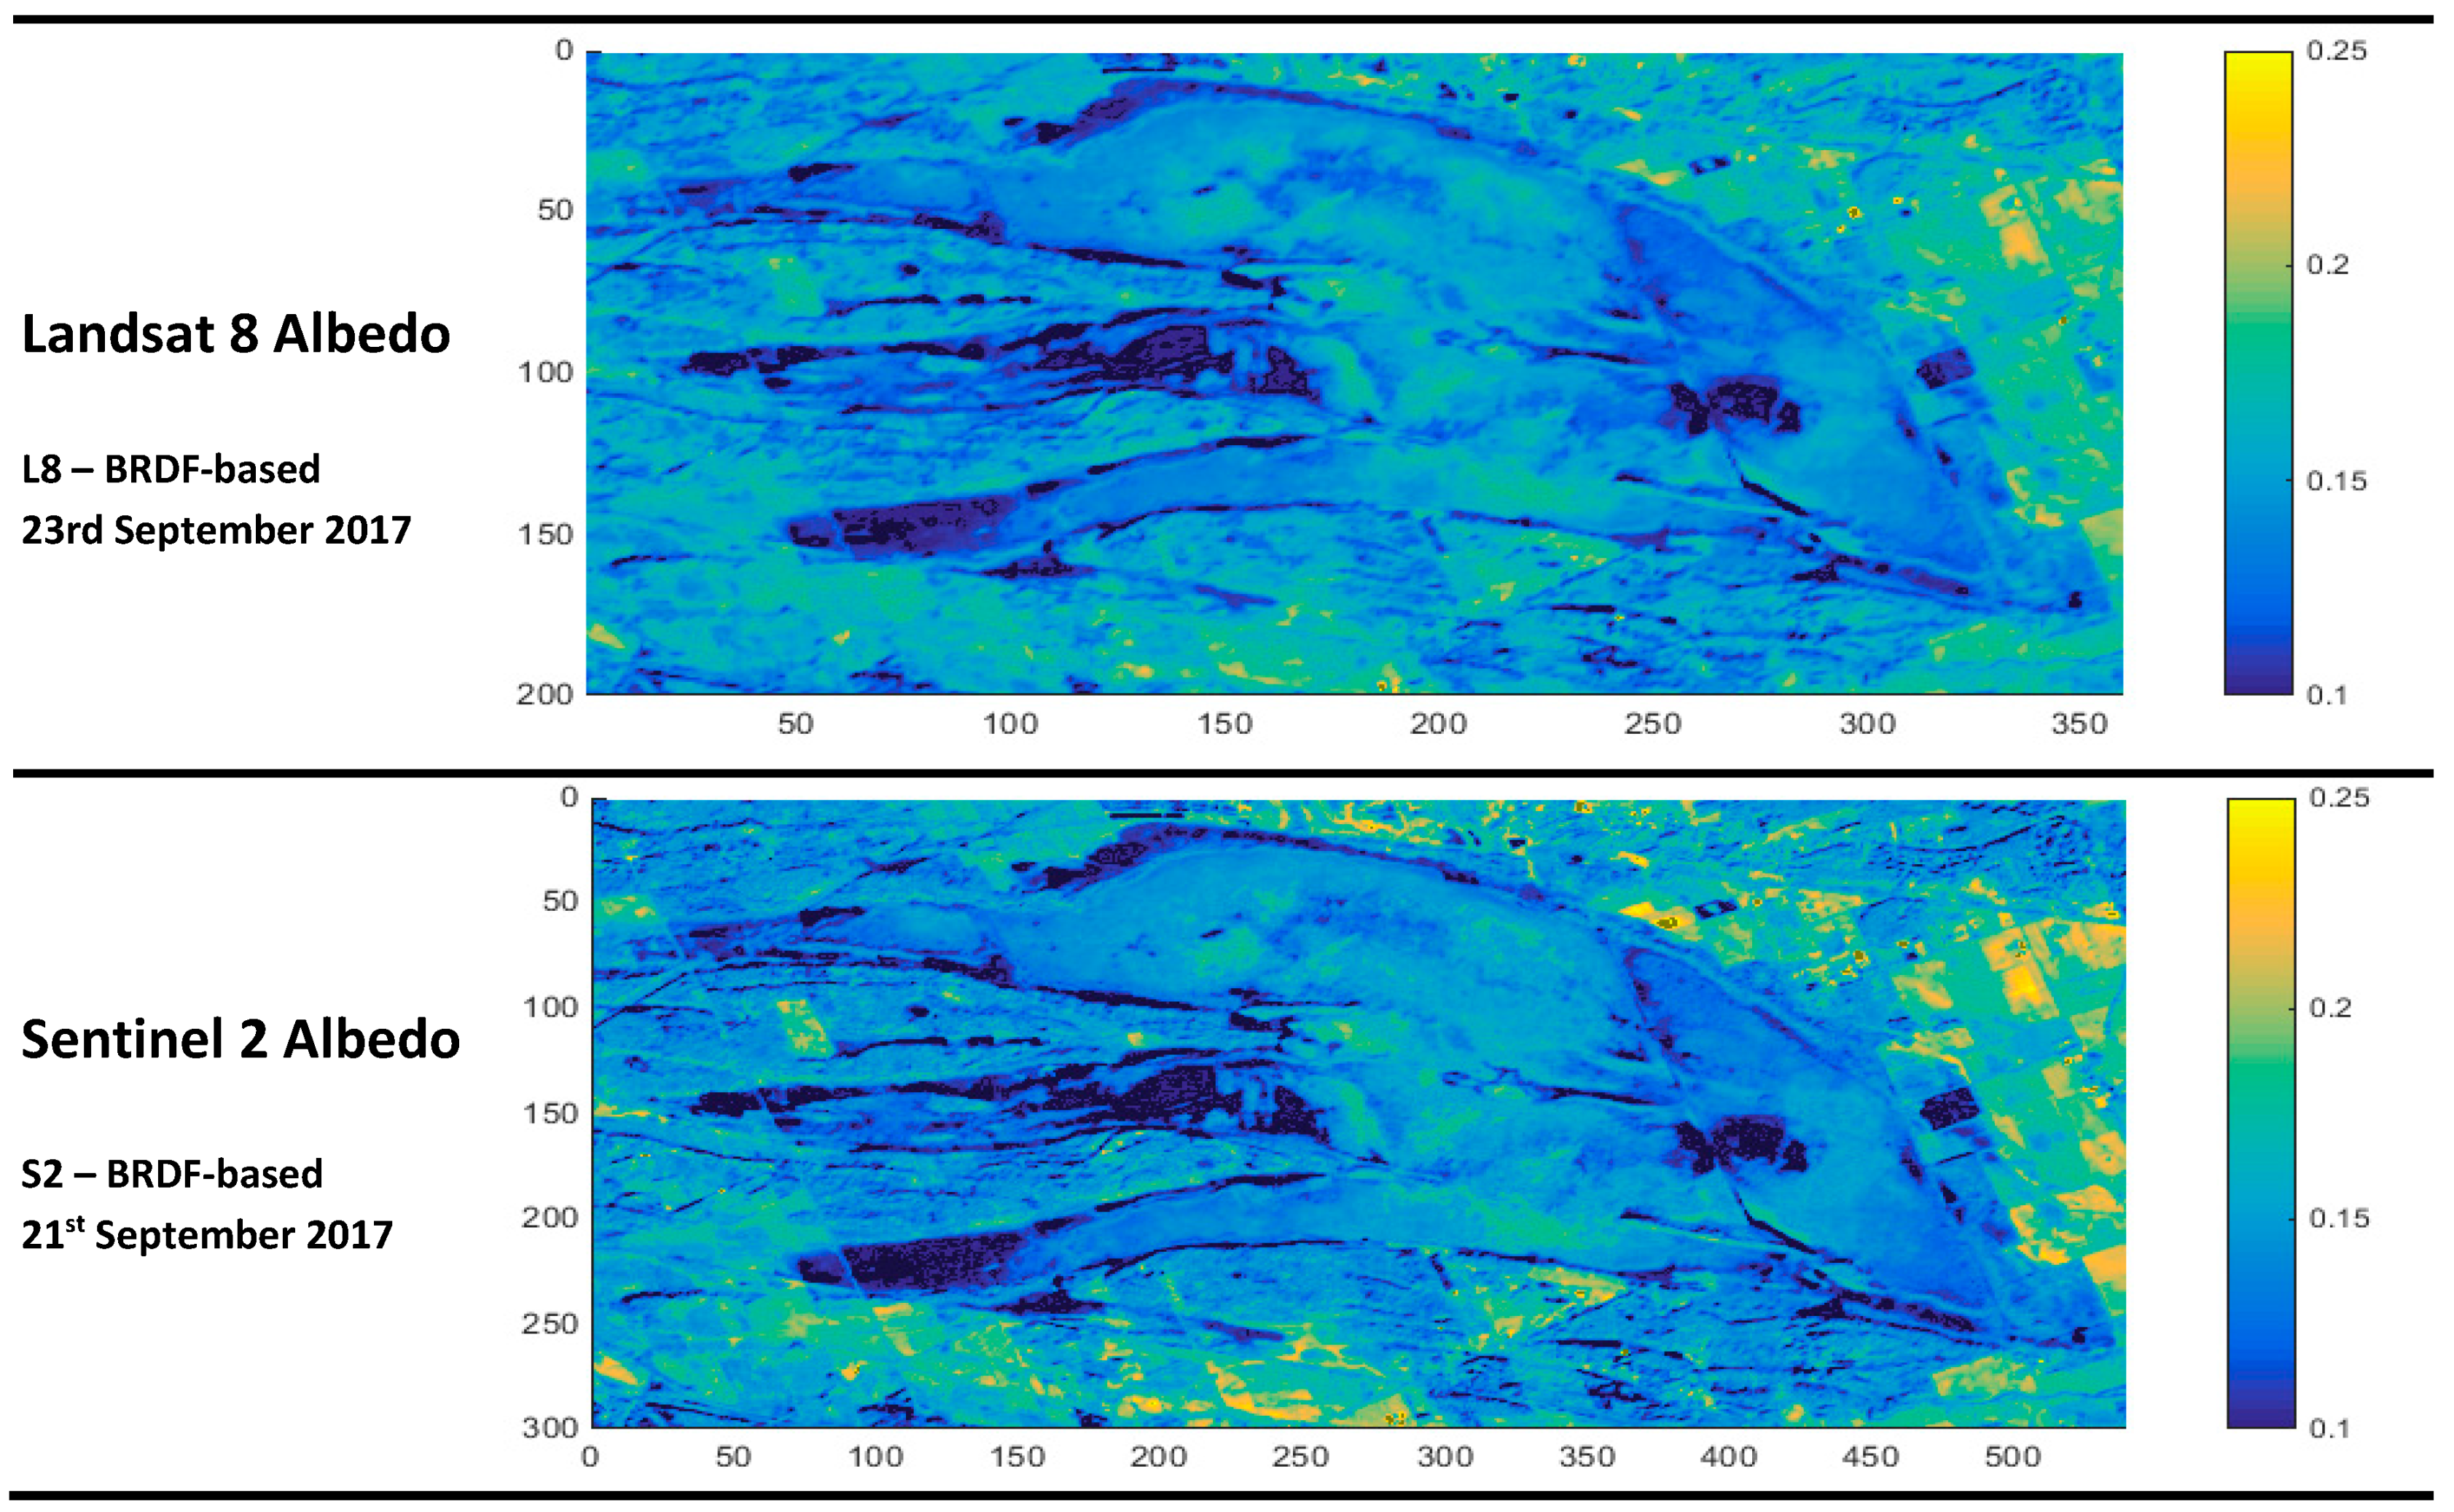
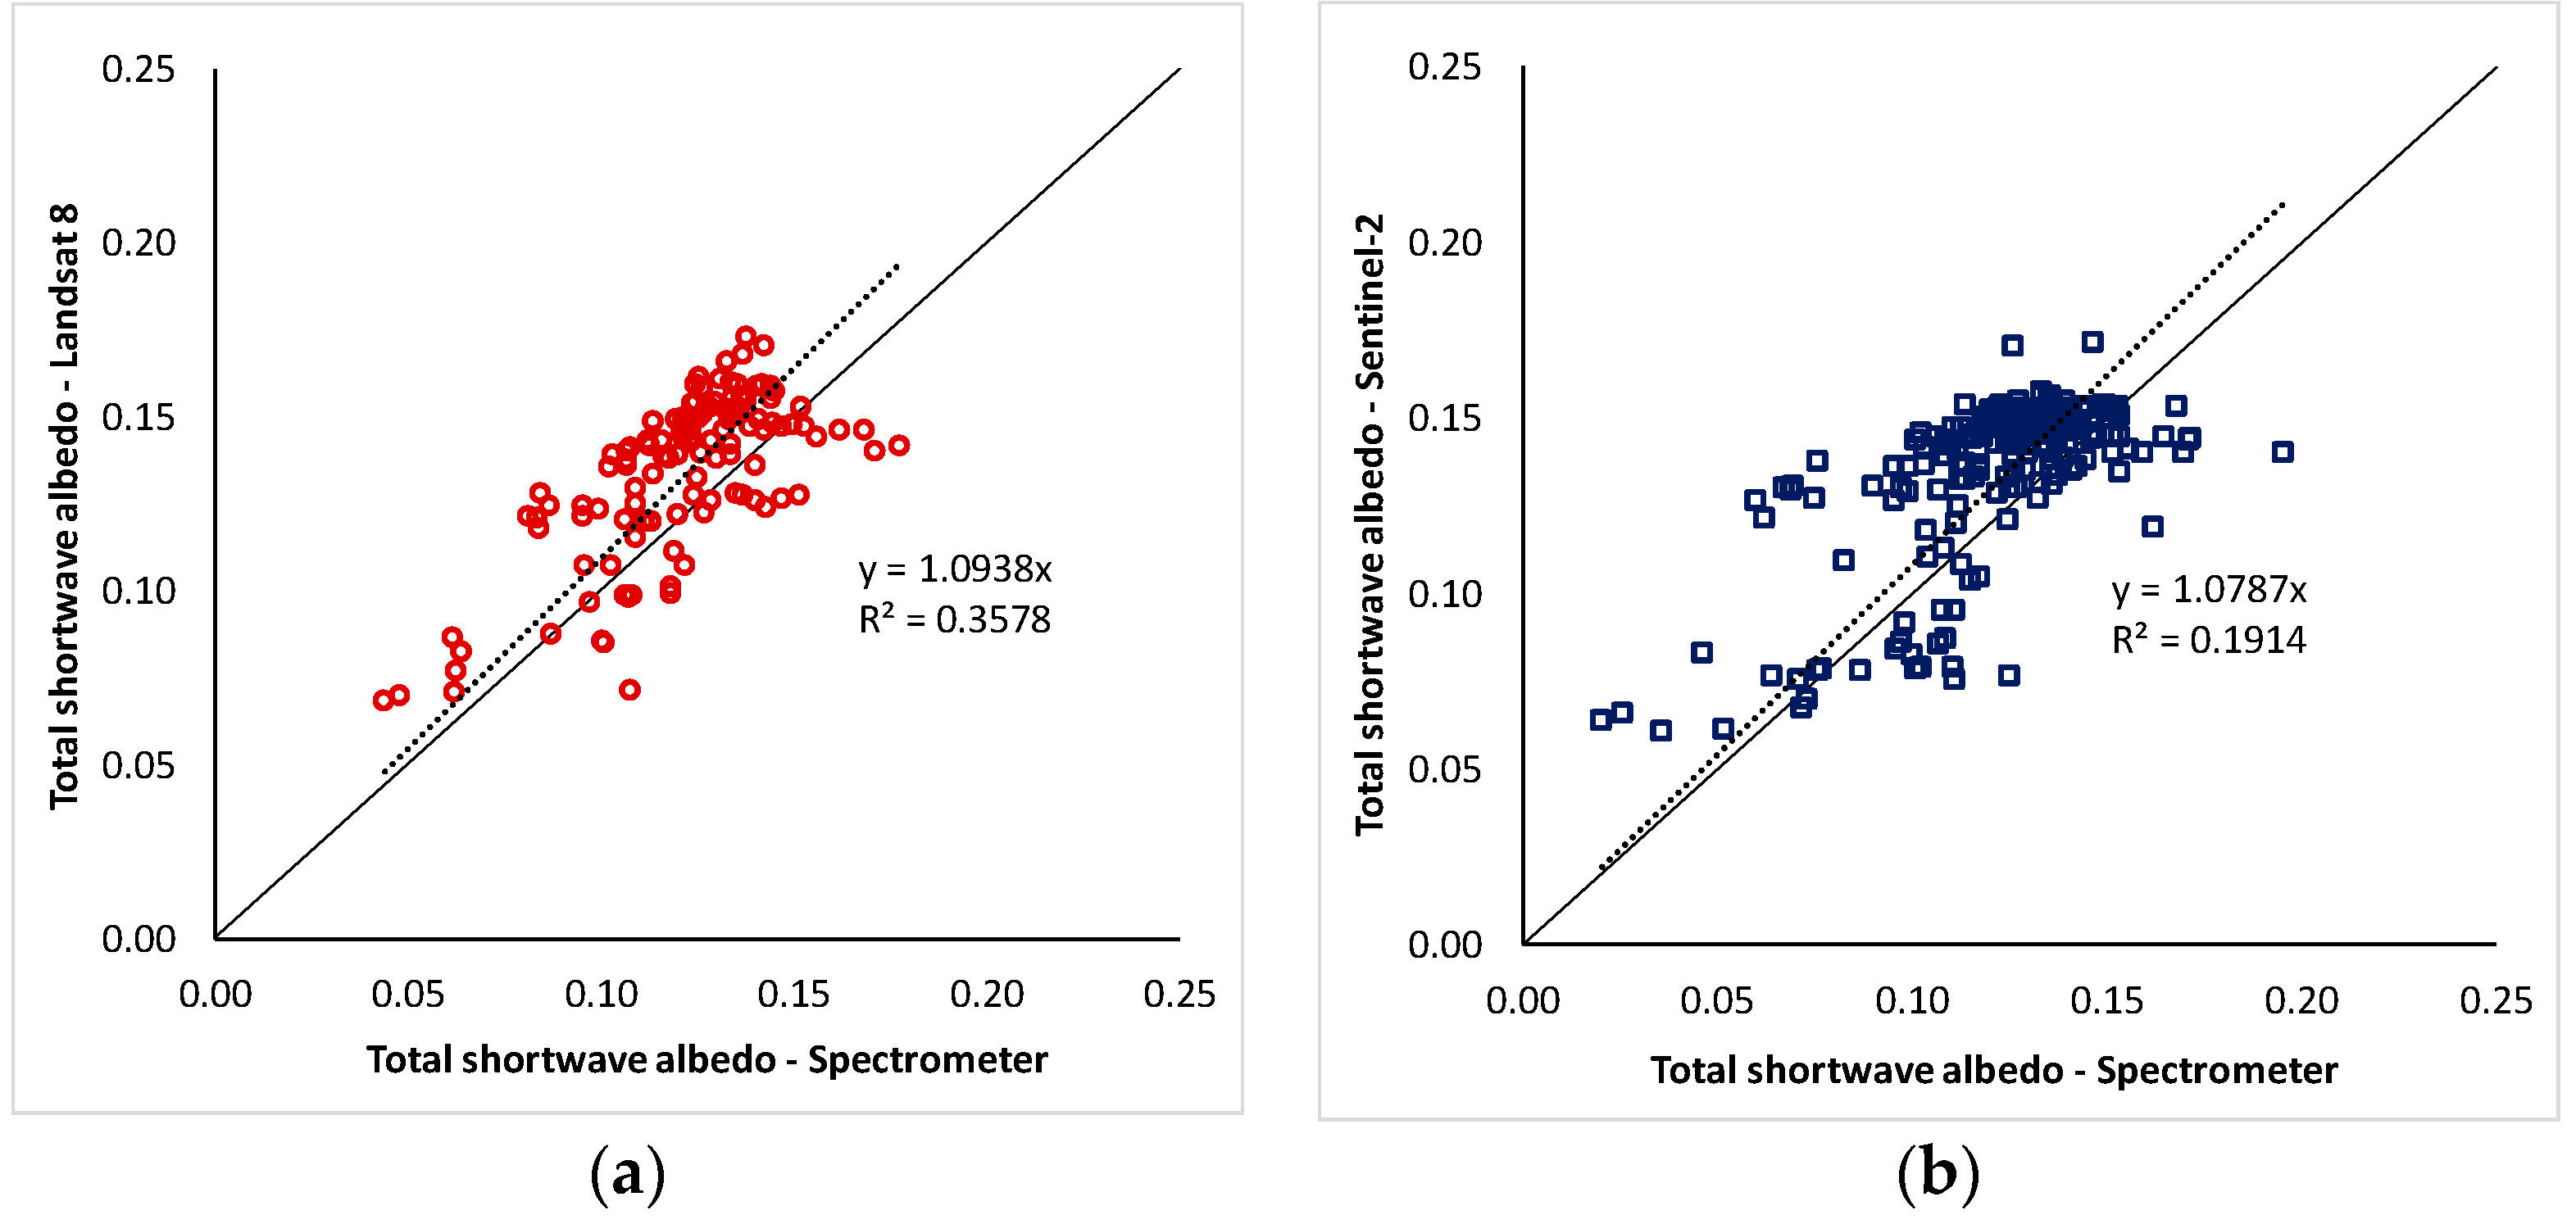
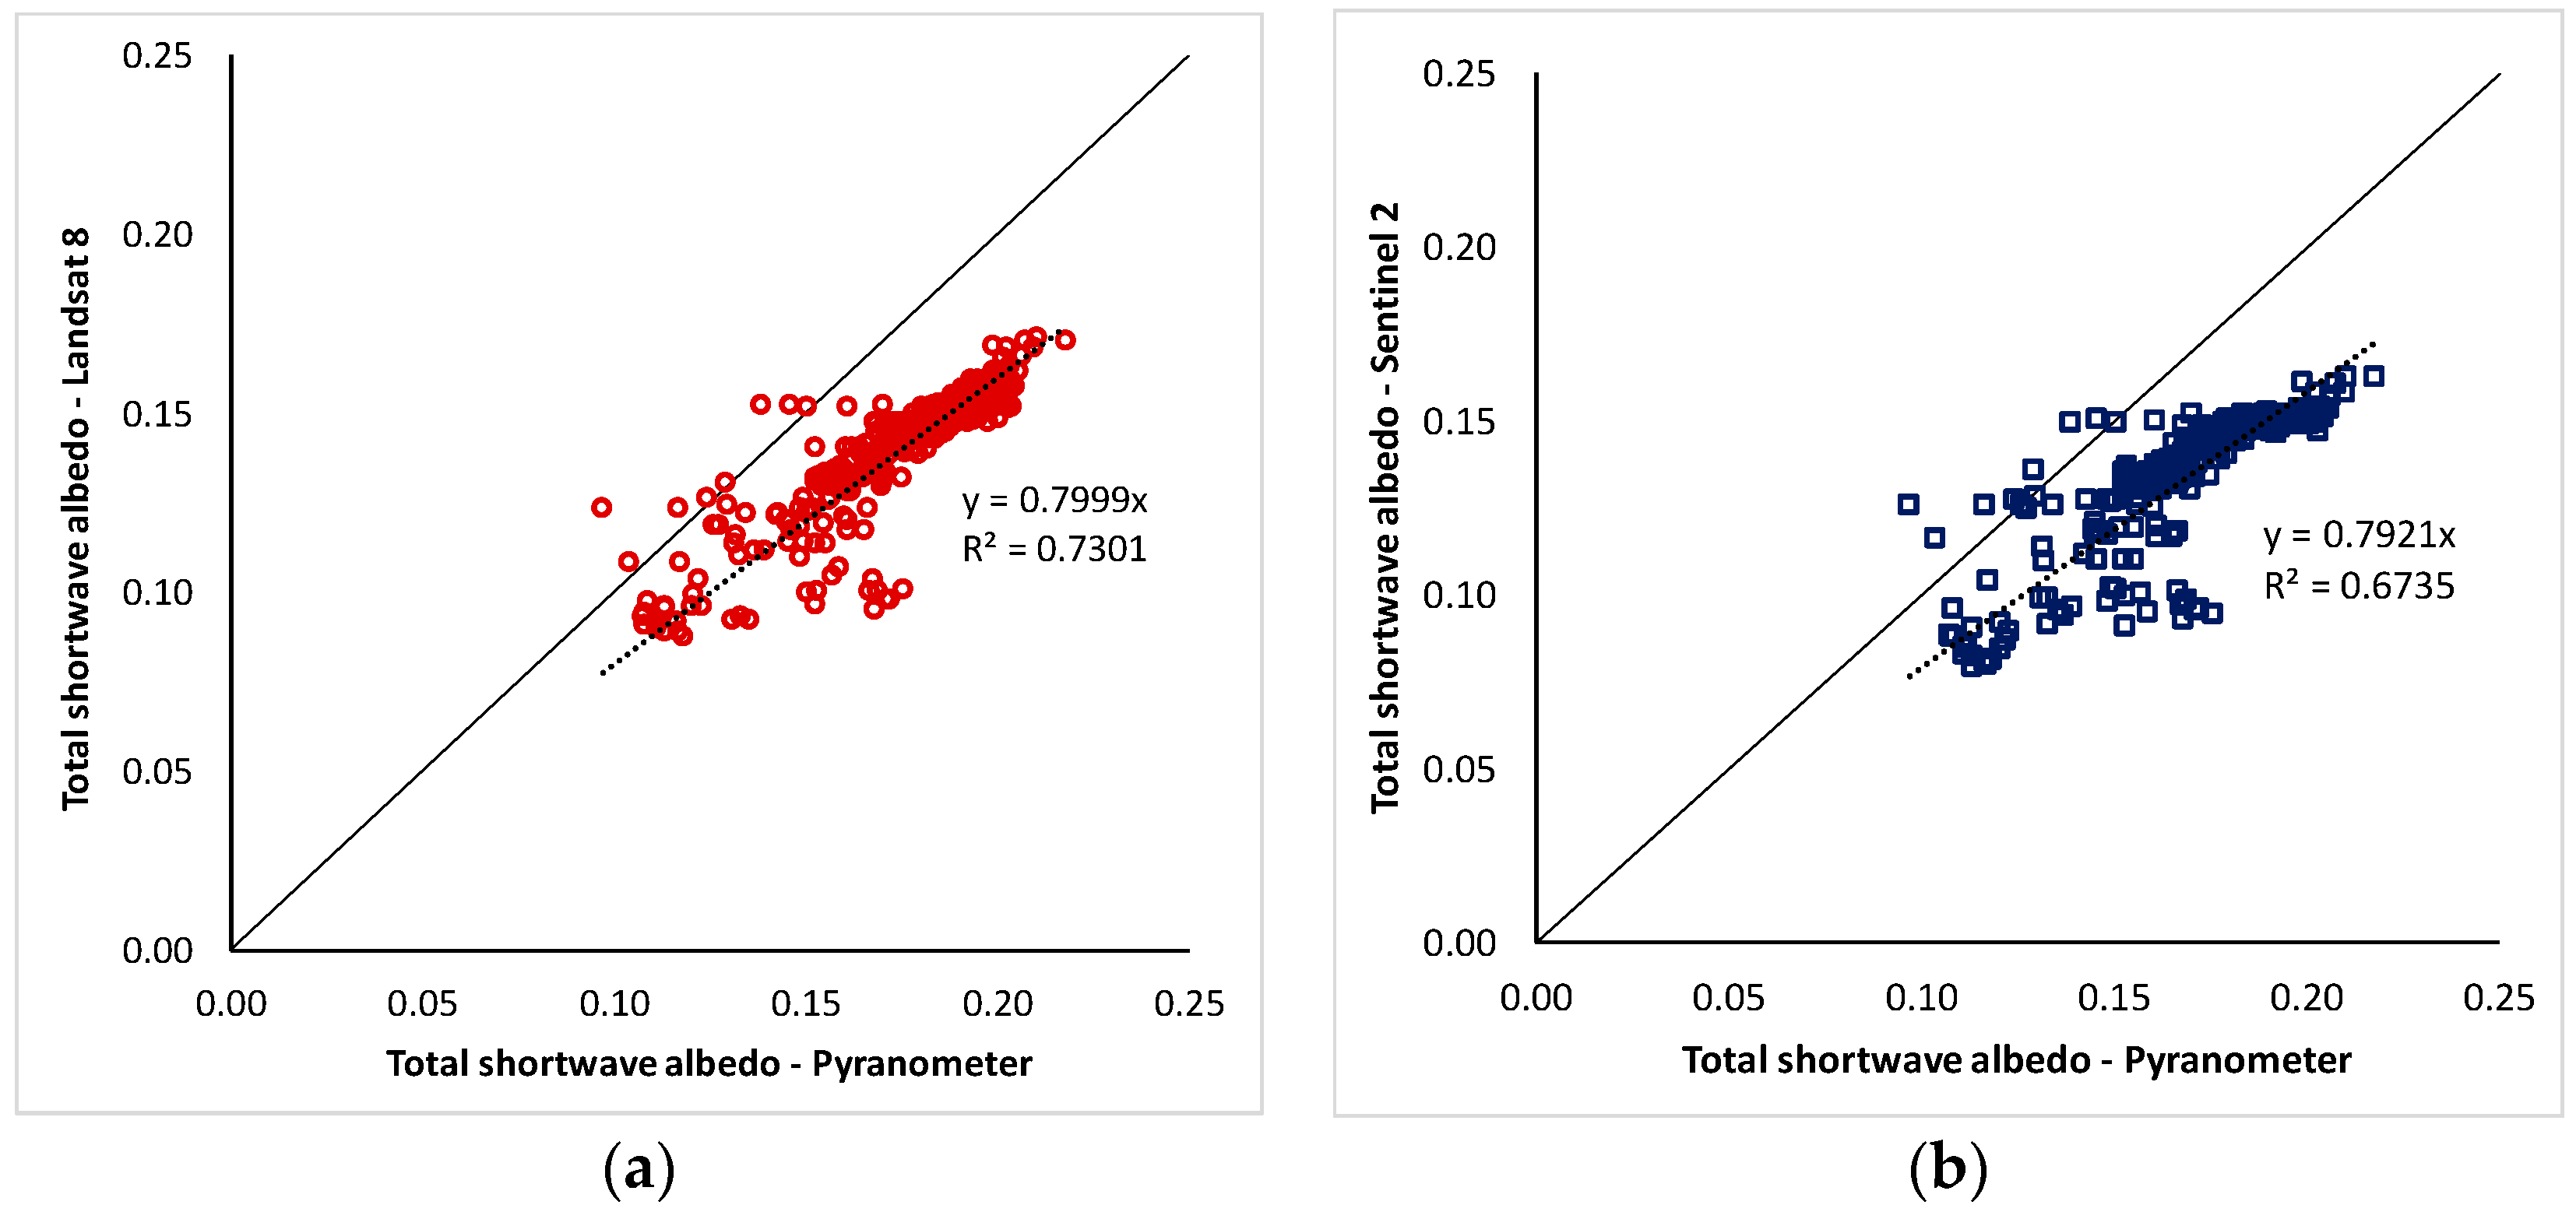
4.5. Comparison UAV-Derived Albedo with Satellite-Derived Albedo

The surface albedo estimates from Landsat 8 and Sentinel-2 satellite data with BRDF correction have good agreement over the Mer Bleue wetland for dates closes to a UAV flight (Figure 12). Our analysis has indicated that the Landsat 8 and Sentinel-2 albedo products demonstrate a strong linear relationship (R2 = 0.82, not shown).
Figure 13 shows a comparison between the total shortwave albedo derived from Landsat 8 and Sentinel-2 and the total shortwave albedo from the pyranometer measurements during the flight on 28 September 2017. The Landsat 8 and Sentinel-2 albedo estimates were aggregated to match the UAV-pyranometer footprint (90° FOV, 60 m diameter) for direct comparison between the two estimates. Theoretically, FOV of the pyranometer is 180° and thus the footprint is infinite. However, the cosine correction is performed for up to 82° of the incidence angle for Li-200R, and 50% of the signal comes from a FOV of 90° and 80% from a FOV of 127° [36]. Therefore, as the average height of the UAV flight is 30 m, 50% of the signal to the downward-facing pyranometer comes from a footprint diameter of 60 m, which is used for the comparison. Data points acquired during cloudy periods were excluded from the analysis, because, variable cloud presence may lead to shadows cast on the ground-based pyranometer, which may lead to low measurements of downward irradiance. This results in erroneously increase albedo calculated from the ratio of the upwelling to the downwelling irradiance.
There is a relatively strong relationships between satellite-derived albedo and directly measured albedo from the pyranometer, across all land cover types (Figure 13; R2 = 0.73 for Landsat 8 and R2 = 0.68 for Sentinel-2). There is a linear bias with satellite-derived albedo underestimated by 20% relative to the values from the pyranometer. The spectral response function of the pyranometer, bias in the satellite-derived albedo estimation and FOVs could explain this (see Section 5.3, Section 5.4 and Section 5.5).
The satellite-derived albedo is compared to spectrometer-derived albedo (Figure 14). The spectrometer-derived albedo is derived at ground sampling footprints of 13.3 m in diameter, and the Landsat 8 and Sentinel-2 albedo estimates are for the original satellite resolutions of 30 m and 20 m, respectively. The results are for the UAV data sampled during the September 28th flight. The satellite-derived albedo estimates and the spectrometer-derived albedo scattered along the 1:1 line. Variations in the relationship between the satellite-derived and spectrometer-derived albedo estimates may also arise from differences in the band characteristics and the spectral range that reflectance data are collected over. Most notably, the spectrometer lacks two SWIR bands that the two satellite sensors possess, which led to a different method used for spectrometer based albedo estimates.

5. Discussion

5.1. Operational UAV Concerns

The UAV sensor system has the potential to characterize a land surface, however, field data acquisition with the UAV sensor system faces several minor challenges such as: limited battery life; slow flight to maintain flight stability; calibration requirements; synchronizing UAV and all the sensors of the UAV and the ground system; and acquiring required permits. Further, the weather conditions such as wind and temperature need to be suitable for stable flight and sensor measurements. Variable clouds could affect the consistencies in the radiation environment between the actual footprint of the UAV sensors and the ground station sensors.

5.2. Issues Related to Mini-Sensors

Compared to standard commercial pyranometers and hyperspectral sensors, small sensors are lightweight, generally more easily mounted on UAV, easily replaced, and cost effective, which allows us to use multiple sensors. We expected some variation between sensors. For example, Li-Cor sensors do not have spectral response function for each individual sensor. However, we performed an inter-comparison between the identical sensors by measuring variable downwelling irradiance at the same time and the result had very good 1:1 correlation. Another issue is that the spectral reflectance of VNIR is from 2 sensors, VIS and NIR, middle portions of the spectrum avoiding the edges from two sensors were merged together. SWIR measurements are useful for various application mainly for estimating total shortwave albedo. But, Ocean optics does not produce small SWIR sensor suitable for UAV.

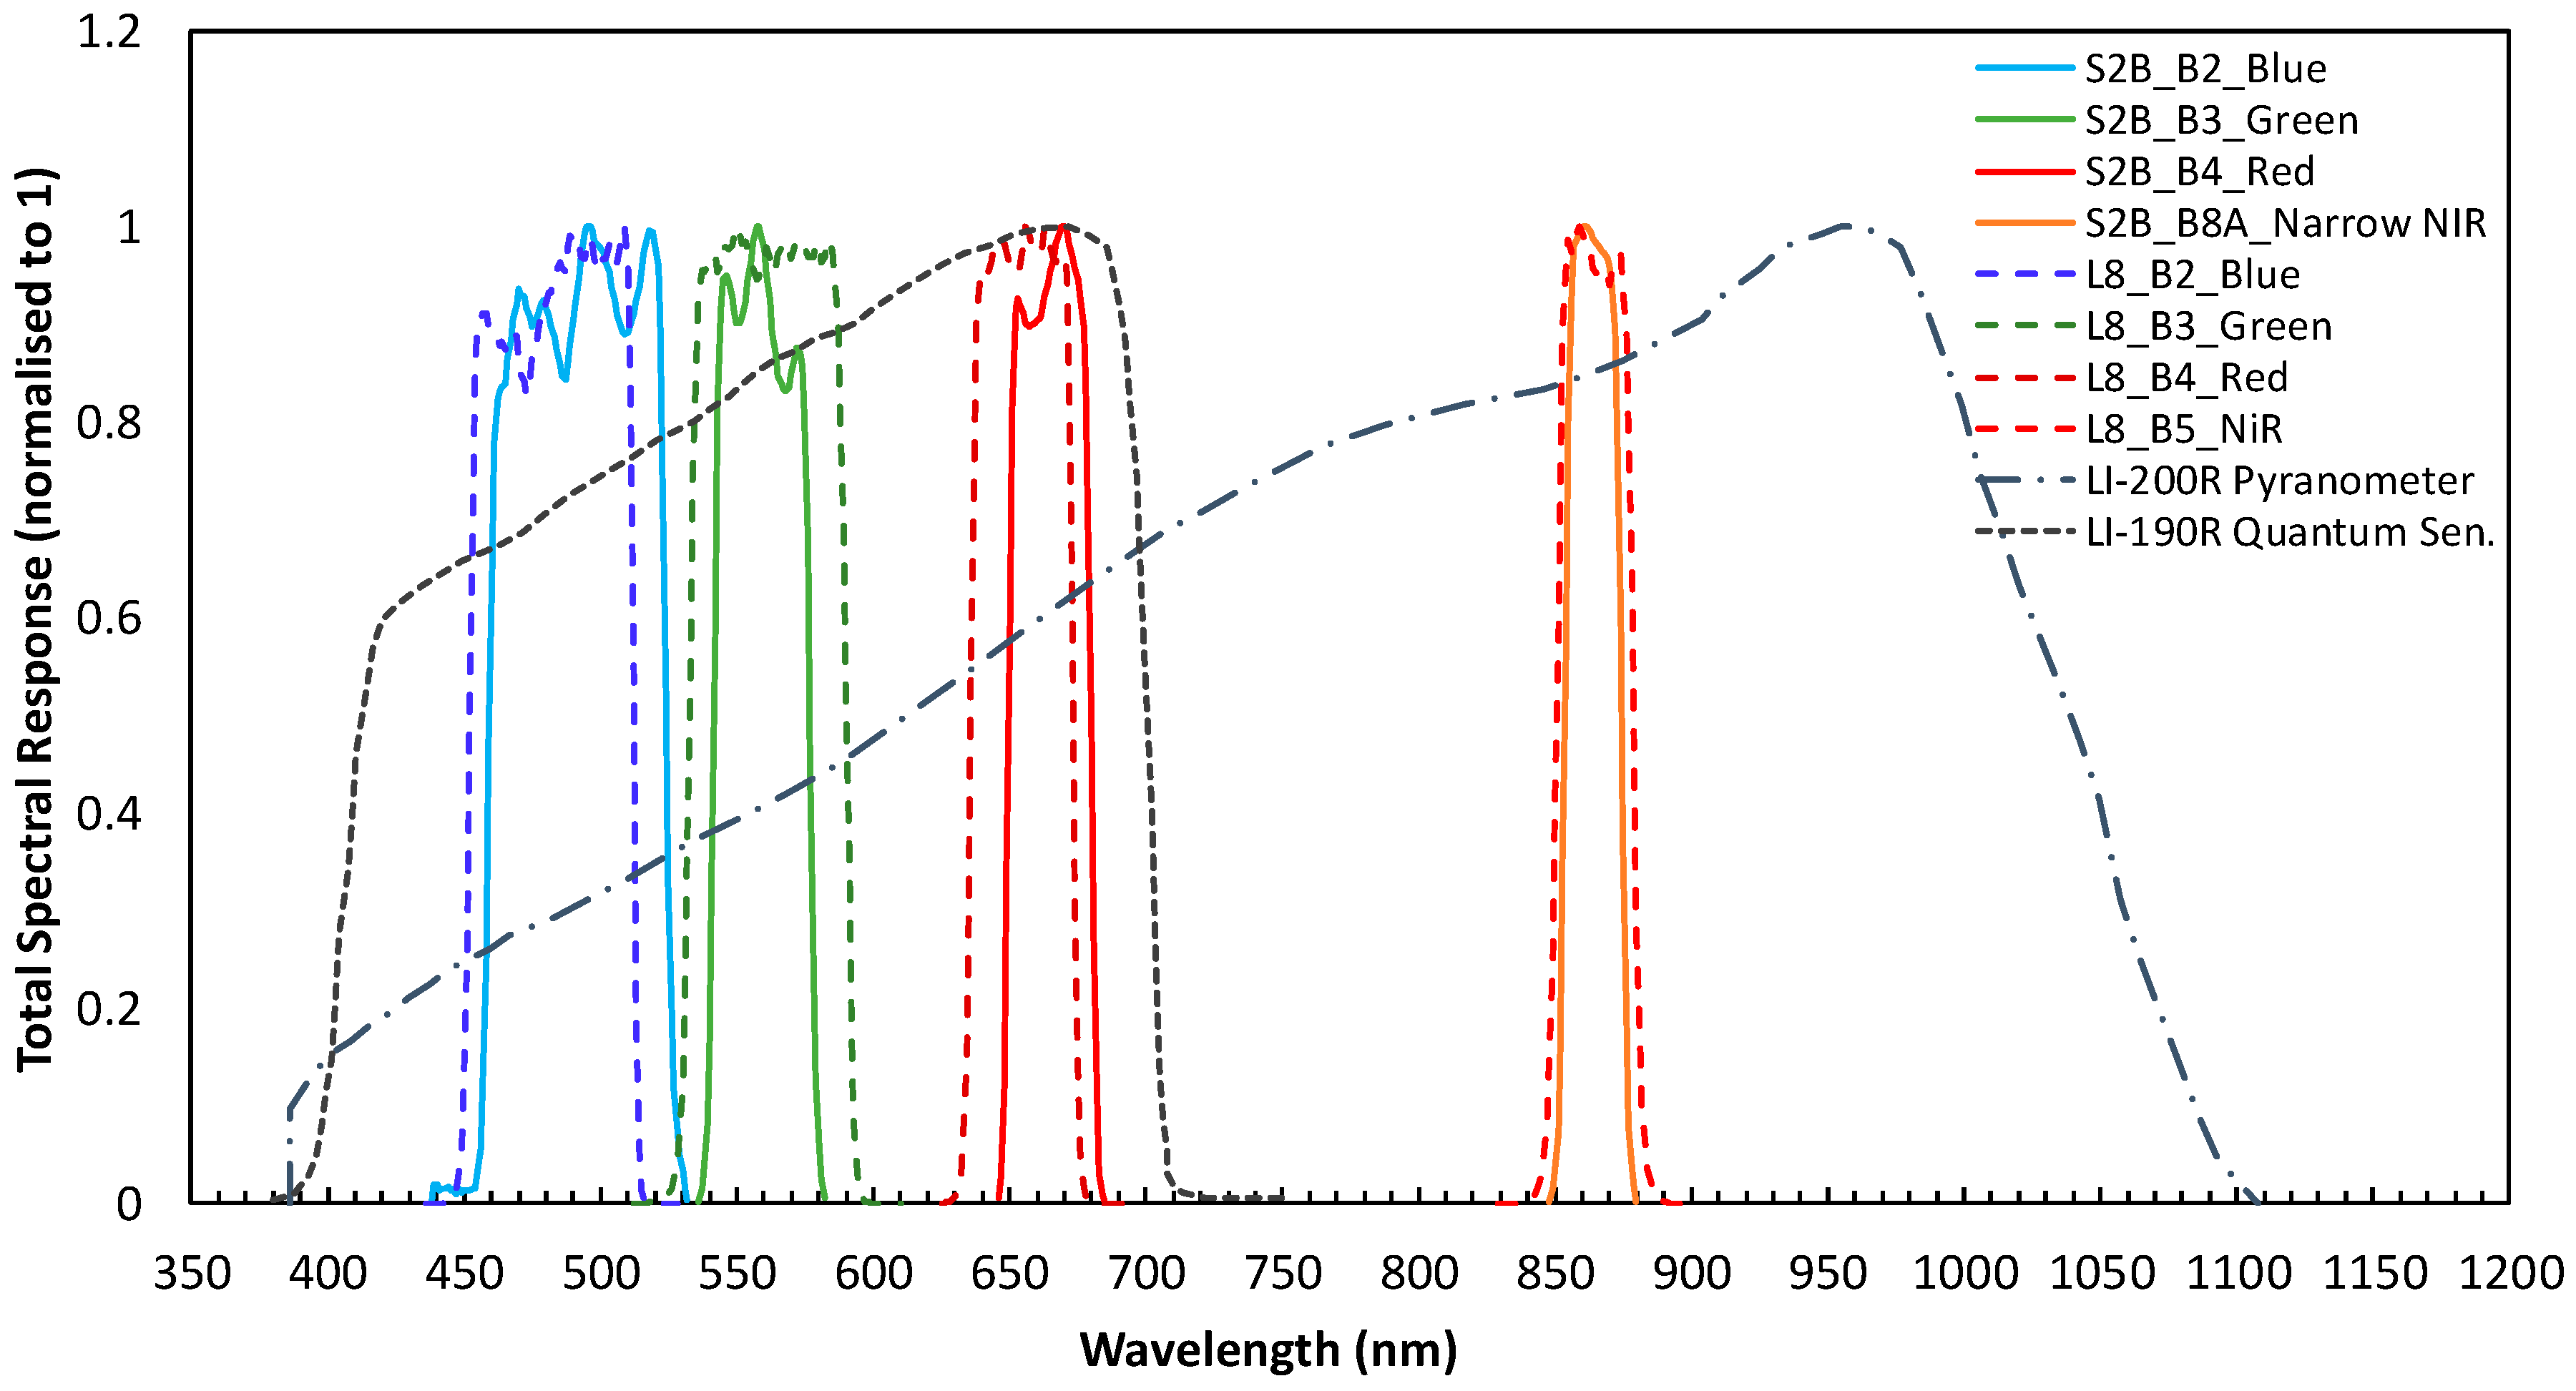
5.3. Spectral Response Functions

The Li-Cor pyranometer is small in size and mass, however, the limited spectral sensitivity (400 nm to 1100 nm) of the pyranometer is a disadvantage [43]. In the case of snow, the Li-Cor 200SZ reflected radiation data with a positive bias when compared to standard optical black thermopile instruments that have a nearly uniform response in the full ultraviolet to infrared (285–2800 nm) range [43]. Whilst the Li-Cor pyranometer samples broadband reflectance, rather than in discrete narrow bands, its spectral response function has a higher contribution of sampled irradiance from NIR (Figure 2). However, even more importantly, the pyranometer only measured visible-NIR wavelengths and does not cover SWIR region. This may have a disproportionately high effect if there are variations in vegetation or soil water content between land covers, or over space and time. In only sampling to the NIR, this implies an inherent assumption that there will be little variation across the remainder of the solar spectrum. This uncertainty in the total surface albedo measurements could be one of the main sources of linear bias in the results, with satellite-derived albedo underestimated, relative to the pyranometer results.

5.4. Satellite Based Albedo Estimation
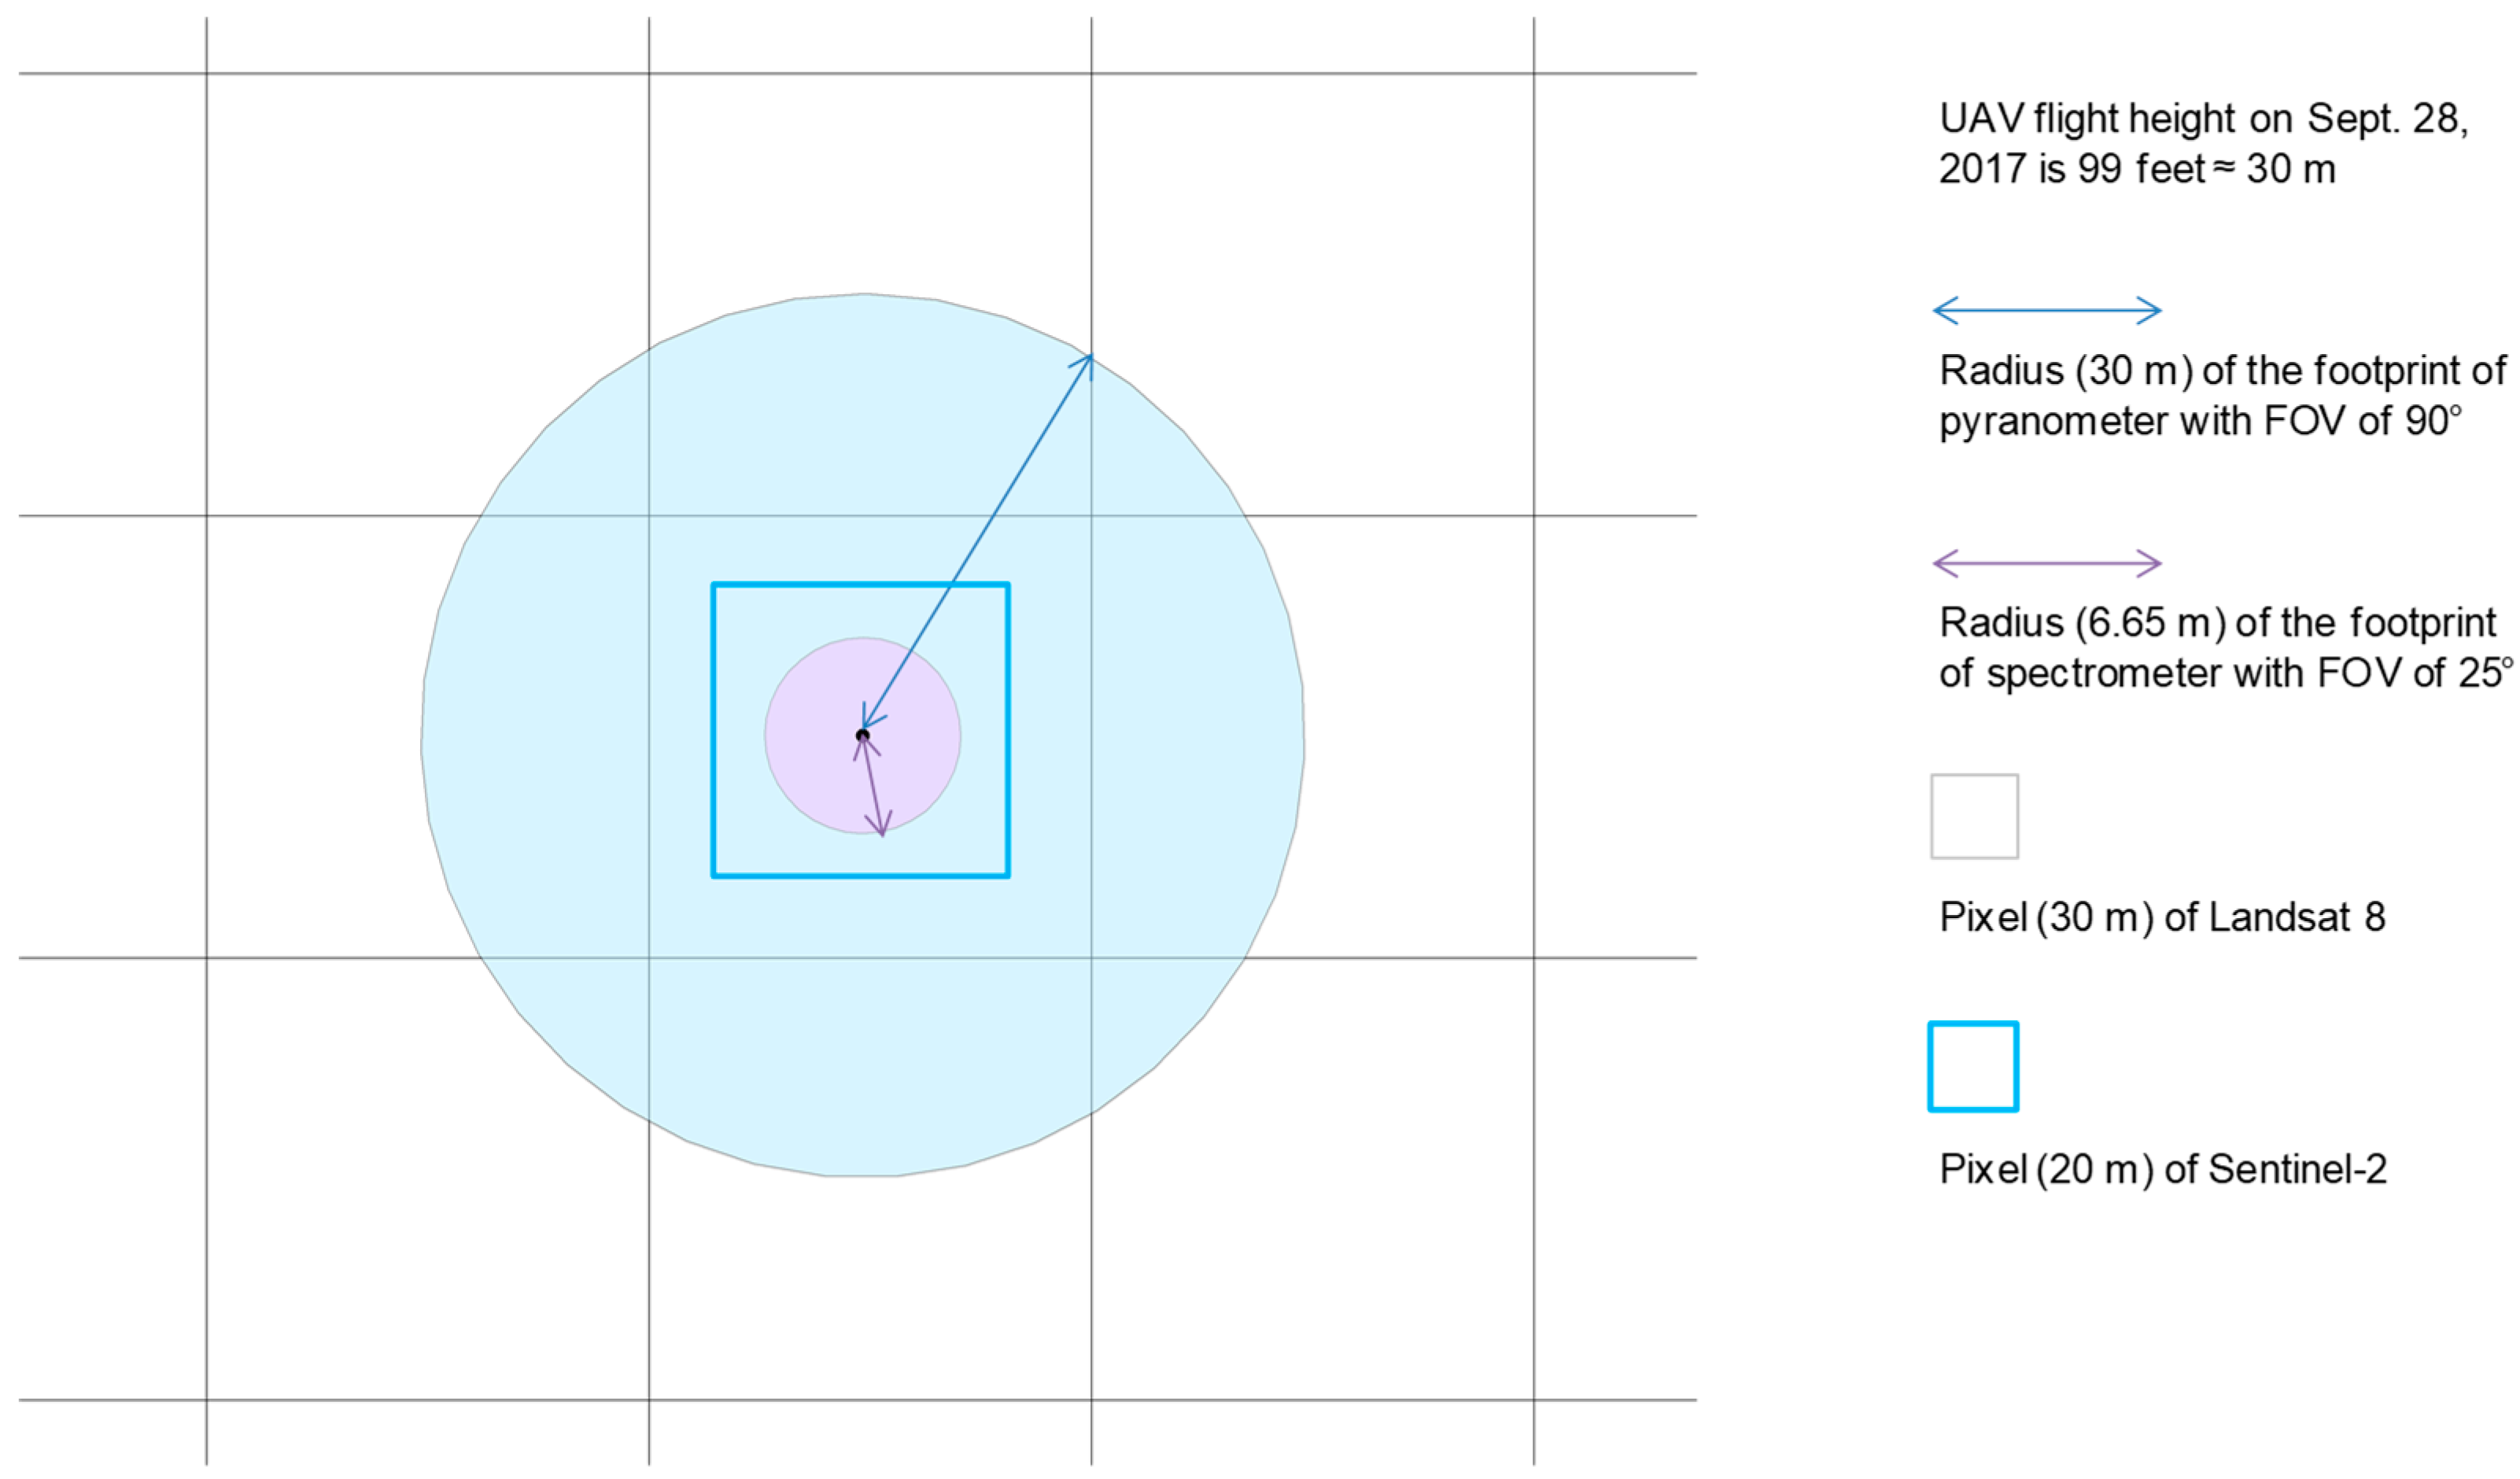
There are a number of well-used empirical coefficients that have been used to convert satellite measured spectral reflectance or radiance into total shortwave albedo [34,44]. However, most of the empirical equations (including Equations (4) and (5)) are based on wide range of albedo data from various landcovers with different shape of spectral reflectance, compared to the vegetation cover in the study are. Further, these empirical methods sometimes neglect to take into consideration the surface anisotropy of the land cover present. Naegeli et al. [35] found that surface anisotropy accounts for an underestimation of albedo of up to 10%, depending on the surface type. Darker surfaces are more sensitive to anisotropy correction compared to brighter surfaces [35]. Furthermore, the time of data acquisition may also lead to uncertainties in the retrieved albedo product [14].

5.5. Field of View

In previous studies, validation of satellite-retrieved albedo using directly measured albedo from radiation sensors was usually conducted with fixed, ground or tower-mounted instruments [38]. The novel use of an on board, UAV-based sensors allows direct albedo measurements in a spatially-continuous manner and provides opportunity to validate satellite estimates using more validation points and, importantly a variety of land covers. Other than that, by averaging multiple UAV-derived albedo values within one pixel of remote sensing image, the issue of upscaling from point measurement to the pixel level can be alleviated. In this case, 50% of contributions to the pyranometer albedo are coming from outside of the 60 m diameter footprint that is compared with aggregated Landsat 8 and Sentinel-2 60 m pixels. Greater uncertainty and error will arise when this is within a heterogeneous landscape, and particularly in landscapes where the albedos from different land covers are very different from each other, such as treed bog adjacent to open bog.

6. Conclusions

This research evaluated the use of a UAV-system for deriving and monitoring surface albedo over a wetland ecosystem for operational hydrological monitoring at fine spatial-scales and short temporal intervals. Pairs of low-cost and lightweight VIS and NIR spectrometers, pyranometers and quantum sensors were used on the ground and on the UAV for measuring downwelling irradiance and upwelling radiance, respectively. Videos from UAV mounted camera was used for extracting land surface structural information and reflectance from spectrometers were used for categorising land surface spectral characteristics. Comparison of total shortwave albedo from spectrometers and total shortwave albedo from pyranometer, allowed quantitative evaluation of the direct albedo from pyranometer against Landsat 8 and Sentinel-2 derived albedo. There were relatively little differences in total shortwave albedo derived from Landsat 8 and Sentinel-2 images, likely due to their similar spectral response functions and spatial resolution, with both satellite results having a strong performance with direct total shortwave albedo measurements from UAV pyranometer (R2 = 0.73 and R2 = 0.68, respectively). However, there is a 20% underestimation that could be due to limited spectral range of LI-200R, generalized use of empirical satellite albedo retrieval equations, and/or the restricted 50% pyranometer FOV that is used for comparison with the satellite pixels. This study demonstrates the potential of a UAV platform for bridging the gap between fixed point, in-situ albedo measurements and pixel-level measurements by satellites, for producing accurate, time sensitive and fine-scale spatially continuous albedo measurements for hydrological monitoring over sensitive and dynamic wetland environments.

Author Contributions

Conceptualization, F.C. and S.W.; Data curation, F.C., S.G.L. and R.W.; Formal analysis, F.C., S.G.L., H.C. and R.W.; Funding acquisition, S.W. and H.A.J.R.; Investigation, F.C., S.W., H.C., S.G.L. and J.C.; Methodology, F.C., S.W., H.C., J.C. and R.W.; Project administration, S.W. and H.A.J.R.; Writing—Original Draft, F.C.; Writing—Review & Editing, S.W., H.C., H.A.J.R. and R.W.

Funding

The UAV-Sensor system has been developed with financial-support from Natural Resources Canada Canada Centre for Mapping and Earth Observation - Water Program; and Geological Survey of Canada - Ground Water Geoscience, and Climate Change Geoscience programs.

Acknowledgments

The authors gratefully acknowledge the support from the CCRS management team for this activity. We are also immensely grateful to Alexander Trichtchenko and Fuqun Zhou for their comments on an earlier version of the manuscript. We thank the editors and anonymous reviewers, who provided scientific and editorial peer review of the manuscript and helpful comments to improve the content.

Conflicts of Interest

The authors declare no conflict of interest.

References

  1. Wang, S.; Trishchenko, A.P.; Sun, X. Simulation of canopy radiation transfer and surface albedo in the EALCO model. Clim. Dyn. 2007, 29, 615–632. [Google Scholar] [CrossRef]
  2. Franch, B.; Vermote, E.; Claverie, M. Intercomparison of Landsat albedo retrieval techniques and evaluation against in situ measurements across the US SURFRAD network. Remote Sens. Environ. 2014, 152, 627–637. [Google Scholar] [CrossRef]
  3. Carter, G.A. Responses of leaf spectral reflectance to plant stress. Am. J. Bot. 1993, 80, 239–243. [Google Scholar] [CrossRef]
  4. Davidson, A.; Wang, S. The effects of sampling resolution on the albedos of dominant land cover types in the North American boreal region. Remote Sens. Environ. 2004, 93, 211–224. [Google Scholar] [CrossRef]
  5. Davidson, A.; Wang, S. Spatio-temporal variations in land surface albedo across Canada from MODIS observations. Can. J. Remote Sens. 2005, 31, 377–390. [Google Scholar] [CrossRef]
  6. Hanesiak, J.M.; Stewart, R.E.; Bonsal, B.R. Characterization and summary of the 1999-2005 Canadian prairie drought. Atmos. Ocean 2011, 49, 1–32. [Google Scholar] [CrossRef]
  7. Wang, S.; Trishchenko, A.P.; Khlopenkov, K.V.; Davidson, A. Comparison of International Panel on Climate Change Fourth Assessment Report climate model simulations of surface albedo with satellite products over northern latitudes. J. Geophys. Res. 2006, 111, D21108. [Google Scholar] [CrossRef]
  8. Betts, A.K.; Ball, J.H. Albedo over the boreal forest. J. Geophys. Res. 1997, 102, 28901–28910. [Google Scholar] [CrossRef]
  9. Qu, Y.; Liang, S.; Liu, Q.; He, T.; Liu, S.; Li, X. Mapping surface broadband albedo from satellite observations: A review of literatures on algorithms and products. Remote Sens. 2015, 7, 990–1020. [Google Scholar] [CrossRef]
  10. Schaaf, C.B.; Gao, F.; Strahler, A.H.; Lucht, W.; Li, X.; Tsang, T.; Strugnell, N.C.; Zhang, X.; Jin, Y.; Muller, J.P.; et al. First operational BRDF, albedo nadir reflectance products from MODIS. Remote Sens. Environ. 2002, 83, 135–148. [Google Scholar] [CrossRef]
  11. Trishchenko, A.P.; Luo, Y.; Khlopenkov, K.V.; Wang, S. A method to derive the multi-spectral surface albedo consistent with MODIS from historical AVHRR and VGT satellite data. J. Appl. Meteorol. Climatol. 2008, 47, 1199–1221. [Google Scholar] [CrossRef]
  12. Maignan, F.; Bréon, F.M.; Lacaze, R. Bidirectional reflectance of Earth targets: Evaluation of analytical models using a large set of spaceborne measurements with emphasis on the Hot Spot. Remote Sens. Environ. 2004, 90, 210–220. [Google Scholar] [CrossRef]
  13. Geiger, B.; Carrer, D.; Franchistéguy, L.; Roujean, J.L.; Meurey, C. Land surface albedo derived on a daily basis from Meteosat Second Generation observations. IEEE Trans. Geosci. Remote Sens. 2008, 46, 3841–3856. [Google Scholar] [CrossRef]
  14. Ryan, J.C.; Hubbard, A.; Box, J.E.; Brough, S.; Cameron, K.; Cook, J.M.; Cooper, M.; Doyle, S.H.; Edwards, A.; Holt, T. Derivation of high spatial resolution albedo from UAV digital imagery: Application over the Greenland Ice Sheet. Front. Earth Sci. 2017, 5, 40. [Google Scholar] [CrossRef]
  15. Adão, T.; Hruška, J.; Pádua, L.; Bessa, J.; Peres, E.; Morais, R.; Sousa, J.J. Hyperspectral imaging: A review on UAV-Based Sensors, Data Processing and Applications for Agriculture and Forestry. Remote Sens. 2017, 9, 1110. [Google Scholar] [CrossRef]
  16. Burkhart, J.F.; Kylling, A.; Schaaf, C.B.; Wang, Z.; Bogren, W.; Storvold, R.; Solbø, S.; Pedersen, C.A.; Gerland, S. Unmanned aerial system nadir reflectance and MODIS nadir BRDF-adjusted surface reflectances intercompared over Greenland. Cryosphere 2017, 11, 1575. [Google Scholar] [CrossRef]
  17. Rippin, D.M.; Pomfret, A.; King, N. High resolution mapping of supra-glacial drainage pathways reveals link between micro-channel drainage density, surface roughness and surface reflectance. Earth Surf. Process. Landf. 2015, 40, 1279–1290. [Google Scholar] [CrossRef]
  18. Ryan, J.C.; Hubbard, A.; Stibal, M.; Box, J.E. Attribution of Greenland’s ablating ice surfaces on ice sheet albedo using unmanned aerial systems. Cryosphere Discuss. 2016. [Google Scholar] [CrossRef]
  19. DJI. Matrice 600 User Manual DJI. 2016. Available online: https://dl.djicdn.com/downloads/m600/20170717/Matrice_600_User_Manual_v1.0_EN.pdf (accessed on 1 February 2017).
  20. Li-Cor. Principles of Radiation Measurement. LI-COR Ltd., 2015. Available online: https://licor.app.boxenterprise.net/s/liuswfuvtqn7e9loxaut (accessed on 5 February 2017).
  21. Mac Arthur, A. Field Guide for the ASD Fieldspec Pro Radiance/Irradiance Measurements in Raw DN Mode; ASD Raw DN Mode Field User Note; NERC FSF: Edinburgh, UK, 2007. [Google Scholar]
  22. Ocean Optics. STS Developer’s Kit—Installation and Operation Manual; Ocean Optics Inc.: Largo, FL, USA, 2014; Available online: http://oceanoptics.com/wp-content/uploads/STSDevKitIO.pdf (accessed on 27 March 2017).
  23. OceanView. OceanView Installation and Operation Manual; Ocean Optics Inc.: Largo, FL, USA, 2013; Available online: http://oceanoptics.com/wp-content/uploads/OceanViewIO.pdf (accessed on 24 March 2017).
  24. Westoby, M.J.; Brasington, J.; Glasser, N.F.; Hambrey, M.J.; Reynolds, J.M. Structure-from-Motion photogrammetry: A low-cost, effective tool for geoscience applications. Geomorphology 2012, 179, 300–314. [Google Scholar] [CrossRef]
  25. Zeng, C.; King, D.J.; Richardson, M.; Shan, B. Fusion of Multispectral Imagery and Spectrometer Data in UAV Remote Sensing. Remote Sens. 2017, 9, 696. [Google Scholar] [CrossRef]
  26. Frolking, S.; Roulet, N.T.; Moore, T.R.; Lafleur, P.M.; Bubier, J.L.; Crill, P.M. Modeling seasonal to annual carbon balance of Mer Bleue Bog, Ontario, Canada. Glob. Biogeochem. Cycles 2002, 16, 4-1–4-21. [Google Scholar] [CrossRef]
  27. Knap, W.H.; Reijmer, C.H. Anisotropy of the Reflected Radiation Field Over Melting Glacier Ice: Measurements in Landsat TM Bands 2 and 4. Remote Sens. Environ. 1998, 65, 93–104. [Google Scholar] [CrossRef]
  28. Knap, W.; Reijmer, C.; Oerlemans, J. Narrowband to broadband conversion of Landsat TM glacier albedos. Int. J. Remote Sens. 1999, 20, 2091–2110. [Google Scholar] [CrossRef]
  29. Loveland, T.R.; Irons, J.R. Landsat 8: The plans, the reality, and the legacy. Remote Sens. Environ. 2016, 185, 1–6. [Google Scholar] [CrossRef]
  30. Drusch, M.; Del Bello, U.; Carlier, S.; Colin, O.; Fernandez, V.; Gascon, F.; Hoersch, B.; Isola, C.; Laberinti, P.; Martimort, P.; et al. Sentinel-2: ESA’s Optical High-Resolution Mission for GMES Operational Services. Remote Sens. Environ. 2012, 120, 25–36. [Google Scholar] [CrossRef]
  31. Roy, D.P.; Wulder, M.A.; Loveland, T.R.; Woodcock, C.E.; Allen, R.G.; Anderson, M.C.; Helder, D.; Irons, J.R.; Johnson, D.M.; Kennedy, R.; et al. Landsat-8: Science and product vision for terrestrial global change research. Remote Sens. Environ. 2014, 145, 154–172. [Google Scholar] [CrossRef]
  32. Roy, D.P.; Zhang, H.; Ju, J.; Gomez-Dans, J.L.; Lewis, P.E.; Schaaf, C.; Sun, Q.; Li, J.; Huang, H.; Kovalskyy, V. A general method to normalize Landsat reflectance data to nadir BRDF adjusted reflectance. Remote Sens. Environ. 2016, 176, 255–271. [Google Scholar] [CrossRef]
  33. Wang, Z.; Schaaf, C.B.; Sun, Q.; Kim, J.; Erb, A.M.; Gao, F.; Román, M.O.; Yang, Y.; Petroy, S.; Taylor, J.R.; et al. Monitoring land surface albedo and vegetation dynamics using high spatial and temporal resolution synthetic time series from Landsat and the MODIS BRDF/NBAR/albedo product. Int. J. Appl. Earth Obs. Geoinform. 2017, 59, 104–117. [Google Scholar] [CrossRef]
  34. Liang, S. Narrowband to broadband conversions of land surface albedo I: Algorithms. Remote Sens. Environ. 2001, 76, 213–238. [Google Scholar] [CrossRef]
  35. Naegeli, K.; Damm, A.; Huss, M.; Wulf, H.; Schaepman, M.; Hoelzle, M. Cross-Comparison of albedo products for glacier surfaces derived from airborne and satellite (Sentinel-2 and Landsat 8) optical data. Remote Sens. 2017, 9, 110. [Google Scholar] [CrossRef]
  36. Cescatti, A.; Marcolla, B.; Santhana Vannan, S.K.; Pan, J.Y.; Román, M.O.; Yang, X.; Ciais, p.; Cook, R.B.; Law, B.E.; Matteucci, G.; Migliavacca, M.; et al. Intercomparison of MODIS albedo retrievals and in situ measurements across the global FLUXNET network. Remote Sens. Environ. 2012, 121, 323–334. [Google Scholar] [CrossRef]
  37. Chen, J.M.; Liu, J.; Leblanc, S.G.; Lacaze, R.; Roujean, J.L. Multi-angular optical remote sensing for assessing vegetation structure and carbon absorption. Remote Sens. Environ. 2003, 84, 516–525. [Google Scholar] [CrossRef]
  38. Coakley, J.A. Reflectance and albedo, surface. In Encyclopedia of Atmospheric Sciences; Holton, J.R., Curry, J.A., Pyle, J.A., Eds.; Academic Press: Cambridge, MA, USA, 2003; pp. 1914–1923. [Google Scholar]
  39. Liang, S.; Strahler, A.H.; Walthall, C. Retrieval of land surface albedo from satellite observations: A simulation study. J. Appl. Meteorol. 1999, 38, 712–725. [Google Scholar] [CrossRef]
  40. Colwell, J.E. Vegetation canopy reflectance. Remote Sens. Environ. 1974, 3, 175–183. [Google Scholar] [CrossRef]
  41. Canisius, F.; Fernandes, R. Evaluation of the information content of Medium Resolution Imaging Spectrometer (MERIS) data for regional leaf area index assessment. Remote Sens. Environ. 2012, 119, 301–314. [Google Scholar] [CrossRef]
  42. Garbulsky, M.F.; Peñuelas, J.; Gamon, J.; Inoue, Y.; Filella, I. The photochemical reflectance index (PRI) and the remote sensing of leaf, canopy and ecosystem radiation use efficiencies. A review and meta-analysis. Remote Sens. Environ. 2011, 115, 281–297. [Google Scholar] [CrossRef]
  43. Stroeve, J.; Box, J.E.; Gao, F.; Liang, S.L.; Nolin, A.; Schaaf, C. Accuracy assessment of the MODIS 16-day albedo product for snow: Comparisons with Greenland in situ measurements. Remote Sens. Environ. 2005, 94, 46–60. [Google Scholar] [CrossRef]
  44. Pimentel, R.; Aguilar, C.; Herrero, J.; Pérez-Palazón, M.; Polo, M. Comparison between Snow Albedo Obtained from Landsat TM, ETM+ Imagery and the SPOT VEGETATION Albedo Product in a Mediterranean Mountainous Site. Hydrology 2016, 3, 10. [Google Scholar] [CrossRef]
Figure 1. The Matrice 600 UAV, Zenmuse Z3 camera, pyranometers, Quantum sensors, and Visible and NIR spectraometers.
Drones 03 00027 g001
Figure 2. Relative spectral response functions (normalized to one) of LI-200R pyranometer, LI-190R Quantum sensor, Landsat 8 OLI and Sentinel-2 MultiSpectral Instrument (MSI) in visible and near infrared (VIS-NIR) range.
Drones 03 00027 g002
Figure 3. UAV (a) and ground (b) systems.
Drones 03 00027 g003
Figure 4. The data processing workflow.
Drones 03 00027 g004
Figure 5. Mer Bleue wetland in eastern Ontario near Ottawa (45°24′34″N, 75°31′07″W). Measurement locations of 5 flight paths are in different colors and highlight difference in line spacing. Cyan path (Flight 5) covers an area of approximately a 500 m MODIS pixel.
Drones 03 00027 g005
Figure 6. The field of view (FOV) specifications and on-ground sampling footprint of the UAV-mounted spectrometer (6.65 m radius) and pyranometer (30 m radius) in comparison to 30 m Landsat 8 and 20 m Sentinel-2 pixels.
Drones 03 00027 g006
Figure 7. (a) Orthomosaic, (b) height above sea level and (c,d) point cloud showing land cover and vegetation structure of Mer Bleue Bog area (28 September 2017—Flight 4).
Drones 03 00027 g007
Figure 8. Open bog total shortwave albedo (a) with changing UAV pyranometer height over homogenous open bog under clear sky and cloudy conditions (b) from Flight 3 (30 m height) observations over open bog while changing from cloudy to clear sky conditions.
Drones 03 00027 g008
Figure 9. Mean and standard deviation of total shortwave albedo of different land cover types.
Drones 03 00027 g009
Figure 10. Visible albedo from quantum sensor vs total shortwave albedo from pyranometer.
Drones 03 00027 g010
Figure 11. Comparison between total shortwave albedo directly measured using pyranometer and that derived from spectrometer.
Drones 03 00027 g011
Figure 12. Spatial total shortwave albedo images (pixel coordinates) from Landsat 8 and Sentinel-2 satellites.
Drones 03 00027 g012
Figure 13. Comparison between satellite-derived albedo using the BRDF-based approach for (a) Landsat 8, and (b) Sentinel-2 sensors, against directly measured albedo from pyranometer.
Drones 03 00027 g013
Figure 14. Comparison between satellite-derived total shortwave albedo using the BRDF-based approach for (a) Landsat 8, and (b) Sentinel-2 sensors, against spectrometer-derived total shortwave albedo.
Drones 03 00027 g014
Table 1. Field of view (FOV) and ground sampling specifications of the UAV and Satellite sensors.
UAV/Satellite SensorsFlight AltitudeFOVGround Footprint (Diameter)
UAV camera30 m-1.84 cm
UAV spectrometer30 m25°13.3 m
UAV pyranometer/
UAV quantum sensor
30 m180° – true FOVInfinite
172° – restricted FOV858 m
90° – restricted FOV60 m
Sentinel-2--20 m
Landsat 8 OLI--30 m

