1. Introduction
Addressing human–wildlife conflicts is a fundamental challenge for conservation practitioners. In some areas of the planet, the loss of lives, crops, or live-stock because of wildlife has significant consequences for people’s livelihoods and their food and agricultural security [
1,
2]. Reconciling the conservation of endangered species with human activities, as well as with socioeconomic uses and human security, has been the subject of numerous studies and management programs. The most commonly implemented actions are aimed at mitigating wildlife negative effects on agricultural production and human health through mitigation operations or economical compensations for losses caused by wildlife [
3,
4,
5]. Quantifying and mapping wildlife-caused damages is essential to carry out both kind of actions. Most methodologies are aimed at developing predictive risk maps [
6], but in the context of human–wildlife conflicts, it is crucial to develop accurate protocols for the reliable verification of the authority of the causative species and their relation with damage claims [
7]. These protocols are fundamental in creating public trust in the legitimacy of compensation programs, and in avoiding fraud and moral hazards. Finding simple and inexpensive methods to quantify damages is a major challenge in decreasing the cost–benefit ratio to achieve conservation objectives. Medium resolution remote sensing imagery as low-cost Unmanned Aerial Vehicles (UAV) has arisen as an essential tool to meet this challenge.
Rice crops (
Oriza sativa) are one of the agricultural habitats most affected by human–wildlife conflicts [
8,
9]. Large populations of aquatic birds inhabit these agricultural habitats due to their high productivity levels and similarity to natural wetlands [
3]. Rice crops are one of the most important bases of the rural economy in many regions of the world. For instance, in the region of the Ebro Delta in the western Mediterranean, with more than 20,000 ha of surface area, the rice fields represent an essential economic revenue, accounting for a significant proportion of the Spanish rice production. At the same time, the Ebro Delta constitutes a fundamental area for the conservation of biodiversity. Hence, some protection figures have been established to protect the area, namely the Natural Park and Wildlife Reserve, Wetlands of International Importance (Ramsar Convention), Natura 2000 Network Space, and recently, Biosphere Reserve for UNESCO’s Man and the Biosphere Program. In this context, striving for agricultural production compatible with the conservation of the biological wealth of the Delta is a priority objective of public administrations and represents an important challenge for landscape managers.
The Western Swamphen is a species of conservation interest in Europe that is included in Annex I of the Birds Directive and is considered a Least Concern species at the European level [
10]. The population in Europe is estimated at 3400–3800 pairs [
10]. At the moment, the Iberian Peninsula contains 81% of this population [
10], and thanks to the application of conservation measures, at the end of twentieth century the species had naturally recolonized some of the Iberian wetlands where it had disappeared [
11]. However, its population increase in the Ebro Delta has caused the emergence of conflicts with rice farmers, since the Western Swamphen uses rice crops as feeding grounds, leading to crop losses. Since the Western Swamphen is protected by national and European legislation, actions taken to reduce crop damages that may lead to changes in its conservation status, such as lethal control or captures and translocations, cannot be undertaken without an assessment of alternative measures. In this context, objectively quantifying Swamphen damage as accurately as possible is a requisite. Initially, the damage assessment was only carried out based on field visits by regional ranges to the affected crops. The obvious damages near the roads were easily evaluable and quantifiable, but the less obvious damages located further away from the roads remained difficult to evaluate. In addition, this method may be subjected to certain levels of subjectivity and without accurate evaluation of the committed error. Thus, defining an objective methodology to quantify the damages is an essential challenge, both for the benefit of the species and from an economic point of view.
Remote sensing medium resolution imagery has shown a great capacity to quantify damages in crop lands. The satellites MODIS and Landsat have been widely used [
12,
13,
14], but Sentinel-2, especially for its finer resolution, constitutes a major asset for this kind of application [
15,
16]. However, due to the types of damages that affect the majority of the crops, satellite resolutions are still too coarse. In this sense, imagery provided by the high spatial resolution commercial satellites as Deimos-2, GeoEye-2, QuickBird, or WorldView-2 could be an appropriate option [
14,
17,
18]. Nevertheless, in some specific decision making contexts the cost–benefit ratio is too high, especially if multiple images of different dates are required or large surfaces are needed. The use of lightweight UAV usually implies lower economic costs than other remote sensing techniques when surveying relatively small areas (tens of hectares) and can be a very good alternative [
19,
20,
21,
22,
23,
24], especially due to its finer resolution (better than 20 cm) and versatility. Lightweight UAVs and photogrammetric derived information as Digital Surface Models (DSM) have been used to calculate crop damages by means of crop height estimation [
25] or grapevine canopy changes [
26]. UAV multispectral information is also becoming very important due to its ability to asses vegetation stress and damages through vegetation indices [
27,
28]. In fact, this ability can be very useful to detect Western Swamphen damages, usually resulting in small and medium vegetation gaps and plant vigor decreases in rice crops. However, mapping large areas with UAV, such as the Ebro Delta, with more than 20,000 ha, may require considerable economic and technical efforts [
29]. In this context, some works use UAV information as field data to calibrate imagery from coarser resolution satellites, such as Landsat or Sentinel-2, with correlative methodologies [
30,
31].
In addition to the developments in quantitative methodological work-flows, it is equally important to offer the results in a comprehensible and useful format for managers responsible for damage assessment and economic compensation guidance [
6]. Developing comprehensible products to boost conservation strategies at high efficiency ratios is a prerequisite.
Thus, this work has two main objectives: the first one is to test the ability to use UAV multispectral imagery as ground truth information for calibrating the physical parameters calculated on medium resolution satellite remote sensing imagery from Sentinel-2; the second is to translate the calibrated remote sensing quantification into understandable and useful products for the landscape managers. We tested these questions in the Ebro Delta region, in NE Spain, with rice crops affected by Western Swamphen activity.
2. Study Area and Species
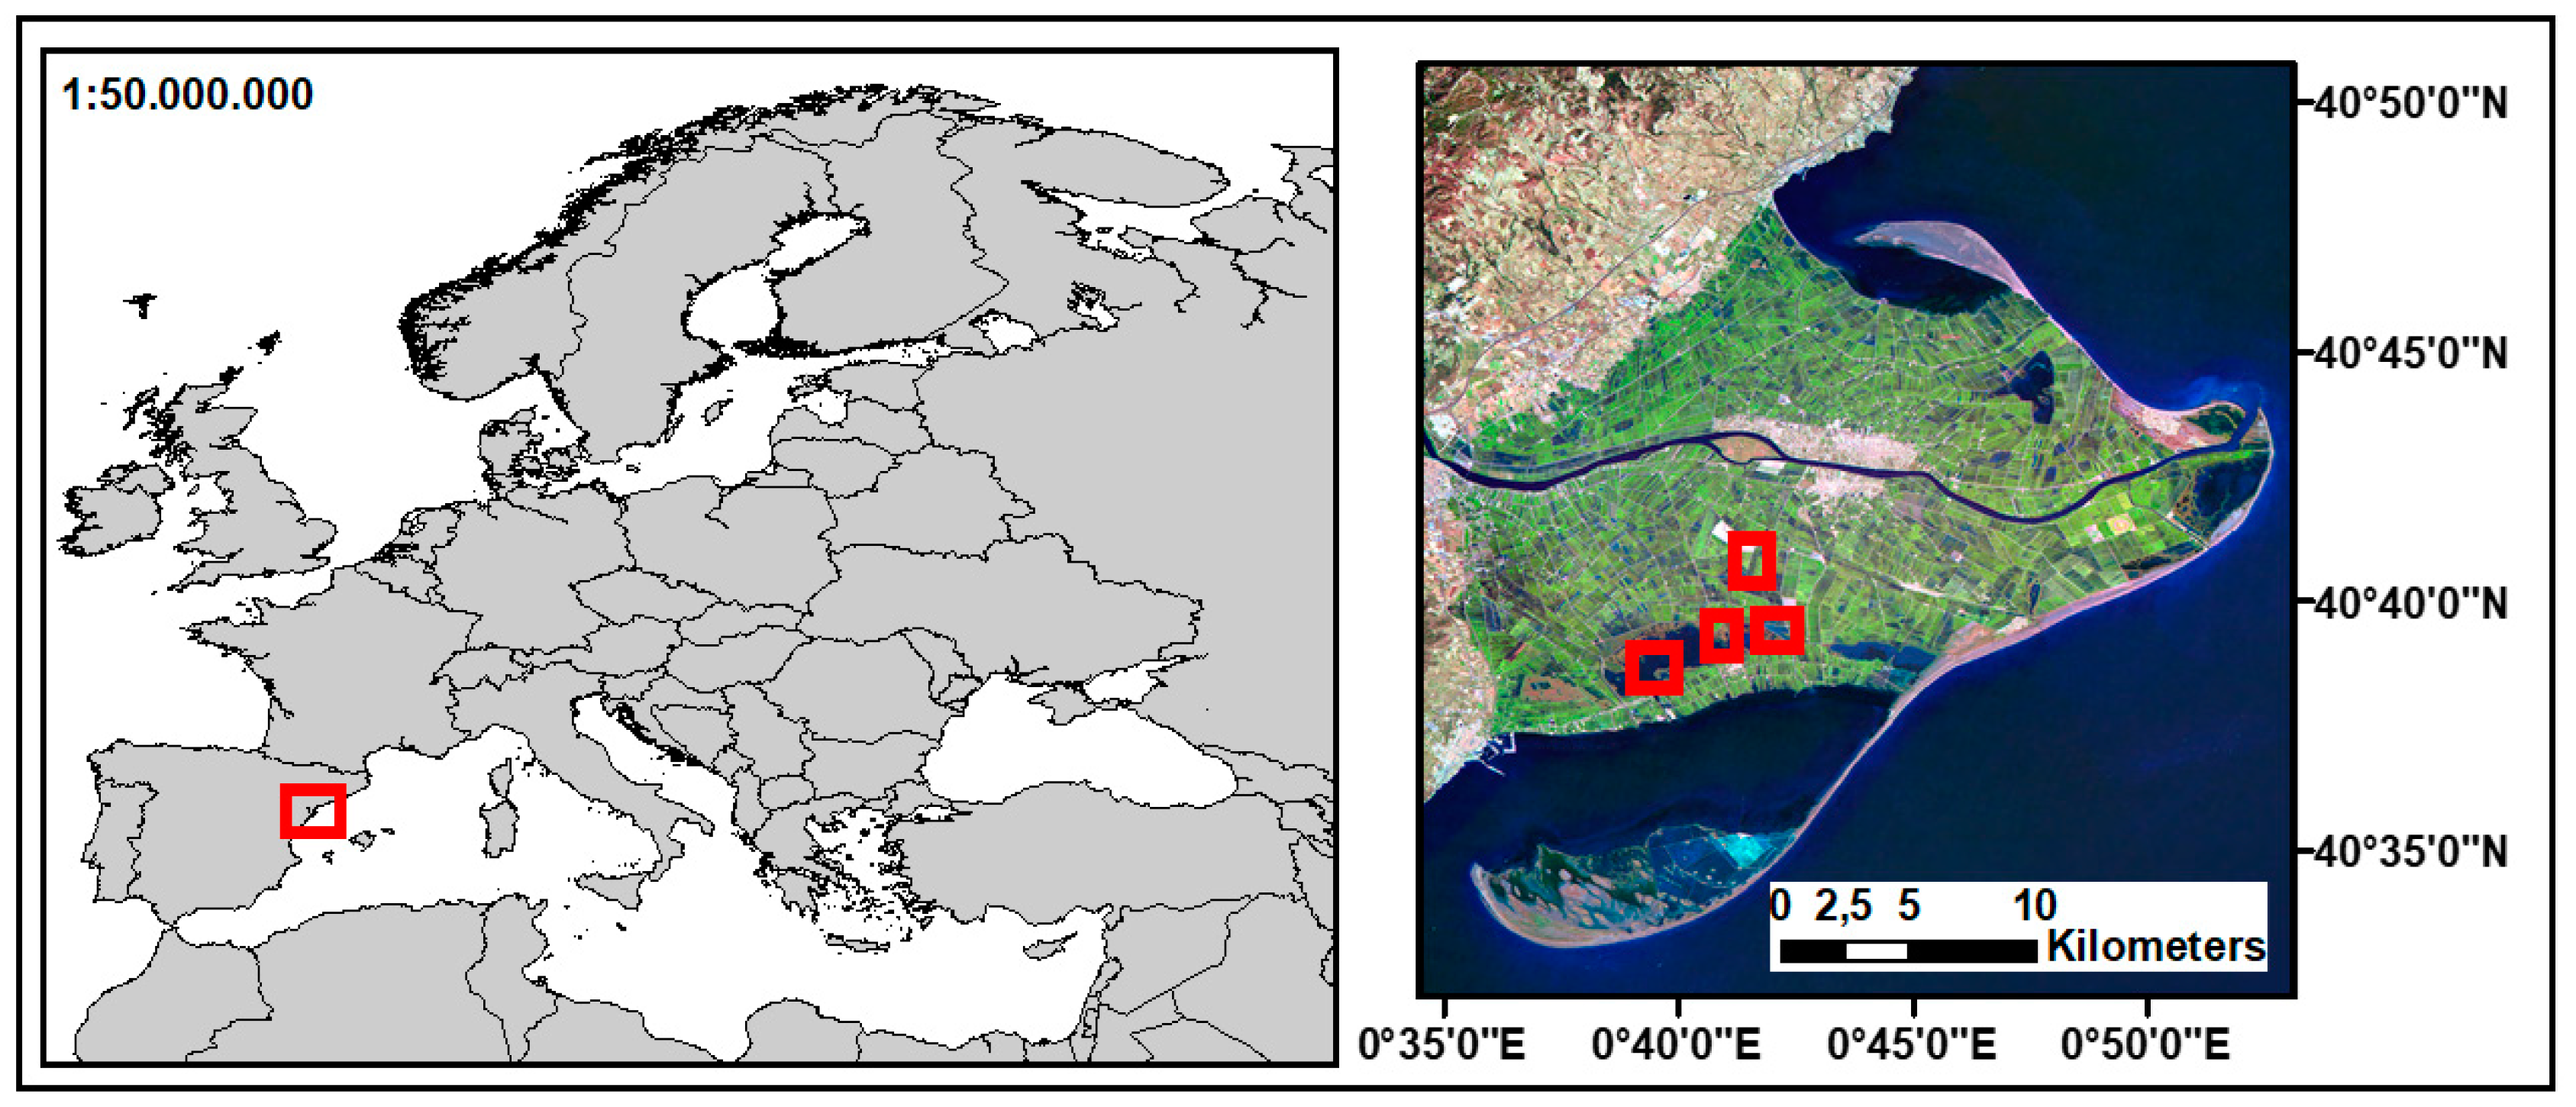
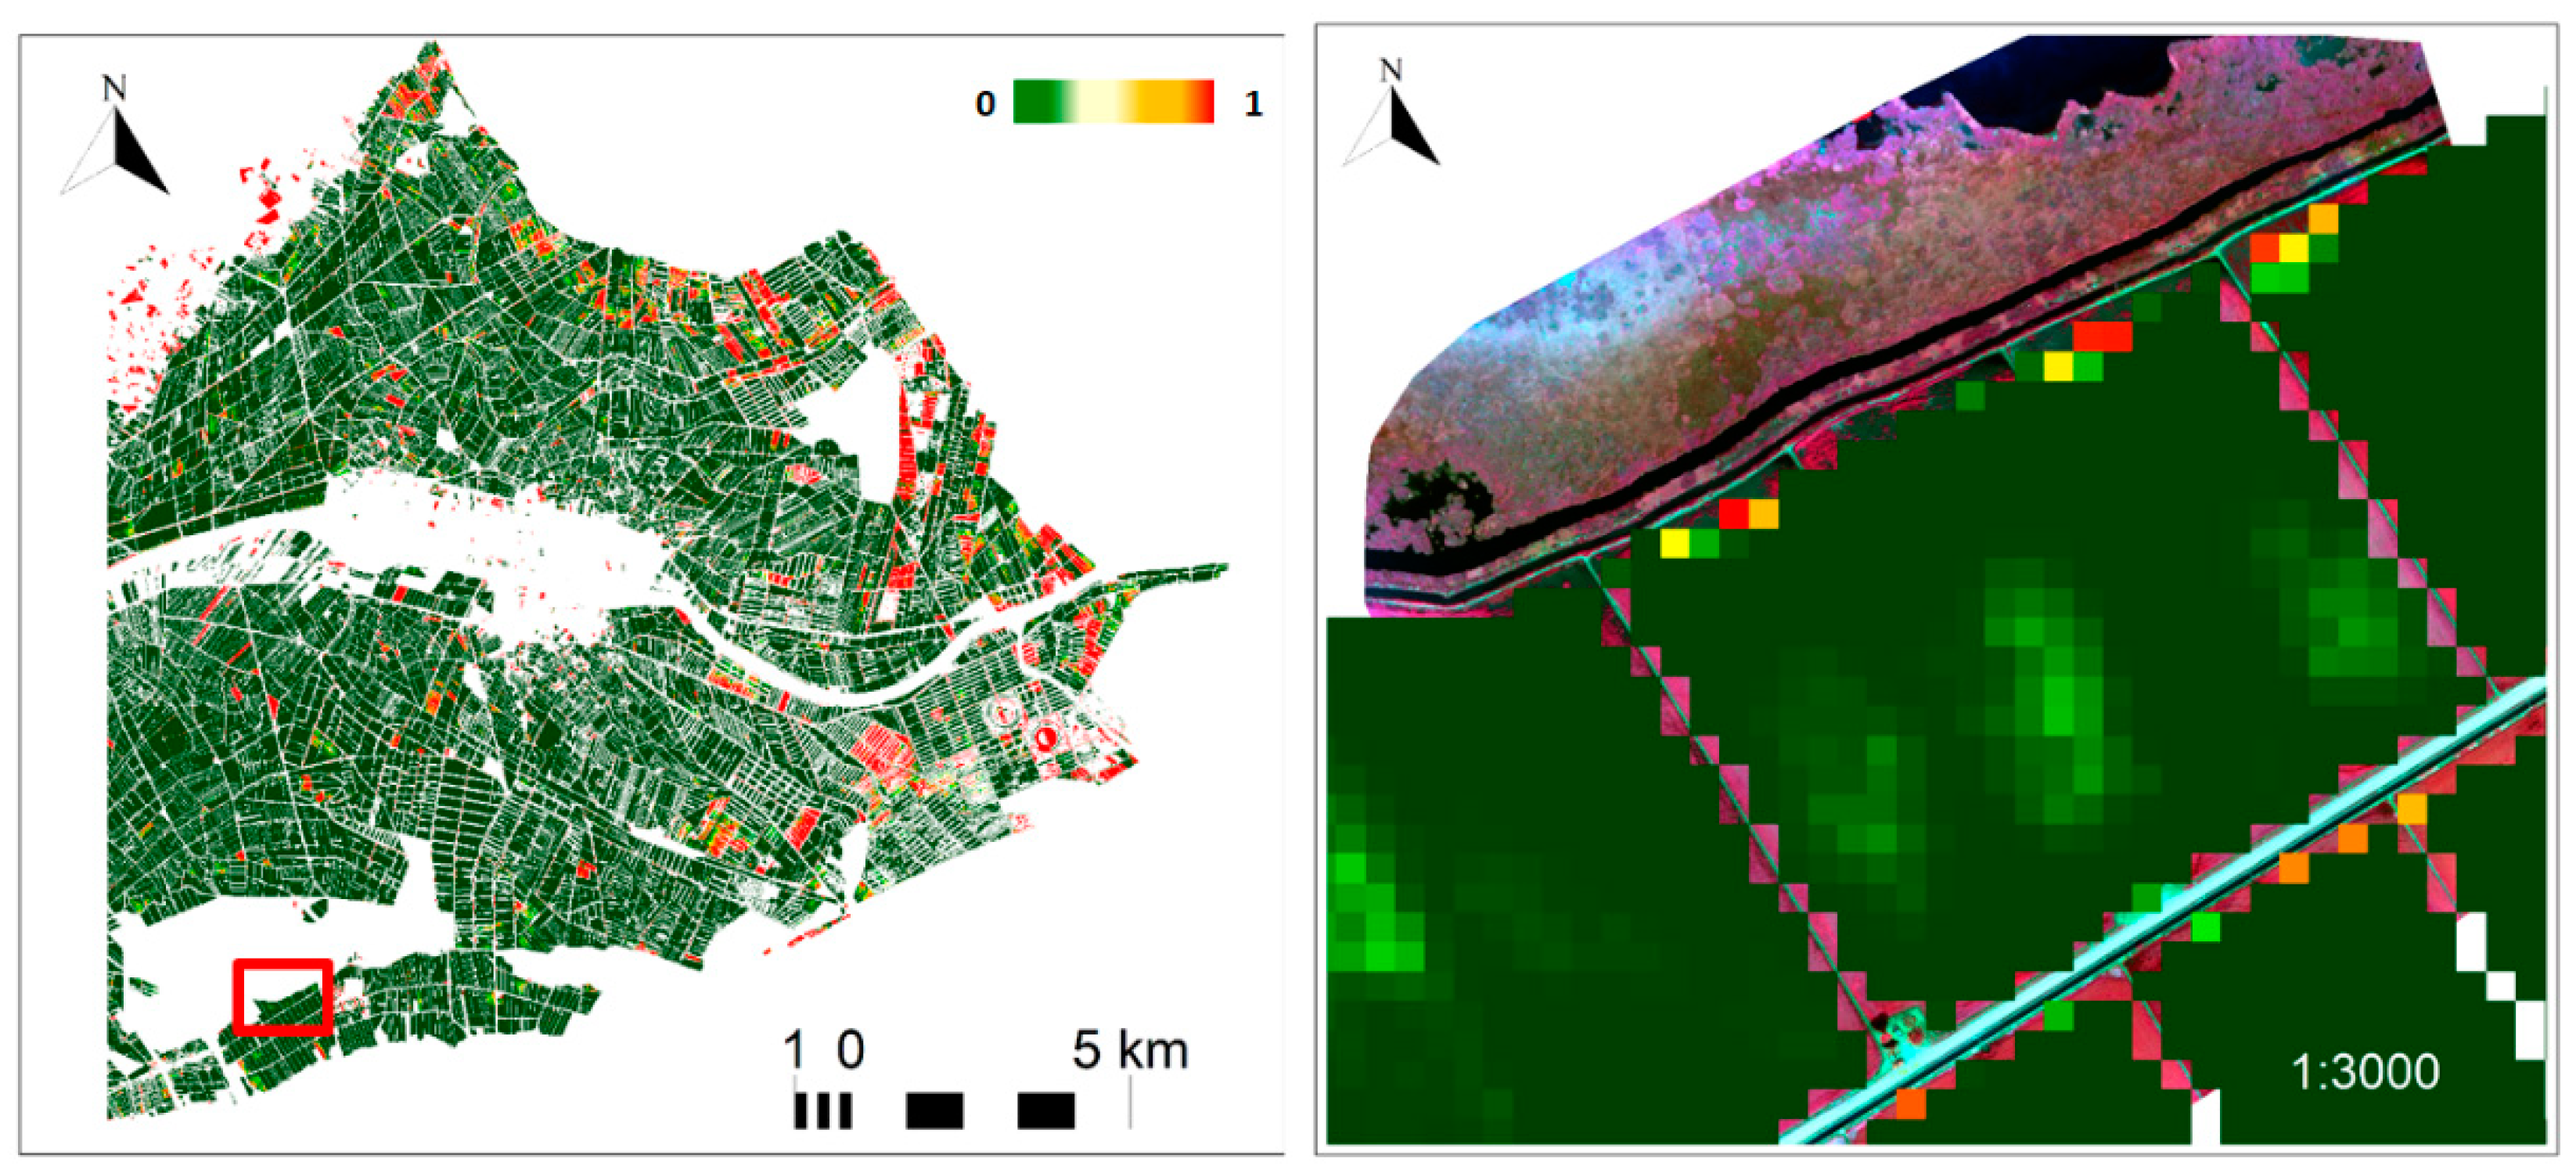
The Ebro Delta constitutes one of the largest wetland areas of the western Mediterranean, at 320 km
2. Its location per Ramsar site designation is 40°43′ N, 00°44′ E (
Figure 1). The delta protrudes around 30 km seaward, with a triangular shape created by the river. Of this, 20% of the area corresponds to natural habitats, 75% is arable land, and the rest are urban areas. Most of the arable land is used for intensive rice agriculture, but noticeable is that this type of agriculture was not implemented until the late nineteenth century. Natural habitats encompass rich ecosystems corresponding to rivers, sea, bays, beaches, dunes, riparian forests, coastal lagoons, and saltmarshes. As a result, the Ebro Delta was declared a natural park in 1983 and a biosphere reserve in 2013. Rice paddies occupy 65% of the Ebro Delta area, and together with tourism, constitute the main economic resource for the approximately 15,000 local residents [
3]. An abundant population of Western Swamphen has been recorded, mainly distributed in natural wetlands and their surroundings, including rice fields [
32]. At present, the Iberian Peninsula constitutes most of its European population and at the end of the 20th century there was a significant population growth thanks to the implementation of active conservation measures [
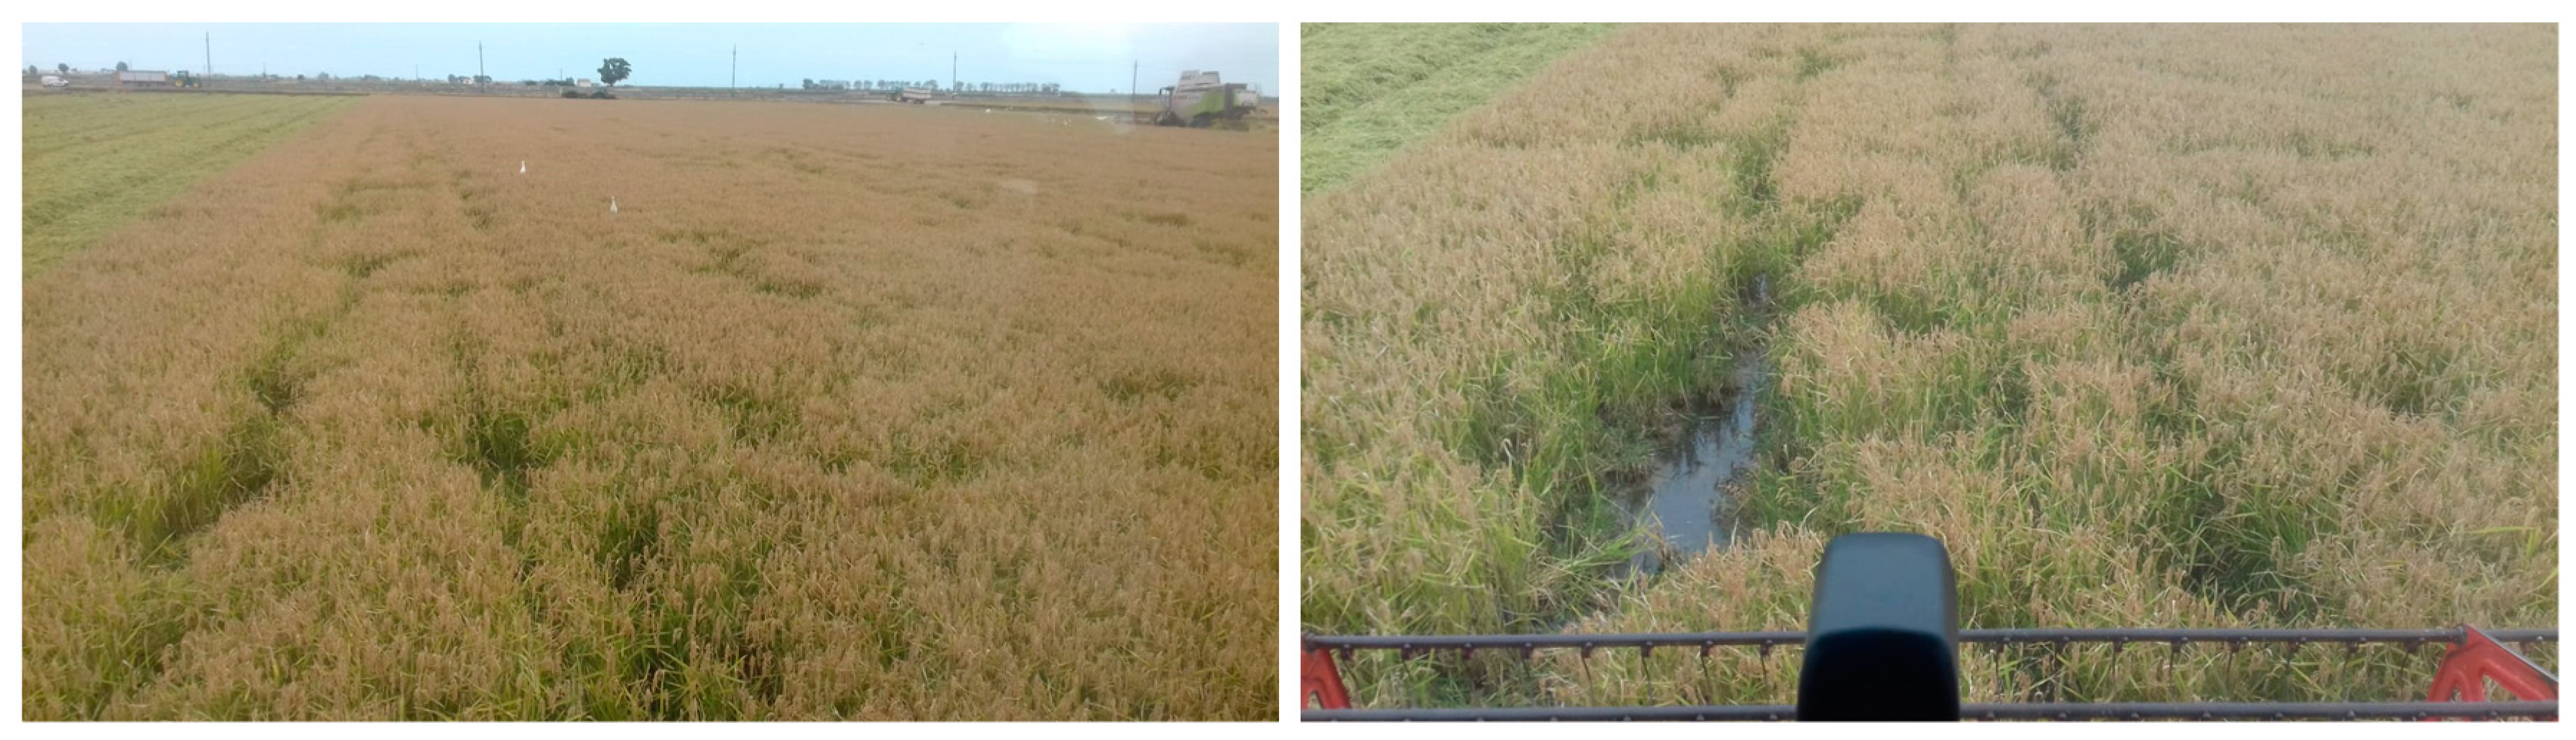
11]. Western Swamphen cause rice damage through the cutting of stems for feeding and by trampling during displacement (creating corridors) within the rice field (
Figure 2). Also, in the case of individual breeding, plaques are generated in the crop (
Figure 2, right) due to the construction of nests and the consequent trampling around them. The effects of Western Swamphen in the field are therefore: (1) absence of plants (stems cut) and (2) damaged plants that rebound (with smaller size and lower rice productivity). Overall, the affected field experiences decreased rice productivity. Due to existing regulation [
33], the government of Catalonia (regional administration) compensates the affected farmers according to the surface area damaged. In the Ebro Delta, administrators had paid up to €203,450 per year from 2003 to 2016 to compensate for damages on about 21,000 ha of rice fields [
3].
3. Material and Methods
We aimed to: (1) calibrate Sentinel-2 images with UAV-derived data, and then (2) validate the generated Sentinel-2 products with field information. The UAV multispectral imagery data were captured in four agricultural plots and used as ground-truth information. The four plots were representative of different levels of crop damage and types of cultivated rice. To assess the matching of information between UAV images and satellite images, we calculated the proportion of damage in each square of a 10 × 10 m mesh co-registered with Sentinel-2 pixels. Then, we selected Sentinel-2 images close to the date of UAV imagery and calculated the Normalized difference vegetation index (NDVI), explained in more detail in the following sections. To reduce noise in the analyses, the 10 m pixels that were not purely of rice crops were removed. We then built a model that related the proportion of damage assessed by UAV imagery to the Sentinel-2 NDVI data. We used the fitted relationship to extrapolate rice damage to the whole Sentinel-2 Delta Ebro image. The prediction maps were validated with independent damage information derived from field observations at the plot level. The following sections explain the entire procedure in more detail.
3.1. Sentinel-2 Imagery
We used free Sentinel-2 imagery that had already been atmospherically-corrected by European Space Agency’s (ESA) Sen2Cor algorithm (Level-2A) [
34]. We selected sixteen available cloud-free images from April to August 2017 corresponding to the Sentinel-2 31TCF zone: April 3, April 6, May 6, May 16, May 23, May 26, June 12, June 15, June 22, July 2, July 5, July 12, August 4, August 14, August 21, and August 24. We calculated the Normalized Difference Water Index (NDWI) for every date. NDWI was proposed by McFeeters in 1996 to delineate the open water features by means of the green and NIR wavelengths:
The water surfaces have positive values, while the surface of the earth and vegetation have 0 or negative values. This NDWI time series was used to identify water channels near the fields to allow later selection of pure rice crops squares, as is explained in
Section 3.4. The August 24 image was the one selected to quantify the maximum crop damages, because it matches the highest season of Western Swamphen activity and is the available image close to the capture date of UAV images. Some small clouds and their shadows present in this image were manually removed by screen digitization. We calculated NDVI for the August 24 Sentinel-2 image, and we refer to this as Sentinel2-NDVI.
3.2. UAV Imagery Adquisition
High resolution image data were collected using a quadcopter (UAV Phantom 3 from DJI) [
35]. This light weight (1280 g) UAV is capable of autonomous waypoint flight following a preplanned route (
Figure 3). A Parrot SEQUOIA multispectral camera was installed in the quadcopter, with four 1.2 megapixel monochrome sensors that collected global shutter imagery along four discrete spectral bands: green (center wavelength (CW): 550 nm; bandwidth (BW): 40 nm), red (CW: 660 nm; BW: 40 nm), red edge (CW: 735 nm; BW: 10 nm), and near infrared (CW: 790 nm; BW: 40 nm). The horizontal (H), vertical (V), and diagonal (D) fields of view (FOV) of the multispectral camera were 61.9° (HFOV), 48.5° (VFOV), and 73.7° (DFOV), respectively, with a focal length of 4 mm. The camera was bundled with an irradiance sensor to record light conditions in the same spectral bands as the multispectral sensor ISO (International Organization for Standardization) value and exposure time was set to automatic. The setting of every captured image is saved in a text metadata file with the irradiance sensor data. All this information was taken into account during the preprocessing stage to obtain reflectance values for the final multispectral product.
UAV imagery was captured at four different agricultural plots (
Figure 1). These four plots were selected with expert criteria for their representativeness in terms of levels of damage and type of cultivated rice and were all near the potential harvesting date. After initial field inspection by rangers, Plots 1, 2, and 4 appeared to present damages causing loss of rice cover in many areas, showing a variety of spatial patterns (both scattered and aggregated). Initial inspections of Plot 3 did not detect damage to the rice crop. The four plots may have been treated with a variety of agricultural treatments in previous months, and plot 4 included a different rice variety. Images were captured during the same day in consecutive hours before and after the noon. The flying altitude was 80 m for three plots with an average GSD (Ground Sample Distance) of 8 cm and an average area of 12 ha. The flying altitude for the fourth flight was of 100 m with an average GSD of 10 cm. The flight speed was 5 m/second with 80% forward and sideways overlap. Images were captured on 17 August 2017, a few days before the harvest, when the maximum crop damages could be observed. Before each flight, images of the Sequoia calibration panel (by AIRINOV) were captured in order to apply radiometric calibration and corrections from reference reflectance maps. Crop monitoring requires accurate calibration [
36], therefore, we ensured application of the same methodology in all the flights: the target is level with the ground and not at an angle; the target is not affected by shadows or reflections of eventual surrounding objects; and the panel images are taken around 1 meter away from the panel and not facing the sun. Several images were taken before the flight to ensure we obtained images with lighting conditions as similar as possible to the ones during the flight. At the moment of application of the radiometric calibration we chose the most appropriate panel picture for each flight.
Three of the plots were totally surveyed, corresponding to areas between 3 and 5 ha each, and the fourth plot had a total area of 194.60 ha, and a representative surface of 17 ha (8.7%) was surveyed.
3.3. UAV Imagery Processing
UAV data was processed into a multispectral orthomosaic with Pix4Dmapper Pro 4.2 following the “Ag Multispectral” template. Pix4D is based on the Structure from Motion algorithms and also integrates computer vision techniques with photogrammetric algorithms [
37,
38] to obtain high accuracy in aerial imagery processing [
39,
40]. Pix4Dmapper Pro computes key points in the single images and uses them to find matches between images. From these initial matches, the software runs several automatic aerial triangulation steps, bundle bloc adjustments, and camera self-calibration steps iteratively until optimal reconstruction is achieved [
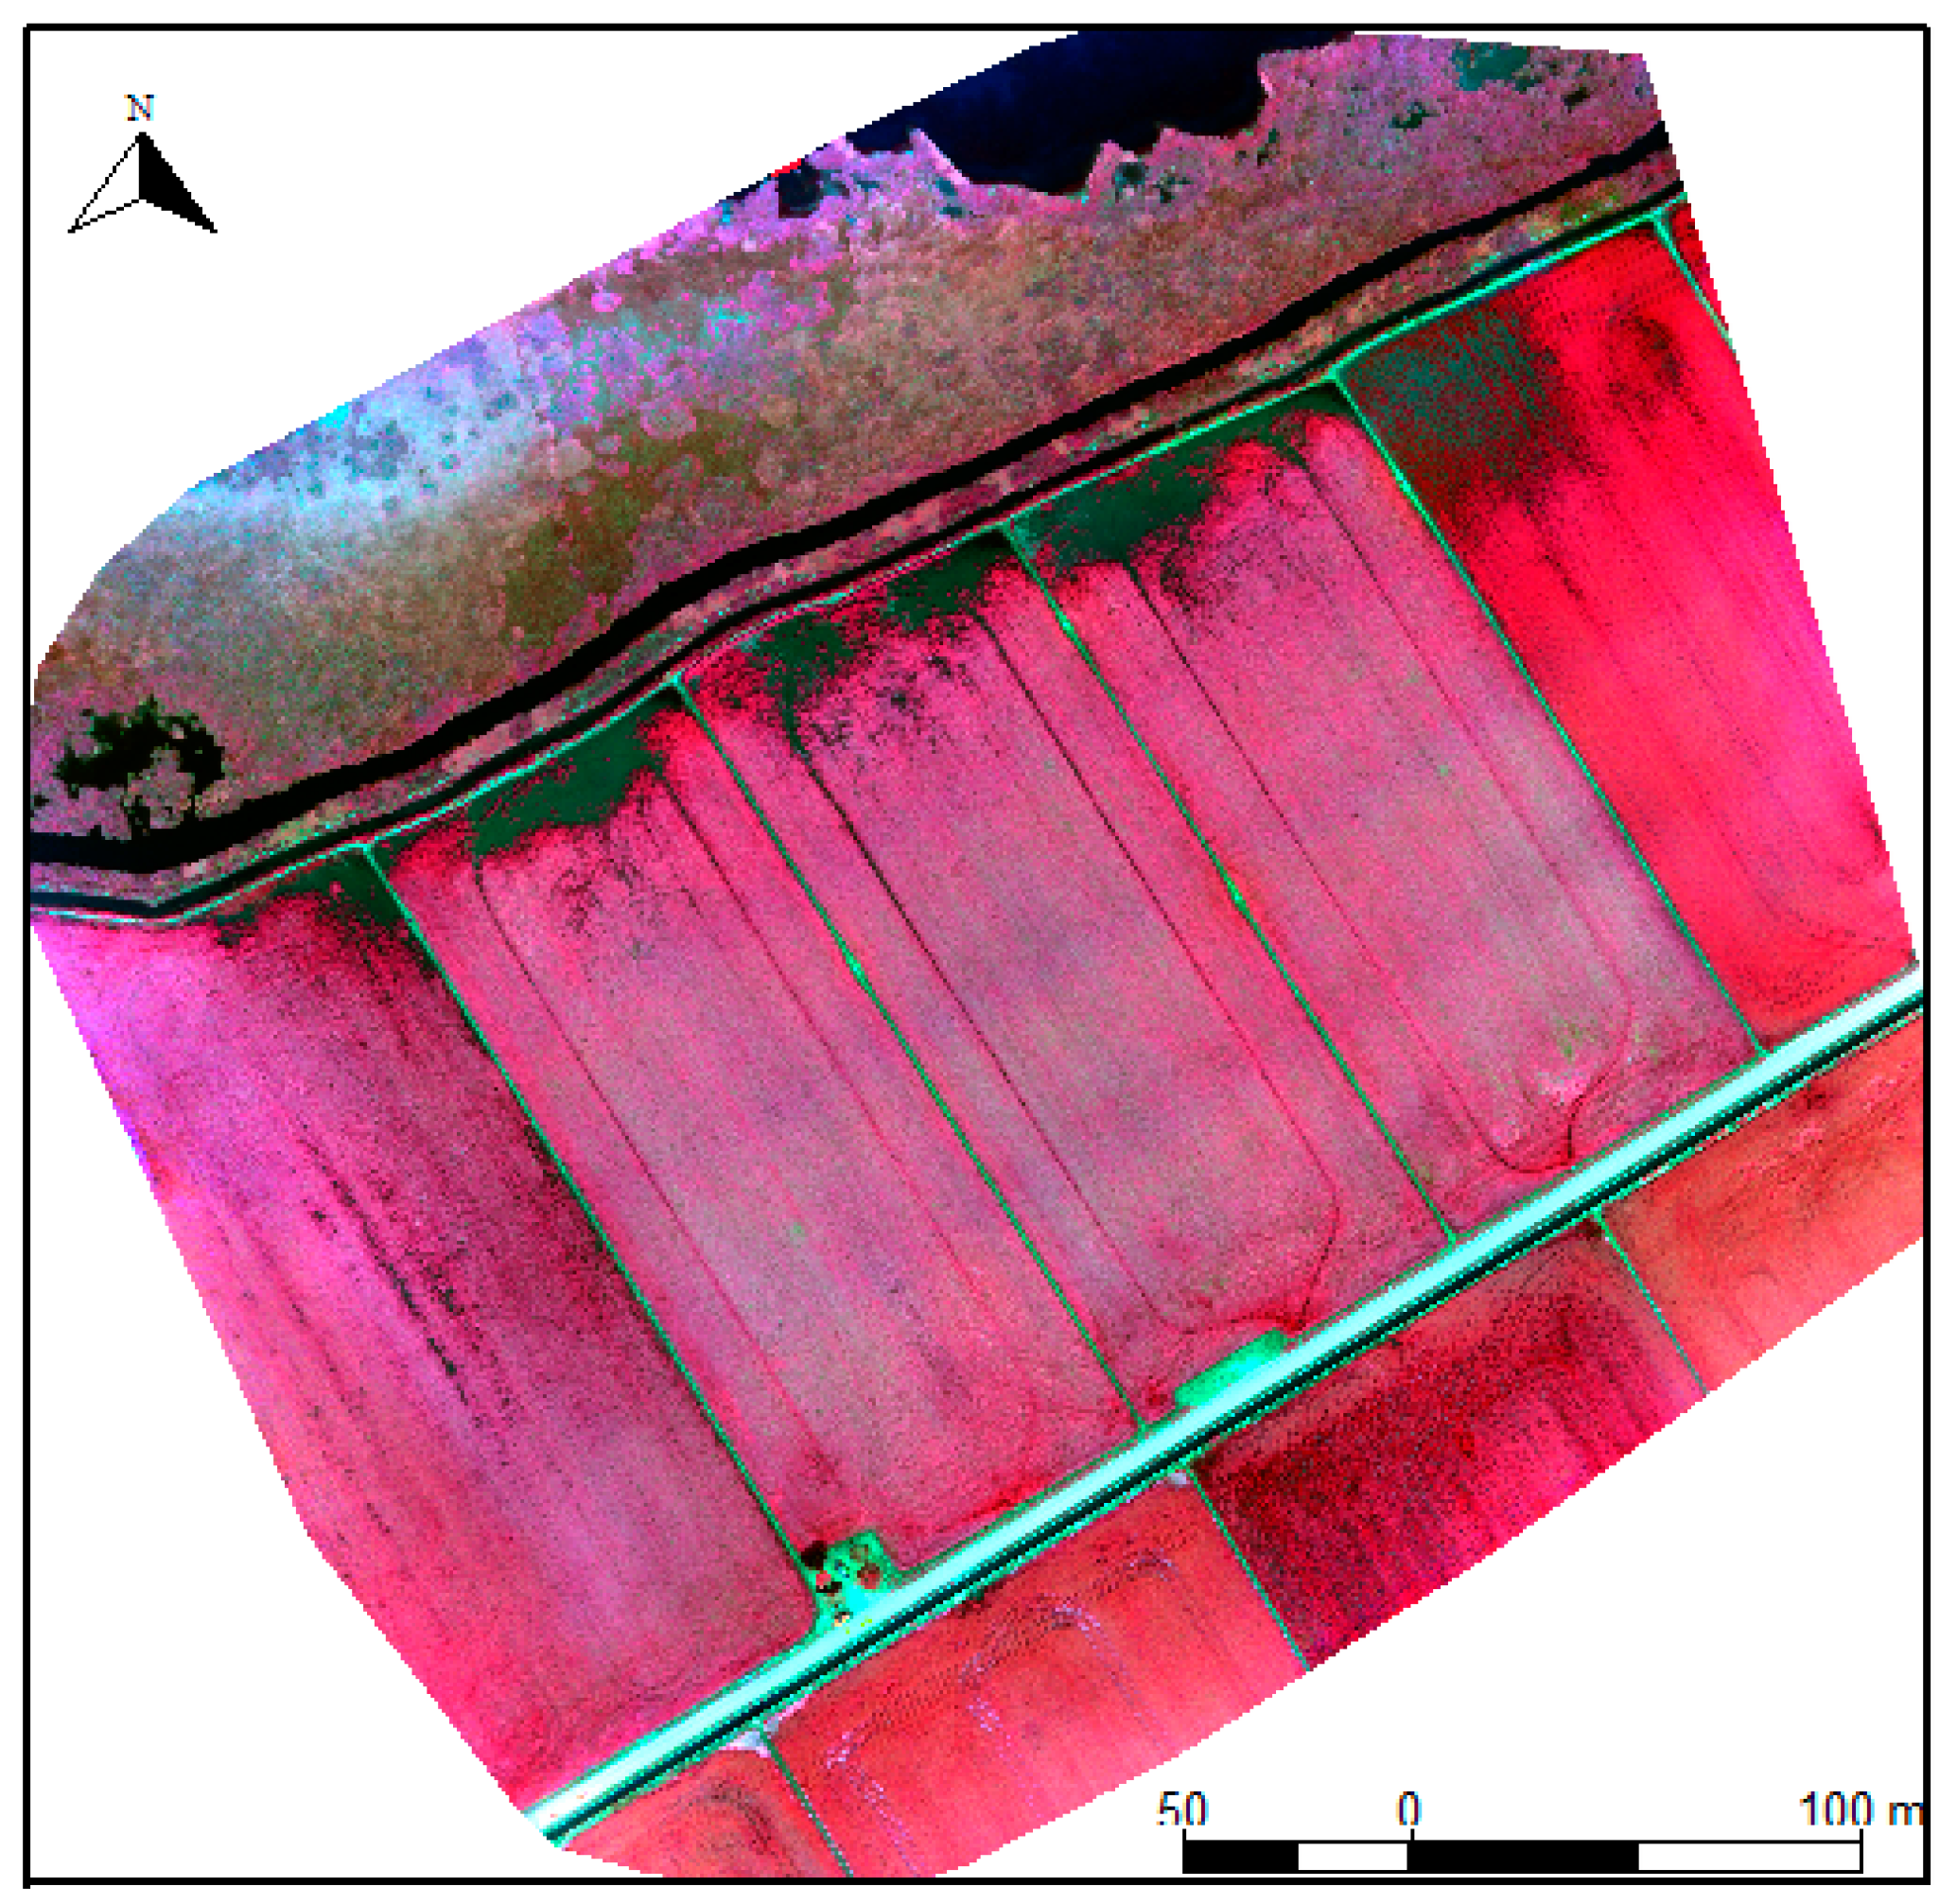
29]. Then, a densified point cloud is generated to obtain a highly detailed digital surface model (DSM) that will be used to generate the final orthomosaics and reflectance maps for every plot (
Figure 4).
The reflectance maps were built by applying radiometric calibrations and corrections. First, radiometric calibration was performed by using the calibration target images that enable one to have an absolute reference of radiometry for that day, and finally makes it possible to compare data coming from several flights. Second, the radiometric corrections “Camera and Sun irradiance” aimed at correcting terrain reflectance was also applied. Within this, the Pix4Dmapper first uses the values of ISO, aperture, shutter speed, sensor response, and optical system and vignetting registered in the text metadata files (EXIF and XMP tags) for every single photogram to correct the camera. Then, the incoming sunlight irradiance is corrected with the information provided by the sun irradiance sensor. This sensor provides information on the light conditions during the flight within the same spectral bands as the one captured by the multispectral sensor and it is registered in the same text metadata files described above. This “Camera and Sun irradiance” correction normalizes the images captured during the flight and, thus, allows one to compare images taken in different illumination conditions. Pix4Dmapper applies this calibration and correction process to every single photogram just before it achieves the final reflectance orthomosaic for every spectral band (
Figure 3). We have calculated the mean error in x-y coordinates by means of geolocation four-points-per-survey through screen digitalization in the UAV final orthomosaic and in the 1:1000 official orthophotos. We have calculated the difference between both points sets and the mean error in x and y is 0.56 m and 1 m, respectively.
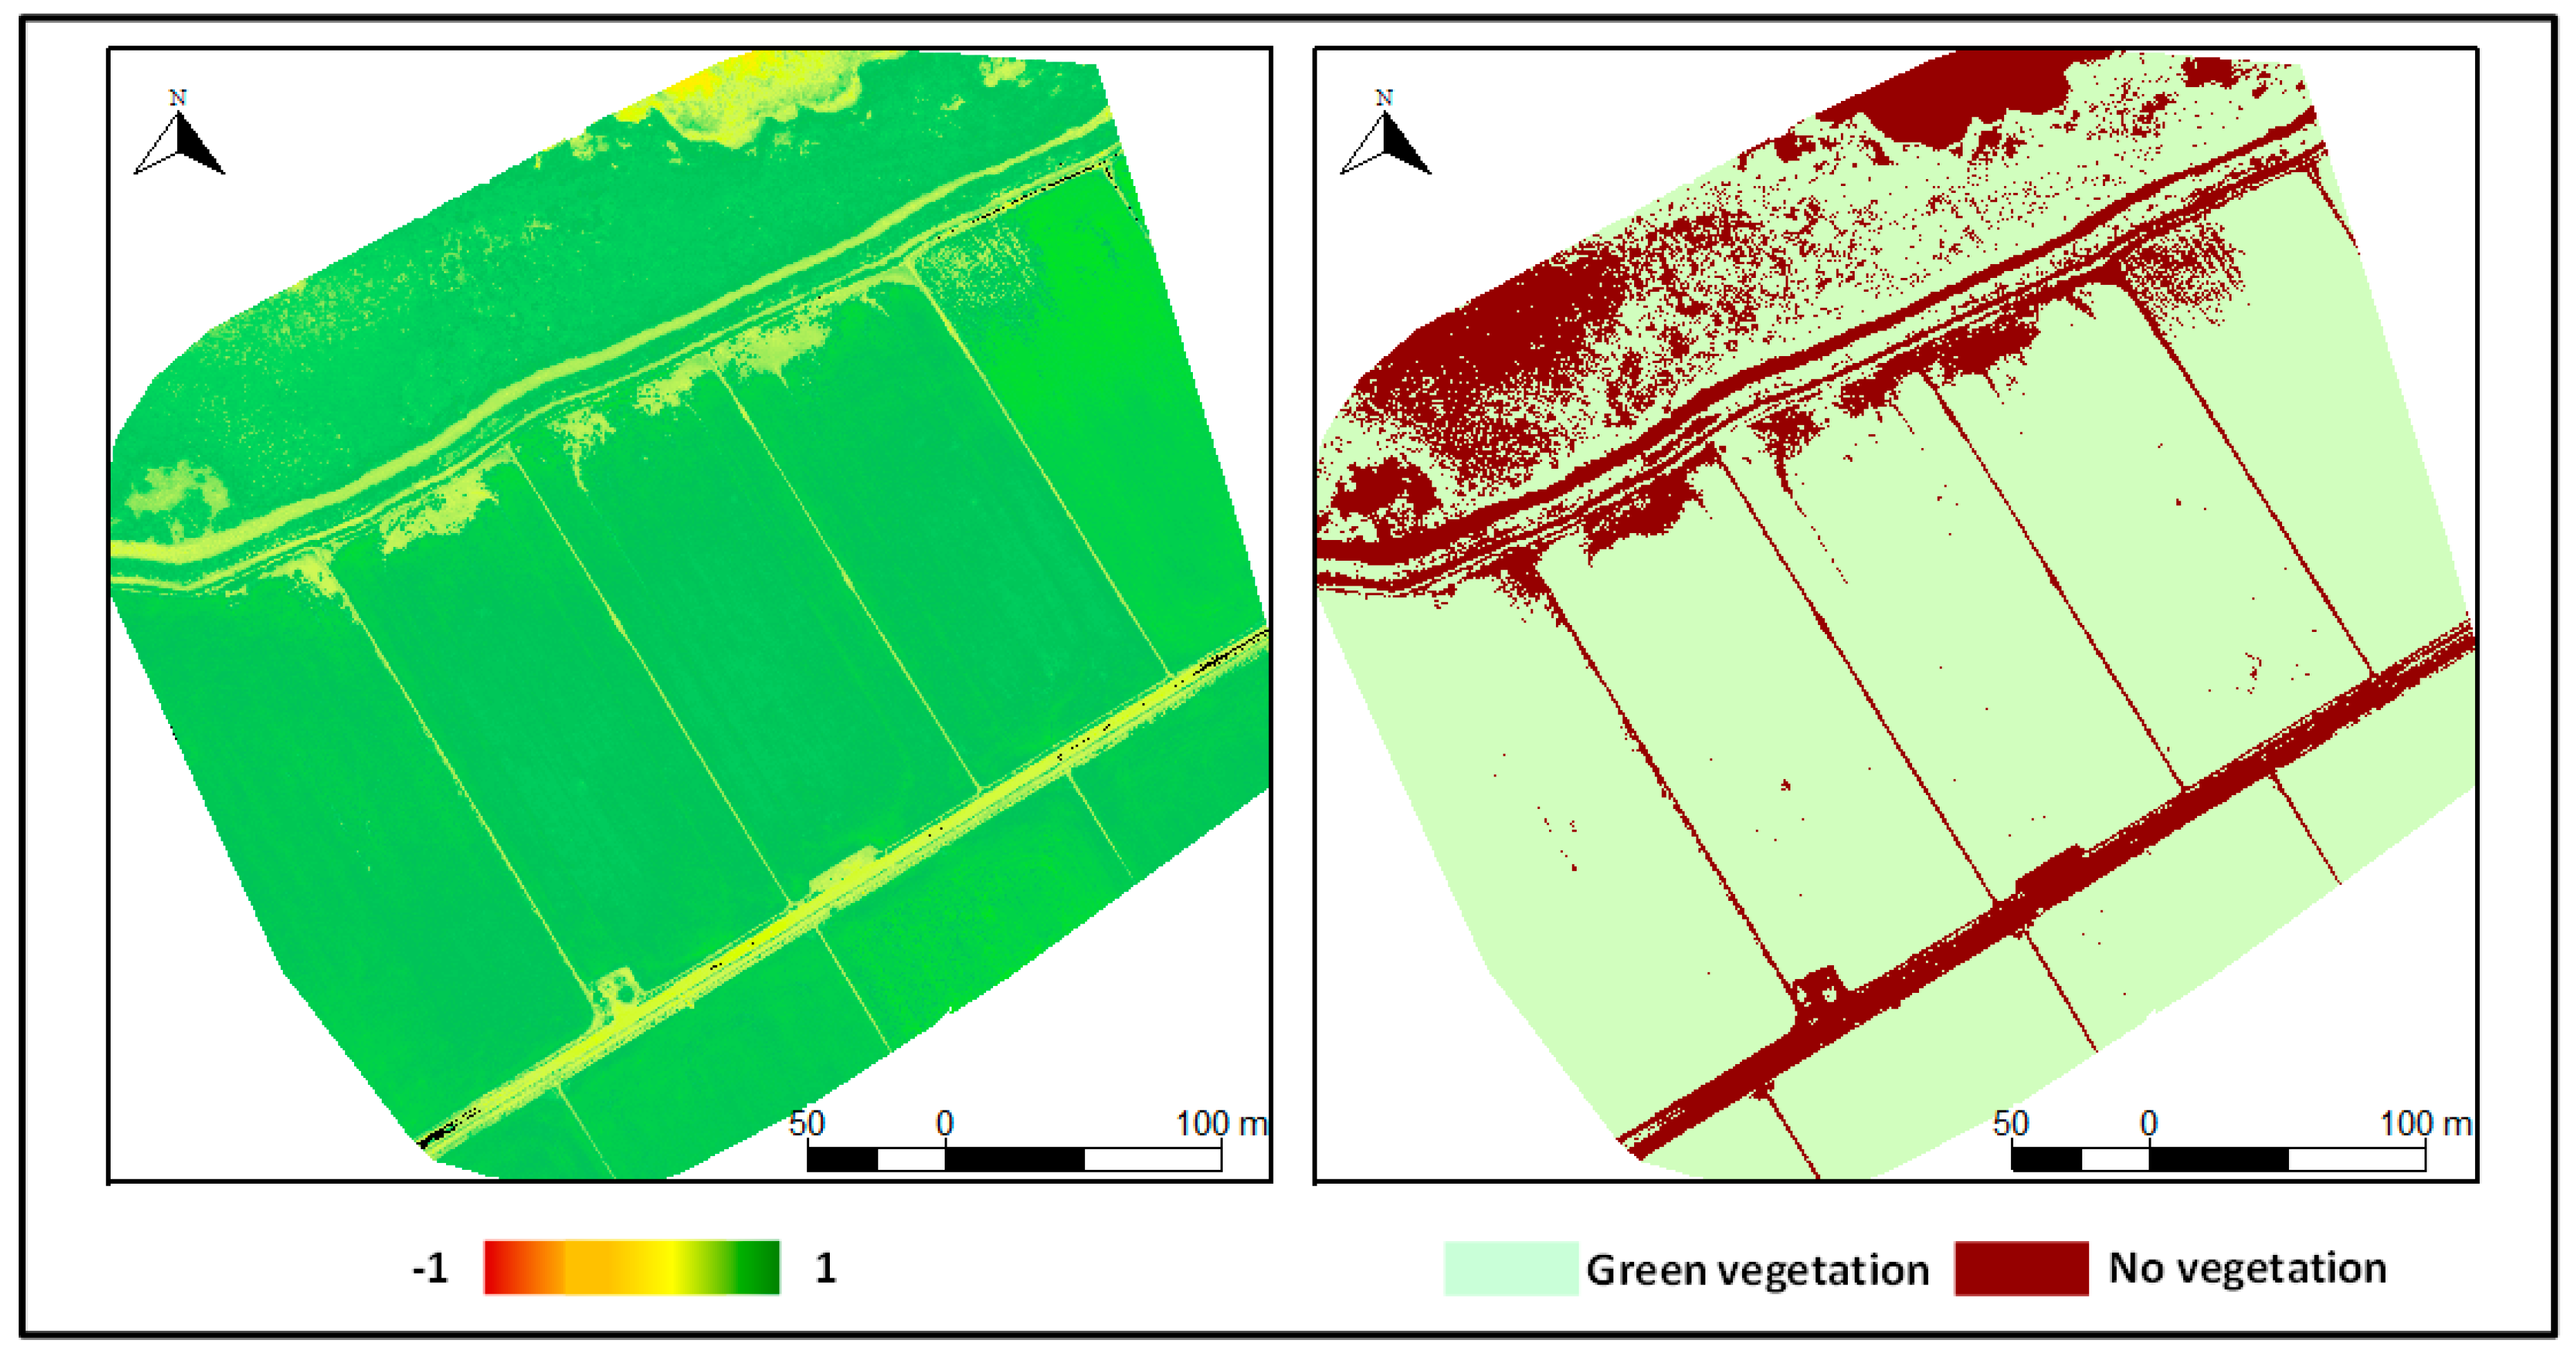
We calculated the NDVI index for the UAV images. The normalized difference vegetation index NDVI [
41] quantifies vegetation by measuring the difference between near-infrared (NIR), which vegetation strongly reflects, and red light (R), which vegetation absorbs with:
NDVI ranges from −1 to +1; negative values in wetland habitats are usually related to water surfaces, while positive values close to 0 represent low green vegetation cover and values close to 1 are usually associated with vegetation with dense green foliage. In this work, the NDVI index allowed us to identify no-greenery vegetation pixels, with or without water pixels, and also low greenery pixels, representing the damages caused by Western Swamphen in rice crops. It has been previously found with images from Sentinel-2 [
42] that the use of vegetation indices improves the results of crop classifications over the use of the respective individual bands.
A simple Jenks classifier was applied separately for every flight and provided the highest discrimination ability to create a binary green vegetation/no-vegetation map (
Figure 5). The Jenks classifier determined a class break value that produced two natural groupings by minimizing each class’s average deviation from its mean, while maximizing each class’s deviation from the other class’s mean. The thresholds to separate the non-vegetation from green vegetation with NDVI data were different for each surveyed plot, taking values between 0.56 and 0.79, depending on the variety and the state of vegetation development of each plot.
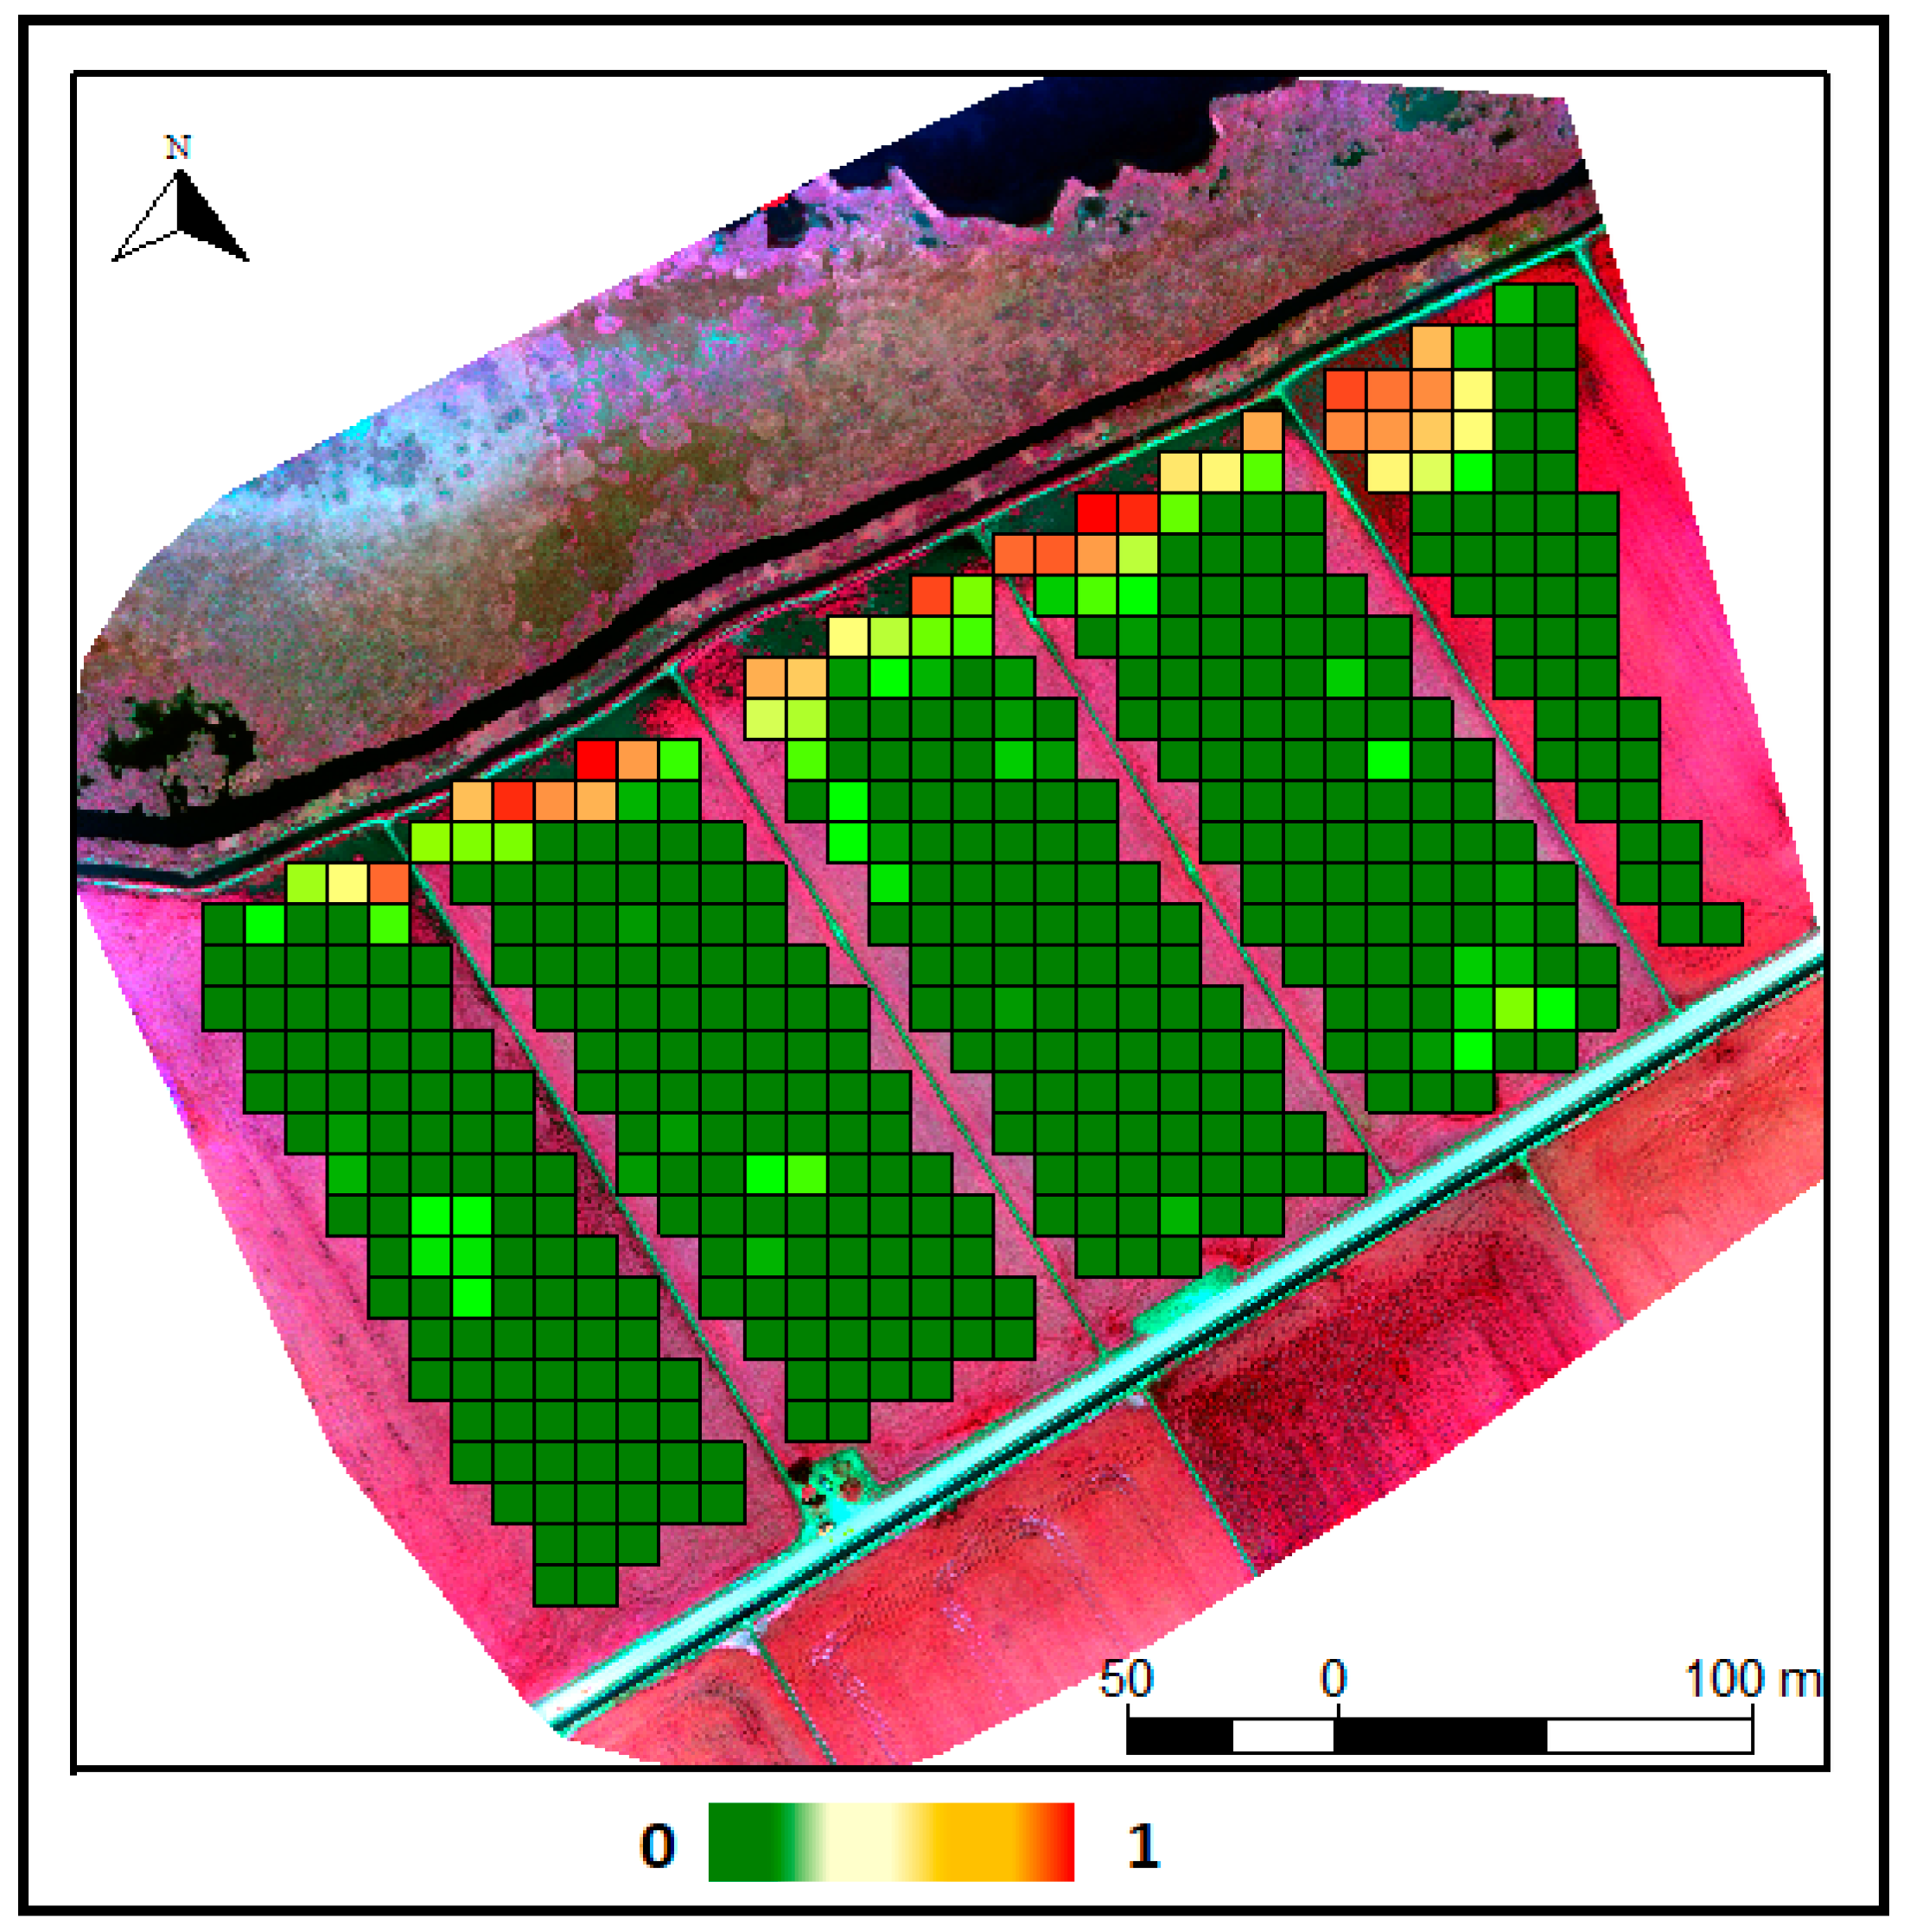
A 10 × 10 m mesh was created for each surveyed plot from the August 24 Sentinel-2 image pixels. The proportion of water and the proportion of non-vegetation for every 10 × 10 m square was calculated by obtaining a proportion of no-greenery vegetation for both indices (
Figure 6). Values near 1 indicated a higher proportion of damage and values near 0 indicate lower or null proportion of damage. From now on we will refer to this 10 × 10 m information as UAV-crop damage.
3.4. Selecting Pure Rice Crops Squares
In order to reduce noise from the analyses, we selected the 10 × 10 m squares that completely contained rice crops (in contrast with other pixels that also contain other land uses, such as rural tracks) (
Figure 6). Two sources of information were used to make this selection: (1) Agricultural Plot Map from the Catalan government, henceforthm SIGPAC (Spanish acronym of Geographical Information System of Agricultural Plots); and (2) all the available April–August 2017 Sentinel-2 cloud free images. SIGPAC is a free downloadable cartography provided by the government of Spain, which is renewed on a year basis. Pixels that were totally or mostly within a plot of “Arable Earth” category were selected. However, this cartography scale does not include all water channels. For this reason, Sentinel-2 imagery was also used to identify them. Since the water is not distributed equally throughout the year on all channels, we selected the maximum NDWI value for every pixel of the NDWI time series described in
Section 3.1 to identify the maximum water that can flow at any time of the year. Finally, with the two sources we computed a water channel mask and we applied it to all UAV-crop damage and Sentinel2-NDVI data. In addition, it was necessary to filter some pixels manually that the described methodology had not recognized (especially in the sampled plots).
3.5. Calibrating Sentinel2 with UAV-Crop Damage Information
We calibrated Sentinel2-NDVI with UAV-crop damage information for the 10 × 10 m cells. We used a generalized linear mixed effect model (GLMM) that predicted the proportion of damage as a function of NDVI value derived from Sentinel, and incorporated each plot as the random factor. We adopted a logistic regression with a logit link function (Equation (3)).
This logistic regression type was chosen because it allowed us to better fit values that cannot range below 0 or above 1. The mixed model regression is suitable to use when some of the observations share common sampling units that can gather some of the variance not directly explained by the fixed factors. In this case each of the agricultural plots may hold differences in rice variety and phenology, seed time, or irrigation conditions, but similarities in each of the cells within each plot. The variability of plot features is included through the random factor of the mixed model.
We checked for model residuals distribution through a fitted residual plot, and we evaluated model goodness-of-fit through the marginal R2 (explained by fixed factors), conditional R2 (explained by both fixed and random factors), and the Root Mean Square Error (RMSE). The model was validated by applying a cross-validation method using 80% of observations for calibration and 20% for testing. Predicted values for test observations were compared to observed values with a linear regression obtaining an adjusted r-squared and a test RMSE. To minimize the bias of the subsampling test data, we ran a 10-fold random subsampling cross-validation and we finally obtained an average adjusted r-squared and RMSE for the ten sub-validations.
3.6. Crop Damage Evaluation at the Plot Level: Translating the Final Models into Useful Products for Landscape Managers
The management unit for the landscape managers is the SIGPAC agricultural plot. The payments for damages are granted based on damage that occurred in each agricultural plot and quantified in hectares, so our goal was to provide a measure of damage per SIGPAC plot. We assume that the damages that cause large loss of vegetation, as the ones observed in the north of the surveyed plot number 1 (from
Figure 4 to
Figure 6), are the minority, and the majority of damages represent a small proportion of the 10 m Sentinel-2 pixel (check photographs in
Figure 2). We also observe that most parts of 10 m pixels in the whole Delta have an estimated damage ratio under 1% that could not be considered as real damage caused by Wester Swamphen. Thus, we needed to identified pixels with significant crop damage that would be caused by the bird and then the final damage map would correspond to the sum of the full pixel surfaces, with significant damage values for each agricultural plot.
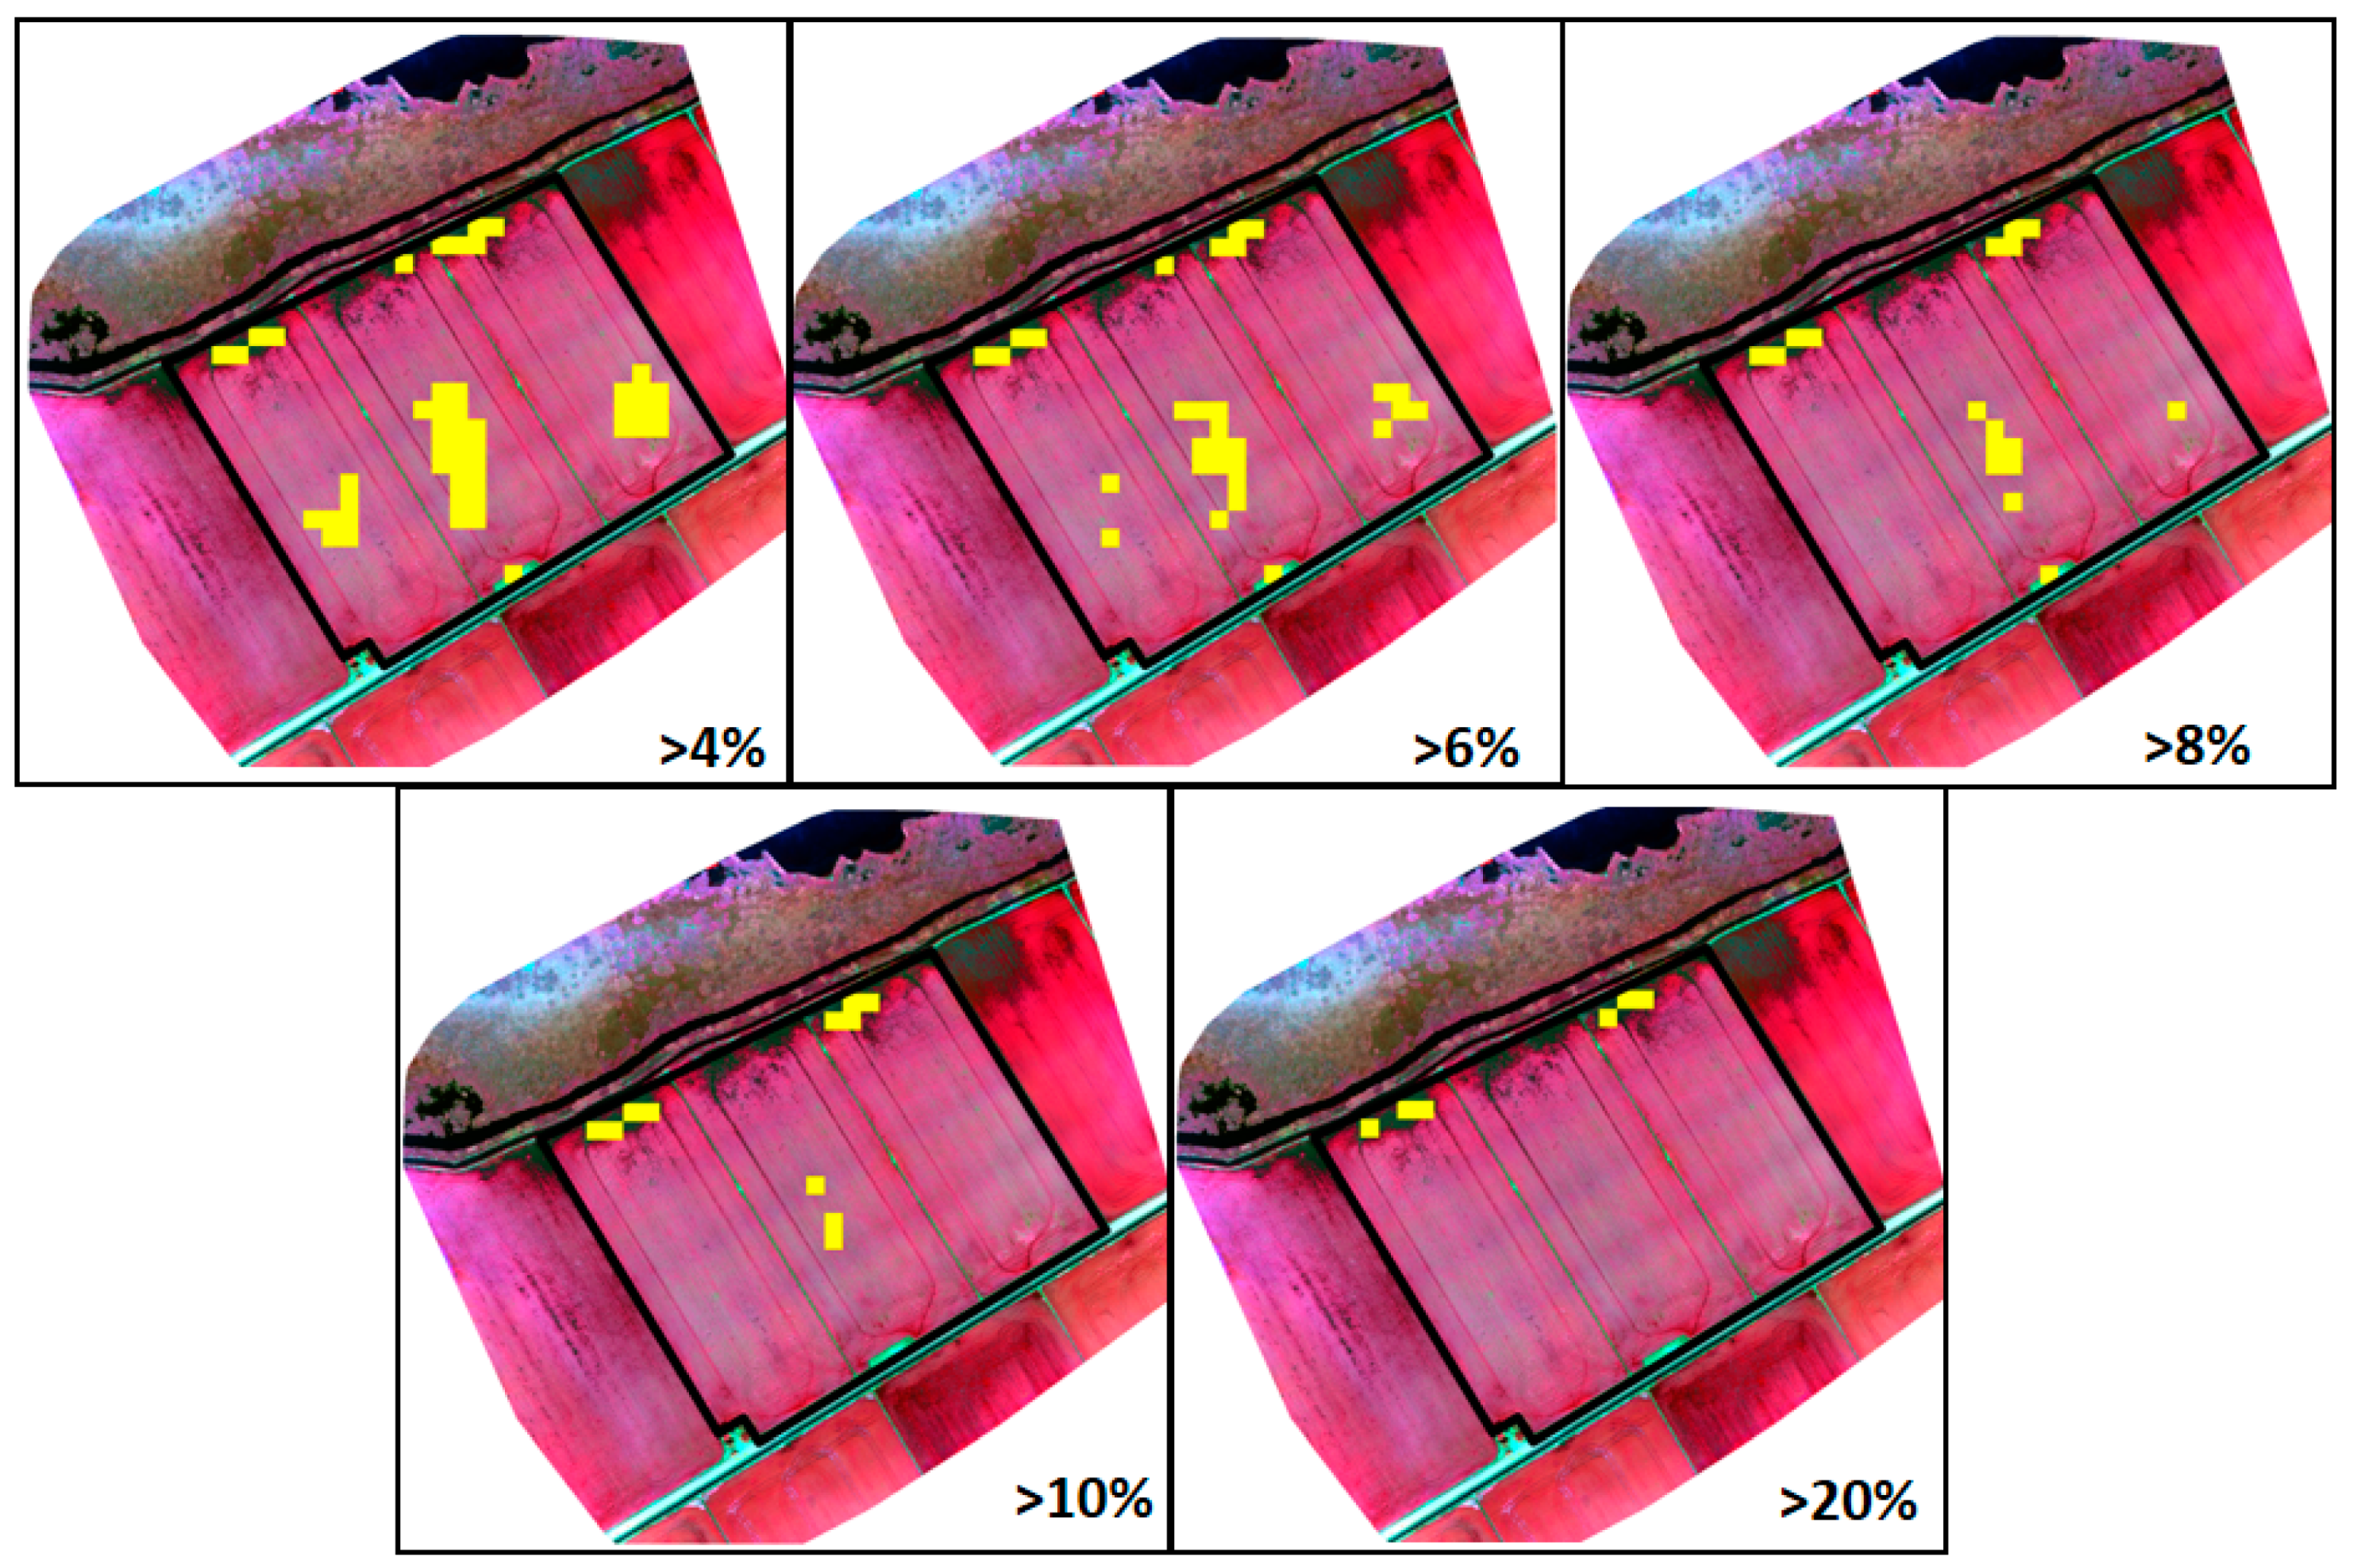
First, we needed to identify this significant crop damage threshold. To proceed with this identification, we tested different thresholds: 4%, 6%, 8%, 10%, and 20%. The selection of these thresholds took into account a compromise between level of significant damage (>1%) and number of damaged pixels selected within every threshold. Low thresholds selected a great number of pixels but may have included pixels that were not actually damaged by birds. Instead, high thresholds selected only pixels with large loss of vegetation, avoiding also damaged pixels without large loss of vegetation. Then, the sum of the damaged pixels for each threshold in each surveyed plot was calculated. Finally, this different estimations at the agricultural plot level were validated [
30,
43] with ground information from Rangers Service from the Catalan government, which follows an established protocol to assess crop damage in the field. Once a farmer has detected some damage caused by the Western Swamphen, he claims the assessment on the field by the Rangers Service to quantify damages and receive the corresponding payments. This assessment is performed on the ground, next to the affected plot, and it is only based on expert criteria. It does not constitute an exact quantification of the damages but it offers an approximate value to evaluate models’ predictions.
4. Results
The four surveyed plots showed different ranges of UAV-crop damages and Sentinel2-NDVI at a 10 m pixel level. Plot number 1 and 2 held a wide UAV-crop damage range (0 to 0.97, and 0 to 0.93, respectively,
Table 1), whereas the UAV-crop damage range in plot number 3 was between 0 and 0.36, and the crop UAV-crop damage for plot number 4 was always under 0.04. This indicated that plots 1 and 2 have larger parts with loss of vegetation, while the damage in crops 3 and 4 are smaller and dispersed throughout the plot. Sentinel2-NDVI range of values also showed clear differences: plot 1 had the widest range (0.32 to 0.78), plot number 2 ranged between 0.38 and 0.74, plot number 3 had Sentinel2-NDVI ranges between 0.38 and 0.95, and plot 4 showed a small range above 0.5, specifically between 0.52 and 0.78.
The selected fitted generalized linear mixed model between UAV-damage ratio and Sentinel2-NDVI achieved good model adjustments, with a RMSE of 0.054 (
Table 2). The random effect of the variable “surveyed plot” appeared significant (<0.001), meaning that the intercept of the relationships between Sentinel2 and UAV-damage differed by plot. The model presented a goodness of fit explained by fixed effects (Sentinel2-NDVI) of 48%, described as marginal R
2 in
Table 2, and explained by both fixed and random (surveyed plot) effects of 81%, described as conditional R
2 also in
Table 2. The cross-validation decreased its prediction ability in comparison to the full calibrated model, but still achieved relevant performances, with an average of 57% in the regression between observed and predicted values and a RMSE of 0.102 (
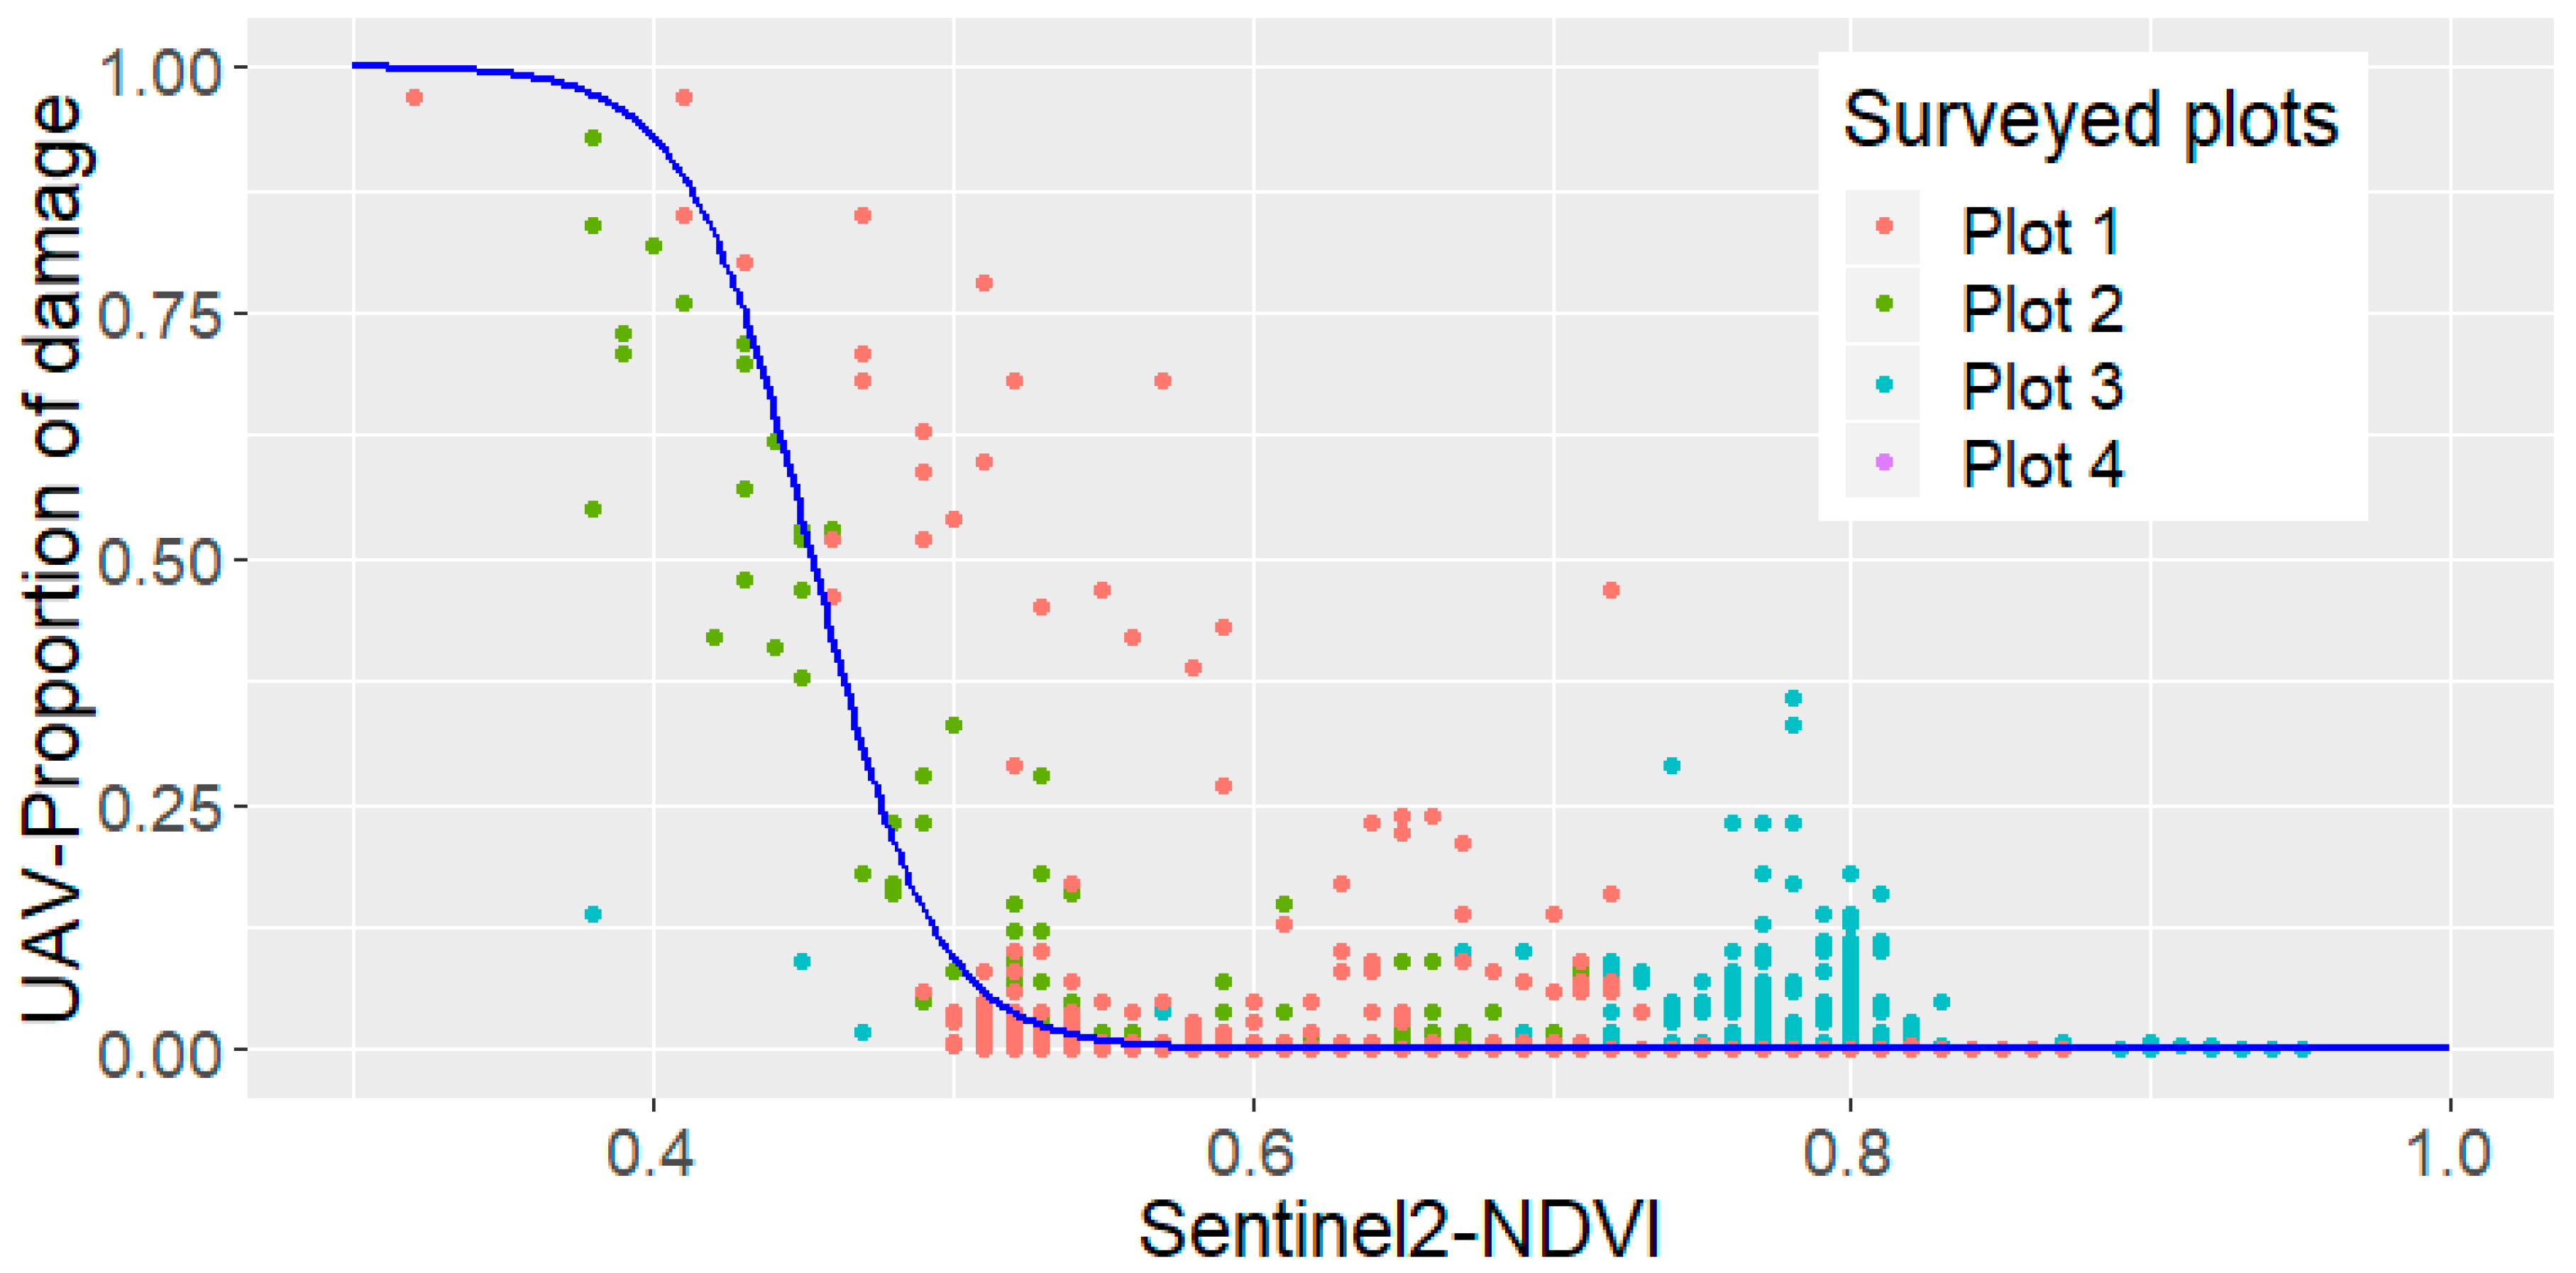
Table 2). The Sentinel2-NDVI index exerted a negative influence in predicting observed damage: an increase in Sentinel2-NDVI values decreases the proportion of Western Swamphen damage described by UAV (
Figure 7).
The model predicted low values of damage proportion, close to 0, in most parts of the pixels with Sentinel2-NDVI values above 0.55 (blue line in
Figure 7). NDVI values under 0.55 predicted damages ratios from 0.05 to 1 (corresponding to 5% and 100% respectively). Most pixels had a damage ratio under 0.20, decreasing considerably the number of pixels with damage ratios above 25%. However, in contrast to what was expected, there are some pixels with damages between 0.12 and mostly up to 0.25, with relatively high Sentinel-NDVI values, specifically with values between 0.6 and 0.8 (
Figure 7), most of them belonging to plot 3.
We applied the resulting model to the whole August 24 Sentinel-2 NDVI product for the Ebro Delta. The final map informed about proportion of damage per pixel with values between 0 and 1 (
Figure 8). The predicted crop damage map identified the pixels with large areas of no-vegetation, with colors from yellow to red in
Figure 8. Most part of the Delta had values close to 0, represented by green colors (
Figure 8).
Finally, we applied the defined damage thresholds (4%, 6%, 8%, 10%, and 20%) to calculate the estimated agricultural plot damage (
Figure 9). Once a pixel has a predicted damage above this threshold, the entire pixel is accounted as damaged. Pixels above these thresholds represented 13%, 12%, 11.6% 11.2%, and 10% of the total predicted surface, respectively. Therefore, damages ratios under 4% represent the majority of the Delta pixels (87% of total crop pixels).
The validation of the different thresholds with ground information from the Rangers Service showed an underestimation of damages in plots 1 and 2 (
Table 3), even in the lowest damage ratio threshold. For plot 1, the largest threshold of damage assessed (20%) included some of the pixels with higher damage identified visually (
Figure 9, northern part). On the contrary, and unexpectedly, the lowest threshold (4%) did not include all the high damage pixels identified visually, but it is also important to note that this threshold correctly identifies the scattered damages in the center of the plot. In plot 3, predicted damages are virtually null, similar to the information gathered by the Rangers Service (
Table 3). Finally, there is a slight overestimation of predicted damages in plot 4, although as the damage threshold per pixel rises, the total value of the plot is closer to the quantification by the Rangers Service (
Table 3), being the 20% threshold, which is slightly lower than Rangers Service quantification.
5. Discussion
The quantification of Western Swamphen crop damage is a big challenge due to its fine grained patterns. The methodology developed in this work, and especially the results and validation of the regression model, appear promising for quantifying this type of damage with Sentinel-2 imagery. The prediction of damages at the agricultural plot level with a previous filter of pure crop pixels is also promising. Previous analyses including pixels containing water channels, roads, pathways, or other land covers showed weaker relationships and major errors (not shown).
The model can more-easily predict damages that produce important loss of vegetation, and it has more difficulty in identifying the less-intense and scattered damages, i.e., less than 25% of damage per 10 m pixel. The scattered damages are able to be detected from UAV but are more difficult to appreciate at Sentinel-2 level because the NDVI values in these pixels remains high. The model presents important limitations to predict damages that only affect the rice grains without decreasing plant vigorousness, and even more if the damaged areas are covered by some type of vegetation, such as algae, which also produces high values of greenery. These types of damages are also arduous to detect with UAV multispectral imagery.
The Sentinel-2 10 m resolution resulted in consistent relationships with UAV information, since the fitted model achieved a good adjustment, although differences appeared among the four surveyed plots that may decrease the adjustment in the cross-validation. We assume that there are not important calibration differences between flights that could influence these results because we have ensured we applied the same methodology to capture calibration panels pictures and we also assume that the reflectivity is quite similar in the four flights due to the hour of the flights (few hours before and after the noon) and the date of the year (August 17th) in the Delta Ebro region. These differences might be related mainly to the differences in the pressure exerted by the species on the crop, rice variety, or agricultural treatments, or due to minor differences in phenology state, but these effects must be minimal because all fields were close to being harvested. These differences increase the uncertainty of the model, but the mixed generalized model is appropriate because it allows incorporation of such differences between crops as a random factor and derivation of one single model for the whole Delta area. The use of a single model for the whole Delta that incorporates the intrinsic variability of rice crops facilitates the transfer of the methodology to the landscape managers in order to use an objective methodology to quantify damages and define economic compensation strategies.
The Sentinel-2 10 m information resolution also allows a promising prediction of damages at the agricultural plot level. The selection of an adequate significant damage threshold shows good potential for identifying scattered damages at this scale. Considering a low damage ratio pixel as a whole affected pixel seems to counteract the difficulties of detecting scattered damages at the 10 m pixel level. This may be reasonable, because according to expert knowledge, scattered damages may show aggregated patterns, therefore, close to some of the detected damages there may be damages that effect rice production but produce low NDVI decrements that are very difficult to detect, even with UAV. The filtering of agricultural pure pixels may produce an underestimation of damages in pixels with important loss of vegetation because the majority of pixels with large loss of vegetation are near agricultural crop edges next to roads and water channels, and some of them they may have been excluded from the analysis, meaning they are not accounted for in the total damaged surface per agricultural plot. On the other hand, automatic pixel filtering also has other limitations in the other direction—there may also be an overestimation of damages in pixels with a small fraction of other uses that have not been filtered by the automatic methodology.
One of the highlights of this project has been the use of multispectral information. The NIR channel information from UAV allowed us to describe the characteristics of the vegetation, which are not well described by using the visible spectrum. At the same time, multispectral information enabled the generation of products more related to the multispectral medium resolution information derived from satellites as Sentinel-2 or Landsat. Previous works applying calibration of multispectral remote sensing measurements from UAV are very few and are aimed at quantifying other ecosystem attributes, such as fire severity [
30,
31]. In these cases, correlations between UAV and medium resolution remote sensing imagery have been found to be higher than the ones presented in this work. This may be because the damages caused by large forest fires are more apparent and visually-identifiable from medium resolution remote sensors than the Western Swamphen damages.
This calibration can be used to estimate damages in Sentinel images in other temporal or spatial contexts. Further validations are fostered in order to better test the capability to properly predict these kinds of damages. However, it is important to note that there may be other animal species that produce similar damages as the ones produced by the Western Swamphen. Moreover, images might detect other agronomic variations of the crops themselves due to diseases, germination problems, environmental variations, etc., with similar responses to the damage produced by animals. For this reason, a complementary expert identification of the plots that have been damaged by this species will generally be required in order to correctly estimate the final cause of damage to the rice crop.
Finally, we conclude that the models in this work improve the cost-efficiency of the quantification of Western Swamphen damage in large rice crop areas, especially in terms of objectivity. However, the methodology presents some weakness that should be addressed in the future to enhance the robustness of the models. We believe that the main points to consider could be the following:
Exploring other UAV vegetation indices that could improve the regressions with Sentinel-2 imagery in order to better discriminate scattered damages, and also identify damaged spots that have been covered with algae or other vegetation and damages that only affect the rice grains.
Analyzing in greater depth the potential relationship between different rice types and the detectable damage. Different varieties of rice are cultivated, each one with different morphology, and these differences could affect the detectability of the damage.
Analyzing the effects, including the information from neighboring pixels.
Improved mapping of water channels, roads, and pathways cartography in order to extract easily the Sentinel-2 pixels with these land covers.
Working on a reliability map aimed at offering the land manager proper information about the real quality of the final model at the plot level.

 ,
, 


