Article

UAVs for Hydrologic Scopes: Application of a Low-Cost UAV to Estimate Surface Water Velocity by Using Three Different Image-Based Methods

by
Paschalis Koutalakis
1,*,
Ourania Tzoraki
1 and
George Zaimes
2
1
Department of Marine Sciences, University of the Aegean, 81100 Mytilene, Greece
2
Department of Forestry and Natural Environment Management, Eastern Macedonia and Thrace Institute of Technology, 1st km Drama-Mikrohoriou, 66100 Drama, Greece
*
Author to whom correspondence should be addressed.
Drones 2019, 3(1), 14; https://doi.org/10.3390/drones3010014
Submission received: 21 December 2018 / Revised: 17 January 2019 / Accepted: 25 January 2019 / Published: 28 January 2019

Abstract

:
Stream velocity and flow are very important parameters that must be measured accurately to develop effective water resource management plans. There are various methods and tools to measure the velocity but, nowadays, image-based methods are a promising alternative that does not require physical contact with the water body. The current study describes the application of a low cost unmanned aerial vehicle that was selected in order to capture a video over a specific reach of Aggitis River in Greece. The captured frames were analyzed by three different software (PIVlab, PTVlab, and KU-STIV) in order to estimate accurately the surface water velocity. These three software also represent three different image-based methodologies. Although there are differences among these three methods, the analysis produced similar trends for all. The velocity ranged between 0.02 and 3.98 m/s for PIVlab, 0.12 and 3.44 m/s for PTVlab, and 0.04 and 3.99 m/s for KU-STIV software. There were parts, especially in the existing vegetation, where differences were observed. Further applications will be examined in the same or different reaches, to study the parameters affecting the analysis. Finally, the image-based methods will be coupled with verification measurements by a current meter to produce more rigorous results.

1. Introduction

Streamflow varies substantially, as there are periods when the flow is low because of droughts and periods characterized by high discharges because of precipitation surplus [1]. Low flows are seasonal and typically occur during similar periods over different years, especially during the summer months, although there are extreme precipitation events that can result in flash floods [2]. Based on the presence and flow of water, streams are characterized as (a) perennial (water flow exists all year round), (b) intermittent (water flow is present for weeks or months over a year) and (c) ephemeral (water flows for hours or days after a rainfall event) [3]. The range of water discharge and stream velocity affect the adjacent environment and riparian area [4], their floodplains [5], their habitats and macroinvertebrates [6], the transported sediment [7], engineering constructions [8,9], the human needs (agriculture, ecotourism, etc.) [10]. Based on the above reasons, monitoring of streams is very important (both for their quantity and quality) and obligatory when referring to European Countries based on the Water Framework Directive [11]. There is an extensive global monitoring network, but it primarily focuses mostly on larger rivers [12] while the majority of intermittent and ephemeral streams or rivers are ungauged [13]. These types of streams and rivers dominate the Mediterranean region [14].
There are various tools and methods to measure the stream velocity and discharge from rating curves to acoustic Doppler devices [15,16] and modeling tools [17]. During the last decades, image-based methods have been proposed in water resources that are still being developed and utilized in different environments and different conditions, but also for different applications. These methods focus on images/frames that can be extracted by captured videos [18]. Initially, the image-based methods were mainly used in laboratory facilities for fluid hydraulics [19]. While researchers have applied the image-based methods in studying liquids since 1977, Meynart was the main researcher who used images to estimate the water velocity, and referred to his work as laser speckle velocimetry (LSV). The term “particle image velocimetry” (PIV) was proposed in 1984, because the images included individual particles [20]. PIV produces two-dimensional or even three-dimensional vector fields of the velocity based on the recorded motion of particles [21]. The method requires a plastic or glass tube, a digital camera, particles, proper lighting conditions by using a lamp, a laser that enhances the visibility of the particles and, finally, software/hardware to run the PIV analysis [22]. The PIV method has mostly focused on studying the water profile of laboratory tubes as they provide the proper visibility to study the hydraulic parameters, but it can be also applied above the free surface of the water [23]. There are many reviews about the PIV method (e.g., review by Di Cristo [24]). Another method used is the particle tracking velocimetry (PTV), that is applied when the particle concentration is so low that it is possible to follow an individual particle. There are also several reviews about the PTV method [25]. The implementation of these methods at a larger scale, such as natural environments (e.g., streams, rivers), led to the introduction of the term “large scale PIV” (LSPIV) [26], a method that measures the surface velocity of water bodies by analyzing the captured images and the movement of larger particles [27]. LSPIV has been applied by cameras mounted in vehicles [28] or over bridges [29] or at high height locations near riverbanks [30], and with unmanned aerial vehicles (UAVs) [31]. The PTV method can also be applied at larger scales, and the LSPTV (large scale particle tracking velocimetry) method was introduced [32,33]. Space time image velocimetry (STIV) is another method developed by Fujita in 2007, in order to estimate the surface water velocity [34]. The STIV method estimates the velocity by analyzing the texture of the flowing water surface within a space time image sequence [35].
Although the UAVs have been developed for military purposes [36], currently, they have been used in other applications and environmental fields, including hydrology [37,38]. The main reasons for their exploitation are the (a) increased life of batteries, (b) decrease in their cost, and (c) innovative software development, including smartphone applications [39]. The UAVs are distinguished into two categories concerning the type of aircrafts (i) the multi-copters or multi-rotors, and (ii) the fixed-wing [40]. Various UAVs have been used in order to estimate the water velocity in hydrology, either commercial or custom-made. The type of drones used in such studies are the multi-copters (hexacopters, quadcopters, or octocopters) because this methodology requires a stable video of a specific location, in contrast to a fixed-wing aircraft that cannot stop during flights. Detert and Weitbrecht used a low-cost UAV system (DJI Phantom FC40) that cost $800, including the camera and the gimbal (GoPro Hero 3), in 2015 [41]. Tauro and his associates used a DJI Phantom 2 quad-rotor with a Zenmuse H3-2D gimbal and a GoPro Hero 3 camera that cost $1300 [42]. Thumser and Haas used a custom-made hexacopter while introducing the name “RAPTOR” which stands for real-time particle tracking in rivers using an unmanned aerial vehicle [43].
The objective of this study was the application of the image-based methods using a low-cost UAV system. The study incorporates three different software that represent three different image-based methods. The three software (PIVlab, PTVlab, and KU-STIV) were utilized by a low cost and small UAV equipment (DJI Spark). The application took place in a natural environment—the Aggitis River in Greece. The results of these three software are compared and discussed.

2. Materials and Methods

2.1. Study Area

The study area was a reach of Aggitis River, the largest tributary of Strymonas River in Greece. The Aggitis River basin is located both in Serres and Drama Prefectures in Northern Greece (Figure 1a) [44]. The river flow is generated by water inputs of an extensive underground karst system, and flows as an underground river at Aggitis (or Maara) Cave [45]. The Aggitis springs are located at the outlet of the cave [46]. The river crosses the plain of Drama Prefecture along with other major streams, then flows through a small gorge “Aggitis Gorge” near Alistrati Cave, and finally contributes to Strymonas River which ends in Strymonikos Gulf in the North Aegean Sea [47,48]. The total area of the Aggitis River basin is about 2300 km2 [49]. The selected reach of the river provides the proper accessibility, since the riparian vegetation from one of the riverbanks is very low, while the road network is nearby and there are two bridges before and after the specific reach (Figure 1b). It is worth mentioning that the study area is not listed as a restricted flying zone while hovering at ≤50 m from the user’s location, so it is legal to fly without any flight plan according to the Greek National Regulations [50]. Due to many previous rainy days before the UAV flight, the water flow of Aggitis River had increased while the water was muddy. Finally, the specific location provides the necessary natural turbulence patterns for the LSPIV analysis due to a constructed barrier (a pipe that transports water for agricultural purposes).

2.2. The UAV

The mini drone DJI Spark was selected to capture a video above the river. It is a low-cost drone (costed €400) compared to other UAVs used in similar studies. The specifications of the drone are depicted in Table 1 [51]. The drone is connected via Wi-Fi with a smartphone/tablet, and can be operated through the official application DJI GO 4. The “Tripod Mode” is an intelligent flying mode option that reduces the speed of the drone, and the video is stable and smooth—appropriate for image-based methods analysis. The DJI spark hovered at 40 m over the selected location and captured a video of about 30 s in the “tripod flight mode”.

2.3. The Software

2.3.1. PIVlab

The PIVlab software was developed by Thielicke and Stamhuis as a Graphical User Interface (GUI) in MATLAB (MathWorks®) for the particle image velocimetry analysis [52], but it can also be utilized in LSPIV applications [53]. It is a free software, downloadable from the internet, while it provides tutorials in order to be user-friendly. More specifications can be found in its tutorials and examples [54]. The image analysis in PIVlab was performed on the georeferenced extracted images (200 frames based on the minimal movement of the drone to reduce errors). The analysis was done at a continuous sequence of frames. Multipass window deformation was applied with two interrogation passes: (i) 64 to 32 px2 and (ii) 32 to 16 px2. Both unreliable high vectors and misleading riparian vectors were deleted during the post-processing of the images. The analysis lasted 15 min, based on the capabilities of the computer and the number of frames that were selected. Figure 2a represents a frame extracted from the captured video by the drone while Figure 2b is the greyscale image used for the image velocimetry.

2.3.2. PTVlab

The PTVlab software was developed by Dr Wernher Brevis (the mathematical algorithms part) and Antoine Patalano (GUI adaptation in MATLAB part) based on the codes of PIVlab [55]. PTVlab uses the LSPTV method and allows the particle detection by the binary correlation, the Gaussian mask, and the dynamic threshold binarization techniques. The particle tracking can be executed with the cross-correlation, the iterative relaxation labeling technique, or a hybrid of the two approaches [56]. It is also a free software, and its specifications can be found online [57]. The same sequence of frames was input for this image analysis. The particle detection was performed using Gaussian mask with a correlation threshold 0.5 and a sigma of 3 px, while the PTV algorithm was cross-correlated by an interrogation area of 20 px, a minimum correlation of 0.7 px, and a similarity neighbor of 25%. The analysis lasted approximately an hour.

2.3.3. KU-STIV

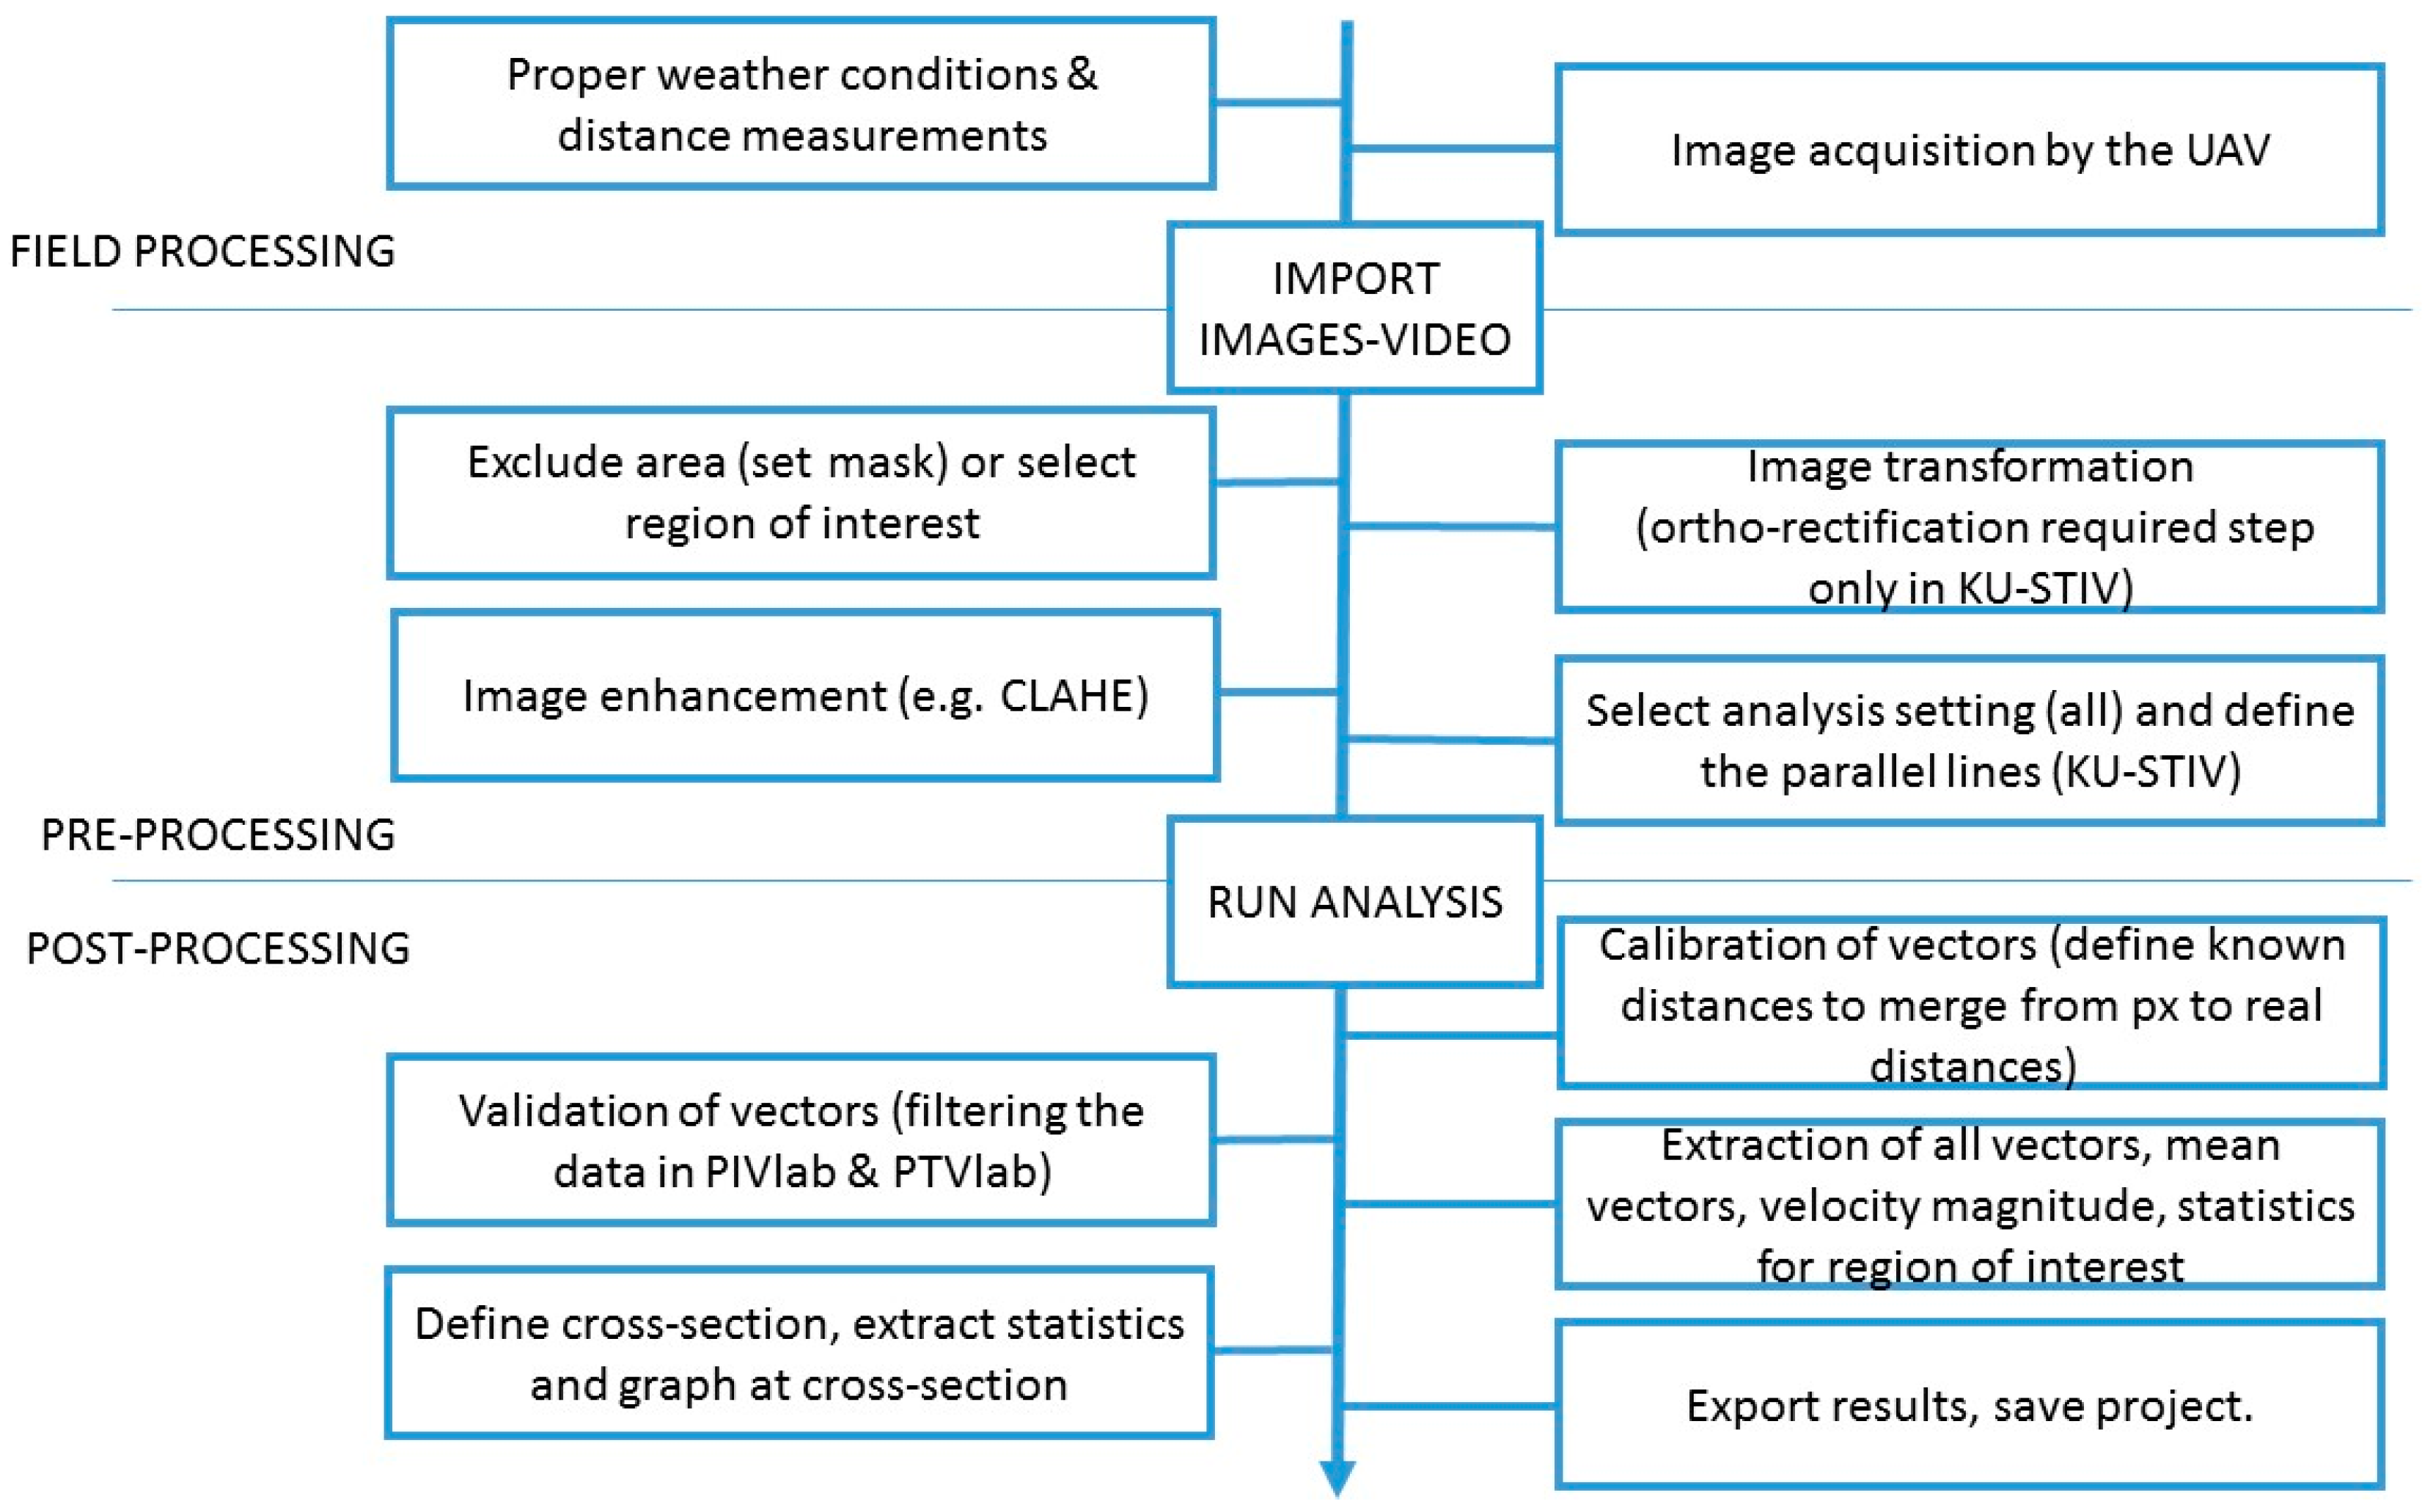
KU-STIV is a software developed by Fujita and his team to apply the STIV method [58]. KU-STIV combines various algorithms: the displacement, rotation, and size change between the consecutive images are detected by using the algorithm known as RIPOC, while the algorithm named SIFT is used to detect feature points in the respective image and record the track based on the coordinates of the detected feature points [59]. This software also provides a stabilization method for the videos but, also, an orthorectification option if the images are captured at oblique angles. The velocity is estimated upon parallel lines to the water flow, predefined by the user, and not in the entire field of the image. Finally, the software requires a license in order to use it. The following figure, Figure 3, illustrates the flowchart of the methodology followed in the present study for all three software.

3. Results

The results of the LSPIV analysis using PIVlab are depicted in Figure 4. The green arrows are the mean calculated velocity vectors that show both direction and magnitude. The vectors are visible only in the location where natural patterns occurred. There were no visible tracers over the constructed barrier requiredo produce the velocity field. There are many reasons for this absence, such as (a) the period that the measurements were taken had no leaves or branches carried by the river flow, (b) the river was muddy and it was therefore difficult to distinguish any floating particles, and (c) the height of the flight was at 40 m, so it was impossible to record sufficient particles in size. A known distance must be defined to convert the pixels of the frame to real dimensions. The black line depicts the known distance of the pipe as measured at the site. PIVlab and PTVlab are both able to produce the streamlines or the flow paths depicted in Figure 4 as white lines. They also have the capability to provide statistics and graphs based on the designed cross-sections or areas. The purple line is the cross-section of the specific reach of Aggitis River. Figure 5 represents the vectors of the PTV analysis in PTVlab.
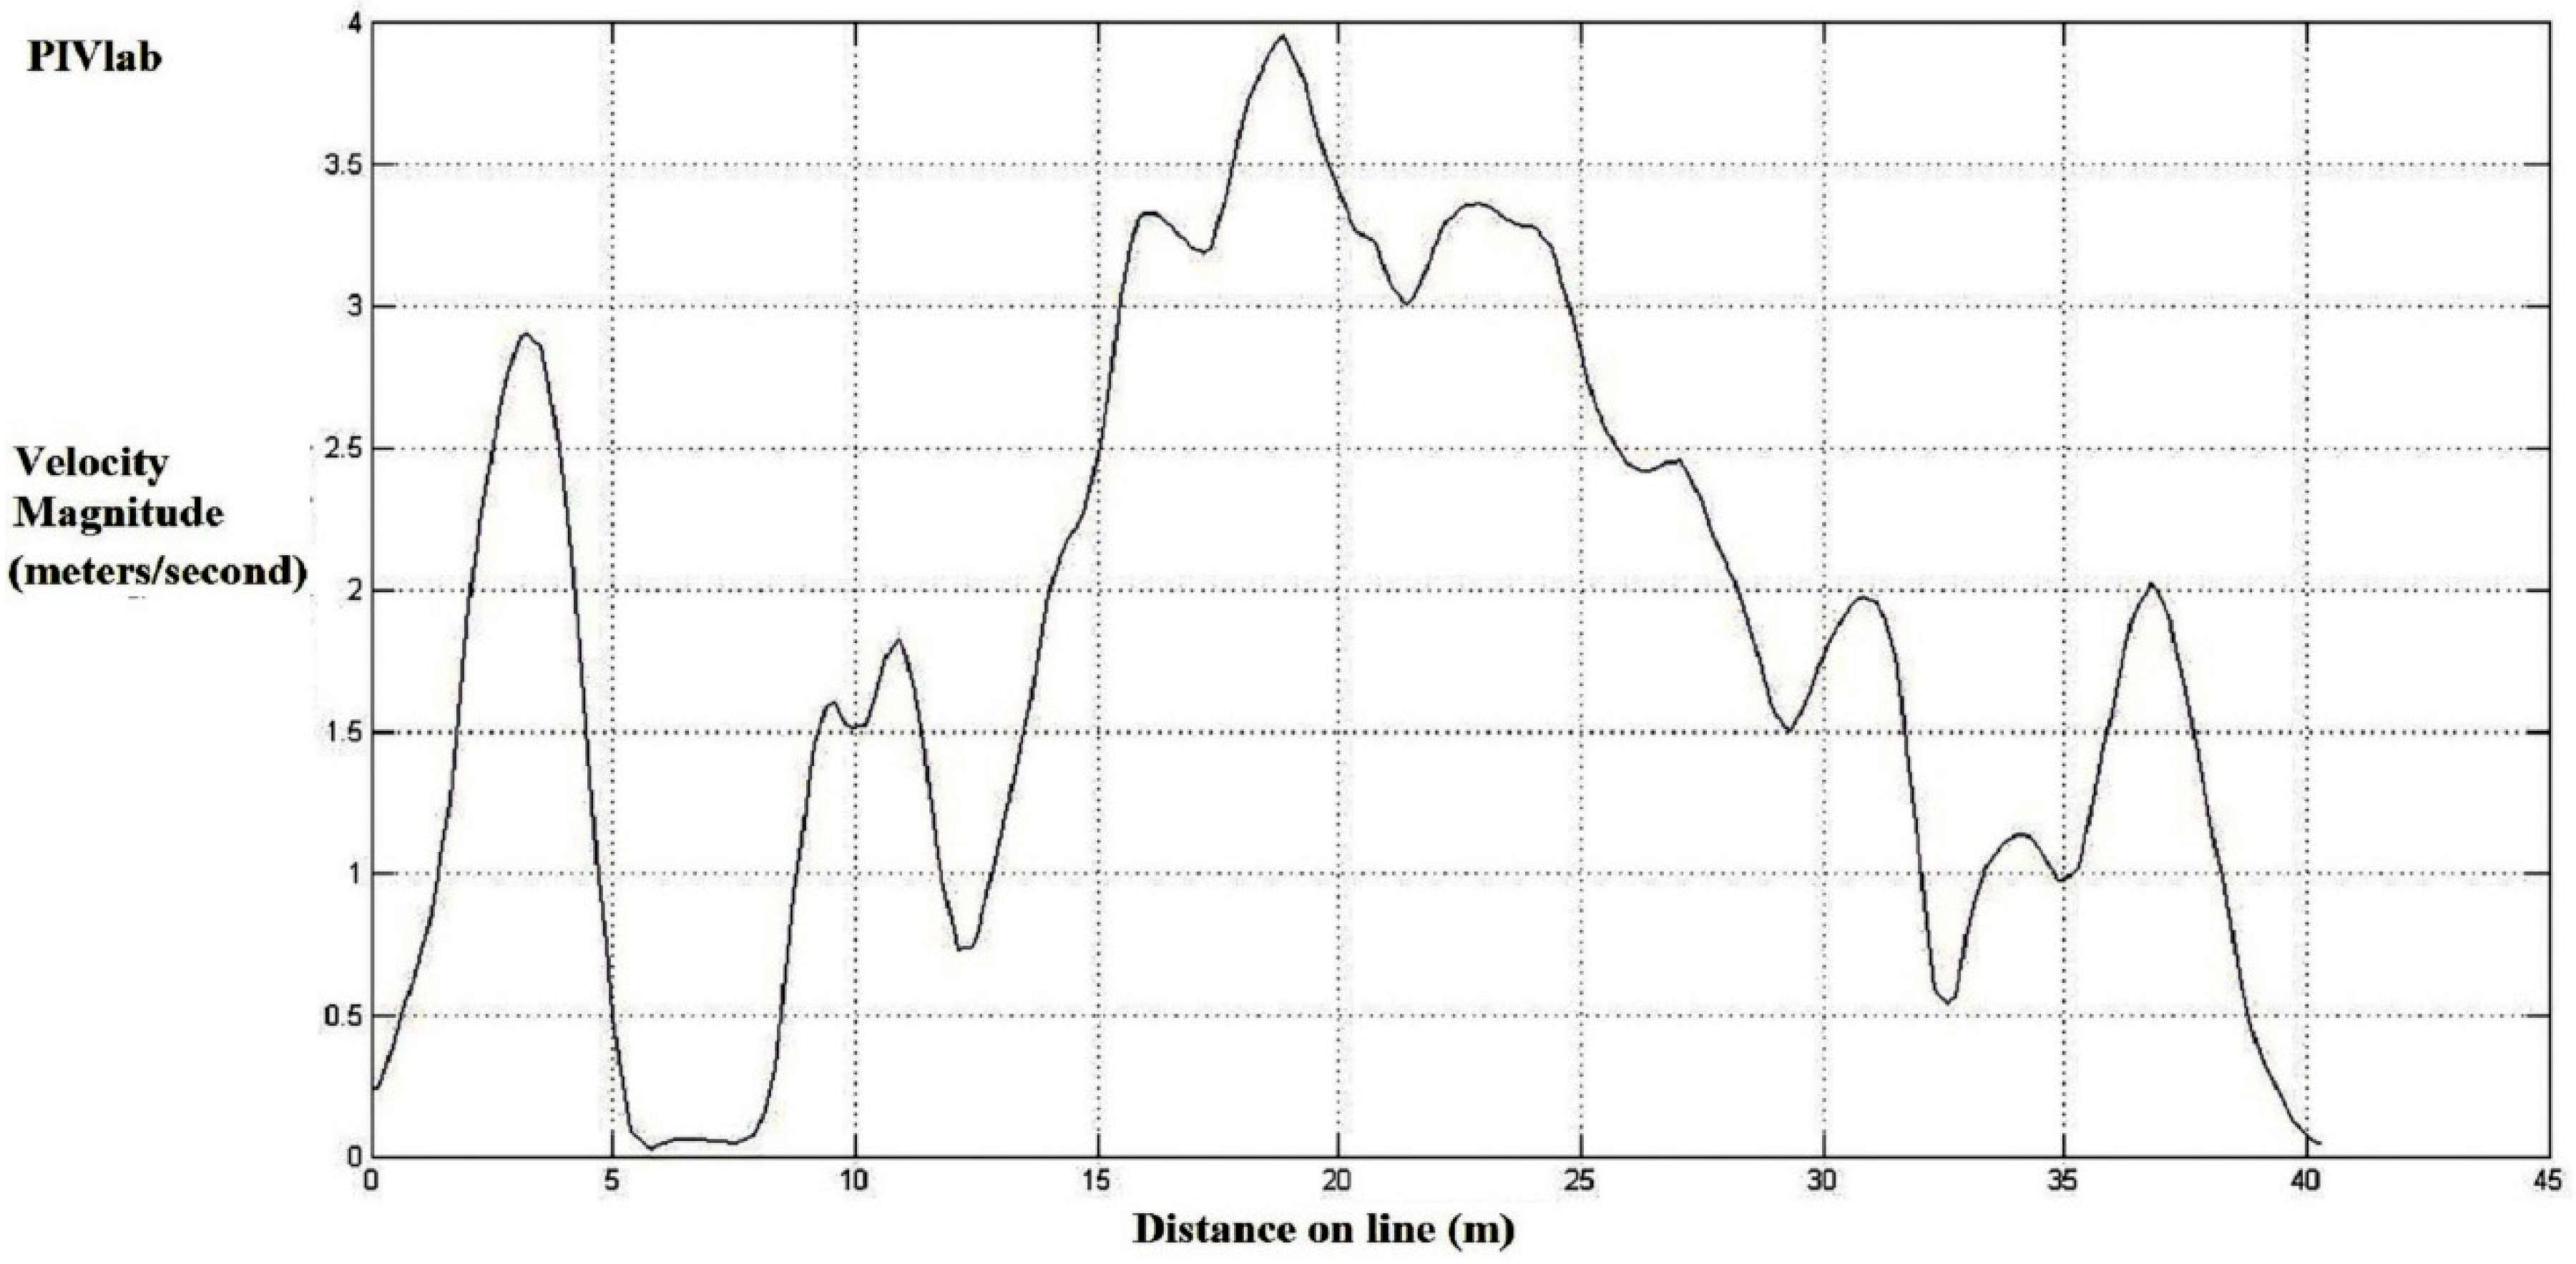
Figure 6 illustrates the overall mean velocity magnitude of the cross-section results in PIVlab. The colored bar depicts the low (red), medium (white), and high (red) velocity values. The greater velocity is depicted in the central part of the river, due to the low depth and absence of obstacles, while there are also two paths at the left and right sides. The two positions where the velocity is low are because of the existing vegetation and rocks that were also depicted. The part of the river upstream with the constructed barriers is represented as expected, with zero or very low velocity because there were no sufficient turbulence patterns to acquire the velocity field. Figure 7 is the produced graph that displays the velocity magnitude, from the left to the right bank, at this cross-section based on PIVlab. The greater velocity (>2.5 m/s) occurs in the central part of the river between 17 and 23 m from the left side of the bank, due to the non-existence of great obstacles. There are two points where the velocity is close to zero at 5–7 m and 38–40 m from the left side of the bank, because of the existing vegetation and rocks.
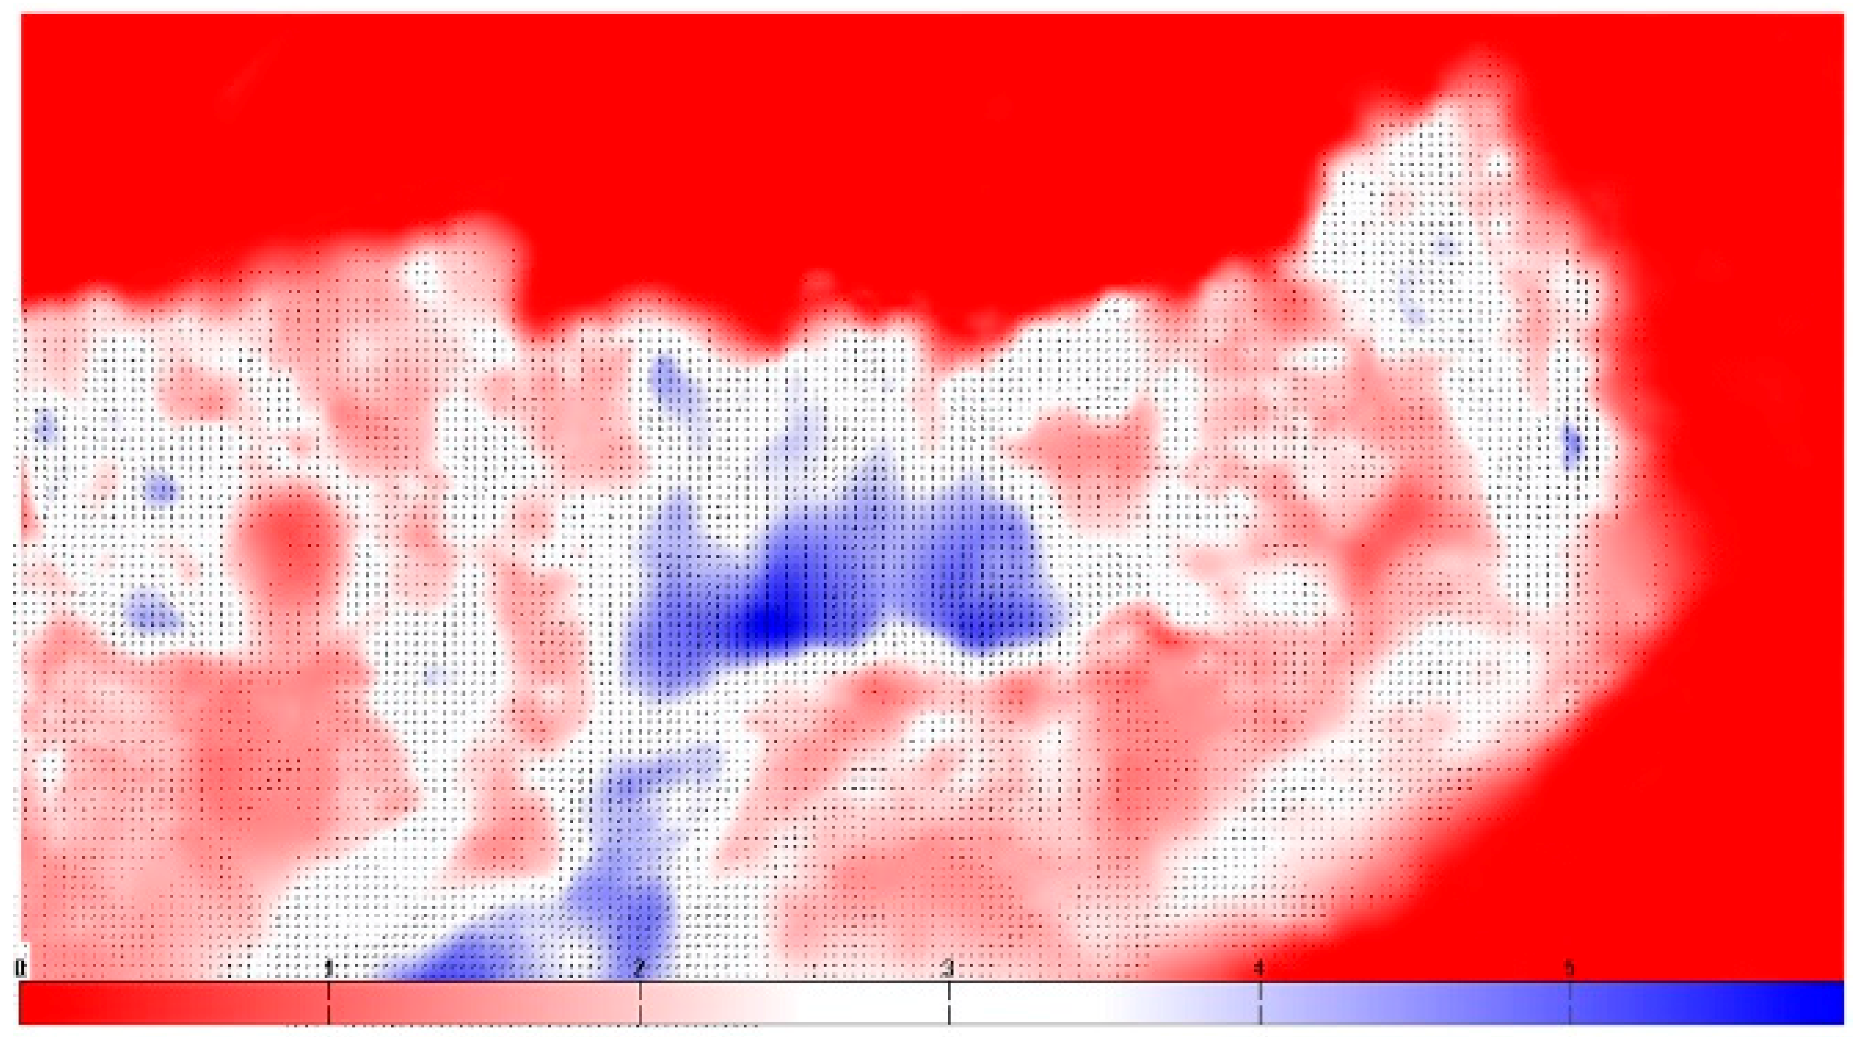
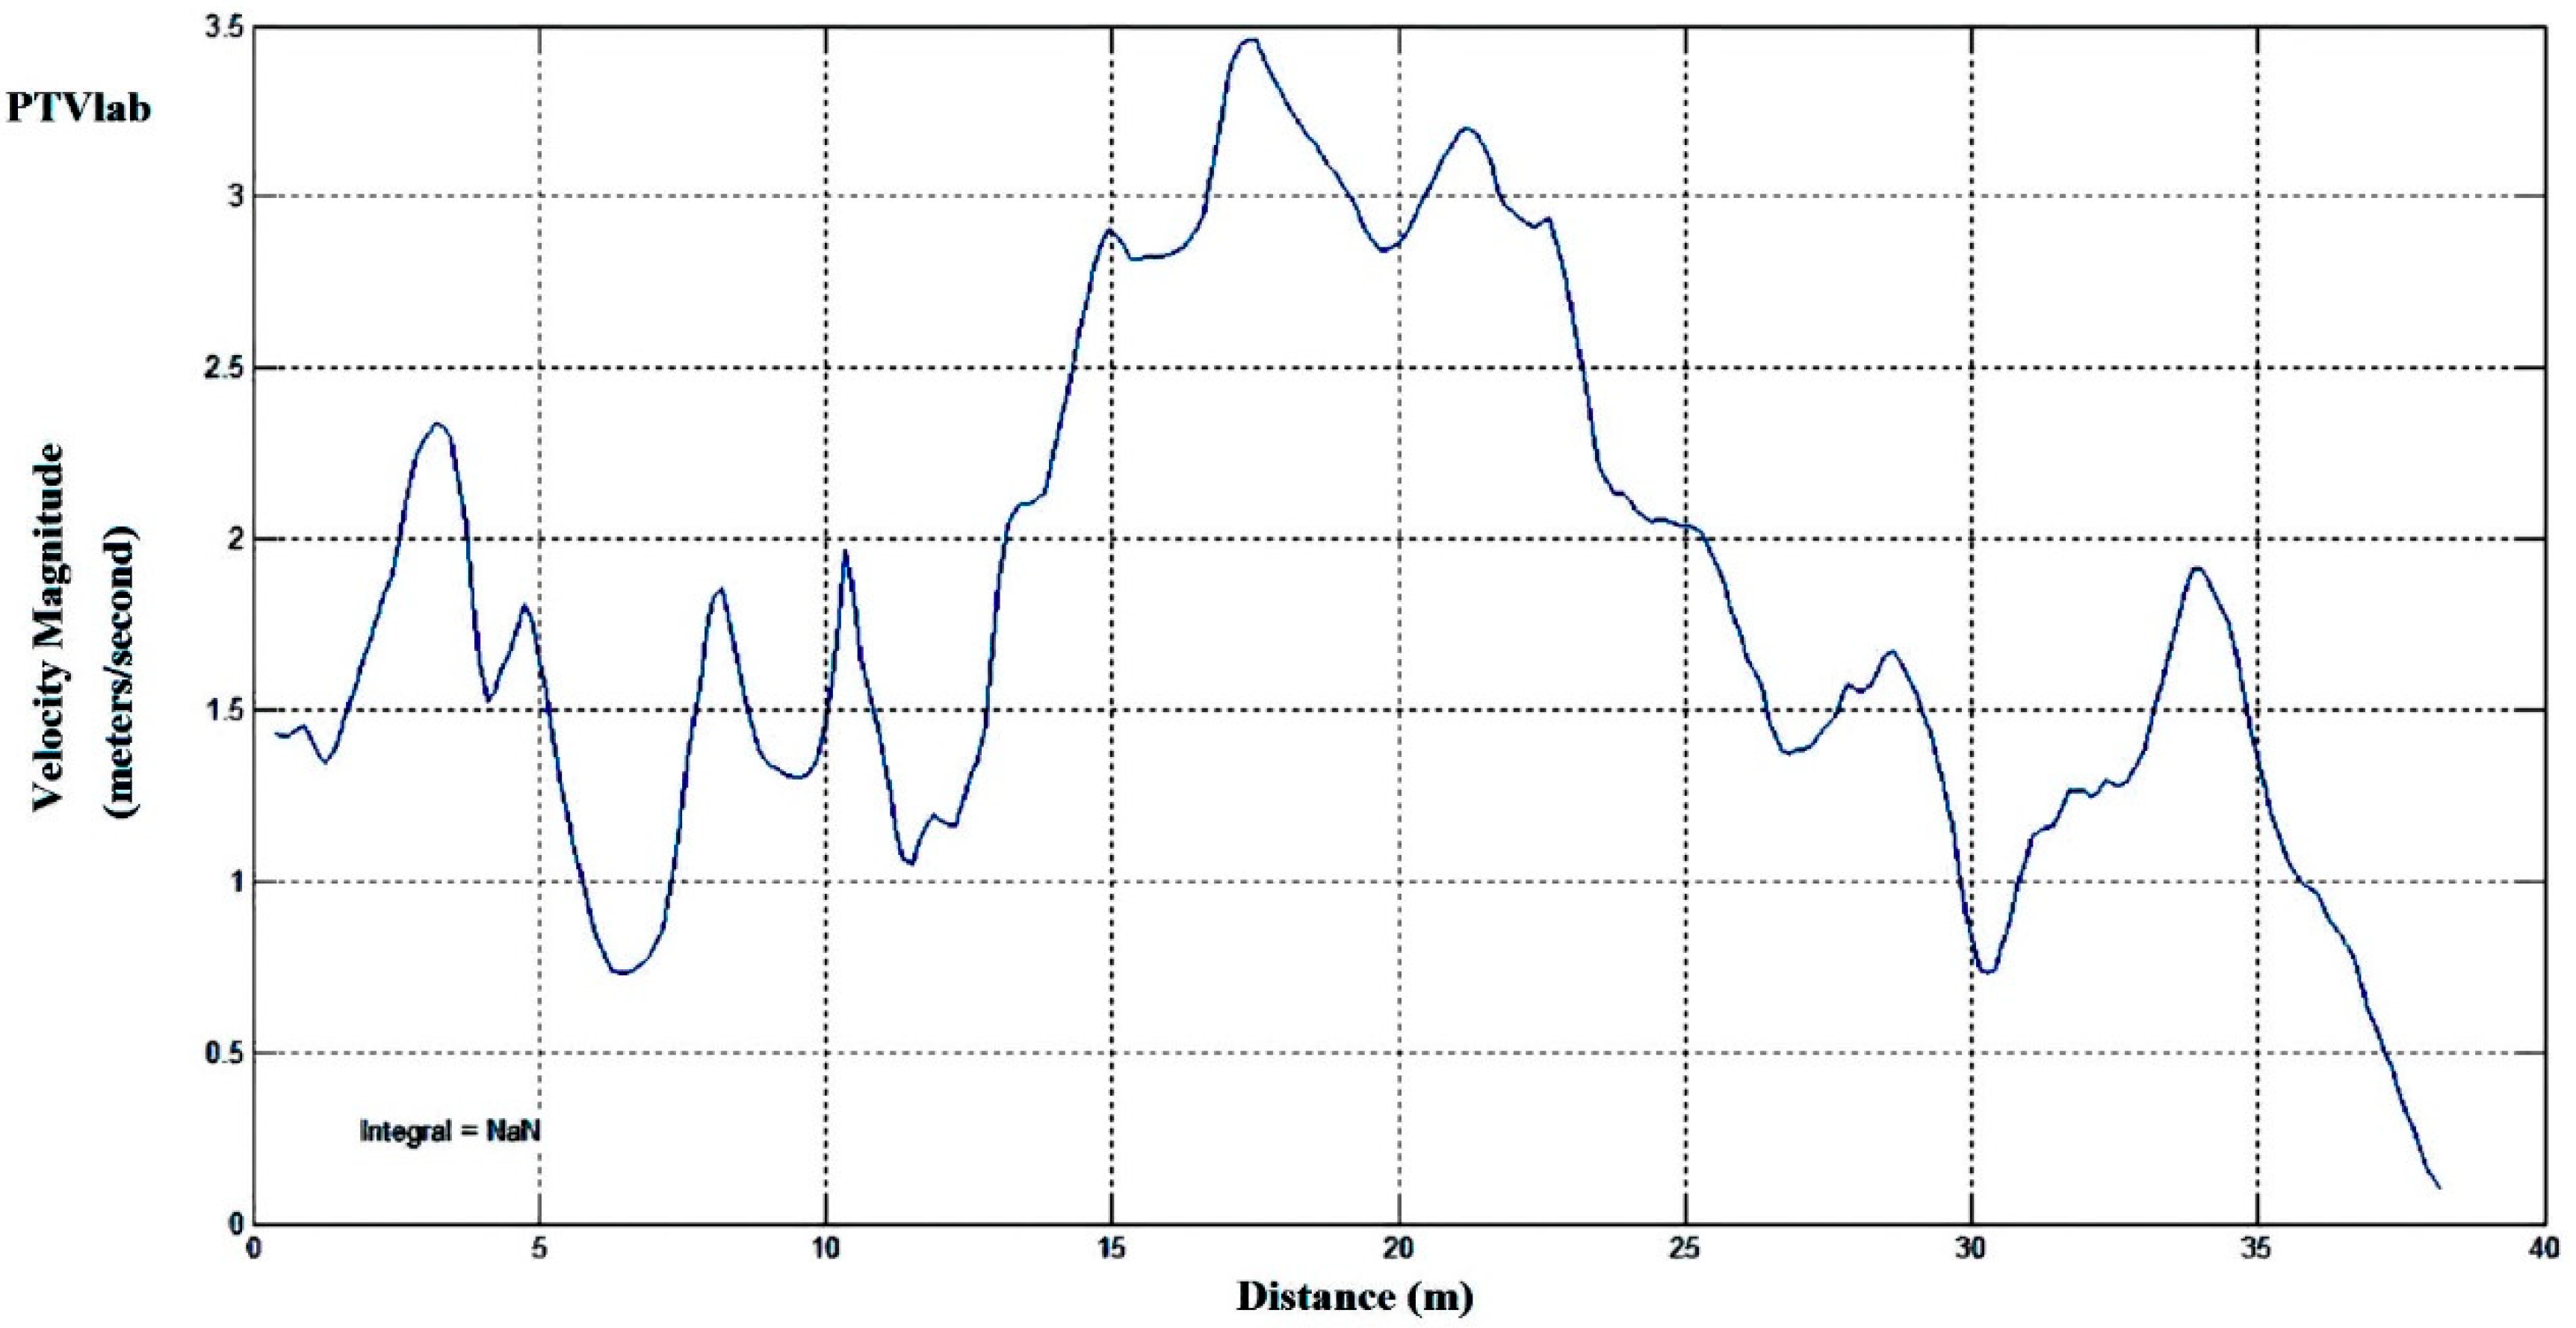
In a similar way, Figure 8 depicts the overall mean velocity magnitude of the section produced by the application of PTVlab. The same colored bar corresponds to the low (red), medium (white) and high (red) velocity values. The greater velocity is depicted in the central part of the river due to the low depth and absence of obstacles, while there are also two paths at the left and right sides. The two positions where the velocity is low because of the existing vegetation and rocks are also depicted. The part of the river upstream with the constructed barriers is represented as expected, with zero or very low velocity because there were no sufficient turbulence patterns to acquire the velocity field. PTVlab also provides graphs, and Figure 9 is the produced graph that displays the velocity magnitude, from the left to the right bank, at this cross-section. The graph is almost identical to the one produced in PIVlab, and its velocities range from 0.12 to 3.44 m/s. There were minor differences, e.g., at 7 m where the velocity is 0.7 m/s (PTV) instead of 0 m/s (PIV), or at 10 m where the velocity is 2 m/s instead of 1.5 m/s (PIV).
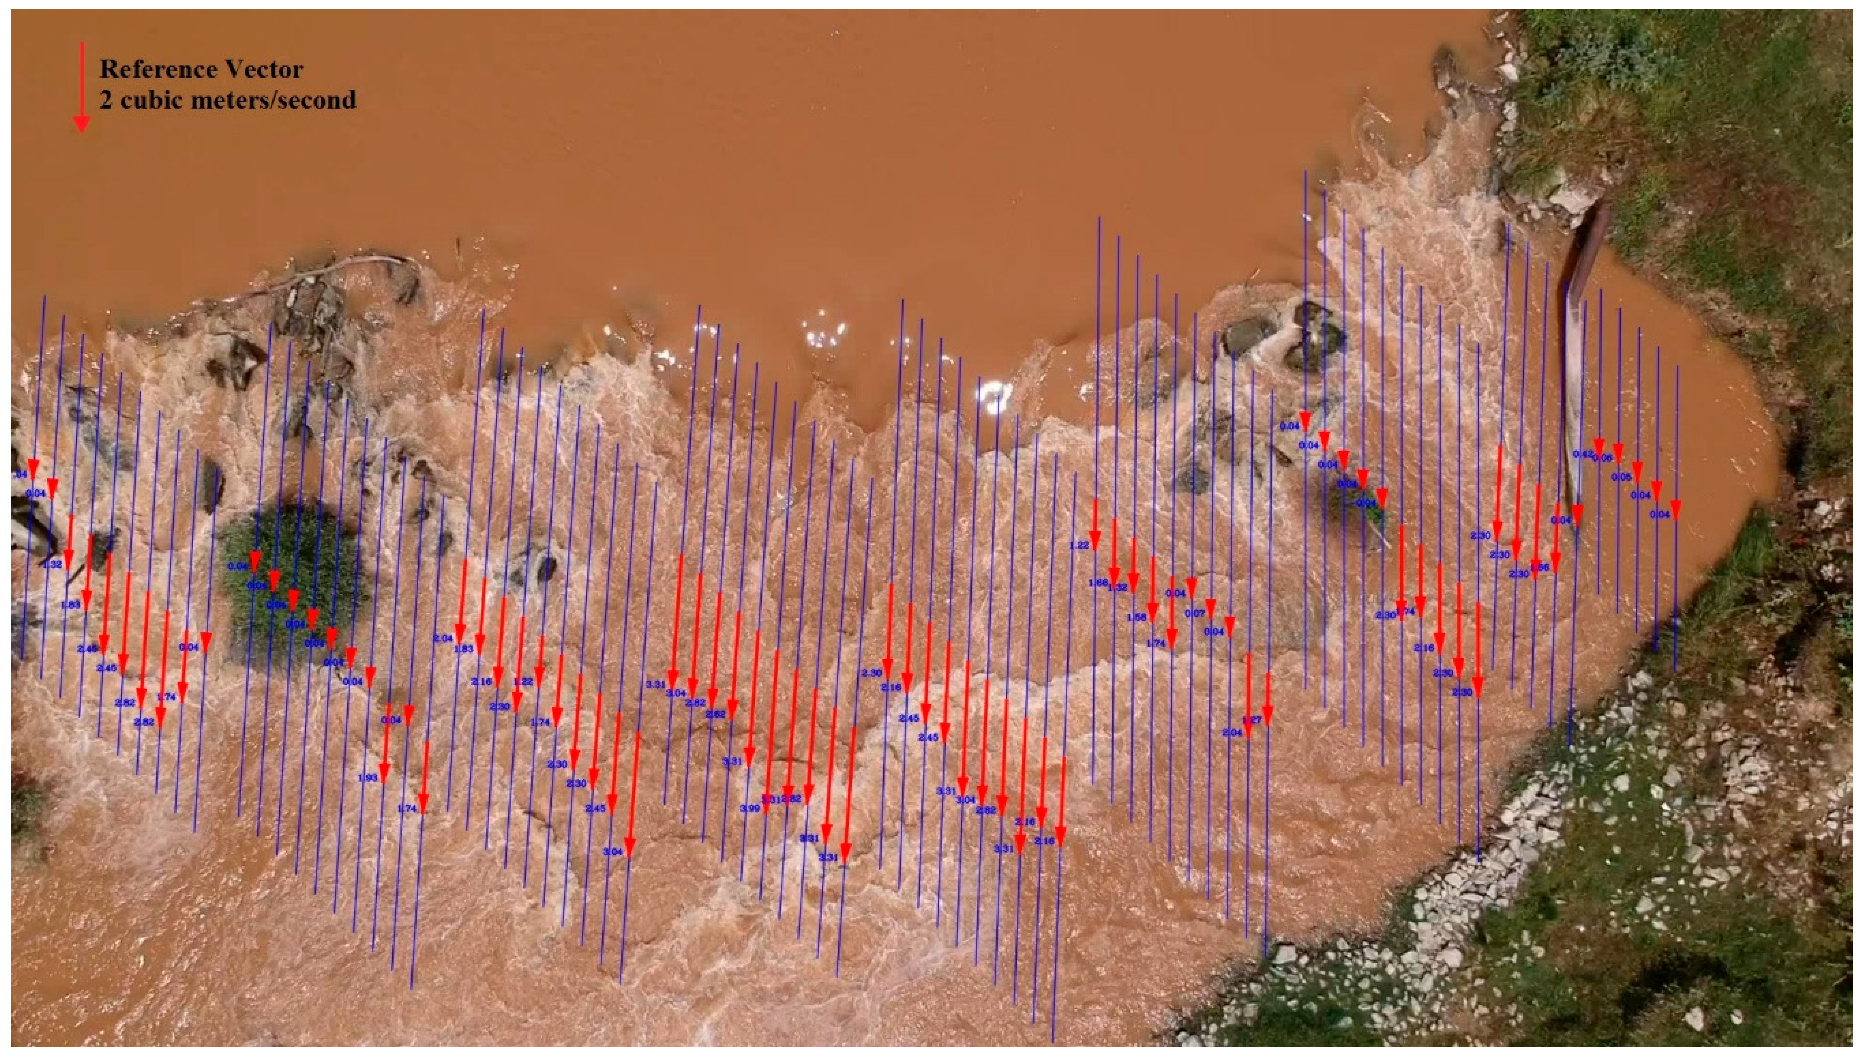
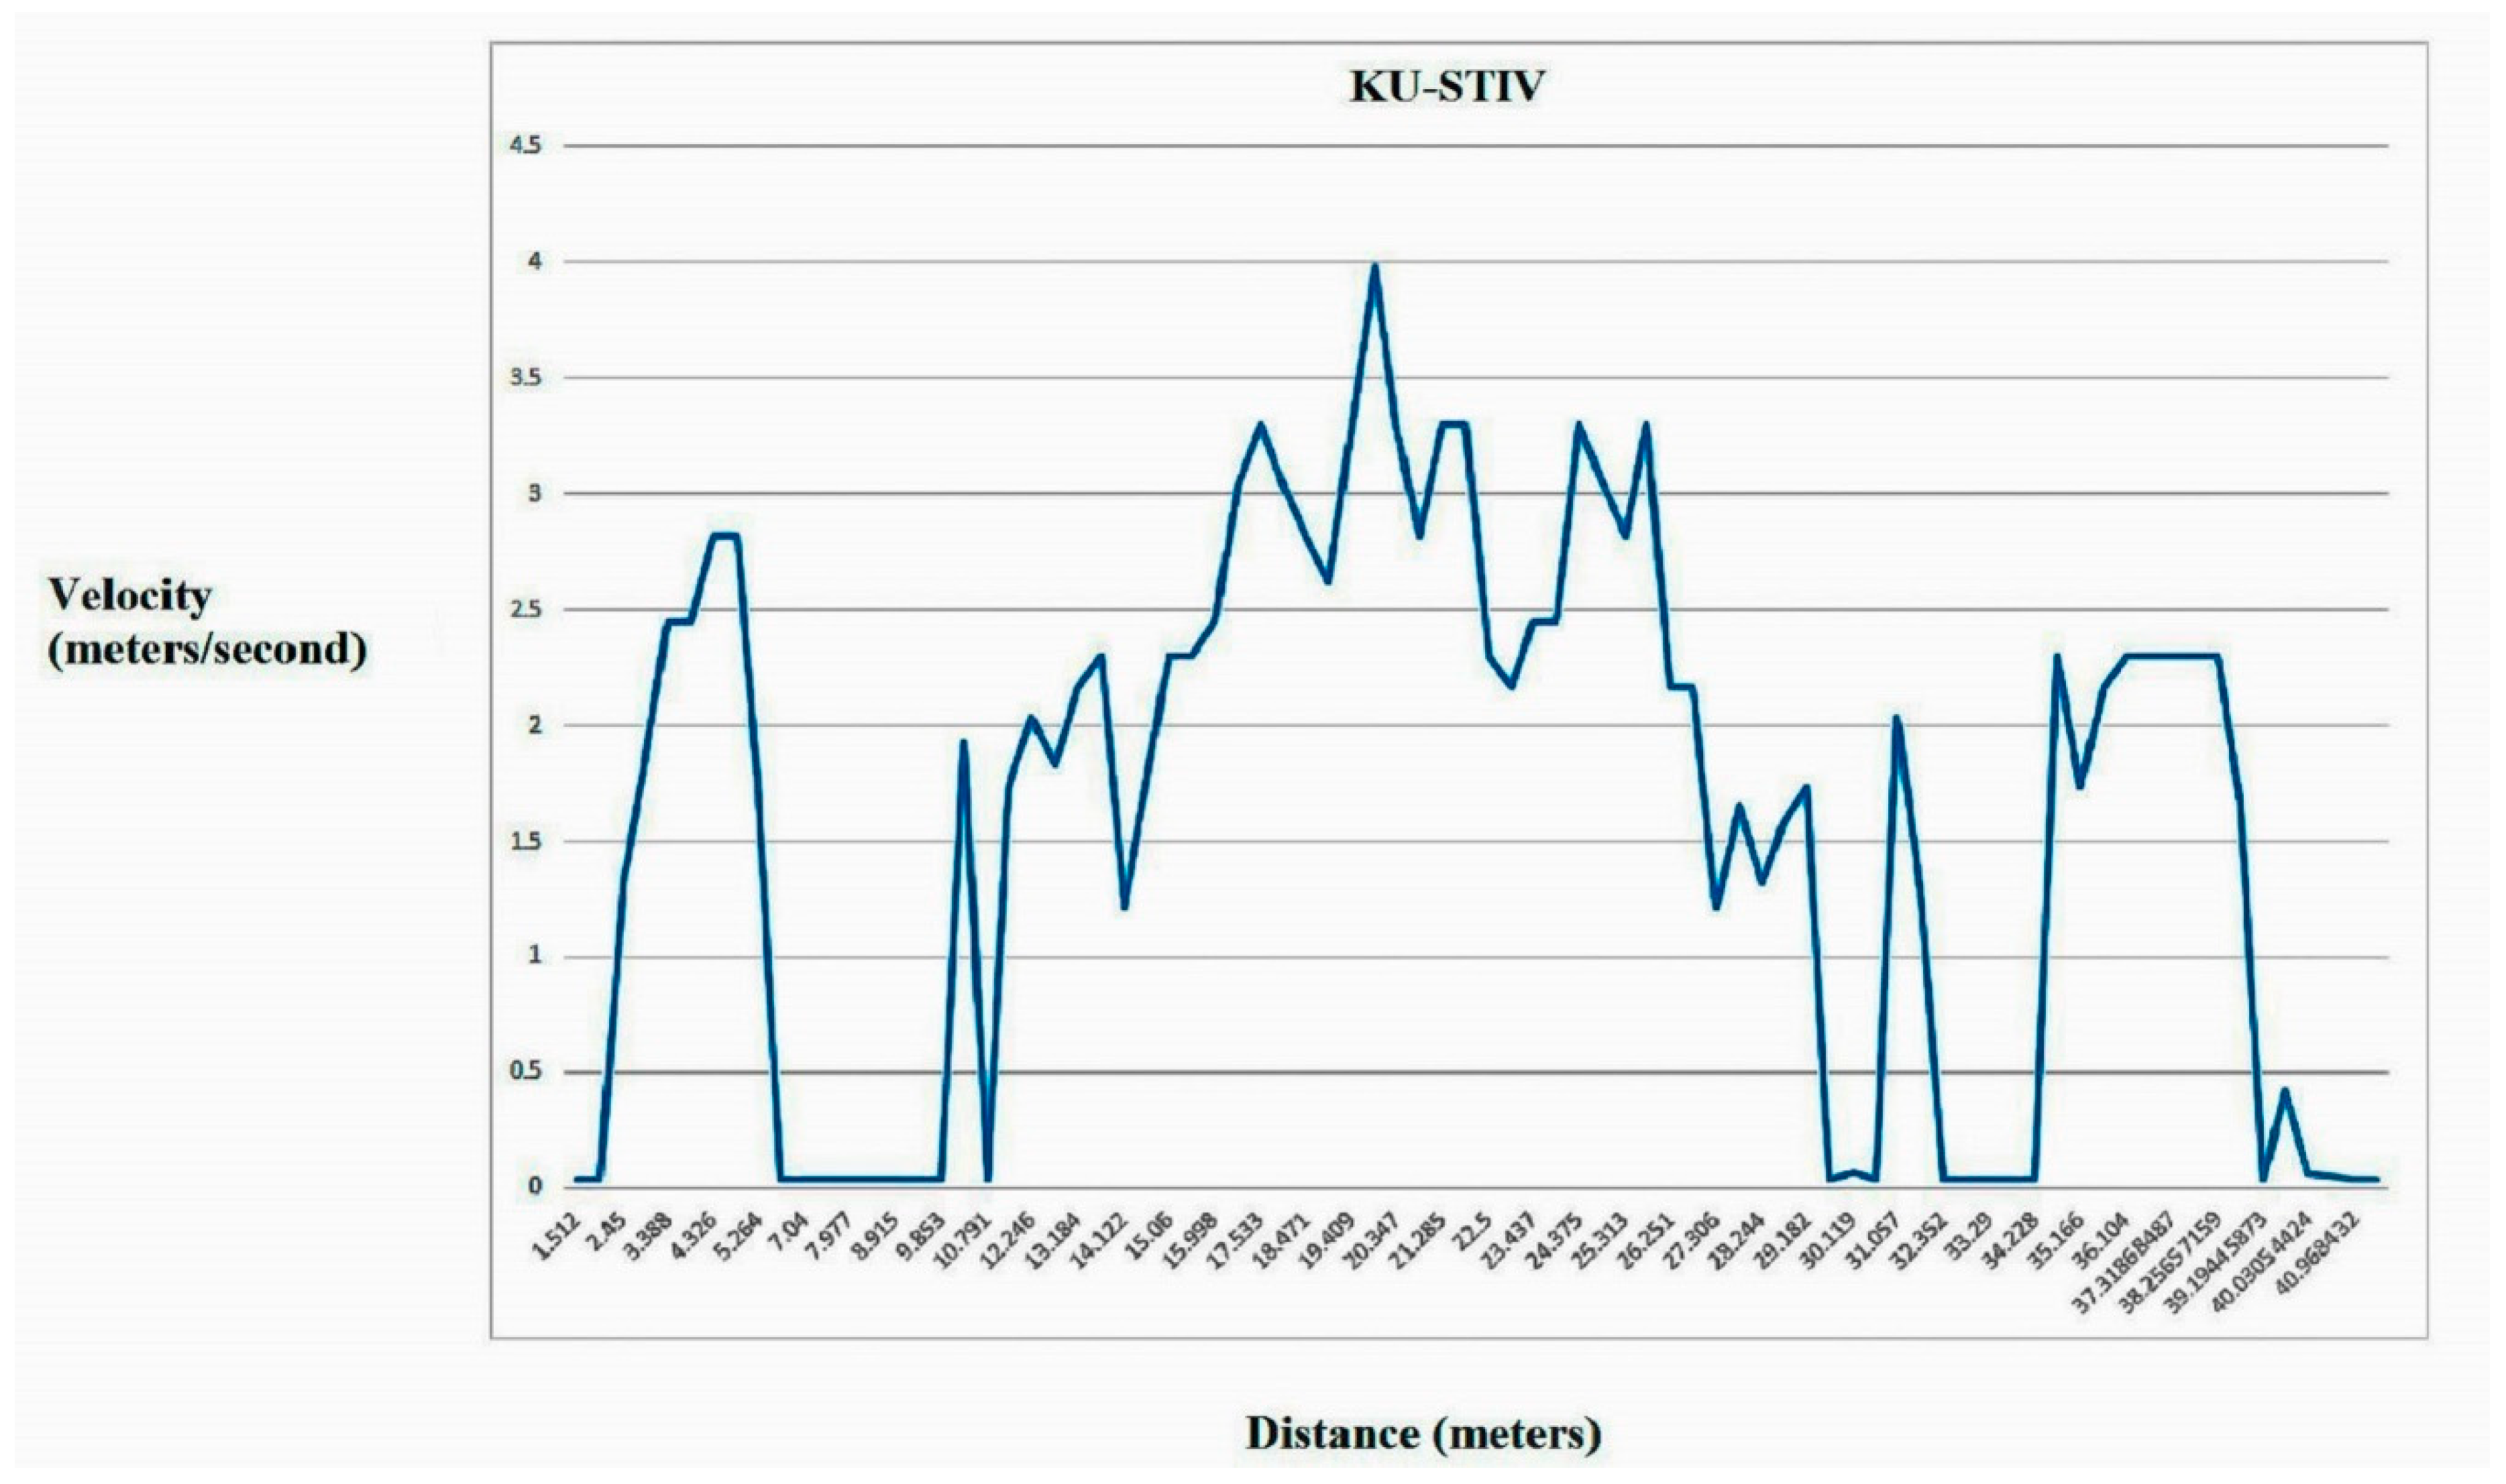
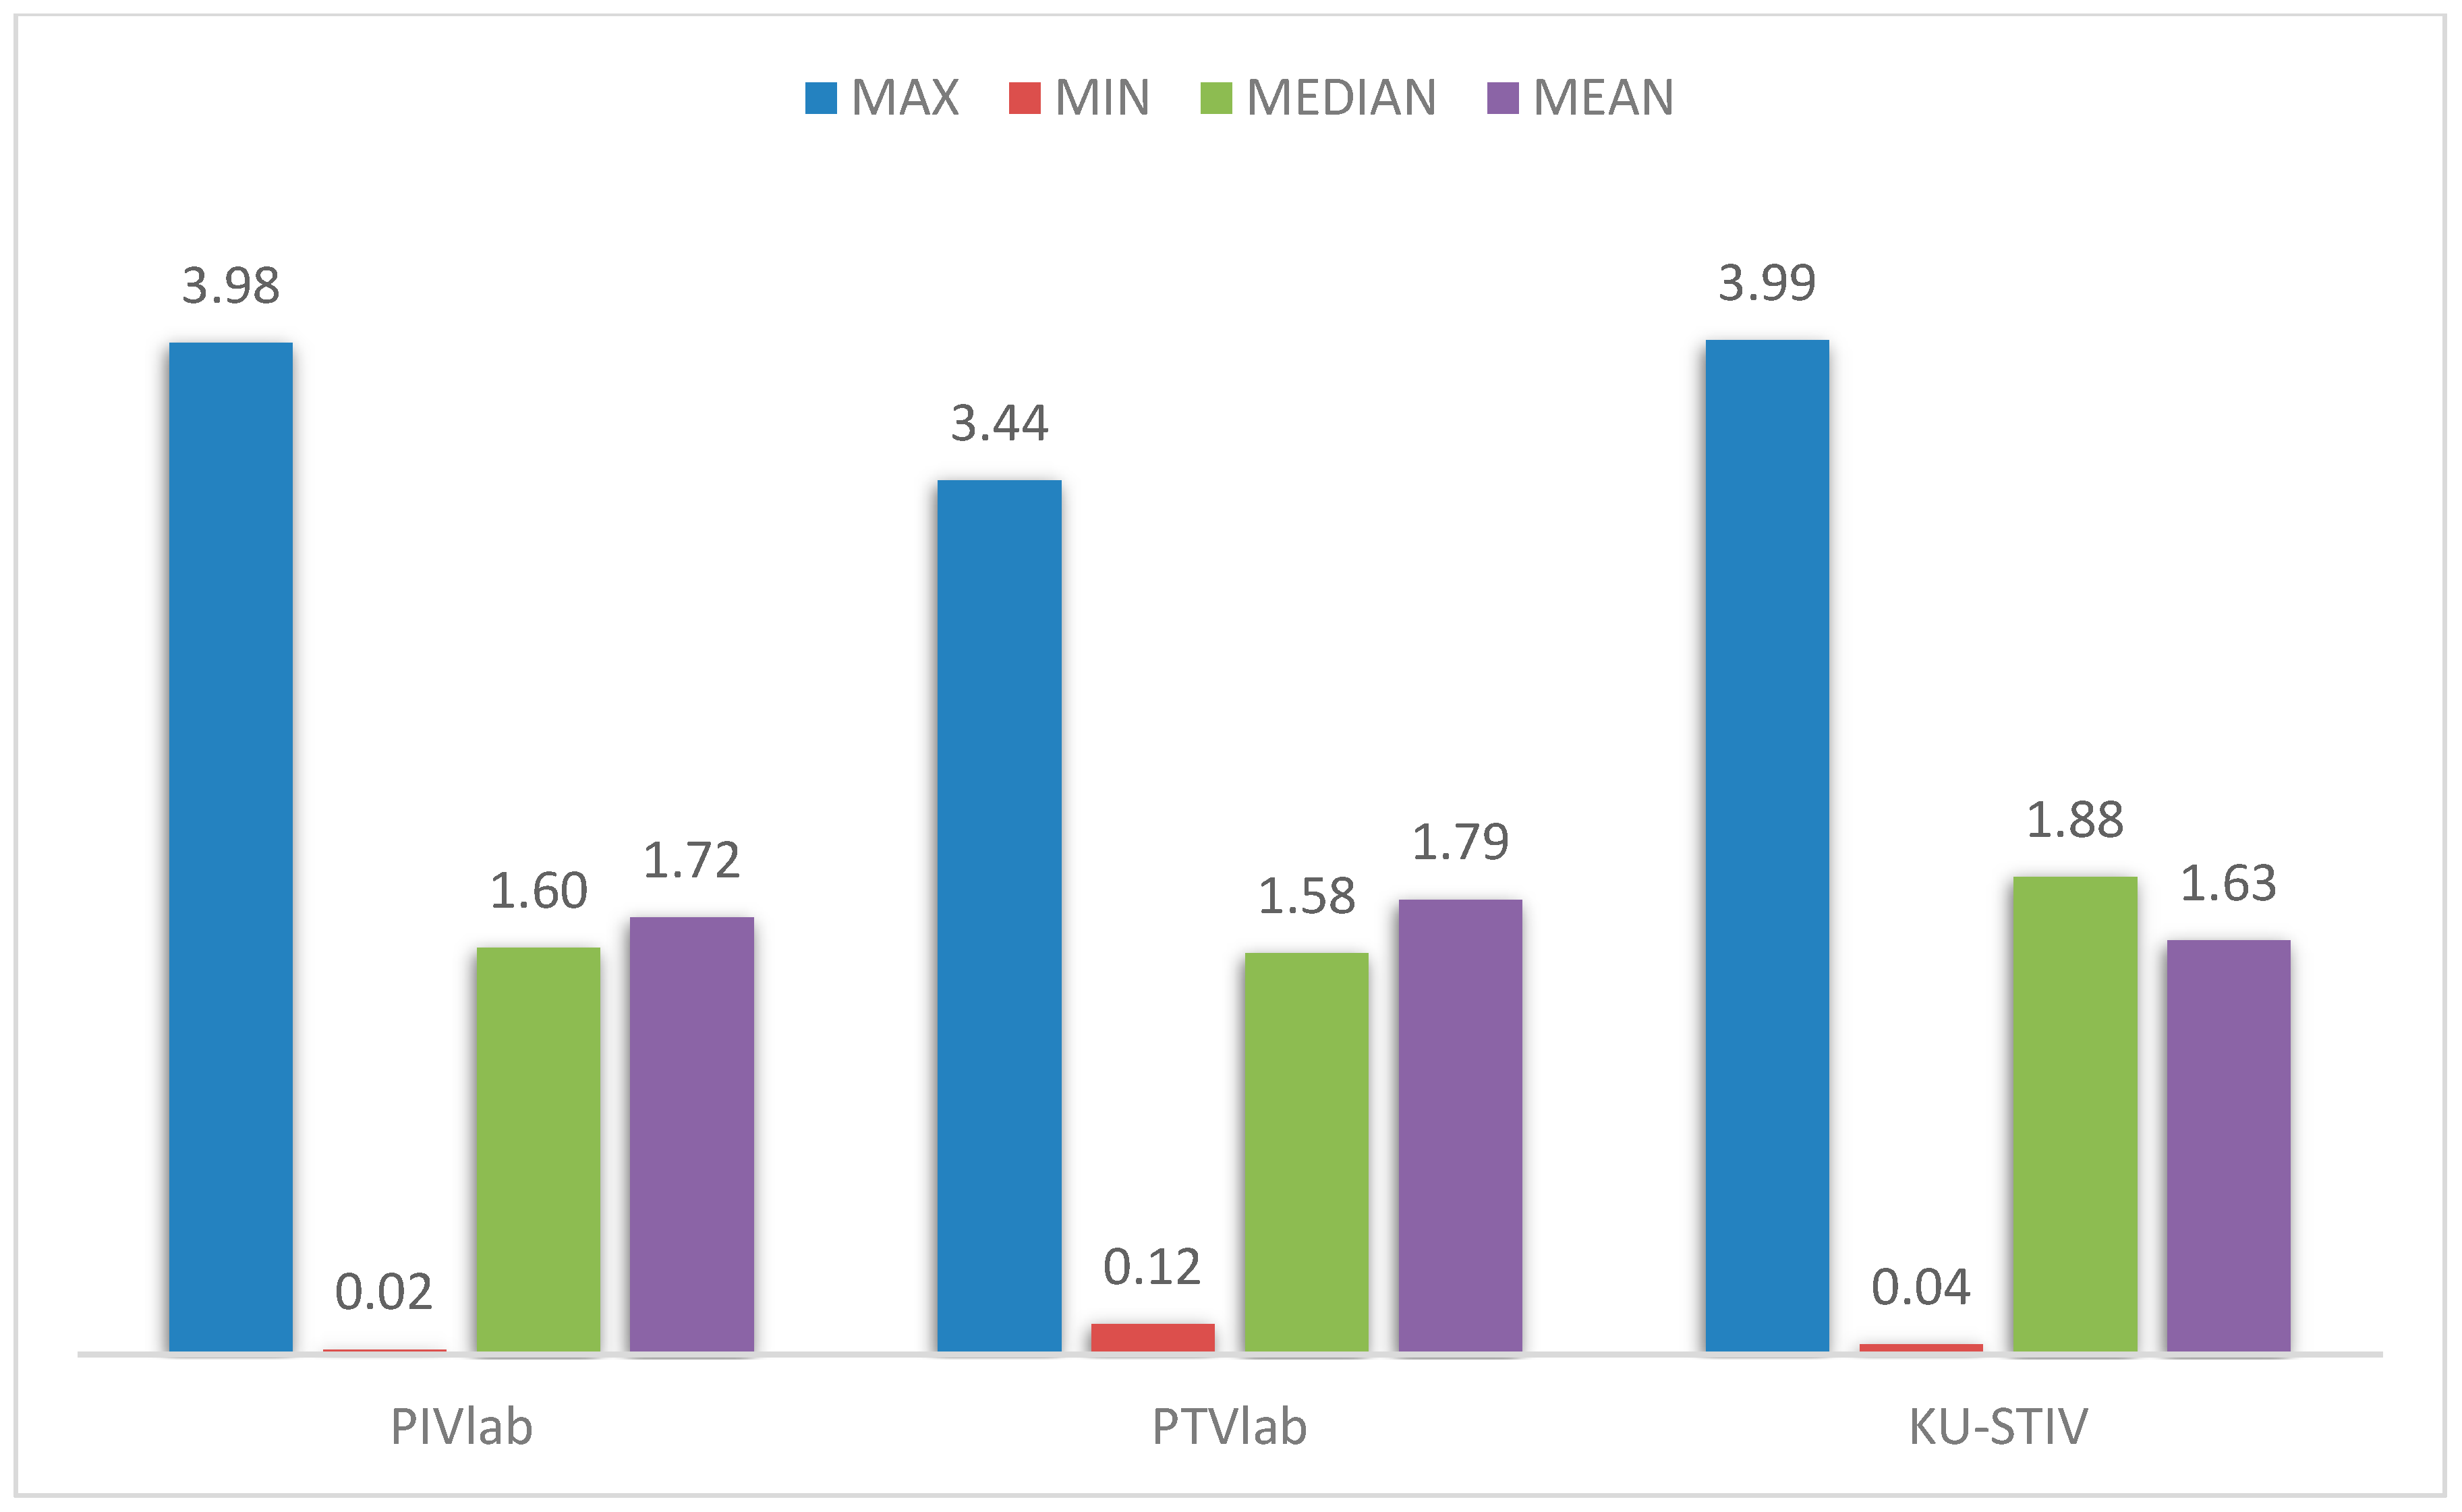
The KU-STIV software was also applied, and the produced results can be seen in Figure 10. The software cannot represent the same field as PIVlab and PTVlab. It estimates the velocity vectors only in defined lines parallel to the water flow. For this reason, the results are not depicted in a colored scale bar, while the vectors (red arrows) follow the direction of the defined parallel lines to the water flow. KU-STIV can also extract the velocity magnitude over a defined cross-section, as represented in Figure 11, that is also very similar to the other two produced graphs. In addition, a bar chart (Figure 12) was produced to depict the maximum, minimum, median, and mean values of the surface velocity at the specific cross-section for the three software used in this study. The velocity ranges are 0.02–3.98 m3/s for PIVlab, 0.12–3.44 m3/s for PTVlab, and 0.04–3.99 m3/s for KU-STIV software. The median values are similar for PIVlab and PTVlab (~1.6 m3/s) while greater for KU-STIV software (1.88 m3/s). On the other hand, the mean value from the KU-STIV is lower (1.63 m3/s) than the other two software that have close values (1.72 m3/s for PIVlab and 1.79 m3/s for PTVlab).

4. Discussion

Different studies have compared different software of the same method [60] or different software with other methods to measure stream velocity [58,61]. To our knowledge, this is the first time that these three software/methods have been compared to each other using the same dataset. All three methods produced similar results, as depicted in previous figures (4 to 12). There were minor changes over specific locations (e.g., 7 to 10 m, and 30 to 34 m) of the reach where the velocity had different values, but the overall trend was almost identical in most measuring locations. In particular, the similarity between the LSPIV and LSPTV analysis was very high because of the high visible natural patterns (surface ripples). The peaks can be observed at the same locations for all three methods. The PTVlab analysis produced lower values at the peaks. As expected, surface velocity was higher (maximum velocity was equal to 3.98 m/s for PIVlab, 3.44 m/s for PTVlab, and 3.99 m/s for KU-STIV) in the center of the river, and decreased near the river banks due to greater friction [62]. Water velocity was estimated only in the parts where visible surface ripples existed. There is a part over the constructed barrier where there were no visible moving particles, and it was not possible to estimate the surface water velocity. Both the PIVlab and the PTVlab are free software, downloadable from the internet and user-friendly, as they have a GUI, but they require MATLAB in order to use them and each needs a different version of MATLAB.
The STIV method produced similar results (as depicted in Figure 10 and Figure 11), but only for selected locations of the stream reach where the parallel lines to the water flow were defined. The differences with the other two methods were because of the methodology and algorithms that STIV uses. While it cannot produce the entire velocity field, this method has the advantage in that it provides the velocity magnitude very quickly in contrast to the other two software/methods. For this reason, it is an important and powerful tool (both as a method and software). Another advantage is that the KU-STIV software is a stand-alone software, user-friendly but with the disadvantage that it requires a license from its developers. Finally, another advantage is that it incorporates the orthorectification for images when the images have an oblique angle view to the water surface.
The results indicated that a low-cost UAV system can be applied easily and effectively, in order to capture a video or a sequence of frames over rivers or flowing water bodies. The use of a multi-copter provides the ability to capture images by using the camera vertically downward. This allows the images to be captured without any angles, that allow the orthorectification process to be avoided [63]. All studied methods have been approved by the scientific community and provide satisfactory performance and results, as they have been tested coupling other verification methods, such as data from gauged stations or acoustic Doppler devices [64,65,66]. In addition, these image-based methods are very useful tools when the studied area is not very easily accessible for field measurements. They can be used as a remote tool without any physical presence if there are no limitations concerning the flying UAV zones and the drone is able to fly remotely over long distances, or if there is a network of cameras that can record the images automatically [67,68]. This is highly advantageous especially when extreme conditions of high discharges or even flood events occur, and it is dangerous for humans to record the velocity and the discharge by field measurements.
Although the image-based methods for stream velocity have been introduced several years ago, there are still limitations to overcome in order to become a worldwide monitoring system [69]. One of the image-based method limitations is to acquire the correct water level or bathymetry measurements. This limitation could be eliminated in urban environments, especially during flood events, as the water level can be measured by using the known height of random objects [70]. In addition, a UAV can provide water level measurements, especially in constructed canals and dams where the depth is known, and this enables us to measure, also, the water discharge if appropriate ground reference points are available [71]. Another limitation is that the surface velocity errors are affected by wind and rain drops, so the measurements are difficult in such weather conditions [72]. The light limitation during nights can be eliminated by using a thermal camera or a far-infrared camera to provide monitoring all time [73,74]. Overall, the main advantages of the imaged-based methods, compared to other traditional methods, are the safety of the recorder, that they are not intrusive to the water body, and they do not require water contact by either the tools or humans.
UAVs have been utilized for the image-based analysis of water velocity by various researchers [31,38,41,42,43]. This was the first time these different image-based methods were applied in Greece, and the first time DJI Spark was used for such applications worldwide. The specific reach studied provided the necessary natural surface patterns for image analysis (surface ripples), but further measurements will be conducted in different reaches in future where there are no natural surface patterns. Various vegetation debris, such as tree branches and leaves, will be examined as surface flowing particles, to enable us to apply these image-based methods [75]. These measurements will be obtained by coupling current flow meter measurements for the entire width of the river, in order to evaluate the results of the image-based methods. In addition, bathymetry measurements will be done along the entire width of the river in order to estimate, accurately, the stream discharge.

5. Conclusions

This study was the first application utilizing a small-cost UAV system (DJI Spark) in order to capture stable video images over a specific natural river reach of Aggitis River in Greece. The continuous frames captured by the UAV were analyzed by using three different software: (a) PIVlab, (b) PTVlab, and (c) KU-STIV, representative of three different image-based methods (LSPIV, LSPTV, and STIV, respectively). According to our knowledge, this is the first time such image-based methods were utilized in a Greek environment for river velocity measurements. In addition, it is the first time that the specific low-cost UAV was used worldwide. There are no studies available online that compare the results of all these three software. The results among the three software depicted, overall, a similar trend. However, more tests are needed to confirm and validate these results, as there were points where the velocity had a different value among the three software. In addition, the results must be verified by using a streamflow current meter as it was not possible to make physical measurements in the entire stream width during the time that the video was recorded by the UAV. Further measurements, combining the image-based methods and a streamflow current meter, will be conducted along the same, but also other, cross-sections of Aggitis River. This will allow for studying the surface velocity in different reaches and testing of different natural vegetation debris (e.g., leaves, branches, etc.) apart from the natural water patterns (surface ripples).

Author Contributions

Conceptualization and Methodology, P.K.; O.T. and G.Z.; Literature Review, P.K. and G.Z.; Field Measurements and Software Application, P.K.; Data Analysis, Visualization and Validation, P.K. and O.T.; Writing—Original Draft Preparation, P.K.; Writing—Review & Editing, O.T. and G.Z.

Funding

This research received no external funding

Acknowledgments

The authors would like to thank Professor Ichiro Fujita who provided the software and the license of KU-STIV software. In addition, we would like to thank Alexandros Koutalakis and Christos Georgakakis who helped during field measurements.

Conflicts of Interest

The authors declare no conflict of interest.

References

  1. Poff, N.L.; Allan, J.D.; Bain, M.B.; Karr, J.R.; Prestegaard, K.L.; Richter, B.D.; Sparks, R.E.; Stromberg, J.C. The natural flow regime. BioScience 1997, 47, 769–784. [Google Scholar] [CrossRef]
  2. Tzoraki, O.; Cooper, D.; Kjeldsen, T.; Nikolaidis, N.P.; Gamvroudis, C.; Froebrich, J.; Querner, E.; Gallart, F.; Karalemas, N. Flood generation and classification of a semi-arid intermittent flow watershed: Evrotas River. Int. J. River Basin Manag. 2013, 11, 77–92. [Google Scholar] [CrossRef]
  3. Svec, J.R.; Kolka, R.K.; Stringer, J.W. Defining perennial, intermittent, and ephemeral channels in eastern Kentucky: Application to forestry best management practices. For. Ecol. Manag. 2005, 214, 170–182. [Google Scholar] [CrossRef]
  4. Zaimes, G.N.; Gounaridis, D.; Iakovoglou, V.; Emmanouloudis, D. Riparian area studies in Greece: A literature review. Fresenius Environ. Bull. 2011, 20, 1470–1477. [Google Scholar] [CrossRef]
  5. Bridge, J.S. Rivers and Floodplains: Forms, Processes, and Sedimentary Record; Blackwell Science: Oxford, UK, 2003; p. 504. ISBN 0-632-06489-7. [Google Scholar]
  6. Dewson, Z.S.; James, A.B.; Death, R.G. A review of the consequences of decreased flow for instream habitat and macroinvertebrates. J. N. Am. Benthol. Soc. 2007, 26, 401–415. [Google Scholar] [CrossRef]
  7. Asselman, N.E.; Middelkoop, H. Floodplain sedimentation: Quantities, patterns and processes. Earth Surf. Process. Landf. 1995, 20, 481–499. [Google Scholar] [CrossRef]
  8. Jones, J.A.; Swanson, F.J.; Wemple, B.C.; Snyder, K.U. Effects of roads on hydrology, geomorphology, and disturbance patches in stream networks. Conserv. Boil. 2000, 14, 76–85. [Google Scholar] [CrossRef]
  9. Kreibich, H.; Piroth, K.; Seifert, I.; Maiwald, H.; Kunert, U.; Schwarz, J.; Merz, B.; Thieken, A.H. Is flow velocity a significant parameter in flood damage modelling? Nat. Hazards Earth Syst. Sci. 2009, 9, 1679–1692. [Google Scholar] [CrossRef] [Green Version]
  10. Postel, S.L.; Daily, G.C.; Ehrlich, P.R. Human appropriation of renewable fresh water. Science 1996, 271, 785–788. [Google Scholar] [CrossRef]
  11. Kallis, G.; Butler, D. The EU water framework directive: Measures and implications. Water Policy 2001, 3, 125–142. [Google Scholar] [CrossRef]
  12. Fekete, B.M.; Vörösmarty, C.J. The current status of global river discharge monitoring and potential new technologies complementing traditional discharge measurements. In Proceedings of the Predictions in Ungauged Basins, Brasilia, Brazil, 20–22 November 2002; IAHS Publ.: Wallingford, UK, 2007; Volume 309, pp. 129–169. [Google Scholar]
  13. Tzoraki, O.; Nikolaidis, P.N. A generalized framework for modeling the hydrologic and biochemical response of a Mediterranean temporary river basin. J. Hydrol. 2007, 346, 112–121. [Google Scholar] [CrossRef]
  14. Zaimes, G.N.; Emmanouloudis, D. Sustainable Management of the Freshwater Resources of Greece. J. Eng. Sci. Technol. Rev. 2012, 5, 77–82. [Google Scholar] [CrossRef]
  15. Costa, J.E.; Spicer, K.R.; Cheng, R.T.; Haeni, F.P.; Melcher, N.B.; Thurman, E.M.; Plant, W.J.; Keller, W.C. Measuring stream discharge by non-contact methods: A proof-of-concept experiment. Geophys. Res. Lett. 2000, 27, 553–556. [Google Scholar] [CrossRef]
  16. Ardıçlıoğlu, M.; Selenica, A.; Özdin, S.; Kuriqi, A.; Genç, O. Investigation of Average Shear Stress in Natural Stream. In Proceedings of the International Balkans Conference on Challenges of Civil Engineering (BCCCE), EPOKA University, Tirana, Albania, 19–21 May 2011. [Google Scholar]
  17. Kuriqi, A.; Ardiçlioǧlu, M. Investigation of hydraulic regime at middle part of the Loire River in context of floods and low flow events. Pollack Period. 2018, 13, 145–156. [Google Scholar] [CrossRef]
  18. Hauet, A.; Kruger, A.; Krajewski, W.F.; Bradley, A.; Muste, M.; Creutin, J.D.; Wilson, M. Experimental system for real-time discharge estimation using an image-based method. J. Hydrol. Eng. 2008, 13, 105–110. [Google Scholar] [CrossRef]
  19. Westerweel, J. Fundamentals of digital particle image velocimetry. Meas. Sci. Technol. 1997, 8, 1379. [Google Scholar] [CrossRef]
  20. Adrian, R.J. Twenty years of particle image velocimetry. Exp. Fluids 2005, 39, 159–169. [Google Scholar] [CrossRef] [Green Version]
  21. Grant, I. Particle image velocimetry: A review. J. Mech. Eng. Sci. 1997, 211, 55–76. [Google Scholar] [CrossRef]
  22. Meinhart, C.D.; Wereley, S.T.; Santiago, J.G. PIV measurements of a microchannel flow. Exp. Fluids 1999, 27, 414–419. [Google Scholar] [CrossRef]
  23. Nezu, I.; Sanjou, M. PIV and PTV measurements in hydro-sciences with focus on turbulent open-channel flows. J. Hydro-Environ. Res. 2011, 5, 215–230. [Google Scholar] [CrossRef] [Green Version]
  24. Di Cristo, C. Particle Imaging Velocimetry and its applications in hydraulics: A state-of-the-art review. In Experimental Methods in Hydraulic Research; Rowiński, P., Ed.; Springer: Berlin/Heidelberg, Germany, 2011; pp. 49–66. ISBN 978-3-642-17475-9. [Google Scholar]
  25. Sokoray-Varga, B.; Józsa, J. Particle tracking velocimetry (PTV) and its application to analyse free surface flows in laboratory scale models. Period. Polytech. Civ. Eng. 2008, 52, 63–71. [Google Scholar] [CrossRef]
  26. Fujita, I.; Kunita, Y. Application of aerial LSPIV to the 2002 flood of the Yodo River using a helicopter mounted high density video camera. J. Hydro-Environ. Res. 2011, 5, 323–331. [Google Scholar] [CrossRef]
  27. Muste, M.; Hauet, A.; Fujita, I.; Legout, C.; Ho, H.C. Capabilities of large-scale particle image velocimetry to characterize shallow free-surface flows. Adv. Water Resour. 2014, 70, 160–171. [Google Scholar] [CrossRef]
  28. Kim, Y.; Muste, M.; Hauet, A.; Krajewski, W.F.; Kruger, A.; Bradley, A. Stream discharge using mobile large-scale particle image velocimetry: A proof of concept. Water Resour. Res. 2008, 44. [Google Scholar] [CrossRef] [Green Version]
  29. Dramais, G.; Le Coz, J.; Camenen, B.; Hauet, A. Advantages of a mobile LSPIV method for measuring flood discharges and improving stage–discharge curves. J. Hydro-Environ. Res. 2011, 5, 301–312. [Google Scholar] [CrossRef]
  30. Sun, X.; Shiono, K.; Chandler, J.H.; Rameshwaran, P.; Sellin, R.H.J.; Fujita, I. Discharge estimation in small irregular river using LSPIV. Proc. Inst. Civ. Eng. Water Manag. 2010, 163, 247–254. [Google Scholar] [CrossRef] [Green Version]
  31. Tauro, F.; Petroselli, A.; Arcangeletti, E. Assessment of drone-based surface flow observations. Hydrol. Process. 2016, 30, 1114–1130. [Google Scholar] [CrossRef]
  32. Lloyd, P.M.; Stansby, P.K.; Ball, D.J. Unsteady surface-velocity field measurement using particle tracking velocimetry. J. Hydraul. Res. 1995, 33, 519–534. [Google Scholar] [CrossRef]
  33. Li, D.X.; Zhong, Q.; Yu, M.Z.; Wang, X.K. Large-scale particle tracking velocimetry with multi-channel CCD cameras. Int. J. Sediment Res. 2013, 28, 103–110. [Google Scholar] [CrossRef]
  34. Fujita, I.; Watanabe, H.; Tsubaki, R. Development of a non-intrusive and efficient flow monitoring technique: The space-time image velocimetry (STIV). Int. J. River Basin Manag. 2007, 5, 105–114. [Google Scholar] [CrossRef]
  35. Tsubaki, R. On the Texture Angle Detection Used in Space-Time Image Velocimetry (STIV). Water Resour. Res. 2017, 53, 10908–10914. [Google Scholar] [CrossRef] [Green Version]
  36. Nex, F.; Remondino, F. UAV for 3D mapping applications: A review. Appl. Geomatics 2014, 6. [Google Scholar] [CrossRef]
  37. Pajares, G. Overview and current status of remote sensing applications based on unmanned aerial vehicles (UAVs). Photogramm. Eng. Remote. Sens. 2015, 81, 281–330. [Google Scholar] [CrossRef]
  38. Tauro, F.; Porfiri, M.; Grimaldi, S. Surface flow measurements from drones. J. Hydrol. 2016, 540, 240–245. [Google Scholar] [CrossRef] [Green Version]
  39. Canis, B. Unmanned Aircraft Systems (UAS): Commercial Outlook for a New Industry; Congressional Research Service: Washington, DC, USA, 2015; pp. 7–5700. [Google Scholar]
  40. Cai, G.; Dias, J.; Seneviratne, L. A survey of small-scale unmanned aerial vehicles: Recent advances and future development trends. Unmanned Syst. 2014, 2, 175–199. [Google Scholar] [CrossRef]
  41. Detert, M.; Weitbrecht, V. A low-cost airborne velocimetry system: Proof of concept. J. Hydraul. Res. 2015, 53, 532–539. [Google Scholar] [CrossRef]
  42. Tauro, F.; Pagano, C.; Phamduy, P.; Grimaldi, S.; Porfiri, M. Large-scale particle image velocimetry from an unmanned aerial vehicle. IEEE/ASME Trans. Mechatron. 2015, 20, 3269–3275. [Google Scholar] [CrossRef]
  43. Thumser, P.; Haas, C.; Tuhtan, J.A.; Fuentes-Pérez, J.F.; Toming, G. RAPTOR-UAV: Real-time particle tracking in rivers using an unmanned aerial vehicle. Earth Surf. Process. Landf. 2017, 42, 2439–2446. [Google Scholar] [CrossRef]
  44. Doulgeris, C.; Georgiou, P.; Papadimos, D.; Papamichail, D. Ecosystem approach to water resources management using the MIKE 11 modeling system in the Strymonas River and Lake Kerkini. J. Environ. Manag. 2012, 94, 132–143. [Google Scholar] [CrossRef] [PubMed]
  45. Pennos, C.; Lauritzen, S.E.; Pechlivanidou, S.; Sotiriadis, Y. Geomorphic constrains on the evolution of the Aggitis River Basin Northern Greece (a preliminary report). Bull. Geol. Soc. Greece 2016, 50, 365–373. [Google Scholar] [CrossRef]
  46. Novel, J.P.; Dimadi, A.; Zervopoulou, A.; Bakalowicz, M. The Aggitis karst system, Eastern Macedonia, Greece: Hydrologic functioning and development of the karst structure. J. Hydrol. 2007, 334, 477–492. [Google Scholar] [CrossRef]
  47. Papaioannou, A.; Plageras, P.; Nastos, P.T.; Grigoriadis, D.; Dovriki, E.; Spanos, T.; Koutseris, S.; Paliatsos, A.G. Assessment of soil and groundwater quality and hydrogeological profile of Drama’s Prefecture, North Greece. WSEAS Trans. Environ. Dev. 2006, 2, 1276–1281. [Google Scholar]
  48. Zouros, N. Geodiversity and sustainable development: Geoparks-a new challenge for research and education in earth sciences. Bull. Geol. Soc. Greece 2010, 43, 159–168. [Google Scholar] [CrossRef]
  49. Riegels, N.; Jensen, R.; Bensasson, L.; Banou, S.; Møller, F.; Bauer-Gottwein, P. Estimating resource costs of compliance with EU WFD ecological status requirements at the river basin scale. J. Hydrol. 2011, 396, 197–214. [Google Scholar] [CrossRef]
  50. Jones, T. International Commercial Drone Regulation and Drone Delivery Services; No. RR-1718/3-RC; RAND Corporation: Santa Monica, CA, USA, 2017; p. 47. [Google Scholar]
  51. DJI—The Future of Possible. Available online: https://www.dji.com (accessed on 14 October 2018).
  52. Thielicke, W.; Stamhuis, E.J. PIVlab-towards user-friendly, affordable and accurate digital particle image velocimetry in MATLAB. J. Open Res. Softw. 2014, 2, e30. [Google Scholar] [CrossRef]
  53. Lewis, Q.W.; Rhoads, B.L. Resolving two-dimensional flow structure in rivers using large-scale particle image velocimetry: An example from a stream confluence. Water Resour. Res. 2015, 51, 7977–7994. [Google Scholar] [CrossRef]
  54. PIVlab—Digital Particle Image Velocimetry Tool for MATLAB. Available online: https://pivlab.blogspot.com (accessed on 7 November 2018).
  55. Patalano, A.; Garcia, C.M.; Brevis, W.; Bleninger, T.; Guillen, N.; Moreno, L.; Rodriguez, A. Recent advances in Eulerian and Lagragian large-scale particle image velocimetry. In Proceedings of the 36th IAHR World Congress, Hague, The Netherlands, 2 July 2015; Volume 26, pp. 1–6. [Google Scholar]
  56. Menser, J.; Schneider, F.; Dreier, T.; Kaiser, S.A. Multi-pulse shadowgraphic RGB illumination and detection for flow tracking. Exp. Fluids 2018, 59, 11. [Google Scholar] [CrossRef]
  57. PTVlab—Time Resolved Digital Particle Tracking Velocimetry (PTV) Tool for MATLAB. Available online: http://ptvlab.blogspot.com (accessed on 7 November 2018).
  58. Lükő, G. Analysis of UAV-based topography and river flow measurements. In Proceedings of the Scientific Students’ Associations Conference, Budapest, Hungary, 18–20 June 2016; Budapest University of Technology and Economics Department of Hydraulic and Water Resources Engineering: Budapest, Hungary, 2016. [Google Scholar]
  59. Kobe University. Measuring River Surface Flow with Image Analysis. Available online: http://www.kobe-u.ac.jp/en/NEWS/research/2016_04_22_01.html (accessed on 7 November 2018).
  60. Le Coz, J.; Patalano, A.; Collins, D.; Guillén, N.F.; García, C.M.; Smart, G.M.; Blind, J.; Chiaverini, A.; Le Boursicaud, R.; Dramais, G.; et al. Crowdsourced data for flood hydrology: Feedback from recent citizen science projects in Argentina, France and New Zealand. J. Hydrol. 2016, 541, 766–777. [Google Scholar] [CrossRef]
  61. Tauro, F.; Piscopia, R.; Grimaldi, S. Streamflow Observations from Cameras: Large-Scale Particle Image Velocimetry or Particle Tracking Velocimetry? Water Resour. Res. 2017, 53, 10374–10394. [Google Scholar] [CrossRef]
  62. Zeedyk, B.; Clothier, V. Let the Water Do the Work: Induced Meandering, an Evolving Method for Restoring Incised Channels; Chelsea Green Publishing: White River Junction, VT, USA, 2009; pp. 22, 256. [Google Scholar]
  63. Berghe, V.T. Image Processing for a LSPIV Application on a River. Master’s Thesis, Ghent University, Ghent, Belgium, 2013. [Google Scholar]
  64. Fujita, I.; Kitada, M.; Shimono, M.; Kitsuda, T.; Yorozuya, A.; Motonaga, Y. Spatial measurements of snowmelt flood by image analysis with multiple-angle images and radio-controlled ADCP. J. JSCE 2017, 5, 305–312. [Google Scholar] [CrossRef]
  65. Dal Sasso, S.F.; Pizarro, A.; Samela, C.; Mita, L.; Manfreda, S. Exploring the optimal experimental setup for surface flow velocity measurements using PTV. Environ. Monit. Assess. 2018, 190, 460. [Google Scholar] [CrossRef] [PubMed]
  66. Hauet, A.; Creutin, J.D.; Belleudi, P. Sensitivity study of large-scale particle image velocimetry measurement of river discharge using numerical simulation. J. Hydrol. 2008, 349, 178–190. [Google Scholar] [CrossRef]
  67. Clarke, R.; Moses, L.B. The regulation of civilian drones’ impacts on public safety. Comput. Law Secur. Rev. 2014, 30, 263–285. [Google Scholar] [CrossRef]
  68. Ran, Q.H.; Li, W.; Liao, Q.; Tang, H.L.; Wang, M.Y. Application of an automated LSPIV system in a mountainous stream for continuous flood flow measurements. Hydrol. Process. 2016, 30, 3014–3029. [Google Scholar] [CrossRef]
  69. Tauro, F.; Petroselli, A.; Grimaldi, S. Optical sensing for stream flow observations: A review. J. Agric. Eng. 2018, 49, 199–206. [Google Scholar] [CrossRef]
  70. Guillén, N.F.; Patalano, A.; García, C.M.; Bertoni, J.C. Use of LSPIV in assessing urban flash flood vulnerability. Nat. Hazards 2017, 87, 383–394. [Google Scholar] [CrossRef]
  71. Ridolfi, E.; Manciola, P. Water level measurements from drones: A pilot case study at a dam site. Water 2018, 10, 297. [Google Scholar] [CrossRef]
  72. Huang, W.C.; Young, C.C.; Liu, W.C. Application of an automated discharge imaging system and LSPIV during typhoon events in Taiwan. Water 2018, 10, 280. [Google Scholar] [CrossRef]
  73. Fujita, I. Discharge measurements of snowmelt flood by Space-Time Image Velocimetry during the night using far-infrared camera. Water 2017, 9, 269. [Google Scholar] [CrossRef]
  74. Ferrara, C.; Lega, M.; Fusco, G.; Bishop, P.; Endreny, T. Characterization of Terrestrial Discharges into Coastal Waters with Thermal Imagery from a Hierarchical Monitoring Program. Water 2017, 9, 500. [Google Scholar] [CrossRef]
  75. Theule, J.I.; Crema, S.; Marchi, L.; Cavalli, M.; Comiti, F. Exploiting LSPIV to assess debris-flow velocities in the field. Nat. Hazards Earth Syst. Sci. 2018, 18, 1–13. [Google Scholar] [CrossRef] [Green Version]
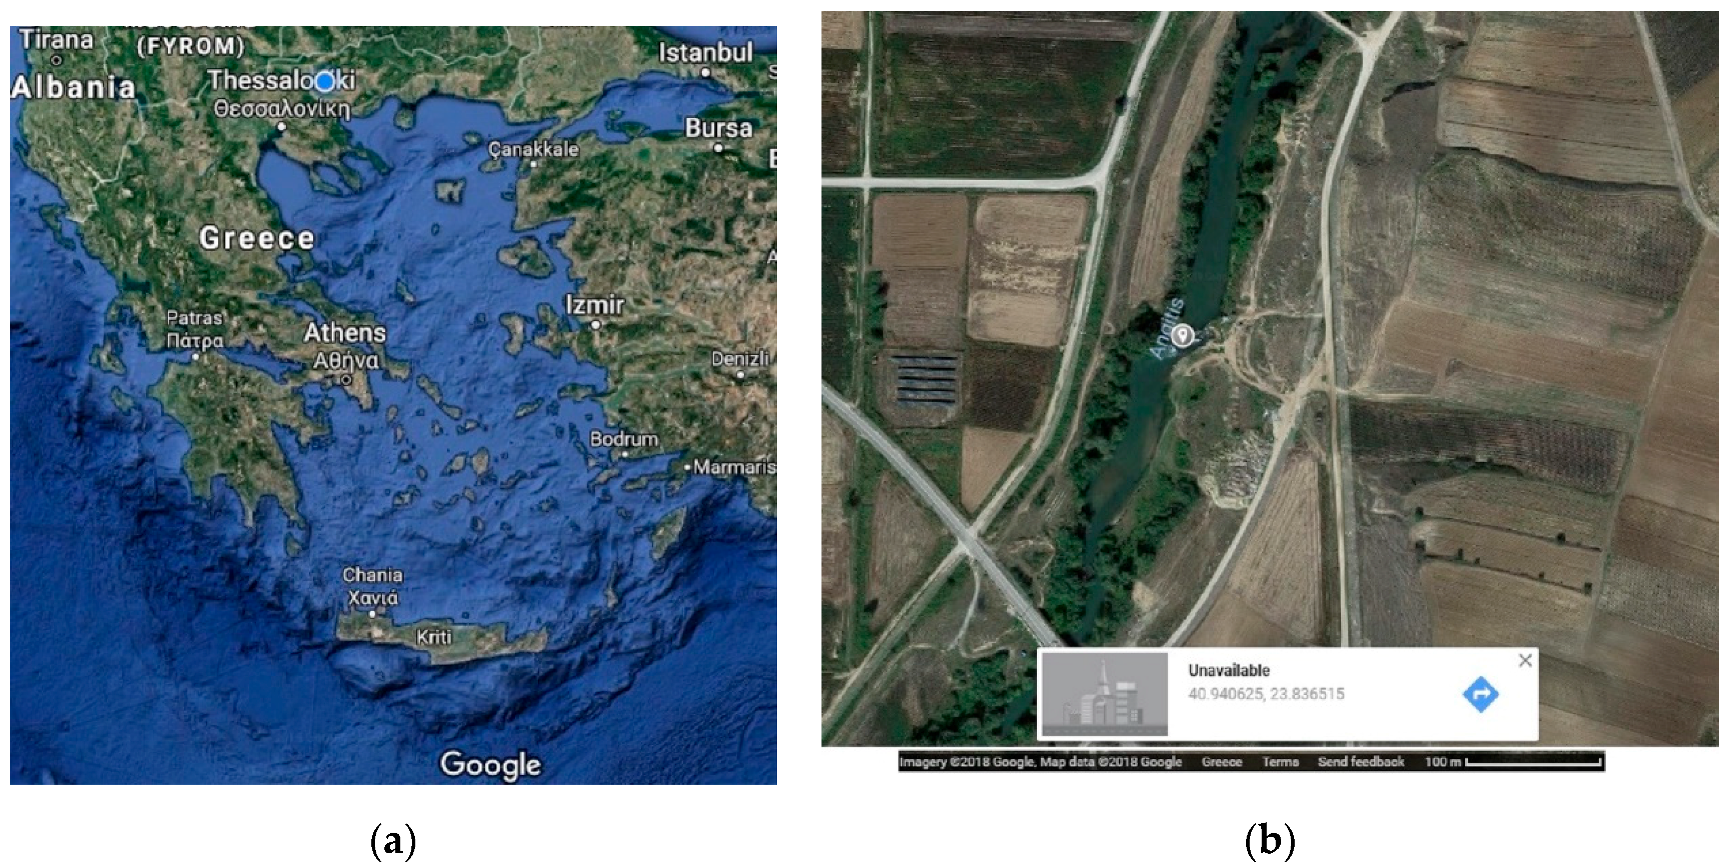
Figure 1. (a) The study area of Aggitis River in Greece; (b) The selected reach of Aggitis River compared to the existed road network. Source: Google Maps.
Drones 03 00014 g001
Figure 2. (a) The captured frame of the study area via DJI Spark at 40 m height; (b) the captured frame in greyscale color for better performance.
Drones 03 00014 g002
Figure 3. The flowchart of the methodology used in the present study for all image-based software.
Drones 03 00014 g003
Figure 4. The velocity vectors (green arrows), the streamlines (in white), the reference distance (black line), and the defined cross-section (blue line) produced in PIVlab.
Drones 03 00014 g004
Figure 5. The velocity vectors (green arrows) produced in PTVlab.
Drones 03 00014 g005
Figure 6. The velocity magnitude produced in PIVlab and depicted as a colored bar.
Drones 03 00014 g006
Figure 7. The produced graph of the velocity magnitude (in PIVlab) over the defined cross-section, from left to right.
Drones 03 00014 g007
Figure 8. The velocity magnitude produced in PTVlab and depicted as a colored bar.
Drones 03 00014 g008
Figure 9. The produced graph of the velocity magnitude (in PTVlab) over the defined cross-section, from left to right.
Drones 03 00014 g009
Figure 10. The velocity vectors (red arrows) over the defined parallel lines to the flow (blue lines) produced in KU-STIV and depicted as colored bars.
Drones 03 00014 g010
Figure 11. The produced graph of the velocity magnitude (in KU-STIV) over the defined cross-section, from left to right.
Drones 03 00014 g011
Figure 12. The produced bar chart of the velocity magnitude statistics (maximum, minimum, median, and mean values) over the defined cross-section for all three software.
Drones 03 00014 g012
Table 1. The DJI Spark Specifications (from https://www.dji.com).
Drone SpecificationsCamera Specifications
Takeoff weight:300 gSensor:1/2.3″ CMOS
Dimensions:143 × 143 mmLens:FOV 81.9° 25 mm
Max flight time:15′–16′ISO range:Video: 100–3200
Satellite positioning:GPS/GLONASSVideo:Resolution: 1920 × 1080 30 fps
Hover accuracy range:Vertical ±0.1 m
Horizontal ±0.3 m
Format:MP4 (MPEG-4 AVC/H.264)
Max transmission Wi-Fi distance:100 m distance
50 m height
Stabilization:2-axis mechanical (pitch, roll)