Abstract
Being sustainable, clean, and eco-friendly, photovoltaic technology is considered as one of the most hoped solutions face to worldwide energetic challenges. Morocco joins this context with the inauguration of numerous clean energy projects. However, one key factor in making photovoltaic installations a profitable investment are regular and effective inspections in order to detect occurred defects. Unmanned aerial vehicles (UAV) are increasingly used in various inspection fields. In this respect, this work focuses on the use of thermal and visual imagery taken by UAV in the inspection of photovoltaic installations. Visual and thermal images of photovoltaic modules, obtained by UAV, from different installations, and with different acquisition conditions and parameters, were exploited to generate orthomosaics for inspection purposes. The methodology was tested on a dataset we have acquired by a mission in Rabat (Morocco), and also on external datasets acquired in Switzerland. As final results, several visual defects were detected in visual RGB and thermal orthomosaics, such as cracks, soiling, and hotspots. In addition, a procedure of semi-automatic hotspots’ extraction was also developed and is presented within this work. On the other side, various tests were conducted on the influence of some acquisition and processing parameters (images’ overlap, the ground sampling distance, the flying height, the use of ground control points, the internal camera parameters’ optimization) on the detection of defects and the quality of visual and thermal generated orthomosaics. In the end, the potential of UAV thermal and visual imagery in the inspection of photovoltaic installations was discussed in function of various parameters. On the basis of the discussion feedback, UAV were concluded as advantageous tools within the thematic of this project, which proves the necessity of their implementation in this context.
1. Introduction
We are currently living through worldwide energy challenge, facing us with the necessity to look not only for alternative energy sources to fossil fuels, but also for green and renewable ones [1]. The sun radiates about 1017 W to earth. This can satisfy, in about one hour, the whole annual needs of the entire human population [2]. Certainly, the majority of the incident radiation falls into the oceans, but what is left is still of enormous potential.
One promising solution to exploit solar energy is photovoltaics (PV). PV solar cells convert directly sunlight into electricity using the photoelectric effect, without fuel supply, moving mechanical parts or undesirable waste production [2]. Global interest in PV technology has remarkably grown during the last decade. According to the global status report on renewables [3], 75 GW of PV capacity was added worldwide during the year 2016, taking the world’s total supply to about 303 GW. This is equivalent to the installation of more than about 7.75 MW hourly. However, PV modules are constantly exposed to various defects of severe impact on electrical output. This makes periodic and efficient inspections necessary in order to maintain PV plants’ production at optimal levels.
In this paper, we propose a methodology for PV installations’ inspection using RGB and thermal infrared imagery simultaneously taken by unmanned aerial vehicle (UAV). Sections are structured, as follows: Section 2 provides an overview of PV technology, some defects affecting PV modules as well as some commonly used techniques in PV inspection. Section 3 focuses on the use of UAV for PV inspection. In Section 4, our experimental study is exposed in details, while Section 5 presents and discusses obtained results. Finally, Section 6 presents a further discussion related to the work’s general thematic.
2. PV Technology: Brief Overview, Common Defects and Inspection Techniques
PV modules are used all over the world. They are constrained to work in different configurations and under harsh environmental conditions. This makes them vulnerable to various defects, leading to significant yield losses [4]. In order to detect, locate, and identify occurred defects, various techniques are used. However, for hard-to-reach and large-scale installations, the use of classic techniques faces challenges that still need to be tackled.
2.1. Brief Overview
Photovoltaics operate by producing direct electric current from photons’ absorption, on the basis of exploiting electronic properties of a special class of materials called semi-conductors [5]. The conversion process is performed by cells. Generated direct current can lately be converted by inverters to obtain an alternating current for suitable usages [6].
Rather than being used individually, PV cells are often assembled and encapsulated to form modules. A typical PV module layout comprises six strips, each one with 10 cells [7]. PV cells are made of semi-conductors. In this respect, many materials can be used, such as silicon, germanium, cadmium telluride, gallium arsenide, copper indium deselenide, etc. The first one is the most used because of its great abundance in the Earth’s crust. Three categories of silicon solar cells are available on the market: Monocrystalline (12–16% efficiency range with a surface area required of about 1 m²/kW), polycrystalline (11–15% efficiency range with a surface area required of about 8 m²/kW) and amorphous (6–8% efficiency range with a surface area required of about 16 m²/kW) [2].
2.2. PV Defects
A PV defect can be defined as everything different from the expected in a PV module [8]. It does not necessarily result in a safety issue or yield loss as in case of a failure, but specifies a part of a module that is different from a perfect one. The term “defect” is consequently broader than “failure” and will be considered in this paper. Some commonly known defects are briefly presented in what follows.
2.2.1. Mismatches
Mismatch defects result from the association of cells with different physical properties, or operating under different conditions [7]. Regardless of the association type (series or parallel), cells (and modules too) do not operate at their individual power point but always under a combined maximum [9]. Therefore, a defect occurring on a cell will have an impact on the whole module.
Mismatches, along with defective bypass diodes, may evolve hotspots (Figure 1) that may cause browning, burn marks or in severe cases, lead to fire [8,9,10].
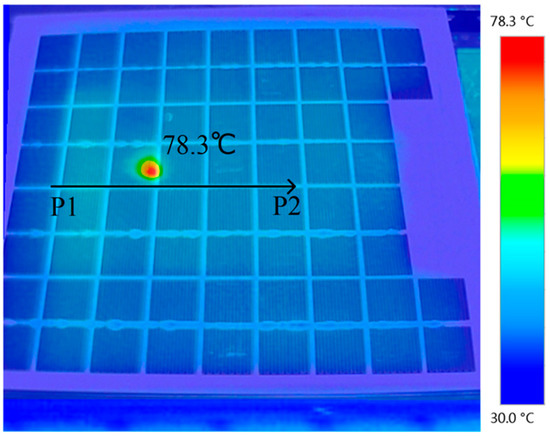
Figure 1.
Observed hotspot on a thermal image of a PV module [11].
2.2.2. Cracks
Cracks (Figure 2) are one of the most frequent defects affecting PV modules. They can have different lengths and orientations and may appear at different stages of modules’ lifetime: during manufacturing due to soldering, stringing process, and handling, after finishing the production due to packaging, transport, and reloading, and lately in the field, as a result of mechanical loads due to wind, snow, and hail [8,9,10,11,12].
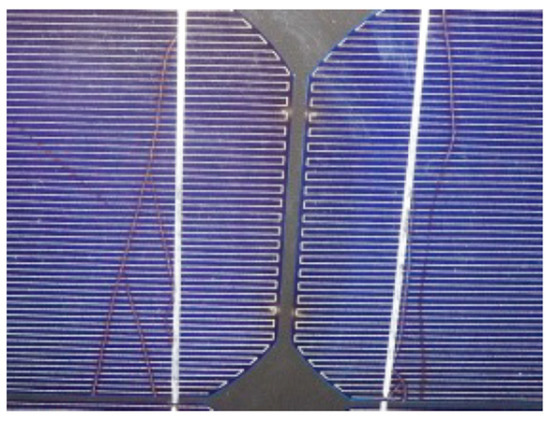
Figure 2.
Cracks in PV cells [8].
2.2.3. Discolorations
Discolorations (Figure 3) may result from internal factors, such as the use of bad quality polymers in cells assembly, or external ones, such as hot temperatures and humidity. Discolorated areas reduce the quantity of sunlight penetrating cells, and thus, may result in yield losses [13].
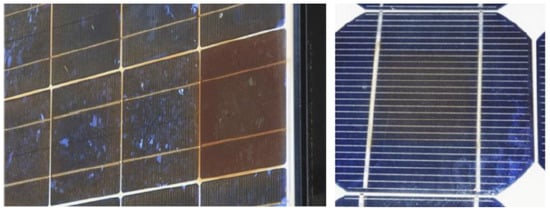
Figure 3.
Discolorated (brown) PV cells [8].
2.2.4. Soiling
Soiling refers to the accumulation of dirt on the surface of PV modules (Figure 4). This may result from various causes such as dust, pollution, bird droppings, etc. [14]. Literature shows annual PV yield losses due to accumulated sediments ranging from 1–7% in regions, such as Spain, to more than 10% in dry zones, such as Cyprus and Kuwait [15]. However, accurate losses prediction remains difficult due to the existence of multiple correlated parameters to be put into consideration such as environmental and weather conditions, tilt angle of the PV modules, the type of soiling agent, and also the texture of cells’ front glass [16,17].
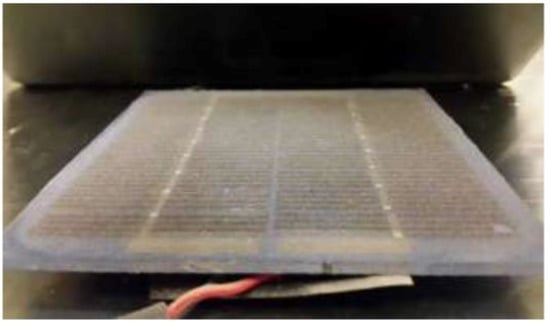
Figure 4.
Soiled PV Cell [18].
2.2.5. Delaminations
During operating lifetime, compromised adhesive bonds between the encapsulant and superstrate/substrate materials of a solar cells of PV modules allow for the intrusion of moisture, which causes strates detachments (or delaminations) (Figure 5). These latter mainly occur due to imperfections in the lamination process, harsh outdoor conditions, or a combination of both [19].
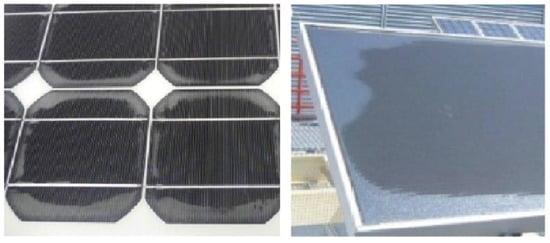
Figure 5.
PV delaminations [8].
2.2.6. Snail Trails/Tracks
Snail trails are a grey/black discoloration effect of silver grid lines on crystalline silicon cell surface (Figure 6). It occurs at micro cracks and/or along cell edges [20]. Snail trails can be easily identified by eyesight. They typically occur three months to one year after the installation of the PV modules and spread depending on environmental conditions [8]. Experimental tests demonstrated a decrease of more than 20% of electrical PV output on modules affected by snail trails [21].
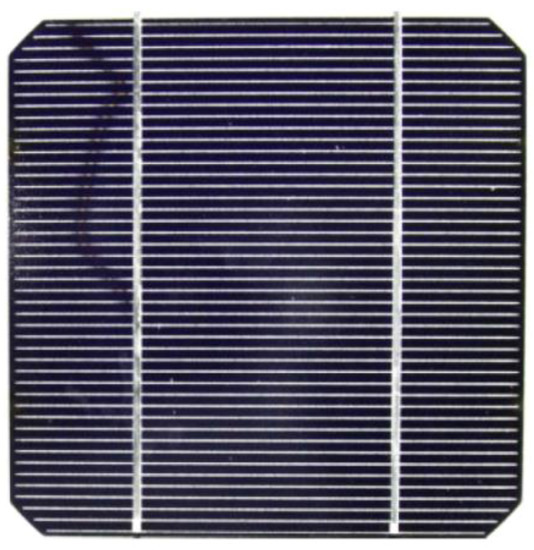
Figure 6.
Phenomenon of snail trials in a PV cell [8].
2.3. Common PV Inspection Techniques
PV modules are inspected using various techniques. Each presents several advantages and limitations, and seems to be adapted to specific defects or particular configurations. In the following, commonly used techniques are briefly presented. Infrared thermography is exposed in more details, since it constitutes the object of our practical field work presented later in Section 4.
2.3.1. Visual Inspection
Visual inspection constitutes generally the first test that modules should successfully pass [13]. Commonly detectable defects by this technique are soiling, some cracks, discolorations, delaminations, and snail trails.
2.3.2. I-V Measurements
I-V measurements are used to establish the I-V curve of PV modules. This latter may reveal a change in PV operating conditions, such as weather and/or the existence of some defects, like delaminations, mismatches, defective bypass diodes, etc. [22]. The operation is proceeded by the analysis of deviations between the I-V curve of inspected modules and a reference one considered as perfect.
Mayfield [23] presents the impact of irradiance and ambient temperature on the I-V curve of a typical PV module, whereas in [8], detectable defects on the basis of I-V curve deviations, with their electrical signatures, are listed in details. However, the main inconvenient of this technique is that an I-V curve profile of a defective module may shelter different potential defects. In addition, no information on the exact location of defects are provided, therefore, resorting to other techniques is often necessary [24].
2.3.3. Electroluminescence
PV modules are designed to optimize sunlight absorption and its conversion into electrical current. Therefore, on the basis of reciprocity principle, they can emit photons after being stimulated, and this is the principle of electroluminescence. The technique consists of applying a direct current to a module and measuring resultant photoemission using an infrared camera [25]. In principle, dark areas correspond to damaged zones by various defects, whereas bright and clear ones correspond to intact zones [26].
Electroluminescence imagery is performed in dark environments. It is specially used to detect cracks which appear as dark lines. In case of multi-crystalline solar modules, an experimented person is required to distinguish cracks from crystallographic defects [8]. On the other side, electroluminescence has several practical disadvantages. Indeed, inspections cannot be performed under PV plants operation. In addition, they require huge power supply and provide only qualitative diagnosis [24].
2.3.4. Infrared Thermography
At temperatures higher than 0K (the absolute zero temperature), each body emits a heat radiation in the form of electromagnetic waves [27]. Emitted radiation is proportional to body temperature. It spreads with the speed of light [28], with no need for a material contact or an intermediate temperature gradient [29]. Using thermal cameras, infrared thermography consists of capting this radiation, converting it into electrical signal and providing raster images (thermograms) where pixels contain temperature values.
The most important part of a thermal camera (or a thermal imager) is the detectors’ array. Basically, two types of detectors can be found [30]: Thermal detectors that operate on the basis of heating by incident infrared radiation, and photonic (or quantum) detectors, where incident IR radiation interacts at an atomic (or molecular) level with the material of the detector generating a voltage or an electrical resistance change. Other classifications into cooled and non-cooled, and based on detectors’ construction are proposed as well [27]. Detectors typically used in PV infrared inspection are microbolometric detectors. They fall into the thermal category [31]. Measurements can be performed in two ways. The first is known as quantitative, in which, exact temperature values of objects are obtained. The second is qualitative. It gives the relative temperature compared to other parts in the inspected object [32].
Factors affecting IR thermography measurements can be classified into three categories: procedural, technical, and environmental. The first concerns the operator and can be reduced by a qualified person. The second concerns the IR camera (technical specifications and calibration), the emissivity as well as the distance of the object being inspected. The third relates to ambient meteorological conditions (temperature, humidity, rain, wind, and solar irradiance) [32].
IR thermography has many advantages, such as non-destruction, non-contact, fast data acquisition, and large-scale use on PV plants at maximum power production state [31,32,33]. Used thermal cameras can be carried by an operator who inspects manually each module, fixed at a static support or mounted on UAV. Some present defects can be identified depending on the shape and the location of their thermal patterns. For example, an entire module warmer than others indicates that it is open circuited. On the scale of a module, a patchwork pattern indicates that the whole module is short-circuited. One cell clearly warmer than the others indicates a shadowing effect, a defective or delaminated cell. A warmer part of a cell indicates the presence of cracks. A pointed heating indicates a partly shadowed area due to a bird dropping for example [8].
3. UAV for PV Inspection
With the gradually wide spreading awareness regarding photovoltaics, tendencies are now moving especially to large plants. At this scale, conventional inspection techniques become time consuming and expensive to implement. Visual and thermal inspections can be performed by aerial cameras. This saves time and human resources. It also allows the coverage of large areas, fast data collection, as well as the inspection of hard-to-reach installations. The use of UAV can reduce up to 85% the time spent performing thermographic inspections in large photovoltaic plants [34].
Efficient PV inspections with UAV require the respect of a list of conditions. For RGB imagery, aerial images have to be captured vertically, with a tilt preferably below 3°. Oblique images may also be used for special purposes. Environmental conditions affect also the quality of RGB visual inspections, such as wind which disrupts the platform stability, and solar rays’ reflection on modules’ surface that results in over illuminated images [35]. For thermal inspections, the used thermal camera should be sensitive in the 8–14 μm band, with a recommended thermal sensitivity below 0.08K to detect small temperature differences [36]. Sufficient solar irradiance is necessary to ensure enough thermal contrast, a stable value between 500 W/m² and 700 W/m² is suggested. For the thermal camera’s positioning, a viewing angle of 5–60° with respect to the perpendicular line on modules’ surface is recommended. Airflows are undesirable, because of the convective cooling they may cause on the surface. In addition, in order to avoid undesirable reflections on modules surface and shadowing from the UAV, carrying out measurements on early morning or in the evening is a proposed option. This also allows better differentiating of profile temperatures on IR captures [31].
Numerous works have been conducted on PV inspection using RGB and/or thermal cameras mounted on UAV. One of the first studies in this field was performed by [21]. The main objective of this study was exploring and evaluating the use of RGB and thermal infrared sensors, mounted on different UAV technologies for PV failures detection. The study demonstrated the effectiveness as well as the time and cost saving benefits of the solution in comparison to conventional used techniques. With visual imagery, some defects, like cracks, discolorations, soiling, delaminations, and corrosion can be detected by visual monitoring using RGB images [35,36,37]. The camera resolution and the flight height are the most important parameters to consider. In [35], an experiment on the influence of the ground sampling distance (GSD) (which is the distance between the centers of two adjacent pixels, measured on the ground) and PV defects detection in visual RGB spectrum was conducted. The inspected installation consisted of 10 PV modules located on the roof of the Department of Energy at Politecnico di Milano campus. Images were captured by a drone type Nimbus PLP-610 equipped with an RGB camera type Nikon 1-V1. Captures were acquired with different heights from 1 m up to 20 m above modules. Results of this study have shown that the correlation between the GSD and defects detection depends on various characteristics of the single defect, such as the shape, the size, the color, the location, etc. For a snail trail, dirt, and white spots, the minimum required GSD for detection was, respectively, 8–10 cm, 3–5 cm, and 2–3 cm.
Thermal images in PV inspection get the temperature distribution over a photovoltaic module surface allowing, consequently, hotspots’ detection. In [34], an experimental thermal inspection was conducted on a large PV plant located in the south of Spain. IR measurements were performed in a clear sky day, with an irradiance value of about 600 W/m², and a wind speed below 6 m/s. An hexacopter drone type AT8-XL, equipped with a FLIR camera was used to fly at a height of about 40 m above modules. Captured images were post-processed using the software Pix4D to generate thermal orthomosaics of the inspected installation. As a result, present hotspots were all detected and validated using a manual thermal imager. In [24], two PV installations were inspected in the campus of the Institut National de l’Énergie Solaire in France. The experiment was performed under realistic maximum power point conditions, with a solar irradiance value between 680 W/m² and 850 W/m², a wind speed below 8 m/s, and cloud coverage below 2 okta. Measurements were done by a hexacopter UAV type Condor AY-704 carrying a thermal camera type Optris PI450 as well as an SLR camera for visual imagery. Acquired images were processed to generate RGB and thermal orthomosaics of inspected installations. Defective modules were detected and were positively validated by four techniques: visual inspection, manual inspection using a thermal imager, I-V curve, and electroluminescence. In their review paper concerning recent advance on monitoring, diagnosis, and power forecasting for photovoltaic systems, Daliento [38] present other examples of studies of thermal analysis of PV that are mostly based on thermal images captured by means of unmanned aerial vehicles.
For an automatic defects’ detection, especially hotspots, state-of-art literature propose different solutions. Canny edge operator was used to identify the location of hotspots on a PV panel from terrestrial thermal infrared image [24] and from thermal infrared images captured with a UAV [39]. However, the noises within and outside the panels affect the quality of the results. Based on the extracted panel area polygons, [39] propose a methodology for panel fault diagnostics using statistical values of thermal intensity of each extracted panel. Mean intensity and standard deviation of each array row were considered as statistical parameters in a local detection rule to diagnose faults. Dotenco et al. [40], for their part, compute four sets of features (module medians, grid cell medians, histogram skewness, and vertical projections) for PV modules detected in UAV thermal images. They conduct a Grubbs’ test followed by Dixon’s Q test to detect the defective modules based on temperature abnormalities. Automatic defects’ geo-localization is also one of the most important aspects in PV plants inspection, especially for large-scale ones. In [41], this issue was addressed by using a UAV equipped with a custom-designed payload that includes, in addition to a thermal and RGB camera, a low-cost RTK GNSS receiver. This allowed locating defects within a centimeter accuracy as well as reducing the time and the cost of the operation.
Leotta et al. [42] have proposed a post processing technique for automatic modules identification in thermographic images provided by drone. The technique starts from converting false color captured images to gray scale. In order to improve edge detection, a contrast stretching transformation function is applied. Edges are then detected on the basis of intensity’s first and second derivatives. In order to eliminate spurious discontinuities, a line procedure detection is applied using Hough transformation, and finally, separation of frames related to different modules is performed. The method was tested on images acquired in Enel Green Power PV plant located in Italy, but due to the low resolution of the thermal camera and non-optimal choice of the drone path, it has not yielded the expected results, but, in contrast, between 20% and 30% of modules were identified.
Dense point clouds offer new possibilities in the detection and evaluation of thermal pathologies in PV modules. In [43], a Structure from Motion process was used to obtain a dense RGB point cloud of inspected panels. This last was geo-referenced using nine ground control points. Information from thermal infrared images was projected to the three-dimensional (3D) geo-referenced point cloud to complement the visible spectrum radiometry associated to each 3D point. The final five-dimensional (5D) dense point cloud (X, Y, Z, RGB, T) was introduced in a three steps segmentation workflow to extract individual PV modules, in which, points were classified on the basis of temperature values. The methodology was tested on an installation of 21 PV modules and was able to detect and locate all existing pathologies.
4. Experimental Study
For our experimental study, the methodology we propose is organized as follows:
- acquisition of thermal and visual images for the installations to inspect;
- image processing in order to generate thermal and visual orthomosaics;
- investigation of generated orthomosaics to detect and locate present defects;
- validation of detected defects; and,
- proposition, test, and validation of an automatic hotspots extraction method.
4.1. Inspection Sites
For our field experiment, two photovoltaic installations were inspected within the campus of Rabat National Mining School (Figure 7 and Figure 8). The first one comprises 18 monocrystalline modules (Figure 7). The second one (Figure 8) comprises a string of six monocrystalline modules, another one of five polycrystalline modules, and a third of 10 amorphous modules. For comparison purposes, some modules have been washed before the flights in every installation.
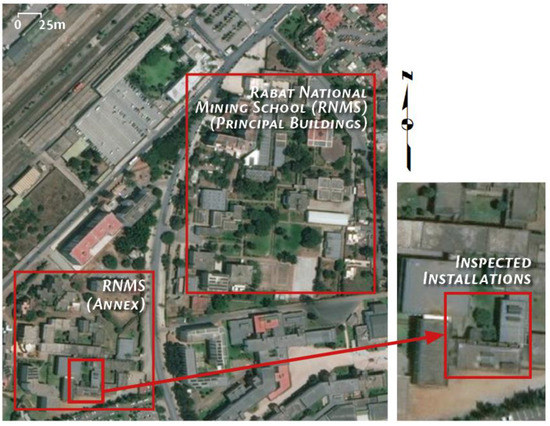
Figure 7.
Localization of inspected installations (World Imagery, 2017).
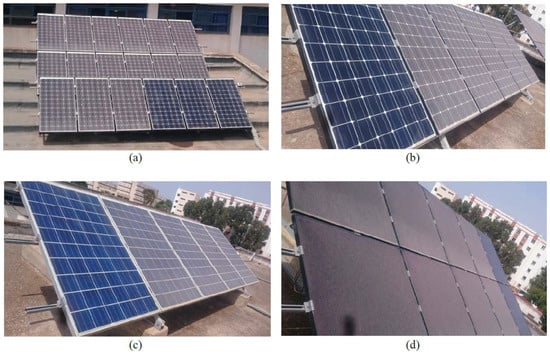
Figure 8.
Inspected installations on Rabat National Mining School. (a): Installation 1 (Three monocrystalline strings), (b): Installation 2 (Monocrystalline string), (c): Installation 2 (Polycrystalline string), (d): Installation 2 (Amorphous string).
In parallel with our mission, we have also exploited, for comparison purposes, visual and IR datasets that were acquired by SenseFly team on Ecublens solar power plant located in the east of Lausanne (Switzerland). The installation consists of 5012 polycrystalline modules.
4.2. Material
Visual and infrared images were captured using a quadcopter drone type Albris, manufactured by SenseFly (Figure 9). The Albris weights 1.8Kg, this includes the battery, the payload, and shrouding. It is equipped with four electric brushless motors providing a flight autonomy up to 22 min. Visual and IR imagery is provided by default included cameras from the manufacturer, of which, main technical specifications are listed below (Table 1).

Figure 9.
The Albris (left) and the eBee (right) (SenseFly, 2018).

Table 1.
Technical specifications of RGB and thermal on-board cameras.
For validation purposes, terrestrial infrared measurements were performed using a portable thermal imager, type FLIR E2. It features a 320 × 240 matrix of microbolometer detectors, with spectral range 7.5–13 μm, temperature range from −20 °C to 250 °C, and a thermal sensitivity of 0.1 °C.
For orthomosaics georeferencing, ground control points were acquired by a set of four bi-frequency GNSS receivers: three type Spectra Precision SP60, and one type Promark 500.
Ecublens data were acquired by a drone type eBee (Figure 9), manufactured by SenseFly. Contrary to the Albris, the eBee has an emplacement where different suitable sensors can be placed. Visual imagery was acquired using a camera type Canon IXUS 127 HS, whereas thermal imagery was acquired using the thermal imager ThermoMAP. Technical specifications of both captors are shown below in Table 2.

Table 2.
Technical specifications of RGB and thermal on-board cameras.
4.3. Software
Delivered with the Albris, eMotion 3 was used for mission planning, simulation, and execution on field. It was also used for data preparation before post processing. This latter was performed using the software Pix4D Mapper Pro. GNSS observables were post processed using Spectra Precision Survey Office (SPSO), and, in the end, visualization, superposition and georeferencing of generated orthomosaics were performed using ArcGIS. This latter was also used for hotspots automatic extraction.
4.4. Data Acquisition
Our inspection mission (Figure 10) took place on 14 June 2017, between 12:00 and 15:00, under steady-state maximum power production conditions, an ambient temperature of 27 °C, irradiance values between 550 W/m² and 780 W/m², and a wind speed below 5 m/s. Ambient measurements were provided by a meteorological station located in the inspected site performing continuous tracking.
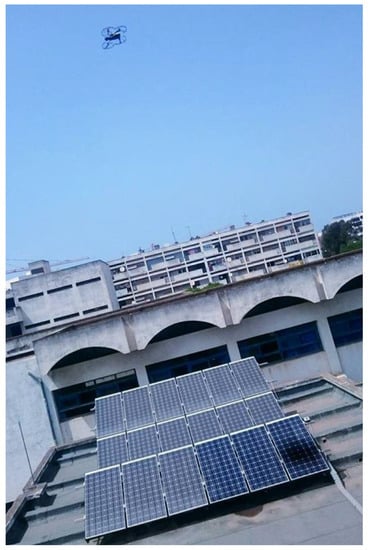
Figure 10.
A photo from the mission.
Mission planning was performed on eMotion 3. This consists of delimiting the area of interest, generating flight lines after specifying the overlap and the ground sampling distance and then pointing take-off and landing points. In order to investigate defects’ manifestation under different heights. Each installation was overflown by two flies: one at a height of 6 m above the panels and another at a height of 11.5 m. The acquisition in both spectrums was performed simultaneously. This means that, for every visual capture, an infrared one is also taken at the same position (Figure 11). Values of frontal and side overlap were set to 90%. In addition, a path-crossed flight was planned for the first installation as a precaution for later processing.
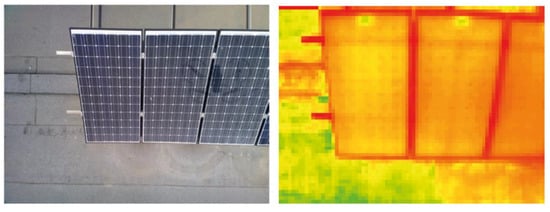
Figure 11.
An RGB image (left) and the corresponding thermal one (right).
In the end of the mission, captures for thermal validation were taken by the FLIR E2 imager for both installations (Figure 12). Real time mode captures were also taken by the Albris for the first installation for comparison purposes. Five Ground control points were lately observed in two static sessions, each of approximately 40 min.
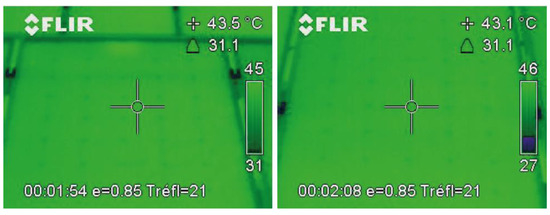
Figure 12.
Thermal images captured by the FLIR E2.
For Ecublens solar plant, thermal and visual images were acquired separately, under steady-state maximum power production conditions, an ambient temperature of 25 °C, and a flight height of approximately 75 m. Mission planning was also performed using eMotion, following the same aforementioned steps for the Albris.
4.5. Data Processing and Exploitation
Acquired visual and thermal images were georeferenced using eMotion 3. This consists of attributing to each image metadata specifying its position and orientation in a 3D datum, so as they could be used lately in the aerial triangulation process. Post processing using Pix4D follows the workflow listed below:
- Initial processing: in which, camera’s interior and exterior parameters are solved using a Structure from Motion (SfM) algorithm. This last also generates a sparse 3D point cloud.
- Point cloud generation: in which, a denser 3D point cloud is computed from previous images using a MultiView Stereo (MVS) algorithm.
- Digital surface model and ortho: in which, visual and thermal orthomosaics are generated by orthorectifying acquired nadir images.
Processing was done first with default Pix4D parameters which are: keypoints extraction on original image scale, optimization of all internal and external camera parameters, half image size for points densification, computation of 3D points for every four/(image scale pixel) and a minimum number of three re-projections on images for a point to be considered on computation. With this processing configuration, datasets with high overlaps (90% in both) took too much time. This was lately resolved by alleviating processing parameters. As a result, for datasets we acquired, processing time was optimized up to 86% by reducing both overlaps to 80% (by images removable from datasets before processing) and parameters modification.
We noticed that pixels values in thermal generated orthomosaics from Albris images do not refer to the exact temperature values. Therefore, and due to the absence of a conversion model to temperature values in Pix4D for the Albris thermal camera, we have performed a manual calibration using captures taken by the thermal imager. Homologous points between these lasts and thermal orthomosaics were pointed. As a result, the following linear equation linking pixel values (VPixel) and their temperatures (TPixel) was obtained:
TPixel (°C) = 0.0071 × VPixel − 174.79,
Automatic hotspots extraction method we propose follows listed steps below:
- Superposition of thermal and RGB orthomosaics: this is a necessary step for later ones. It is done by pointing homologous points in both orthos to make same details superimposed as much as possible.
- PV strings extraction: consists of isolating PV strings after delimiting them with polygons, so as the extraction will be performed only on the delimited area.
- Threshold specification: this step consists of specifying a threshold for hotspots characterization. Every pixel that has a superior value to this threshold will be considered as located within a hotspot. For this purpose, we have exploited Migan’s [44] formula, which determines the expected temperature of a PV cell (Tcell) on the basis of solar irradiance (S), ambient temperature (Tair), and the nominal operating cell temperature (NOCT), which is typically provided by the manufacturer in technical specifications of manufactured modules.Tcell = Tair + (NOCT − 20) × S/80,
In the end of the process, extracted hotspots can be superimposed on RGB orthomosaic to facilitate their localization, especially in large PV installations.
5. Results and Discussion
5.1. Visual Inspection
In our experimental mission, the Albris flew at two different heights above the installations underwent inspection. The 6 m height resulted to a 1 mm GSD, whereas the 11.5 m one resulted to a 2 mm GSD. Generated visual orthomosaics are presented in (Figure 13) and (Figure 14). Generated orthos for both heights look the same at the scale of Figures 16 and 17, that is why one ortho is presented for each installation. On the basis of generated RGB orthomosaics, the following defects were detected:
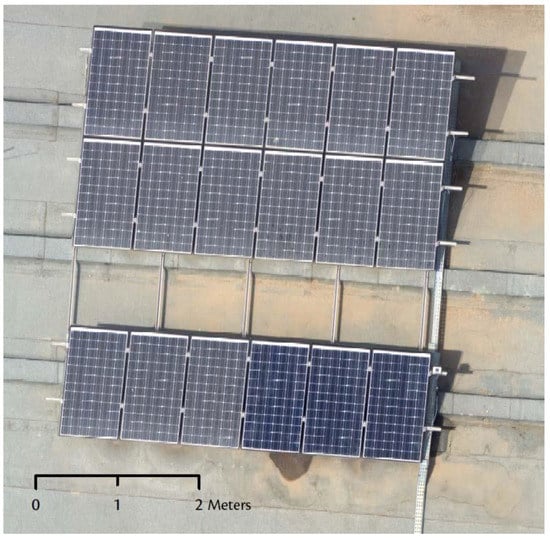
Figure 13.
Visual orthomosaic of installation N°1.
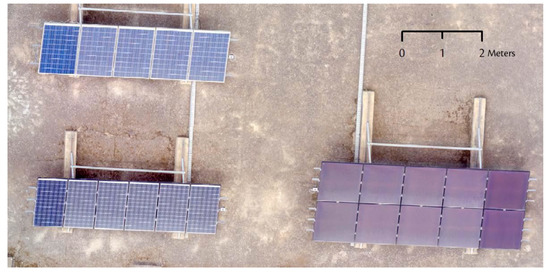
Figure 14.
Visual orthomosaic of installation N°2.
- Soiling was clearly distinguishable on all generated orthomosaics. Even after washing, the smooth left layer remained visible (Figure 15).
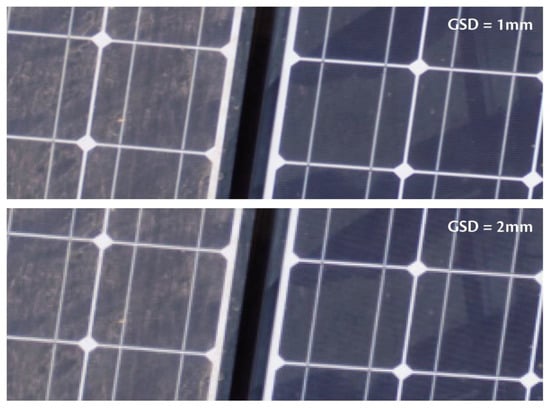 Figure 15. Appearance of soiling at the two experimented flight altitudes.
 - Cracks were found on four cells in the first installation. At a 1 mm GSD, they are clearly visible whereas at a 2 mm GSD, additional effort is required from the examiner in order to detect them (Figure 16).
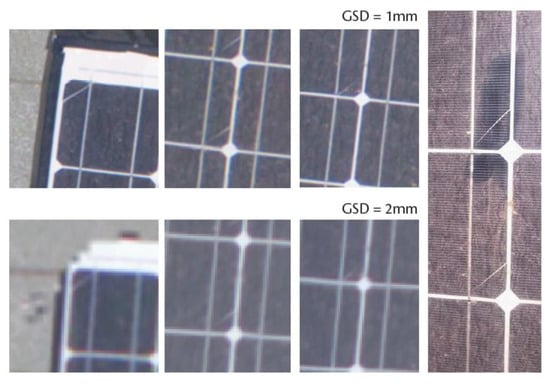 Figure 16. Appearance of cracks at the two experimented flight altitudes.
 - Smears of different sizes and forms were also found in almost all modules. Big ones are easy to detect on all orthomosaics whereas small ones require an additional effort to detect them on 2 mm GSD orthomosaics (Figure 17).
 Figure 17. Appearance of smears at the two experimented flight heights.
Validation of detected defects was performed manually by eyesight on the field. On the other side, in the RGB orthomosaic we generated from Ecublens data, no defect has been detected, except slight soiling in some zones. Strings surface appears quasi homogeneous. Except irradiated zones by the sun, cells contours are distinguishable, but defects detection on a sub-cellular scale was impossible due to insufficient GSD (Figure 18).
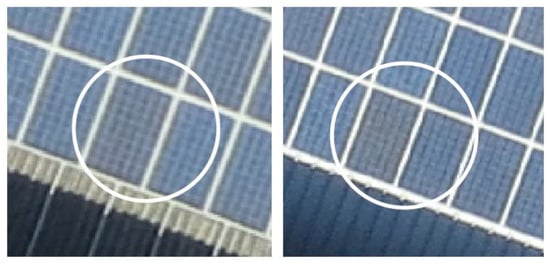
Figure 18.
Slightly soiled modules observed in Ecublens RGB orthomosaic.
5.2. Thermal Inspection
5.2.1. Primary Results
The Albris low thermal resolution (80 × 60 px) made it difficult for Pix4D to reconstruct the project, due to the lack of information in images. The only dataset that passed the processing process is the path-crossed one (acquired for the installation N°1), of which the result is presented below (Figure 19).
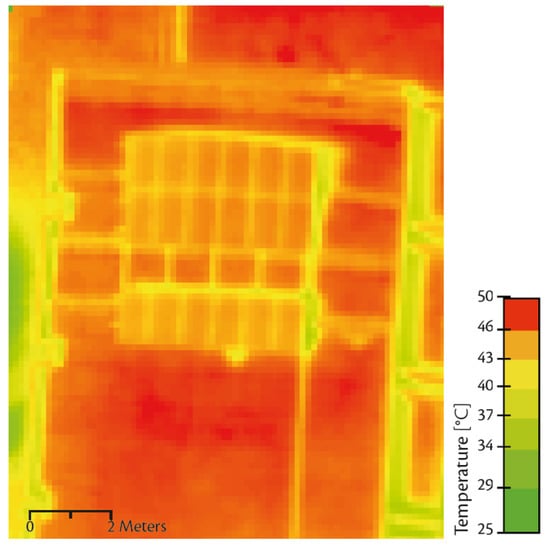
Figure 19.
Thermal orthomosaic of installation N°2.
The GSD of the thermal orthomosaic was 13.4 cm. At this scale, modules’ edges were distinguishable but cells were not so. No defect has been detected. This was lately validated by the thermal imager which didn’t show any abnormal profile temperature on all modules surfaces, and also by the yield tracking station that did not save any abnormal output losses. However, there were some thermal imager captures showing point shaped spots corresponding to bird droppings (Figure 20).
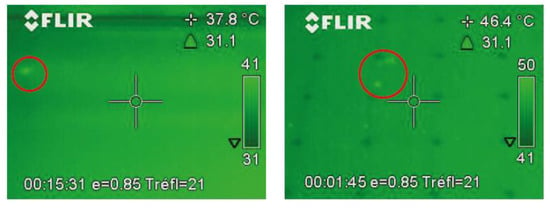
Figure 20.
Spots on thermal images due to bird droppings.
5.2.2. Investigation of Thermal Images Processing Failures
All other thermal datasets failed the processing workflow. They either gave a deformed result or failed to pass the initial processing step.
For further investigation on reasons why datasets failed processing, we have done tests on the basis of two parameters: First one is the use of GCP and second one is the camera parameters optimization. Results are summarized below:
- Test 1—No used GCP: generated thermal orthomosaic with no parameters optimization was smaller than the one with parameters optimization. Moreover, this last and the RGB orthomosaic were not perfectly superimposed despite the fact that their images have been captured simultaneously and geotagged exactly two by two like each other with the same trajectory file.
- Test 2—GCP are introduced: thermal orthomosaic generated with no optimization presented heavy deformations, whereas the one with optimization was intact.
Analysis of Pix4D processing reports highlighted that one more possible cause of perceived deformations may be in images calibration process. This last consists of iterative calculations of focal length, the coordinates of the principle point of auto-collimation and distortion’s coefficients. Reports showed that not all of processed images were calibrated (Table 3).

Table 3.
Percent of calibrated images for each flight.
Another remark we observed in Pix4D reports are big differences between initial values and calibrated ones (Table 4). According to Pix4D, the difference should not exceed 5% whereas Table 4 shows larger values. The low quality of processed images is an involved cause of these calibration issues, but moreover, we noticed that the thermal camera model included in Pix4D database attributes zero values for lens distortions which is normally illogical. This was the second cause why thermal images were failing initial processing.

Table 4.
Difference between initial and calibrated values for each flight.
5.2.3. Hotspots Automatic Extraction
For hotspots automatic extraction, we applied our proposed methodology on Ecublens thermal dataset owing to their better quality and resolution (Figure 21). Results of the methodology, step by step, are presented below (Figure 22, Figure 23 and Figure 24). Validation of extracted hotspots was lately done referring to SenseFly team inspection’s report which revealed exactly the same hotspots we have extracted.
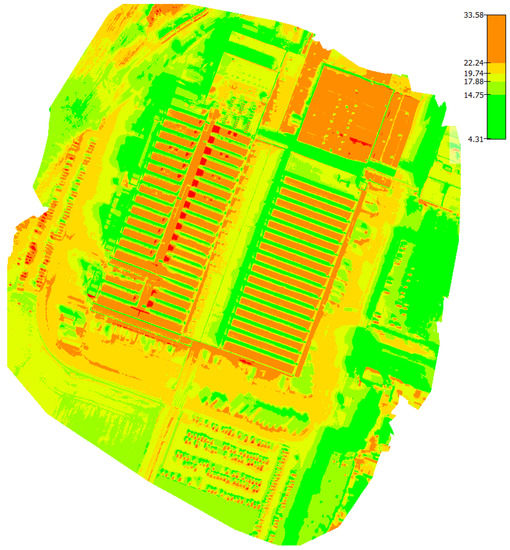
Figure 21.
Generated thermal orthomosaic from Ecublens dataset (temperature values are in °C).
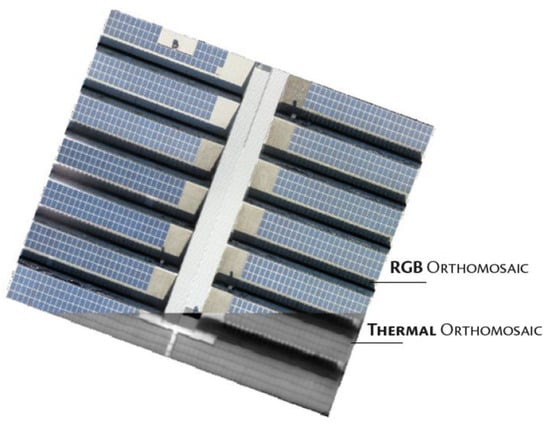
Figure 22.
Superposition of RGB and thermal orthomosaics.
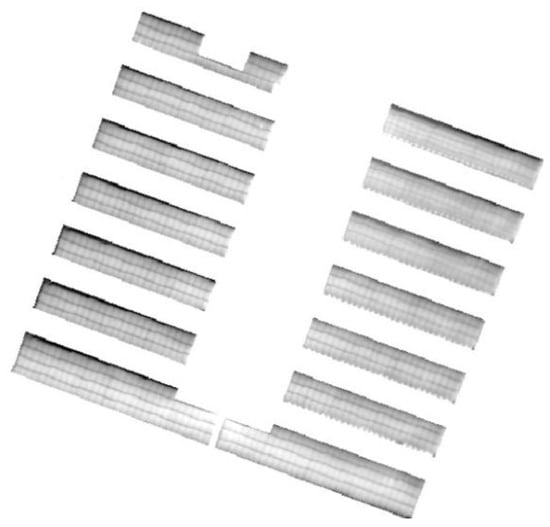
Figure 23.
Extracted modules on thermal orthomosaic.
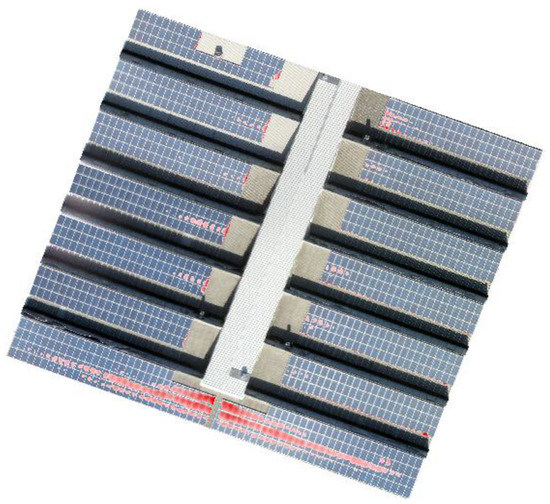
Figure 24.
Extracted hotspots and their location within the installation.
6. Further Discussion
On the basis of what has been previously presented, various results and conclusions have been obtained. On the basis of these latter, this section develops the discussion on a practical aspect, for different scale installations, as well as, lately, some general aspects related to inspection operations.
6.1. Case of Small Installations
For easy to access small installations, of approximately 10 to 100 modules, the use of UAV is not justified. It is not a wise option due to the cost of the operation and also the process of obtaining the flight authorization (in Morocco as an example, for security issues, a flight authorization is required for every UAV flight). Visual inspections could be done closely by eye sight, whereas thermal inspections could be also performed in parallel by manual thermal imagers. For further investigations, defective modules could be taken to a laboratory for thorough inspections with other techniques (I-V measurements, electroluminescence, etc.).
For small installations located in difficult to access places, such as buildings, roofings, or façades, rotary wings UAV are advantageous thanks to their maneuverability. Inspection could be performed by static captures or in video mode.
For visual inspections in RGB spectrum, captures are preferred. They can be assembled into mosaics providing one valuable support to investigate the whole installation. Video mode is also an available option, but constant movements of UAV platforms do not favor inspections in this case.
For thermal inspections, video mode could also be used, but captures are also preferred. In this case, automatic flight is recommended so as regular side and frontal overlaps could be maintained. Crossed-path acquisition with high overlaps (90% for both: side and frontal) is also recommended so as sufficient keypoints could be extracted, and the aerial triangulation passes successfully. Previously mentioned conditions in Section 3, related to ambient conditions and cameras position regarding modules surface are also to be respected to obtain reliable results.
6.2. Case of Medium to Large Scale Plants
Actually, most PV inspection challenges are in case of medium to large scale installations composed by thousands of modules. Here, fixed wings UAV take the advantage thanks to their endurance, speed, and large coverage. However, there is one problem is that, for safety issues, flying heights of fixed wings UAV are generally limited by manufacturers. This can be solved by two ways: First, it is known that most of large-scale installations are located in flat areas where there are no threatening obstacles for UAV. Therefore, manufacturers may propose an option in planning software allowing flying at lower heights. Second, the use of high specifications airborne cameras is also a solution. The market proposes actually sensors capable of centimetric thermal and millimetric RGB GSD, but in this case, the price must be taken also into consideration.
Acquired images can be processed to generate thermal and RGB orthomosaics, this process requires wise choices of processing parameters to optimize processing time without compromising the quality of expected results. Orthomosaics are to be examined lately by experimented operators in order to locate and identify present defects. Rotary wings UAV can also be used in this case in parallel with fixed wings ones. Indeed, in case of impossibility to identify with exactitude some defects on the basis of generated orthomosaics (from the fixed wing UAV dataset), the list of their coordinates can be transmitted to a rotary wing UAV to perform an automatic flight and take close range imagery in both spectrums.
Web mapping tools provide interesting solutions for data sharing, access, and visualization. As application in our context, generated orthomosaics and overlaid located defects with their identification or any other additional information could be overlaid over a satellite or cartographic background, and uploaded on a FTP server. The link, with an access protected password can be delivered to the organism that has requested the inspection. Defects will be located with a centimetric accuracy in case of previous georeferencing with GCP. The operator can investigate at ease the orthomosaics and decide what to do for defective modules.
6.3. General Aspects
It is to be highlighted that in case of assembling images into orthomosaics. The UAV must be equipped with a GPS/GNSS and an inertial measure unit, so as to ensure that captured images could be geotagged. On the other side, added extra cost by these elements must also be taken into consideration.
Combined flights are cost and time saving, imagery in both spectrums are acquired at once. However, required flight parameters from thermal and RGB flights are different. Therefore, in order to meet the first one’s requirements (path-crossed flights with 90% overlaps), extra unnecessary RGB data will be acquired, this extends the processing time that is a precious element in the case of large-scale plants. In this case, possible solutions depend on available material. Separate flights are a solution, and implementing an option in planning software so as thermal and RGB images could be taken at proportional frequencies is also another possible one.
Resolution is one of the most criticized points of thermal cameras. For cost reasons, this latter is often low compared to RGB ones. This creates a sort of imbalance between both spectrums making it impossible to perform flights with similar acquisition parameters. High resolutions give an abundance of present information in taken images. This reduces the number of images to take and values of overlaps to adopt. Moreover, it facilitates the execution of processing algorithms and gives in the end more satisfying orthomosaics allowing better inspections. However, defects’ detection and identification remain dependent essentially on the ground sampling distance. Small values allow the detection of more defects, whereas larger ones make it more difficult as most of the defects occur at a millimetric or centimetric scale. On the other side, the atmospheric column between inspected modules and the camera always hinders the exact evaluation of modules’ true surface temperature.
One of the most important issues in PV plants inspection, especially for large-scale plants, is precise georeferencing of detected failures. In our work, we have used GCPs. For one single inspection, this solution is not cost-effective as it consumes time and involves additional human intervention in the field, but in the long term, the cost is amortized. Indeed, for a large-scale plant, of which periodic inspections will have to be regularly performed. GCPs (which will help to obtain a survey grade accuracy) will have to be established once in a lifetime. Moreover, as the algorithm that we used for processing relies on Structure from Motion and MultiView Stereo, the number of GCPs to be created is independent from the scale of the PV plant. This means that very large-scale plants can be inspected, with a centimeter accuracy, using only few GCPs. However, the use of GCP still cannot be as cost effective as the use of RTK surveys that directly provide the required precise geo-localization.
For thermal images georeferencing, using aluminum marks is advantageous. Aluminum has a low emissivity (between 0.04 and 0.09), this makes it appear as black in thermal spectrum and therefore facilitates its pointing.
The Albris is a valuable mapping and inspection tool. However, its thermal camera still needs some ameliorations. First, the thermal sensitivity should be ameliorated to about 0.05°C or better to detect slight temperature variations. Second, the thermal matrix resolution should also be augmented. This will allow a faster coverage of larger areas avoiding in parallel processing issues.
One of main Pix4D advantages when compared to other photogrammetry processing software available on the market is thermal images processing. However, in our experimental work, we were obliged to establish manually a calibration equation to convert pixels values to temperature one. Moreover, lens distortions values were missing in Albris’s included thermal camera model which should be corrected in oncoming software versions.
7. Final Conclusions and Recommendations
In the work presented within this paper, thermal and visual images with different acquisition parameters and conditions were used to inspect three PV installations. Present defects have been detected and validated. Various parameters’ influence on thermal images’ processing failures have been exposed, in addition, a methodology for hotspots’ automatic extraction has been proposed and validated. On the basis of obtained results, practical aspects of PV inspection have also been exposed and discussed.
Efficient aerial defects detection requires the use of high specifications airborne cameras, as most of defects occur at a centimetric or millimetric level, and that constitutes a challenge to actual available sensors. UAV have proved their value and efficiency in PV inspection. However, the use of UAV technology still cannot replace definitely conventional methods. The actual state of art appeals to a complementarity between the two in order to speed up the inspection procedure. A first level detection may be performed using UAV, and after, a human intervention may be done close to suspected modules in order to do a more precise inspection. For further development, we recommend:
- testing other processing software platforms such as InPHO UAS Master, Bentley ContextCapture, ERDAS Imagine UAV module, as well as PhotoMOD;
- performing tests with performant RGB and thermal cameras for large scale installations;
- using RTK surveys for precise geo-localization of present defects; and,
- exploring possibilities that may offer the cooperation of pixel based and object-oriented approaches in defects extraction and classification.
Author Contributions
Conceptualization, Y.Z. and A.E.; Formal analysis, I.S.; Funding acquisition, S.A.L.; Investigation, I.S.; Methodology, Y.Z., A.E. and I.S.; Project administration, I.S.; Software, Y.Z., A.E. and I.S.; Supervision, I.S. and S.A.L.; Validation, Y.Z., A.E. and I.S.; Visualization, Y.Z. and A.E.; Writing—original draft, Y.Z. and I.S.; Writing—review & editing, I.S.
Funding
This research received no external funding.
Acknowledgments
We would like to gratefully thank the enterprise ETAFAT (Casablanca, Morocco) for providing us the drone Albris, following the evolution of this work as well as coordinating with SenseFly in order to provide us external datasets. We acknowledge also Rabat National Mining School for allowing us to conduct our field experiments on their PV installations.
Conflicts of Interest
The authors declare no conflict of interest.
References
- Heinberg, R.; Fridley, D. Our Renewable Future: Laying the Path for One Hundred Percent Clean Energy; Island Press/Center for Resource Economics: Washington, DC, USA, 2016; pp. 1–15, ISBN-13: 978-1-61091-780-3. [Google Scholar]
- Lynn, P.A. Electricity from Sunlight: An Introduction to Photovoltaics; Wiley: Singapore, 2010; ISBN 978-0-470-74560-1. [Google Scholar]
- Sawin, J.L.; Seyboth, K.; Sverrisson, F. Renewables 2018 Global Status Report; Renew. Energy Policy Network 21th Century: Paris, France, 2016. [Google Scholar]
- Ferrara, C.; Philipp, D. Why do PV modules fail? Energy Procedia 2011, 15, 379–387. [Google Scholar] [CrossRef]
- Labouret, A.; Villoz, M. Énergie Solaire Photovoltaïque, 5th ed.; Dunod: Paris, France, 2010; ISBN 978-2-10-055598-7. [Google Scholar]
- Madeti, S.R.; Singh, S.N. Monitoring system for photovoltaic plants: A review. Renew. Sustain. Energy Rev. 2016, 67, 1180–1207. [Google Scholar] [CrossRef]
- Peled, A.; Appelbaum, J. Minimizing the current mismatch resulting from different locations of solar cells within a PV module by proposing new interconnections. Solar Energy 2016, 135, 840–847. [Google Scholar] [CrossRef]
- Köntges, M.; Kurtz, S.; Packard, C.; Jahn, U.; Berger, K.; Kato, K.; Friesen, T.; Liu, H.; Iseghem, M. Review of Failures of Photovoltaic Modules; IEA-PVPS Report; International Energy Agency: Paris, France, 2014; ISBN 978-3-906042-16-9. [Google Scholar]
- Forniés, E.; Naranjo, F.; Mazo, M.; Ruiz, F. The influence of mismatch of solar cells on relative power loss of photovoltaic modules. Solar Energy 2013, 97, 39–47. [Google Scholar] [CrossRef]
- Silvestre, S.; Boronat, A.; Chouder, A. Study of bypass diodes configuration on PV modules. Applied Energy 2009, 86, 1632–1640. [Google Scholar] [CrossRef]
- Wang, Y.; Itako, K.; Kudoh, T.; Koh, K.; Ge, Q. Voltage-based hot-spot detection method for photovoltaic string using a projector. Energies 2017, 10, 230. [Google Scholar] [CrossRef]
- Kajari-Schröder, S.; Kunzea, I.; Köntges, M. Criticality of cracks in PV modules. Energy Procedia 2012, 27, 658–663. [Google Scholar] [CrossRef]
- Djordjevic, S.; Parlevliet, D.; Jennings, P. Detectable faults on recently installed solar modules in Western Australia. Renew. Energy 2013, 67, 1–7. [Google Scholar] [CrossRef]
- Lopez-Garcia, J.; Pozza, A.; Sample, T. Long-term soiling of silicon PV modules in a moderate subtropical climate. Solar Energy 2016, 130, 174–183. [Google Scholar] [CrossRef]
- Pedersen, H.; Strauss, J.; Selj, J. Effect of soiling on photovoltaic modules in Norway. Energy Procedia 2016, 92, 585–589. [Google Scholar] [CrossRef]
- Piliougine Rocha, M.; Carretero Rubio, J.E.; Sidrach-de-Cardona, M.; Montiel, D.; Sánchez-Friera, P. Comparative analysis of the dust losses in photovoltaic modules with different cover glasses. In Proceedings of the 23rd European Photovoltaic Solar Energy Conference and Exhibition, Valencia, Spain, 1–5 September 2008; pp. 2698–2700. [Google Scholar] [CrossRef]
- Mani, M.; Pillai, R. Impact of dust on solar photovoltaic (PV) performance: Research status, challenges and recommendations. Renew. Sustain. Energy Rev. 2010, 14, 3124–3131. [Google Scholar] [CrossRef]
- Abideen Afridi, M.; Arbab, M.; Bilal, M.; Ullah, M.; Ullah, N. Determining the effect of soiling and dirt particles at various tilt angles of photovoltaic modules. Int. J. Eng. Works 2017, 4, 143–146. [Google Scholar]
- Sinha, A.; Sastry, O.S.; Gupta, R. Detection and characterization of delamination in PV modules by active infrared thermography. Nondestruct. Test. Eval. 2016, 31, 1–16. [Google Scholar] [CrossRef]
- Meyer, S.; Richter, S.; Timmel, S.; Gläser, M.; Weerner, M.; Swatek, S.; Hagendorf, C. Snail trails: Root cause analysis and test procedures. Energy Procedia 2013, 38, 498–505. [Google Scholar] [CrossRef]
- Quarter, P.B.; Grimaccia, F.; Leva, S.; Musseta, M.; Aghaei, M. Light Unmanned Aerial Vehicles (UAVs) for Cooperative Inspection of PV Plants. IEEE J. Photov. 2014, 4, 1107–1113. [Google Scholar] [CrossRef]
- Bun, L. Détection et Localisation de Défauts Dans un Système Photovoltaïque. Ph.D. Thesis, Université de Grenoble, Grenoble, France, 2011. [Google Scholar]
- Mayfield, R. Photovoltaic Design & Installation for Dummies; Wiley: Hoboken, NJ, USA, 2010; ISBN 978-0-470-59893-1. [Google Scholar]
- Tsanakas, A.; Long, D.H.; Al-Shakarchi, F. Advanced inspection of photovoltaic installations by aerial triangulation and terrestrial georeferencing of thermal/visual imagery. Renew. Energy 2016, 102, 224–233. [Google Scholar] [CrossRef]
- Mansouri, A.; Zettl, M.; Mayer, O.; Lynass, M.; Bucher, M.; Stern, O.; Burhenne, R. Defect Detection in Photovoltaic Modules Using Electroluminescence Imaging. In Proceedings of the 27th European Photovoltaic Solar Energy Conference and Exhibition, Frankfurt, Germany, 24–28 September 2012; pp. 3374–3378. [Google Scholar] [CrossRef]
- Ebner, R.; Zamini, M.; Újvári, G. Defect analysis in different photovoltaic modules using electroluminescence (EL) and infrared thermography (IR). In Proceedings of the 25th European Photovoltaic Solar Energy Conference and Exhibition/5th World Conference on Photovoltaic Energy Conversion, Valencia, Spain, 6 September 2010; pp. 333–336. [Google Scholar] [CrossRef]
- Minkina, W.; Dudzik, S. Infrared Thermography: Errors and Uncertainties; Wiley: Hoboken, NJ, USA, 2009; ISBN 978-0-470-74718-6. [Google Scholar]
- Brébec, J.; Desmarais, T.; Favier, A.; Ménétrier, M.; Noël, B.; Noël, R.; Orsini, C.; Vanhaecke, J. Thermodynamique 2ème Année MP-MP* PC-PC* PSI-PSI* PT-PT*; Hachette: Paris, France, 2012; ISBN-10: 201145641X. [Google Scholar]
- Modest, M.F. Radiative Heat Transfer; Elsevier: Amsterdam, The Netherlands, 2013; ISBN-13: 978-0123869449/ISBN-10: 0123869447. [Google Scholar]
- Williams, T.L. Thermal Imaging Cameras: Characteristics and Performance; CRC Press: Boca Raton, FL, USA, 2009; ISBN 9781420071856. [Google Scholar]
- Tošer, P.; Bača, P.; Neoral, J. The Ways How to Measure the Characteristics of a Solar Panel. ECS Trans. 2014, 48, 297–302. [Google Scholar] [CrossRef]
- Prakash, R. Infrared Thermography; InTech: Rijeka, Croatia, 2012; p. 222. [Google Scholar]
- Qingju, T.; Jingmin, D.; Junyan, D.; Chunsheng, L.; Yuanlin, L.; Chunping, R. Quantitative Detection of Defects Based on Markov-PCA-BP Algorithm Using Pulsed Infrared Thermography Technology. Infrared Phys. Technol. 2016, 77, 144–148. [Google Scholar] [CrossRef]
- Coello, J.; Perez, L.; Parral, V.; Gomez, R. Implementation of Aerial Thermography Inspection of PV Modules in the O&M Activities in Large PV Plants. In Proceedings of the 32st European Photovoltaic Solar Energy Conference and Exhibition, Munich, Germany, 20–24 June 2016; pp. 1730–1735. [Google Scholar]
- Aghaei, M.; Dolara, A.; Leva, S.; Grimaccia, F. Image Resolution and Defects Detection in PV Inspection by Unmanned Technologies. In Proceedings of the IEEE Power and Energy Society General Meeting (PESGM), Boston, MA, USA, 17–21 July 2016; pp. 1–5. [Google Scholar] [CrossRef]
- Mayekar, P.; Kotmire, N.; Wagh, M.; Shinde, N. Review on the Thermographic Analysis of PV panels/system using the infrared thermal cameras. Int. J. Sci. Eng. Appl. Sci. 2016, 2, 135–139. [Google Scholar]
- Grimaccia, F.; Leva, S.; Niccolai, A. PV Plant Digital Mapping for Modules’ Defects Detection by Unmanned Aerial Vehicles. IET Renew. Power Gen. 2017. [Google Scholar] [CrossRef]
- Daliento, S.; Chouder, A.; Guerriero, P.; Massi Pavan, A.; Mellit, A.; Moeini, R.; Tricoli, P. Monitoring, Diagnosis, and Power Forecasting for Photovoltaic Fields: A Review. Int. J. Photoenergy 2017. [Google Scholar] [CrossRef]
- Kim, D.; Youn, J.; Kim, C. Automatic fault recognition of photovoltaic modules based on statistical analysis of UAV thermography. Int. Arch. Photogr. Remote Sens. Spat. Inf. Sci. 2017, 179–182. [Google Scholar] [CrossRef]
- Dotenco, S.; Dalsass, M.; Winkler, L.; Wurzner, T.; Brabec, C.; Maier, A.K.; Gallwitz, F. Automatic detection and analysis of photovoltaic modules in aerial infrared imagery. In Proceedings of the IEEE Winter Conference on Applications of Computer Vision (WACV), Lake Placid, NY, USA, 7–10 March 2016; pp. 1–9. [Google Scholar] [CrossRef]
- Muhammad, B.; Prasad, R.; Nisi, M.; Manella, A.; Gagliarde, G.; Cianca, E.; Marenchino, D.; Angrisano, A.; Addabbo, P.; Ullo, S. Automating the Maintenance of Photovoltaic Power Plants; Global Wireless Summit (GWS): Cape Town, South Africa, 2017; pp. 6–11. [Google Scholar] [CrossRef]
- Leotta, G.; Pugliatti, P.M.; Di Stefano, A.; Aleo, F.; Bizzarri, F. Post processing technique for thermo-graphic images provided by drone inspections. In Proceedings of the 31st European Photovoltaic Solar Energy Conference and Exhibition (EU PVSEC ’15), Hamburg, Germany, 14–18 September 2015; pp. 1799–1803. [Google Scholar] [CrossRef]
- López-Fernández, L.; Lagüela, S.; Fernández, J.; González-Aguilera, D. Automatic Evaluation of Photovoltaic Power Stations from High-Density RGB-T 3D Point Clouds. Remote Sens. 2017, 9, 631. [Google Scholar] [CrossRef]
- Migan, G. Study of the Operating Temperature of a PV Module; Project Report; Lund University, Faculty of Engineering: Lund, Sweden, 2013. [Google Scholar]
© 2018 by the authors. Licensee MDPI, Basel, Switzerland. This article is an open access article distributed under the terms and conditions of the Creative Commons Attribution (CC BY) license (http://creativecommons.org/licenses/by/4.0/).