1. Introduction
In recent years, various new technologies have emerged making it possible to obtain accurate data quickly at a lower cost in the field of archaeology. Firstly, the reliability of drones has rapidly improved, allowing archaeologists to obtain accurate images in variable weather conditions. The possibilities offered in the field of archaeology by this emergent, cutting-edge technology is now generating great interest. Reflecting this interest are recent scientific publications on the topic [
1,
2,
3,
4,
5,
6,
7,
8,
9,
10,
11] to cite some examples. Secondly, parallel to the drone market, various types of software, such as Agisoft PhotoScan [
12,
13] and Pix4D processes [
14], have improved mosaicing, orthorectification, image georeferencing and multispectral post-processing, allowing archaeologists to obtain a wide range of results such as accurate maps, 3D models or digital terrain and elevation models [
15].
Likewise, the evolution of trade sensors (cameras) adapted for drones, above all those related to the field of precision agriculture, today allow the use of devices with a high spatial and a wide spectral resolution. Thus, it is possible to place multispectral cameras on these platforms, covering visible, near-infrared and thermal [
6] wavelengths, similar to those provided by satellite imagery.
All these technological advances have been used in this project. Consequently, our aims have been to discriminate between the possibilities of identification of remains buried beneath flat cultivated fields with different drones and sensors. The purpose of this experiment was to determine which tools were most useful and obtained the best results in the visualization of buried archaeological remains.
These hidden archaeological remains can be revealed by means of the so-called vegetation marks or crop marks. The remote sensing in archaeological research is based on these marks [
16]. Just as Verhoeven and Vermeulen emphasize [
17] the crop marks are often the main focus of both aerial observers and image interpreters due to their potential to disclose very detailed morphological information about hidden features and structures, certainly in cereals such as wheat and barley, like we can see in this case of study.
The near-infrared [
18], multispectral and hyperspectral [
19] images can highlight crop marks in vegetated areas by exploiting the spectral information conveyed in reflected solar radiation. In recent years, different vegetation indices and several other image features have been used, with varying success, to improve the interpretation of remotely sensed images for archaeological research [
20,
21,
22]. In this study, we use some of this feature images for highlight the crop marks in La Caridad (Spain). The aim of this paper is to examine the potential use of different drones with different sensors. The method used for the comparison of the tools is based on direct visual inspection, as in traditional aerial archaeology.
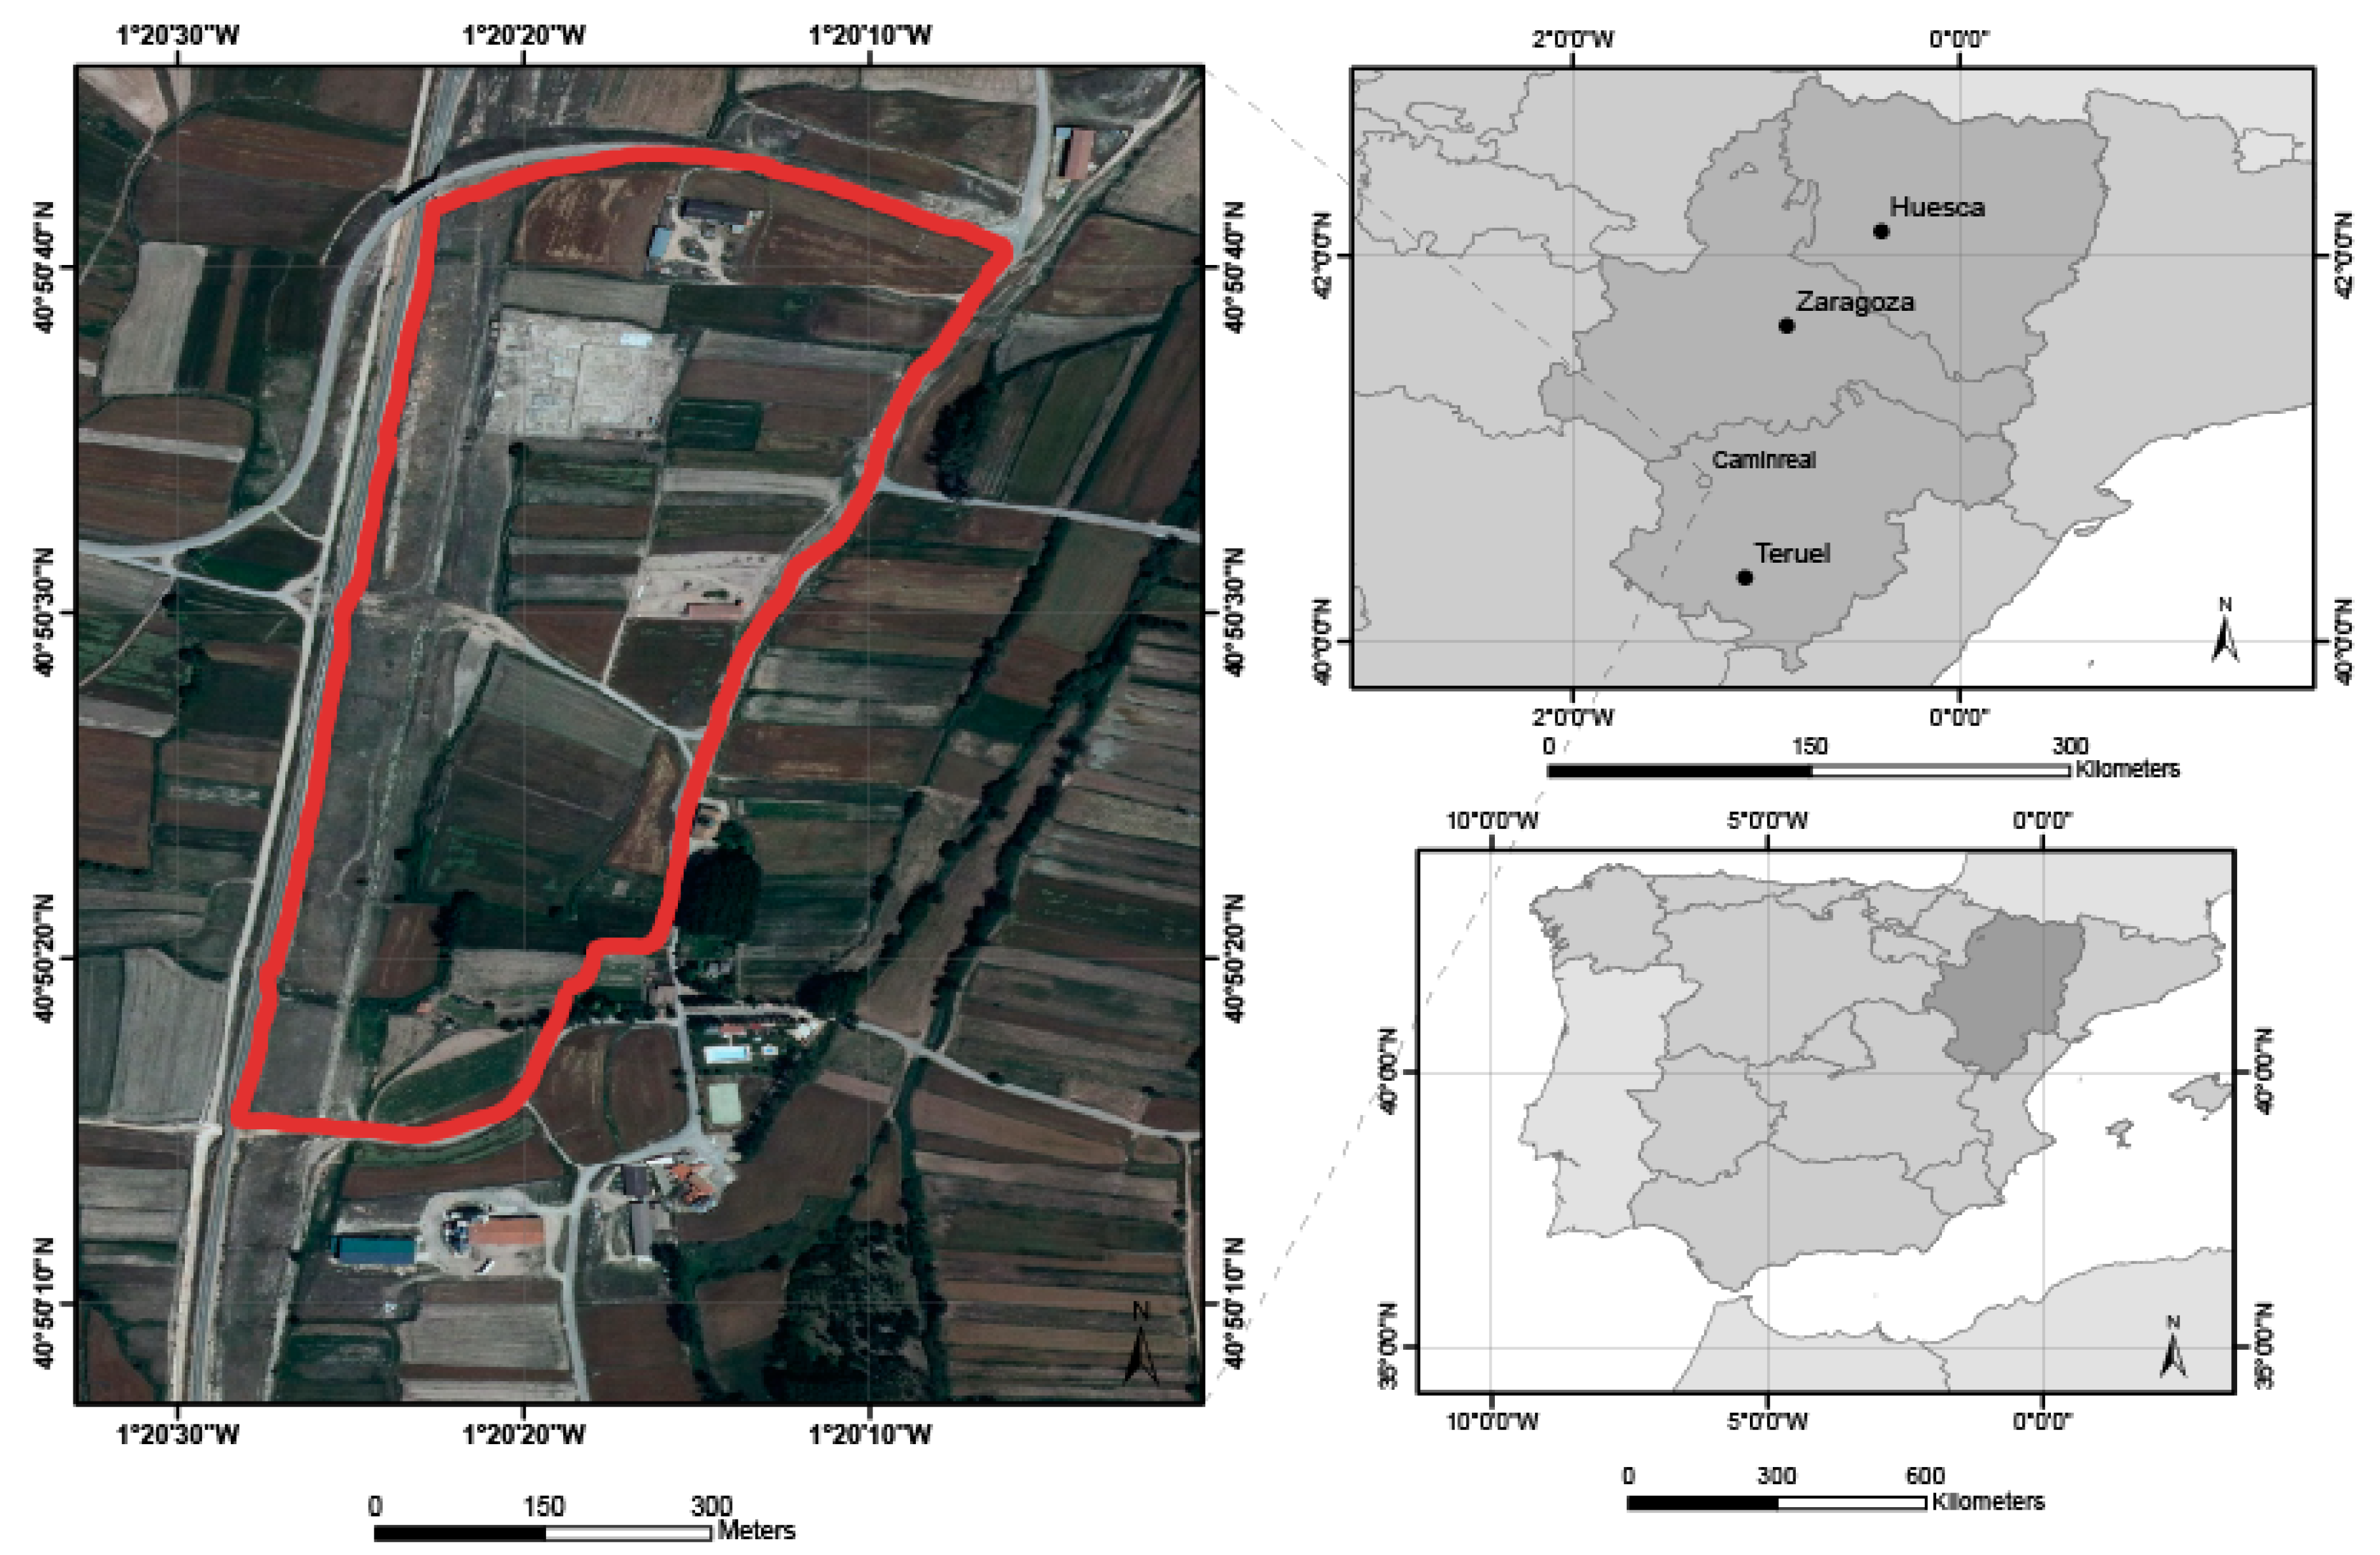
2. Study Area: La Caridad (Caminreal, Teruel, Spain)
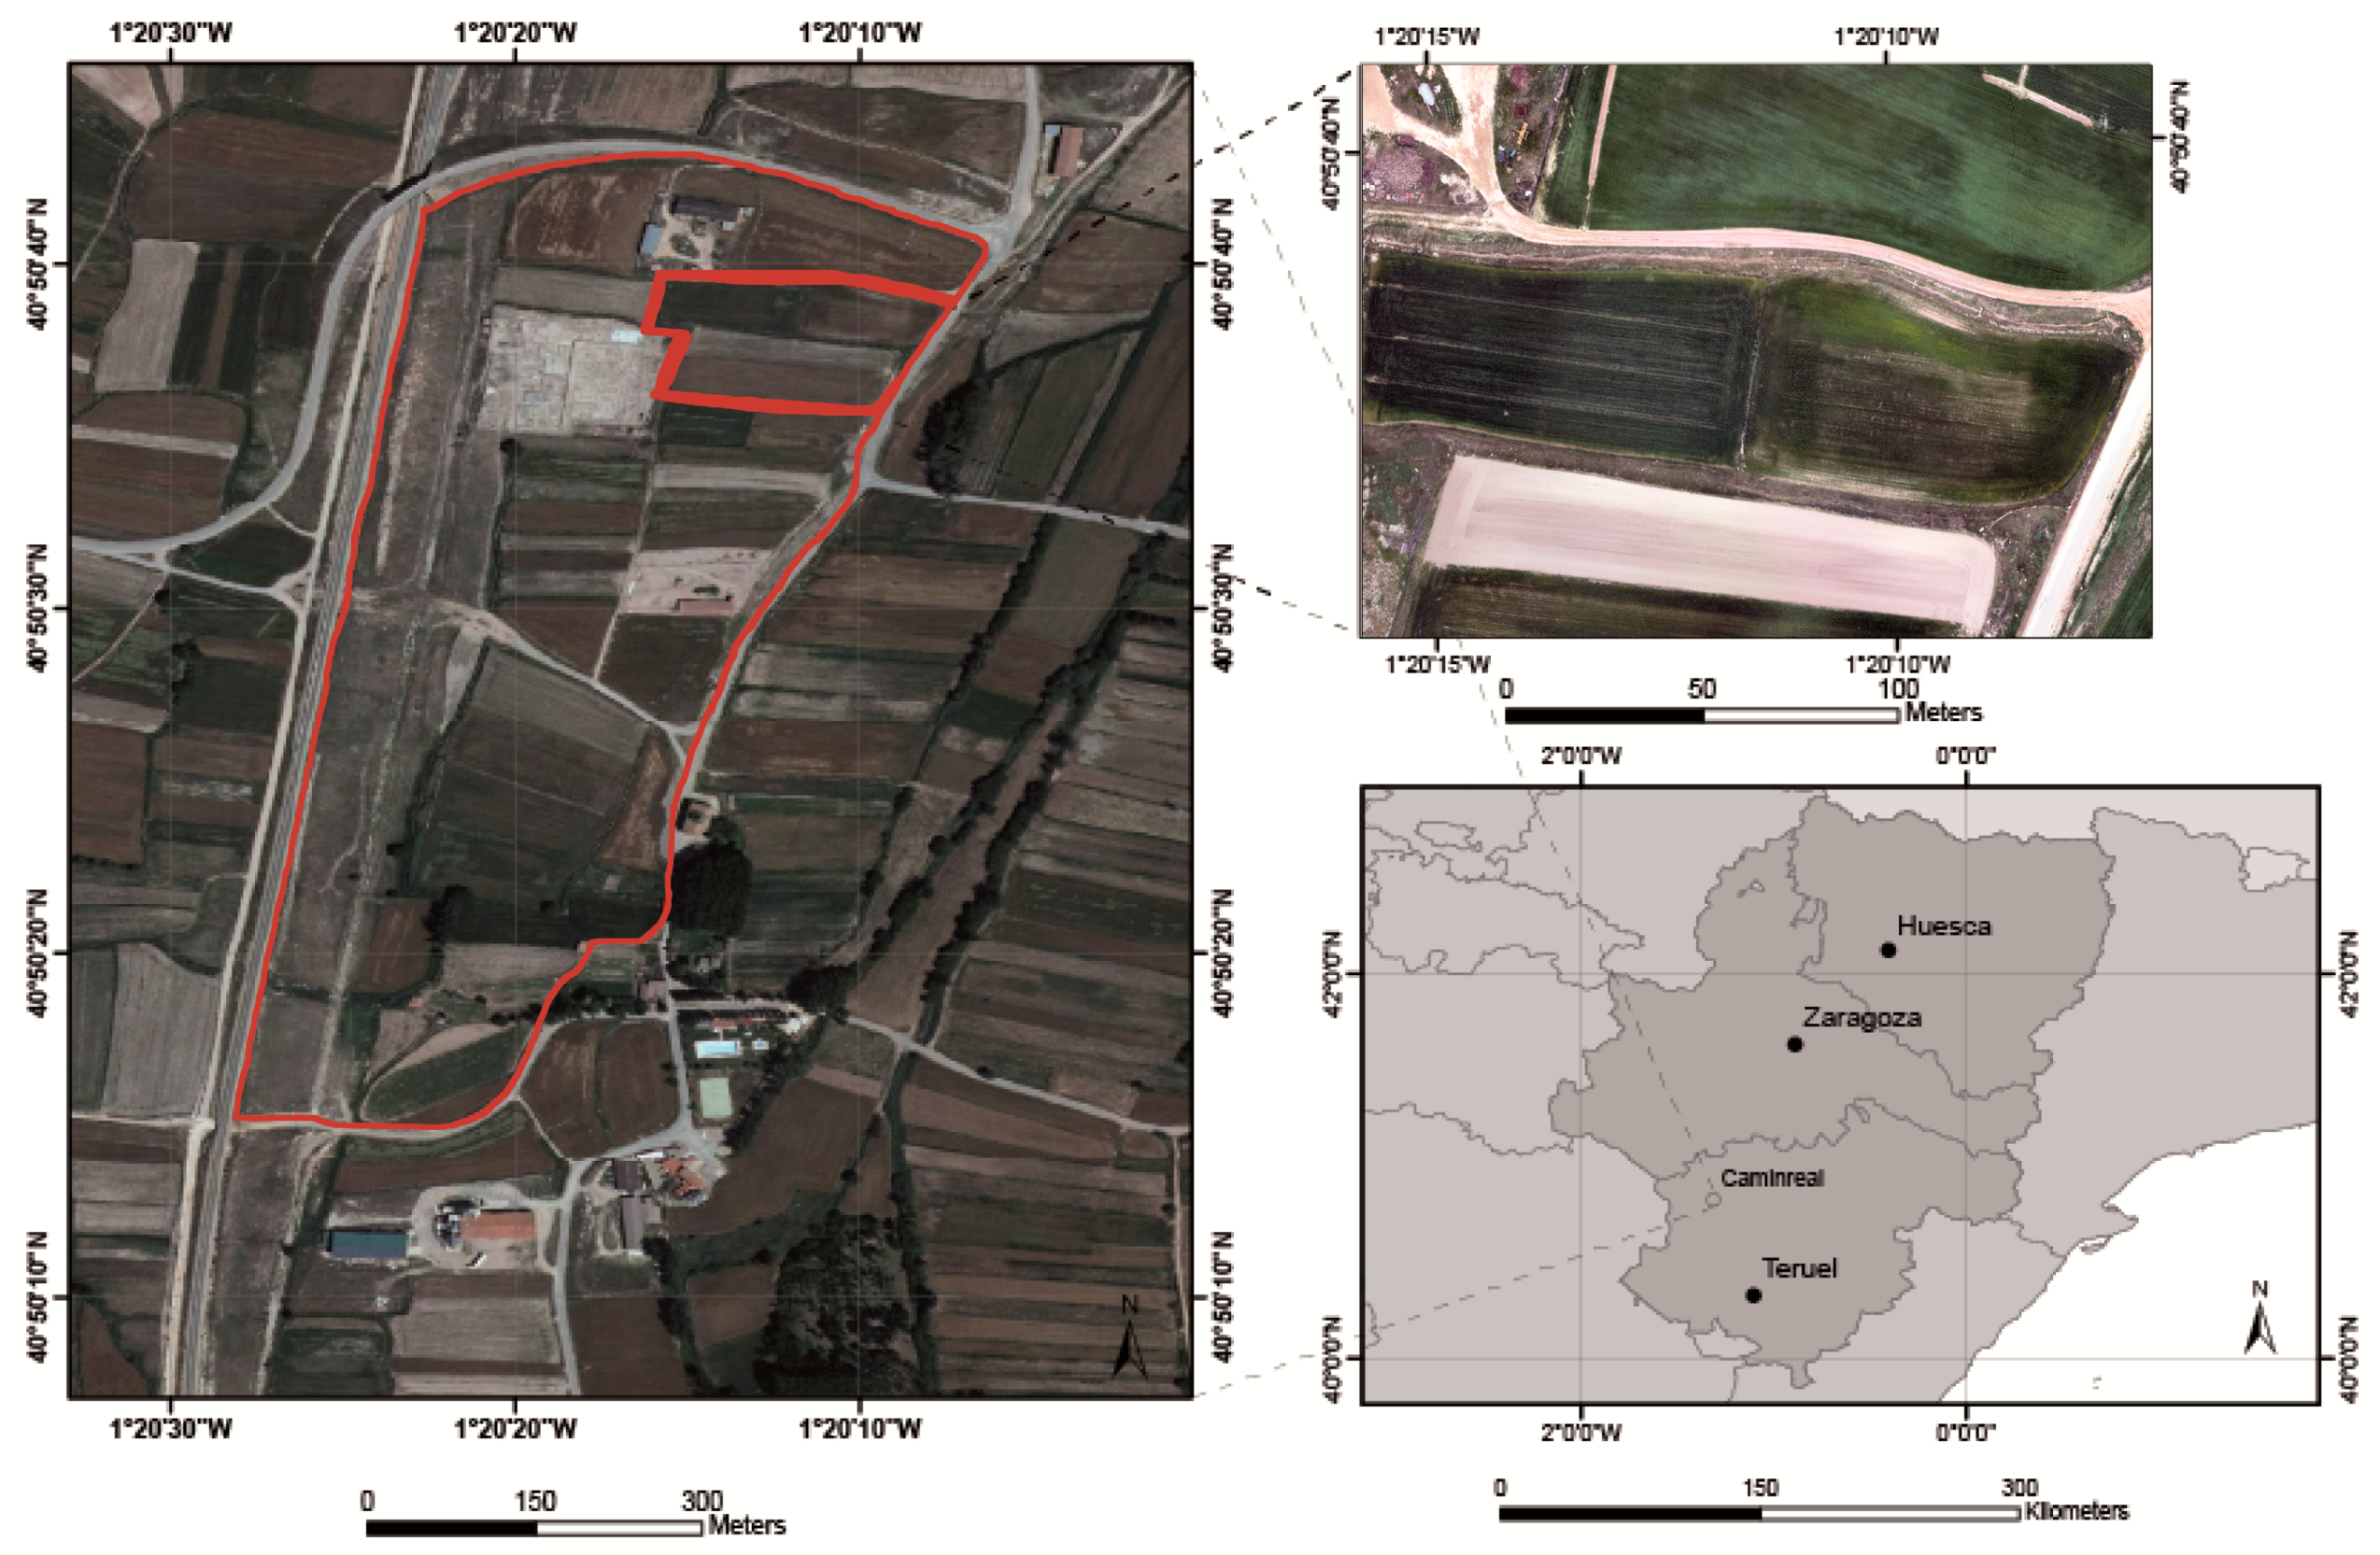
The Roman republican archaeological site of La Caridad is on the left bank of the river Jiloca and has a trapezoidal shape covering 12.5 hectares (
Figure 1). It is considered one of the most important Republican era settlements in the Ebro valley. The original name of the city is still unknown with different opinions about the by scholars [
23,
24,
25].
The absence of previous settlements and its topography allowed orthogonal urban planning, with
cardines and perpendicular
decumani of uniform width [
26]. The archaeological data confirms a single and very brief occupation between the 2nd century B.C. and the destruction of the city around 80–72 B.C. However, fragments of Hispanic
terra sigillata, found within the site, seem to indicate the continuation of part of the habitat to the 1st century AD. The core of the settlement was built ex novo. Thanks to the excavations by the Museum of Teruel, which opened in 1984, much is now known about their households, which contributes valuable information on domestic architecture in the Ebro valley in the Republican era. However, the most striking fact about this city is that, although the architecture is distinctly Roman, its inhabitants were locals, as confirmed by the material culture and inscriptions found. According to Vicente and Ezquerra [
25], analysis of the inscriptions denotes the presence of Celtiberians to a lesser extent than Iberians. They highlight the total absence of Latin inscriptions, with the exception of a potter’s stamp on a ceramic mortar. It is suggestive for Vicente and Ezquerra [
25]. They suggest that the city was created to house auxiliary veteran Celtiberians.
This case of study was chosen because La Caridad is the one of the oldest Roman cities of northern Hispania. In La Caridad, the Roman houses are well known by means of the excavations but the public part of the city, where the forum and temples should have been located, is still unknown.
A full study of the site has been carried out, in which different Roman houses have been documented (
Figure 2). Only the remains of structures can be seen in
Figure 3, which are probably related to public architectonic elements, maybe the forum or the temples. In fact, this knowledge has been very important by means of this investigation because this type of domestic construction is the only one currently known as a result of the different fieldwork seasons.
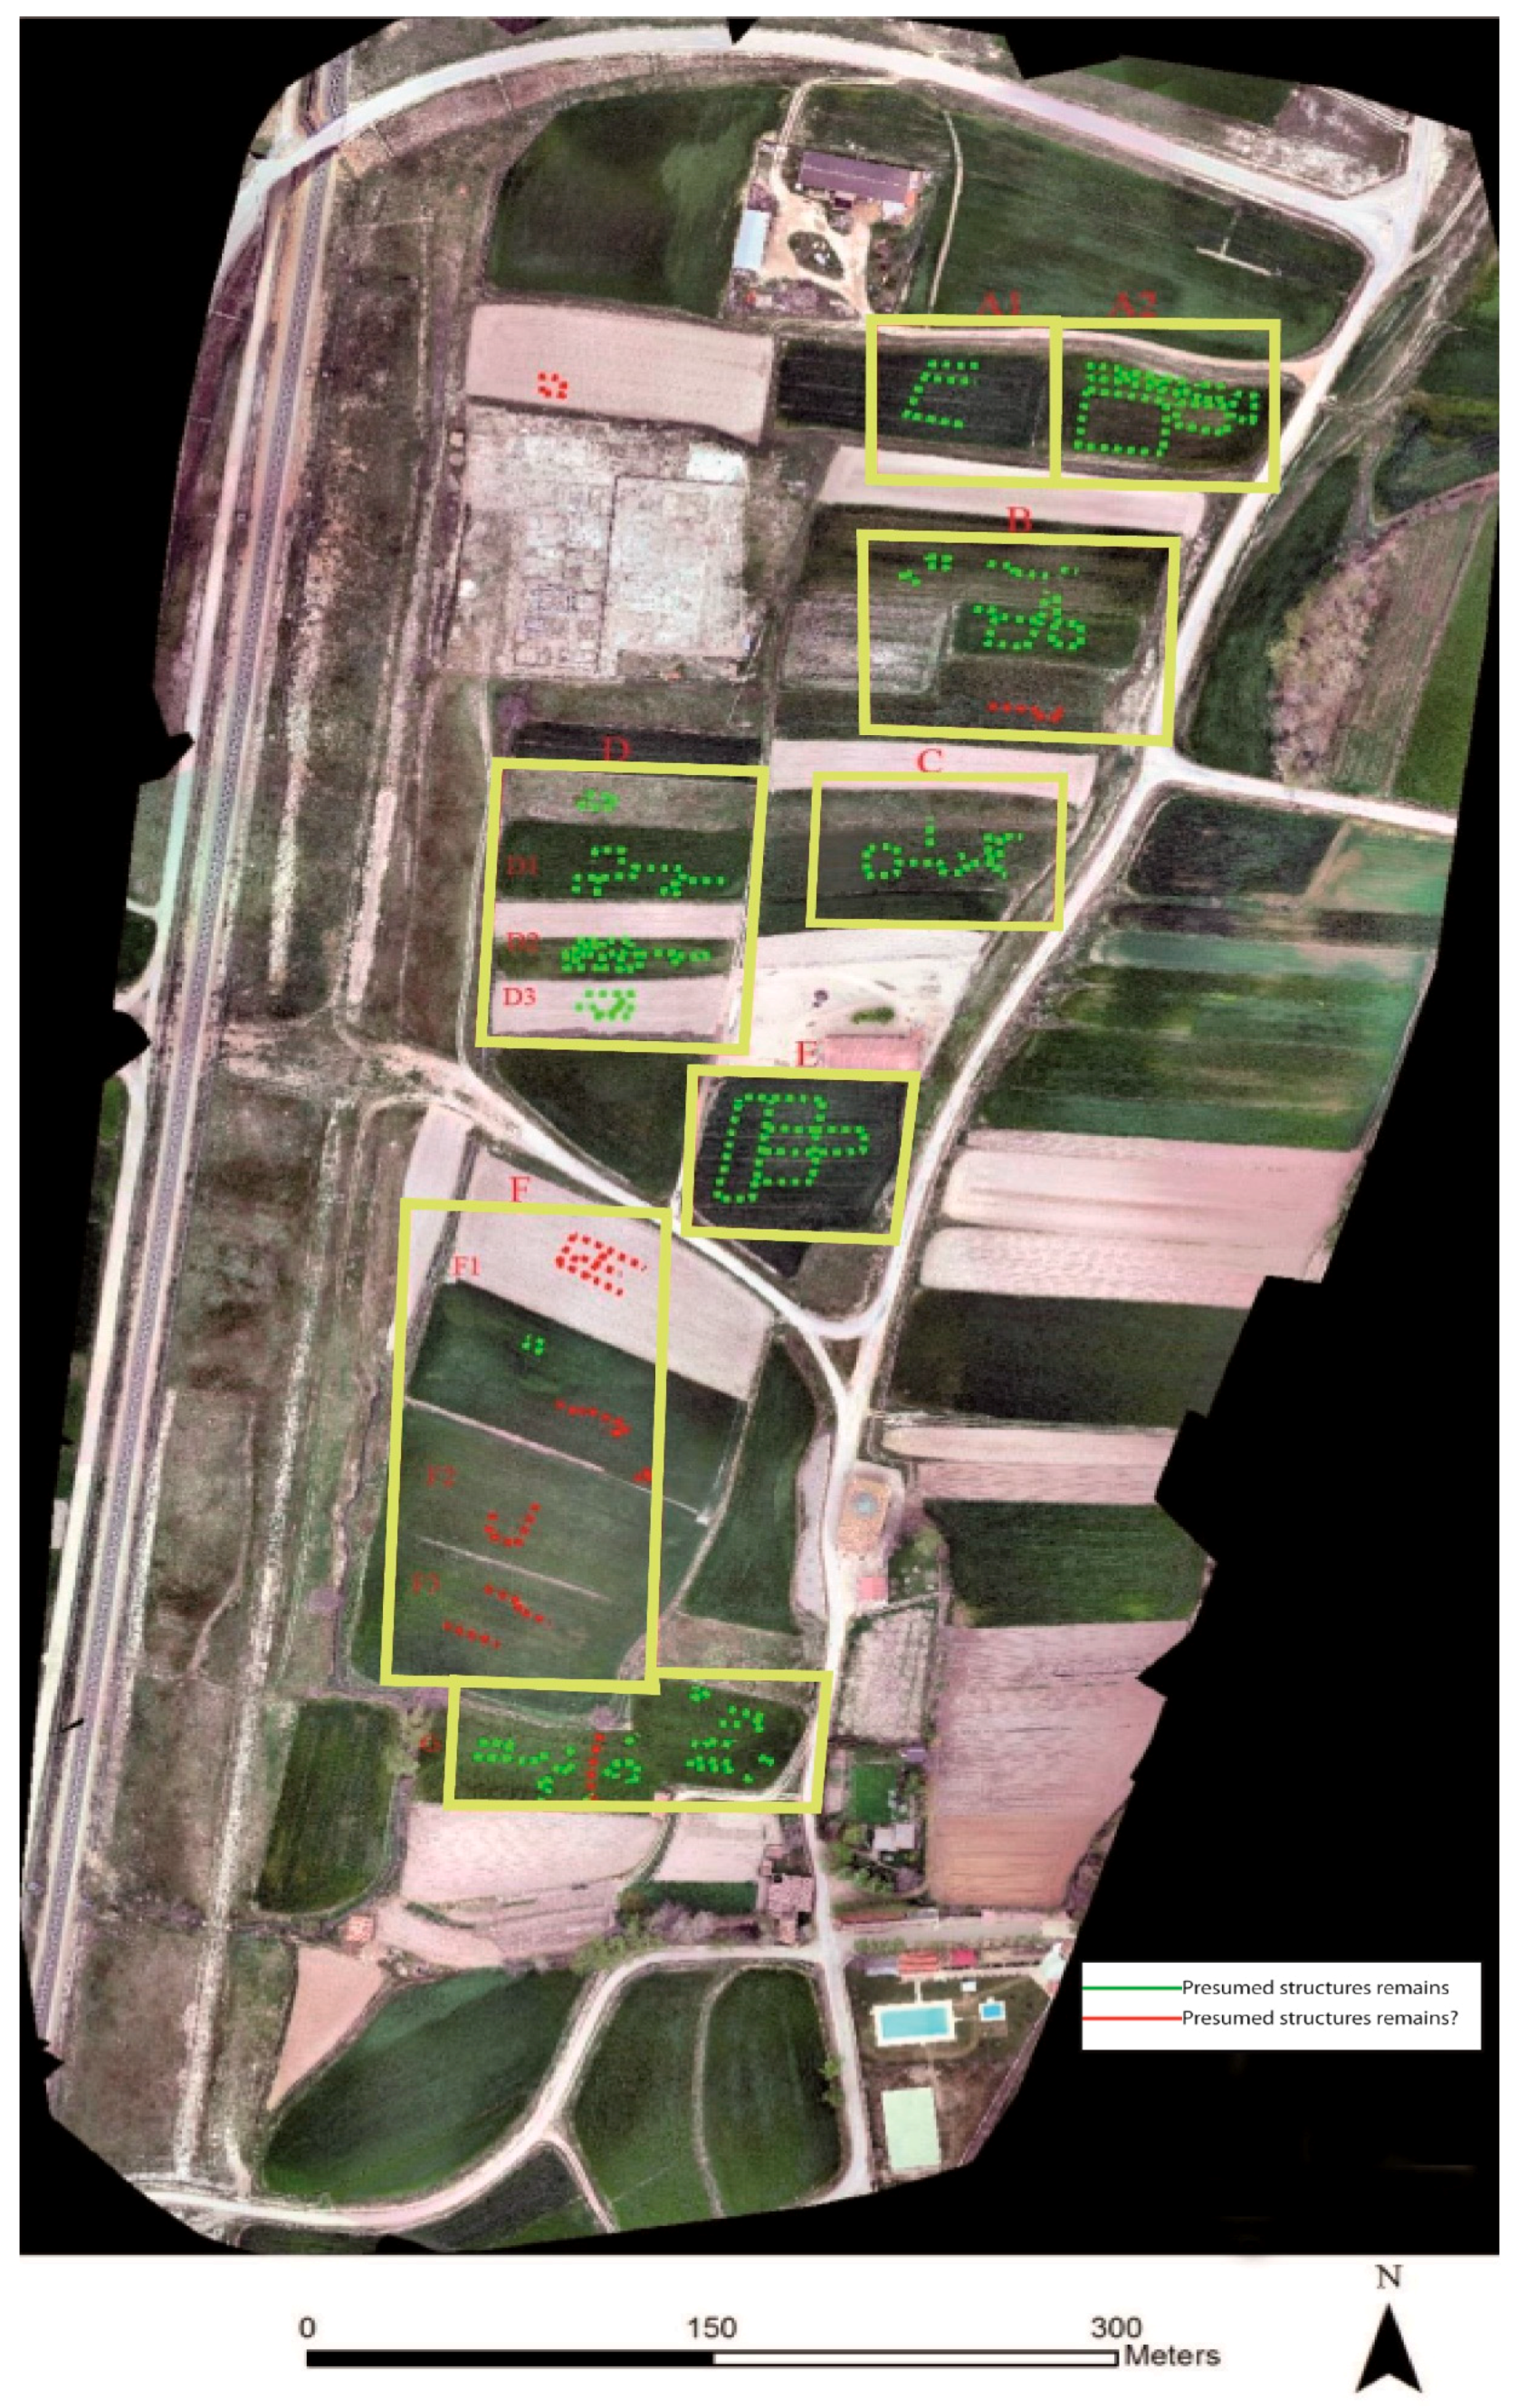
The cereal crop fields indicated in
Figure 4 were chosen to facilitate experimentation with different tools. These fields have been chosen because they were located in the suburban zone (outside of walls) of the old Roman city. Moreover, we know that the same cereal is grown every year (wheat).
The drones were used in different years and times of the year during different archaeological aerial campaigns. In the first campaign, the crops were in the beginning of the senescence but, in the second period, they were at the maximum vegetal vigor of the wheat. The method used for the comparison of the tools has been based on direct visual inspection, as in traditional aerial archaeology. In this sense, we consider that, in this visual interpretation method, that flights are carried out in different dates, do not alter the visual results. This multi-temporal data, with different phenological stages, can improve the visual enhance of the crop marks.
3. Materials
3.1. Drone Systems
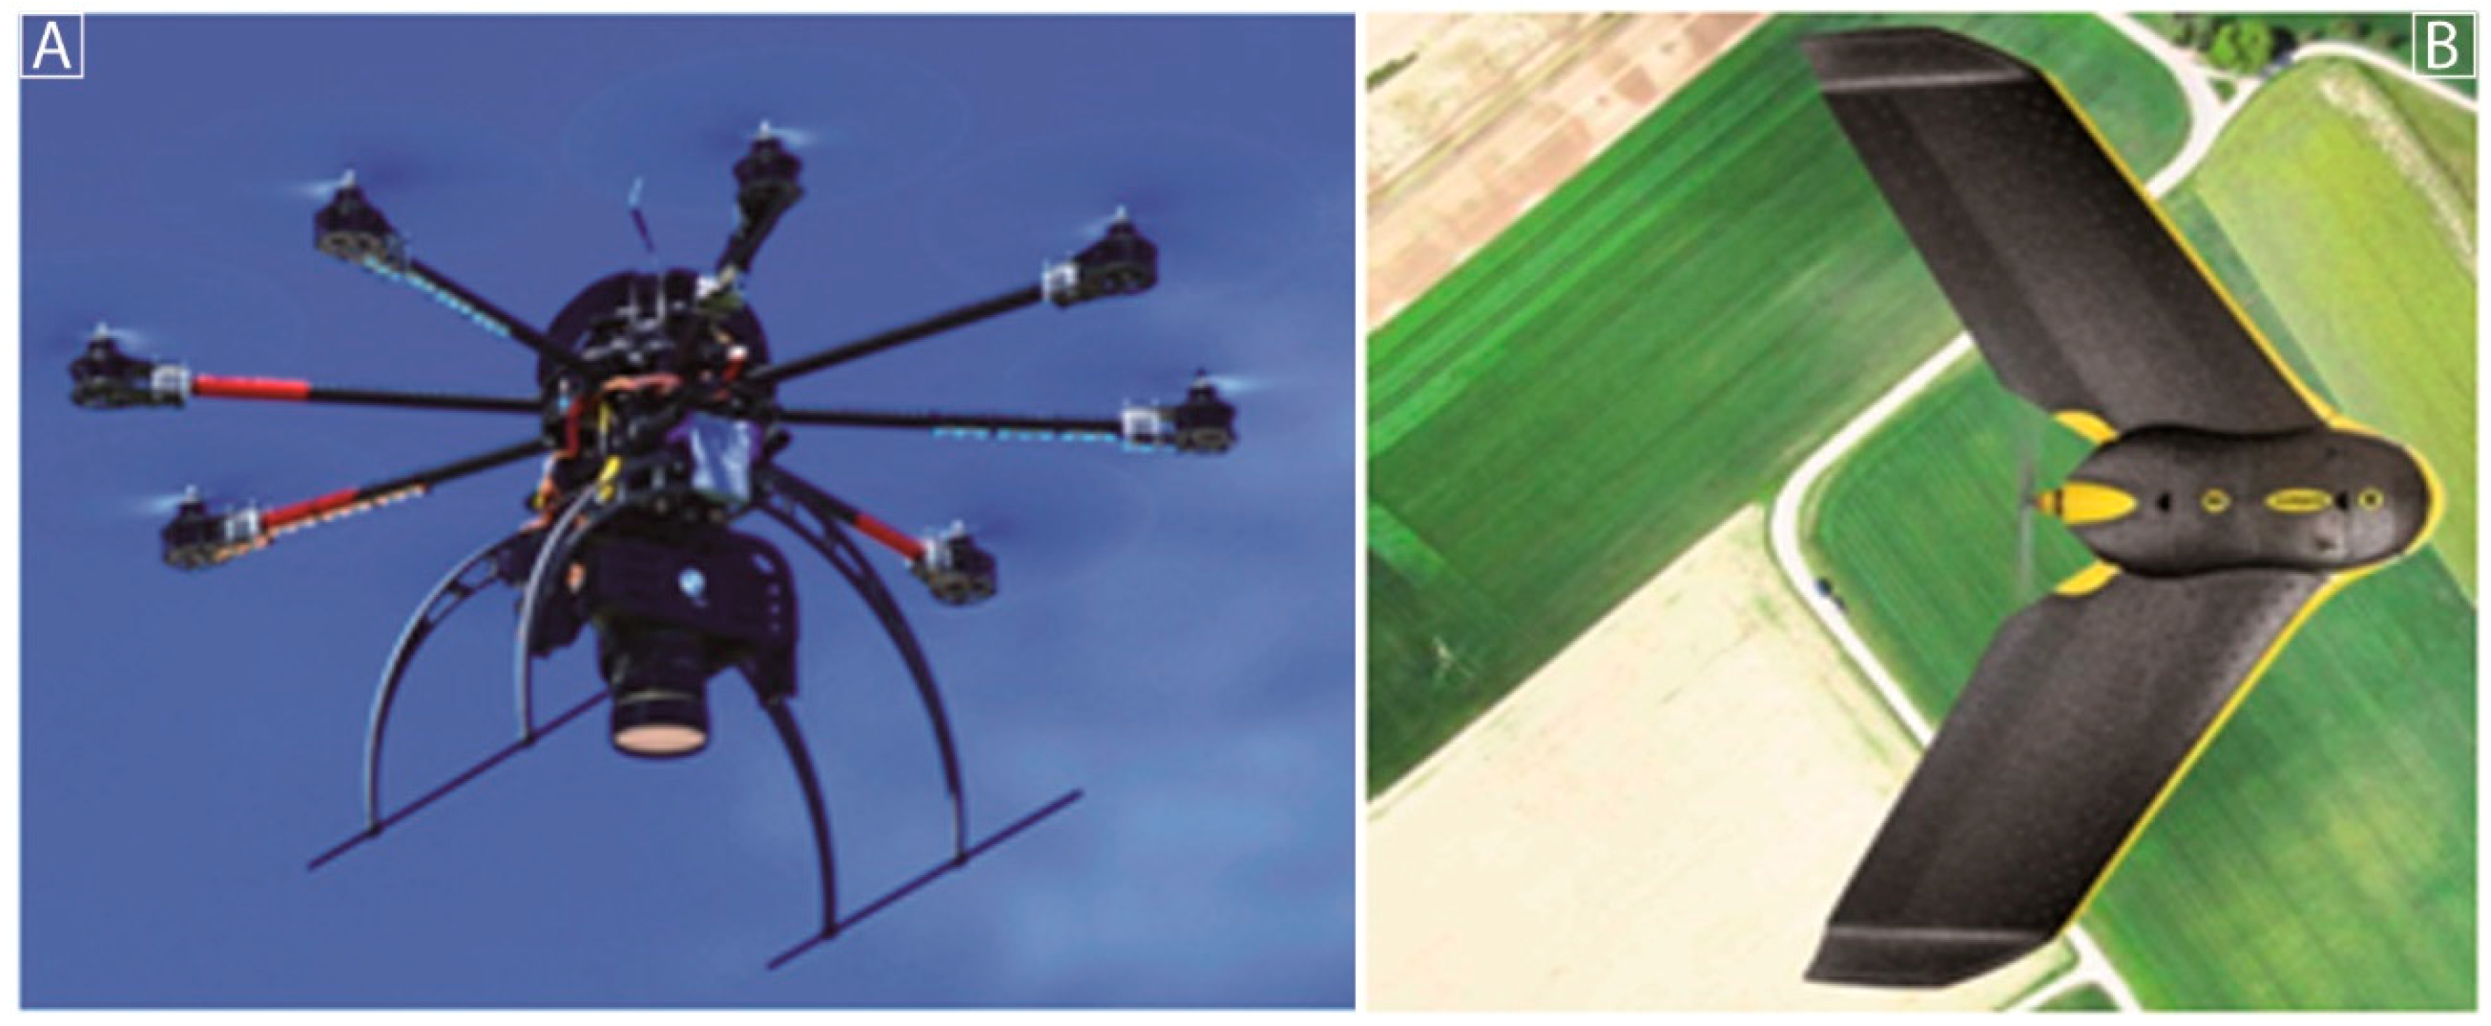
As shown in
Table 1, two different drones system were used: a Mikrokopter designed by Tecnitop SA together with the University of Zaragoza (Spain) and an eBee produced by SenseFly Company (Cheseaux-sur-Lausanne, Switzerland). Thus, in this study we have combined in-house manufacturing with commercial equipment. The former allows greater versatility in adapting different sensors whereas the latter, which comes equipped with irreplaceable cameras, provides a faster and more accurate workflow.
(a) In-house system equipment: The Tecnikopter
An 8-engined UAV with a folding carbon structure—manufactured in-house—was used in our project, with a Mikrokopter v. 2.02 ME flight control board. This system integration has been designed by Tecnitop SA together with the University of Zaragoza Department of Design and Manufacturing, which was enabled by the SME (Small and Medium Enterprise) Technology Transfer Program of the Aragonese Foundation for Research and Development. The project arose from the necessity of a platform capable of integrating particular sensors, in this case photogrammetric and multispectral cameras already available in the research group but which could not be used with commercial systems. In this case, the size of the area covered per flight is approximately five hectares. This system is operated with a free software application, called MK tools [
27].
(b) Commercial system equipment: The eBee
The eBee is a professional mapping drone manufactured by SenseFly Company (Cheseaux-sur-Lausanne, Switzerland)
https://www.sensefly.com/. It is a fully autonomous drone that can capture high-resolution aerial photos and generate accurate orthomosaics. This flying wing is a very light UAV (700 g with the camera) and its wingspan is 96 cm (
Figure 5). It has an on-board artificial intelligence system, which analyzes data from an Inertial Measurement Unit (IMU) and an on-board GPS to optimize every aspect of its flight. The main advantage of this flying wing compared to the Tecnikopter is the size of the area covered per flight. However, the wind speed has to be lower than 40 km/h. A lithium polymer battery provides at least 50 min of continuous operation. The flight is operated with the eMotion
® software, provided with the eBee. This software allows the flight to be planned before the mission and interaction with the drone during the flight. All the parameters, such as the height of the flight, the overlap between the images or the images’ spatial resolution, are user-specified before each flight [
28].
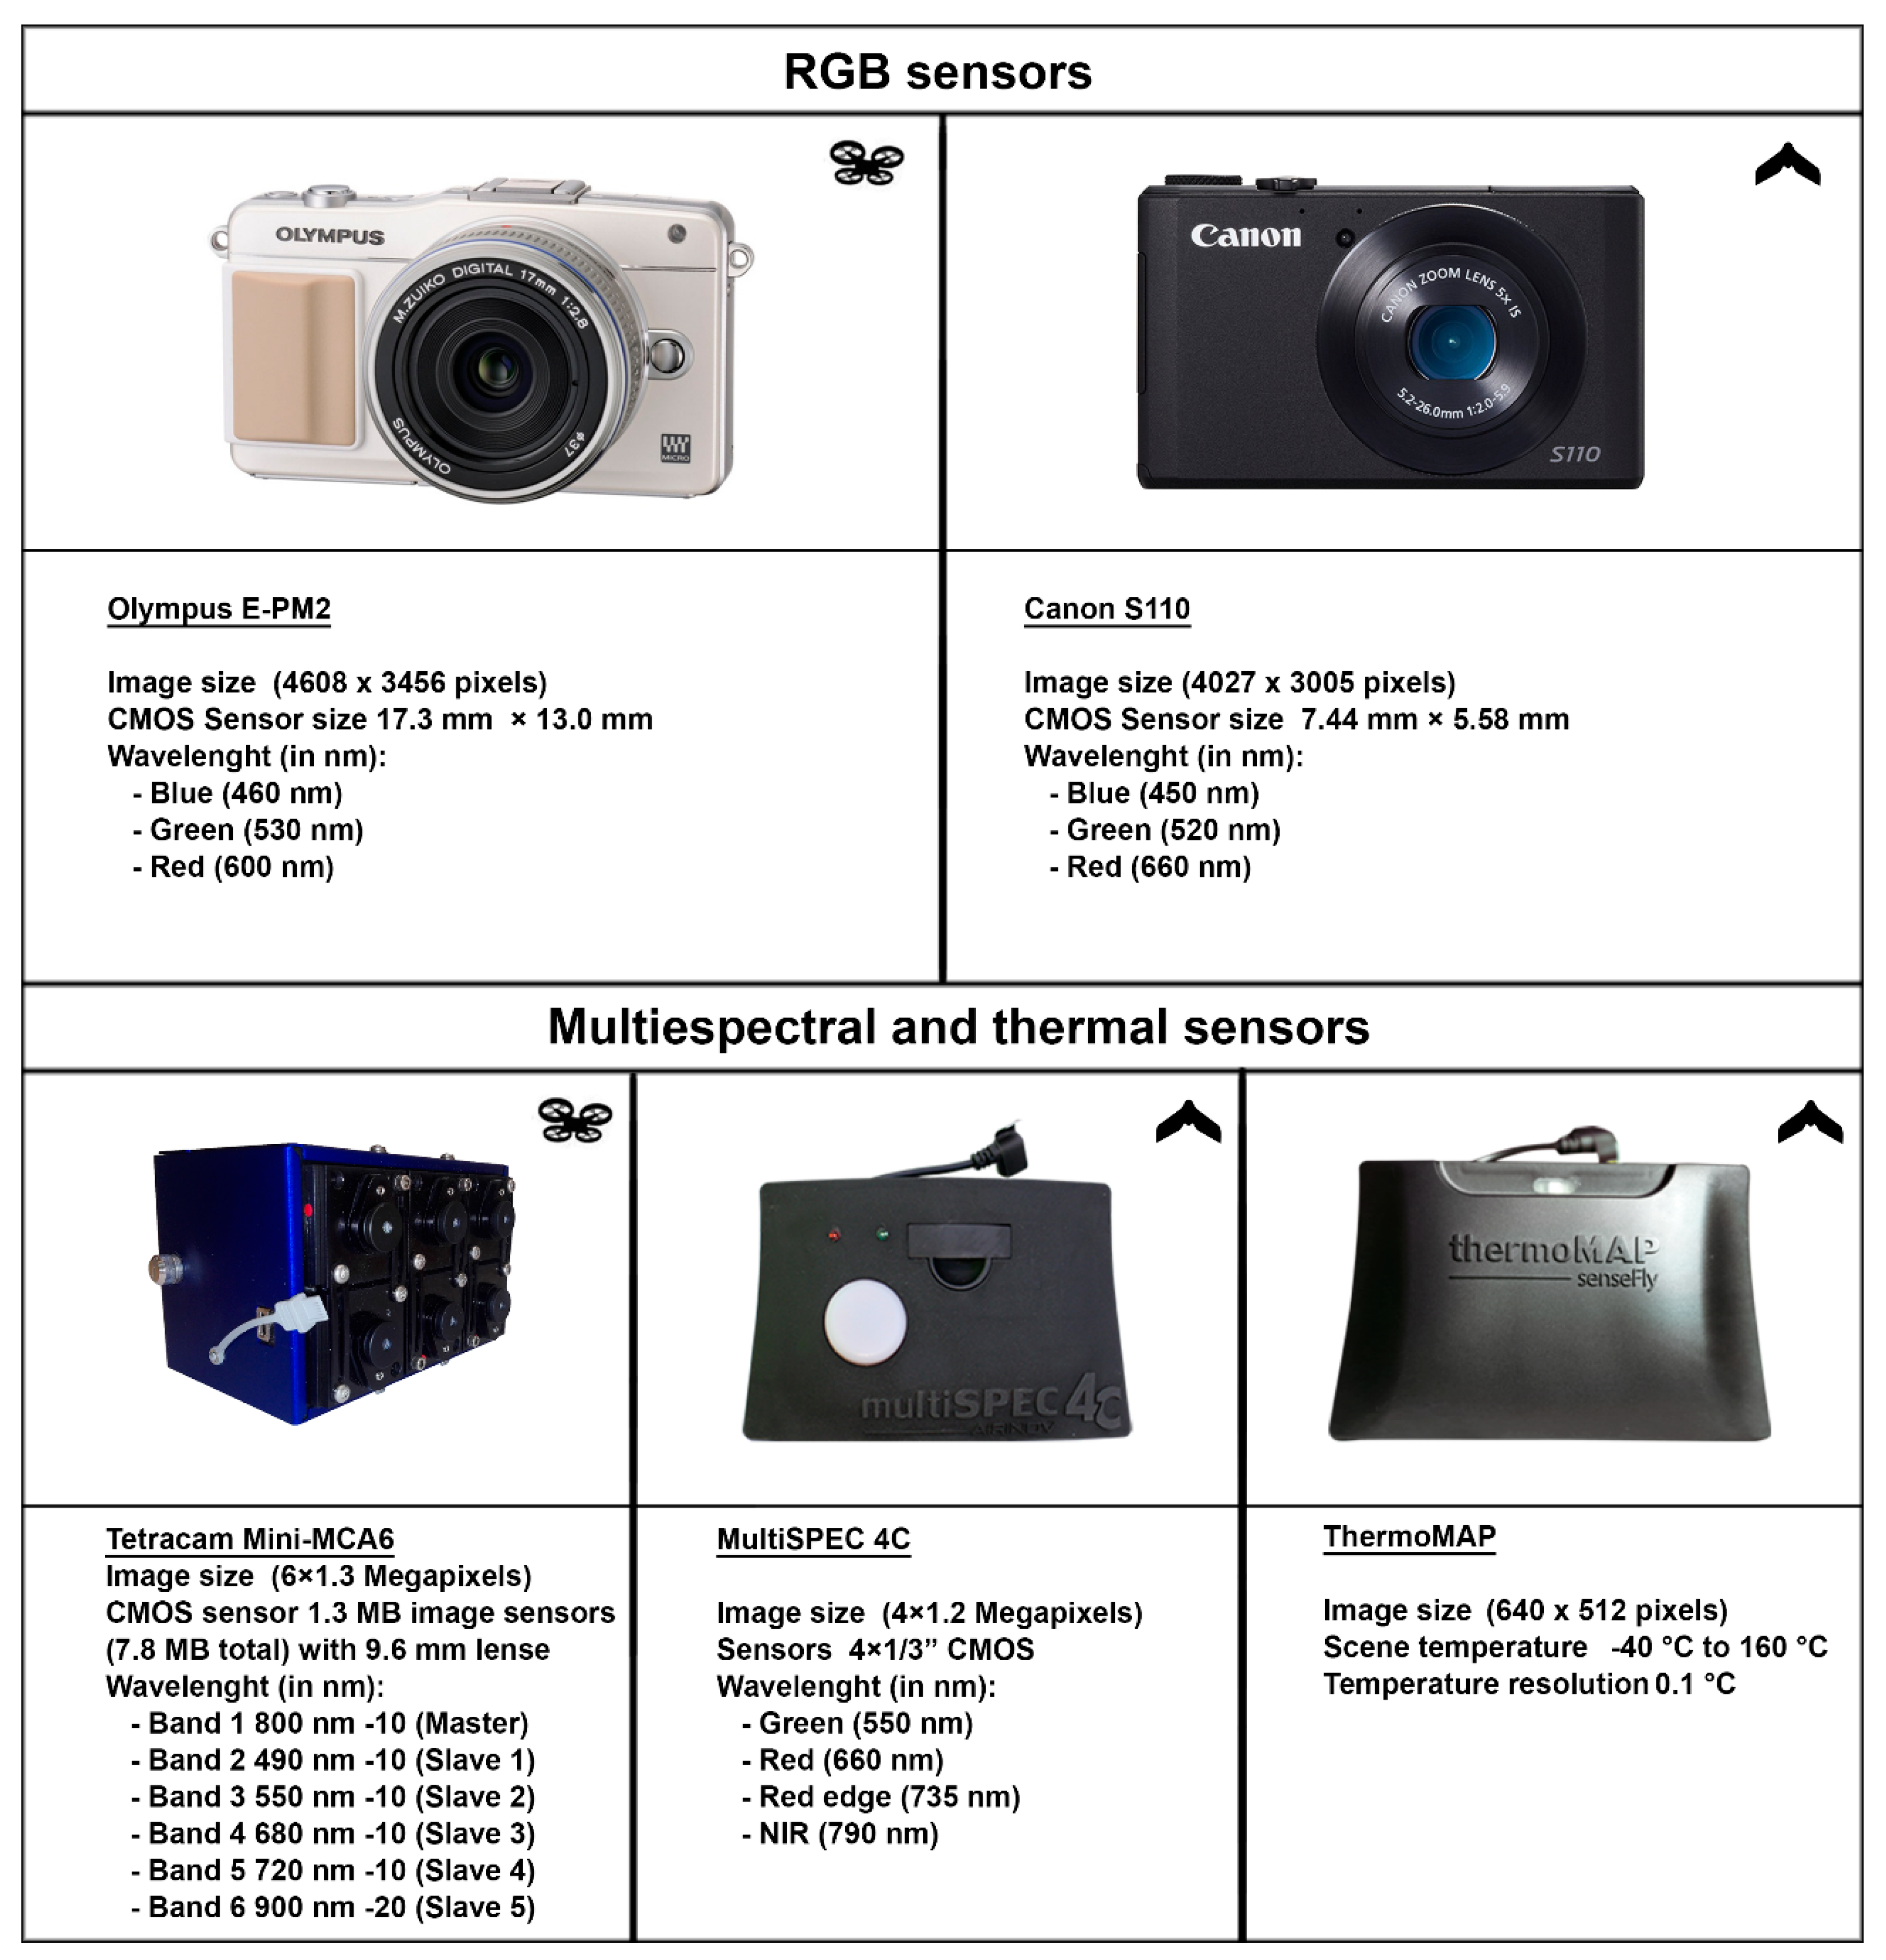
3.2. Drone Sensors
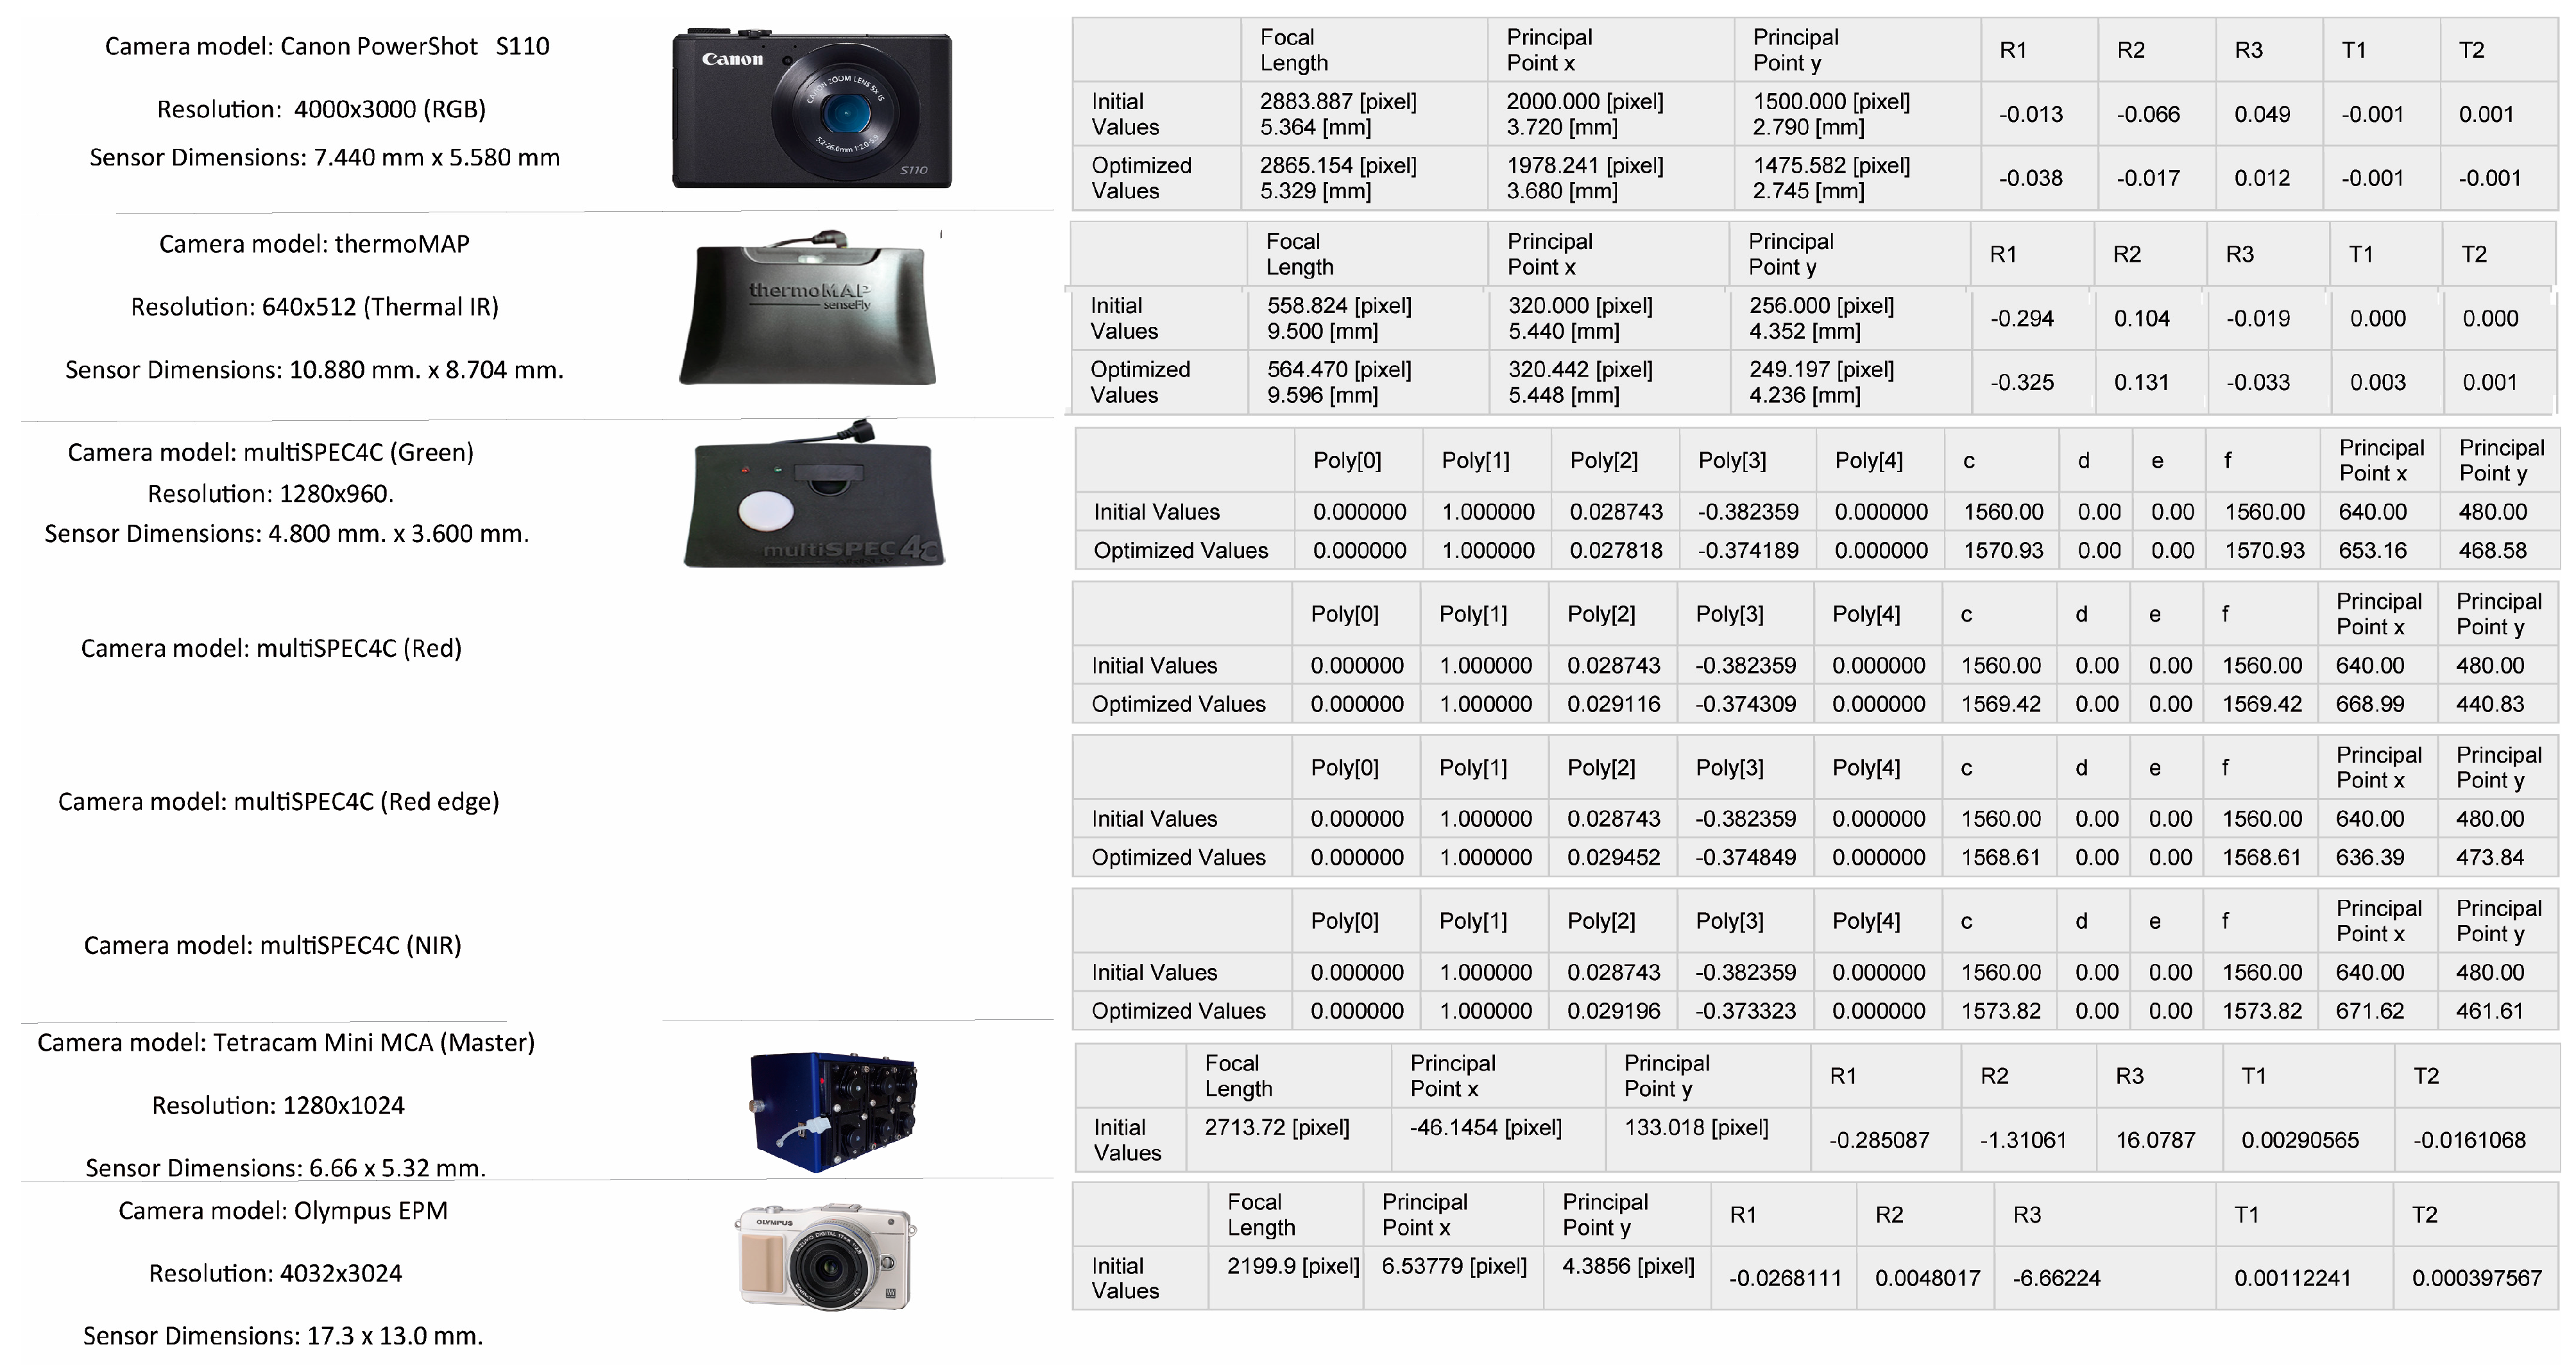
Five drone sensors were tested (
Figure 6) and compared in terms of their ability to identify buried remains in archaeological settlements. The sensors have different spectral ranges and spatial resolution.
Table 2 lists their relevant properties.
(a) E-PM2
To capture visible wavelengths with the TecniKopter, an OLYMPUS E-PM2—a micro four-thirds compact camera with a 16-megapixel Live MOS sensor (max. resolution 17.2 megapixels) and TruePic VI processor—was used. This camera has a primary color (RGB) filter known as a
Bayer filter [
29,
30].
(b) MINI-MCA 6 Tetracam
The Tetracam MINI-MCA is a six-band multispectral camera that can acquire imagery in six discrete wavebands suitable to its performance, size and weight. It has six channels corresponding to different filters with different wavelengths. The system works with a master camera that is responsible for synchronizing the rest of the cameras (slaves), calculating exposure and GPS synchronization for the georeferenced information in each image. Each camera has its own filter (Andover spectroscopic) with a bandwidth between 10 and 20 nm, resulting in a wavelength that spans from 490 to 940 nm.
(c) S110 RGB
The commercial eBee system uses the CANON Powershot ELPH110 HS RGB camera, with a resolution of 16.1 Mpixel, to acquire RGB. Its focal length ranges from 4.3 mm to 21.5 mm, which for a flight height of 150 m, for example, yields a ground sampling distance of 4.69 cm.
(d) MultiSPEC 4C eBee
The multiSPEC 4C is a cutting-edge sensor unit developed by Airinov’s agronomy specialists and customized for the eBee Ag. It contains four separate 1.2 MP sensors that are controlled by the eBee Ag’s autopilot. These acquire data across four highly precise bands, plus each sensor features a global shutter for sharp, undistorted images.
The multiSPEC 4C provides image data across four highly precise bands—Green, Red, Red-edge and NIR—with no spectral overlap. In addition, its upward-facing irradiance sensor automatically compensates for sunlight variations, resulting in unparalleled reflectance measurement accuracy.
(e) thermoMAP
The thermoMAP is a professional camera payload that produces greyscale images and video with high pixel density and thermal resolution. Its temperature sensitivity range makes it ideal for a wide range of industrial applications such as solar panel inspection, site inspection, stockpile hotspot detection and agricultural applications such as irrigation and plant health monitoring. The thermoMAP automatically calibrates itself during the mission. It briefly closes its shutter at each waypoint and images the back of the shutter. A built-in temperature sensor accurately measures the temperature.
4. Methods
The method used for the comparison of the tools is based on direct visual inspection, as in traditional aerial archaeology. We can observe in
Figure 4 that, in the visible spectrum, we cannot visualize the buried remains. Only the structures are identified in the sensors that possess wavelengths that overtake and pass the NIR. The visual comparison between these sensors is realized in the results.
4.1. Flight Planning and Data Acquisition Procedure
The flights were planned in different manners:
- (a)
With the Tecnikopter we used the MKTools, a free software application. The purpose of this planning was to define a route that would allow a longitudinal and transversal image overlap of 80%. The average speed for flights was 10 m/s at an altitude of approximately 100 m. The RBG images were recorded in a .raw format (the proprietary Olympus format being .orf) with the same fixed Zuiko Digital ED 12 mm f/2.0 lens with an ISO of 200 and with a manual focus to infinity. For the Tetracam camera the shutter speed was every two seconds at 4 m/s with the speed maintained.
- (b)
With the commercial system eBee we used the eMotion software to calculate the flight plan, which is based on automatic photogrammetric parameters. Once we set the configuration (GSD and overlapping percentages, lateral and longitudinal) the software automatically calculates the number of strips required to cover the archaeological area.
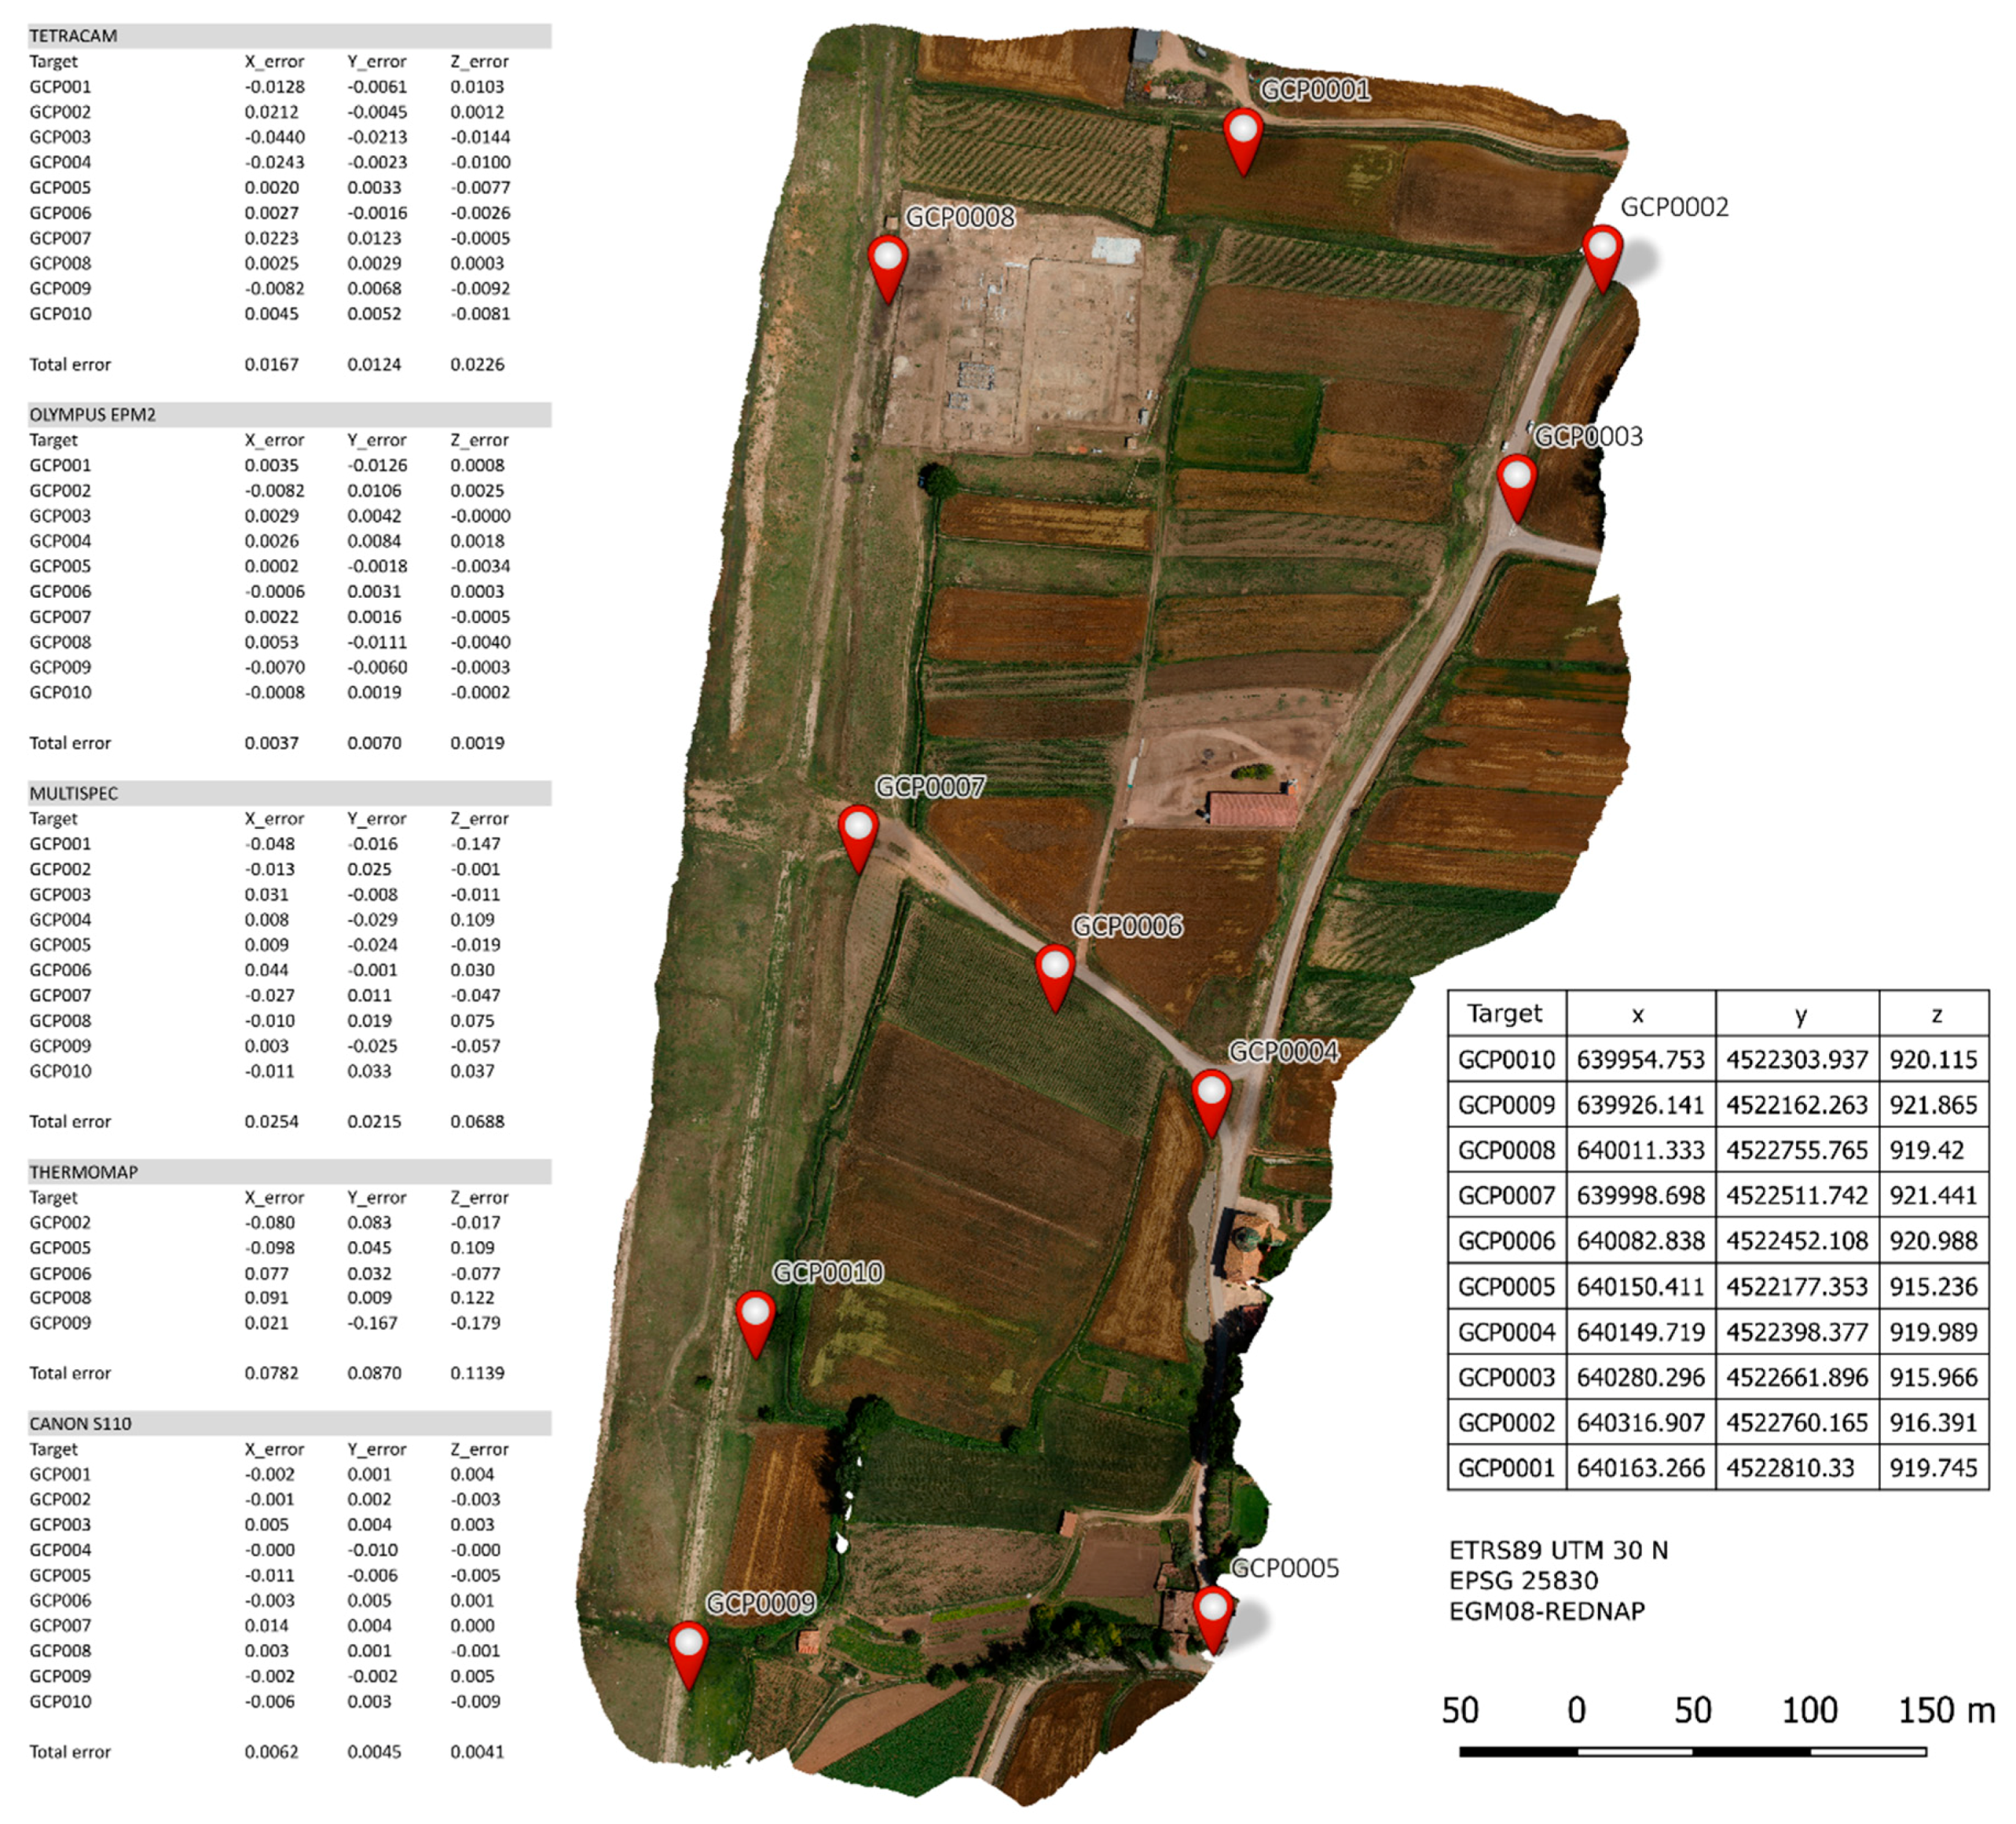
For both of them the acquisition of field data requires the determination of several control points on the ground, known as GCPs (Ground Control Points). We used the same GCPs for all the flights (
Figure 7). This acquisition required a good geometric distribution within the defined flight area with the objective of scaling the final model to a metric system, and inserting it into the selected coordinate reference system. The geodesic reference system used was the official system in Spain—UTM ETRS89 (Royal decree 1071/2007 of 27 July)—in UTM zone 30. The GCPs were acquired using a Leica GS14 GNSS system. The connection between the mobile equipment to a fixed network was carried out via GPRS connection to the ARAGEA active geodesic network of the Aragonese Government (
http://gnss.aragon.es/). Subsequently between 15 and 20 points were distributed within the defined area, and all the points were used for all the sensors in the field data collection. Landmarks ranged from easily identified points in the field, such as roads or stones, to targets and survey stakes in areas with vegetation. Consequently, a file with the format “x, y, z, cod” was obtained, to permit later photogrammetric support.
4.2. Image Processing
- (a)
For the Tecnikopter images the orthorectification and mosaicing processes were performed by Agisoft PhotoScan (2014) software [
12,
13], for all wavelengths. In this sense, we obtained a structure-from-motion (Sfm) elevation model using a radiometric adjustment by Adaptive Orthophoto. For the texture of the 3D model, the software performs a radiometric adjustment based on the average of each pixel in each image taken. The software calibrates the images assuming that every camera model used specifies the transformation from point coordinates in the local camera coordinate system to the pixel coordinates in the image frame (
Figure 8). The local camera coordinate system has origin at the camera projection center where the
Z axis points towards the viewing direction,
X axis points to the right and
Y axis points down. The image coordinate system has origin at the top left image pixel, with the center of the top left pixel having coordinates (0.5, 0.5). The
X axis in the image coordinate system points to the right,
Y axis points down. Image coordinates are measured in pixels. Equations used to project a points in the local camera coordinate system to the image plane are provided below for each supported camera model [
31].
- (b)
For eBee we used Pix4D [
14] for initial processing of matching image pairs and generate a point cloud, mesh and orthomosaic. This software uses a radiometric calibration that allows the calibration and correction of the image reflectance, taking the illumination and sensor influence into consideration (
Figure 8). The external camera parameters are different for each image. They are given by [
32]:
After obtaining the orthophotos and 3D models, the data was adapted to work with Erdas Imagine (2013) and ArcGis (2013). This adaption consisted of the creation of a layer stack with the VIS and the NIR images in .tiff format, generating multilayer files with 6 bands of multispectral information in each case. For the Tecnikopter, we have obtained images with this order band: 1 = 490–500 nm; 2 = 550–560; 3 = 680–690; 4 = 720–730; 5 = 800–810; 6 = 920–940; for the images with Multispec 4C obtained with eBee: 1 = 550; 2 = 660; 3 = 735; 4 = 790. The Thermomap produces panchromatic greyscale images, 1 = 10,000.
4.3. Image Post-Processing
The principal objective of these different procedures has been to enhance visual detection of the cropmarks for the identification of buried archaeological remains.
The following techniques of digital image processing have been applied in combination for the multispectral images: (a) the generation of new bands of information (spectral indices and Principal Components PCs) from the original bands; and (b) the application of radiometric enhancements and the creation of compositions in false color (RGB), applied to both the original and the new bands.
(a) The generation of indices and PCs allows us to extract continuous information and enhance significant aspects of the images from the original bands. For this study, the metric relationship between bands has been employed to estimate biophysical parameters such as plant vigor, in the case of obtaining vegetation indices, and the statistical relationship between bands to create the PCs. For the thermal images we have only operated with the temperature index (°C), estimated directly with Pix4D. In this case, the software uses the pixel values in the band (10,000 nm) and calculates:
The vegetation indices consist of the pixel-by-pixel building of ratios or quotients, between the digital levels of two or more image bands [
33]. The potential of this technique in the field of archaeology was raised by Verhoeven [
18,
34] and Bennett et al. [
20]. Specifically, this project has used: NDVI—
Normalized Difference Vegetation Index—[
35], Green NDVI—
Green Normalized Difference Vegetation Index—[
36] and SAVI—
Soil Adjusted Vegetation Index—[
37]. These indices use three key spectral ranges (Green, Red and NIR) related to spatial differences of the density and physical state of vegetation and soil moisture that might be linked to the presence of archaeological remains [
34].
where, NIR = Near Infrarred and L = 0.5.
NDVI shows an effective capability in the detection of crop marks and have widely been used to detect archaeological features [
20]. GNDVI is more sensitive to variation in chlorophyll content [
36] and SAVI is used to reduce the spectral contribution of soil. Both aspects are especially important to consider over cereal crops because of the phenology dynamic and management interactions might affect the identification of signals related to buried structures.
The Principal Components Analysis (PCA) is a statistical procedure that reduces redundant information by transforming several quantitative variables (common underlying dimensions) into several new uncorrelated variables. The first two variables or components retain the highest proportion of variation, and from the CP number 3 begin to increase the percentage of noise. This statistical process is performed using a variance-covariance matrix without losing significant portions of the original information. This capacity of synthesis is of great interest in the field of remote sensing as the acquisition of images in adjacent spectrum bands often involves the detection of redundant information, since canopy cover often exhibits similar behavior in close wavelengths.
In the field of archeology, it has been used in particular when working with hyperspectral sensors [
21,
22] contributing significantly to the identification of marks of archaeological structures. In this study, it has been applied to the VIS-NIR image (containing all bands) for the creation of new bands including in false color compositions.
(b) With respect to radiometric enhancements, radiometric histogram adjustments and false color compositions (RGB) have been applied. According to Jensen [
38], the linear contrast tends to expand the original digital levels to the minimum and maximum (0–255) to exploit the sensitivity of the device. In this case, linear contrast adjustment and histogram equalization were used to increase the global contrast, which were defined statistically and interactively using breakpoints and percent clip. With regard to histogram equalization, the number of pixels of every image is divided by different number of bins equaling the number of pixels in each bin.
These settings have been applied to the following bands and new channels: VIS, NIR, and VIS-NIR images, NDVI, Green NDVI, SAVI, CP1, CP2, CP3 and Thermal index. False color compositions are three-band combinations, to each of which were assigned additive primary colors (Red, Green and Blue RGB). Here, in place of the original bands, the three NDVIs, or the first three CPs, have been used for revealing specific patterns and emphasizing variations between site and their surroundings that not be visible without applications of these kinds of techniques.
5. Results
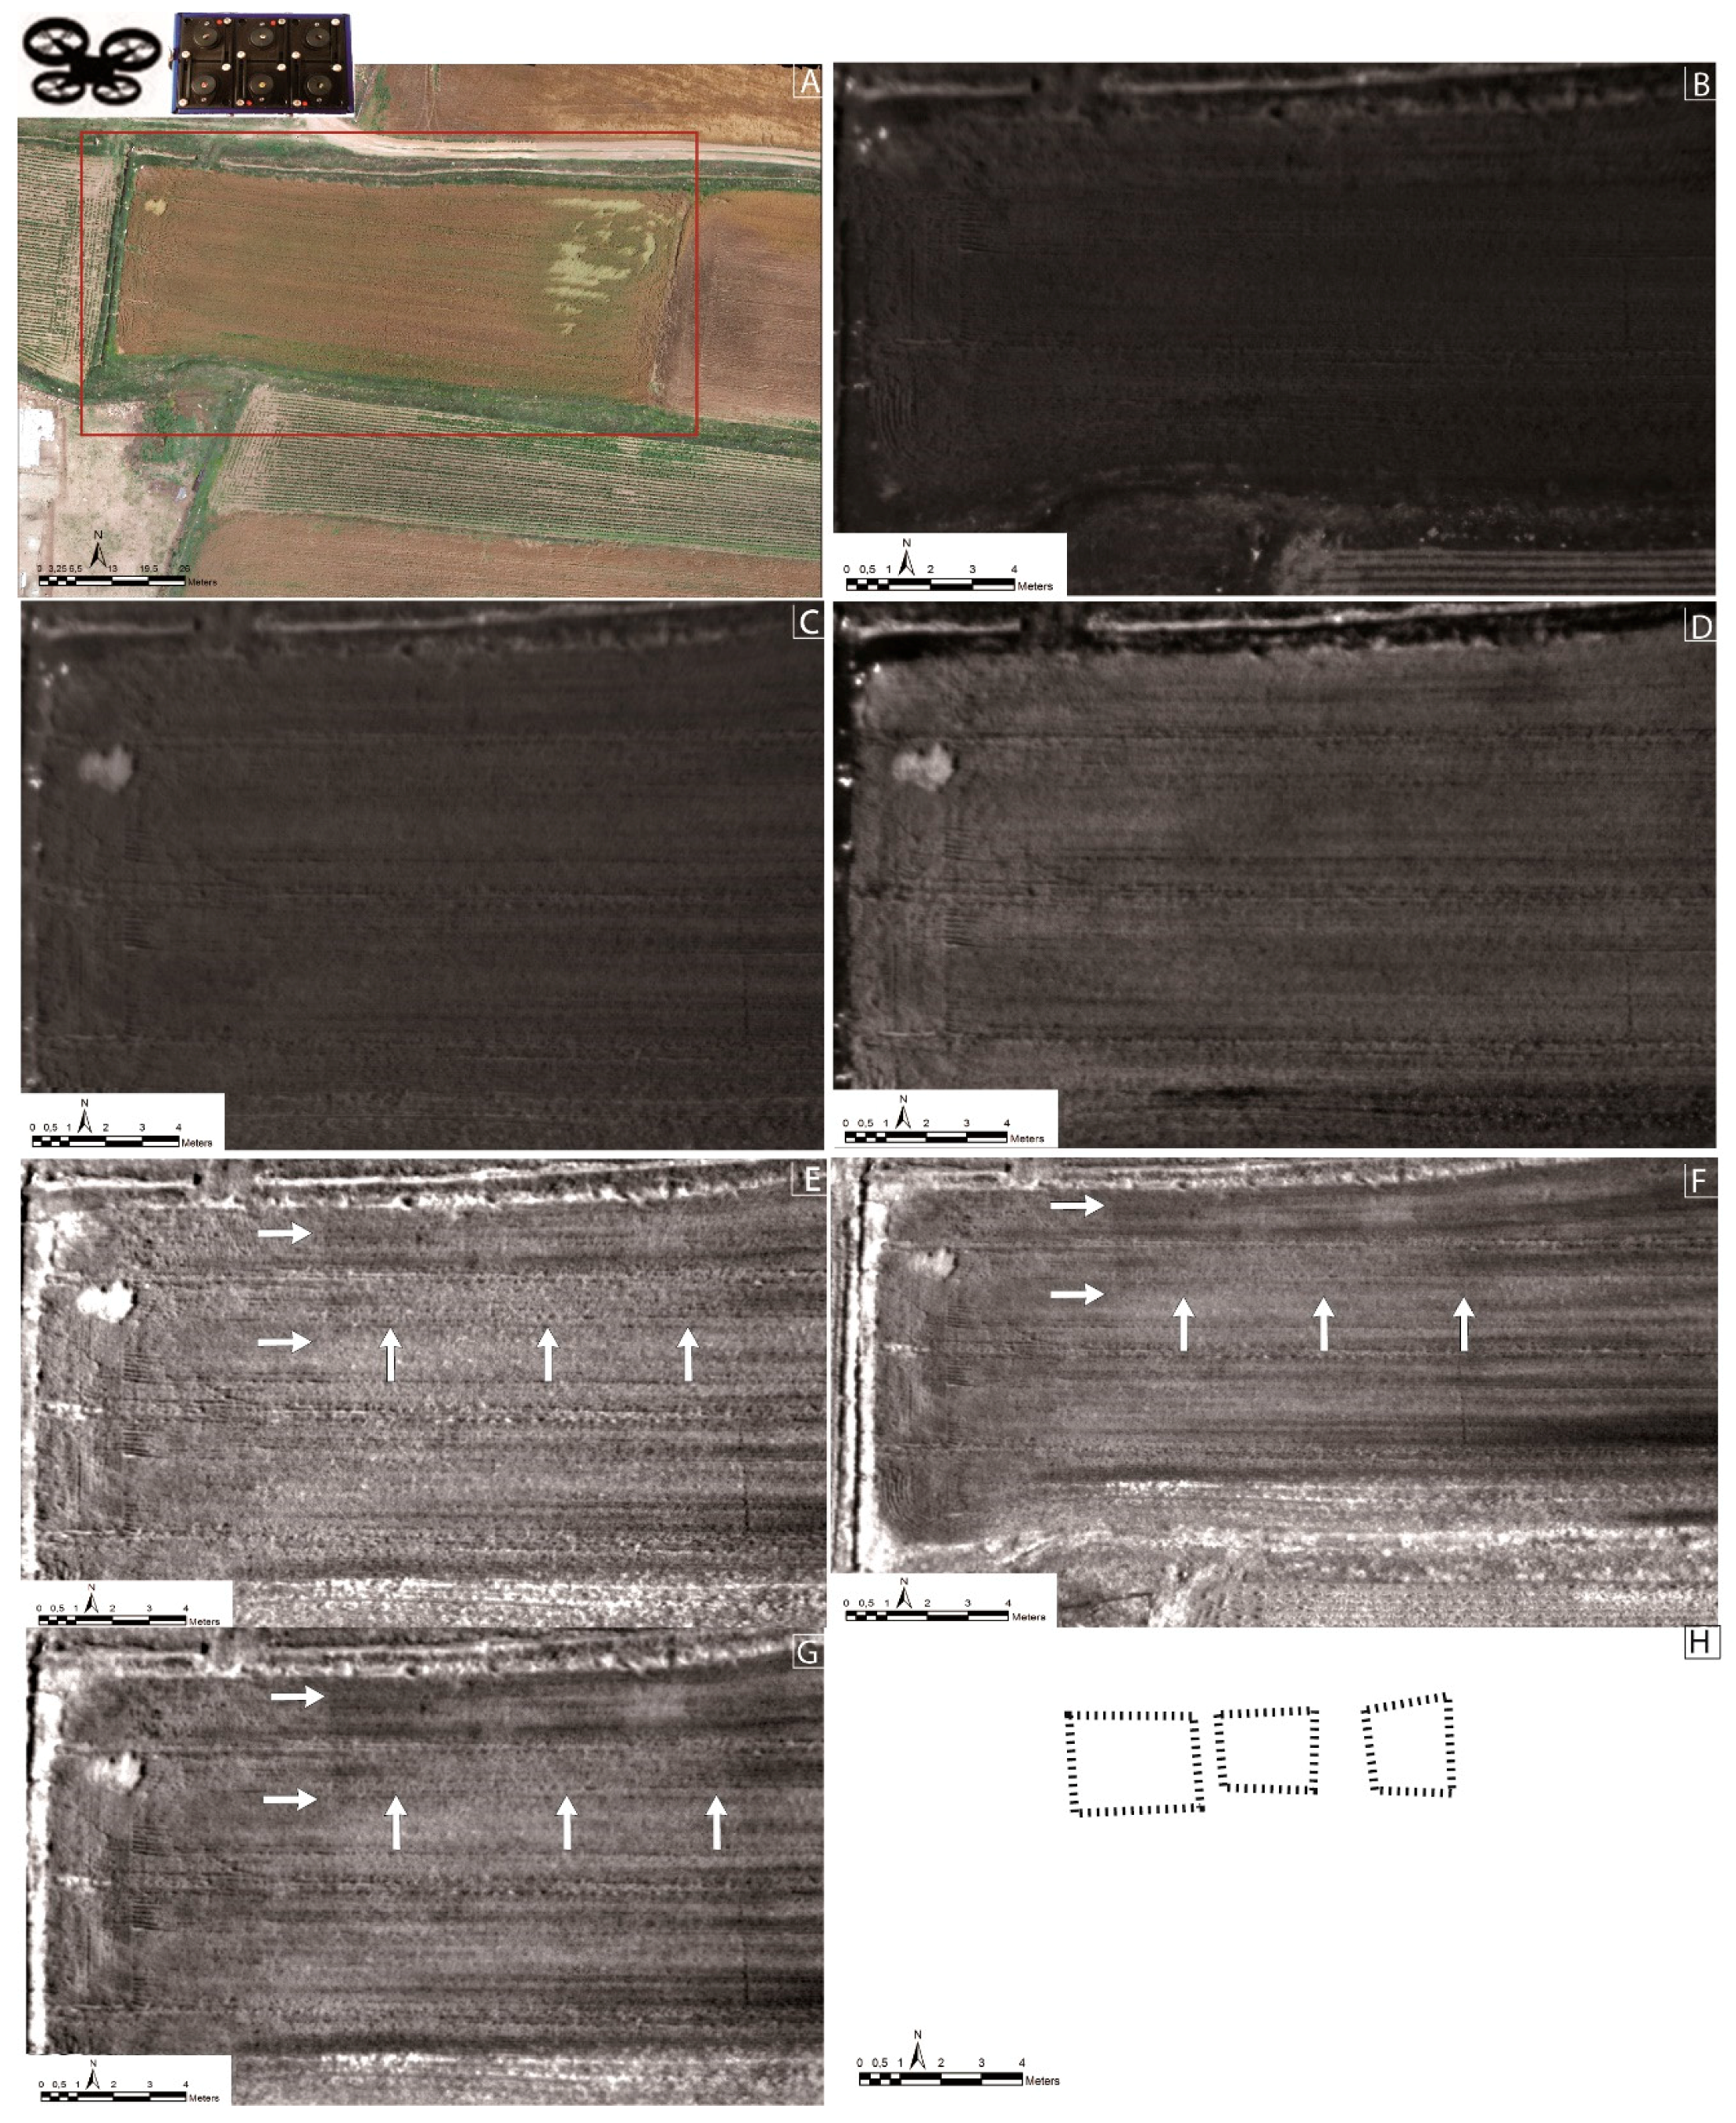
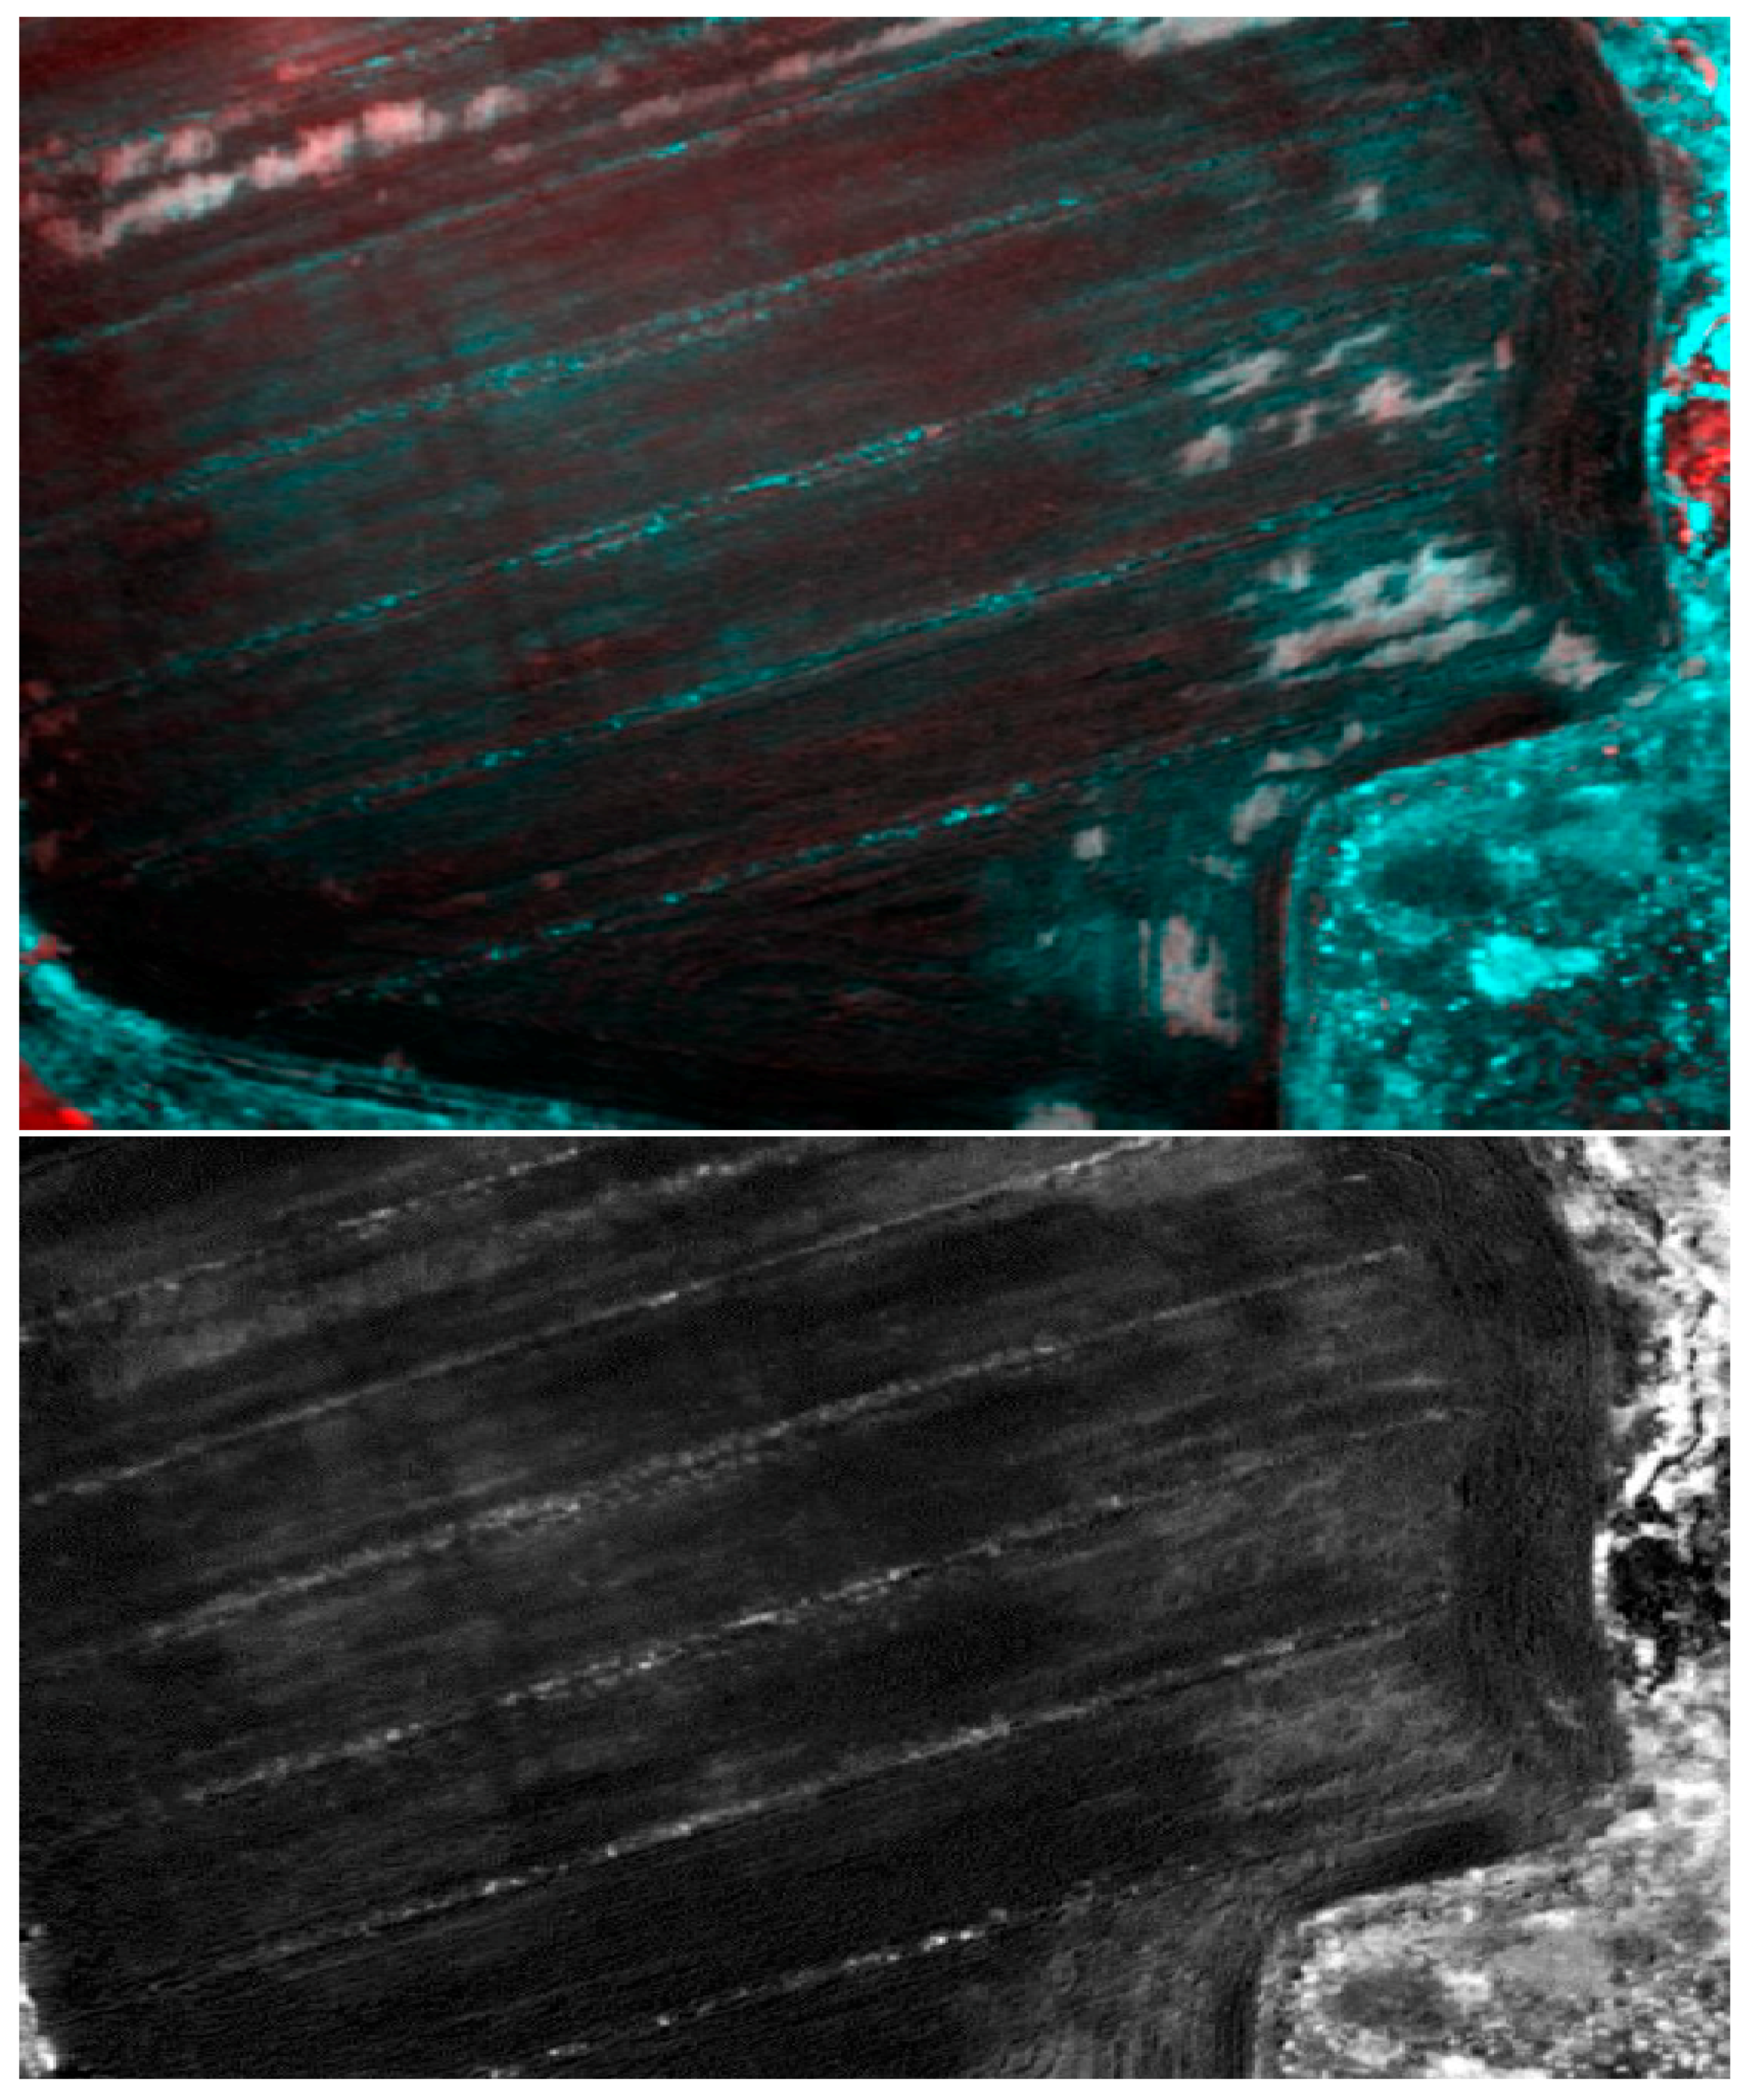
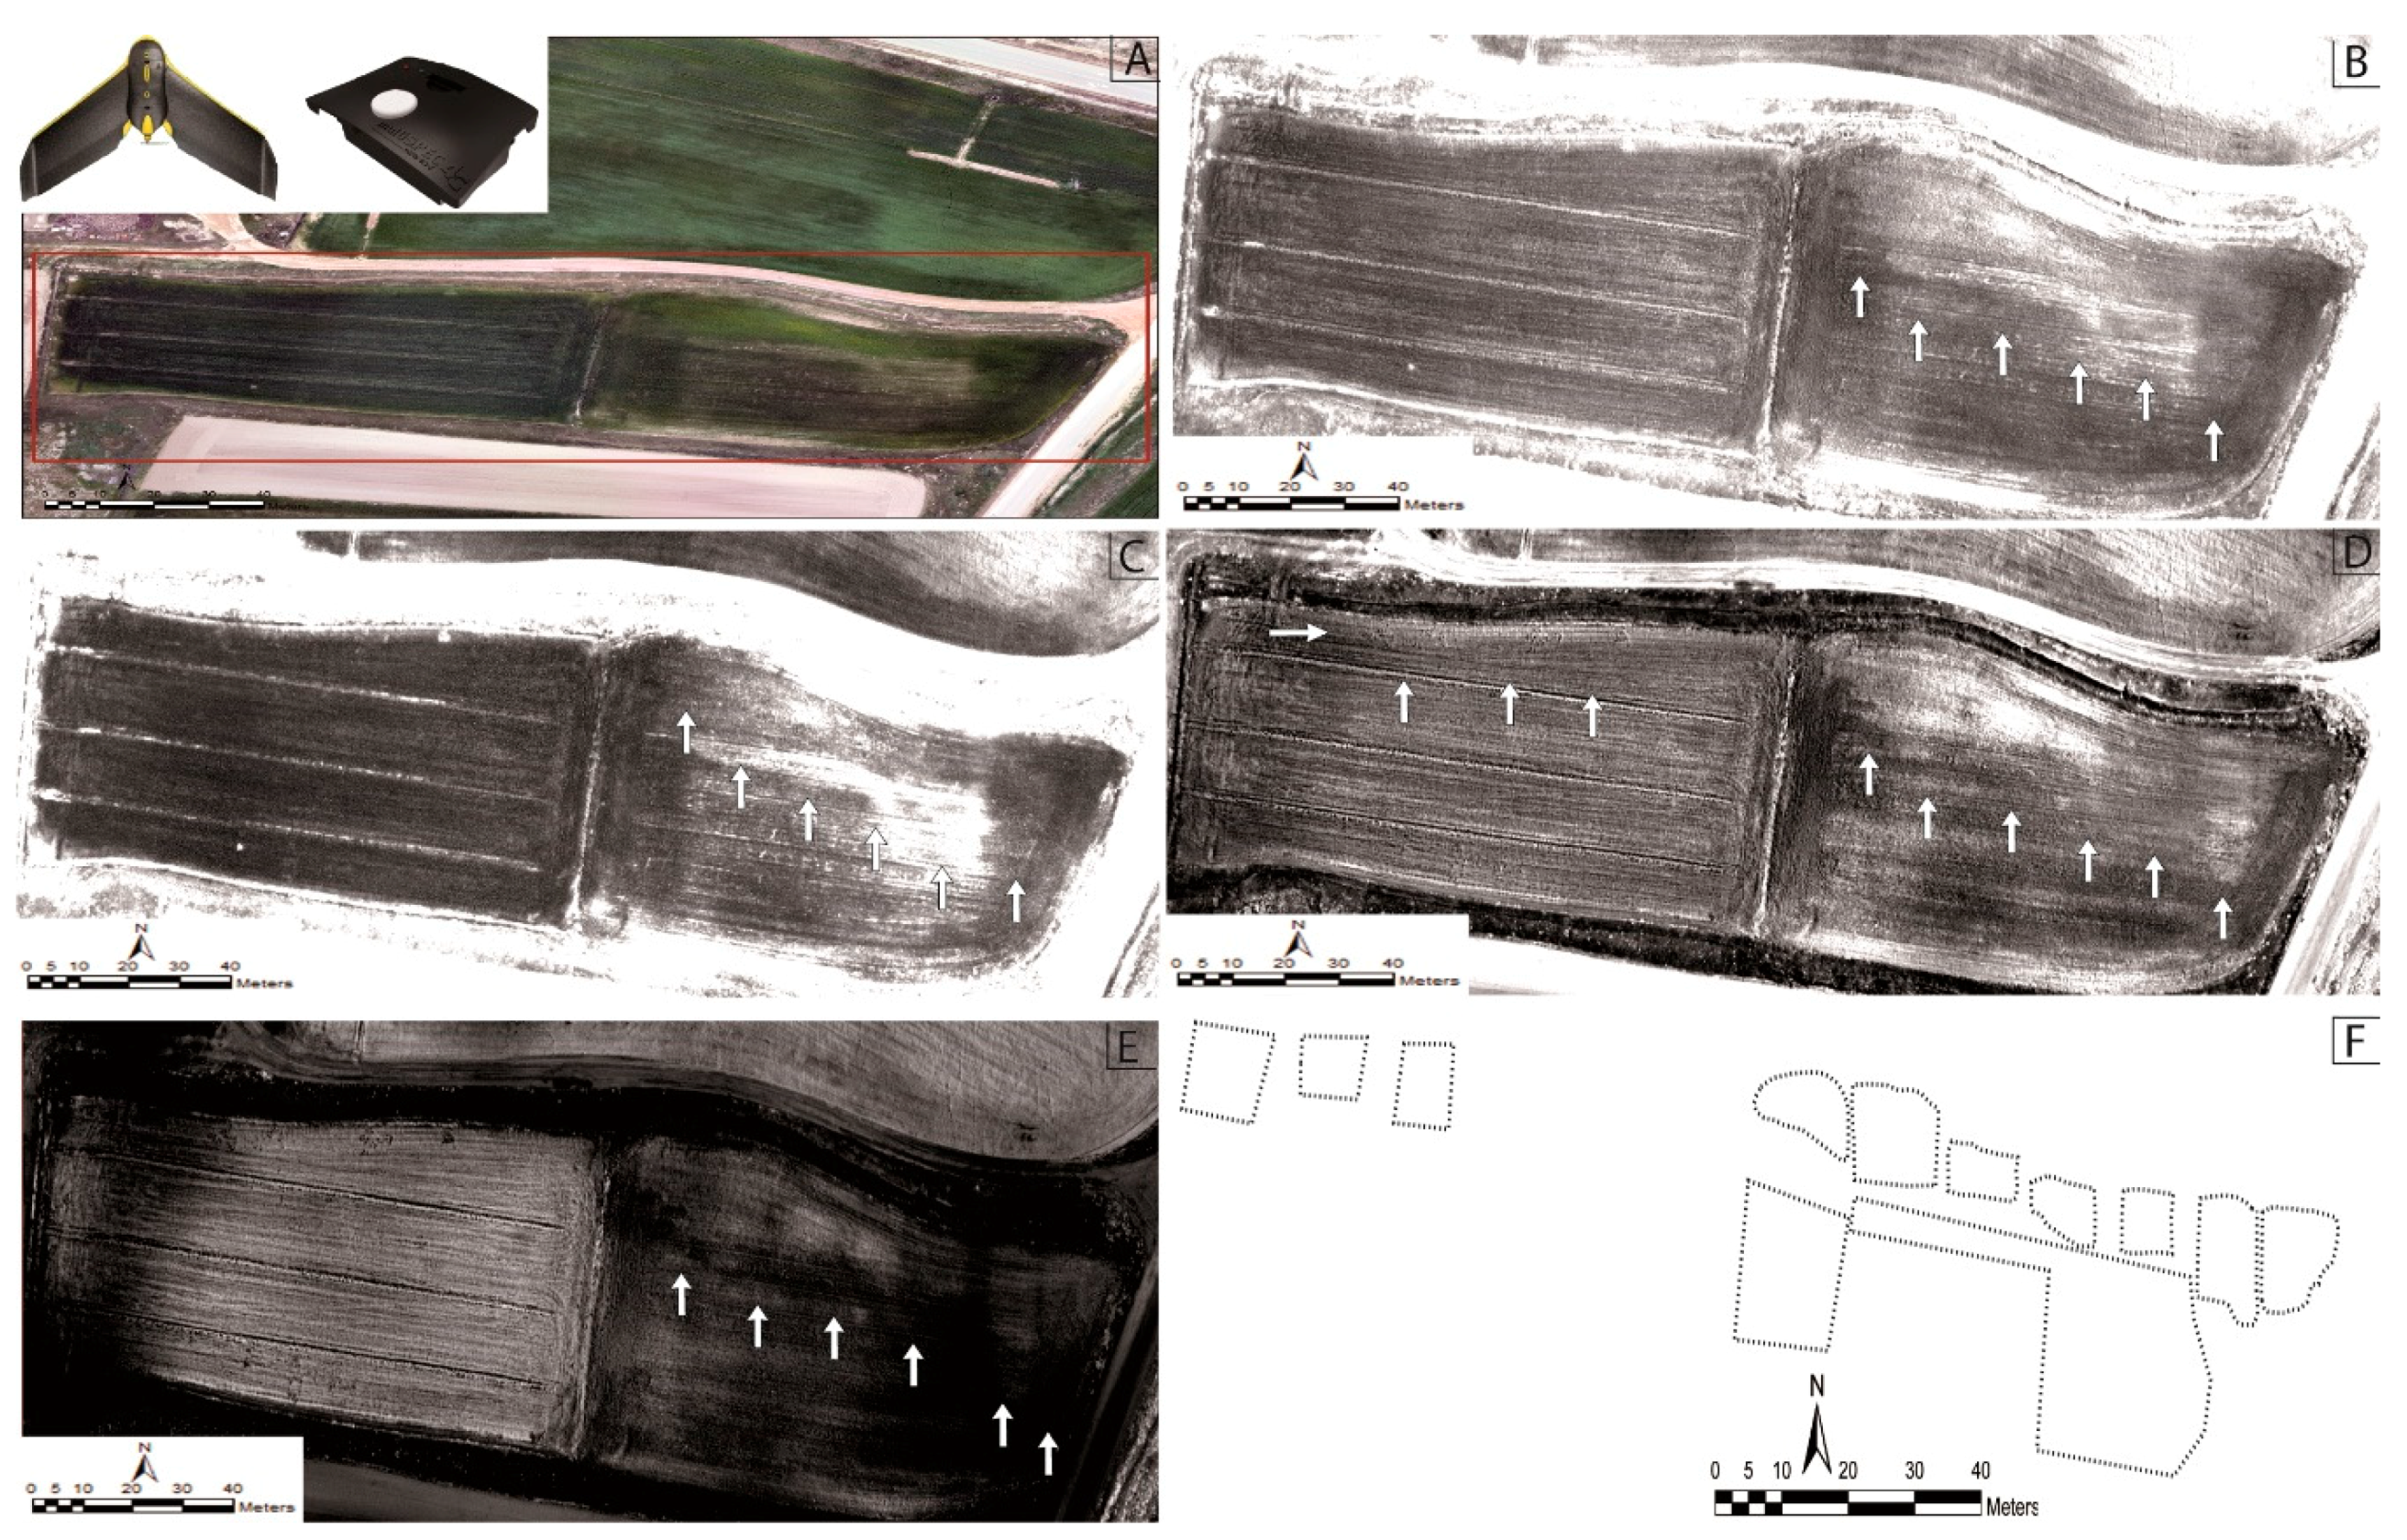
(a) Tecnikopter plus Tetracam
This system has allowed us to use the desired camera for research and not one imposed by the manufacturer, in this case the Tetracam Mini MCA6. Although the workflow with this system is quite complex and requires laborious and time-consuming post-processing, the results can identify different buried archaeological remains. Due to the complexity of the workflow and the deformations that the camera produces, we have obtained better results for the crop marks working with individual images. The creation of orthophotos has not proved satisfactory in enhancing the crop marks as the sensor has problems with the effective size of the camera lens aperture, resulting in what is known as
vignetting [
39] as well as a poor overlap between bands. In this case, the band 6 images (920–940 nm) with a standard deviation enhancement of 2.5 allows us to obtain the best results (
Figure 9G).
Various image treatments such as obtaining vegetation indices [
20] (
Figure 10) and PCs have been made. This image post-processing has allowed us to identify several anomalies in the ancient remains of the city of
La Caridad. In the case of the Tetracam sensor, and taking into account the advanced phenological state of the vegetation as the drone passes, the techniques that have given the best results are: (1) SAVI with any of the infrared bands (800, 720 or 920) (
Figure 11B–D, respectively), and (2) the false color composition of the PCs (components 123) with an equalized enhancement of the histogram (
Figure 11G).
Based on the SAVI indices in the northern part of the field, a succession of quadrangular forms can be made out with a different tonality of grey that represents different levels of the greenness of the cereal following a spatial pattern that is clearly orthogonal and non-natural.
These forms reveal the presence of buried archaeological remains. The different levels of greenness will have been determined by the varying soil conditions associated with the architectonic elements documented here. In some cases, the presence of the remains at subsuperficial level will have contributed to the modification of the physical properties of the ground and either speeded up or slowed down the ageing process of the cereal. With the second technique—the generation of false color composition using the first principal components- and afterwards applying an equalize enhancement of the histogram (
Figure 11G), we can observe how these quadrangular elements appear in purple and turquoise tones.
However, in the process of planting the cereal, no similar planting pattern is known to have been applied. Taking into account the usual physical interpretation of the PCs and the false color composition used, the turquoise tones are associated with very green, moist and shiny surfaces while the purple tones reveal a low degree of greenness and brightness.
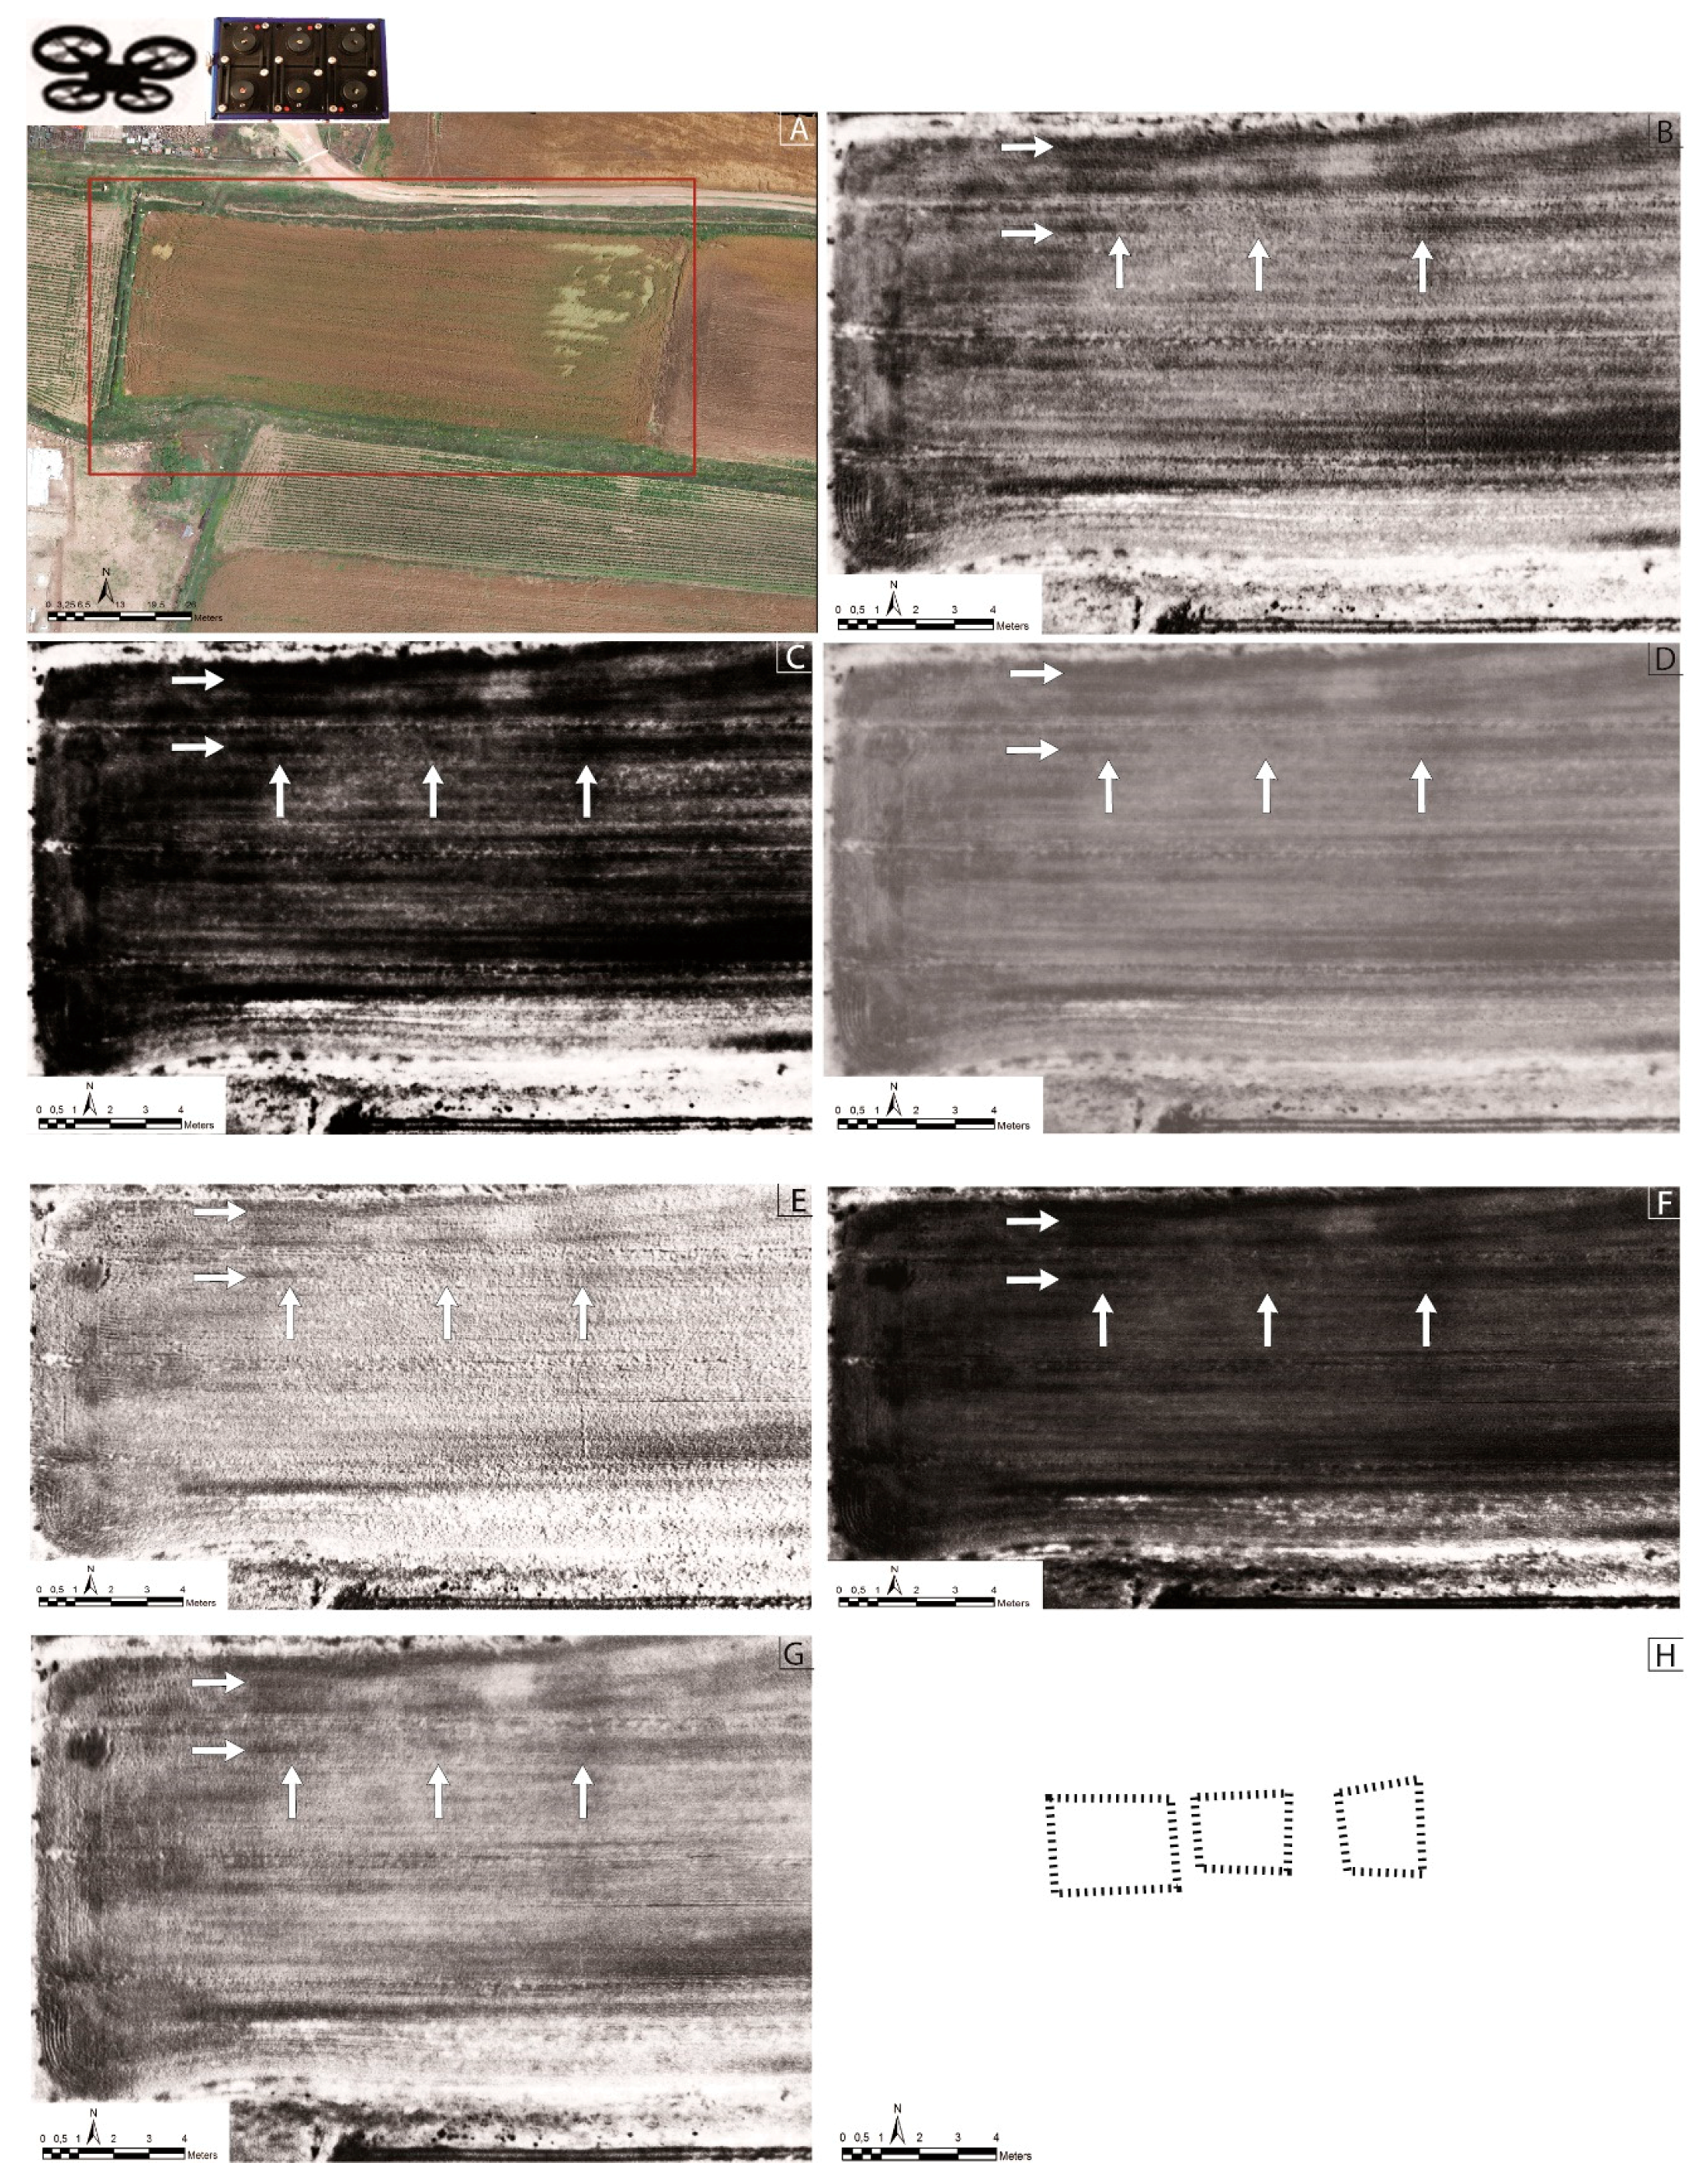
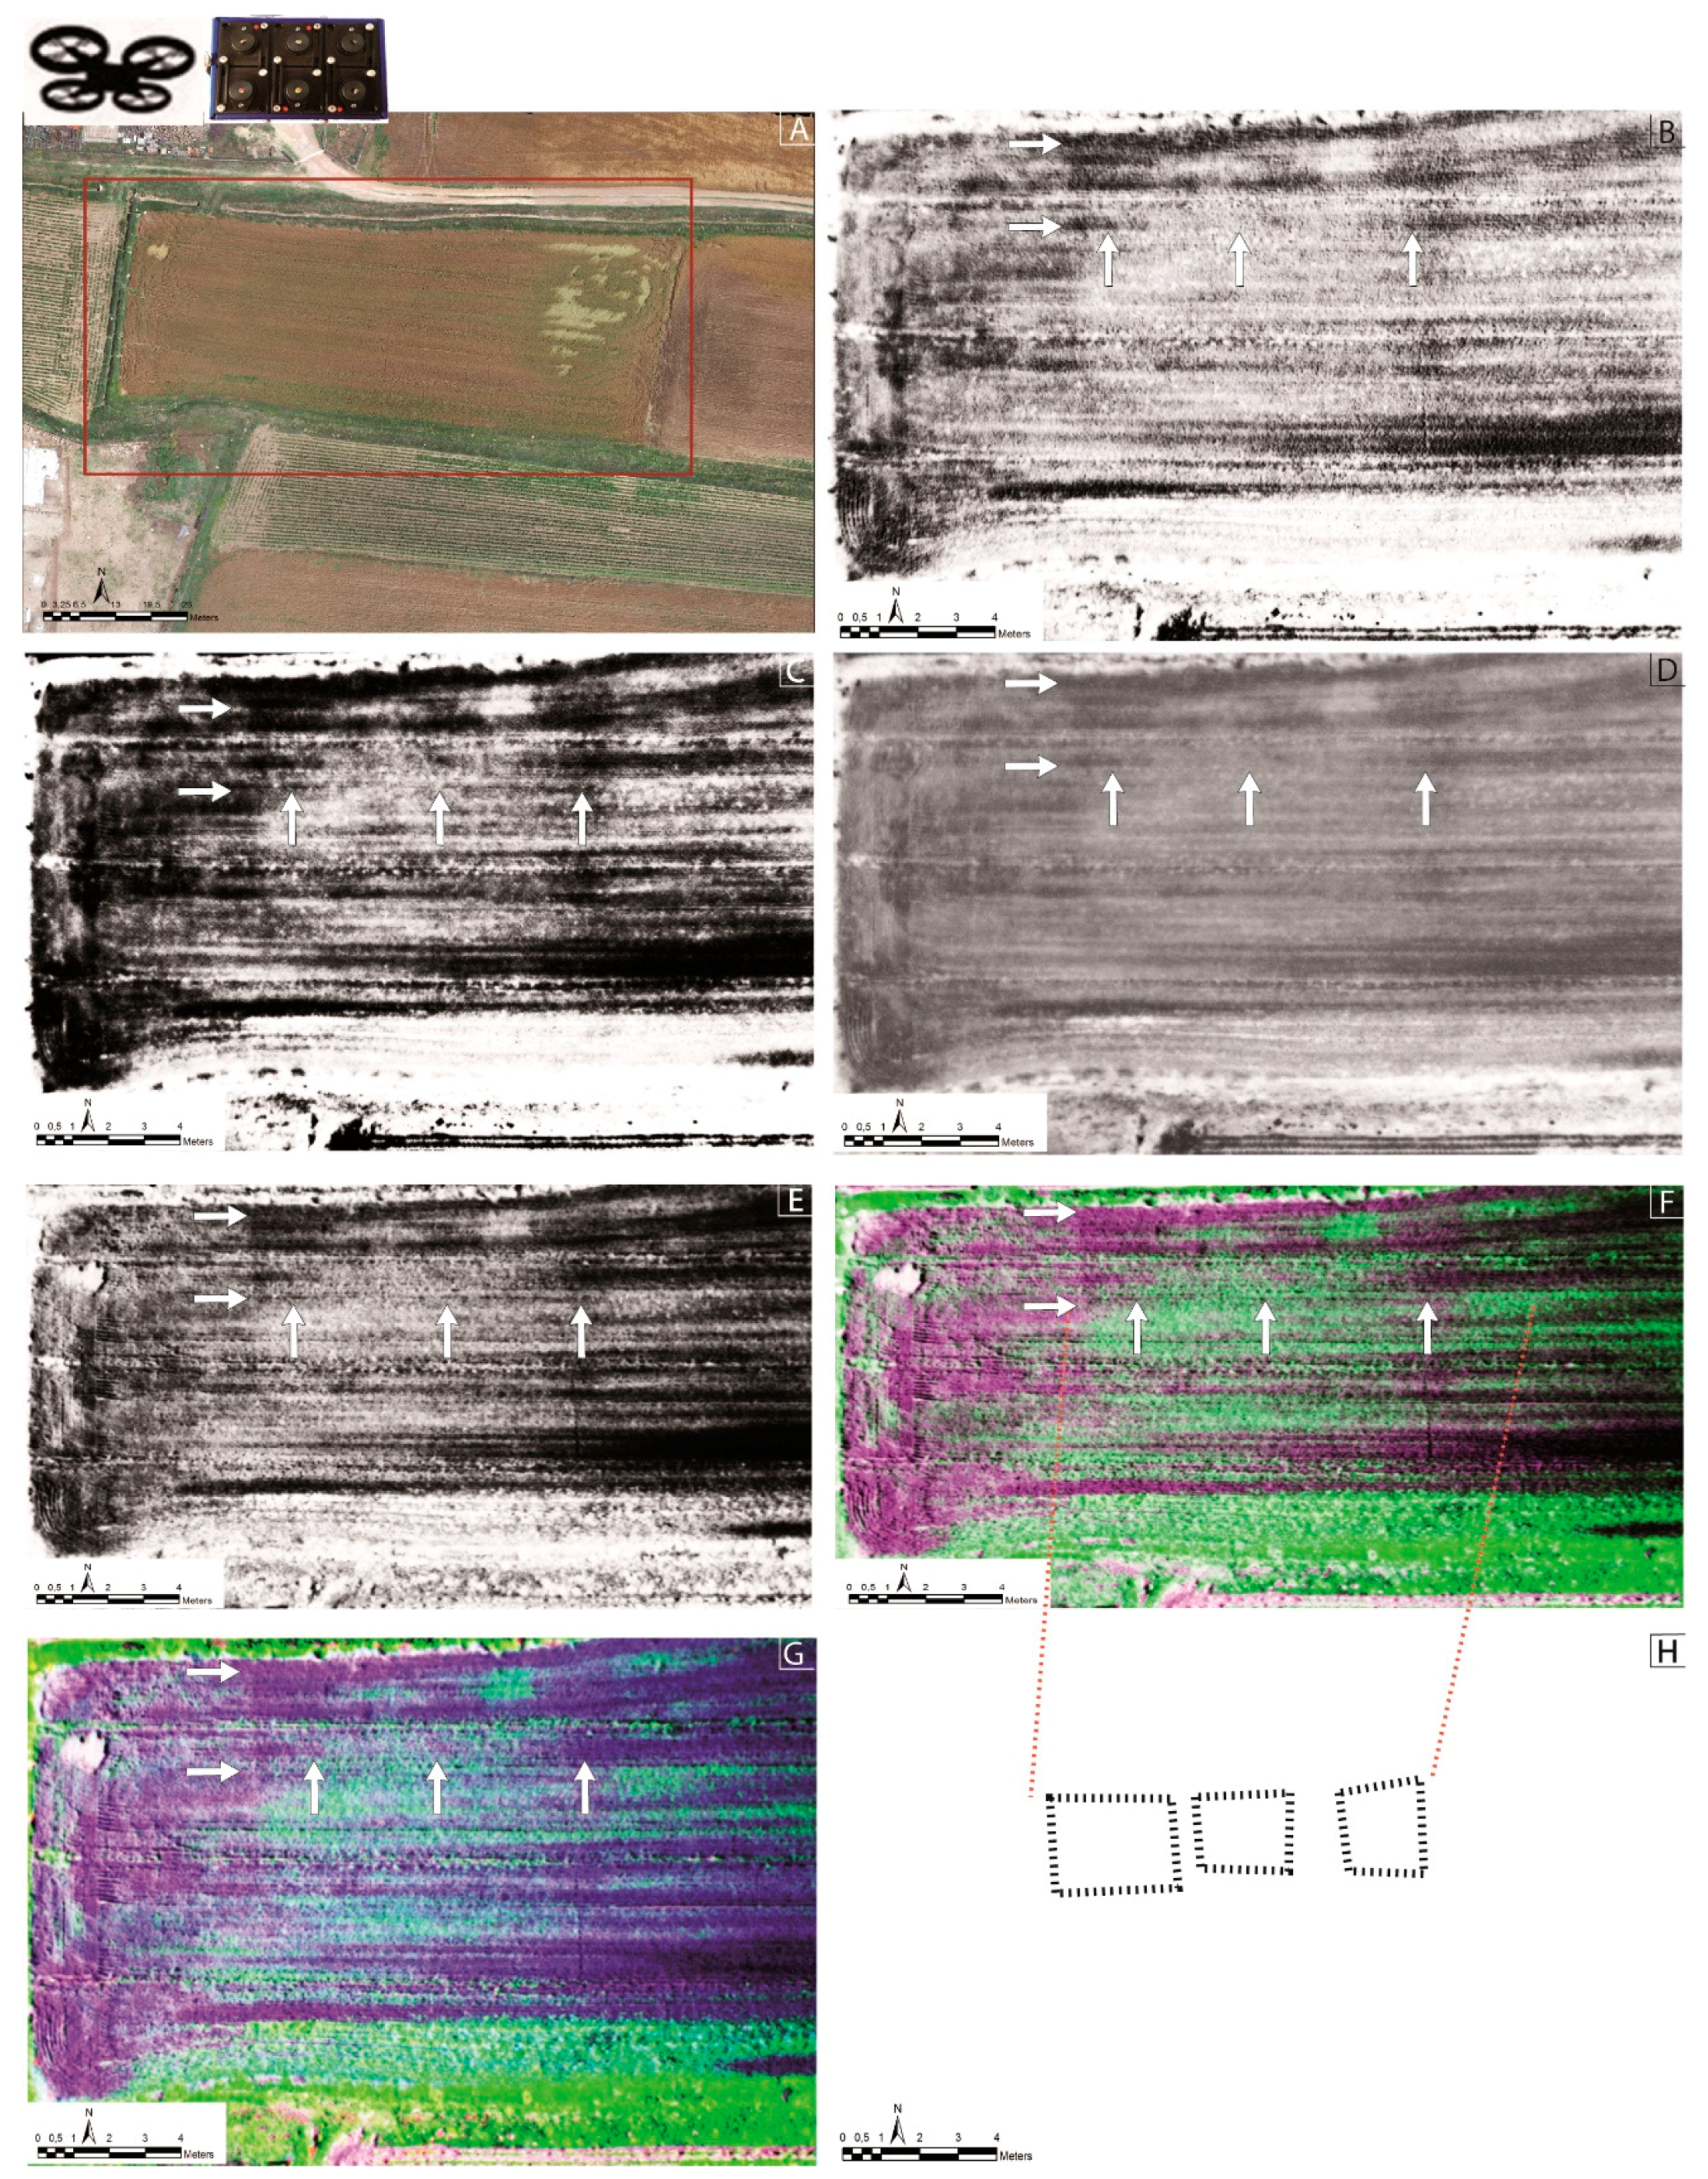
(b) eBee plus Multispec 4C
This commercial system only allows us to work with the Multispec 4C multispectral camera. The process of data capture and post-processing is faster as the workflow is fully systematized. The results are satisfactory for the identification of archaeological remains as can be seen in
Figure 12 and
Figure 13. In this case, it allows a greater visualization of the cropmarks in the NIR orthomosaic (
Figure 12E). In it we can identify, with lighter grayish tones, the succession of quadrangular structures distributed in the northern area of the field. These shades reveal the greater Digital Number of vegetation at this wavelength. In contrast, the southernmost structure can be clearly identified using the 660 nm red band (
Figure 12C). In this case, the lighter tone of this form signifies a lower presence of vegetation since the pigments (chlorophylls and xanthophylls) absorb most of the radiation at this wavelength. Likewise, the vegetation indices collected in
Figure 13C,D (GreenNDVI and SAVI respectively) highlight the lower photosynthetic activity of the vegetation. With regard to the false color composition (
Figure 13F), obtained by means of this sensor, the assignment of the first two components to the three color canons (RGB), component 1 is displayed simultaneously in red and blue. The southern structure is shown in green tones while the rectangular shapes in the northern part of the field appear in bright magenta shades.
The quadrangular structures are not in the same tones and thus, there is no systematic correspondence with the type of cover. Consequently, we can affirm that each quadrangular structure behaves differently without there being a systematic correspondence with the cover type.
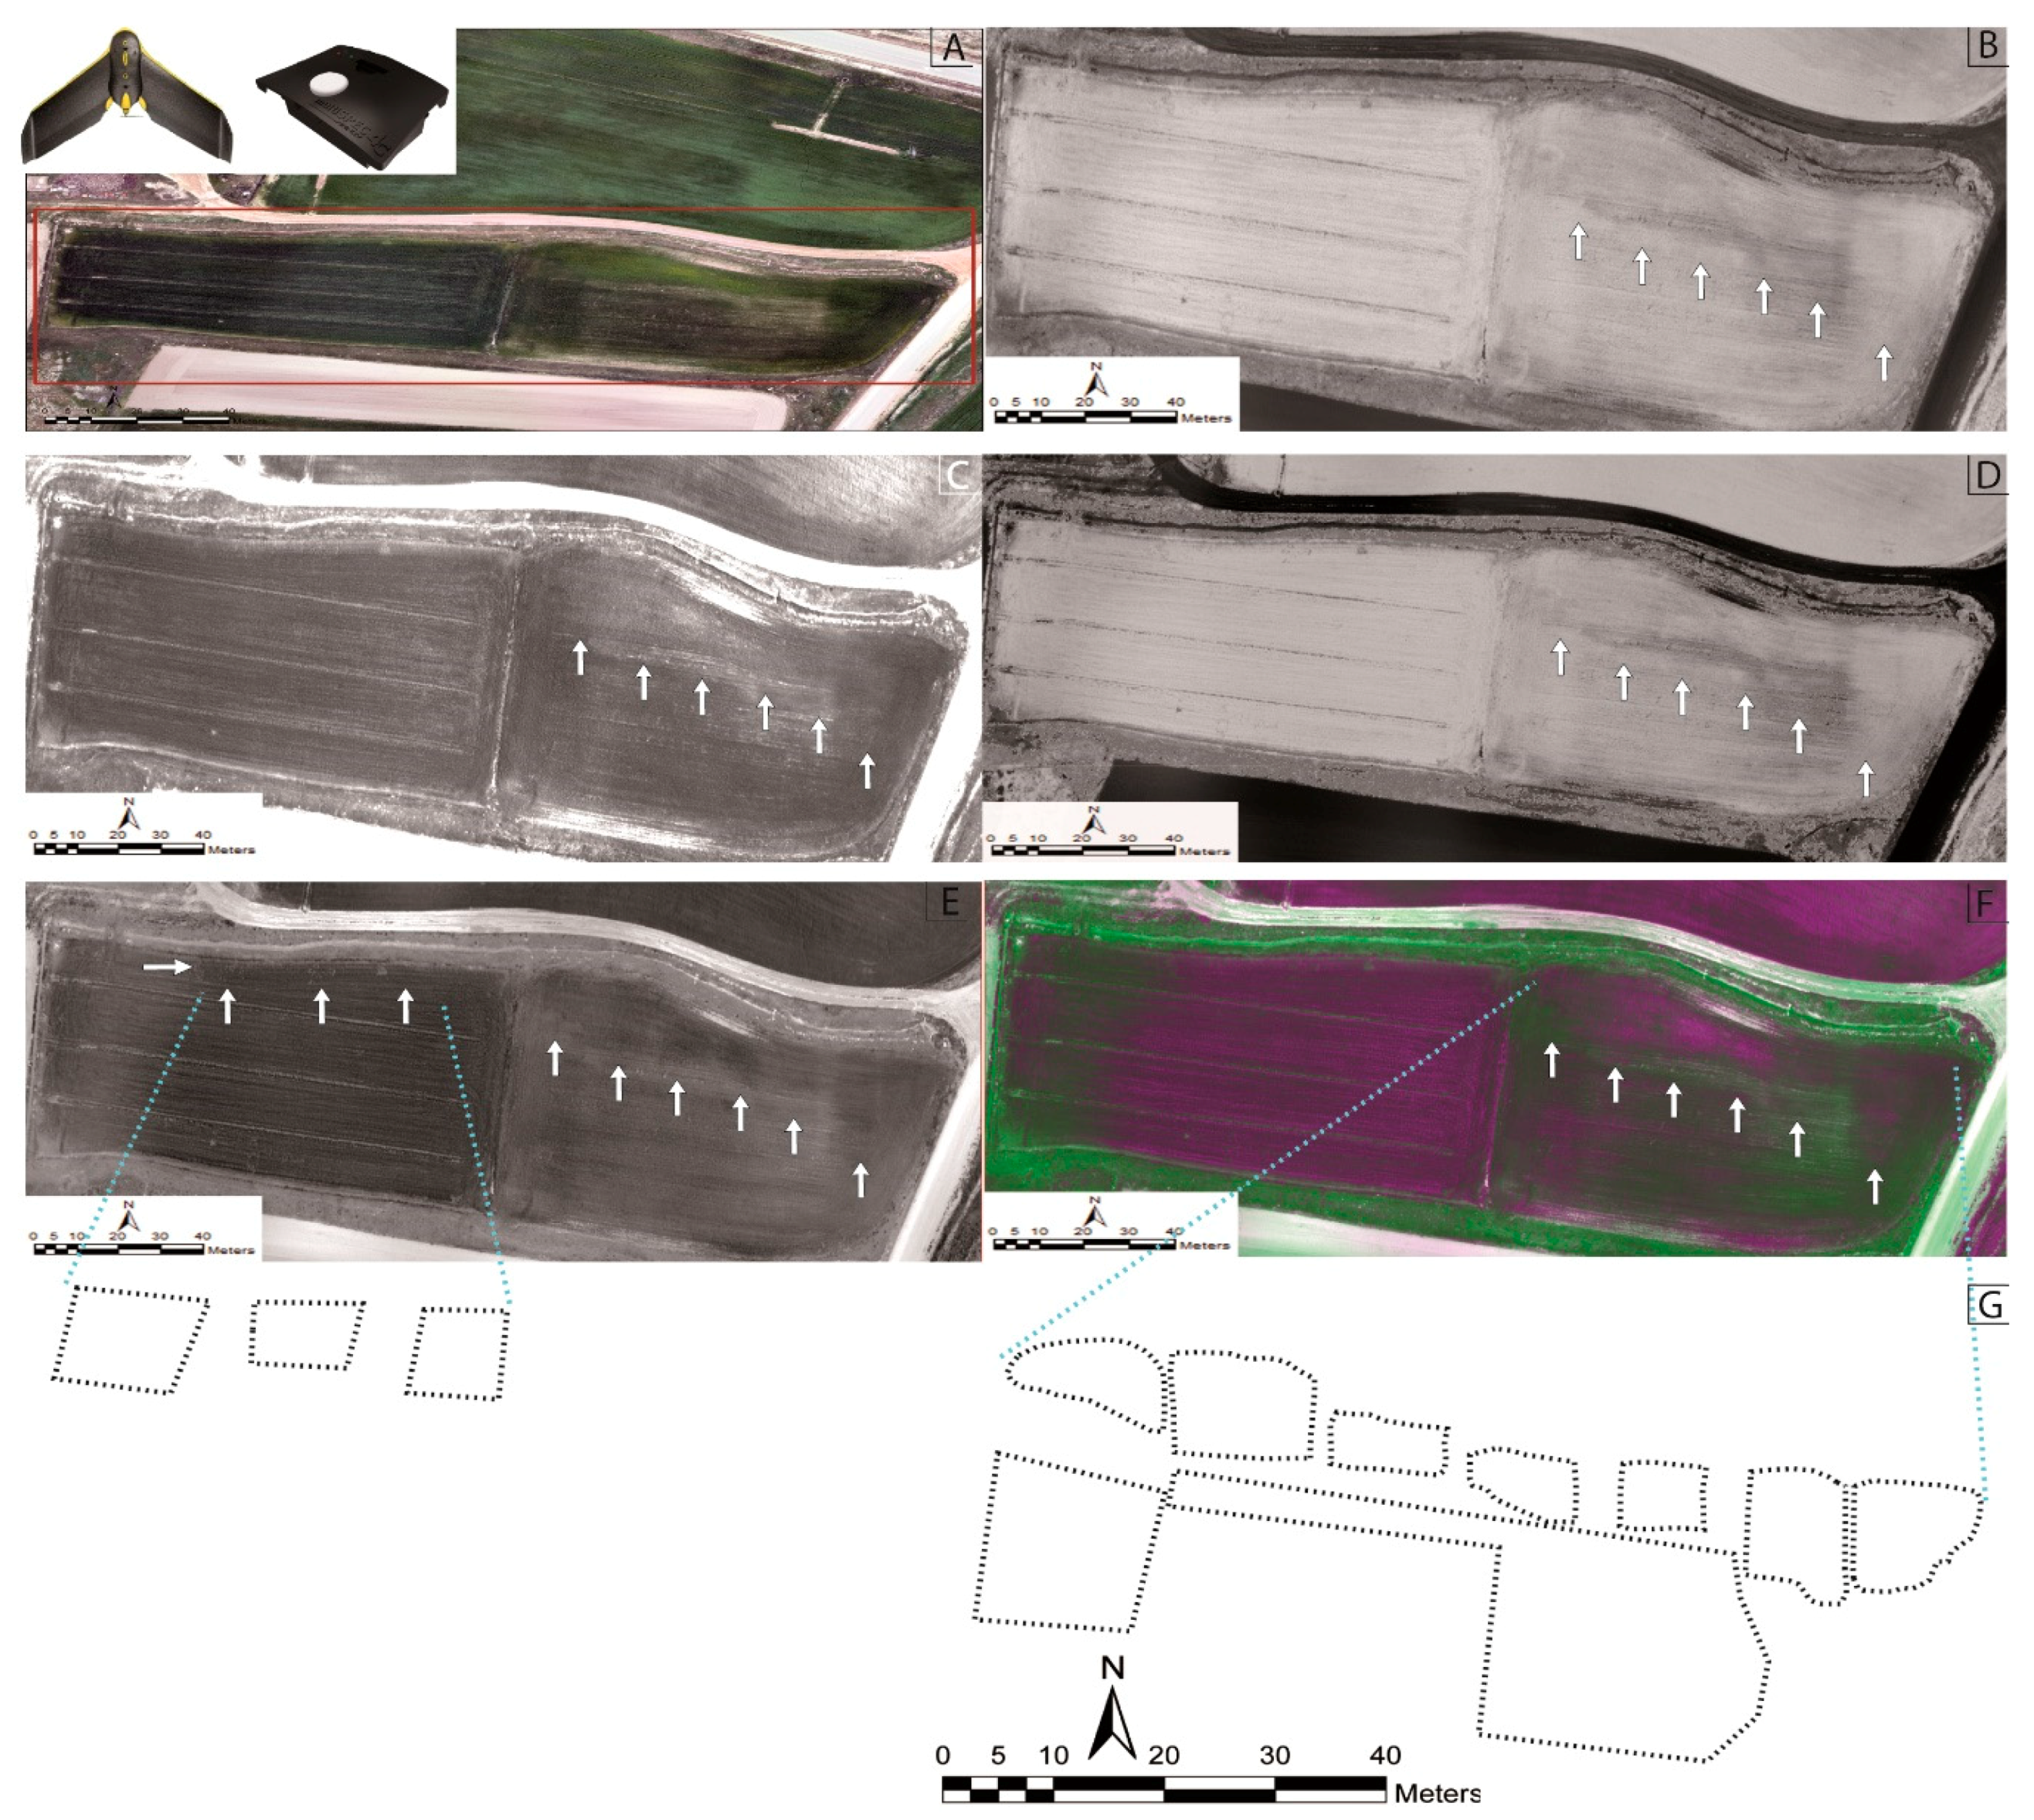
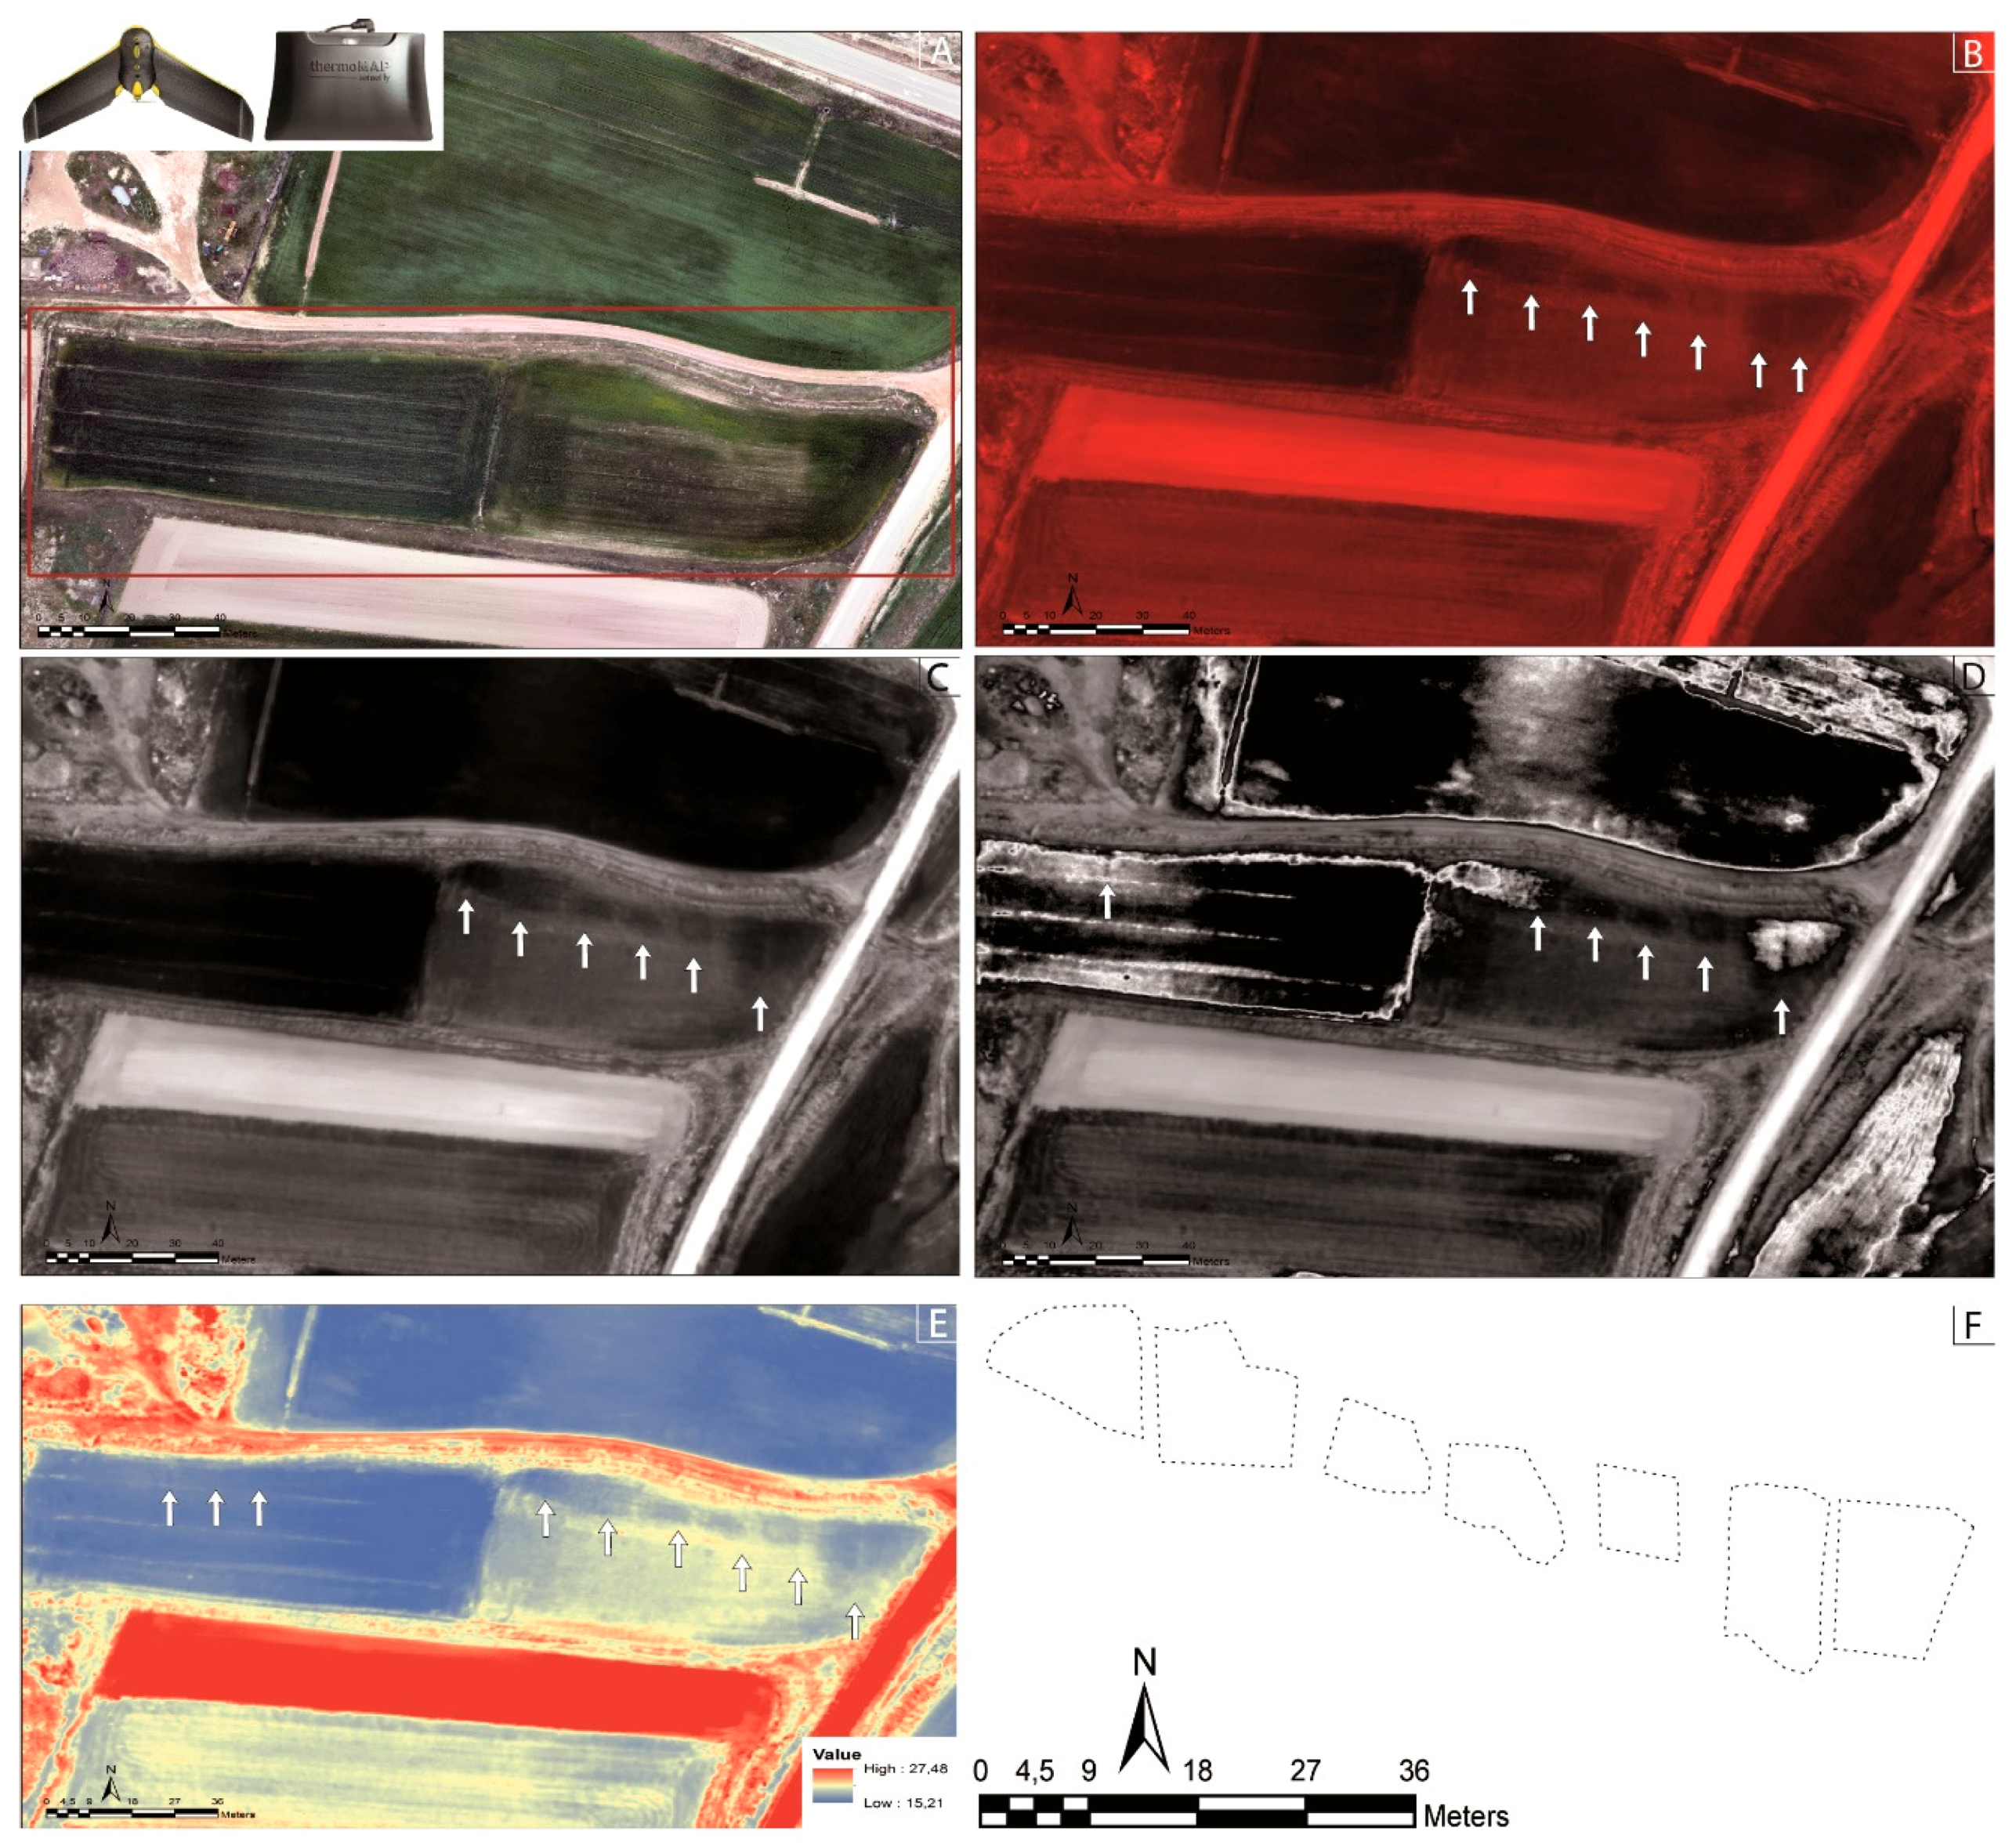
(c) eBee plus ThermoMap
According to the results obtained in this experiment, basing our method on direct visual inspection, it seems that this is the best system for enhancing the archaeological crop marks. Simply by using the temperature index we can observe (
Figure 14) that the sharpness of the display of the remains is increased.
In
Figure 14E, the lower temperature (bluish tones) recorded by the crop marks corresponds to the highest temperature in the field (~20 °C) (yellowish tones). The fact that the cultivation field is already harvested favors the identification of the remains due to the absence of a homogenizing role of the vegetation in its phenological maximum and its greater emissivity. In the field immediately to the west, whose cover is in a phase near this maximum, it is possible to verify the masking effect that the vegetation has on the cropmarks. Therefore, we think that with this type of sensor, as in classical aerial archeology, it would be necessary to carry out the flights when there is greater difference within the same crop. Additionally, the spatial resolution is lower than in the previous cases.
6. Discussion
The purpose of this paper has been to determine which drones and sensors were most useful and obtained the best results in the visualization of buried archaeological remains by means of enhancing the archaeological crop marks. To achieve this objective, we have used two drone systems and five sensors. These systems have been applied to archaeological surveying of an area defined within the Republican Roman city of La Caridad (Teruel, Spain), a site that is partially excavated. The experiment was conducted with two drone systems: one in-house (the Tecnikopter) and a commercial system (the eBee). Flights with the Tecnikopter were performed using the Tetracam MiniMCA6 multispectral camera. With the commercial eBee, a multispectral camera (the MultiSpec 4C) and a thermal camera (the ThermoMap) were used. The method used for the comparison of the tools has been based on direct visual inspection, as in traditional aerial archaeology.
The technical progress that this sector is experiencing means that we are unable to discern which tool is the most useful because of the sheer range of options, or we are unable to obtain enough funding to use the tool in question. The ultimate goal of this work has been to find the best tool that would enable a standardized work process, which was applicable at all times and with which we knew that satisfactory results would be obtained.
Obviously, the in-house system—Tecnikopter—allows us to work with the desired sensor, in this case Tetracam Mini MCA6. This is a sensor that provides good results but which is difficult to work with and above all, to establish a standardized workflow. The first problem arises with the adaptation of the available camera drone system, and this problem increases exponentially when downloading data, with deformation of the images and their subsequent treatment. Yet the 920–940 wavelength filter is still an essential element for archaeological applications since other sensors on the market do not reach this wavelength.
The commercial system constrains us to particular products, in this case MultiSpec and ThermoMap, but facilitates the entire work process—both in data collection in the field and in the process of composition of the mosaics and subsequent image processing. We think the MultiSpec 4C could offer similar results to the Tetracam Mini MCA6 if it was fitted with another filter length similar to that of the 920–940 nm in the Tetracam. This means that the archaeological results are always less sharp when it comes to displaying the remains and that the post-processing of images with remote sensing techniques is more time-consuming when extracting the data.
As we have demonstrated, basing our method on direct visual inspection, the most effective tool (
Figure 14) has been the combination of eBee with the ThermoMap system. As other work has shown [
18,
21], the use of longer wavelengths enables enhanced visualization of archaeological cropmarks. Just as in classic aerial surveying using aircraft [
40], we have observed how the phenological state influences its characterization. As shown in the results obtained, the archaeological remains are best visualized in the field when the crop has begun its senescent phase. However, in employing a thermal camera we lose spatial resolution due to the characteristics of the camera.
Consequently, we believe that there is not yet a single product (drone plus sensor) on the market that provides optimum results in the field of Archeology, as is the case in other fields such as precision agriculture. Thus, the ideal solution is to combine the available tools to achieve the best topographic results using one method, and remote sensing results using another. In any case, we think that these new tools (drone plus different sensors) should be added to the modern archaeological praxis as a common and standardized procedure in all explorations prior to or instead of an archaeological excavation, especially at sites which are not threatened by looting and/or construction works.
7. Conclusions
We can affirm that the use of drones with multispectral or thermal cameras is a useful tool in the field of archeology, as shown by these results and other publications [
1,
2,
3,
4,
5,
6,
7,
8,
9,
10,
11]. The problem is in choosing the sensor to use to obtain the best results.
With the in-house system (Tecnikopter and Tetracam), we have found that the workflow is quite complex and involves laborious post-processing, but the results allow us to identify buried archaeological remains. The eBee has only allowed us to work with the Multispec 4C multispectral camera. The process of data capture and post-processing has been faster as the workflow is fully systematized. According to the data obtained and by means of merely visual comparison the best results have been obtained with the combination of the eBee and Thermomap. Simply by using the temperature index we can observe that the sharpness of the display is greater than with the other tools. However, it is not homogeneous for the rest of the cultivated fields that make up the ancient site. Additionally, although the results obtained with the latter system allow better identification of buried remains, spatial resolution is lost.
It is harder to speculate as to the nature of the archaeological structures but we can conclude that each documented structure behaves in a specific way. This means that the data obtained by these sensors, in this particular case, is not related to the vegetation cover but to what is happening in the subsoil.
As a consequence we focused on the thermal data and posited that they could be positive crop marks [
40,
41] due to the growth of more vegetation in a more humid zone, which would explain its lower temperature. In this way we could hypothesize that they were deeper structures such as types of tank, sink, or foundation caissons, since their widths vary between 7 m and 21 m.
This paper has shown that the use of drones with multispectral or thermal cameras is a useful tool in the field of archeology, providing data for archaeological surveying. As stated above, the use of these tools should become a common standardized procedure before starting an excavation. However, until now no comparison of data obtained with different drone systems and sensors, indicating which method obtained the best results, has been published. Despite our experiments, we conclude that there is not yet a single product (drone plus sensor) on the market that attains optimum results in the field of archeology, as is the case in other fields such as precision agriculture. As explained by other authors [
42], the character of archaeological features is so variable that it is not possible to establish some more automatic way of identifying possible examples. No single technique or tool was universally successful.


 ,
, 


