Assessing the Carbon Mitigation Potential of UAV-Based Last-Mile Delivery Using 3D Path Planning: A Case Study of Shanghai


Highlights
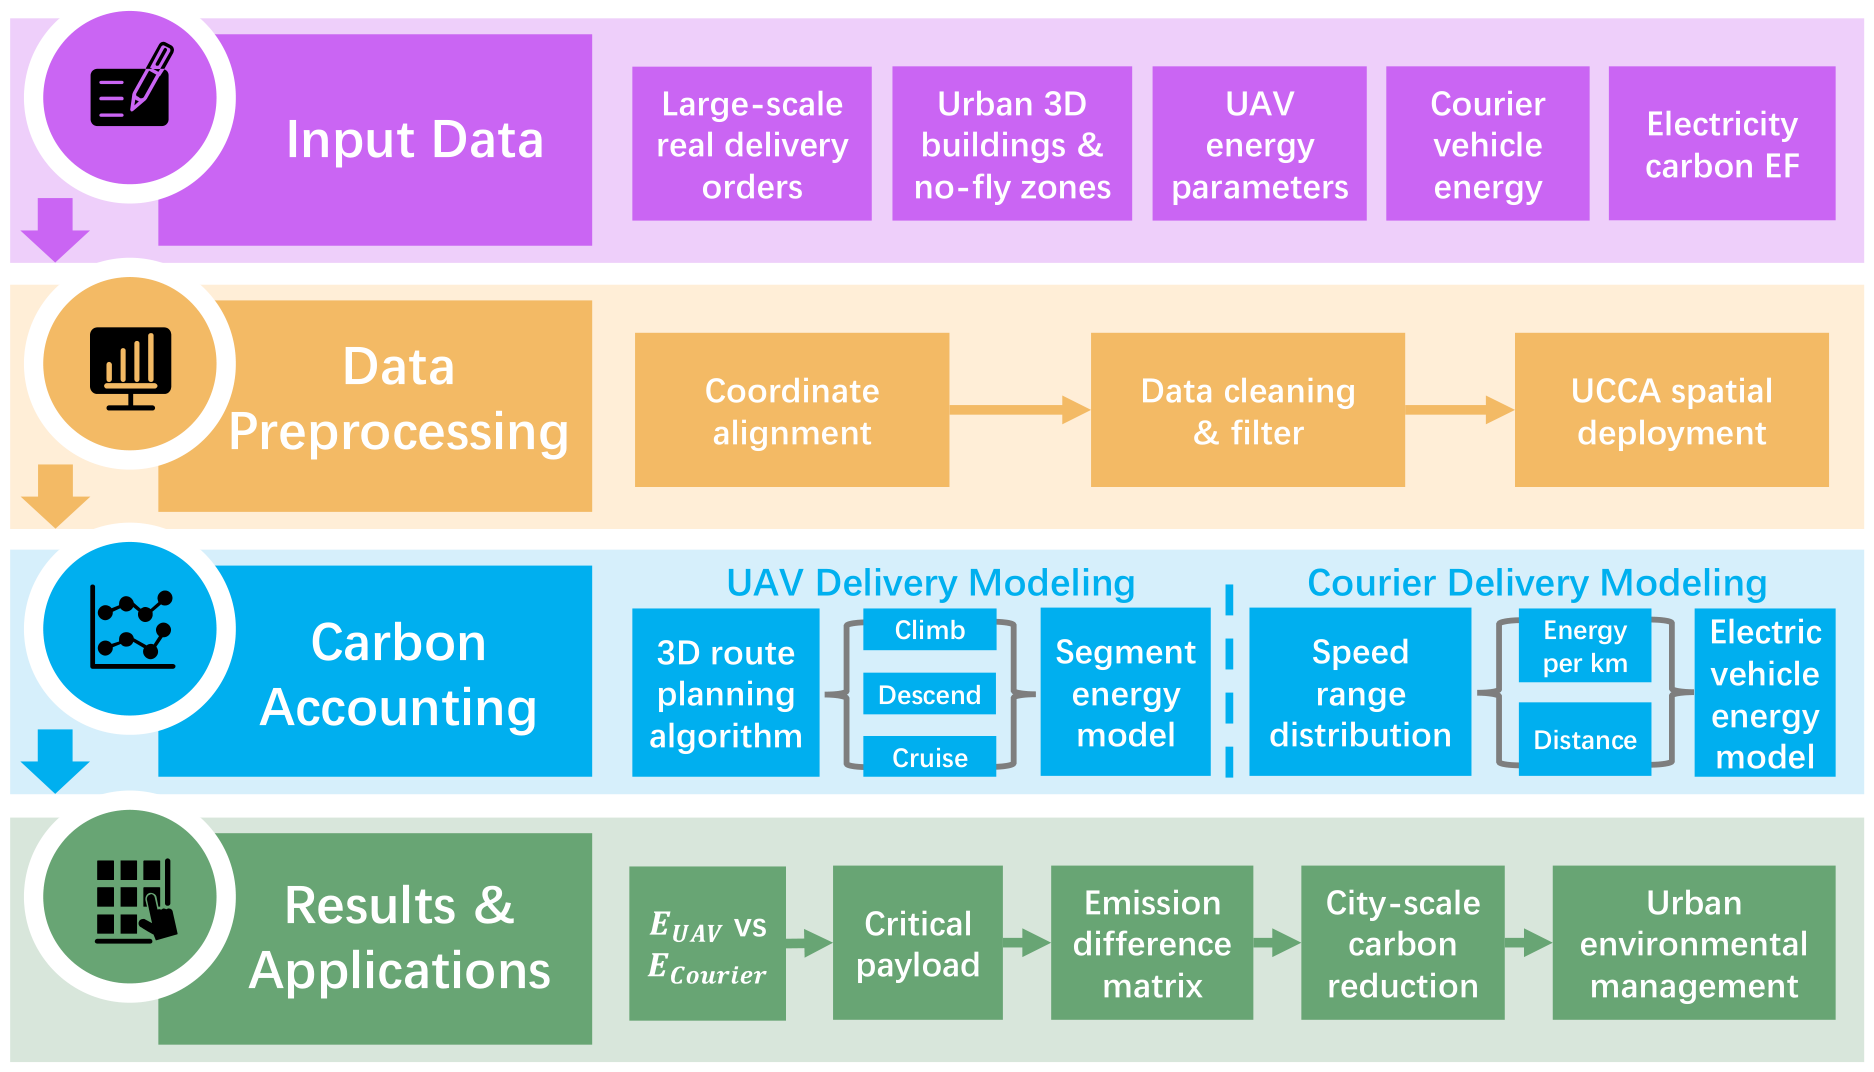
- A unified UAV–courier carbon accounting framework was developed using 185,673 real parcel orders and 3D urban spatial data in Shanghai.
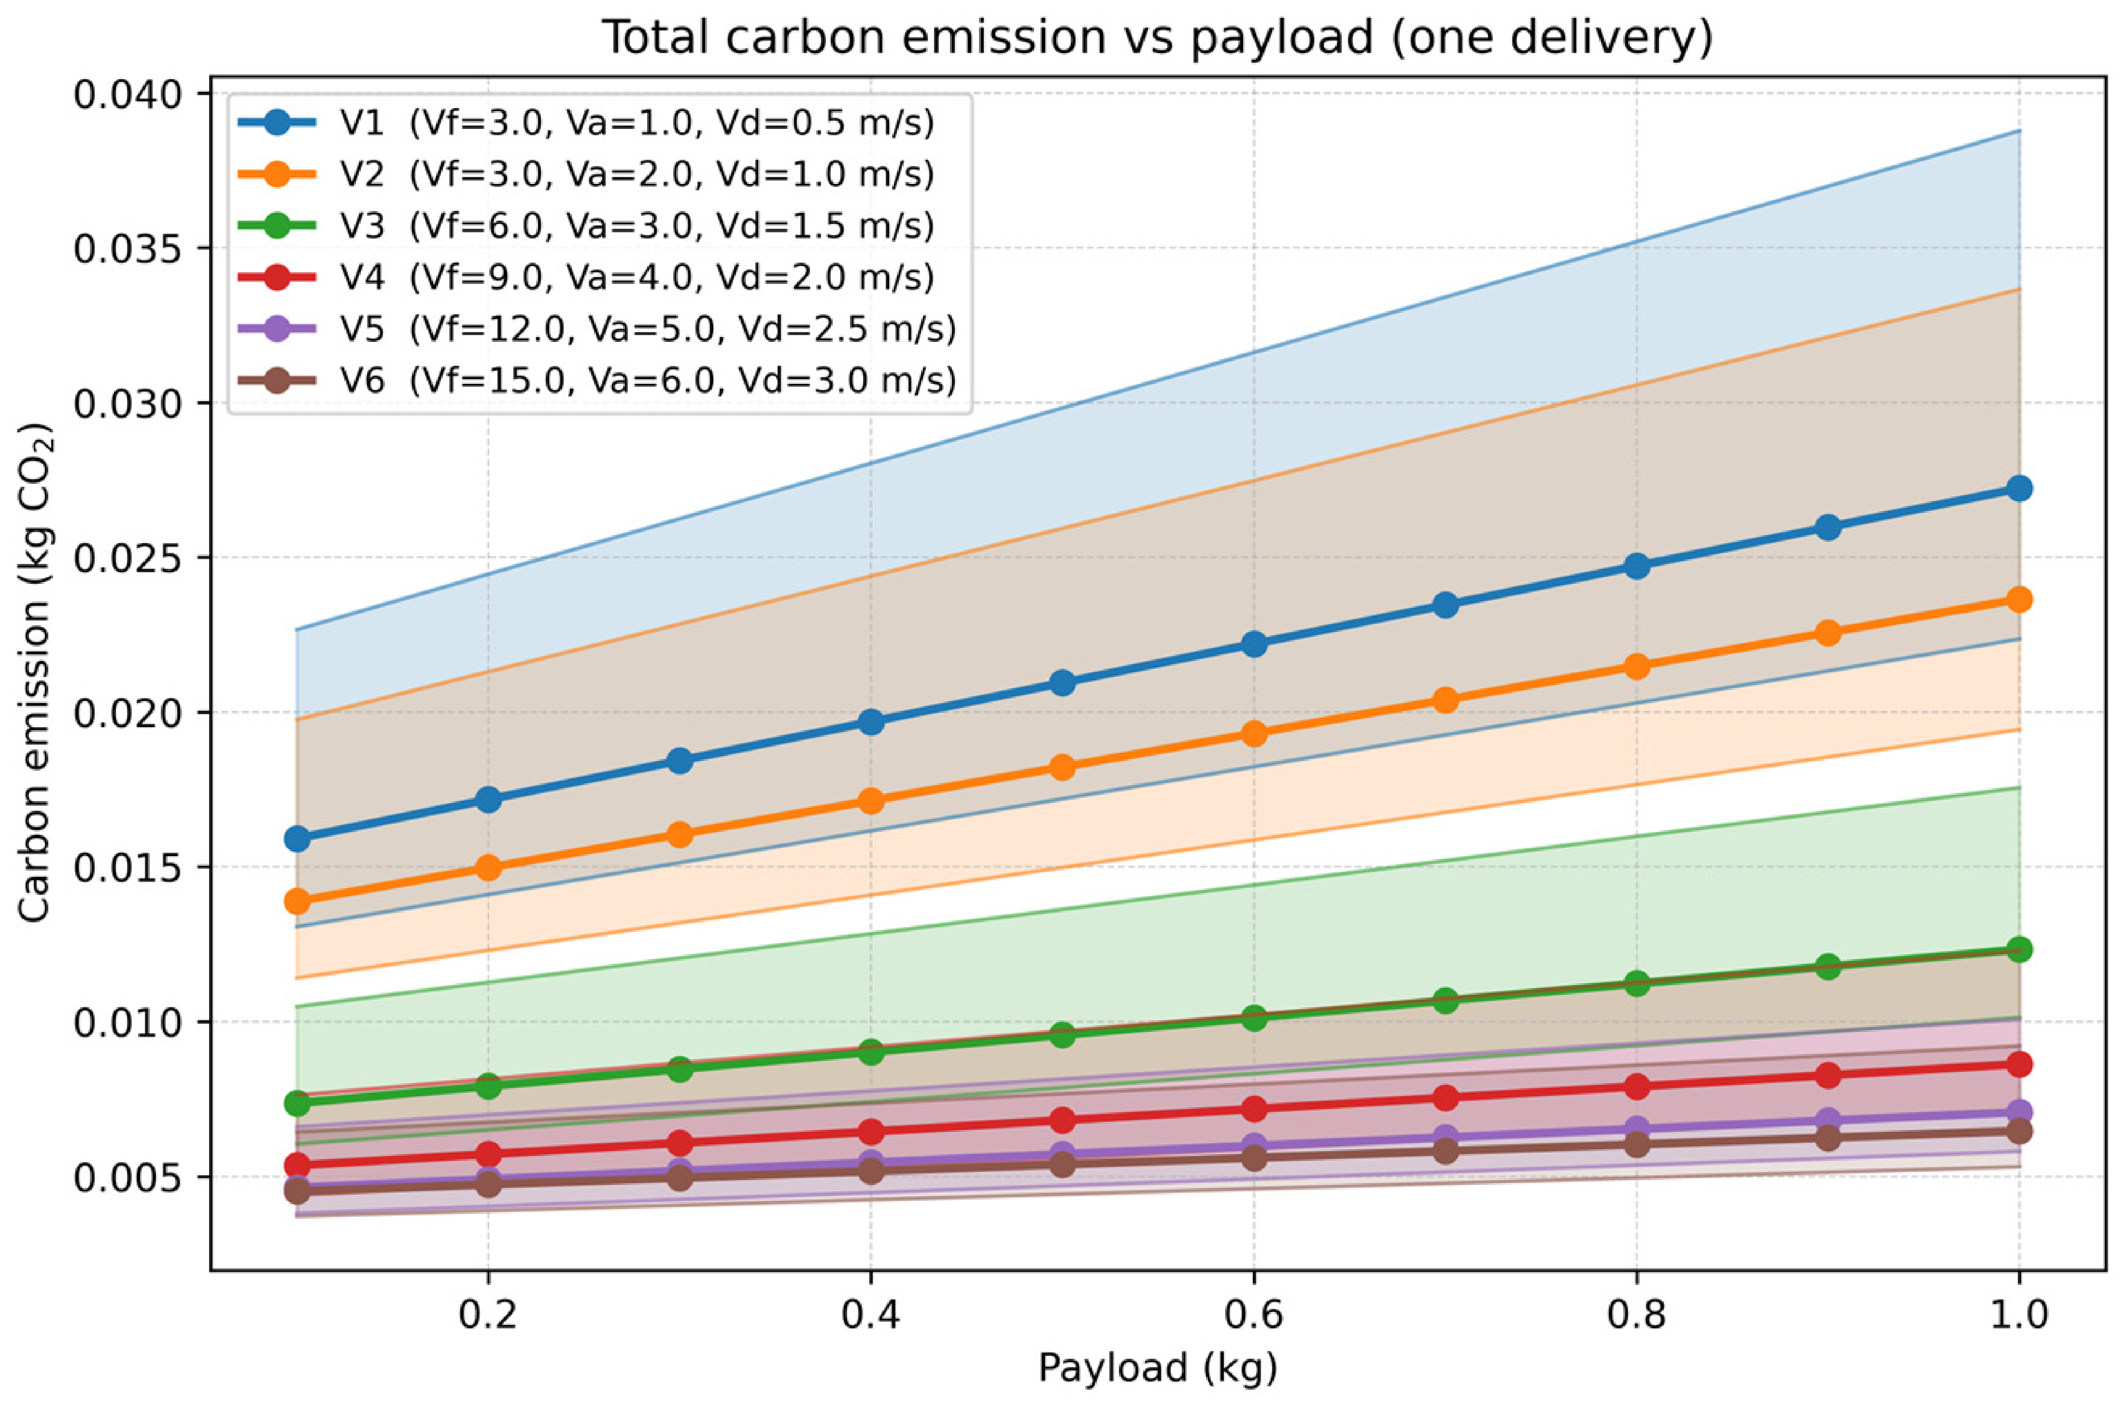
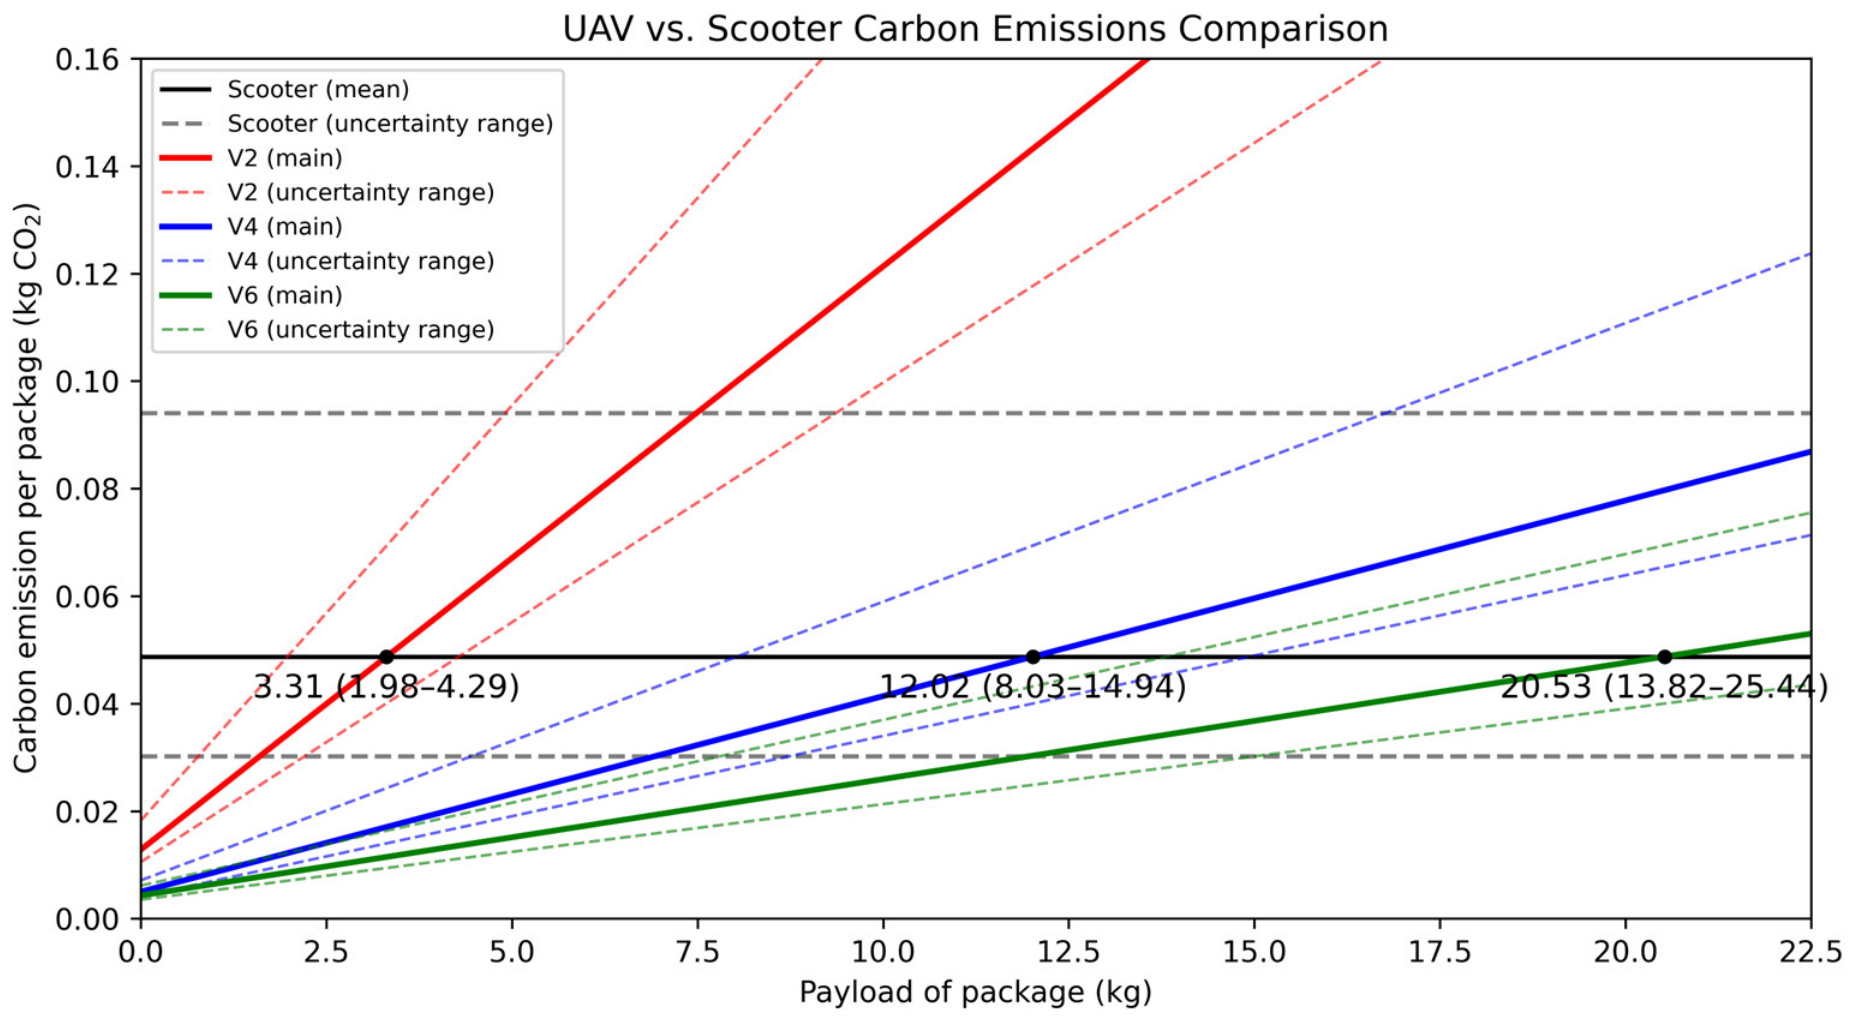
- Under the modeled assumptions, UAV delivery tends to show lower per-delivery carbon emissions under lightweight and high-speed operating conditions, with a scenario-based annual reduction estimate of about 343,300 t CO2 by 2030.
- The climate benefits of low-altitude logistics are highly condition-dependent and should be guided by payload, speed, and deployment scenarios.
- The proposed framework provides quantitative support for urban low-altitude logistics planning, infrastructure layout, and carbon-reduction policy design in Chinese megacities.
Abstract
1. Introduction
- Using more than 185,000 real last-mile orders, we examine carbon-emission differences between UAV delivery and conventional delivery under actual last-mile order settings.
- We innovatively incorporate 3D urban spatial constraints from a representative megacity to develop an energy–carbon assessment framework for UAV last-mile delivery that more closely reflects constrained urban flight conditions than purely scenario-based assumptions.
- We synthesize evidence and methods across multiple research dimensions relevant to low-altitude last-mile logistics to compare the carbon emissions of conventional delivery and UAV-based delivery. These studies have not yet been systematically integrated within a single low-altitude logistics scenario, yet they provide critical data and methodological foundations for assessing emissions from low-altitude logistics.
2. Related Work
2.1. State of Research on Last-Mile Delivery
2.2. State of Research on UAV Energy Consumption
2.3. State of Research on Energy Use of Electric Transport Modes
2.4. State of Research on UAV Path Planning
2.5. State of Research on Grid Electricity CO2 Emission Factors
2.6. Status of Research on Carbon Emissions from Low-Altitude Last-Mile Logistics
3. Materials and Methods
3.1. Study Area Overview
3.2. Data Sources
3.2.1. UAV Delivery Data
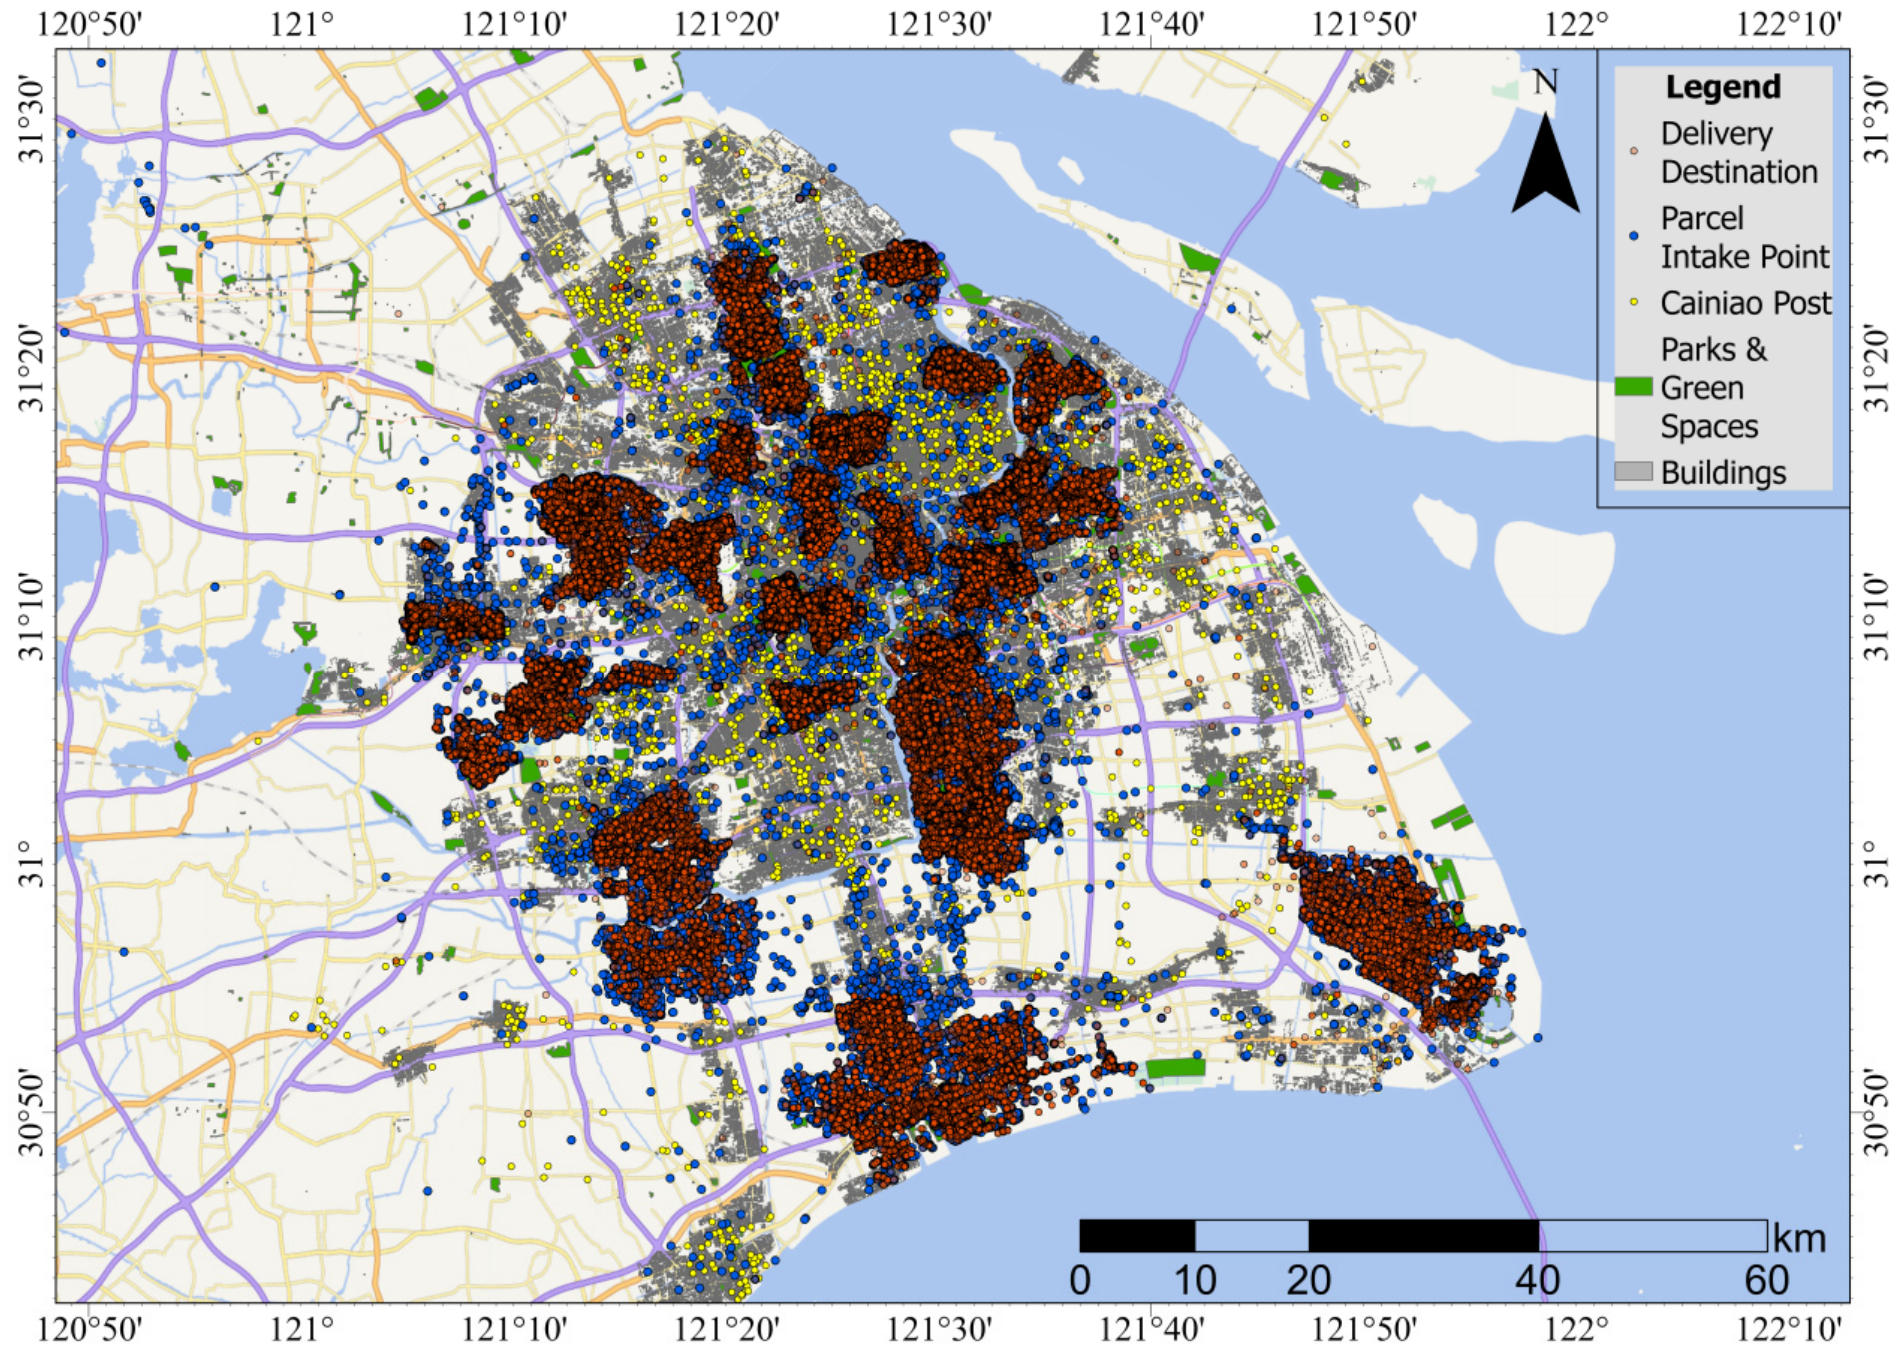
- Building data: These data are derived from the China Multi-Attribute Building (CMAB) vector dataset [56]. It covers 3667 cities across China and includes more than 31 million buildings and 23.6 billion m2 of rooftops.
- No-fly zone data (NoFly): UAV no-fly polygons were defined using the “parks and green spaces” category from the OpenSpaceGlobal urban open-space product [57].
- UAV parcel-delivery data: These data were obtained from the LaDe last-mile express delivery dataset. LaDe covers six consecutive months of Cainiao last-mile logistics data and includes five cities: Shanghai, Hangzhou, Chongqing, Yantai, and Jilin. It contains extensive parcel pickup and drop-off records, partial courier trajectory information, and urban road-network data, involving 21 k couriers and 10,677 k parcels [27].
- UAV return-to-hangar data: We used the 2025 coordinate dataset of Cainiao stations in Shanghai (CaiNiao_ShangHai2025), which we extracted from Amap (Gaode Map, https://lbs.amap.com, accessed on 18 August 2025) via its open Application Programming Interface (API).
- Baseline flight altitude for UAV routes: The baseline altitude was derived from civil aviation industry standards of the People’s Republic of China. The minimum route-design altitude should be higher than 40 m above the zero-elevation datum, and the maximum should not exceed 120 m above the altitude reference datum [58].
- Logistics UAV type: The power model in this study is based on field-measured energy-consumption data from the DJI M210 RTK V2 quadrotor UAV (SZ DJI Technology Co., Ltd., Shenzhen, China) [59].
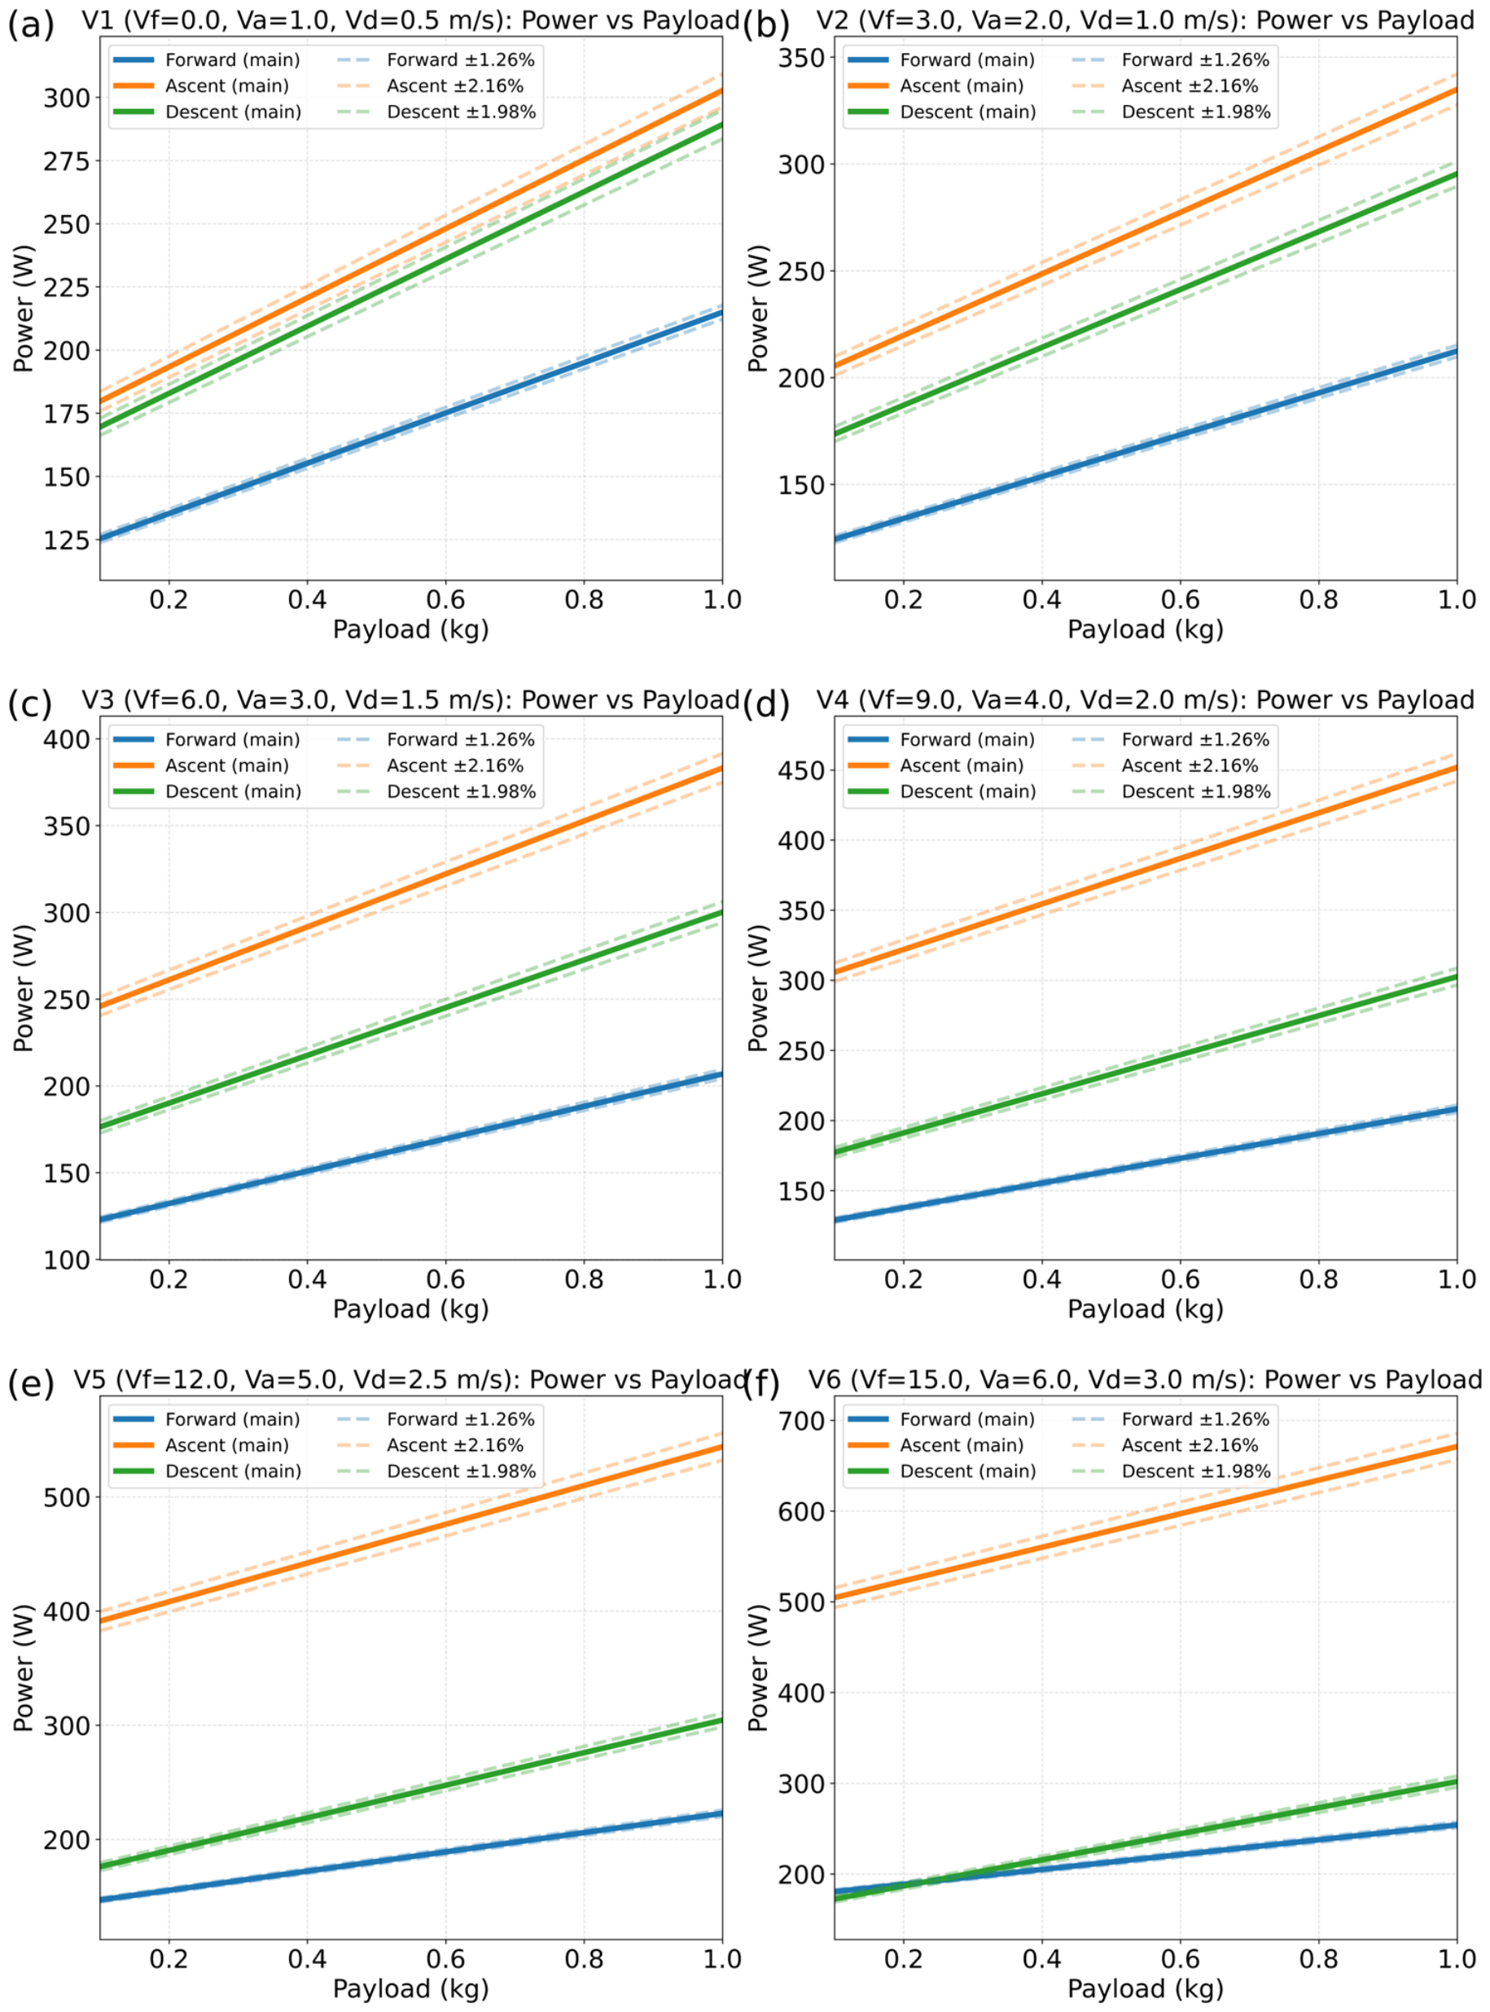
- Standard curve for payload weight–energy consumption: We adopted the multirotor UAV power model proposed by Gong et al. [40] as the baseline for energy calculations. This model establishes a general three-dimensional power model and provides closed-form power expressions for horizontal flight, vertical ascent, and vertical descent. In particular, the payload–power relationships used in this study are derived from the model-based simulation results reported by Gong et al. [40], rather than from direct parcel-delivery measurements. We, therefore, treat the resulting UAV estimates as baseline model outputs and explicitly propagate an additional model-form uncertainty in later sections.
3.2.2. Conventional Courier Delivery Data
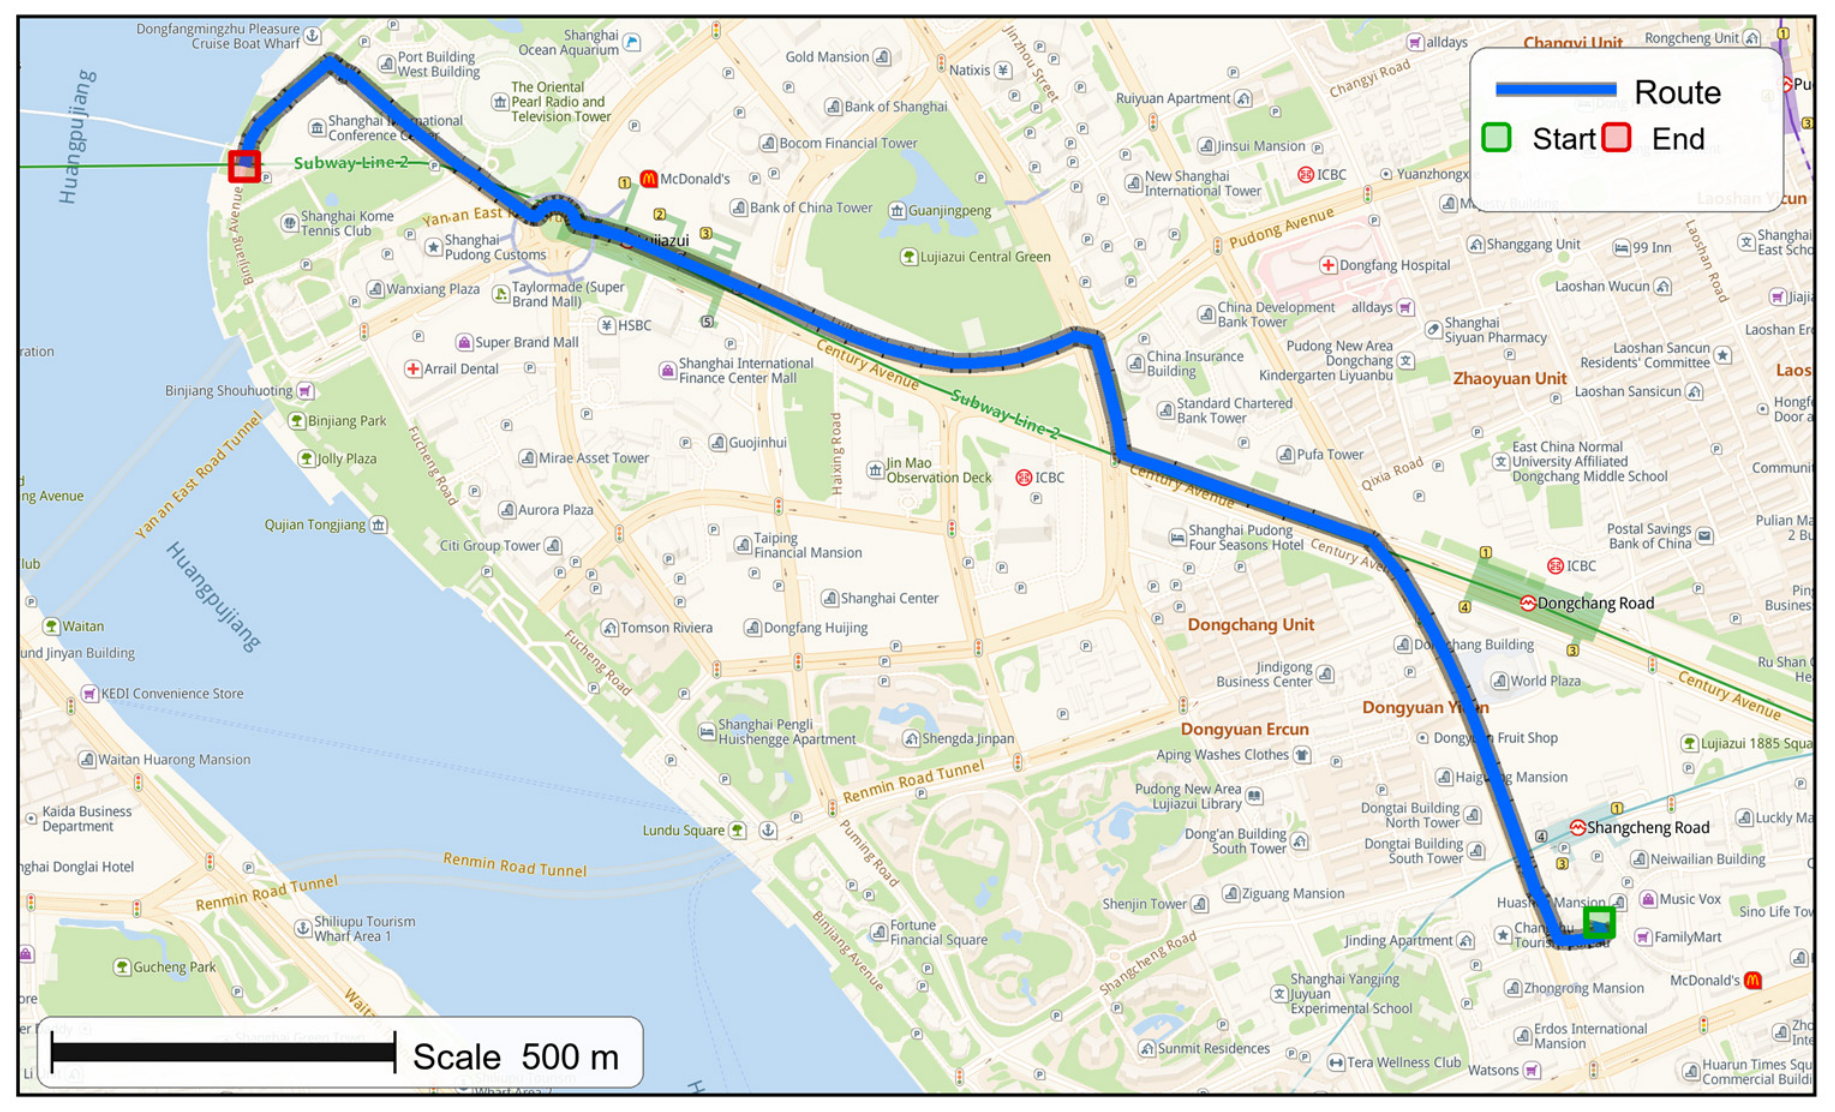
- Courier trajectory data: Derived from the last-mile parcel delivery dataset LaDe [27].
- Courier parcel data: Derived from the last-mile parcel delivery dataset LaDe [27].
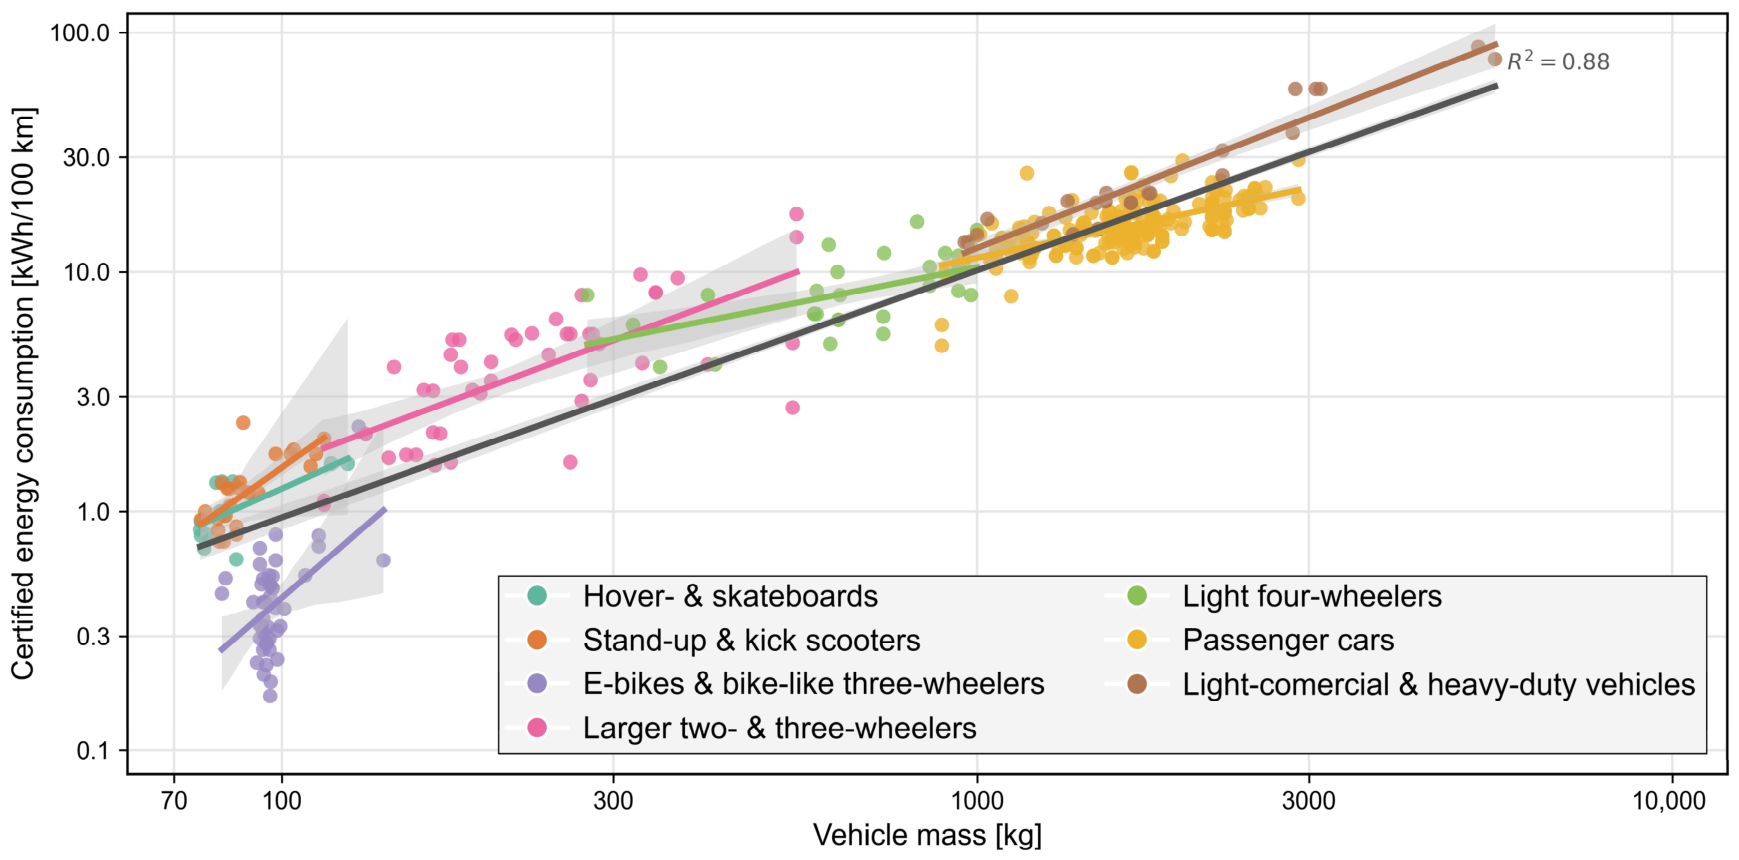
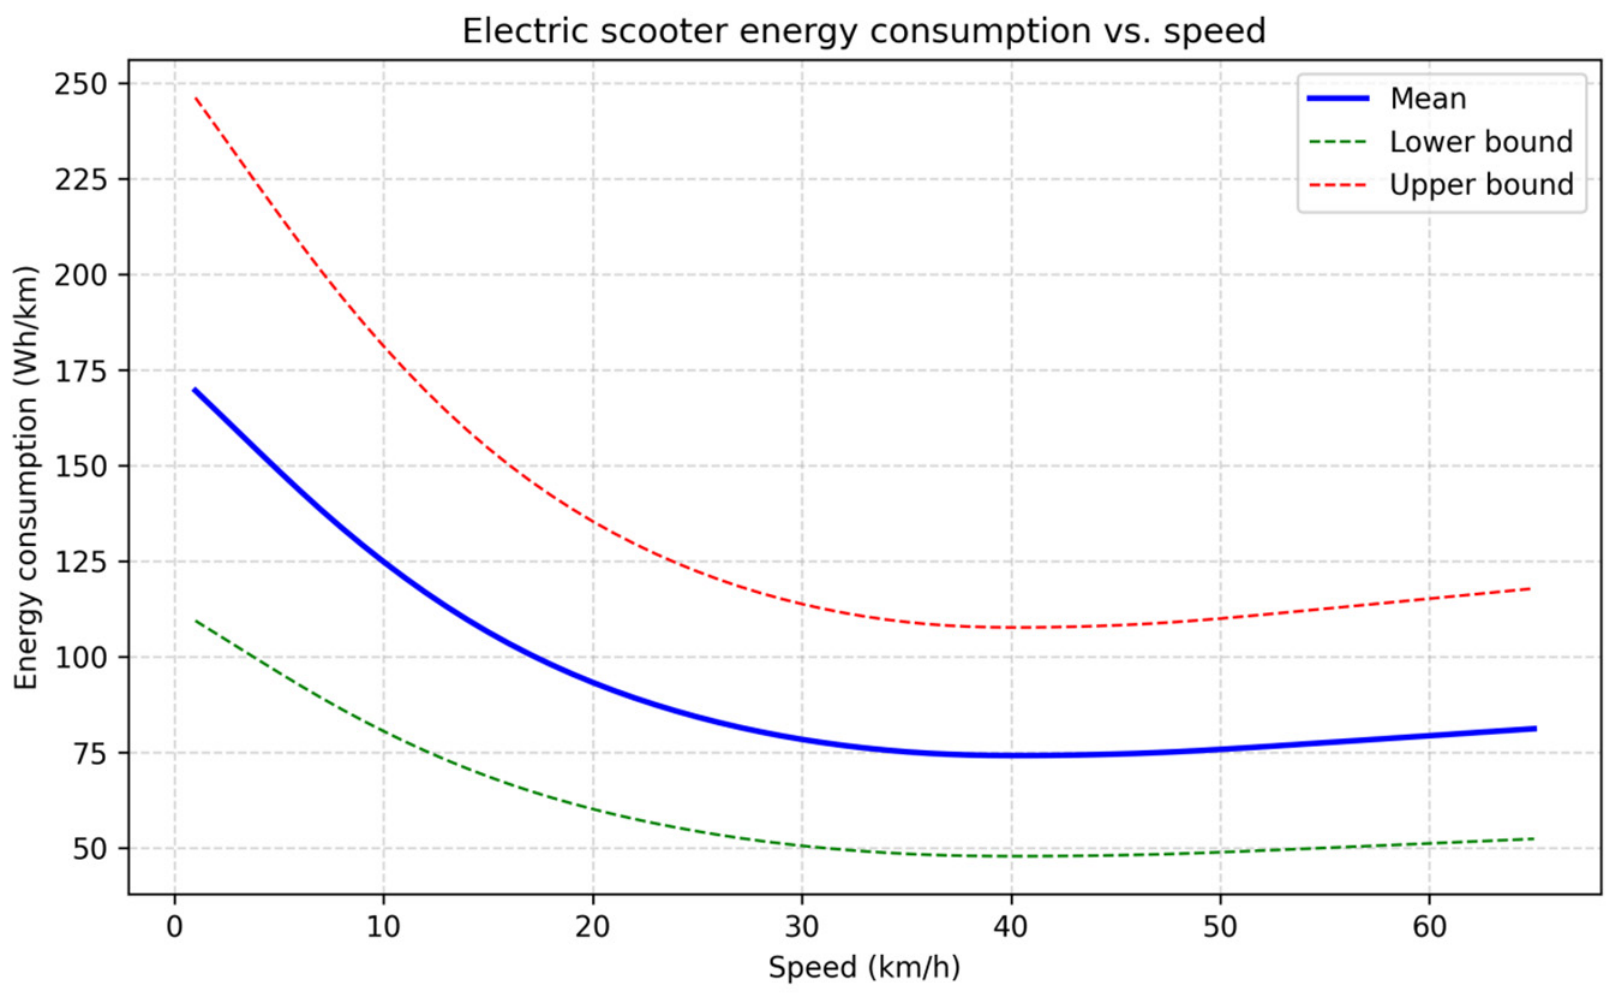
- Energy-consumption data for courier delivery vehicles: We adopted the cross-vehicle energy-consumption synthesis reported by Weiss et al. [42] in Environmental Sciences Europe. In measuring energy consumption for multiple vehicle types, the study also accounted for a standardized driver body mass of 70 kg, making the estimates more representative of real-world conditions.
3.2.3. Data for Converting Electricity Use to Carbon Emissions
3.3. Data Preprocessing
3.3.1. Data Cleaning
3.3.2. Sample Comparability Design Under the Released Data Structure
3.3.3. Delineation of the UCCA Deployment Space
3.4. Data Notes
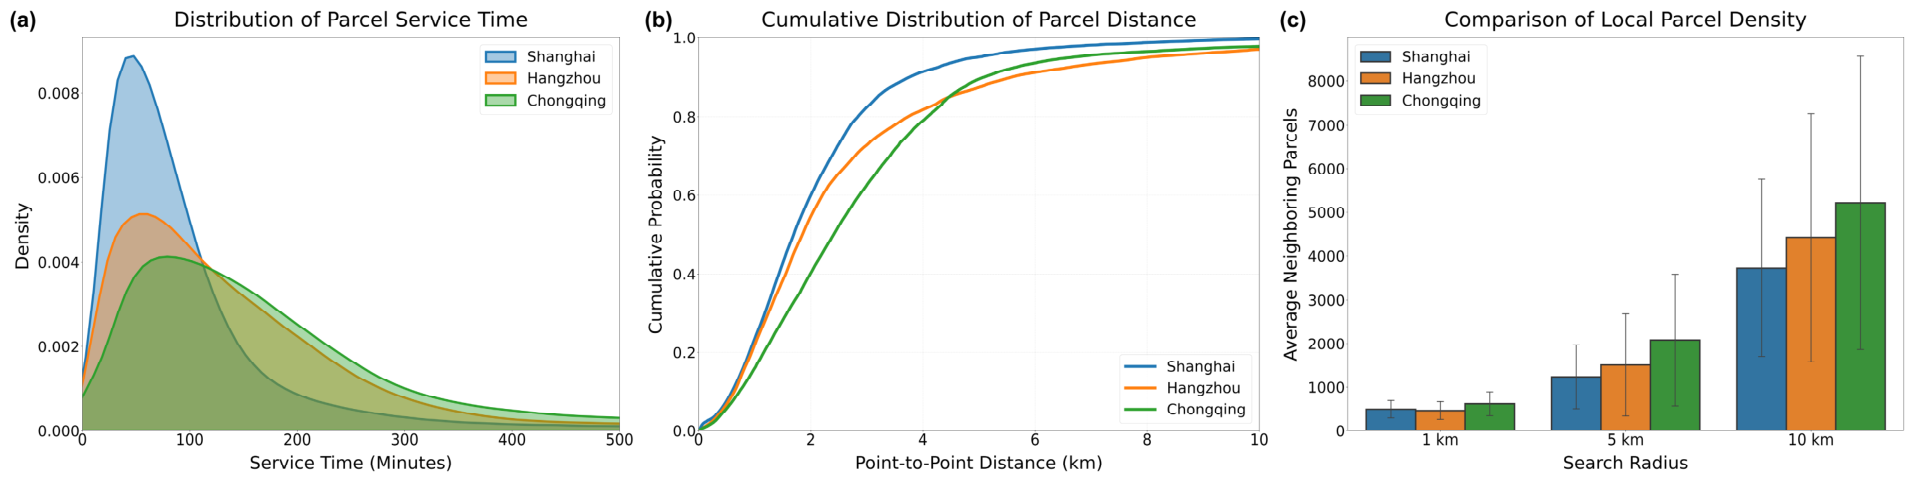
- For privacy protection, the released Shanghai data used in this study separate parcel records with usable original parcel coordinates from trajectory-enabled courier records with transformed privacy-preserving coordinates [27]. In the UAV-side parcel batch, the acceptance and delivery coordinates can be linked to the real urban 3D environment and are, therefore, suitable for UAV route planning. In the courier-side records, however, the parcel and trajectory coordinates are transformed for privacy protection. These transformed coordinates can still be used for internal distance-based calculations, including parcel-level point-to-point distance and local parcel-density estimation, but they cannot be directly overlaid with real building, no-fly-zone, or other geographic layers. As a result, the full-sample UAV and courier analyses cannot be conducted on exactly the same parcel instances, and the cross-sample comparison must be restricted to variables that are validly supported by both released data batches.
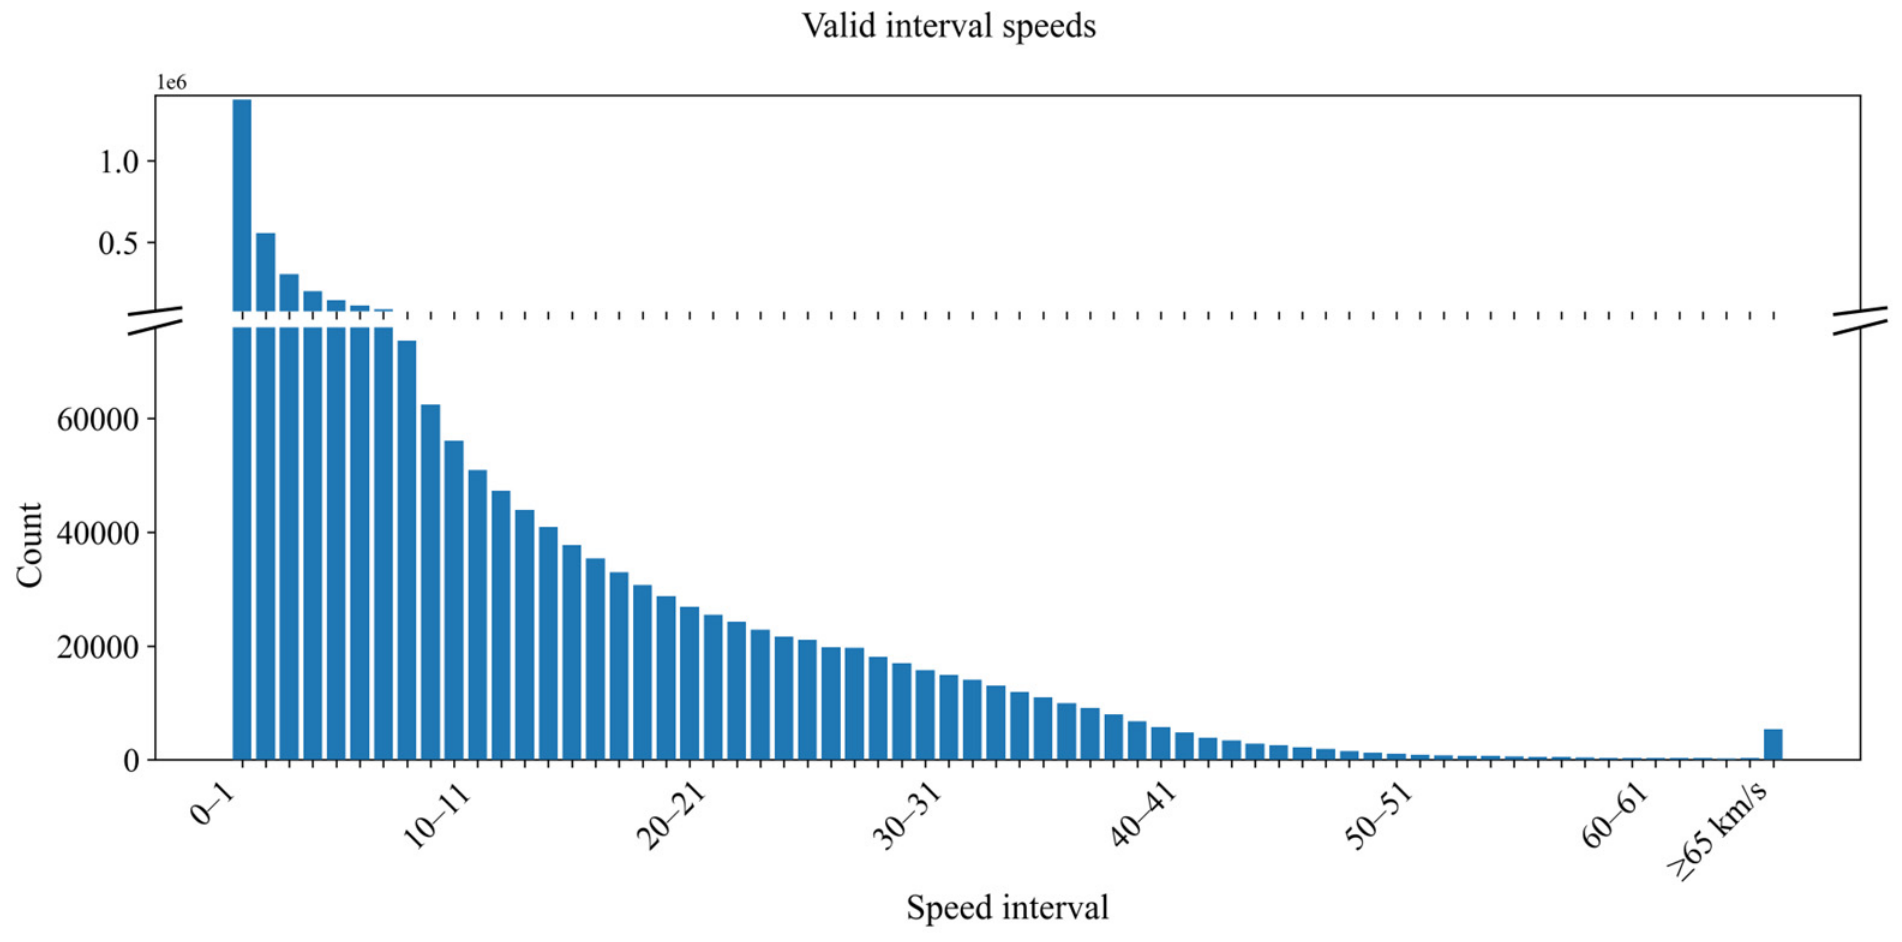
- We use the courier trajectory information, rather than directly using parcel records, to compute energy consumption for conventional delivery, for the following reasons: (i) Using the parcel acceptance and delivery coordinates as the origin and destination implicitly assumes that conventional delivery involves delivering only one parcel per trip, while in practice, couriers often carry multiple parcels along the same route, so this approach would overestimate energy consumption; (ii) using the parcel acceptance and delivery coordinates as the origin and destination also implies that energy is consumed only when the courier is carrying a parcel, but after completing a delivery, couriers may travel to the next pickup location with an empty vehicle, and this energy use is non-negligible. In summary, it is more reasonable to estimate average per-parcel energy consumption and carbon emissions by quantifying the distribution across speed intervals and combining it with courier-vehicle energy-consumption data at different speeds.
3.5. UAV Path Planning
3.5.1. K-Dimensional Tree Algorithm
- Build a KD-tree index over station coordinates.
- For each delivery point, run a nearest-neighbor query to return the coordinates and distance of the nearest hangar.
3.5.2. 3D Path Planning Based on Theta* and Lazy Theta*
3.5.3. Computational Procedure
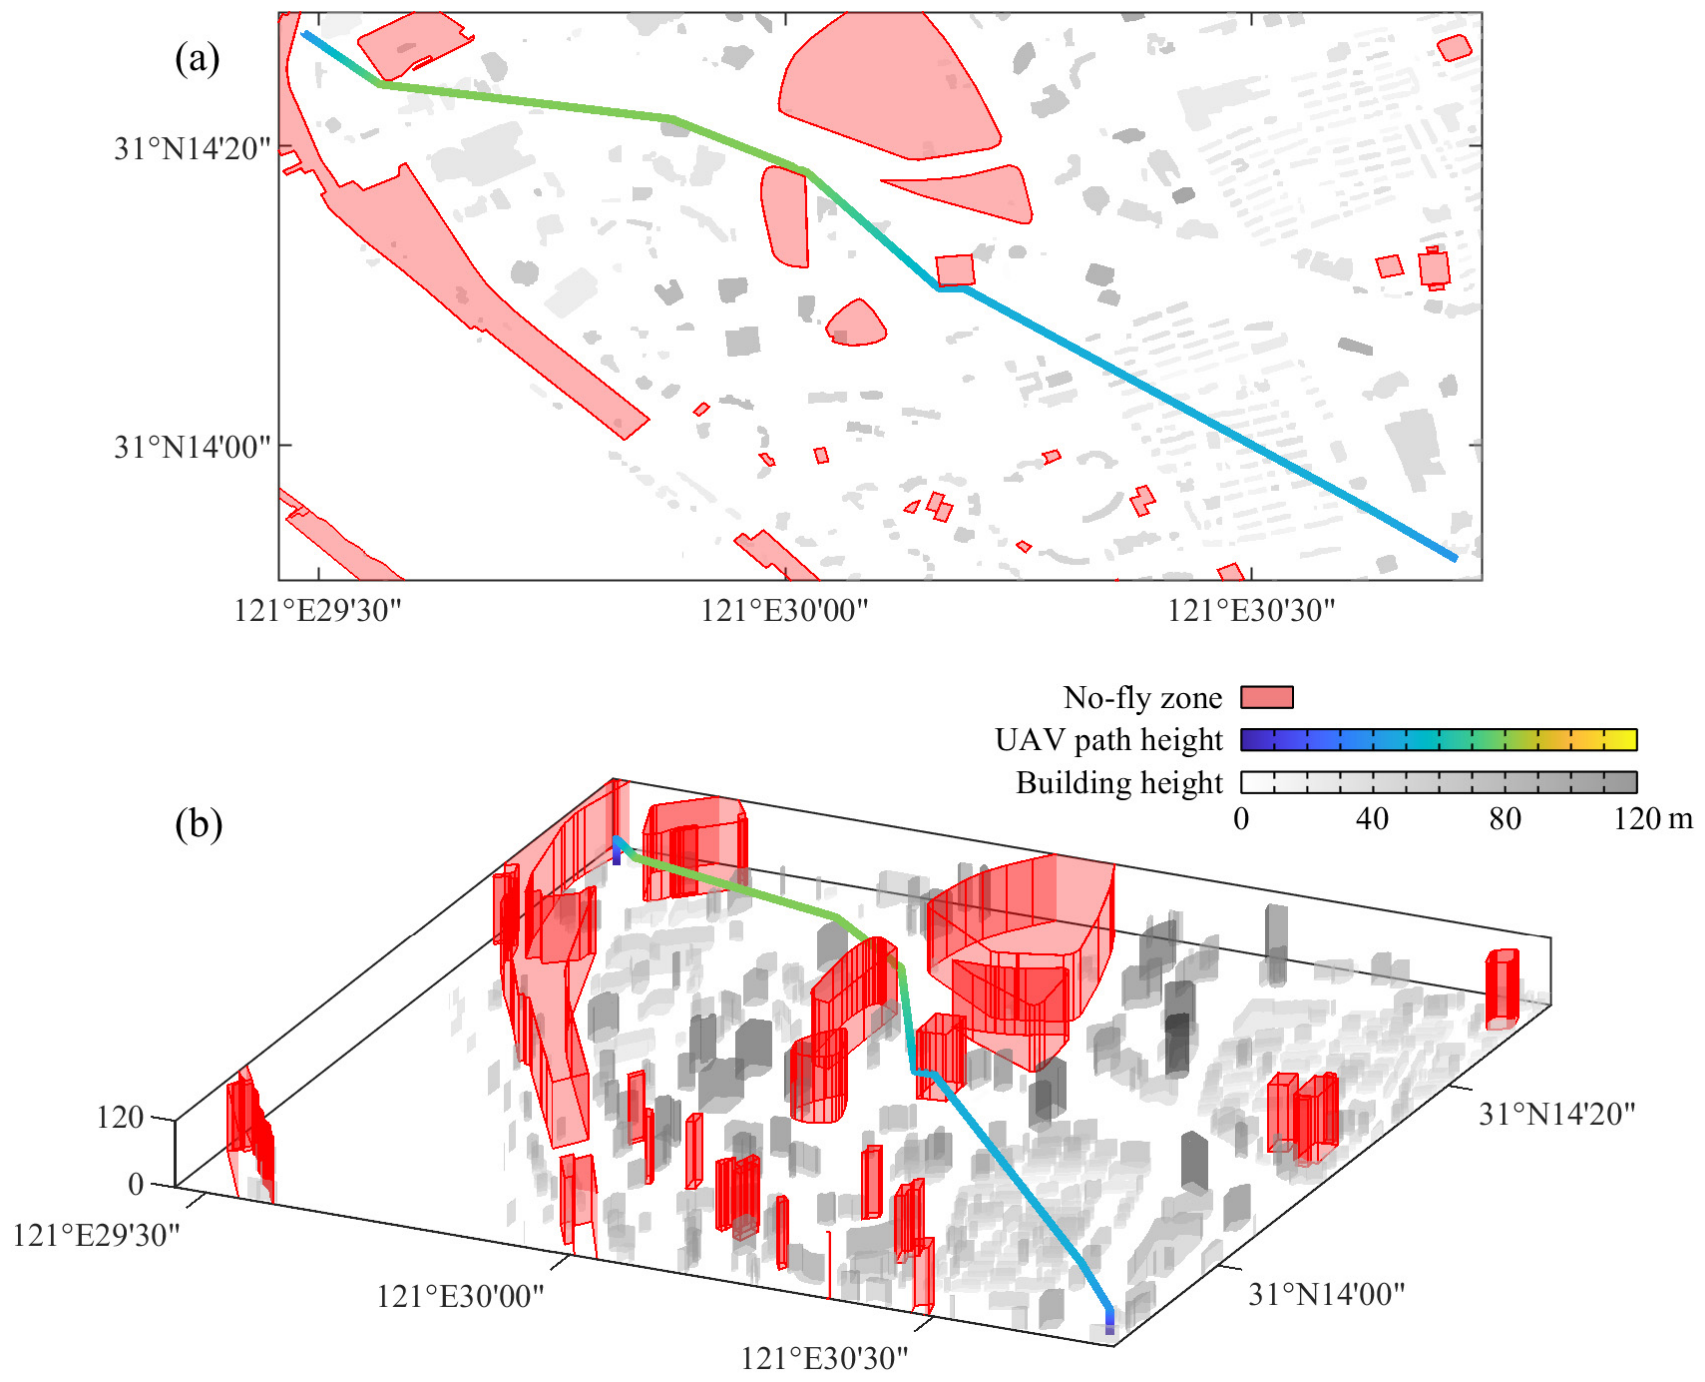
- Spatial harmonization and obstacle preparation. Parcel acceptance and delivery coordinates, Cainiao station coordinates from CaiNiao_ShangHai2025, CMAB building-height vectors [56], and NoFly polygons are harmonized to Web Mercator so that all distance calculations and grid operations are performed in a consistent metric coordinate system. Building and no-fly shapefiles are loaded once, and their bounding boxes are precomputed to accelerate spatial filtering.
- Nearest-hangar matching. We build a KD-tree [60] from the filtered Cainiao station coordinates, and the nearest compliant hangar is queried for each delivery point to determine the destination of the second flight leg.
- Origin–destination deduplication and caching. To reduce repeated path searches at city scale, origin–destination pairs for both flight legs are hashed and deduplicated on a 10 m grid in Web Mercator space. Orders sharing the same deduplicated key reuse the same path-planning result.
- Fast corridor screening. Before full 3D search, a local corridor check is performed between the origin and destination. A 200 m corridor buffer is applied around the straight-line segment, and precomputed building/no-fly bounding boxes are used for rapid screening. If no building is above 40 m and no no-fly polygon intersects the corridor, the task is treated as a direct-flight case, and the horizontal distance is calculated directly.
- Local 3D grid search. If direct flight is not feasible, a local 3D occupancy grid is constructed over the minimum bounding rectangle spanning the start and end points, expanded by 50 m in both horizontal directions and discretized at a 10 m resolution. Building heights are discretized into 10 m vertical layers using ceiling rounding, whereas no-fly polygons are encoded as fully blocked cells up to 120 m (12 layers). The start and end nodes are snapped to the 10 m lattice, and their initial flight layers are set to the larger of the local obstacle layer and the fourth vertical layer (40 m). The outermost x–y boundary and the top/bottom boundary of the local grid are marked as non-traversable. Path search is then performed using a near-optimal any-angle 3D search derived from the Lazy Theta* family [28,51], with 26-neighbor connectivity and line-of-sight relaxation. The line-of-sight test distinguishes full, partial, and blocked visibility. The search cost combines accumulated path cost, a Euclidean-distance heuristic, and an obstacle-aware penalty term, with the search-weight vector set to [1, 1.25, ||Δx, Δy, Δz||].
- Segment extraction. For each feasible path, node-to-node grid differences are converted back to metric distances using the 10 m grid size and decomposed into ascent, descent, and cruise components. Transitions with |Δz| ≤ 1 m are treated as near-horizontal motion. The resulting outputs include vertical ascent/descent distances and their associated horizontal distances for both flight legs, as summarized in Table 1.
- Parallel execution and batch writing. To improve computational scalability, unique path tasks are dispatched in parallel using a two-queue strategy: all tasks first enter a fast queue and are downgraded to a slow queue if the initial search exceeds a 10 s timeout threshold. At initialization, approximately half of the available workers are assigned to the fast queue and the remainder to the slow queue; once the fast queue is exhausted, all workers are reassigned to the slow queue.
3.6. Speed-Interval Distribution of Couriers
- Coordinate distance calculation: For each trajectory, the distance between adjacent points is computed using the 2D Euclidean formula:
- 2.
- Outlier removal: First, due to positioning errors, some inter-point distances may be abnormal; considering the upper speed bound of courier vehicles, we set a threshold of 1000 m and discard any single-segment distance exceeding this threshold to remove obvious noise that would distort total distance estimates; second, to account for parking or non-working periods, if a courier’s trajectory coordinates remain unchanged for an extended duration, the segment is treated as abnormal, and given that red-light durations in cities are typically 60–120 s, we set the threshold to six intervals (120 s). Segments remaining after outlier removal are treated as valid intervals.
- 3.
- Speed-interval distribution statistics: Each pair of adjacent trajectory points is treated as one interval; we compute the travel distance for each valid interval i to estimate the average speed for that interval and store the results as interval–speed data.
3.7. The UCCA Carbon-Emission Model
3.7.1. UAV Delivery Carbon-Emission Model
3.7.2. Carbon-Emission Model for Conventional Courier Delivery
4. Results
4.1. Observable Comparability Between the UAV Valid Parcel Sample and the Courier Parcel Sample
4.2. Results of the UAV Delivery Carbon-Emission Model
4.2.1. Sample Composition and Validity
4.2.2. UAV Path-Planning Results
4.2.3. UAV Delivery Energy Use and Carbon Emissions
4.3. Results of the Courier Delivery Carbon-Emission Model
4.3.1. Results of Speed-Interval Distribution for Couriers
4.3.2. Courier Delivery Energy Use and Carbon Emissions
5. Discussion
5.1. Comparison and Analysis of and
5.2. Critical Payload
5.3. Carbon-Emission Difference Matrix
5.4. Scenario Analysis of Potential Carbon Reduction in Shanghai by 2030
5.5. Cross-City Applicability of the Framework
5.6. Other Sources of Uncertainty
6. Conclusions
- By integrating a 3D UAV path-planning algorithm, an empirically calibrated segment-wise UAV energy model, a real-world power-consumption model for large electric courier vehicles, and a medium- to long-term grid emission factor, we propose a last-mile express delivery planning model and carbon-emission assessment pipeline aligned with the Route Design Specification of the Light–Small Unmanned Aircraft System for Urban Logistics. The framework is, in principle, transferable to low-altitude logistics assessments in other Chinese cities, although the numerical outcomes require local recalibration.
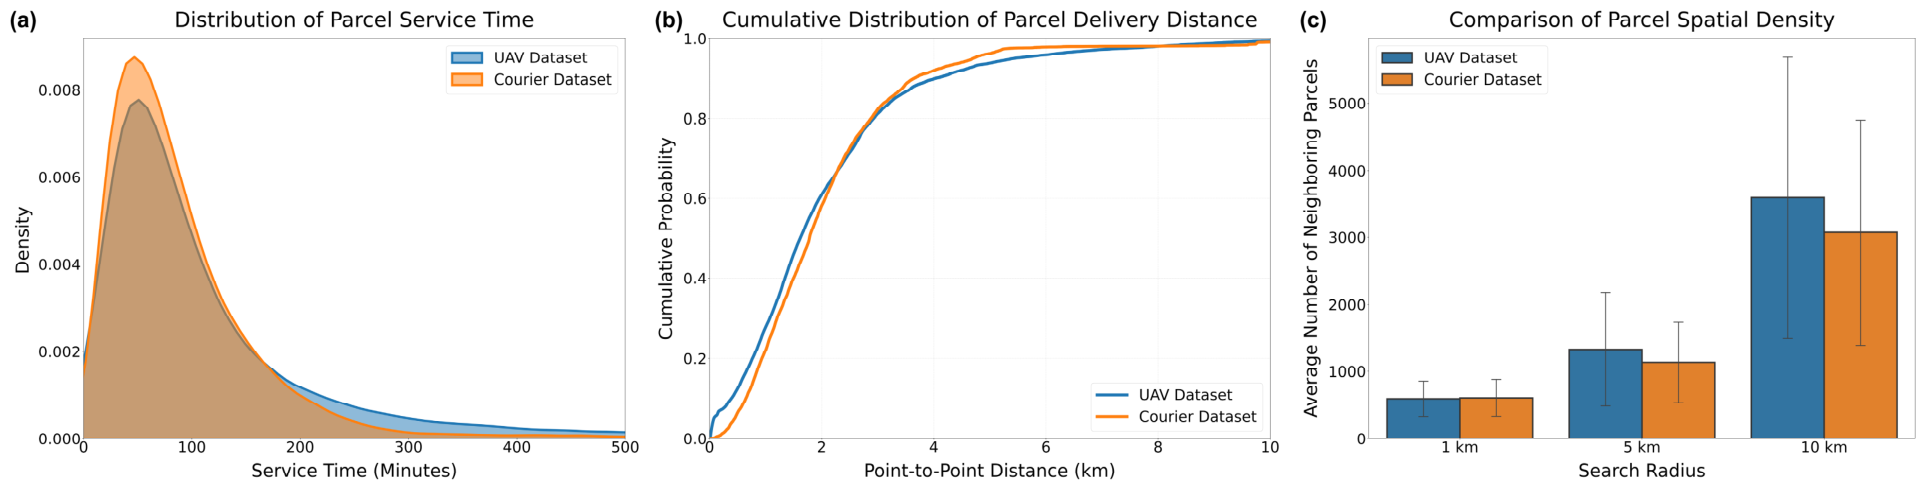
- In the Shanghai case, UAV delivery and conventional courier delivery exhibit only limited differences in parcel-scale delivery geometry, yet they differ substantially in carbon-emission levels. Under light-load and high-speed conditions, UAV delivery shows a lower-carbon advantage in the baseline analysis under the modeled assumptions. The observable sample-comparability analysis further shows that the UAV valid parcel sample (n = 185,673) and the trajectory-linked courier parcel sample (n = 98,210) are broadly similar in service duration, point-to-point distance, and local parcel density, which strengthens the validity of the cross-mode comparison. These findings further suggest that the environmental performance of low-altitude logistics is highly conditional and should be managed through scenario-specific deployment.
- Based on the carbon-emission difference matrix and the representative 1 kg parcel scenario, full-scale UAV deployment in Shanghai could yield a scenario-based annual carbon reduction of approximately 343,300 t CO2 by 2030. This magnitude is roughly comparable to the direct carbon emissions of Shanghai’s “Metal Products” sector in 2022 [64,65,66,67,68,69].
Author Contributions
Funding
Data Availability Statement
Acknowledgments
Conflicts of Interest
Abbreviations
| UAV | Unmanned Aerial Vehicle |
| UCCA | UAV–Courier Carbon Accounting |
| API | Application Programming Interface |
| EF | Emission Factor |
| ETA | Estimated Time of Arrival |
| POI | Point of Interest |
| KD-tree | K-Dimensional Tree |
| GPS | Global Positioning System |
| NDCs | Nationally Determined Contributions |
| CAGR | Compound Annual Growth Rate |
| CEADs | Carbon Emission Accounts and Datasets |
| RMB | Renminbi |
| CMAB | China Multi-Attribute Building dataset |
| LaDe | Last-mile Delivery dataset |
| CO2 | Carbon Dioxide |
| NoFly | No-Fly-zone dataset |
| DJI Matrice 210 RTK V2 | DJI Matrice 210 RTK V2 quadrotor UAV |
References
- Friedlingstein, P.; O’sullivan, M.; Jones, M.W.; Andrew, R.M.; Hauck, J.; Landschützer, P.; Le Quéré, C.; Li, H.; Luijkx, I.T.; Olsen, A.; et al. Global carbon budget 2024. Earth Syst. Sci. Data Discuss. 2024, 17, 965–1039. [Google Scholar] [CrossRef]
- Dhakal, S.; Minx, J.C.; Toth, F.; Abdel-Aziz, A.; Figueroa Meza, M.; Hubacek, K.; Jonckheere, I.G.; Kim, Y.-G.; Nemet, G.F.; Pachauri, S. Emissions trends and drivers (chapter 2). In Climate Change 2022—Mitigation of Climate Change: Working Group III Contribution to the Sixth Assessment Report of the Intergovernmental Panel on Climate Change; Cambridge University Press: Cambridge, UK, 2022. [Google Scholar] [CrossRef]
- World Economic Forum. Transforming Urban Logistics: Sustainable and Efficient Last-Mile Delivery in Cities; World Economic Forum: Geneva, Switzerland, 2024. [Google Scholar]
- Liu, Z.; Deng, Z.; He, G.; Wang, H.; Zhang, X.; Lin, J.; Qi, Y.; Liang, X. Challenges and opportunities for carbon neutrality in China. Nat. Rev. Earth Environ. 2022, 3, 141–155. [Google Scholar] [CrossRef]
- Wang, H.-L.; Weng, Y.-Y.; Pan, X.-Z. Comparison and analysis of mitigation ambitions of Parties’ updated Nationally Determined Contributions. Adv. Clim. Change Res. 2023, 14, 4–12. [Google Scholar] [CrossRef]
- Ao, Z.; Fei, R.; Jiang, H.; Cui, L.; Zhu, Y. How can China achieve its goal of peaking carbon emissions at minimal cost? A research perspective from shadow price and optimal allocation of carbon emissions. J. Environ. Manag. 2023, 325, 116458. [Google Scholar] [CrossRef] [PubMed]
- Chen, X.H.; Tee, K.; Elnahass, M.; Ahmed, R. Assessing the environmental impacts of renewable energy sources: A case study on air pollution and carbon emissions in China. J. Environ. Manag. 2023, 345, 118525. [Google Scholar] [CrossRef] [PubMed]
- Hepburn, C.; Qi, Y.; Stern, N.; Ward, B.; Xie, C.; Zenghelis, D. Towards carbon neutrality and China’s 14th Five-Year Plan: Clean energy transition, sustainable urban development, and investment priorities. Environ. Sci. Ecotechnol. 2021, 8, 100130. [Google Scholar] [CrossRef]
- Zhong, Y.; Cui, S.; Bai, X.; Shang, W.; Huang, W.; Liu, L.; Wang, S.; Zhu, R.; Zhai, Y.; Zhang, Y. Carbon emissions from urban takeaway delivery in China. npj Urban Sustain. 2024, 4, 39. [Google Scholar] [CrossRef]
- Saenz, J.; Figliozzi, M.; Faulin, J. Assessment of the Carbon Footprint Reductions of Tricycle Logistics Services. Transp. Res. Rec. 2016, 2570, 48–56. [Google Scholar] [CrossRef]
- Saenz-Esteruelas, J.; Figliozzi, M.; Serrano, A.; Faulin, J. Electrifying Last-Mile Deliveries: A Carbon Footprint Comparison between Internal Combustion Engine and Electric Vehicles. In Proceedings of the Smart Cities; Springer Nature: Cham, Switzerland, 2016; pp. 76–84. [Google Scholar]
- Dong, Y.; Guo, X.; Wang, M.; Xu, J. Modeling carbon intensity of electric vehicles in the well-to-wheels phase under different traffic flow conditions. iScience 2024, 27, 111070. [Google Scholar] [CrossRef]
- Stolaroff, J.K.; Samaras, C.; O’Neill, E.R.; Lubers, A.; Mitchell, A.S.; Ceperley, D. Energy use and life cycle greenhouse gas emissions of drones for commercial package delivery. Nat. Commun. 2018, 9, 409. [Google Scholar] [CrossRef]
- China Academy of Information and Communications Technology. Low-Altitude Economy: Policy and Industrial Ecosystem Development in China; China Academy of Information and Communications Technology (CAICT): Beijing, China, 2024. [Google Scholar]
- Doole, M.; Ellerbroek, J.; Hoekstra, J. Estimation of traffic density from drone-based delivery in very low level urban airspace. J. Air Transp. Manag. 2020, 88, 101862. [Google Scholar] [CrossRef]
- Eichleay, M.; Evens, E.; Stankevitz, K.; Parker, C. Using the Unmanned Aerial Vehicle Delivery Decision Tool to Consider Transporting Medical Supplies via Drone. Glob. Health Sci. Pract. 2019, 7, 500. [Google Scholar] [CrossRef]
- Li, Z.; Li, S.; Lu, J.; Wang, S. Air Route Network Planning Method of Urban Low-Altitude Logistics UAV with Double-Layer Structure. Drones 2025, 9, 193. [Google Scholar] [CrossRef]
- Murray, C.C.; Chu, A.G. The flying sidekick traveling salesman problem: Optimization of drone-assisted parcel delivery. Transp. Res. Part C Emerg. Technol. 2015, 54, 86–109. [Google Scholar] [CrossRef]
- Sadeghi Esfahlani, S.; Simanjuntak, S.; Sanaei, A.; Fraess-Ehrfeld, A. Advanced Drone Routing and Scheduling for Emergency Medical Supply Chains in Essex. Drones 2025, 9, 664. [Google Scholar] [CrossRef]
- Securities Times. With 740,000 Commercial Orders, Meituan Accelerates Its UAV Rollout as JD.com, FlashEx and Other Giants Double Down on the “Low-Altitude Battlefield” of Instant Retail. Securities Times, 23 December 2025.
- Touch Shanghai. Delivery Descends from the Sky! Meituan’s First Regular Commercial Drone Route Is Officially Launched in Shanghai! Touch Shanghai, 6 May 2023.
- Brown, J.R.; Bushuev, M.A. Last mile delivery with drones: A carbon emissions comparison. Int. J. Sustain. Transp. 2024, 18, 791–802. [Google Scholar] [CrossRef]
- Figliozzi, M.A. Lifecycle modeling and assessment of unmanned aerial vehicles (Drones) CO2e emissions. Transp. Res. Part D Transp. Environ. 2017, 57, 251–261. [Google Scholar] [CrossRef]
- Goodchild, A.; Toy, J. Delivery by drone: An evaluation of unmanned aerial vehicle technology in reducing CO2 emissions in the delivery service industry. Transp. Res. Part D Transp. Environ. 2018, 61, 58–67. [Google Scholar] [CrossRef]
- Kirschstein, T. Comparison of energy demands of drone-based and ground-based parcel delivery services. Transp. Res. Part D Transp. Environ. 2020, 78, 102209. [Google Scholar] [CrossRef]
- Shanghai Municipal Commission of Economy and Informatization. Shanghai’s 14th Five-Year Plan for Industrial Green Development; Shanghai Municipal Commission of Economy and Informatization: Shanghai, China, 2022.
- Wu, L.; Wen, H.; Hu, H.; Mao, X.; Xia, Y.; Shan, E.; Zheng, J.; Lou, J.; Liang, Y.; Yang, L.; et al. LaDe: The First Comprehensive Last-mile Express Dataset from Industry. In Proceedings of the 30th ACM SIGKDD Conference on Knowledge Discovery and Data Mining, Barcelona, Spain, 25–29 August 2024; Association for Computing Machinery: New York, NY, USA, 2024; pp. 5991–6002. [Google Scholar]
- Sartori, D.; Zou, D.; Yu, W. An efficient approach to near-optimal 3D trajectory design in cluttered environments for multirotor UAVs. In Proceedings of the 2019 IEEE 15th International Conference on Automation Science and Engineering (CASE), Vancouver, BC, Canada, 22–26 August 2019; IEEE Press: Piscataway, NJ, USA, 2019; pp. 1016–1022. [Google Scholar]
- Almasan, P.; Suárez-Varela, J.; Rusek, K.; Barlet-Ros, P.; Cabellos-Aparicio, A. Deep reinforcement learning meets graph neural networks: Exploring a routing optimization use case. Comput. Commun. 2022, 196, 184–194. [Google Scholar] [CrossRef]
- Li, X.; Luo, W.; Yuan, M.; Wang, J.; Lu, J.; Wang, J.; Lu, J.; Zeng, J. Learning to Optimize Industry-Scale Dynamic Pickup and Delivery Problems. In Proceedings of the 2021 IEEE 37th International Conference on Data Engineering (ICDE), Chania, Greece, 19–22 April 2021; IEEE Press: Piscataway, NJ, USA, 2021; pp. 2511–2522. [Google Scholar]
- Zeng, Y.; Tong, Y.; Chen, L. Last-mile delivery made practical: An efficient route planning framework with theoretical guarantees. Proc. VLDB Endow. 2019, 13, 320–333. [Google Scholar] [CrossRef]
- Gao, C.; Zhang, F.; Wu, G.; Hu, Q.; Ru, Q.; Hao, J.; He, R.; Sun, Z. A Deep Learning Method for Route and Time Prediction in Food Delivery Service. In Proceedings of the 27th ACM SIGKDD Conference on Knowledge Discovery & Data Mining, Virtual Event, Singapore, 14–18 August 2021; Association for Computing Machinery: New York, NY, USA, 2021; pp. 2879–2889. [Google Scholar]
- Araujo, A.C.d.; Etemad, A. End-to-End Prediction of Parcel Delivery Time With Deep Learning for Smart-City Applications. IEEE Internet Things J. 2021, 8, 17043–17056. [Google Scholar] [CrossRef]
- Wu, F.; Wu, L. DeepETA: A Spatial-Temporal Sequential Neural Network Model for Estimating Time of Arrival in Package Delivery System. Proc. AAAI Conf. Artif. Intell. 2019, 33, 774–781. [Google Scholar] [CrossRef]
- Li, K. Study on the Layout of Express Outlets in Beijing Based on Machine Learning. Master’s Thesis, Beijing Jiaotong University, Beijing, China, 2019. (In Chinese) [Google Scholar]
- Dorling, K.; Heinrichs, J.; Messier, G.G.; Magierowski, S. Vehicle Routing Problems for Drone Delivery. IEEE Trans. Syst. Man Cybern. Syst. 2017, 47, 70–85. [Google Scholar] [CrossRef]
- Zhang, J.; Campbell, J.F.; Sweeney, D.C., II; Hupman, A.C. Energy consumption models for delivery drones: A comparison and assessment. Transp. Res. Part D Transp. Environ. 2021, 90, 102668. [Google Scholar] [CrossRef]
- Franco, C.D.; Buttazzo, G. Energy-Aware Coverage Path Planning of UAVs. In Proceedings of the 2015 IEEE International Conference on Autonomous Robot Systems and Competitions, Vila Real, Portugal, 8–10 April 2015; IEEE Press: Piscataway, NJ, USA, 2015; pp. 111–117. [Google Scholar]
- Abeywickrama, H.V.; Jayawickrama, B.A.; He, Y.; Dutkiewicz, E. Comprehensive Energy Consumption Model for Unmanned Aerial Vehicles, Based on Empirical Studies of Battery Performance. IEEE Access 2018, 6, 58383–58394. [Google Scholar] [CrossRef]
- Gong, H.; Huang, B.; Jia, B.; Dai, H. Modeling Power Consumptions for Multirotor UAVs. IEEE Trans. Aerosp. Electron. Syst. 2023, 59, 7409–7422. [Google Scholar] [CrossRef]
- Mellios, G.; Hausberger, S.; Keller, M.; Samaras, C.; Ntziachristos, L. Parameterisation of Fuel Consumption and CO2 Emissions of Passenger Cars and Light Commercial Vehicles for Modelling Purposes; Publications Office of the European Union: Luxembourg City, Luxembourg, 2011. [Google Scholar] [CrossRef]
- Weiss, M.; Cloos, K.C.; Helmers, E. Energy efficiency trade-offs in small to large electric vehicles. Environ. Sci. Eur. 2020, 32, 46. [Google Scholar] [CrossRef]
- Grée, F.; Laznikova, V.; Kim, B.; Garcia, G.; Kigezi, T.; Gao, B. Cloud-Based Big Data Platform for Vehicle-to-Grid (V2G). World Electr. Veh. J. 2020, 11, 30. [Google Scholar] [CrossRef]
- Ohde, B.; Ślaski, G.; Maciejewski, M. Statistical analysis of real-world urban driving cycles for modelling energy consumption of electric vehicles. J. Mech. Transp. Eng. 2016, 68, 25–39. [Google Scholar] [CrossRef]
- Kusalaphirom, T.; Satiennam, T.; Satiennam, W. Factors Influencing the Real-World Electricity Consumption of Electric Motorcycles. Energies 2023, 16, 6369. [Google Scholar] [CrossRef]
- Liang, Y.; Juntong, Q.; Xiao, J.; Xia, Y. A literature review of UAV 3D path planning. In Proceedings of the 11th World Congress on Intelligent Control and Automation, Shenyang, China, 29 June–4 July 2014; IEEE Press: Piscataway, NJ, USA, 2014; pp. 2376–2381. [Google Scholar]
- Hart, P.E.; Nilsson, N.J.; Raphael, B. A Formal Basis for the Heuristic Determination of Minimum Cost Paths. IEEE Trans. Syst. Sci. Cybern. 1968, 4, 100–107. [Google Scholar] [CrossRef]
- Koenig, S.; Likhachev, M. Incremental A*. In Proceedings of the 15th International Conference on Neural Information Processing Systems: Natural and Synthetic, Vancouver, BC, Canada, 3–8 December 2001; MIT Press: Cambridge, MA, USA, 2001; pp. 1539–1546. [Google Scholar]
- Stentz, A. The focussed D* algorithm for real-time replanning. In Proceedings of the 14th International Joint Conference on Artificial Intelligence—Volume 2, Montreal, QC, Canada, 20–25 August 1995; Morgan Kaufmann Publishers: San Francisco, CA, USA, 1995; pp. 1652–1659. [Google Scholar]
- Daniel, K.; Nash, A.; Koenig, S.; Felner, A. Theta*: Any-angle path planning on grids. J. Artif. Intell. Res. 2010, 39, 533–579. [Google Scholar] [CrossRef]
- Nash, A.; Koenig, S.; Tovey, C. Lazy Theta*: Any-Angle Path Planning and Path Length Analysis in 3D. Proc. AAAI Conf. Artif. Intell. 2010, 24, 147–154. [Google Scholar] [CrossRef]
- Ministry of Ecology and Environment of the People’s Republic of China; National Bureau of Statistics of China; National Energy Administration. Announcement on Releasing the 2024 Electricity Carbon Footprint Factor Data; Ministry of Ecology and Environment of the People’s Republic of China: Beijing, China, 2025; (In Chinese).
- Cai, B.; Zhao, L.; Zhang, Z. Research on Carbon Dioxide Emission Factors of China’s Regional Power Grid (2020–2035). Available online: https://www.caep.org.cn/sy/tdftzhyjzx/zxdt/202310/W020231027692141725225.pdf (accessed on 20 December 2025). (In Chinese)
- Shanghai Municipal Statistics Bureau. Statistical Bulletin on National Economic and Social Development of Shanghai (2024); Shanghai Municipal Statistics Bureau: Shanghai, China, 2025; (In Chinese).
- Shanghai Postal Administration. Shanghai Postal Industry Development Statistical Bulletin (2024); Shanghai Postal Administration: Shanghai, China, 2025; (In Chinese).
- Zhang, Y.; Zhao, H.; Long, Y. CMAB: A Multi-Attribute Building Dataset of China. Sci. Data 2025, 12, 430. [Google Scholar] [CrossRef]
- Fan, R.; Wang, L.; Xu, Z.; Niu, H.; Chen, J.; Zhou, Z.; Li, W.; Wang, H.; Sun, Y.; Feng, R. The first urban open space product of global 169 megacities using remote sensing and geospatial data. Sci. Data 2025, 12, 586. [Google Scholar] [CrossRef]
- MH/T 4054—2022; Route Design Specification of the Light-Small Unmanned Aircraft System for Urban Logistics. Civil Aviation Administration of China: Beijing, China, 2022. (In Chinese)
- DJI. Matrice 200 Series V2 Support [Product Information]. Available online: https://www.dji.com/cn/support/product/matrice-200-series-v2 (accessed on 28 November 2025).
- Bentley, J.L. Multidimensional binary search trees used for associative searching. Commun. ACM 1975, 18, 509–517. [Google Scholar] [CrossRef]
- Kang, P.; Song, G.; Xu, M.; Miller, T.R.; Wang, H.; Zhang, H.; Liu, G.; Zhou, Y.; Ren, J.; Zhong, R.; et al. Low-carbon pathways for the booming express delivery sector in China. Nat. Commun. 2021, 12, 450. [Google Scholar] [CrossRef]
- Głębocki, R.; Żugaj, M.; Jacewicz, M. Validation of the energy consumption model for a quadrotor using Monte-Carlo simulation. Arch. Mech. Eng. 2023, 70, 151–178. [Google Scholar] [CrossRef]
- Xia, W. Research on the application and multi-dimensional economic impact of unmanned delivery vehicles in e-commerce terminal delivery. E-Commer. Lett. 2025, 14, 1428–1435. (In Chinese) [Google Scholar] [CrossRef]
- Xu, J.; Guan, Y.; Oldfield, J.; Guan, D.; Shan, Y. China carbon emission accounts 2020–2021. Appl. Energy 2024, 360, 122837. [Google Scholar] [CrossRef]
- Carbon Emission Accounts and Datasets (CEADs). Available online: https://www.ceads.net.cn (accessed on 12 November 2025).
- Guan, Y.; Shan, Y.; Huang, Q.; Chen, H.; Wang, D.; Hubacek, K. Assessment to China’s Recent Emission Pattern Shifts. Earth’s Future 2021, 9, e2021EF002241. [Google Scholar] [CrossRef]
- Shan, Y.; Huang, Q.; Guan, D.; Hubacek, K. China CO2 emission accounts 2016–2017. Sci. Data 2020, 7, 54. [Google Scholar] [CrossRef] [PubMed]
- Shan, Y.; Guan, D.; Zheng, H.; Ou, J.; Li, Y.; Meng, J.; Mi, Z.; Liu, Z.; Zhang, Q. China CO2 emission accounts 1997–2015. Sci. Data 2018, 5, 170201. [Google Scholar] [CrossRef]
- Shan, Y.; Liu, J.; Liu, Z.; Xu, X.; Shao, S.; Wang, P.; Guan, D. New provincial CO2 emission inventories in China based on apparent energy consumption data and updated emission factors. Appl. Energy 2016, 184, 742–750. [Google Scholar] [CrossRef]



| Field | Definition |
|---|---|
| ID | Primary key |
| order_id | Parcel order identifier (input order ID). |
| Climb1_vert | Vertical distance traveled during ascent in leg 1. |
| Descend1_vert | Vertical distance traveled during descent in leg 1. |
| Cruise1 | Total horizontal-projection length of leg 1. |
| Climb1_horiz | Cumulative horizontal distance during ascent in leg 1. |
| Descend1_horiz | Cumulative horizontal distance during descent in leg 1. |
| Climb2_vert | Vertical distance traveled during ascent in leg 2. |
| Descend2_vert | Vertical distance traveled during descent in leg 2. |
| Cruise2 | Total horizontal-projection length of leg 2. |
| Climb2_horiz | Cumulative horizontal distance during ascent in leg 2. |
| Descend2_horiz | Cumulative horizontal distance during descent in leg 2. |
| Indicator | UAV Valid Parcel Sample (n = 185,673) | Courier Parcel Sample (n = 98,210) | Interpretation |
|---|---|---|---|
| Service duration | 118.68 min (median 79.00) | 94.38 min (median 71.00) | Similar right-skewed workload structure |
| Point-to-point distance | 2.10 km (median 1.62) | 2.09 km (median 1.78) | Highly similar parcel-scale delivery geometry |
| Local parcel density within 1 km | 592.9 | 606.9 | Similar local clustering |
| Local parcel density within 5 km | 1331.7 | 1134.5 | Similar intermediate-scale clustering |
| Local parcel density within 10 km | 3592.2 | 3073.3 | Similar large-scale clustering |
| Category | Count | Share |
|---|---|---|
| Total records of the Shanghai LaDe dataset | 204,027 | 100% |
| Valid records | 185,673 | 91.00% |
| Invalid 1: within no-fly zones | 16,085 | 7.88% |
| Invalid 2: local grid-construction or path-search failure | 2189 | 1.07% |
| Invalid 3: missing coordinates in the LaDe dataset | 80 | 0.04% |
| Metric | Sum | Mean | Max |
|---|---|---|---|
| Climb_vert | 16,422,310 | 88.447485 | 400 |
| Descend_vert | 16,413,920 | 88.402299 | 410 |
| Cruise | 579,708,538.5 | 3122.201605 | 78,173.390577 |
| Climb_horiz | 38,168,320.098 | 205.567423 | 38,819.043 |
| Descend_horiz | 63,851,072.875 | 343.8899 | 44,452.025 |
| Speed_Bin | 1 kg | 2 kg | 5 kg | 8 kg | 10 kg |
|---|---|---|---|---|---|
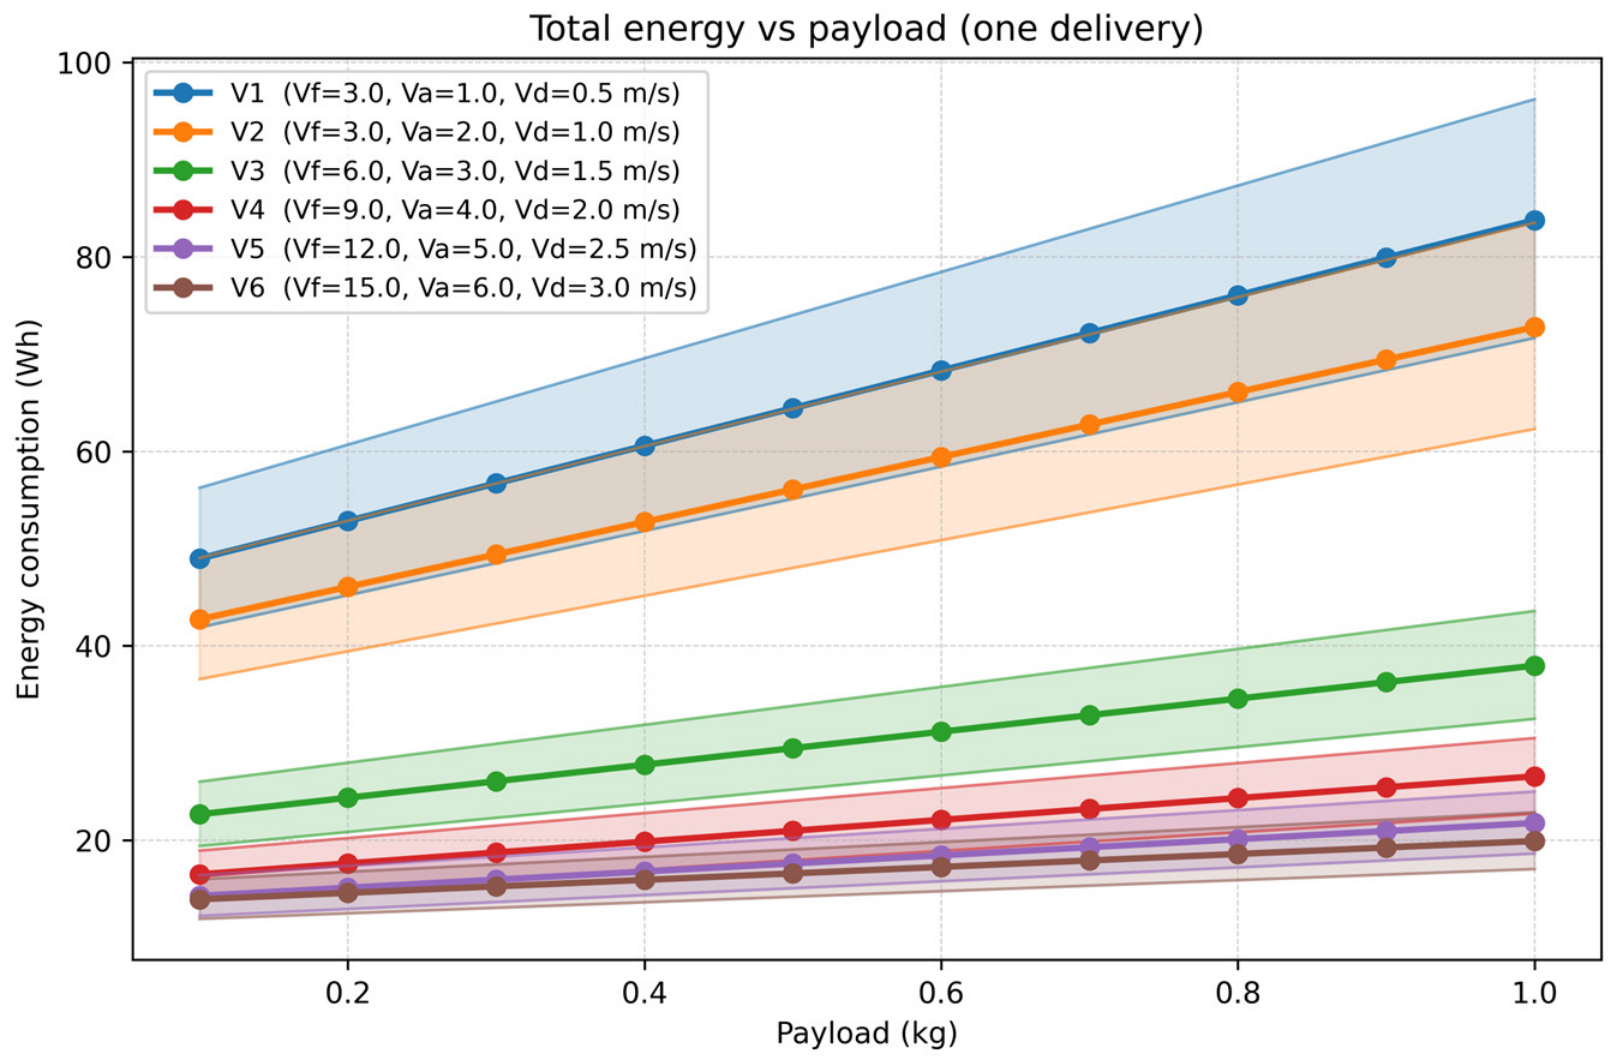
| V1 | 83.1 | 121.3 | 235.9 | 350.5 | 426.9 |
| V2 | 72.8 | 106.2 | 206.4 | 306.6 | 373.4 |
| V3 | 38.0 | 54.9 | 105.9 | 156.9 | 190.9 |
| V4 | 26.6 | 37.8 | 71.4 | 105.0 | 127.4 |
| V5 | 21.8 | 30.1 | 55.1 | 80.1 | 96.7 |
| V6 | 19.9 | 26.6 | 46.6 | 66.5 | 79.9 |
| Speed_Bin | 1 kg | 2 kg | 5 kg | 8 kg | 10 kg |
|---|---|---|---|---|---|
| V1 | 0.027 | 0.039 | 0.077 | 0.114 | 0.139 |
| V2 | 0.024 | 0.035 | 0.067 | 0.100 | 0.121 |
| V3 | 0.012 | 0.018 | 0.034 | 0.051 | 0.062 |
| V4 | 0.009 | 0.012 | 0.023 | 0.034 | 0.041 |
| V5 | 0.007 | 0.010 | 0.018 | 0.026 | 0.031 |
| V6 | 0.006 | 0.009 | 0.015 | 0.022 | 0.026 |
| UAV_Bin | Scooter_Curve | Payload_kg | CO2_kg_Per_Delivery |
|---|---|---|---|
| UAV_V1 | Scooter mean | 2.711 (1.556–3.556) | 0.048742 |
| UAV_V2 | Scooter mean | 3.312 (1.976–4.285) | 0.048742 |
| UAV_V3 | Scooter mean | 7.593 (4.967–9.512) | 0.048742 |
| UAV_V4 | Scooter mean | 12.019 (8.031–14.935) | 0.048742 |
| UAV_V5 | Scooter mean | 16.393 (11.027–20.322) | 0.048742 |
| UAV_V6 | Scooter mean | 20.525 (13.816–25.440) | 0.048742 |
| UAV_Bin_vs_Scooter_Curve | 1 kg | 2 kg | 5 kg | 10 kg |
|---|---|---|---|---|
| UAV_V1-Scooter mean | 0.0215 (0.0100–0.0264) kg | 0.0089 (−0.0079–0.0161) kg | −0.0288 (−0.0617–0.0149) kg | −0.0916 (−0.1512–0.0665) kg |
| UAV_V2-Scooter mean | 0.0251 (0.0151–0.0293) kg | 0.0142 (−0.0004–0.0204) kg | −0.0183 (−0.0467–0.0064) kg | −0.0726 (−0.1239–0.0510) kg |
| UAV_V3-Scooter mean | 0.0364 (0.0312–0.0386) kg | 0.0309 (0.0233–0.0341) kg | 0.0143 (−0.0003–0.0205) kg | −0.0133 (−0.0396–0.0022) kg |
| UAV_V4-Scooter mean | 0.0401 (0.0364–0.0417) kg | 0.0365 (0.0313–0.0387) kg | 0.0255 (0.0157–0.0297) kg | 0.0073 (−0.0102–0.0148) kg |
| UAV_V5-Scooter mean | 0.0417 (0.0387–0.0429) kg | 0.0390 (0.0348–0.0407) kg | 0.0308 (0.0232–0.0340) kg | 0.0173 (0.0040–0.0229) kg |
| UAV_V6-Scooter mean | 0.0423 (0.0395–0.0434) kg | 0.0401 (0.0364–0.0417) kg | 0.0336 (0.0272–0.0363) kg | 0.0228 (0.0118–0.0274) kg |
Disclaimer/Publisher’s Note: The statements, opinions and data contained in all publications are solely those of the individual author(s) and contributor(s) and not of MDPI and/or the editor(s). MDPI and/or the editor(s) disclaim responsibility for any injury to people or property resulting from any ideas, methods, instructions or products referred to in the content. |
© 2026 by the authors. Licensee MDPI, Basel, Switzerland. This article is an open access article distributed under the terms and conditions of the Creative Commons Attribution (CC BY) license.
Share and Cite
Wang, R.; Liu, Y. Assessing the Carbon Mitigation Potential of UAV-Based Last-Mile Delivery Using 3D Path Planning: A Case Study of Shanghai. Drones 2026, 10, 364. https://doi.org/10.3390/drones10050364
Wang R, Liu Y. Assessing the Carbon Mitigation Potential of UAV-Based Last-Mile Delivery Using 3D Path Planning: A Case Study of Shanghai. Drones. 2026; 10(5):364. https://doi.org/10.3390/drones10050364
Chicago/Turabian StyleWang, Ruiqi, and Yang Liu. 2026. "Assessing the Carbon Mitigation Potential of UAV-Based Last-Mile Delivery Using 3D Path Planning: A Case Study of Shanghai" Drones 10, no. 5: 364. https://doi.org/10.3390/drones10050364
APA StyleWang, R., & Liu, Y. (2026). Assessing the Carbon Mitigation Potential of UAV-Based Last-Mile Delivery Using 3D Path Planning: A Case Study of Shanghai. Drones, 10(5), 364. https://doi.org/10.3390/drones10050364