Article

Path Optimization for Multi-Vehicle and Multi-UAV Collaborative Delivery in Flood Rescue Under Road Disruptions: A Case Study of the 2024 Guangdong Flood Disaster


1
Tsinghua Shenzhen International Graduate School, Tsinghua University, Shenzhen 518055, China
2
School of Civil Engineering and Transportation, South China University of Technology, Guangzhou 510641, China
*
Author to whom correspondence should be addressed.
Drones 2026, 10(5), 322; https://doi.org/10.3390/drones10050322
Submission received: 23 March 2026 / Revised: 21 April 2026 / Accepted: 22 April 2026 / Published: 24 April 2026

Highlights

What are the main findings?
  • A multi-vehicle and multi-UAV collaborative rescue routing model is developed for flood-disrupted environments, jointly considering road feasibility, water-depth-dependent vehicle speeds, multi-point UAV sorties, payload-dependent energy consumption, and vehicle–UAV synchronization.
  • In the Guangdong 2024 flood case, the proposed dual-track solution framework shows that the heuristic method scales effectively to large instances and can outperform time-limited MILP solutions in the 135-node instance, while the priority-weighted objective improves response timeliness for critical nodes. Comparative experiments confirm that the proposed method outperforms vehicle-only delivery, single-stop UAV collaboration, two-stage decomposition, and ALNS without embedded DP refinement.
What are the implications of the main findings?
  • Vehicle–UAV collaboration is a practical and effective rescue logistics strategy when flood-induced inundation degrades road accessibility.
  • Sensitivity analysis suggests that maintaining a moderate trade-off coefficient (α in 0.2–0.8) helps preserve both overall completion efficiency and priority-response performance, providing quantitative decision support for balancing mission makespan and critical-node protection in humanitarian operations.

Abstract

Flood disasters often disrupt road networks and severely reduce ground accessibility, hindering the timely delivery of emergency supplies. To address this challenge, this study investigates a collaborative routing problem involving multiple vehicles and multiple UAVs under road disruptions and formulates a mixed-integer linear programming model that jointly minimizes mission makespan and priority-weighted response time for critical nodes. The model explicitly captures road feasibility, vehicle speeds affected by flood depth, multi-point UAV sorties, payload-dependent energy consumption, and vehicle–UAV spatiotemporal synchronization. To balance solution quality and scalability, a dual-track solution framework is developed: exact optimization is used for small instances, while a adaptive large neighborhood search algorithm with embedded dynamic programming is designed for larger instances. A case study based on the 2024 Guangdong flood with 135 demand points shows that the heuristic can obtain high-quality solutions efficiently and outperforms time-limited MILP solutions on large instances. Comparative experiments further demonstrate that multi-point sorties, integrated coordination, and embedded sortie refinement are all crucial to performance improvement. Sensitivity analysis indicates that setting the trade-off coefficient α within 0.2–0.8 provides a robust balance between overall mission efficiency and timely response to critical nodes.

1. Introduction

1.1. Research Background

In mid-April 2024, under the combined influence of persistent heavy rainfall and monsoonal frontal systems, severe flooding and geological disasters occurred in many areas of Guangdong Province. The torrential rainfall caused rapid water level rises in the Beijiang River Basin, resulting in urban and rural inundation, landslides, and road disruptions. Under such circumstances, the rapid and reliable delivery of relief supplies to affected areas became a critical component of emergency logistics.
In flood-rescue scenarios, traditional vehicle routing faces three major challenges. First, damage to the road network significantly reduces accessibility: some roads are completely disrupted, preventing ground vehicles from reaching certain affected locations or forcing them to take substantial detours. Second, the early stage of rescue operations is highly sensitive to response time, especially for life-saving nodes such as centralized shelters, hospitals, and densely populated trapped areas. Third, ground rescue resources are limited and the spatial distribution of affected locations is uneven, which can easily result in the coexistence of overly rapid local coverage and excessively delayed service in peripheral areas.
By contrast, multirotor UAVs offer important advantages, including obstacle-crossing capability, rapid direct access, and flexible deployment, and their effectiveness has already been demonstrated in tasks such as disaster reconnaissance, communication relay, and emergency delivery. Integrating the payload advantage of vehicle-based ground transportation with the timeliness and flexibility of UAV-based aerial delivery can substantially improve both coverage efficiency and response speed to critical nodes in flood-rescue operations.

1.2. Research Problem

Compared with purely vehicle-based or purely UAV-based rescue operations, vehicle–UAV collaboration in flood scenarios is not a simple combination of two transportation modes but a strongly coupled spatiotemporal optimization problem. The key challenge is that vehicles operate on a disrupted road network, whereas UAVs perform aerial sorties, leading to substantial differences in mobility structure, speed scale, task organization, and operational constraints. Meanwhile, UAV launch, service, and recovery decisions must remain synchronized with the position and timing of the supporting vehicle, which tightly couples vehicle routing, UAV assignment, and rendezvous scheduling.
Accordingly, the problem studied in this paper is not a direct extension of a conventional vehicle routing problem or a single-UAV delivery model. Instead, it is a unified collaborative optimization problem tailored to flood-disrupted environments. The model jointly determines vehicle routes, multi-point UAV sorties, service assignment, and vehicle–UAV synchronization while balancing overall mission efficiency, priority-sensitive response to critical nodes, and operational feasibility. This formulation is intended to capture more realistically the coordination mechanism of “ground-based trunk transport plus aerial supplementary service” in flood-rescue logistics.
Let G = (V, A) be a directed graph representing the road network, where V = {0} ∪ N ∪ {n + 1} denotes the set of nodes (depot 0, customer nodes N, and return depot n + 1) and A ⊆ V × V represents the set of directed arcs. Due to flood-induced road disruptions, we define the set B ⊆ A^V of completely disrupted arcs that vehicles cannot traverse.
Each customer node j ∈ N has an associated demand qj and priority weight wj reflecting rescue urgency. Vehicles have capacity limit Qk, while UAVs have a payload capacity QU and battery energy limit Emax.
The collaborative delivery system must determine:
(i)
Vehicle routes that avoid disrupted arcs while serving customer nodes;
(ii)
UAV sortie assignments on vehicle arcs with energy constraints;
(iii)
Synchronization timing at rendezvous nodes to minimize completion time.
The optimization objective minimizes a weighted combination of mission makespan and priority-weighted response time, where α is a trade-off parameter between operational efficiency and rescue equity.
It is subject to the following constraints:
(i)
A coverage constraint ensuring each customer is served exactly once;
(ii)
Depot constraints for the vehicle start and end points;
(iii)
A road disruption constraint preventing vehicles from traversing blocked arcs;
(iv)
A pattern selection constraint linking UAV sorties to vehicle arcs;
(v)
An energy constraint ensuring UAV operations stay within battery limits;
(vi)
A synchronization constraint for timing coordination between vehicles and UAVs.
The complete mathematical programming formulation is presented in Section 2.4. This formulation captures the essential trade-offs between vehicle routing efficiency, UAV energy constraints, and synchronized operations under road disruption scenarios.

1.3. Main Contributions

The contribution of this study lies primarily in an integrated modeling-and-solution framework tailored to flood-rescue logistics, rather than in the development of a fundamentally new general-purpose metaheuristic. Compared with existing studies, which often address only part of the vehicle–UAV collaboration structure, this work focuses on flood-induced road disruptions and integrates multi-vehicle multi-UAV coordination, multi-point UAV sorties, payload-dependent energy consumption, vehicle–UAV synchronization, and priority-sensitive emergency response within a unified optimization framework, followed by validation in a real case setting. The main contributions are summarized as follows:
(1)
A flood-rescue-oriented collaborative routing problem is formulated under road disruption conditions.
This study considers a single-depot emergency distribution problem involving multiple vehicles and multiple UAVs in a disrupted flood environment, where accessibility is degraded, service urgency differs across demand nodes, and ground–air coordination is required. The formulation explicitly incorporates road-feasibility constraints, vehicle–UAV rendezvous and synchronization, and rapid response requirements for high-priority nodes, thereby making the problem setting closer to actual disaster-relief decision-making.
(2)
Several key mechanisms that are often treated separately in the literature are integrated into one unified model.
Unlike studies that consider only single-stop UAV services or simplified endurance limits, the proposed model allows a UAV to visit multiple affected locations within one sortie and incorporates a payload-dependent linear energy-consumption approximation to represent flight feasibility. Meanwhile, vehicle routing, UAV sortie selection, service assignment, and temporal synchronization are jointly optimized. The novelty of this work therefore lies primarily in the systematic integration of these mechanisms in one flood-rescue setting, rather than in an isolated breakthrough in a single algorithmic component.
(3)
A problem-tailored dual-track solution framework is developed.
Given the strong combinatorial nature and tightly coupled constraints of the problem, this study develops a dual-track framework consisting of exact optimization and heuristic optimization. The MILP model is used to provide benchmark solutions for small instances, while an ALNS-based heuristic with embedded dynamic programming is designed for larger instances so as to balance solution quality and computational efficiency. It should be emphasized that the methodological contribution of this paper is mainly reflected in the adaptation of the solution framework to this specific collaborative rescue problem, rather than in proposing a new algorithm for all vehicle–UAV routing problems.
(4)
A real flood case is used for empirical validation and managerial interpretation.
Using a 135-node case derived from the 2024 Guangdong flood, the study verifies the practical effectiveness of the proposed framework in improving both overall mission efficiency and timely service to critical nodes under disrupted road conditions. In addition, analyses of collaborative routes, waiting behavior, priority response, and parameter sensitivity provide application-oriented insights into when and how vehicle–UAV collaboration is beneficial in flood-rescue logistics.

1.4. Research Framework

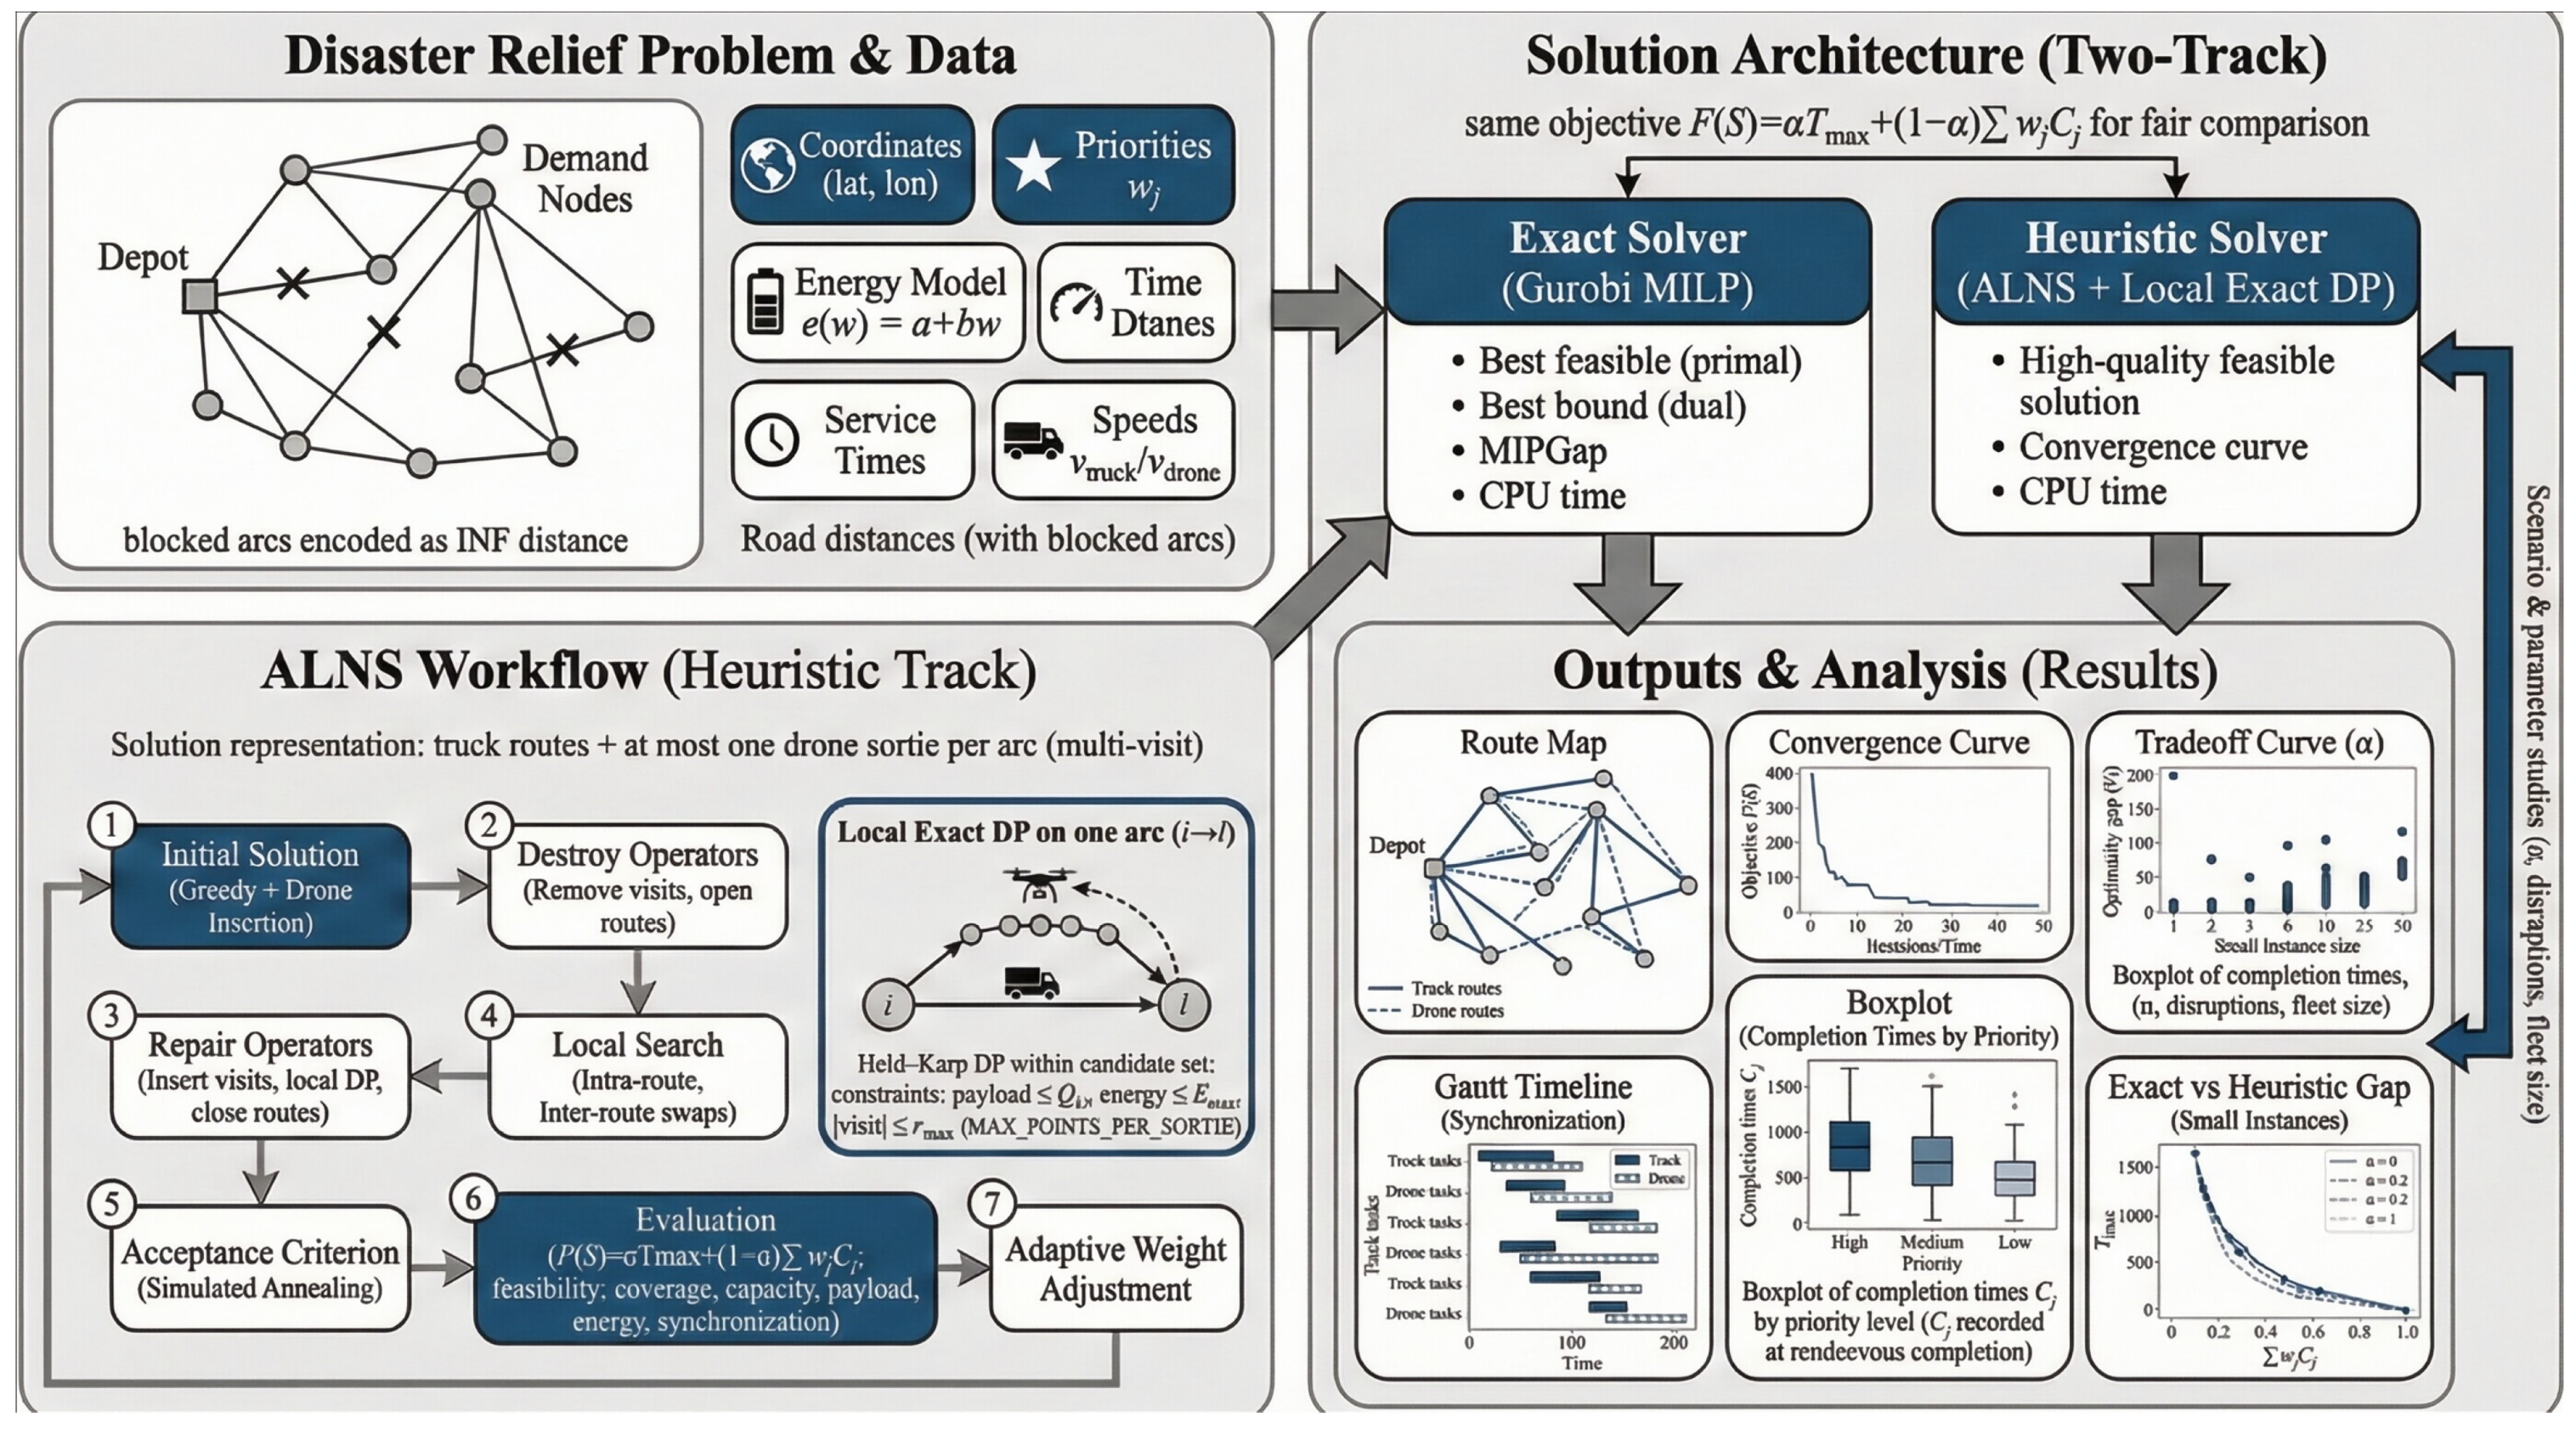
This paper develops a complete research framework for collaborative rescue distribution involving multiple vehicles and multiple UAVs under flood-induced road disruption conditions, covering problem formulation, solution methodology, case study validation, and sensitivity analysis, as illustrated in Figure 1.

1.5. Literature Review

Vehicle-mounted UAV collaborative delivery routing problems are commonly categorized as the vehicle–UAV routing problem (TDRP) or the vehicle routing problem with UAVs (VRP-D). Early studies mainly focused on single-vehicle single-UAV variants, such as the TSP-D and VRP-D, with emphasis on vehicle–UAV synchronization and sortie feasibility. These problems were typically solved using mixed-integer linear programming (MILP), branch-and-price methods, or heuristic algorithms. As practical applications have become increasingly complex, research has gradually expanded toward multi-vehicle multi-UAV collaboration, multi-point sorties, as well as issues related to reliability, uncertainty, and dynamic synchronization. Existing review studies have systematically summarized different collaboration modes, constraint types, and mainstream solution approaches, such as adaptive large neighborhood search (ALNS), variable neighborhood search (VNS), branch-and-price (B&P), and hybrid heuristics, while also pointing out that multi-point sorties and refined energy-consumption modeling have emerged as important research trends.
Conventional VRP-D studies often approximate UAV endurance by imposing upper bounds on flight distance or flight time. However, for multirotor UAVs, energy consumption is closely associated with payload weight. In recent years, researchers have introduced payload-dependent energy-consumption functions, including linear, piecewise linear, and nonlinear formulations, in order to model sortie feasibility more realistically. In this study, the commonly used linear energy consumption approximation, e(w) = a + bw, is adopted to balance modeling accuracy and MILP tractability.
In the field of humanitarian relief, UAVs have been widely used for rapid supply delivery to areas where roads are damaged or communities are isolated. Recent studies have increasingly embedded vehicle–UAV collaboration into the design of relief distribution networks and routing decisions, while incorporating mechanisms such as time windows, priority levels, multi-objective optimization, and robustness to reflect the fairness and timeliness requirements of rescue operations. Nevertheless, empirical studies based on specific real flood events that simultaneously consider multi-vehicle multi-UAV collaboration, multi-point sorties, payload-dependent energy consumption, and road disruptions remain relatively limited. This gap constitutes the main research motivation of the present study. The specific contributions and innovations of this paper are summarized in Table 1.
Overall, substantial progress has been made in vehicle–UAV collaborative routing, multi-UAV mission planning, humanitarian logistics, and energy-constrained optimization. However, for the specific problem of multi-vehicle and multi-UAV collaborative rescue under flood-induced road disruptions, the literature still lacks a unified framework that simultaneously incorporates road accessibility, multi-point sorties, payload-dependent energy consumption, vehicle–UAV synchronization, and priority-sensitive response to critical nodes. In flood scenarios, efficient collaboration cannot be achieved by optimizing vehicles and UAVs separately and then simply combining them; rather, differences in mobility networks, operating speeds, and synchronization requirements fundamentally shape the decision structure.
Motivated by this gap, the objective of this study is not to propose a universally new algorithm for all vehicle–UAV routing problems. Instead, it is to develop an integrated modeling-and-solution framework tailored to a specific flood-rescue context, with both structural completeness and decision interpretability, and to validate its practical value through a real case study.

2. Materials and Methods

2.1. Problem Setting and Study Area

According to publicly available reports, the most severely affected areas in the 2024 Guangdong flood disaster were located in northern Guangdong and the Beijiang River Basin, where large-scale road inundation, road disruptions, and landslides occurred in areas such as Qingyuan and Shaoguan. In this study, the emergency supply depot is located at the Rescue Material Reserve Center in Baiyun District, Guangzhou (113.3182, 23.3189). The service targets consist of a set N of 135 disaster-affected locations within the study area, including 17 hospitals, 113 townships, and 5 subdistricts. The road arc set A V is constructed from the road network of the study region, while the disrupted arc set B is identified on the basis of disaster conditions, water levels, and road damage information. In addition, using flood-depth information determines the effective vehicle speed on each road segment.
In terms of spatial distribution, the affected locations are distributed over a longitude range of [112.28, 114.38] and a latitude range of [23.65, 25.23], covering regions such as Qingyuan, Yingde, Shaoguan, and Lianzhou, thereby exhibiting a clear cross-regional distribution pattern. Demand quantities vary across locations, as summarized in Table 2. The key scenario parameters used in the case study, including node category, demand level, nominal travel settings, and priority-related disaster indicators, are defined from publicly available flood reports, geographic information, and scenario-based operational interpretation, so that the case configuration remains transparent and reproducible at the tactical planning level. It should be noted that this study focuses on tactical vehicle–UAV collaborative routing under a given emergency resource configuration; therefore, the number of vehicles is treated as an exogenous input parameter rather than a decision variable. In the case study, three vehicles are adopted to represent a limited yet deployable level of ground transport capacity in the post-disaster response stage. Meanwhile, the reported total delivery duration refers to the system-level mission completion time under the current resource constraint, disrupted road conditions, and full-node service requirement, rather than the arrival time of the first batch of critical relief supplies.

2.2. Problem Description and Basic Assumptions

This study investigates a road-disruption rescue distribution problem involving a single depot, multiple vehicles, and multiple multirotor UAVs operating collaboratively. The depot departure node is denoted by 0, and the return node is denoted by n + 1 . The set of affected locations is N = { 1 , , n } , where each affected location j N has a deterministic demand q j > 0 and an associated rescue-priority weight w j > 0 .
The fleet consists of multiple vehicles K = { 1 , , m } , and each vehicle k K carries one multirotor UAV. Each vehicle departs from depot node 0, performs ground-based deliveries through a number of affected locations, and eventually returns to the depot node 0. Due to flooding, vehicle speed is closely correlated with the depth of water accumulated on road surfaces; once the water depth exceeds a safe threshold, the road becomes completely impassable. UAVs may only be launched and recovered either at the depot or at the node where the vehicle is currently located.
Each UAV mission is referred to as a sortie. For a vehicle travel arc ( i , l ) , the UAV may be launched at the arc origin i, depart from node i, visit several affected locations in a prescribed order while delivering supplies, and finally rendezvous with the same vehicle at the arc destination l. The UAV is not required to return to its launch node i; instead, it only needs to be recovered at the rendezvous node l. During the execution of a sortie, the vehicle may continue traveling and serving locations without waiting in place. At the rendezvous node, either the vehicle or the UAV may arrive first, in which case the earlier arrival must wait for the later one.
Based on the theoretical derivation and empirical analysis of multirotor UAV energy consumption by Dorling et al., the energy consumption under a given flight regime and payload range can be approximated as a linear function of battery weight and payload weight: e(w) = a + bw [6], where w denotes the UAV payload during flight (kg), and a and b are fitted energy-consumption parameters. The total energy consumption of each sortie must not exceed the maximum available battery energy E max , and the total payload of each sortie must not exceed the UAV payload capacity Q U .
However, actual UAV energy consumption depends not only on payload, but also on flight phase, hovering, and environmental disturbances. Recent studies have therefore emphasized that realistic UAV energy models are generally nonlinear and may involve take-off, cruise, hovering, and landing components. Directly embedding a fully nonlinear flight-energy model into the present routing framework would substantially reduce tractability. Since the focus of this study is tactical routing and synchronization optimization rather than flight-control-level energy simulation, a segment-based affine approximation is adopted. If a higher precision energy evaluation is required, nonlinear energy-consumption functions may be introduced for simulation-based correction on top of the solutions obtained from the present model, or recent modeling and algorithmic approaches that support general energy-consumption functions may be employed.
Specifically, for a given sortie pattern, the total UAV energy consumption is modeled as the sum of fixed take-off energy and landing energy, payload-dependent cruise energy on each flight segment, and hovering/service energy at visited nodes. In addition, an operational safety reserve is imposed through an effective battery budget. This treatment preserves the tractability of the pattern-based MILP + heuristic framework while improving the physical interpretability of the endurance constraint.
Based on the above, the following basic assumptions are made:
(1)
Demand quantities, road-network status, flight distances, nominal vehicle/UAV speeds, and service times are assumed to be known within the planning horizon. This assumption is intended to represent a short-term tactical planning stage after emergency information has been updated for a given decision window, rather than a fully real-time dynamic dispatch process.
(2)
In the core formulation, UAV operations are not explicitly modeled with additional operational factors such as no-fly zones, communication interruptions, or mechanical failures. Instead, the present study focuses on routing- and synchronization-level decision-making under payload, endurance, and rendezvous constraints.
(3)
The initial time of all vehicles and UAVs is set to 0, and no temporary task additions or cancelations are considered.
(4)
Each affected location must be served exactly once, either directly by a vehicle or by a UAV sortie.
(5)
Each vehicle carries the total demand associated with both its directly served locations and the locations served by its onboard UAV, and the total load must not exceed the vehicle capacity.
These assumptions are introduced to define the scope of the present study. The paper focuses on tactical collaborative planning within a short decision window after key emergency information has been updated, and therefore demand, road conditions, and major operational parameters are treated as known inputs. More complex sources of uncertainty, such as no-fly zones, severe weather, communication loss, and UAV failures, are also important in real operations, but their explicit treatment usually requires dynamic, stochastic, or robust optimization frameworks and is beyond the scope of this study.

2.3. Notation

The definitions of the symbols adopted in the model are listed in Table 3.
For each arc ( i , l ) , feasible patterns p P il are pre-generated, with the visiting sequence defined as:
r 0 p = i , r 1 p , , r | C p | p , r | C p | + 1 p = l .
Let W u p denote the payload carried during the u-th flight segment of pattern p: W u p = j = u + 1 m q j . Then, the total energy consumption and total duration of pattern p are given by:
E p = E t o + E l d + u = 0 m d j u j u + 1 U ( a + b W u p ) + p h o v u = 1 m s j u ,
τ p = u = 0 | C p | d r u p , r u + 1 p U / v U + j C p s j U .
Only those patterns satisfying the following are retained: EpηEmax and j C p q j Q U .

2.4. Mathematical Programming Model

(1)
Objective Function: Makespan and Priority-Weighted Response Time
minZ = α T max + ( 1 α ) j N w j C j ,
In this function, w j is used to characterize differences in rescue urgency among affected locations. In order to make the priority definition operationally interpretable, the affected locations are classified into three rescue-priority levels according to their functional role in disaster response. This classification follows a widely used humanitarian prioritization logic: life-saving nodes, critical support nodes, and general material-support nodes [9]. Accordingly, hospitals, shelters, and densely populated trapped areas are assigned to Level 1 because delays at these nodes may immediately affect survival and medical outcomes. Critical infrastructure support nodes, such as water/power support facilities, key transport hubs, or transfer points, are assigned to Level 2 because they play an important supporting role in maintaining system functionality and enabling continued relief operations. Ordinary communities and general supply points are assigned to Level 3 because their service remains necessary, but their urgency is typically lower than that of life-saving and system-support nodes in the early response phase. It should be noted that this three-level scheme is adopted here as an operational classification rule for tactical rescue planning, rather than as a claim of a universally unique disaster-priority standard:
Let g ( j ) { 1 , 2 , 3 } denote the priority class of node j . To capture both class-based urgency and within-class heterogeneity, the priority weight of node j is constructed in two layers. First, a base priority level is assigned according to the functional classification in Table 4. Second, continuous disaster-related indicators are introduced to refine the priority ranking among nodes within the same class. In this study, these indicators include the affected population P j and rainfall severity R j , a refined priority weight can be constructed as [9]:
w ~ j = β 1 · Level ( j ) + β 2 · P j max h N P h + β 3 · R j max h N R h ,
w j = 1 + γ · w ~ j min h N w ~ h max h N w ~ h min h N w ~ h .
where β1, β2, and β3 are treated as preference parameters rather than statistically estimated coefficients, as detailed in Table 5. Specifically, β1 controls the contribution of the class-based priority level, β2 reflects the contribution of affected population, β3 reflects the contribution of flood severity, and γ is used to moderate the dispersion of the continuous indicators. To avoid scale dominance and preserve interpretability, the continuous indicators are normalized before aggregation, and the final priority score is further linearly normalized through Formula (6). Therefore, the proposed weighting scheme should be understood as a structured decision-support rule that combines functional classification with disaster-severity refinement.
In the Guangdong flood case, the priority-related inputs are assigned from publicly available case information and scenario interpretation. More specifically, the base class is determined according to whether the node functions as a hospital, shelter, critical support location, or general supply point, while the continuous indicators are derived from observable disaster characteristics such as affected population scale and local flood/rainfall severity.
The parameter α [ 0 , 1 ] represents the trade-off between overall makespan T max and priority-weighted response time. A larger α places greater emphasis on completing the overall rescue operation as early as possible, whereas a smaller α places greater emphasis on the rapid response to high-priority nodes [7].
In this study, α { 0 , 0.2 , 0.4 , 0.6 , 0.8 , 1 } is considered. To evaluate the effect of α , the following procedure is adopted:
① Fix the disaster scenario and the values of w j , while keeping the numbers of vehicles and UAVs, battery capacity, and other parameters unchanged;
② For each value of α , solve the model and record T max ( α ) , j w j C j ( α ) and the average response time of Level-1 node:
C ¯ ( 1 ) ( α ) = j N : g ( j ) = 1 C j ( α ) | { j N : g ( j ) = 1 } | .
③ Plot the trade-off curve between T max ( α ) and j w j C j ( α ) to identify the region of diminishing marginal returns;
④ Using α = 0.6 as the benchmark, compute the relative change rates:
Δ T max ( α ) = T max ( α ) T max ( 0.6 ) T max ( 0.6 ) × 100 % ,
Δ C ¯ ( 1 ) ( α ) = C ¯ ( 1 ) ( α ) C ¯ ( 1 ) ( 0.6 ) C ¯ ( 1 ) ( 0.6 ) × 100 % .
Through the above analysis, quantitative support can be provided for emergency management authorities in balancing overall efficiency and priority rescue, and a recommended range of α values together with its policy implications can be identified.
(2)
Service Coverage Constraint
k K z k , j V + k K ( i , l ) A V p P il : j C p u k , il , p = 1 , j N .
(3)
Vehicle Routing and Capacity Constraints
Departure and return constraints:
j N x k , 0 j = 1 , k K , i N x k , i , n + 1 = 1 , k K .
Flow conservation constraints:
j N { n + 1 } x k , ij = h { 0 } N x k , hi , k K , i N .
Road disruption constraints:
x k , ij = 0 , k K , ( i , j ) B = { ( i , j ) A V | h i j h ¯ } .
Consistency between service and visit decisions:
z k , j V i { 0 } N x k , ij , k K , j N , z k , j V l N { n + 1 } x k , jl , k K , j N .
Vehicle capacity constraints:
j N q j z k , j V + ( i , l ) A V p P il : j C p u k , il , p Q k , k K .
Vehicle subtour elimination constraints (MTZ):
S k , j S k , i + 1 M ( 1 x k , ij ) , k K , i , j N , i j ,
1 S k , i n , k K , i N .
(4)
UAV Pattern Selection and Endurance Constraints
For each vehicle, at most one sortie pattern may be selected on arc ( i , l ) :
p P il u k , il , p x k , il ,
p P il u k , il , p 1 , k K , ( i , l ) A V .
Since the pattern set has already been pre-screened, feasibility is implicitly guaranteed within the main model.
(5)
Time Synchronization and Response Time Definition
Initial times:
A k , 0 = D k , 0 = 0 , k K .
Vehicle service time constraints:
D k , i A k , i + s i V , k K , i N .
According to the functional relationship between vehicle travel speed and road surface water depth proposed and derived by Pregnolato et al. [10], it follows that:
v i j V = v i j 0 ρ ( h i j ) , 0 h i j < h ¯ , ρ ( h i j ) = ( 0.0009 h i j 2 0.5529 h i j + 86.9448 ) ÷ 86.9448 , 0 h i j < h ¯ .
Vehicle travel time constraints:
t ij V = d i j V / v i j V , A k , j D k , i + t ij V M ( 1 x k , ij ) , k K , ( i , j ) A V .
Sortie rendezvous time constraints:
A k , l A k , i + τ p M ( 1 u k , il , p ) , k K , ( i , l ) A V , p P il .
Definition of service completion time (vehicle/UAV):
C j A k , j M 1 z k , j V , k K , j N , C j A k , l M 1 u k , il , p , k K , ( i , l ) A V , p P il , j C p .
Makespan constraint:
T max A k , n + 1 , k K .
(6)
Variable Domains
x k , ij { 0 , 1 } ,   k K ,   ( i , j ) A V , z k , j V { 0 , 1 } ,   k K ,   j N , u k , il , p { 0 , 1 } ,   k K ,   ( i , l ) A V ,   p P il , A k , i 0 ,   D k , i 0 ,   k K ,   i V , 1 S k , i n ,   k K ,   i N , C j 0 ,   j N , T max 0 .

3. Results

3.1. Algorithm Design

To obtain solutions with both accuracy and scalability under the coexistence of road disruption and ground–aerial coordination constraints, this study develops a dual-track solution framework. On the one hand, Gurobi is employed to solve the mixed-integer linear programming (MILP) model exactly and provide benchmark results [8]. On the other hand, a heuristic algorithm for large-scale instances is designed, using adaptive large neighborhood search (ALNS) as the main framework and embedding locally exact dynamic programming (DP) into key substructures [11]. Both solution tracks are evaluated under the same objective function, thereby ensuring the comparability of results.
The exact solution track is directly based on the MILP model proposed in this study, which explicitly characterizes vehicle routing decisions, UAV sortie assignment on vehicle arcs, vehicle–UAV synchronization and waiting, as well as vehicle capacity and UAV payload and energy constraints. Road disruptions are handled by assigning infeasible road arcs an infinite travel cost, thereby automatically excluding unreachable movements. For small- and medium-sized instances, Gurobi is called to solve the MILP within a prescribed time limit, producing optimal or near-optimal feasible solutions for subsequent quality assessment and comparison with the heuristic method.
When the instance size becomes too large for the MILP to converge within an acceptable computation time, the heuristic solution track is adopted. The solution representation consists of two components: (i) a closed-route sequence for each vehicle; and (ii) at most one UAV sortie configured on any adjacent vehicle arc (i → l), where each sortie is allowed to visit multiple affected locations. This representation is consistent with the collaborative mechanism of “launch on an arc and recover at the arc destination,” while also facilitating the embedding of constraints.
The heuristic algorithm starts from a feasible initial solution constructed in a vehicle-first, UAV-second manner. First, affected locations are assigned to different vehicles through sweep clustering. Then, an initial route for each vehicle is constructed using nearest-neighbor insertion and improved by a 2-opt procedure. On this basis, UAV tasks are gradually introduced in a greedy manner: feasible vehicle-served nodes are removed from vehicle routes and inserted into a UAV sortie on a selected arc whenever possible. If no feasible sortie is generated during this phase, a seed-sortie injection mechanism is triggered, so that a small number of feasible sorties can activate vehicle–UAV collaboration and provide a starting point for subsequent search.
The core improvement stage adopts an iterative ALNS procedure with four types of neighborhood operators [12]:
(I)
The operator 2-opt, which reverses subsequences within a single vehicle route;
(II)
Sortie opt, which re-optimizes a sortie on a given arc;
(III)
Relocate to sortie, which transfers a node from a route to a sortie on an arc;
(IV)
Remove sortie, which removes a sortie and reinserts its served nodes into vehicle routes in a minimum-increment manner.
To enhance the ability to escape local optima, the candidate-solution acceptance criterion adopts a simulated annealing mechanism: an improved solution is always accepted, whereas a deteriorated solution is accepted with a probability determined by the temperature parameter, which gradually decreases with the iteration process.
Locally exact DP is a key component for improving heuristic solution quality. For a candidate arc, a Held Karp-type DP is applied within a small candidate-node set to enumerate and screen feasible multi-point sorties. Subject to UAV payload, energy, and maximum-visit constraints, the DP returns the optimal visiting sequence together with the corresponding flight time, service time, and energy consumption. This mechanism substantially strengthens neighborhood evaluation and improvement intensity without causing combinatorial explosion, thereby improving the overall search efficiency and solution quality [13,14].
Overall, the dual-track framework provides benchmark solutions for small instances through exact optimization and high-quality near-optimal solutions for medium and large instances through “ALNS + locally exact DP”, thereby balancing methodological rigor and practical applicability.

3.2. Feasibility Analysis and Practical Considerations

This section clarifies feasibility from three aspects: instance-level feasibility, feasibility-preserving search design, and handling of infeasible cases. The purpose is not to claim a universal theorem-style guarantee for all disrupted rescue instances, but to show that the proposed framework operates within an explicitly defined feasible region.
(1)
Instance-Level Feasibility Conditions
A full-service instance is regarded as feasible only if each demand node j ∈ N can be served by at least one admissible mode. In particular, node j must satisfy
  a   feasible   vehicle   path   to   j   or   ( i , l , p ) : j C p , u k , i l , p = 1 .
That is, every node must be reachable either by the residual road network or by a feasible UAV sortie supported by some vehicle arc.
Capacity feasibility further requires that vehicle and UAV loads remain within their limits. For each vehicle k,
j N q j z k , j V + ( i , l , p ) j C p q j u k , i l , p Q k .
and for each sortie pattern p,
j C p q j Q U .
In addition, UAV endurance must be satisfied. For each retained sortie pattern p,
E p η E m a x .
where Ep is the total sortie energy consumption defined in Section 2.3. Since the pattern set is pre-generated, only those patterns satisfying (30) and (31) are included in the optimization model.
Therefore, conditions (28)–(31) are used here as operational feasibility requirements for valid rescue instances, rather than as a strict necessary and sufficient characterization of all possible cases.
(2)
Feasibility-Preserving Design of the Algorithm
The proposed solution framework follows a feasibility-first principle. In the exact track, feasibility is enforced directly by the MILP constraints. In the heuristic track, feasibility is preserved through initialization, neighborhood evaluation, and repair.
The initial solution is constructed in a vehicle-first, UAV-second manner. UAV sorties are inserted only when the corresponding payload, endurance, and synchronization conditions are satisfied. Hence, the initial solution satisfies
c o v e r a g e + c a p a c i t y + e n e r g y + s y n c h r o n i z a t i o n   f e a s i b i l i t y .
During ALNS iterations, any candidate move is accepted for objective evaluation only if it preserves the hard constraints. Specifically, route modification and sortie adjustment must maintain
k ( z k , j V + ( i , l , p ) : j C p u k , i l , p ) = 1 , j N .
Together with vehicle capacity, sortie-payload, and timing-consistency constraints. For intermediate moves that temporarily break structural consistency, a repair step is applied before evaluation.
Moreover, the embedded dynamic programming module refines sortie design only over admissible states. For a candidate arc (i, l), the DP returns a sortie pattern p only if
| C p | H , j C p q j Q U , E p η E m a x .
where H denotes the maximum number of customers allowed in one sortie. Thus, infeasible sortie structures are screened out during local refinement.
Accordingly, the heuristic does not claim a formal feasibility guarantee for every conceivable disrupted instance; rather, it searches efficiently within the feasible region induced by the model and the pre-generated pattern set.
(3)
Handling of Infeasible Cases
In severely disrupted flood scenarios, infeasibility may still arise because of accessibility loss, insufficient carrying capacity, or UAV endurance limitations.
If infeasibility is caused by accessibility loss, then for a node j,
  f e a s i b l e   v e h i c l e   p a t h   t o   j   a n d   ( i , l , p ) : j C p .
In this case, possible remedies include temporary road clearance, temporary transfer points, or relocation of launch/recovery positions.
If infeasibility is caused by insufficient carrying capacity, then
j N q j > k K Q k .
Or it will not be possible for a critical subset to be assigned feasibly. Practical remedies include adding vehicles, UAVs, or emergency replenishment resources.
If infeasibility is caused by UAV endurance, then candidate sorties violate
E p > η E m a x .
Possible responses include shortening sortie length, restricting UAV service to higher-priority nodes, or redesigning the supporting vehicle route so that launch and rendezvous points are closer.
Overall, feasibility in this study is addressed through instance screening, feasibility-preserving optimization design, and operational adjustment for disrupted cases, which is consistent with the tactical planning scope of the paper.

3.3. Comparison of Solution Results

The experiments were conducted on a laptop computer with an Intel(R) Core(TM) i9-14900HX CPU and 32 GB RAM. The Gurobi version used was 13.0.1, and the heuristic algorithm was implemented in PyCharm Community Edition 2024.3.4. To ensure a fair comparison, the key parameters of the heuristic algorithm were systematically calibrated before the main experiments. In addition, to mitigate the effect of randomness, each instance was run 10 times, and the results are reported as mean ± standard deviation.
The time limit of the Gurobi solver was set to 1800 s. The comparison results are shown in Table 6. The best solution for each instance is highlighted in bold; if Gurobi failed to find the best solution for a given instance, the result is marked with “×”.
As shown in Table 6, for small-scale instances, Gurobi is able to prove optimality or near-optimality within the given time limit, and the relative gap between the heuristic and Gurobi is generally small. For medium-scale instances, the rate of improvement of Gurobi decreases substantially, whereas the heuristic produces stable feasible solutions of satisfactory quality within a relatively short time. For large-scale instances, the heuristic demonstrates favorable scalability and is able to obtain feasible solutions that are clearly superior to those returned by Gurobi within a limited computational budget.

4. Discussion

4.1. Visualization of Results

To improve the interpretability of the solution results, this study visualizes and analyzes the most representative solution obtained from the real flood-rescue dataset of Guangdong Province in 2024 (a total of 135 demand points), from five perspectives: spatial structure, temporal coordination, service performance, algorithmic behavior, and UAV resource utilization [15]. These visualizations reveal the underlying mechanism of vehicle–UAV collaborative distribution.
(1)
Visualization of Spatial Structure
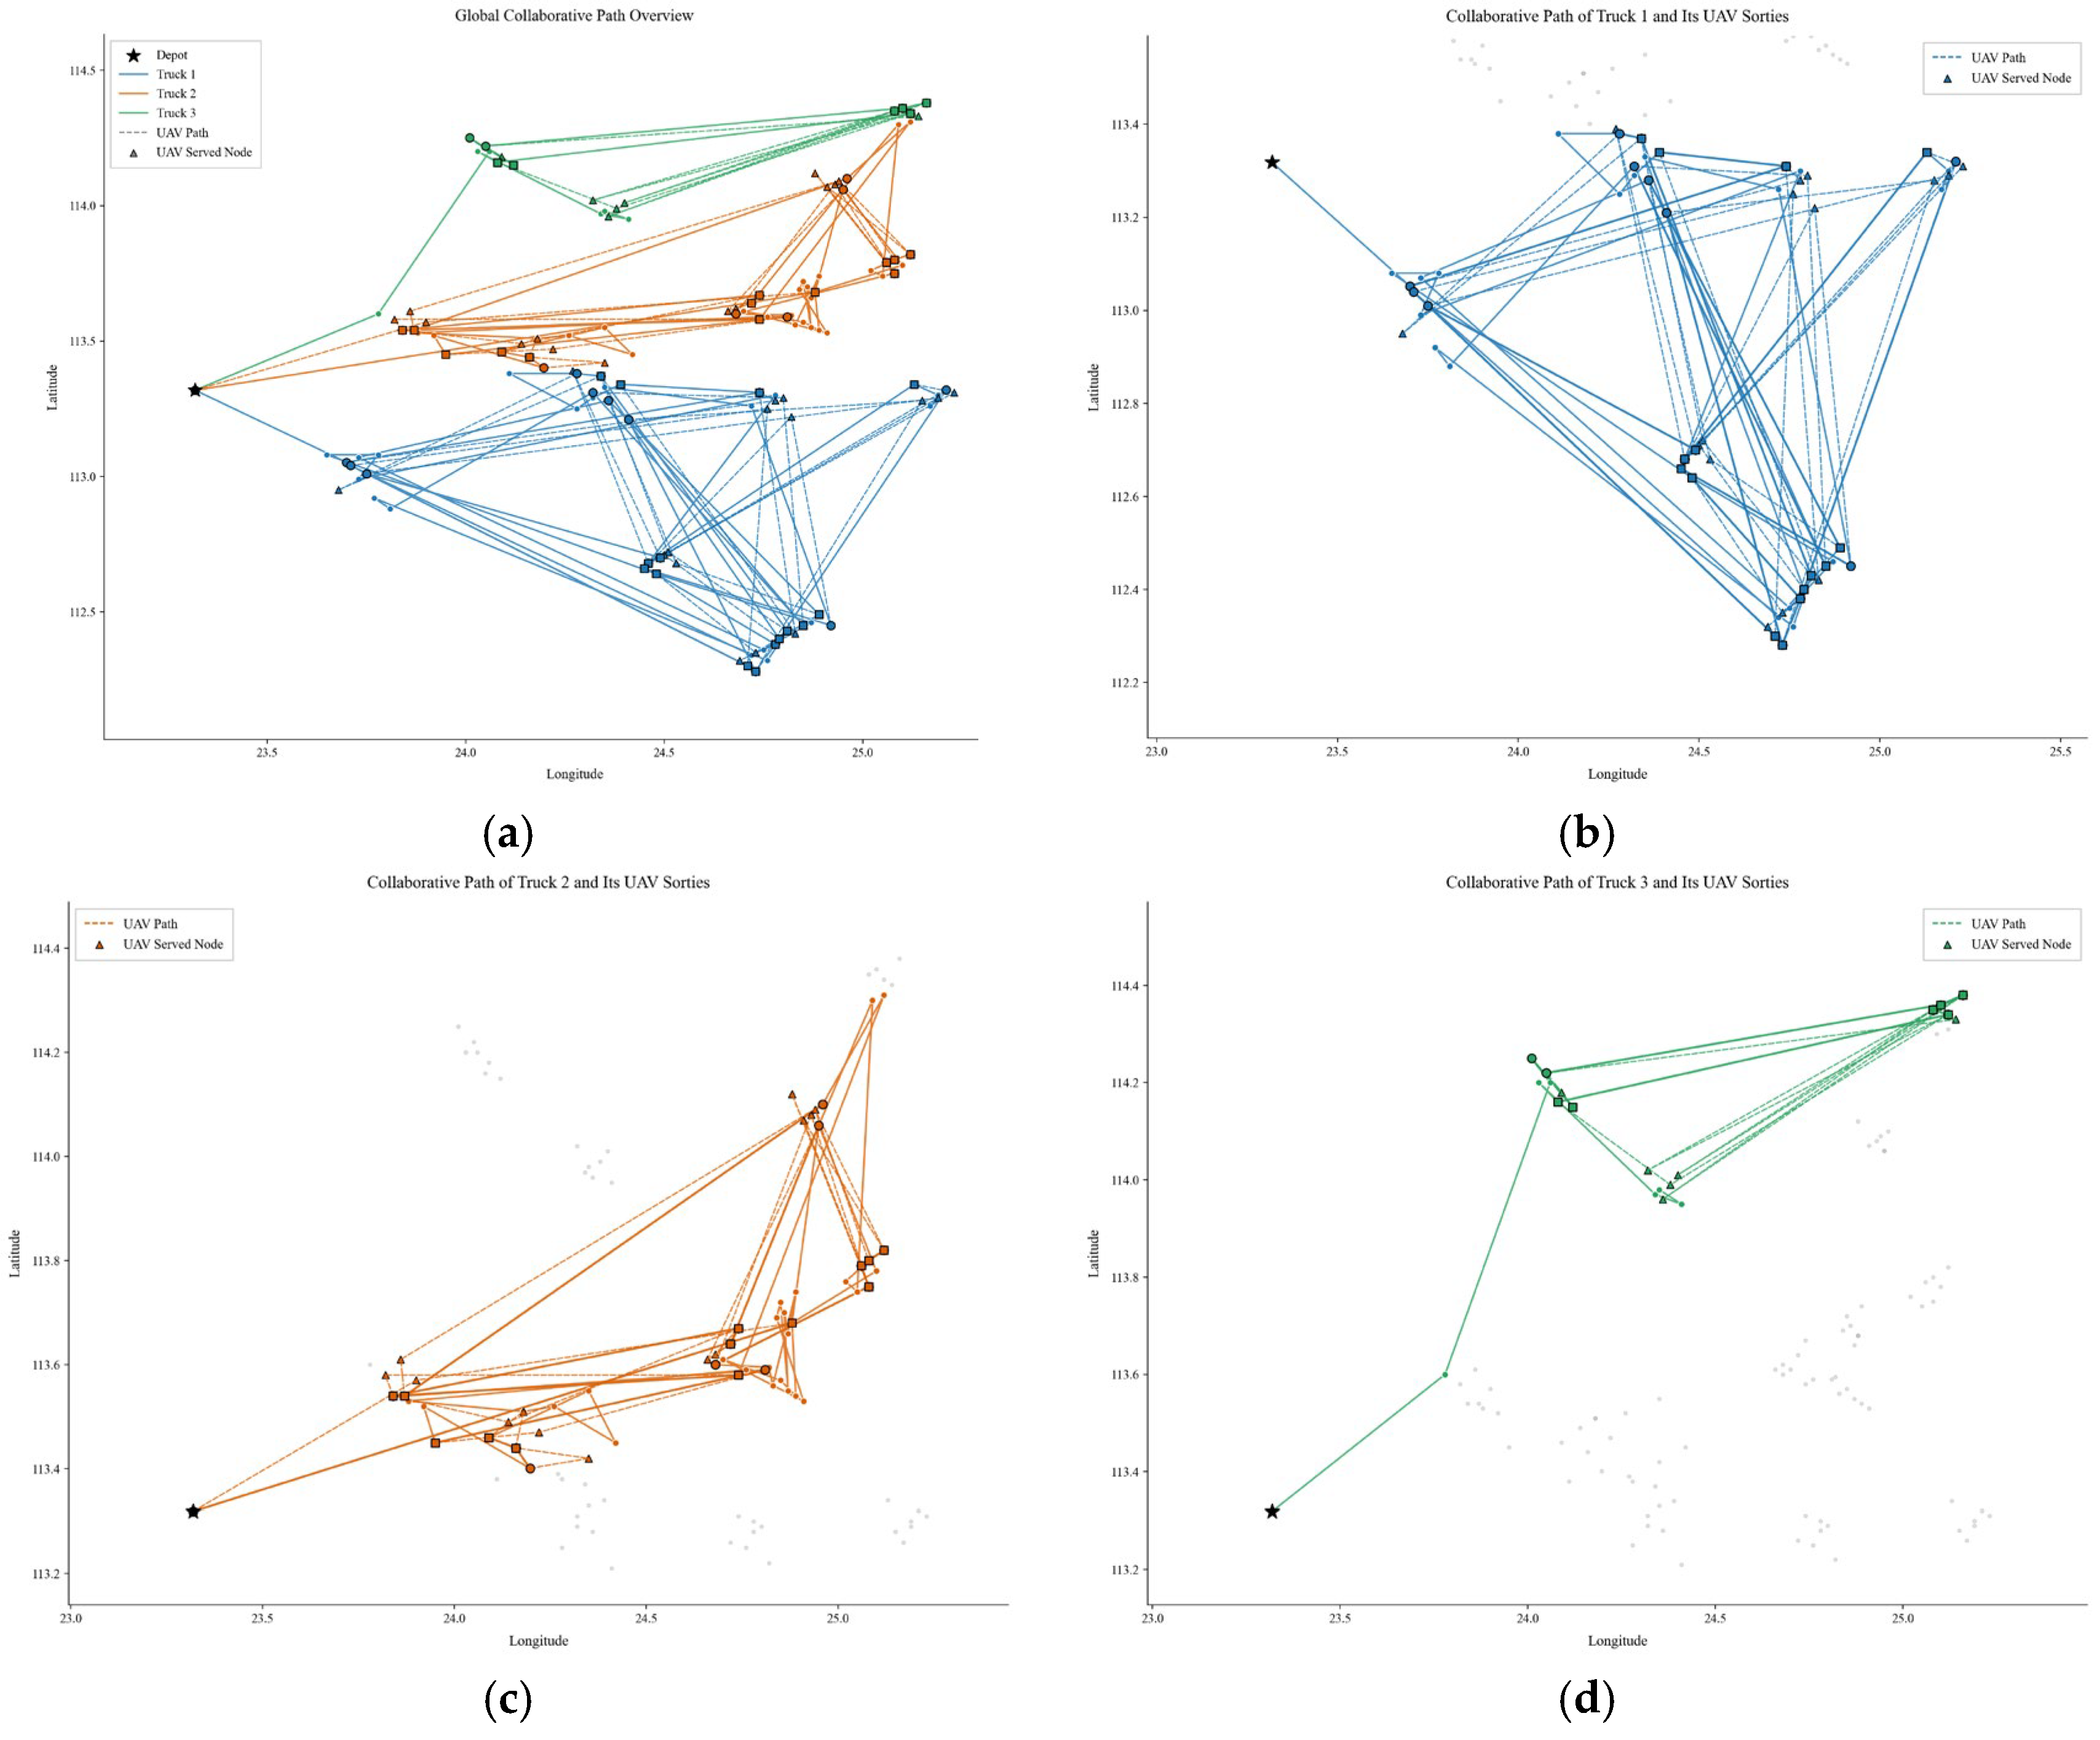
The detailed trajectories of vehicles and UAVs are illustrated in Figure 2.
In the figure, different vehicle routes are distinguished by solid lines of different colors, while different UAV routes are distinguished by dashed lines of different colors. The following conclusions can be drawn. First, the vehicle routes exhibit a clear pattern of regional partitioning. The three vehicle routes cover relatively contiguous geographical areas with limited overlap, thereby reducing unnecessary travel distance and time. Second, UAV tasks are mainly distributed over outlying nodes beyond the main vehicle routes. By adopting the “launch on an arc and recover at the arc destination” mechanism, UAVs achieve rapid coverage of peripheral demand points, thereby reflecting the complementary advantage of vehicle–UAV collaboration: vehicles undertake trunk transportation and large-scale coverage, whereas UAVs provide a highly mobile supplementary service to remote or dispersed nodes [16].
(2)
Time Synchronization Mechanism and Waiting Effects
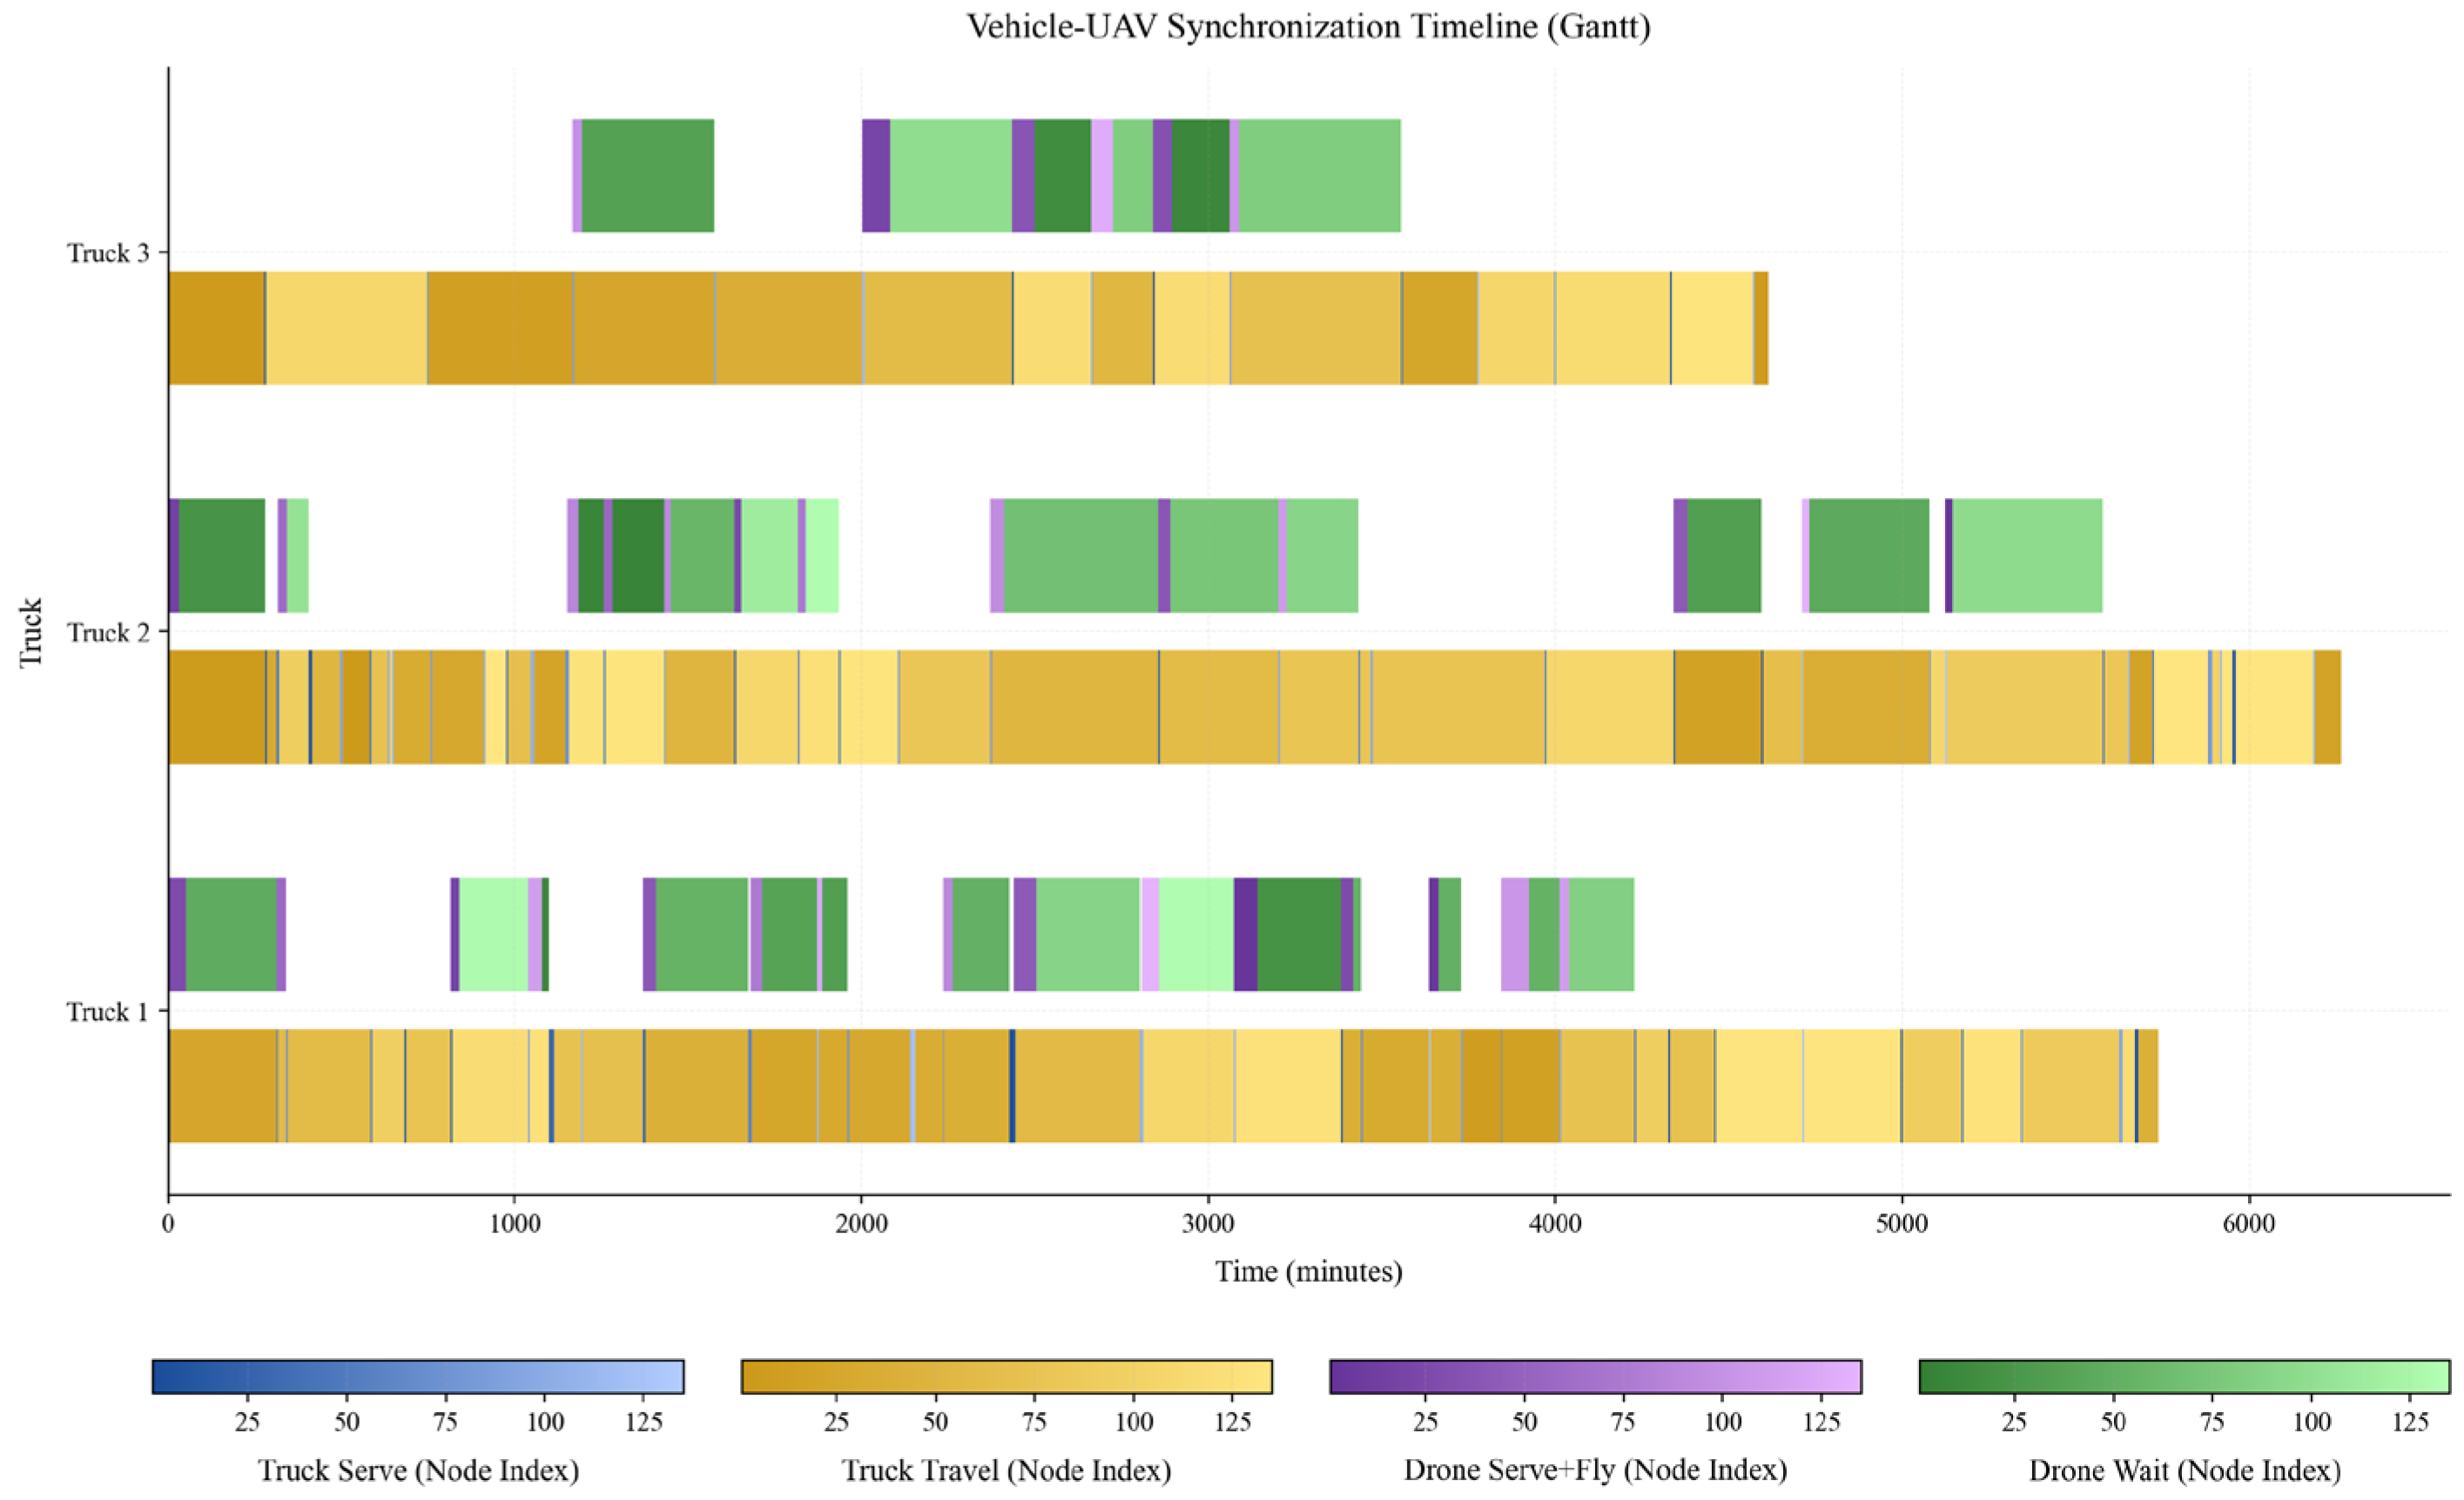
Figure 3, presented as a Gantt chart, shows that vehicle travel and UAV sorties are executed in parallel rather than sequentially. The vehicle remains the structural backbone of the mission, while the UAV is launched on a vehicle arc, completes its delivery task during vehicle movement, and then a rendezvous occurs at the designated recovery node. This pattern indicates that the vehicle is kept moving to protect the overall schedule, and the UAV absorbs the synchronization slack. In other words, the chart directly visualizes the temporal coupling mechanism of the proposed system.
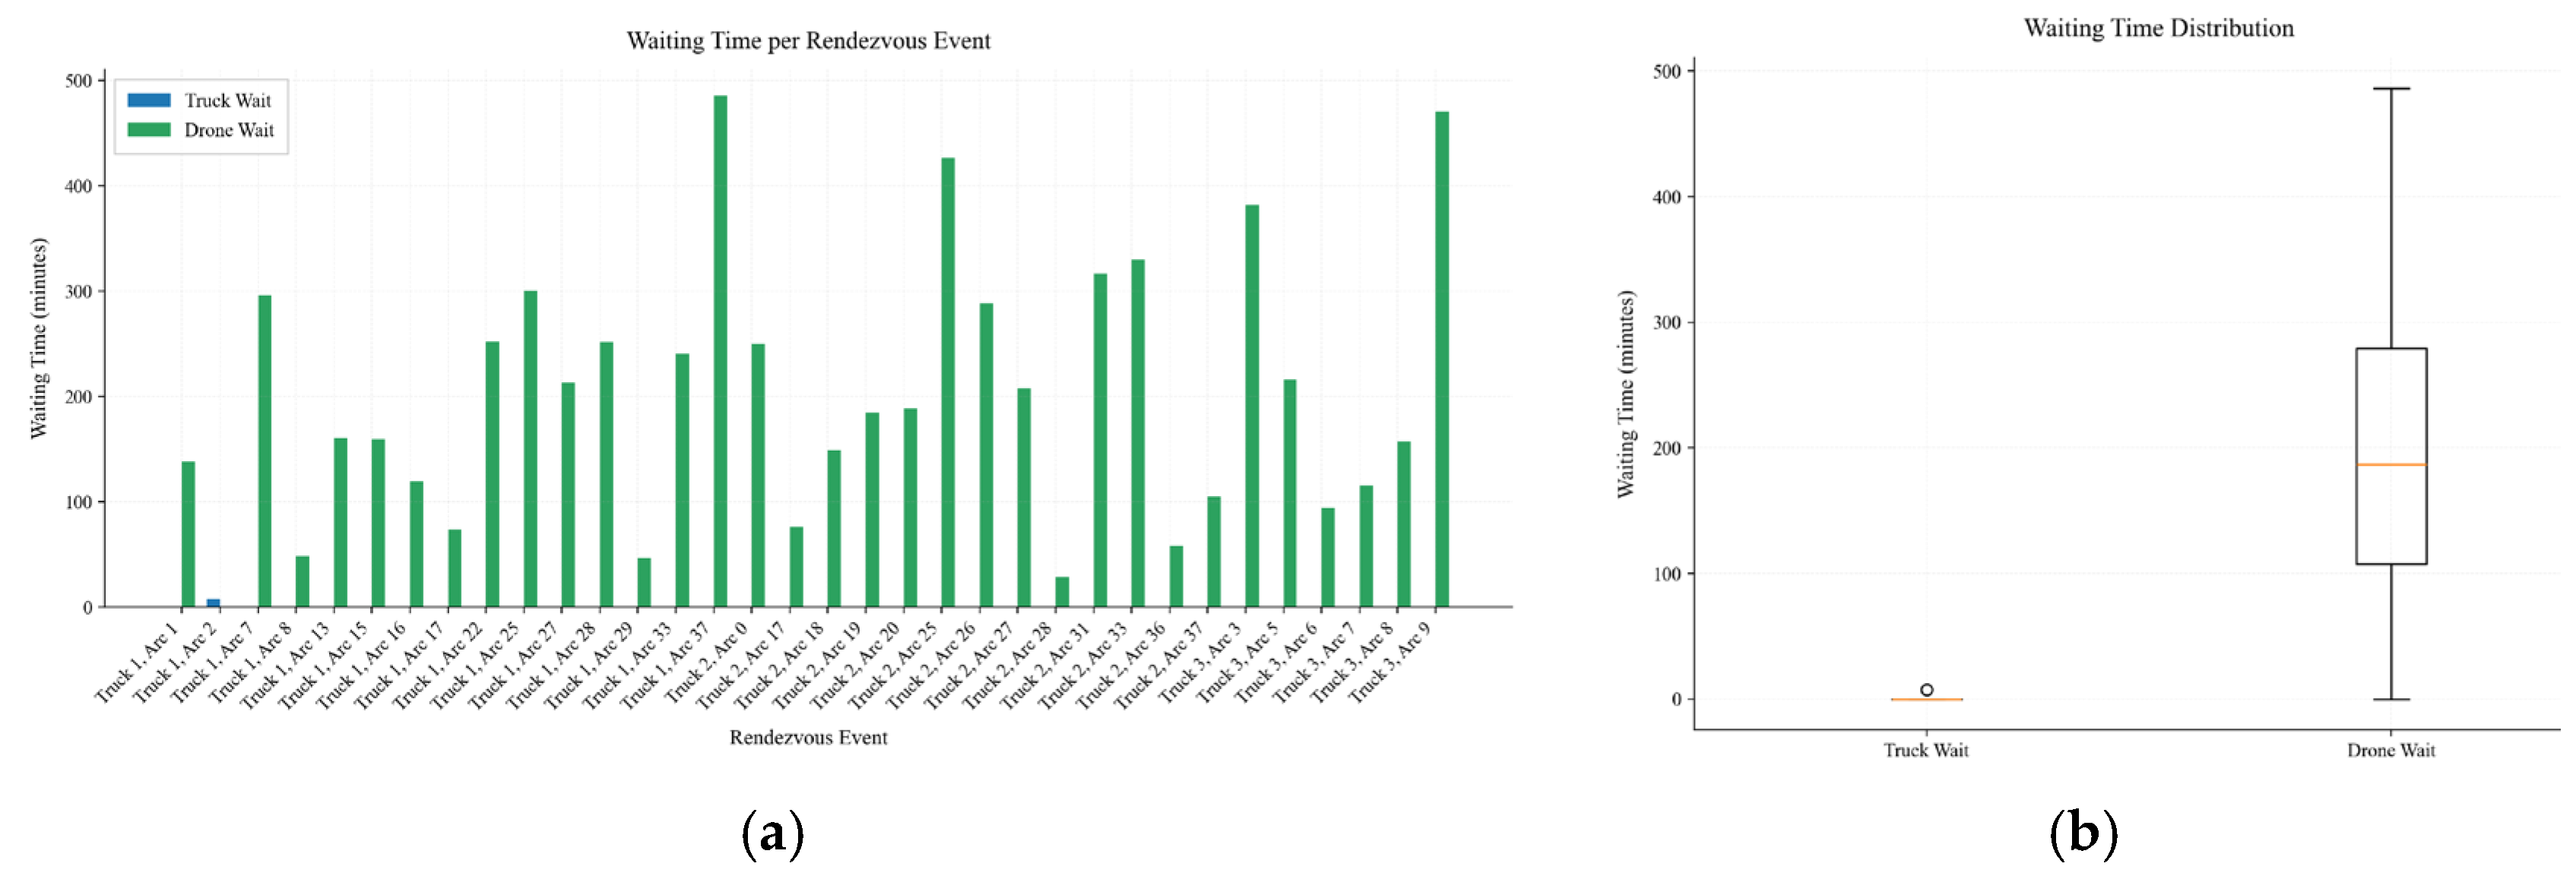
The UAV is launched on a vehicle arc and performs its task while the vehicle continues moving along the road network. Since the sortie must rendezvous with the vehicle at the arc destination, waiting occurs whenever the arrival times of the vehicle and UAV are not synchronized. As shown in Figure 4a,b, vehicle waiting times are generally small, whereas UAV waiting times exhibit substantially greater dispersion. This result should not be interpreted as evidence of poor routing design or under-utilization of aerial resources. On the contrary, the average UAV payload utilization in the current solution is close to 90%, indicating that the UAV capacity has already been exploited intensively within the feasible sortie set. Therefore, the longer waiting time is better understood as a consequence of the inherent capability asymmetry between vehicles and UAVs rather than as a simple planning inefficiency. Specifically, vehicles provide the main trunk transport and carry substantially larger loads, whereas UAVs, although faster and more flexible, remain constrained by limited payload and battery endurance. Under such asymmetric capacities, UAV sorties can effectively supplement service to peripheral or hard-to-reach nodes, but they must still re-synchronize with the supporting vehicle at designated rendezvous points. As a result, part of the temporal burden of collaboration is naturally transferred to the UAV side [17].
From this perspective, the waiting time observed in Figure 4 is a reasonable coordination cost for maintaining the feasibility and responsiveness of the overall rescue system. In flood-rescue operations, forcing vehicles to stop frequently in order to eliminate UAV waiting would likely weaken the continuity of ground transport and reduce the efficiency of serving high-demand nodes [18]. By contrast, allowing UAVs to absorb part of the synchronization slack enables the system to preserve vehicle progress while still taking advantage of aerial accessibility. This interpretation is also supported by the vehicle–UAV routing literature, where payload-dependent endurance and rendezvous synchronization are repeatedly identified as major determinants of UAV deployment patterns [19]. Future reductions in UAV waiting time would therefore depend mainly on improvements in endurance and payload capacity, which could enlarge the feasible sortie range and reduce the need for early rendezvous. Moreover, when operational conditions permit, such waiting intervals may also be used for short-range reconnaissance, damage verification, or local situational monitoring, thereby partially converting synchronization time into additional rescue value [20].
(3)
Spatial Gradient of Service Completion Time and Priority Response
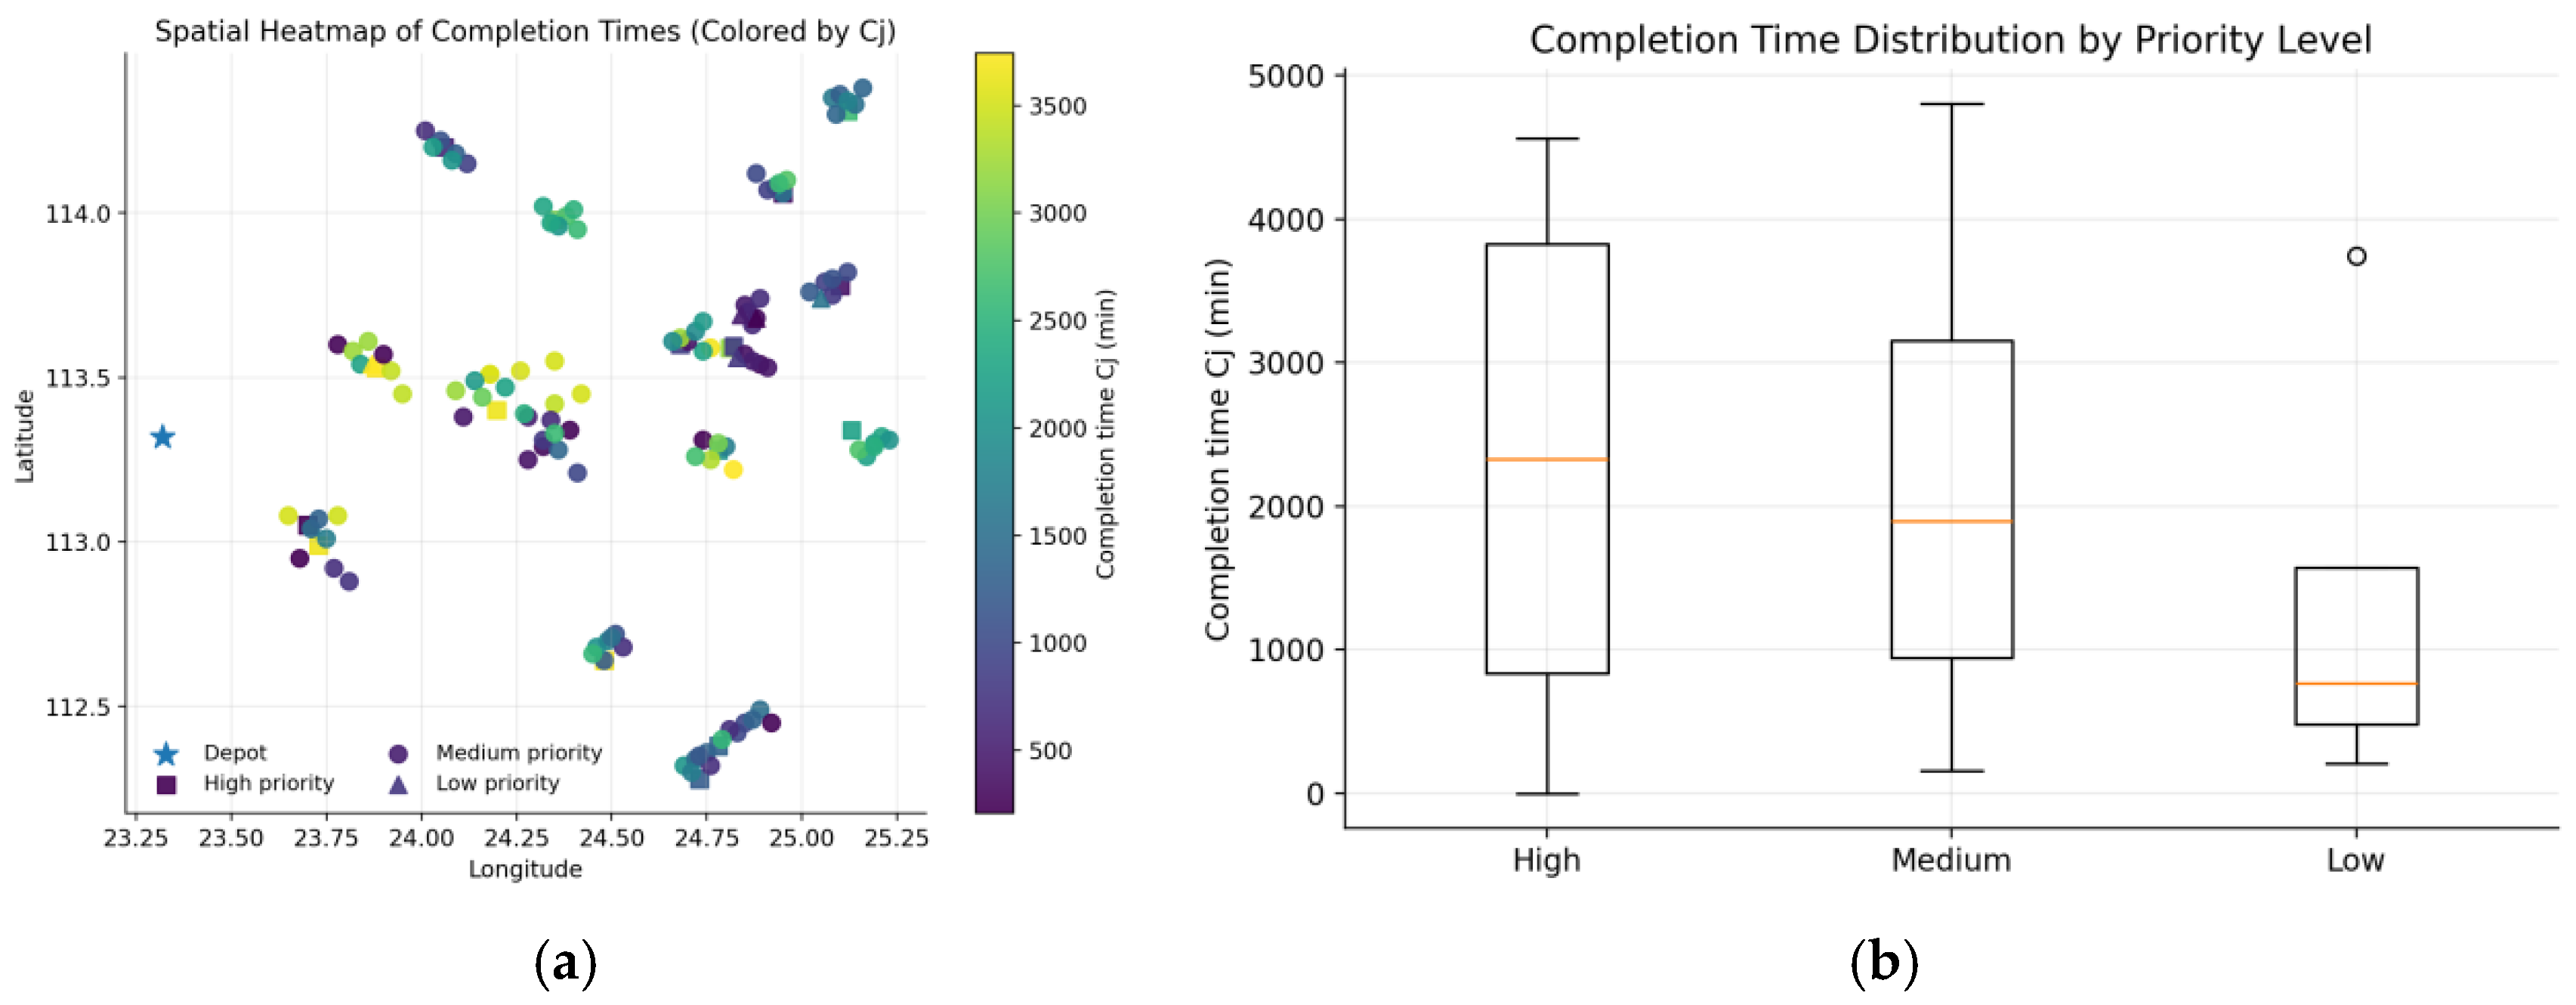
Figure 5a shows that service completion times exhibit a clear spatial gradient, increasing from near to far locations. At the same time, some distant nodes do not exhibit significantly larger completion times, suggesting that they may have been served more efficiently by UAVs.
Figure 5b further compares the completion time distributions across nodes of different priority levels. The results indicate that high-priority nodes have a significantly lower median completion time and an overall left-shifted distribution, which suggests that the weighted term in the objective function effectively drives the algorithm to prioritize the response to critical nodes. In addition, the tail risk of high-priority nodes is lower, indicating that the algorithm not only reduces the average completion time but also decreases the probability of severe delays at critical nodes, which is particularly important in rescue operations [21].
(4)
Algorithm Convergence and Search Behavior
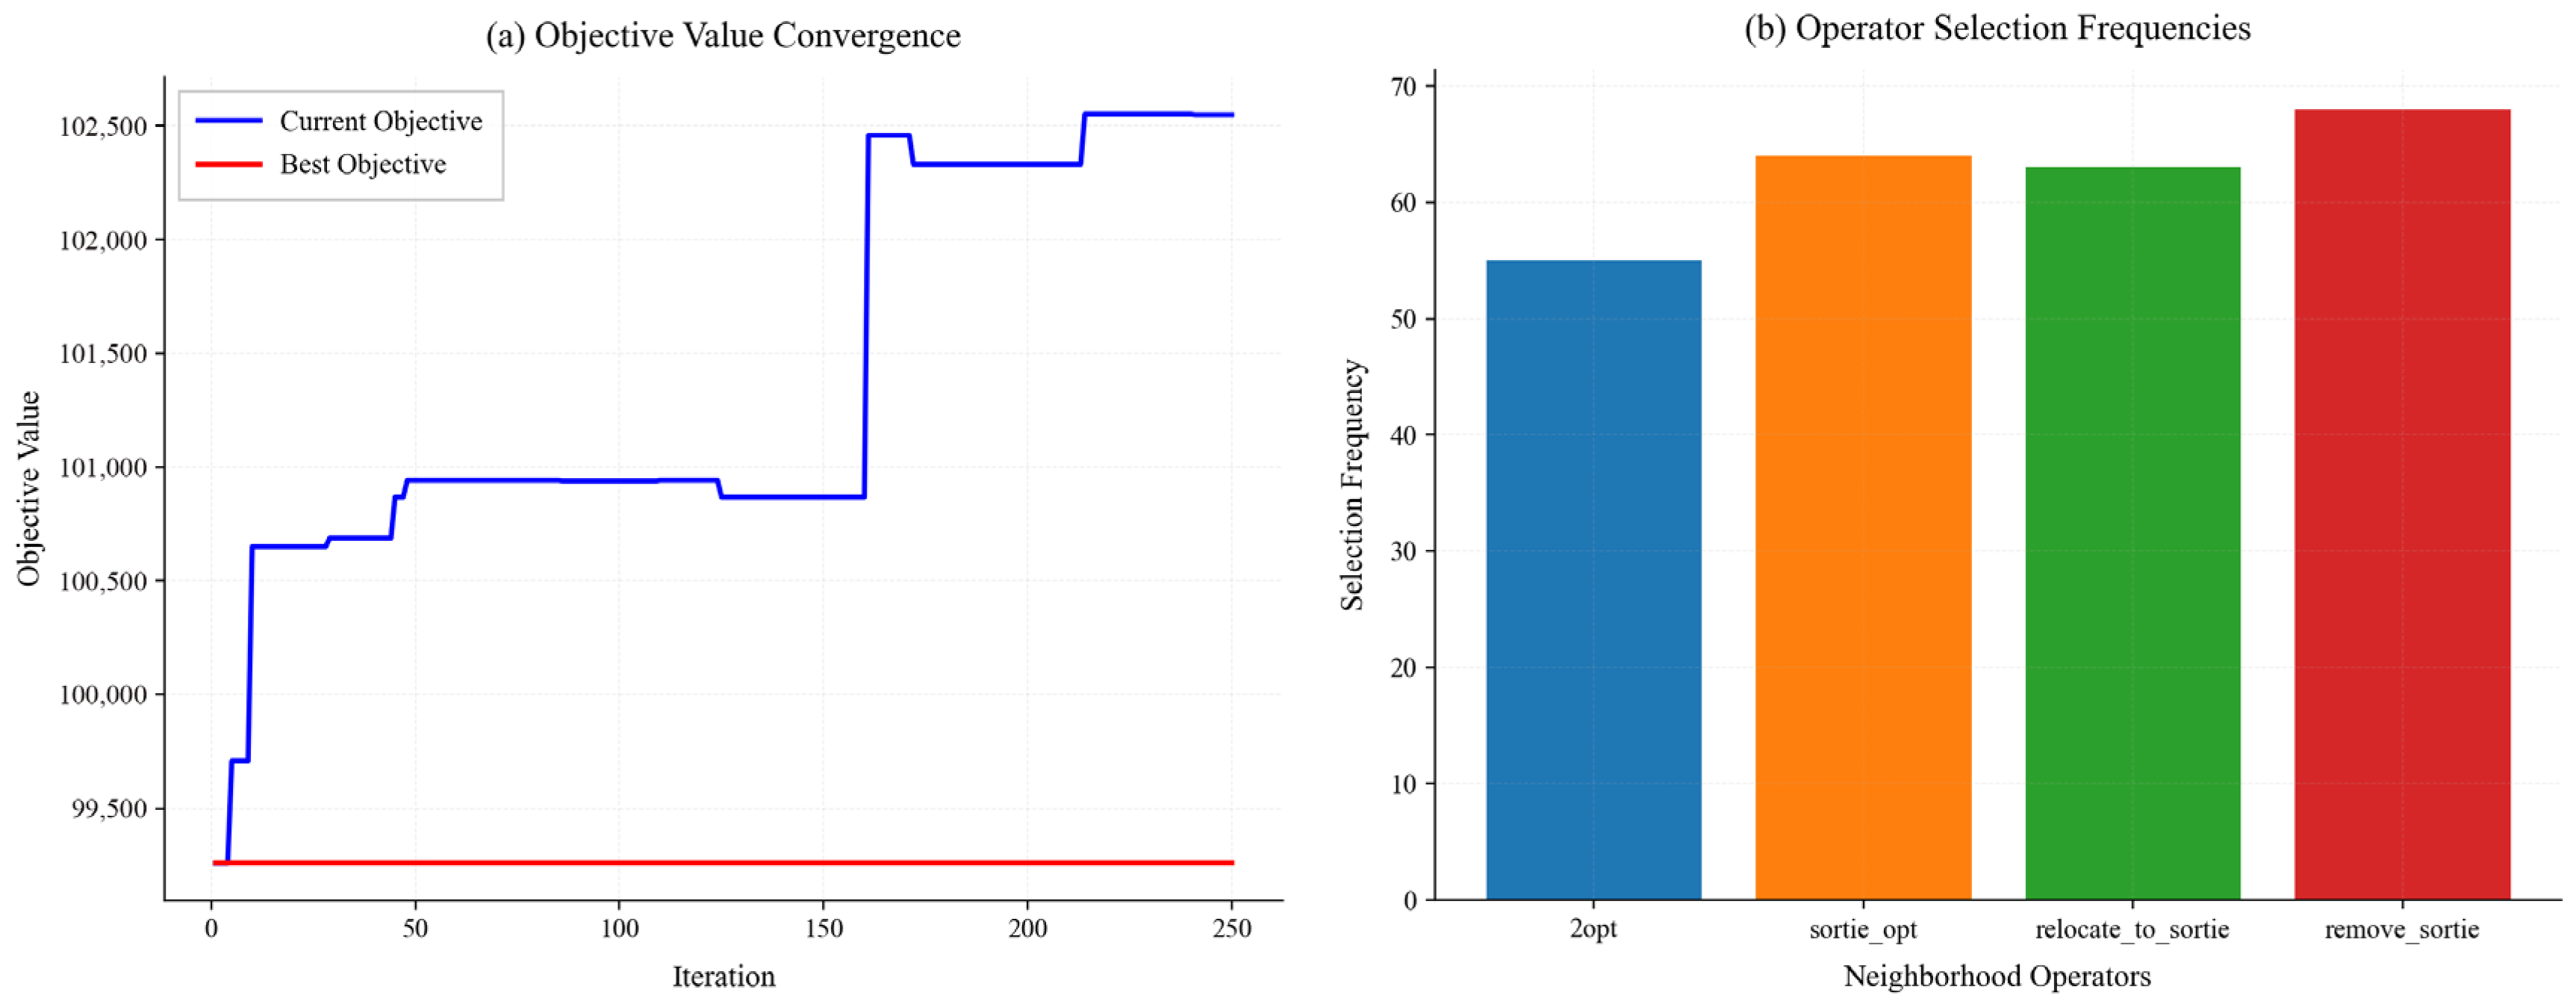
To verify the stability and effectiveness of the algorithmic solution process, Figure 6a presents the trajectories of the current solution objective value and the historically best objective value during ALNS iterations. It can be observed that the objective value decreases rapidly during the early iterations, while the rate of improvement gradually slows and stabilizes in the middle and later stages.
Figure 6b reports the selection frequencies of different neighborhood operators in order to explain which operations are more critical for solution improvement. The results show that operators related to sorties are selected more frequently, indicating that in vehicle–UAV collaborative routing problems, the reassignment of nodes between vehicles and UAVs is the core mechanism for improving the objective value. Local route-optimization operators mainly play a role in fine-tuning route shapes, and together with collaborative reassignment operators, they form a combined search pattern of structural improvement plus local optimization [14,22].
(5)
UAV Payload–Energy Utilization and Feasibility
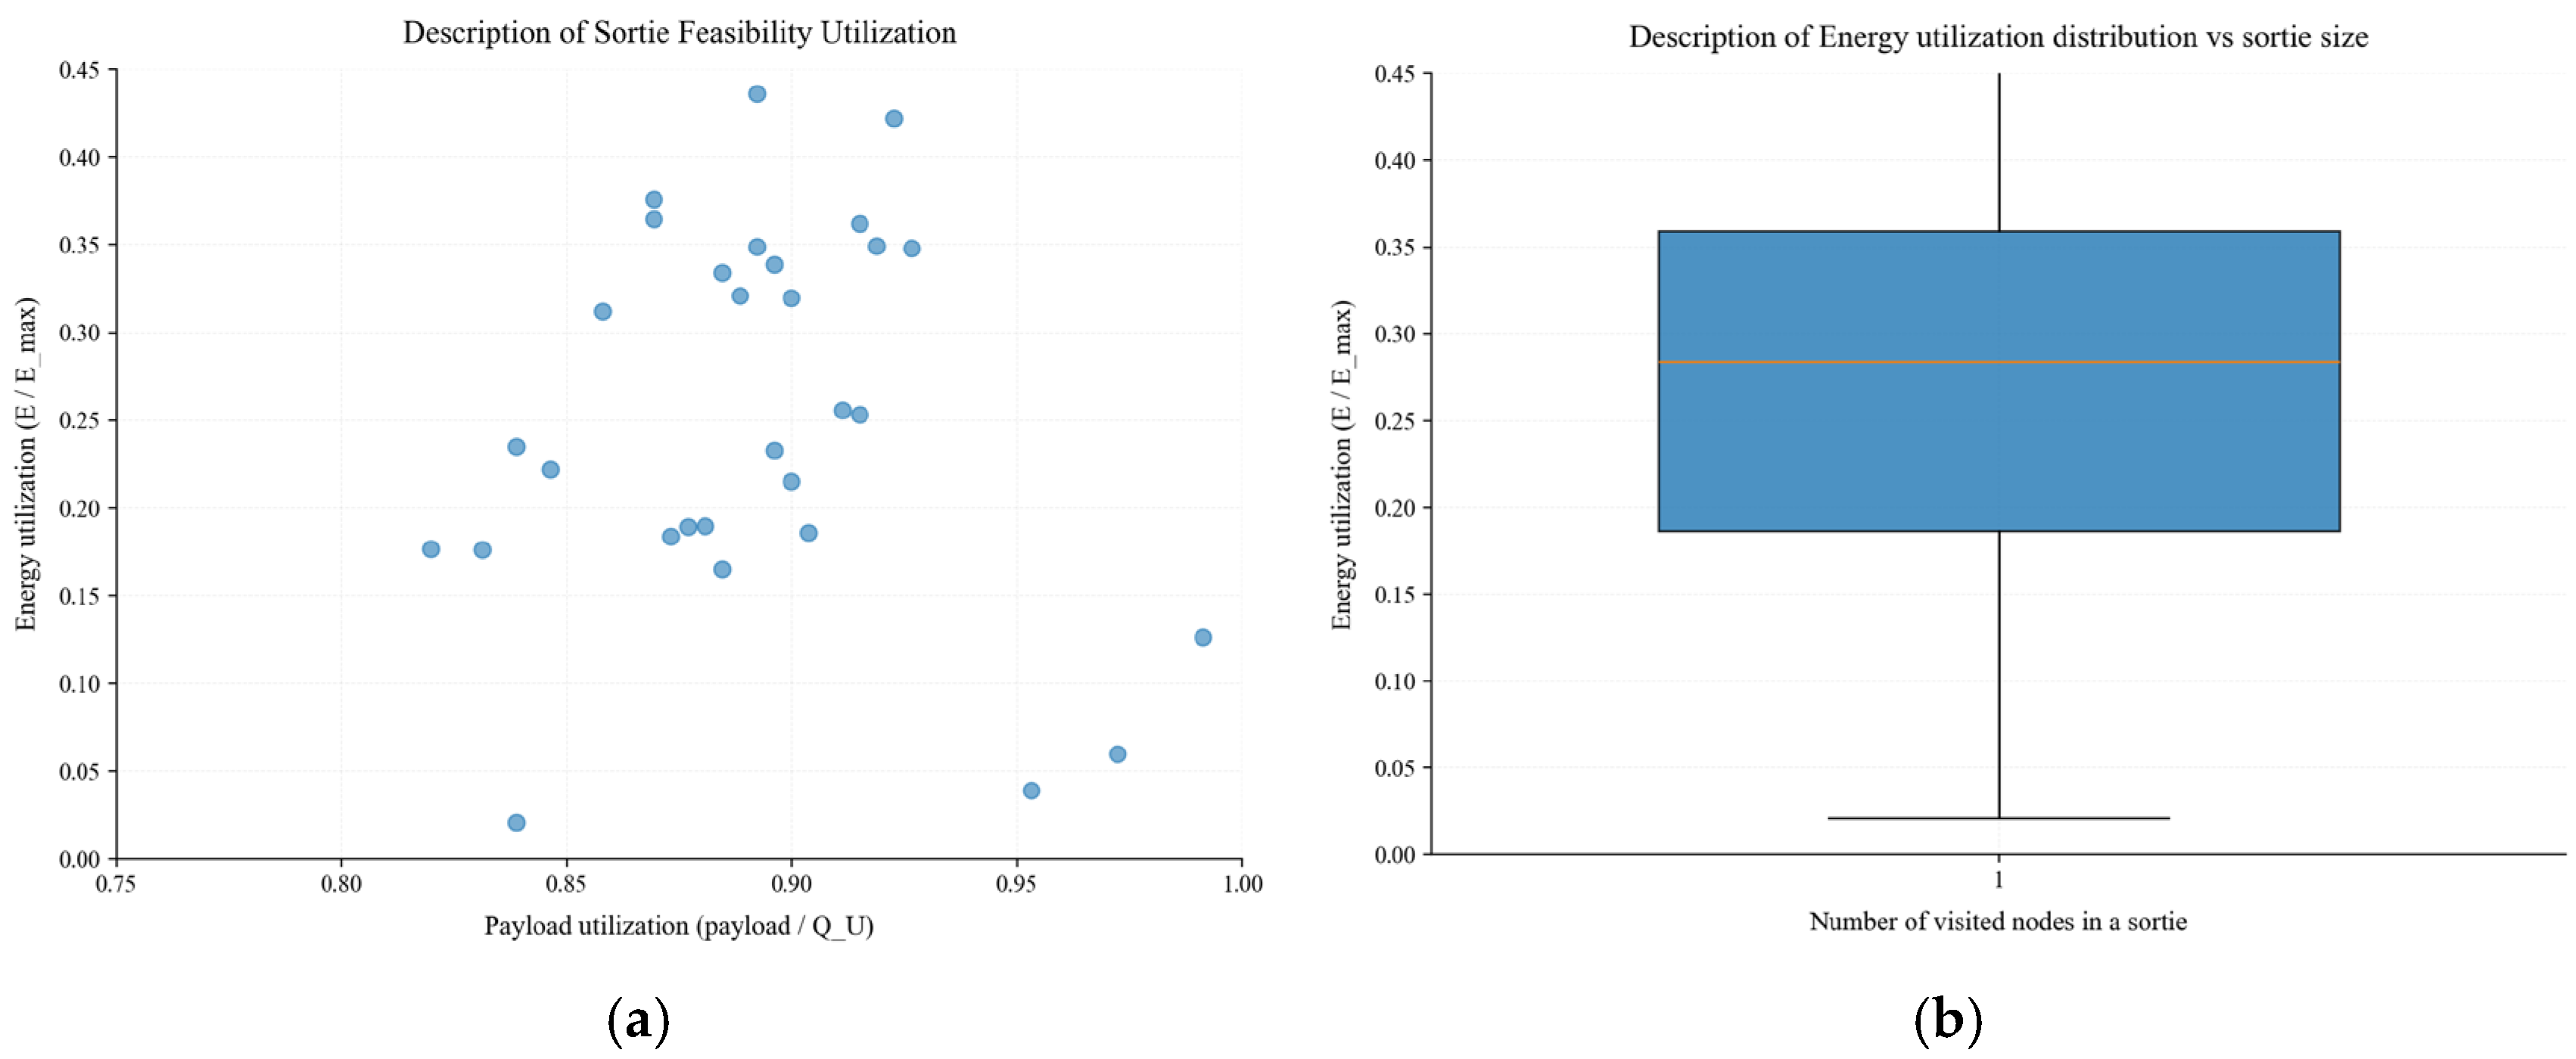
Figure 7a shows that most sorties have a relatively high payload utilization rate, indicating that the algorithm tends to load UAVs as fully as possible within the feasible range in order to improve the efficiency of each dispatch. However, the overall energy utilization rate remains relatively low, suggesting that system performance is more likely to be constrained by synchronization waiting and vehicle-route structure than by the battery limit itself [23].
Figure 7b further presents the statistical distribution of energy utilization rates. The distribution is generally concentrated in a relatively low range with moderate dispersion, indicating that the flight intensity of UAVs varies across sorties, while a sufficient safety margin in battery energy is maintained overall.

4.2. Sensitivity Analysis

To evaluate the effect of the trade-off coefficient α on the solution results and collaborative strategies, this study conducts a sensitivity analysis centered on the objective function. A larger α places greater emphasis on completing the overall mission as early as possible, whereas a smaller α places greater emphasis on priority-weighted early response [13,24].
The experiments use the same instances and parameter settings as in the main experiment, with only α being changed. To reduce the incidental effect of heuristic randomness, each value of α was tested using 10 independent runs with different random seeds, and the mean results were reported. Specifically, α ∈ {0, 0.2, 0.4, 0.6, 0.8, 1.0} was tested. Table 7 reports the statistical results under different values of α.
(1)
Trade-off Relationship and Effective Range of α
As shown in Table 7, when α ∈ [0, 0.8], Tmax remains basically stable within 6028.133–6085.513 min, and ΣwjCj remains stable within 192,480.476–193,225.710. In other words, changing the preference weight within this range does not significantly alter the two decomposed performance indicators. This suggests that, under the current resource allocation and constraint conditions, the system possesses a set of structurally similar high-quality collaborative solutions that can simultaneously maintain satisfactory overall completion efficiency and priority-response performance.
A further noteworthy observation is that the solutions for α = 0.0, 0.2, and 0.4 are identical in the current instance. This suggests that, under the present flood-disruption network and resource setting, the weighted response component already leads the search toward a collaboration structure that is similarly efficient in makespan terms. Thus, within the lower-to-moderate range of α, the two components of the objective are not in sharp conflict; instead, they are partially aligned through the collaborative use of UAVs to accelerate service to remote or high-priority nodes without severely delaying the overall mission. This phenomenon is consistent with the humanitarian-routing literature, which has shown that efficiency and priority/equity objectives are not always strictly antagonistic; under an appropriate routing structure, they can reinforce each other over a moderate parameter interval [25].
When α = 1.0, Tmax increases to 8604.275 min, and ΣwjCj increases to 284,711.542, indicating that both indicators deteriorate simultaneously. This shows that an extreme preference does not yield gains in makespan, but instead induces a degradation of the collaborative structure.
(2)
Response of Critical Nodes and Tail Risk
In rescue scenarios, the worst-case performance of critical nodes, namely tail risk, is often more relevant for decision-making than the average level [26]. Table 7 shows that when α ∈ [0, 0.8], the 90th percentile of the completion times of Level-1 nodes remains within a narrow fluctuation range of 5661.369–5762.591 min. This indicates that the current model is able to protect high-priority nodes with strong robustness across moderate parameter settings. In practical terms, even when the decision preference shifts somewhat toward overall completion efficiency, the most delayed critical nodes do not experience substantial service deterioration.
By contrast, when α = 1.0, the Level-1 P90 rises sharply to 8217.703 min. This increase is much larger than the variation observed within the moderate α range and indicates a substantial growth in the tail risk of critical-node response. This result has an implication: once the model completely removes the incentive to value early service to high-priority locations, it does not merely redistribute service times evenly across all nodes; rather, it allows some critical nodes to be pushed much later in the rescue sequence. In humanitarian logistics terms, this represents a loss of responsiveness where it matters most. Therefore, the sensitivity analysis suggests that the weighted response component of the objective is not only a normative preference term, but also a practical safeguard against late service to life-saving or highly sensitive locations.
(3)
Mechanistic Interpretation of Collaboration Intensity and Synchronization Waiting
In terms of collaboration intensity, when α ∈ [0, 0.8], the average number of sorties is 32–34, corresponding to 32–34 UAV-served nodes, and UAV payload utilization stays around 89%. This means that the system maintains an active and intensive collaboration structure in which UAVs are not marginal resources, but essential components of the service architecture.
When α = 1.0, the solution changes substantially: the number of UAV sorties drops from 32–34 to 4, total travel distance decreases to 8404 km, and both vehicle and UAV waiting times are reduced. However, this does not indicate a more efficient collaborative plan. Instead, it shows that UAV participation is greatly weakened, so more nodes are shifted back to vehicle service and the rescue process becomes less parallelized. As a result, the collaborative advantage of the vehicle–UAV system is reduced, which explains why both Tmax and priority-response performance deteriorate simultaneously.
Waiting time should be interpreted in the same way. Under moderate α values, UAV waiting is higher than vehicle waiting, but UAV payload utilization remains high, indicating that UAVs are actively used rather than idle. In this case, part of the synchronization slack is assigned to UAVs so that vehicles can continue advancing along the disrupted road network. Therefore, lower waiting time does not necessarily imply a better solution; in this study, a moderate level of UAV waiting is the temporal cost of maintaining effective vehicle–UAV collaboration.
Considering the trade-off relationship, tail risk of critical nodes, and collaboration intensity jointly [27,28], this study recommends prioritizing α ∈ [0.2, 0.8] in flood-rescue instances of this type. Within this interval, both low Tmax and low ΣwjCj, can be maintained, while a relatively high level of UAV collaboration is preserved and the tail risk of critical nodes remains stable. From the perspective of decision preference, the following additional recommendations can be given:
① If greater emphasis is placed on rapid response and risk control for critical nodes, α ≤ 0.4 is recommended.
② If greater emphasis is placed on completing the overall mission as early as possible while still considering critical nodes, α = 0.6 is recommended.
③ α = 1.0 is not recommended, because it may lead to degradation of the collaborative structure and simultaneous deterioration in Tmax. Once α reaches 1.0, the objective function completely removes the incentive to protect early service to critical or remote nodes. As a result, the search tends to suppress UAV deployment and relies much more heavily on vehicle-only service along the disrupted road network. In other words, the model no longer uses UAVs to absorb spatial dispersion and priority pressure; instead, more nodes are forced back onto the ground routes, making the rescue process more sequential and less synchronized in a beneficial way. The consequence is that both overall completion time and priority-node response deteriorate.

4.3. Comparative Analysis

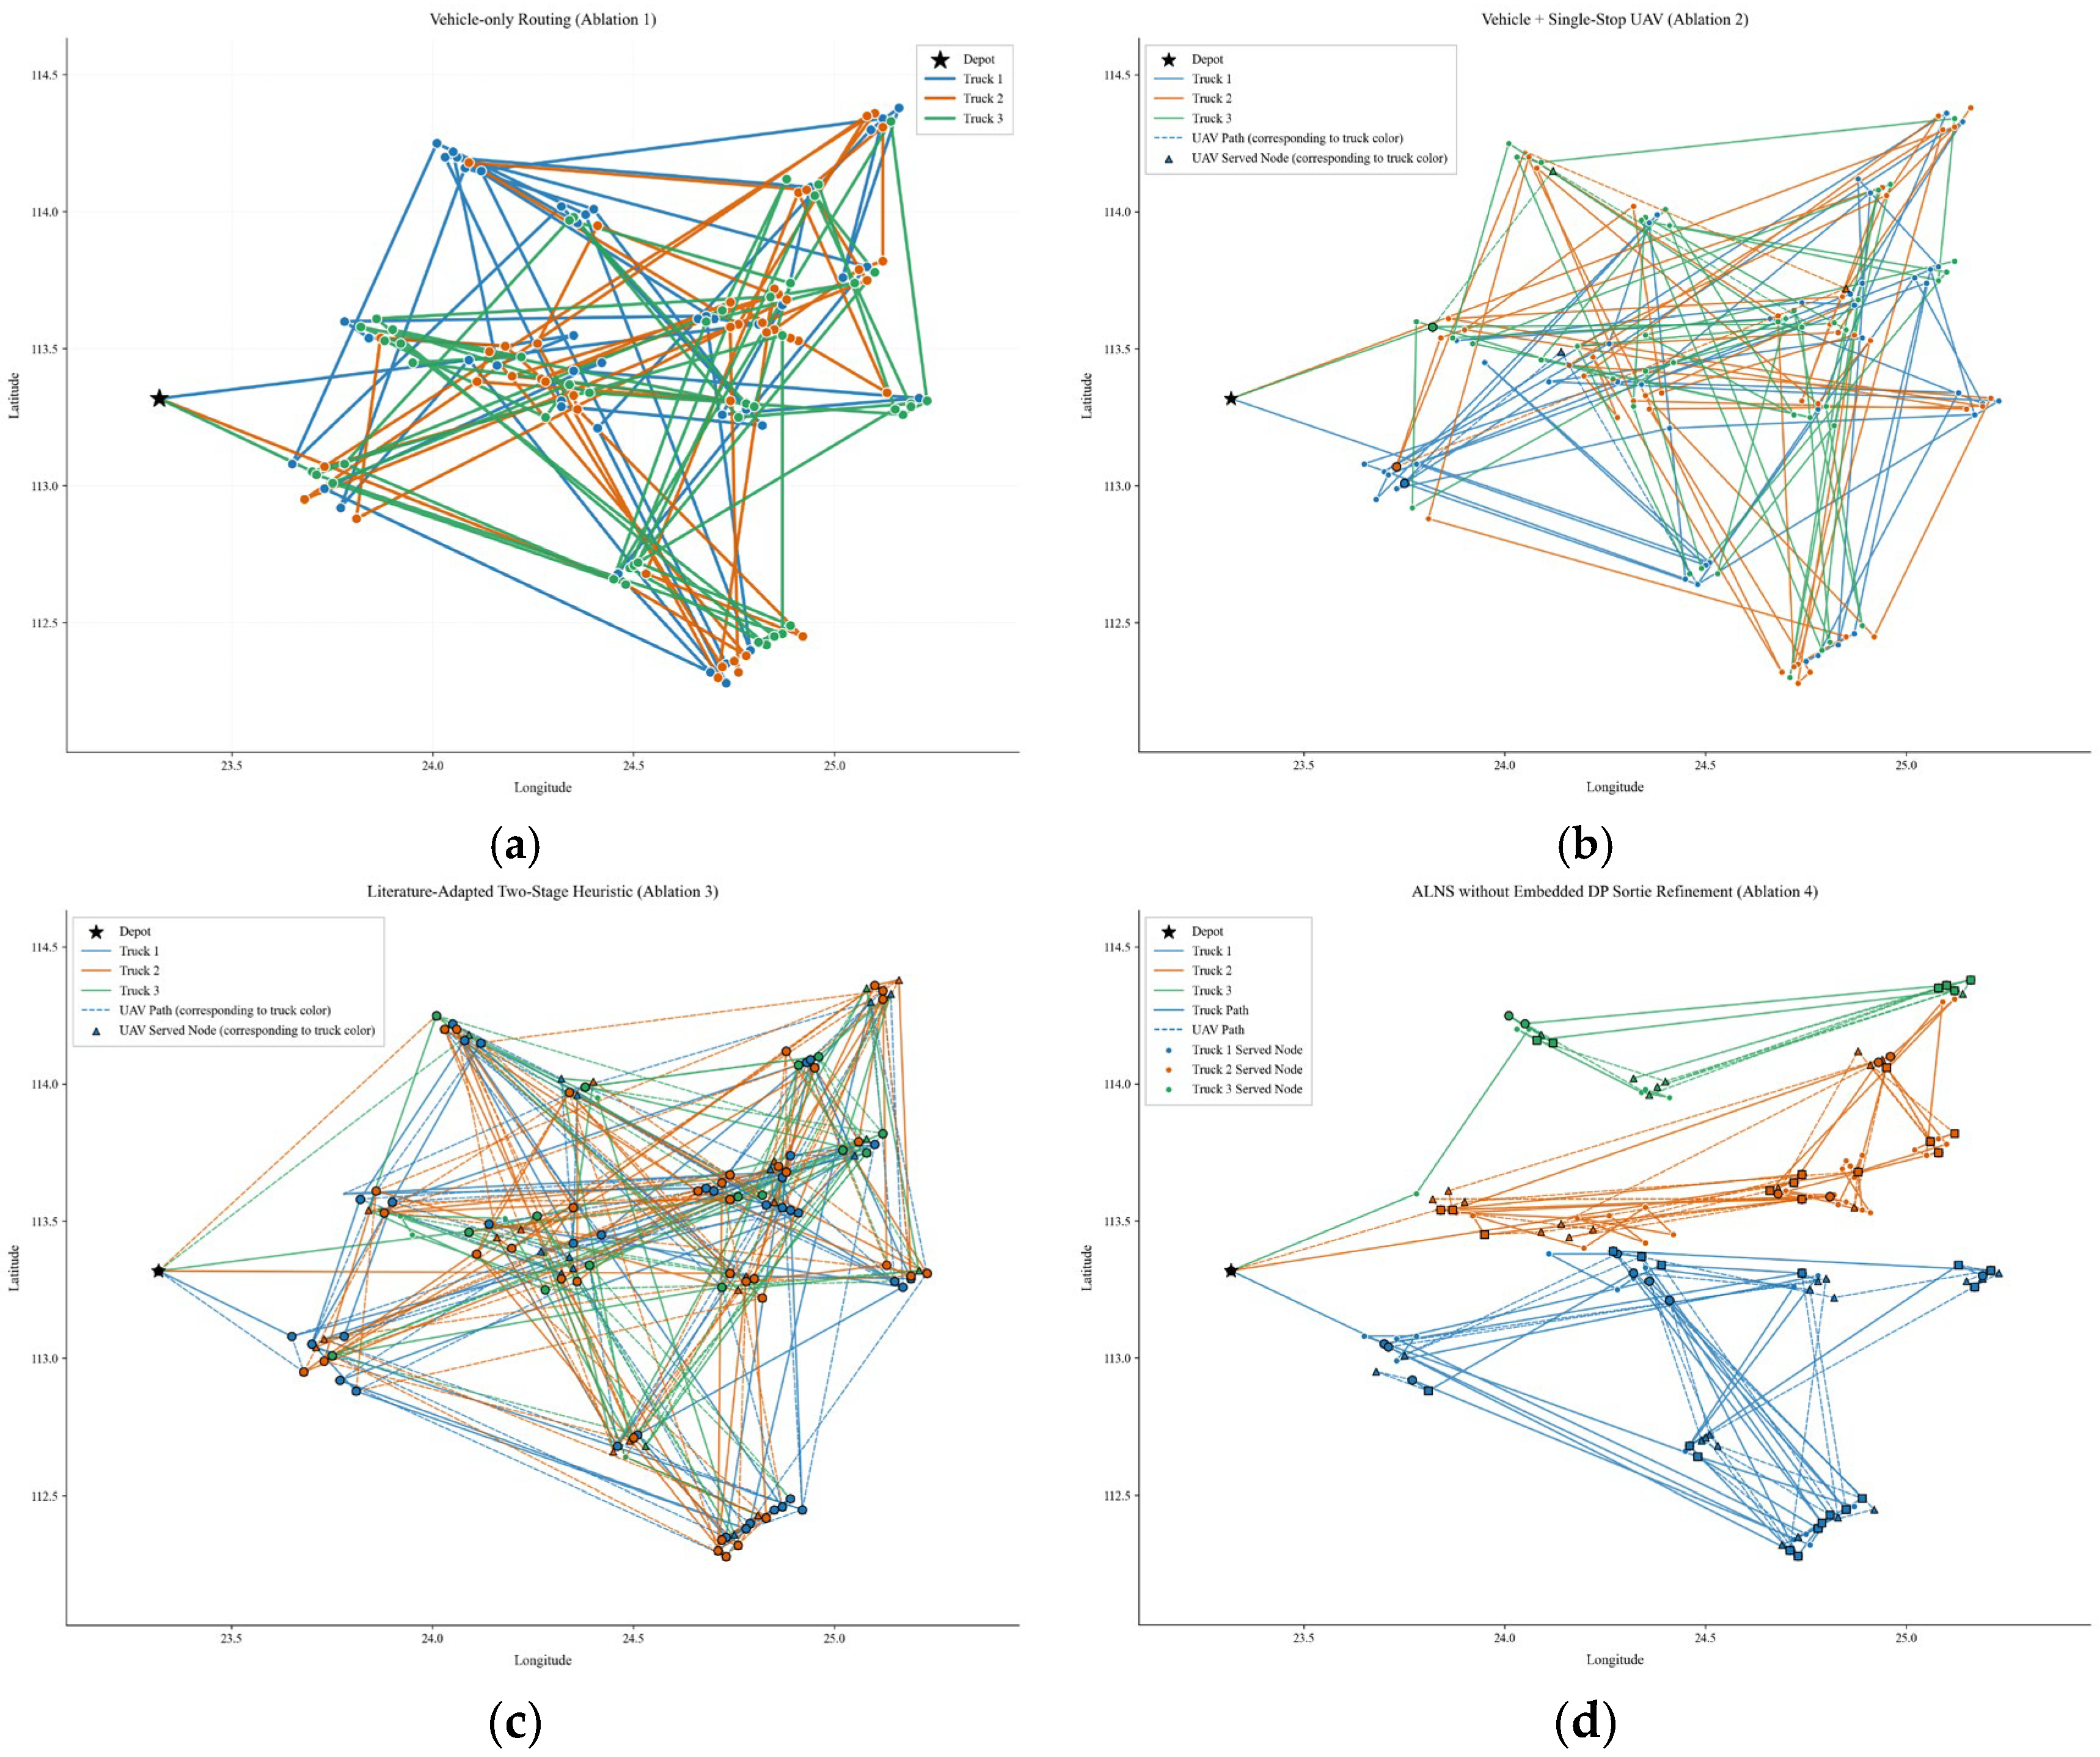
To further evaluate the effectiveness of the proposed multi-vehicle multi-UAV collaborative delivery model under flood-induced road disruptions, four benchmark settings are introduced for comparison. The first three benchmarks are designed to isolate the contributions of UAV collaboration, multi-point sorties, and integrated optimization relative to representative solution paradigms reported in the literature. The fourth benchmark is an algorithmic ablation setting used to quantify the contribution of the embedded dynamic programming (DP) refinement within the proposed ALNS framework. All methods are tested on the same disrupted road network, with identical demand data, vehicle and UAV capacities, payload-dependent energy settings, and other scenario parameters. The comparative numerical results are summarized in Table 8, and representative route visualizations are presented in Figure 8.
(1)
Vehicle-Only Baseline
This baseline is used to quantify the contribution of UAV collaboration by removing all UAV operations from the system. Specifically, the number of UAVs carried by each vehicle is set to zero, while all vehicle-related constraints, road-disruption avoidance rules, flood-depth-based speed reduction, and the original objective structure are retained. The ALNS framework is correspondingly adapted to solve the resulting pure vehicle-routing problem [1].
The comparison with the vehicle-only baseline provides the clearest evidence of the value of air–ground collaboration. As reported in Table 8, the proposed model reduces T m a x from 9879.067 min to 6028.133 min and decreases j w j C j from 281,480.673 to 193,225.710. At the same time, the average response time for Level-1 nodes drops substantially from 5793.189 min to 1969.077 min. These improvements are not marginal; they indicate that, under disrupted road conditions, UAV collaboration changes the service logic of the rescue system rather than simply accelerating an otherwise unchanged vehicle route. Specifically, UAVs allow the system to serve peripheral or difficult-to-access nodes without forcing vehicles to incur large detours on the damaged road network. As a result, the vehicle routes can retain their trunk-distribution role, while the UAVs absorb part of the spatial dispersion and urgency pressure. This is precisely the type of functional complementarity emphasized in the vehicle–UAV literature: vehicles provide carrying capacity and route continuity, whereas UAVs improve accessibility and timeliness for selected locations. Another implication is that the gain is not limited to overall mission duration. The very large reduction in Level-1 response time shows that UAV collaboration is valuable for protecting critical nodes.
(2)
Vehicle + Single-Stop UAV Baseline
This baseline is used to isolate the contribution of multi-point UAV sorties. Compared with the proposed model, each UAV sortie in this benchmark is restricted to serving at most one affected location before rendezvousing with the vehicle. In implementation terms, the sortie pattern set is restricted to | C p | 1 , while all other synchronization, energy, payload, and road-disruption constraints are kept unchanged. The ALNS framework with embedded dynamic programming is then adapted to optimize only single-stop sorties [1].
Relative to the proposed model, the single-stop setting yields a worse T m a x of 8790.174 min, a worse j w j C j of 265,199.496, and a much higher average response time for Level-1 nodes of 4621.493 min. At the same time, UAV utilization drops sharply to 30.024%, and only six sorties are executed. These results indicate that merely equipping vehicles with UAVs is not sufficient; the way UAV missions are structured is equally important. When each launch can serve only one node, the aerial component becomes highly fragmented, and the benefit of UAV mobility is diluted by repeated launch–recovery overhead and weak task consolidation.
This result is especially meaningful in the present flood-rescue setting. Because road disruption enlarges the effective separation between accessible and difficult-to-access nodes, a single-stop sortie often cannot exploit the full value of an aerial dispatch opportunity. By contrast, multi-point sorties allow the system to package several compatible deliveries into one synchronized flight, thereby reducing sortie fragmentation and making better use of limited payload and endurance. In other words, the advantage of the proposed model is not simply “more UAV trips” but a more efficient use of each launch-and-recovery cycle. This mechanism is also visible in Table 8; compared with the single-stop baseline, the proposed model achieves much higher UAV utilization and much better response to Level-1 nodes while requiring fewer but more productive sorties.
(3)
Two-Stage Heuristic Baseline
To provide a comparison with a representative literature-style solution paradigm, this benchmark adopts an adapted two-stage heuristic framework. In the first stage, vehicle routes are generated without explicitly considering UAV operations. In the second stage, eligible demand nodes are assigned to UAVs on adjacent vehicle arcs using simple insertion rules, but without the dynamic-programming-based local refinement adopted in the proposed method. This benchmark therefore represents a route-first, UAV-second decomposition strategy adapted to the present multi-vehicle multi-UAV flood-rescue setting, while enforcing the same disruption, payload, energy, and synchronization constraints [2,4].
Compared with the proposed model, this benchmark yields a higher T m a x of 6635.915 min, a higher j w j C j of 241,424.949, and a much worse Level-1 average response time of 3304.565 min. Although its UAV utilization reaches 83.033% and 23 sorties are still performed, its overall solution quality remains clearly inferior. This result suggests that the main weakness of the two-stage strategy is not the complete absence of UAV collaboration, but the fact that collaboration is introduced too late in the decision process. Once the vehicle routes are fixed first, UAV deployment is forced to adapt to a structure that was not designed jointly with sortie opportunities, synchronization requirements, or priority-sensitive service. As a result, UAV insertion becomes opportunistic rather than structural. The deeper implication is that, in this flood-rescue problem, collaboration quality depends heavily on simultaneous optimization. The value of UAVs does not come only from serving a subset of nodes, but from reshaping the entire division of labor between ground and aerial resources. If vehicle routing and UAV sortie planning are separated into two sequential stages, the model loses the ability to exploit these cross-effects fully.
(4)
ALNS without Embedded DP Sortie Refinement Baseline
This benchmark is designed as an algorithmic ablation experiment to quantify the contribution of the embedded dynamic programming module within the proposed ALNS framework. In this setting, the overall ALNS structure, neighborhood operators, acceptance criterion, and solution representation are retained, but the exact DP-based sortie refinement is disabled. Instead, feasible multi-customer sorties are constructed and updated using only greedy insertion logic. All other constraints, including synchronization, payload, energy feasibility, and road-disruption constraints, remain unchanged [21].
Without DP refinement, the benchmark obtains a higher T m a x of 6514.206 min, a higher j w j C j of 229,241.537, and a worse Level-1 average response time of 2975.230 min. However, its UAV utilization remains relatively high at 84.316%, and the number of sorties is still 25. This pattern is informative because it shows that the performance loss is not due to a collapse of collaboration intensity. Instead, the system continues to use UAVs frequently, but the quality of sortie construction is lower. In other words, the problem is not whether to use UAVs, but how well each sortie is organized under payload, energy, and synchronization constraints. This distinction is important for interpreting the role of the embedded DP module. In the proposed framework, DP is not an auxiliary coding detail; it is the mechanism that improves the internal structure of UAV sorties by identifying better multi-point flight sequences on candidate arcs.
Overall, the four benchmark experiments reveal that the advantage of the proposed method is layered rather than singular. The vehicle-only comparison demonstrates the value of introducing UAV collaboration under disrupted road conditions. The single-stop baseline shows that the benefit of UAVs depends strongly on whether sortie design can exploit multi-point service. The two-stage heuristic comparison indicates that collaboration must be optimized jointly with vehicle routing rather than appended afterward. Finally, the DP ablation confirms that even within a collaborative heuristic, high-quality sortie refinement remains essential for translating collaboration potential into actual performance. Thus, the proposed model outperforms the benchmarks not because of any single isolated feature, but because it integrates the key mechanisms of effective vehicle–UAV rescue routing into one coherent framework.
From an application perspective, the comparative analysis also provides a clear managerial message. In flood-rescue logistics, simply adding UAVs to a vehicle system is not enough. The real performance gains arise only when UAVs are deployed in a way that preserves parallel service, supports multi-point aerial operations, and is jointly coordinated with vehicle routing and synchronization decisions. Therefore, the practical value of the proposed framework lies not only in obtaining lower objective values, but also in identifying how vehicle–UAV collaboration should be structured to remain effective in disrupted and time-sensitive rescue environments.

4.4. Supplementary Analysis and Practical Extensions

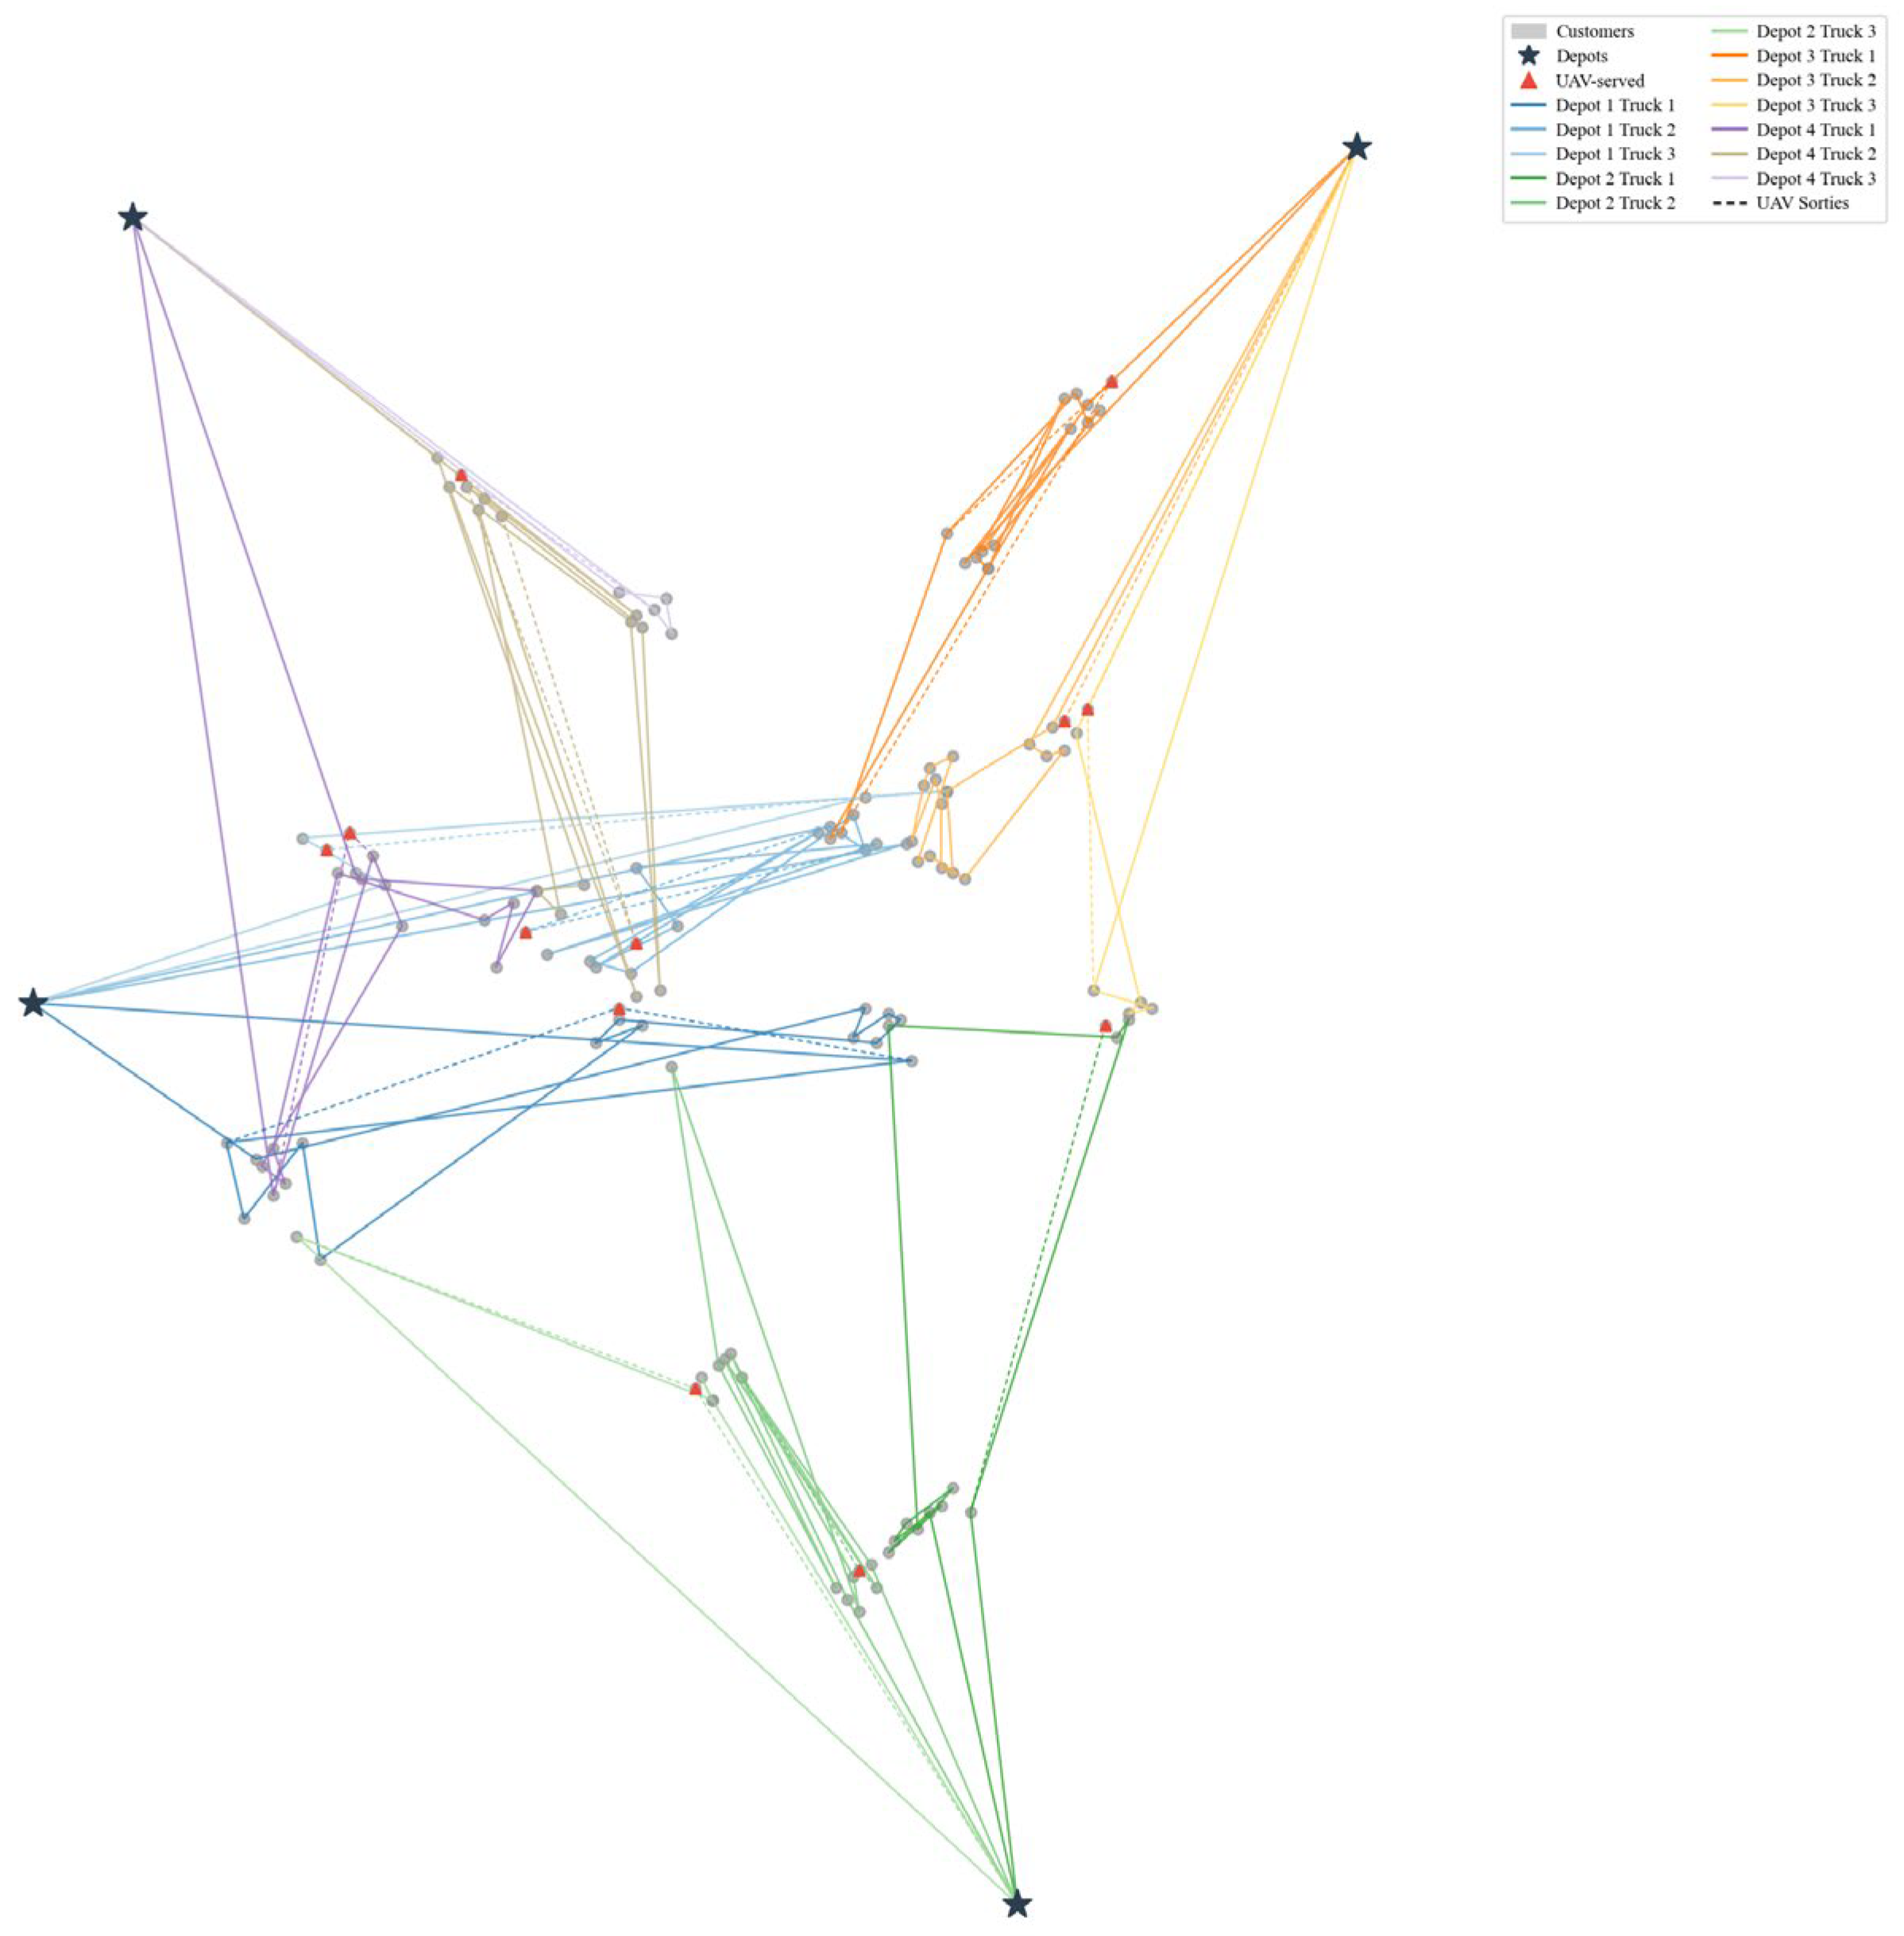
To address the practical concern regarding multi-depot coordination in large-scale disaster scenarios, we extend our experimental framework to incorporate three relief warehouses strategically located in adjacent cities around the flood-affected area. This extension validates the scalability and practical applicability of our proposed approach under more realistic operational conditions.
Three warehouses were established in the cities He Zhou (111.78, 25.00), He Yuan (114.78, 25.58), and Gan Zhou (114.66, 23.49), each equipped with three ground vehicles and corresponding UAVs. The depot selection followed emergency management protocols, maintaining safe operational distances from flooded zones. Customer demands and road disruption patterns remained consistent with the baseline scenario, but assignments were dynamically allocated across multiple depots based on proximity and resource availability. Figure 9 presents the optimized routing solutions for the four-depot scenario.
Table 9 quantifies the performance comparison between single-depot and multi-depot configurations across key operational metrics. The maximum task completion time decreased by 51.7%, while the average time for Level-1 nodes was reduced by 56.1%. This demonstrates that strategic depot placement significantly accelerates emergency response, particularly for high-priority requirements.
The results validate the strategic importance of distributed logistics infrastructure in disaster management, supporting the shift from centralized to decentralized emergency response models.

5. Conclusions

Taking the emergency supply delivery associated with the 2024 flood disaster in the Beijiang River Basin of Guangdong Province as the research background, this study investigates the optimization of collaborative emergency distribution routes involving multiple vehicles and multiple UAVs in response to the inherent limitations of ground-based rescue distribution under road disruption scenarios. Through a systematic framework covering problem modeling, algorithm design, empirical analysis, and strategy optimization, the study ultimately verifies the feasibility and superiority of the vehicle–UAV collaborative mode in flood rescue, while also providing quantitative evidence and practical recommendations for emergency logistics scheduling decisions.
This study should also be interpreted within its modeling scope. The proposed framework is intended for tactical collaborative planning after emergency information has been updated within a short decision window, rather than for fully dynamic dispatch in continuously evolving disaster environments. Accordingly, demand, road conditions, and nominal travel parameters are treated as given in the present model. In addition, operational factors such as no-fly zones, weather disturbances, communication interruptions, and UAV failures are not explicitly optimized in the core formulation. These simplifications allow the study to focus on the coupled effects of road disruptions, vehicle-UAV synchronization, and priority-sensitive rescue routing, while preserving computational tractability. Future research may extend the present framework toward rolling-horizon, stochastic, or robust optimization so as to better capture uncertainty and richer operational constraints in real disaster-response environments.

Author Contributions

Conceptualization, X.D.; Methodology, X.D.; Validation, R.L.; Formal analysis, X.D.; Investigation, X.D.; Data curation, X.D.; Writing—original draft, X.D. and R.L.; Writing—review & editing, X.D., B.G. and R.L.; Supervision, X.D. and B.G.; Funding acquisition, B.G. All authors have read and agreed to the published version of the manuscript.

Funding

This research received no external funding.

Data Availability Statement

The data presented in this study are available on request from the corresponding author, the data are not publicly available due to privacy restrictions.

Conflicts of Interest

The authors declare no conflict of interest.

References

  1. Murray, C.C.; Chu, A.G. The flying sidekick traveling salesman problem: Optimization of UAV-assisted parcel delivery. Transp. Res. Part C Emerg. Technol. 2015, 54, 86–109. [Google Scholar] [CrossRef]
  2. Agatz, N.; Bouman, P.; Schmidt, M. Optimization approaches for the traveling salesman problem with UAV. Transp. Sci. 2018, 52, 965–981. [Google Scholar] [CrossRef]
  3. Bouman, P.; Agatz, N.; Schmidt, M. Dynamic programming approaches for the traveling salesman problem with UAV. Networks 2018, 72, 528–542. [Google Scholar] [CrossRef]
  4. Ham, A.M. Integrated scheduling of m-vehicle, m-UAV, and m-depot constrained by time-window, drop-pickup, and m-visit using constraint programming. Transp. Res. Part C Emerg. Technol. 2018, 91, 1–14. [Google Scholar] [CrossRef]
  5. Poikonen, S.; Golden, B.; Wasil, E. The multi-visit UAV routing problem. Comput. Oper. Res. 2020, 113, 104802. [Google Scholar] [CrossRef]
  6. Dorling, K.; Heinrichs, J.; Messier, G.G.; Magierowski, S. Vehicle routing problems for UAV delivery. In IEEE Transactions on Systems, Man, and Cybernetics: Systems Publication Information; IEEE: Piscataway, NJ, USA, 2017. [Google Scholar]
  7. Carlsson, J.G.; Song, S. Coordinated Logistics with a Truck and a Drone. Manag. Sci. 2018, 64, 4052–4069. [Google Scholar] [CrossRef]
  8. Ha, Q.M.; Deville, Y.; Pham, Q.D.; Hà, M.H. On the min-cost traveling salesman problem with UAV. Transp. Res. Part C Emerg. Technol. 2018, 86, 597–621. [Google Scholar] [CrossRef]
  9. Brito Junior, I.; Leiras, A.; Yoshizaki, H.T.Y. Humanitarian Logistics Prioritization Models: A Systematic Literature Review. Logistics 2024, 8, 60. [Google Scholar] [CrossRef]
  10. Pregnolato, M.; Ford, A.; Wilkinson, S.M.; Dawson, R.J. The impact of flooding on road transport: A depth-disruption function. Transp. Res. Part D Transp. Environ. 2017, 55, 67–81. [Google Scholar] [CrossRef]
  11. Chowdhury, S.; Emelogu, A.; Marufuzzaman, M.; Nurre, S.G.; Bian, L. UAVs for disaster response and relief operations: A continuous approximation model. Int. J. Prod. Econ. 2017, 188, 167–184. [Google Scholar] [CrossRef]
  12. van Steenbergen, R.; Mes, M.; van Heeswijk, W. Reinforcement learning for humanitarian relief distribution with vehicles and UAVs under travel time uncertainty. Transp. Res. Part C Emerg. Technol. 2023, 157, 104401. [Google Scholar] [CrossRef]
  13. Haghani, A.; Oh, S.-C. Formulation and solution of a multi-commodity, multi-modal network flow model for disaster relief operations. Transp. Res. Part A Policy Pract. 1996, 30, 231–250. [Google Scholar] [CrossRef]
  14. Barbarosoğlu, G.; Arda, Y. A two-stage stochastic programming framework for transportation planning in disaster response. J. Oper. Res. Soc. 2004, 55, 43–53. [Google Scholar] [CrossRef]
  15. Afshar, A.; Haghani, A. Modeling integrated supply chain logistics in real-time large-scale disaster relief operations. Socio-Econ. Plan. Sci. 2012, 46, 327–338. [Google Scholar] [CrossRef]
  16. Huang, K.; Jiang, Y.; Yuan, Y.; Zhao, L. Modeling multiple humanitarian objectives in emergency response to large-scale disasters. Transp. Res. Part E Logist. Transp. Rev. 2015, 75, 1–17. [Google Scholar] [CrossRef]
  17. Pisinger, D.; Ropke, S. A general heuristic for vehicle routing problems. Comput. Oper. Res. 2007, 34, 2403–2435. [Google Scholar] [CrossRef]
  18. Jeong, H.Y.; Song, B.D.; Lee, S. Truck-drone hybrid delivery routing: Payload-energy dependency and No-Fly zones. Int. J. Prod. Econ. 2019, 214, 220–233. [Google Scholar] [CrossRef]
  19. Yang, Y.; Li, J.; Hu, H. A Literature Review of Vehicle and Drone Delivery Routing Problems in Different Synchronization Level Scenarios. Drones 2026, 10, 206. [Google Scholar] [CrossRef]
  20. Kunovjanek, M.; Wankmüller, C. Humanitarian Drones: A Review and Research Agenda. Bus. Horiz. 2021, 64, 359–373. [Google Scholar]
  21. Ropke, S.; Pisinger, D. An adaptive large neighborhood search heuristic for the pickup and delivery problem with time windows. Transp. Sci. 2006, 40, 455–472. [Google Scholar] [CrossRef]
  22. Rojas Viloria, D.; Solano-Charris, E.L.; Muñoz Villamizar, A.; Montoya-Torres, J.R. Unmanned aerial vehicles/UAVs in vehicle routing problems: A literature review. Int. Trans. Oper. Res. 2020, 28, 1626–1657. [Google Scholar] [CrossRef]
  23. Moshref-Javadi, M.; Winkenbach, M. Applications and research avenues for UAV-based models in logistics: A classification and review. Expert Syst. Appl. 2021, 177, 114854. [Google Scholar] [CrossRef]
  24. Chung, S.H.; Sah, B.; Lee, J. Optimization for UAV and UAV-vehicle combined operations: A review of the state of the art and future directions. Comput. Oper. Res. 2020, 123, 105004. [Google Scholar] [CrossRef]
  25. Zhu, L.; Gong, Y.; Xu, Y.; Gu, J. Emergency relief routing models for injured victims considering equity and priority. Ann. Oper. Res. 2019, 283, 1573–1606. [Google Scholar] [CrossRef]
  26. Anaya-Arenas, A.M.; Renaud, J.; Ruiz, A. Relief distribution networks: A systematic review. Ann. Oper. Res. 2014, 223, 53–79. [Google Scholar] [CrossRef]
  27. Zeng, F.; Chen, Z.; Clarke, J.-P.; Goldsman, D. Nested vehicle routing problem: Optimizing UAV-vehicle surveillance operations. Transp. Res. Part C Emerg. Technol. 2022, 139, 103645. [Google Scholar] [CrossRef]
  28. Wang, Y.; Wang, Z.; Hu, X.; Xue, G.; Guan, X. Truck–drone hybrid routing problem with time-dependent road travel time. Transp. Res. Part C Emerg. Technol. 2022, 144, 103901. [Google Scholar] [CrossRef]
Figure 1. Research approach.
Drones 10 00322 g001
Figure 2. (a) Multi-vehicle and multi-UAV collaborative delivery routing map; (b) vehicle 1 and UAV 1 collaborative delivery routing map; (c) vehicle 2 and UAV 2 collaborative delivery routing map; (d) vehicle 3 and UAV 3 collaborative delivery routing map.
Drones 10 00322 g002
Figure 3. Vehicle–UAV synchronization timeline.
Drones 10 00322 g003
Figure 4. (a) Description of waiting time per rendezvous event; (b) description of waiting time distribution.
Drones 10 00322 g004
Figure 5. (a) Spatial heatmap of completion times; (b) completion time distribution.
Drones 10 00322 g005
Figure 6. (a) ALNS convergence curve; (b) operator selection frequency.
Drones 10 00322 g006
Figure 7. (a) Description of sortie feasibility utilization; (b) description of energy utilization distribution vs. sortie size.
Drones 10 00322 g007
Figure 8. (a) Vehicle-only delivery routing map; (b) vehicle + single-stop UAV collaborative delivery routing map; (c) two-stage heuristic collaborative delivery routing map; (d) ALNS without embedded DP sortie refinement collaborative delivery routing map.
Drones 10 00322 g008
Figure 9. Multiple-vehicle and UAV collaboration with a four-depot delivery routing map.
Drones 10 00322 g009
Table 1. Literature comparison.
PaperVehicle/UAV ConfigurationL/R
Position
Sortie
Service
Energy
Consumption
Road
Conditions
Typical
Objectives
Typical
Solutions
This paperm-vehicle
m-UAVs
At the start and end of an arcmulti-
visit
Linear energy consumptionRoad disruptionsMakespan + weighted response timeMILP + arc-based pattern pre-generation
Murray, Chu.
FSTSP [1]
1-vehicle
1-UAV
node1-stopTime-limit constraintsMinimum makespan/scheduling synchronizationMILP
Agatz et al.
TSP-D [2]
1-vehicle
1-UAV
node1-stopDistance constraintsCost/timeIP + route-first, cluster-second heuristic
Bouman et al. TSP-D [3]1-vehicle
1-UAV
node1-stopDistance/timeCompletion time/costdynamic programming
Ham.
VRP-D with time windows [4]
m-vehicles
m-UAVs
m-depots
nodemulti-
visit
Time window
constraints
Minimum makespanConstraint programming
Poikonen et al. k-MVDRP [5]1-vehicle
m-UAVs
The vehicle serves as a mobile depotmulti-
visit
Specified energy-consumption functionCompletion time/efficiencyFlexible heuristics + sensitivity experiments
Dorling et al. m-VRP [6]m-UAVs
m-tasks
Depart from and return to the depotmultiple tasksConsiders payload and energy-consumption effectsCost/timeMIP + heuristics
Song et al.
“Horseflies” Collaboration [7]
1-vehicle
1-UAV
During vehicle movement/return to the vehiclemultiple-
trip service
Abstract analysis of cost/speed trade-offsWithout explicit road disruption constraintsTheoretical bounds on service efficiency improvementTheoretical analysis + simulation
Ha et al. Min-cost TSP-D [8]1-vehicle
1-UAV
node1-stopCost + waiting timeMinimum transportation cost + waiting penaltyMILP + GRASP/TSP-LS heuristics
Table 2. Demand statistics of affected locations.
TypeNumberTotal
Demand (kg)
Mean (kg)Standard Deviation (kg)Minimum (kg)Maximum (kg)
Hospital175715336.1880.45230520
Township11327,570243.98152.79200410
Street51153230.613.23220255
Total13534,438253.2137.86200520
Table 3. Model symbol description.
SymbolMeaning
N = {1, …, n}Set of affected locations
V = {0} ∪ N ∪ {n + 1}Set of all nodes (departure depot, affected locations, return depot)
K = {1, …, m}Set of vehicles (each vehicle carries one UAV)
AV ⊆ V × VSet of directed road arcs traversable by vehicles, with i j
B ⊆ AVSet of disrupted road arcs that vehicles are not allowed to traverse
L = {0} ∪ NSet of nodes where UAV launch, landing, and recovery are allowed
PilSet of feasible UAV sorties for each vehicle arc ( i , l ) A V , launched from i and rendezvousing at l
CP ⊆ NSet of affected locations served by UAV in pattern p P i l (with a fixed visiting sequence)
qjDemand of affected location j (kg)
QkCapacity of vehicle k (kg)
QUMaximum payload capacity of the UAV per sortie (kg)
dijVRoad distance (km)
v i j 0 Dry-road speed on road arc (i, j)
v i j V Actual effective speed on road arc (i, j)
tijVVehicle travel time (s)
drsUUAV flight distance (km)
vUUAV speed (m/s)
siVVehicle service time at node i (s)
sjUUAV service time at affected location j (s)
a, bParameters of the linear energy-consumption model
EmaxMaximum available battery energy of the UAV
EtoFixed take-off energy consumption of the UAV
EldFixed landing/recovery energy consumption of the UAV
phovHovering/service power of the UAV
W u p Remaining payload carried on flight segment u of sortie pattern p
η ∈ (0, 1]Effective battery-budget factor
hijFlood depth (mm) on road arc (i, j)
h ¯ Maximum safe passable flood depth for road vehicles
τpTotal flight and service time of pattern p
MA sufficiently large positive constant (Big-M)
wjPriority weight of affected location j
α ∈ [0, 1]Trade-off coefficient between makespan and weighted response time
xk,ij ∈ {0, 1}Equals 1 if vehicle k traverses arc ( i , j ) A V , and 0 otherwise
zk,jV ∈ {0, 1}Equals 1 if affected location j is directly served by vehicle k
uk,il,p ∈ {0, 1}Equals 1 if vehicle k executes pattern p P i l on arc ( i , l ) A V , and 0 otherwise
Ak,iArrival time of vehicle k at node i V
Dk,iDeparture time of vehicle k from node i V
Sk,iVisiting order of vehicle k at affected location i N
CjService completion time of affected location j N
TmaxThe time at which the last vehicle returns to the depot
Table 4. Functional classification of affected locations by rescue-priority level.
LevelTypeExamples
Level 1Life-saving nodesSuch as centralized shelters, hospitals, and densely populated trapped areas, which are highly sensitive to response time
Level 2Critical infrastructure support nodesSuch as water and power supply facilities, important transport hubs, or material transfer points
Level 3General material-support nodesSuch as ordinary communities and general supply points
Table 5. Interpretation of the priority-weight parameters.
ParameterInterpretationRole in the ModelSetting Principle
β 1 Weight of categorical priority levelEnsures that operationally critical nodes receive a higher base prioritySet as a managerial preference parameter reflecting the dominant importance of rescue-role classification
β 2 Weight of affected populationDifferentiates nodes according to the scale of exposed or affected populationSet to refine urgency within the same class rather than override the class-based priority
β 3 Weight of hazard severityReflects the additional urgency induced by local flood/rainfall severitySet to incorporate disaster-intensity information into the priority score
γ Dispersion
adjustment parameter
Moderates the spread of continuous indicators and reduces domination by extreme valuesSet as a scaling parameter to improve robustness and interpretability after normalization
Table 6. Comparison between Gurobi and the heuristic algorithm.
Problem SizeGurobi SolverHeuristic Algorithm
TmaxΣwjCjTime/sTmaxΣwjCjTime/s
5918.0626617.3190.501009.3686987.1140.20
101097.1378063.7612.001273.26710,962.9190.20
151296.35813,969.3618.001681.69314,983.9620.20
201888.76917,032.92760.002144.38118,003.2270.20
252231.98119,911.223780.002590.02520,697.7290.20
503269.20446,790.1821080.003303.77247,296.1830.64
754430.655×83,761.474×1800.003933.45879,326.6701.53
1005705.453×150,729.098×1800.005019.364110,378.0912.69
1256906.670×200,315.556×1800.005608.367160,213.3753.37
1358832.516×234,764.630×1800.006028.133193,225.7104.61
Table 7. Comparison of core performance indicators under different values of α.
αTmax
(min)
ΣwjCjDistance
(km)
Level-1
P90 (min)
Vehicle Waiting
(min)
UAV Waiting
(min)
UAV Payload RatioSortie
0.06035.127192,480.4769883.0905690.4450.223200.85589.371%34
0.26035.127192,480.4769883.0905690.4450.223200.85589.371%34
0.46035.127192,480.4769883.0905690.4450.223200.85589.371%34
0.66028.133193,225.7109707.9195661.3690.239206.61589.199%32
0.86085.513193,059.8499660.6135762.5910.229192.46589.307%33
1.08604.275284,711.5428404.2358217.7030.000184.42689.084%4
Note: Under this instance, the standard deviations of the 10 repeated runs for each α are close to zero, indicating that under the current instance scale and parameter setting, the algorithm converges to highly consistent solutions.
Table 8. Comparison of key indicators in comparative experiments.
MethodTmax
(min)
ΣwjCjVehicle Travel Time (min)UAV SortiesUAV
Utilization
Avg Time for Level-1 Nodes (min) Objective Value Gap to Proposed
Proposed Model6028.133193,225.71017,026.3213289.199%1969.077-
Vehicle-Only9879.067281,480.67328,647.079--5793.18985.378%
Single-Stop UAV8790.174265,199.49625,438.207630.024%4621.49337.508%
Two-Stage Heuristic6635.915241,424.94918,262.4352383.033%3304.56524.494%
Without DP Sortie6514.206229,241.53717,810.6202584.316%2975.23018.319%
Table 9. Comparison of key indicators in supplementary experiments.
MethodTmax
(min)
ΣwjCjVehicle Travel Time (min)UAV SortiesUAV
Utilization
Avg Time for Level-1 Nodes (min)
Proposed Model6028.133193,225.71017,026.3213289.199%1969.077
Four depots2910.91369,757.07819,365.6724178.464%863.796
Disclaimer/Publisher’s Note: The statements, opinions and data contained in all publications are solely those of the individual author(s) and contributor(s) and not of MDPI and/or the editor(s). MDPI and/or the editor(s) disclaim responsibility for any injury to people or property resulting from any ideas, methods, instructions or products referred to in the content.