Article

Field-Validated Drone-Based Precision Control of the Invasive Apple Snail (Pomacea canaliculata) in Rice Paddy Fields: Chemical Reduction and Yield Preservation

Division of Crop Rotation Research for Lowland Farming, Kyushu-Okinawa Agricultural Research Center, National Agriculture and Food Research Organization, 496 Izumi, Chikugo 833-0041, Fukuoka, Japan
*
Author to whom correspondence should be addressed.
Drones 2026, 10(3), 176; https://doi.org/10.3390/drones10030176
Submission received: 29 January 2026 / Revised: 1 March 2026 / Accepted: 2 March 2026 / Published: 5 March 2026

Highlights

What are the main findings?
  • UAV-based microtopography identified deep-water aggregation zones favorable to apple snails.
  • Site-specific drone applications reduced chemical use by 44.1–63.0% without yield loss.
What are the implications of the main findings?
  • An automated workflow—from aerial imagery to prescription maps—facilitates scalable precision pest control.
  • Automated drone-enabled precision management reduces environmental burden and supports a sustainable agro-ecosystem allowing coexistence with apple snails.

Abstract

Apple snail infestation poses a persistent threat to rice production in open-field environments, where long-term coexistence with this species is unavoidable. This study presents a drone-based precision control approach that integrates high-resolution micro-topographic mapping with site-specific pesticide application. A lightweight mapping unmanned aerial vehicle was deployed to produce centimeter-level microtopographic data across paddy fields, facilitating the identification of deep-water areas preferred by apple snails. From these elevation-derived water risk patterns, prescription maps were generated to guide downstream management decisions, and agricultural drones equipped for granular application subsequently performed targeted pesticide delivery only in these high-risk areas. Over 2 years of field experiments, the proposed method achieved rice yields comparable to those under conventional management while reducing pesticide use by 44.1–63.0%, with lower estimated crop damage in regions with high apple snail occurrence. Designed with robustness and scalability in mind, the system demonstrated considerable potential for practical implementation in general farming households and broader applications in precision pest management.

1. Introduction

Rice (Oryza sativa L.) is one of the most important staple crops worldwide, serving as a primary food source for more than half of the global population [1]. Ensuring stable and sustainable increases in rice yield is therefore critical for meeting the growing global demand for food and maintaining food security. Sustaining and enhancing rice production depend on the development of high-yielding cultivars, the adoption of large-scale and advanced management practices, and the maintenance of a sustainable agro-ecological growing environment. Among environmental factors, the availability of fresh and safe water is particularly crucial, as rice production relies heavily on irrigation and ranks among the most water-intensive agricultural systems [2]. Contamination of irrigation water or the occurrence of damaging pests without timely intervention can directly result in declines in rice yield or grain quality. Invasive apple snails (Pomacea canaliculata) represent one such pest, causing annual recurring feeding damage to young rice seedlings in many rice-growing regions [3].
Invasive apple snails continue to damage rice crops each year, and in Japan, more than 2 decades of region-specific control efforts have yielded limited success. As global warming progresses, the geographical range of this species continues to expand, both within Japan [4] and worldwide [5,6]. Owing to their pronounced ecological adaptability and high reproductive capacity, no effective method has been identified yet to eradicate apple snails from the diverse natural and agricultural aquatic environments they inhabit. Although apple snails are considered pests because they feed on tender crop tissues, they also serve as prey for fish and birds [7,8] and can even contribute positively to agricultural production; for example, they are sometimes used to graze young weeds in organic rice paddies [9]. Consequently, agricultural systems in regions where apple snails are present must be prepared for long-term coexistence with this species. Minimizing damage to young, vulnerable seedlings while controlling management costs remains a persistent challenge.
In large-scale rice production, multiple control strategies—such as mechanical control through tillage [10,11], molluscicide application [12], attractant-based trapping [13], shallow-flood irrigation management [14], and crop rotation [15]—have shown partial effectiveness. Severe damage is highly likely to occur when specific predisposing factors are present: substantial numbers of adult snails with shell heights of 3–4 cm or greater, the absence of food more palatable than rice seedlings before the V5 growth stage, water temperatures exceeding 17 °C, and the presence of deep-water zones. Sin [16] reported that transplanted 21-day-old seedlings suffered 100% damage at a water depth of ≥5.0 cm. Under experimental conditions described in another study [17], rice seedlings at the V3.5–4 growth stage suffered approximately 90% feeding damage within six days at water depths exceeding 8 cm. Adult apple snails require sufficient water depth to partially or fully suspend their bodies, which facilitates grasping and ingestion of rice seedlings [18]. Therefore, damage increases significantly when water depth exceeds the shell height of adult snails (approximately 4 cm), as buoyancy enhances feeding success.
When these predisposing factors can be clearly anticipated and conventional control methods are insufficient to mitigate the damage, advanced approaches—such as unmanned aerial vehicle (UAV)-assisted and AI-driven detection and eradication [19,20]—have already received increasing attention and demonstrated some success. These approaches for detecting apple snail eggs have made certain progress; however, the locations where eggs are found do not represent the actual habitats of the snails. Moreover, because of water surface reflection and floating debris, it remains extremely difficult to detect or distinguish snail bodies in the water or on the mud surface, even with low-altitude UAV flights or UAV-borne high-magnification optical cameras. Furthermore, despite the ability to identify snail bodies in some cases, apart from labor-intensive and time-consuming manual chemical applications, no prompt, efficient, or on-demand eradication devices or technologies are currently available for field-level prevention strategies.
However, we can take advantage of the snails’ characteristic tendency to inhabit areas with water depths of 4 cm or deeper, where they significantly damage young rice, by obtaining water depth data in the field and performing targeted control. To this end, two key technologies are required: (1) generating a water-depth distribution map for the entire paddy field, and (2) producing a prescription map based on that distribution and then applying variable-rate or site-specific treatments using an agricultural drone. For the first requirement, water-level sensors installed at fixed points can measure the water depth only at their respective locations, providing point-based rather than spatially continuous surface data [21]. A UAV-borne bathymetric LiDAR sensor can, in principle, obtain water depth data when the water is relatively clear [22,23]; however, during the optimal apple snail control period—shortly before and after rice transplanting—the water is typically turbid, contains floating debris, and is typically within a shallow depth range of 0–30 cm, which likely reduces the reliability of the acquired data. Therefore, we focused on measuring the ground elevation when the paddy field was in a bare soil state, either before transplanting or after puddling with no standing water. This enabled us to derive an estimated water depth distribution map using UAV-based photogrammetry or LiDAR surveys, as well as total station and ground-based LiDAR scanning techniques [24,25].
For the second requirement, prescription maps need to be generated from the water depth distribution map, similar to preceding studies that produced prescription maps based on the distribution of indices, such as the normalized difference vegetation index [26,27]. The challenge is to ensure that the generated prescription maps can be recognized by commercially available drones or unmanned helicopters and to successfully achieve site-specific or variable-rate applications. In practice, this poses several challenges. Several agricultural drones on the market are capable of variable-rate application (VRA) based on prescription maps, including the Nileworks Nile-JZ Plus (Tokyo, Japan; discontinued in 2024), DJI Agras T10 (Shenzhen, China) and its subsequent models, XAG P and V series released after 2022 (Guangzhou, China), NTT e-Drone AC102 (Saitama, Japan), and unmanned helicopters such as the Yamaha Fazer R (Shizuoka, Japan) and Yanmar YF390AX (Osaka, Japan). Each model uses its own proprietary prescription map data format. Therefore, an interface capable of automatically converting multiple prescription map data formats is required.
Unlike our previous proof-of-concept study [28], the present study emphasizes long-term field-scale validation and system-level optimization under practical farming conditions. The system was extended to support multiple prescription map data formats and improve compatibility with commercially available agricultural drone models. Several technical advances have been introduced, including spatial autocorrelation-based analysis for target field screening and substantial improvements in automated orthomosaic generation and prescription map workflows. From a usability perspective, a cloud-based web interface was developed to facilitate operation by non-expert users. Based on 2 consecutive years of field experiments, variable rates and site-specific drone-based control strategies were compared with conventional and uniform applications in terms of rice yield, crop damage rate, and pesticide usage.
The objectives of this study were (i) to develop and validate a drone-based, field-scale precision control framework for invasive apple snails under practical rice farming conditions; (ii) to improve the robustness of ground elevation characterization through spatial autocorrelation-based filtering and zone-level aggregation; (iii) to enhance the automation, interoperability, and usability of prescription map generation via a cloud-based workflow compatible with multiple agricultural drone models; and (iv) to quantitatively evaluate the agronomic and operational performance of variable-rate and site-specific agricultural drone applications over 2 consecutive growing years.

2. Materials and Methods

2.1. Study Sites

Our experimental fields were located on the Saga Plain of Kyushu, southern Japan, a region where apple snails occur frequently every year. In this area, the number of days with temperatures below freezing in winter is limited, allowing some apple snails inhabiting paddy fields, rivers, and irrigation canals to overwinter [4,29]. The local climate is suitable for a double-cropping system; after winter wheat or barley is harvested in May, most farmlands begin flooding for rice transplanting in mid- to late June. A small portion of the fields uses direct dry seeding for rice, and some are allocated for soybean production. Dry-seeded rice fields are not flooded until the seedlings surpass the V5 growth stage; therefore, the risk of damage by apple snails is minimal. Soybean fields remain unflooded throughout the season, thus providing no suitable habitat for apple snails. Only transplanted rice fields face a high risk of damage, especially after heavy rainfall during the rainy season, which causes water levels to rise and exposes the tender seedlings to apple snails.
During rice transplantation, the molluscicide Sukuminon (containing 10.0% metaldehyde) is typically dispensed to control apple snails. However, its effect lasts for only approximately 1 week; once the efficacy diminishes, heavy rainfall and rising water levels can trigger large-scale apple snail migration. Therefore, the most effective control window is generally 7–20 days after transplanting, depending on seedling size and duration of deep-water flooding.
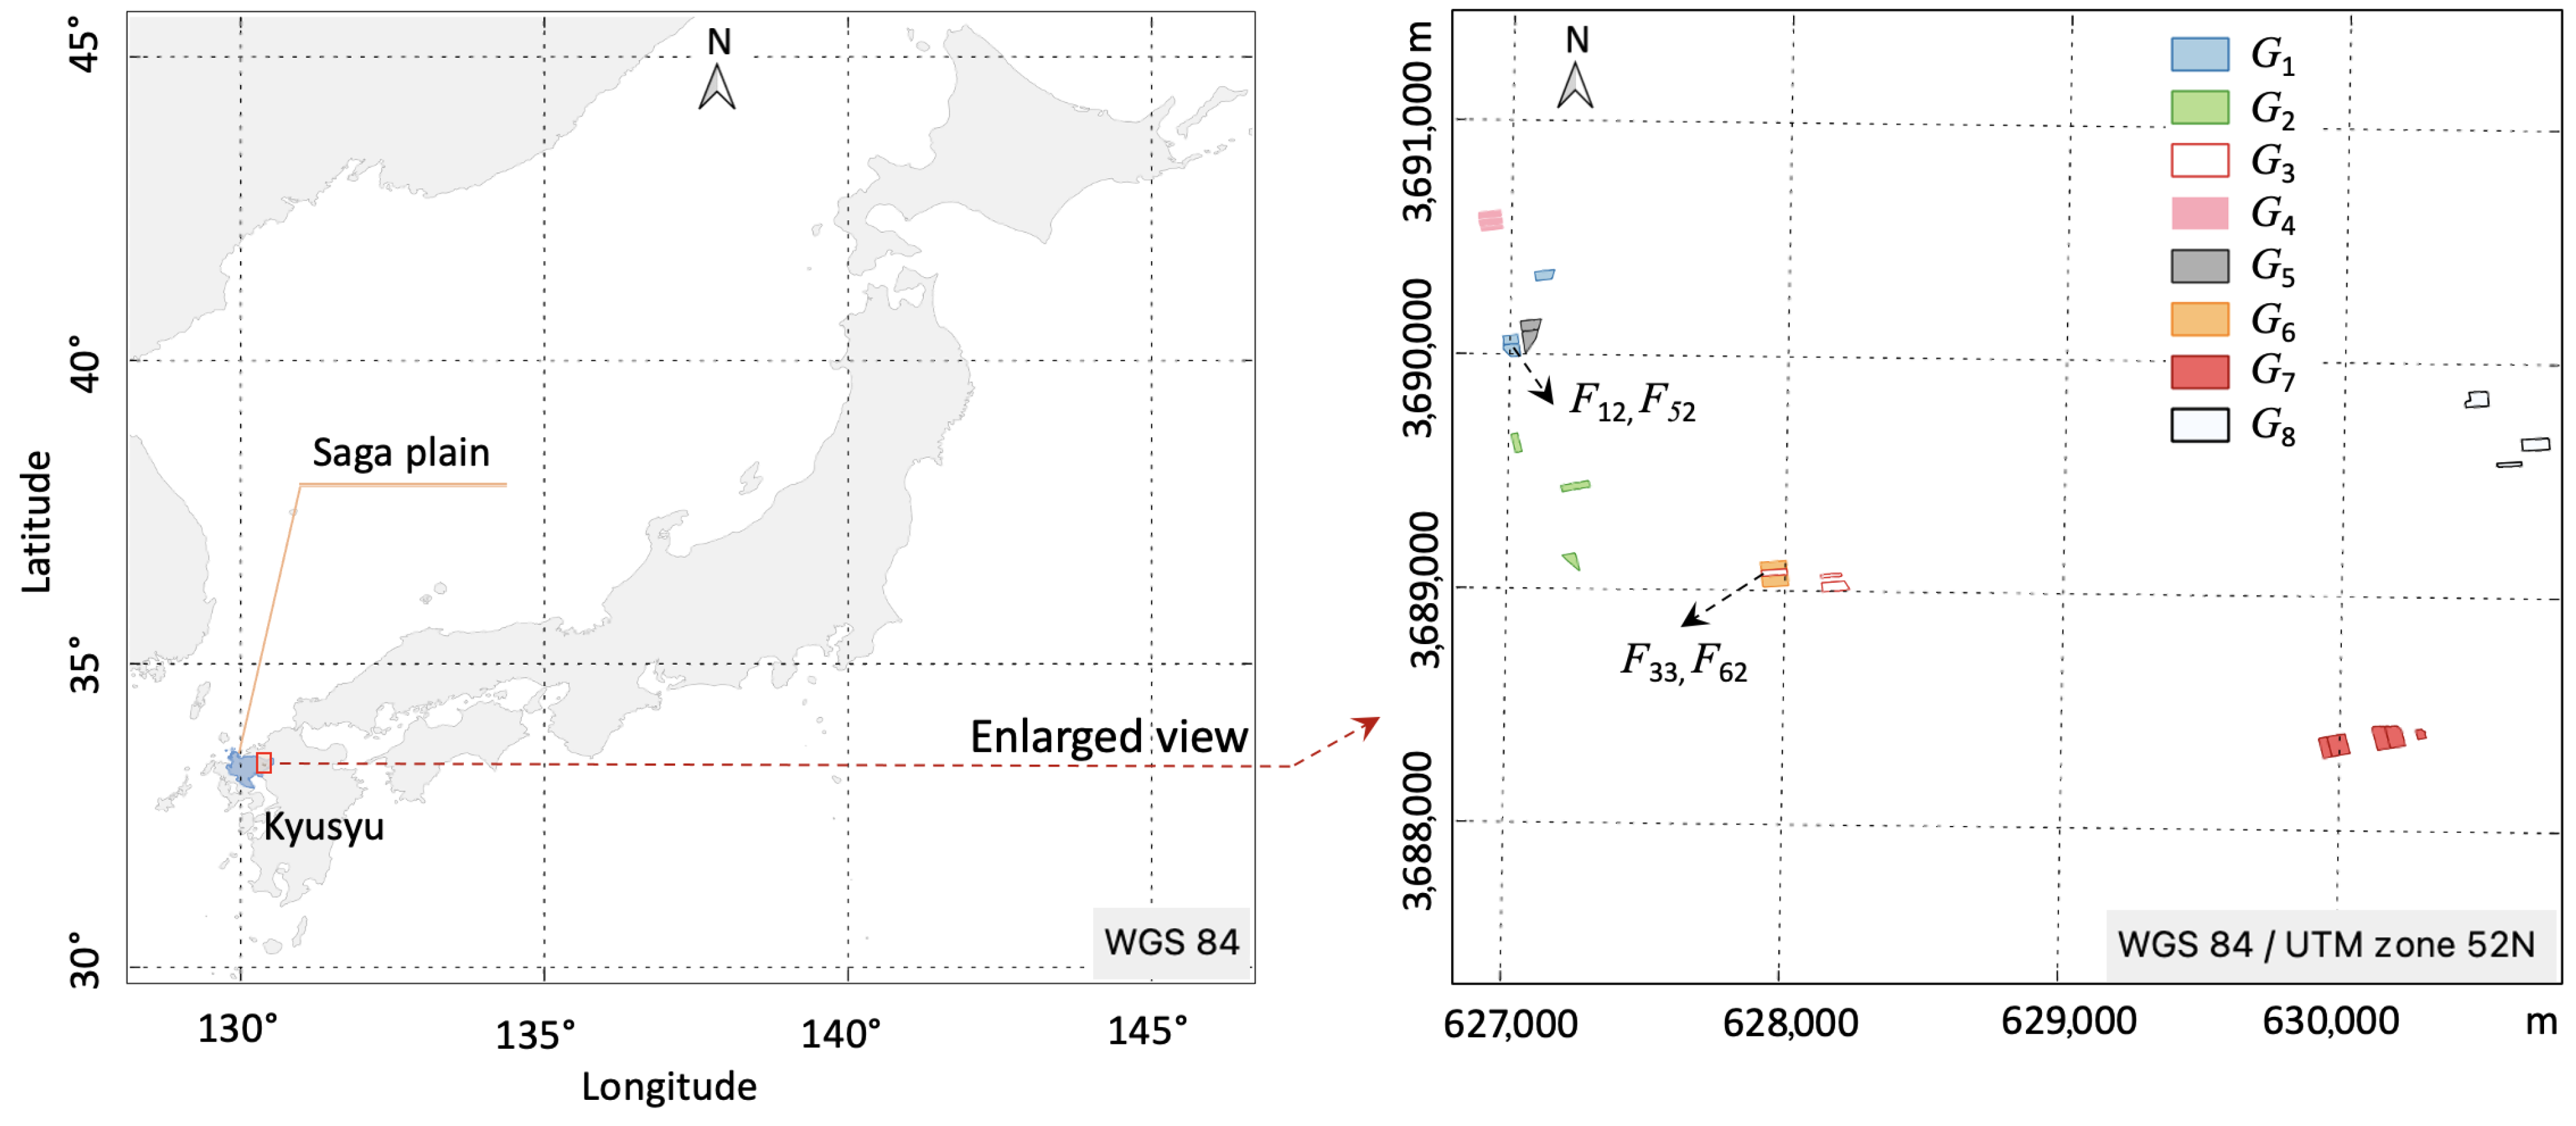
Because deep-water flooding areas in paddy fields correspond to zones with lower ground elevation, we applied the following rules to select experimental fields: (1) analyze the ground elevation data for each field to determine the distribution and size of the low-lying areas; (2) form one group consisting of three experimental fields, where each field contains a large and contiguous deep-water area when the field is flooded. These three fields are geographically adjacent or very close and share similar environmental conditions; (3) a total of three such groups were formed. Each group was separated by several hundred meters to several kilometers to ensure geographical independence. Figure 1 shows the geographical locations of the study sites and the spatial distribution of the experimental fields for each treatment group.
In 2024, nine experimental fields were planted with a single rice variety, Hiyokumochi. In 2025, 17 fields were selected: nine planted with Hiyokumochi and eight with Hinohikari. For Hinohikari, because only five fields were geographically close, one field, rather than the planned two fields, was used for conventional treatment. The specific locations and related information are presented in Table 1. Field F 12 in Group G 1 (2024) and field F 52 in Group G 5 (2025) represent the same experimental field, as do field F 33 in Group G 3 (2024) and field F 62 in Group G 6 (2025). The locations of these two reused fields are also indicated in the enlarged view on the right side of Figure 1.
All experimental fields were transplanted with rice using a rice transplanter after plowing and puddling, and the molluscicide was automatically dispensed from the transplanter’s hopper during transplanting. Within 7–10 days after transplanting, two fields in each group were selected for variable-rate or site-specific application and uniform application, respectively, whereas the remaining field was assigned to conventional cultivation, meaning that no additional molluscicide was applied. The molluscicide used for drone application was Sukumin Bait 3, a light-green granular formulation containing 3.0% iron(II) phosphate hydrate of natural origin. This compound is environment-friendly, suitable for drone-based applications, and can be used without restrictions regarding the number of applications.

2.2. Research Methodology

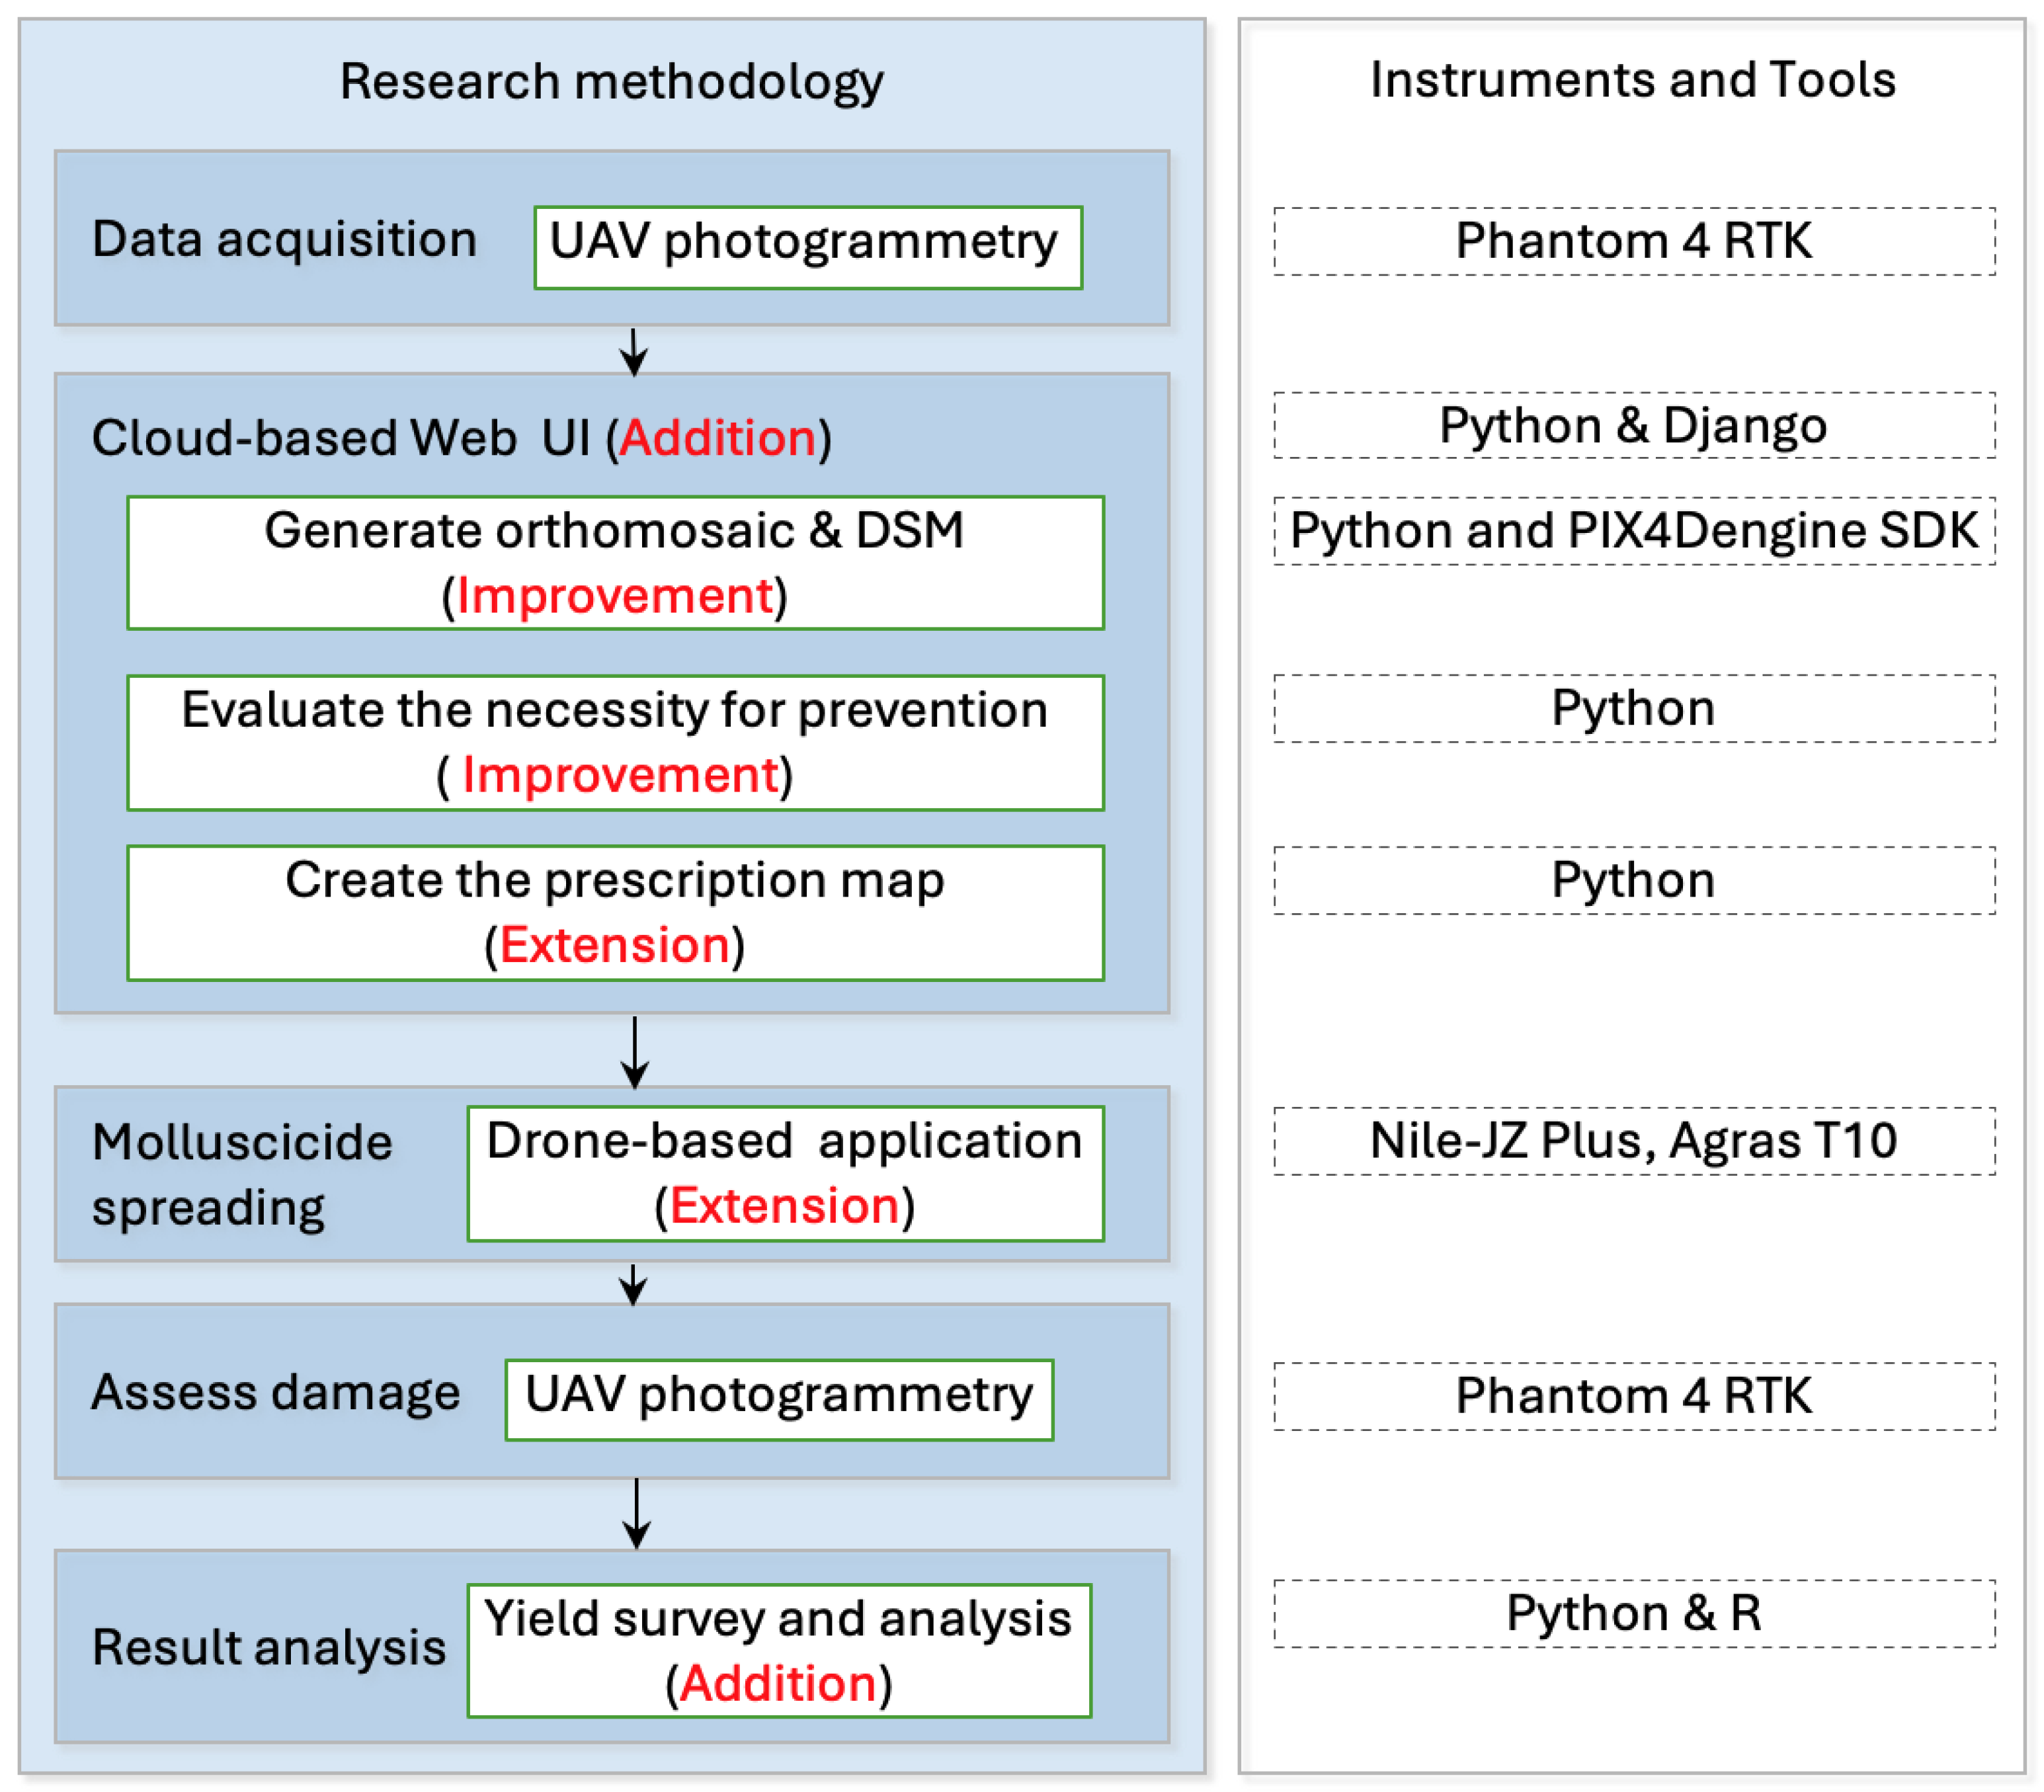
The methodology has been partially described in our previous studies [28,30]. In brief, UAV photogrammetry was used to generate a digital surface model (DSM) and ground elevation distribution maps of the target fields. Based on the estimated water depth distribution, a prescription map was created, and the entire process was automated. Using this as a starting point, we introduced several additions, improvements, and extensions to the workflow, as illustrated in Figure 2.
In the workflow, high-resolution aerial imagery was acquired in mid-June using DJI Phantom 4 real-time kinematics (RTK; DJI, China) after plowing and before puddling, to generate a DSM and derive elevation distribution maps of the experimental fields. The flight parameters were consistent: an altitude of 100 m above ground level (AGL), a flight speed of 8.4 m/s, 75% overlap in both forward and side directions, a 3-s interval capture mode, and RTK maintained in the FIX state. The wind speed during each flight was <3 m/s. Automated aerial photography conducted at 100 m AGL resulted in a ground sampling distance (GSD) of 2.7 cm per pixel for both the orthomosaic imagery and the DSM.
The acquired aerial images were then uploaded to the Amazon AWS cloud-based web interface, which triggered automatic generation of the orthomosaic and DSM. The system was improved by enabling automatic parameter adjustments to achieve high-quality orthomosaics when the initial output quality was poor. Next, each target field within the orthomosaic was segmented, and elevation data distributions were derived for each field, including intermediate analytical results such as histograms, standard deviation, Moran’s I statistic [31], Local Getis–Ord Gi* [32], and the ratio of areas requiring treatment. When generating the prescription map, the procedure creates both a GeoTIFF raster file and vector files in SHP, GeoJSON, ISOXML (defined in ISO 11783-10 [33]), or KML formats, all based on a 1 × 1 m grid. It can also merge adjacent grids that require treatment into larger contiguous zones, which are used to define the flight boundaries for agricultural drone operations.
The cloud-based web interface was designed for general users, such as farmers or agricultural company staff, without requiring expertise in UAV-based remote sensing. Users simply select the folder containing the aerial images to upload, specify the field name, and choose other related options before clicking the upload button. Once processing is complete, a notification email is sent, and users can download the orthomosaic, DSM, contour reports, and prescription maps or related files in the specified formats.
In late August, approximately 1 week before the rice heading stage, a second UAV flight was conducted using the same flight parameters as those applied in mid-June, resulting in the same GSD of 2.7 cm per pixel. This flight was performed to generate RGB orthomosaic imagery, from which canopy coverage was estimated based on pixel-level red (R), green (G), and blue (B) values. The rice damage rate was assessed using the same formula and method described previously Guan et al. [28].
For molluscicide spreading, 12 experimental plots in groups G 1 , G 2 , G 3 , G 7 , and G 8 were treated using both site-specific and uniform applications, all performed using the Nile-JZ Plus model. For the VRA application in field F 41 and the site-specific applications in fields F 51 and F 61 , which were conducted using Agras T10, prescription maps and flight boundary files were generated using the developed extension program. After receiving these task data via an SD card or cloud transfer, both agricultural drones automatically executed the spreading operations under RTK FIX status. The internal load capacities of the Nile-JZ Plus and Agras T10 were 8 and 10 kg, respectively, for granule spreading. The spreading parameters were set to a flight altitude of 2 m and spreading width of 5 m, with a consistent flight speed calculated from the drone’s spreading parameters.
The quadrat harvest method was used for yield surveys. In each field, three sampling plots were selected at equal intervals along the diagonal, with 25 plants per plot (five rows × five hills). Missing plants were supplemented from adjacent areas to maintain 25 plants per sampling point. Brown rice was obtained after post-harvest steps, including drying, threshing, husking, winnowing, and sieving through a 1.8 mm screen. Based on the measured moisture content of the brown rice, the yields for 2024 and 2025 were adjusted to a 15% moisture basis.

2.3. Equations, Software, and Field Selection Decisions

In our research methodology, the equations listed in Table 2 were employed. Equations (1) and (2) were used for field selection decisions, whereas Equations (3) and (4) were applied to assess the rice damage rate.
In Equation (1), n denotes the total number of spatial units, x i and x j represent the observed elevation values at locations i and j, x ¯ is the global mean, and w i j is the spatial weight defined by the Queen contiguity matrix. In Equation (2), G i * is the standardized local Getis–Ord statistic, where S denotes the global standard deviation. In Equation (3), B, G, and R denote the spectral values of the blue, green, and red bands, respectively, while the empirical thresholds were set to θ 1 = 0.82 , θ 2 = 0.90 , and θ 3 = 60 . Finally, in Equation (4), r represents the rice damage rate, calculated as one minus the canopy rate.
The software, their usage, and version information are listed in the table below (Table 3).
After the aerial survey conducted in mid-June, a DSM corresponding to the flight coverage was automatically generated using our cloud-based web interface, and all paddy fields managed by the farmers were subsequently clipped from the DSM. Each field was then analyzed and screened according to the following procedures.
(1)
Each field was partitioned into a regular grid with a spatial resolution of 1 × 1 m, and the corresponding ground-elevation histogram was generated.
(2)
Global Moran’s I was calculated for each field, and fields with Moran’s I values greater than 0.7 were retained.
(3)
The local Getis–Ord Gi* statistic was computed for each field, and fields in which cold spots (Z-score 1.65 and p 0.1 ) accounted for more than 20% of the area were selected.
(4)
Based on the ground-elevation histogram, as well as the spatial separation and geographic distribution of the candidate fields, three fields were selected for site-specific treatment.
(5)
For each site-specific treatment field, two adjacent fields were selected as controls and assigned to uniform and conventional treatments, respectively.

3. Results

3.1. Prescription Map and Drone-Based Application

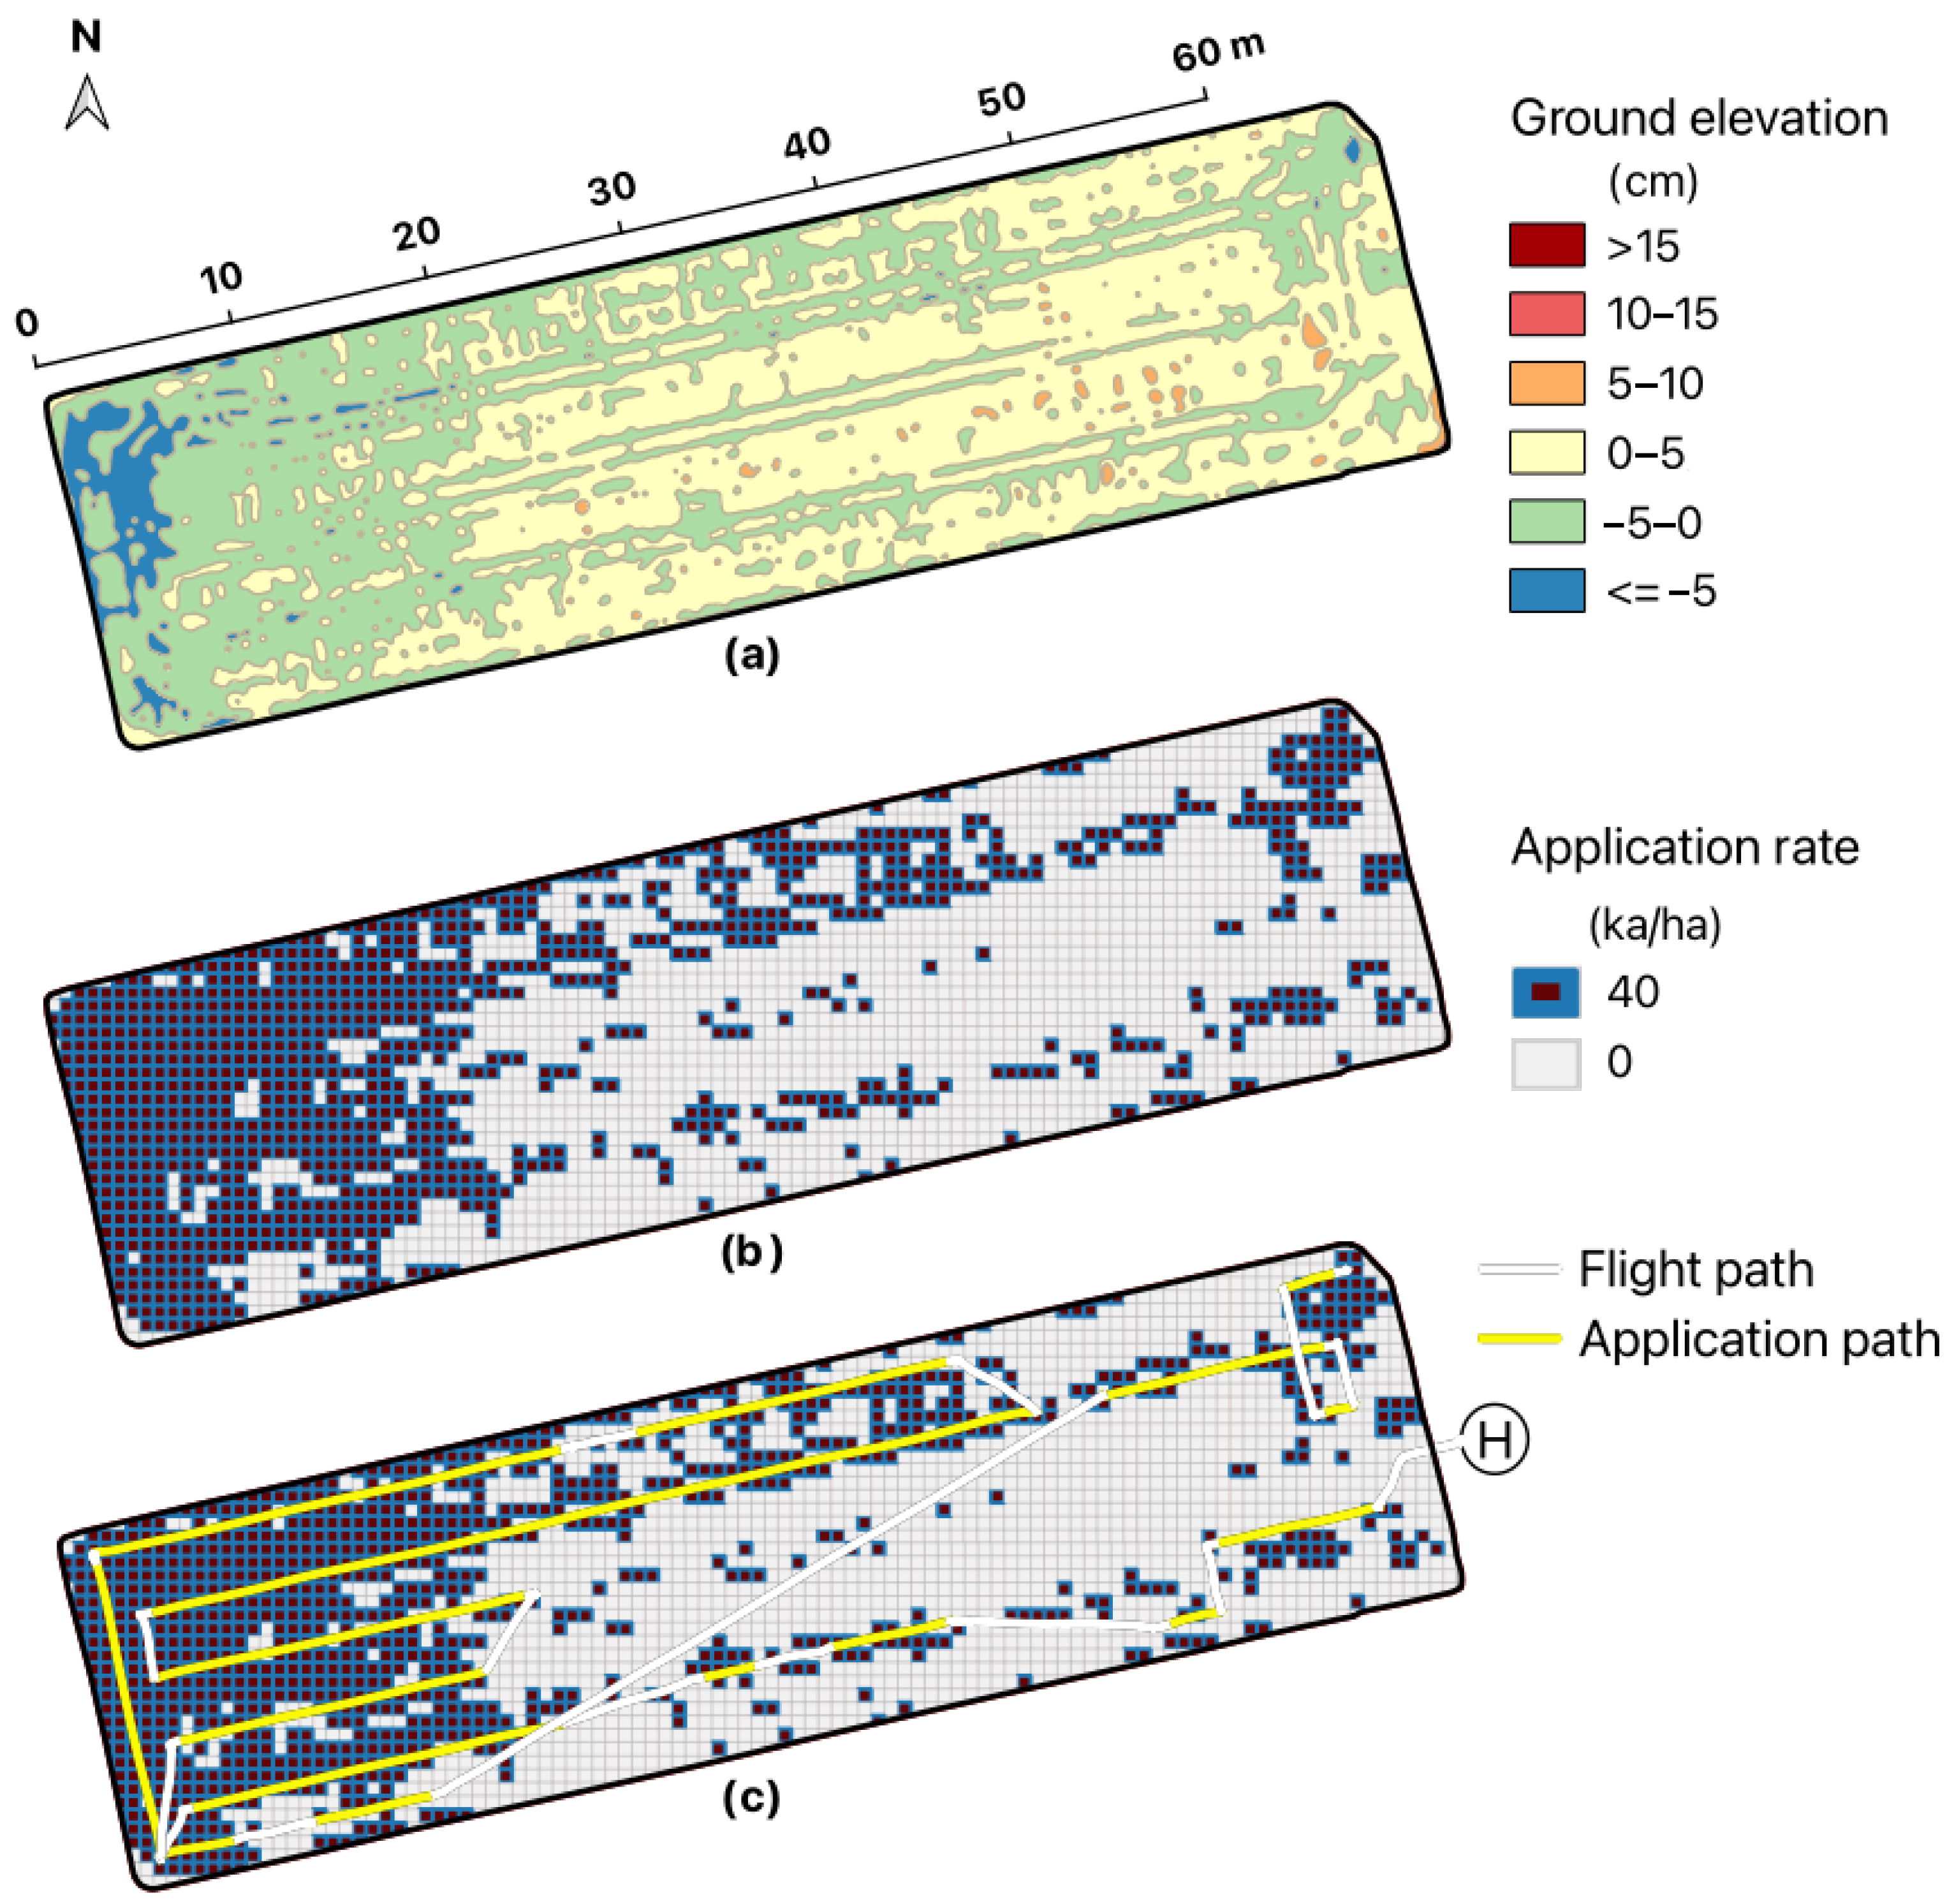
After obtaining RTK aerial images, the data are uploaded to our cloud-based Web UI, which automatically generates both the clipped ground-elevation distribution map and the corresponding prescription map for the specified field, for example, F 21 . The ground-elevation map is provided in two formats: (1) a GeoTIFF file containing the raw elevation data in centimeters, referenced to the mean elevation (0 cm) of the field; and (2) a 5 cm interval color-coded contour map, as shown in Figure 3a.
The conversion from centimeter-scale elevation data to the prescription map followed the procedure described in our previous study [28]. Specifically, the threshold was derived by taking the 95th percentile of the elevation distribution and subtracting 4 cm. Areas with elevation values lower than this threshold were classified as target application zones. These zones are divided into 1 × 1 m grids, and each grid cell is assigned an application rate of 40 kg/ha. Grid cells outside the application zones are assigned an application rate of 0 kg/ha (Figure 3b).
Figure 3c shows the actual path of the Nile-JZ Plus drone during both the transit and application segments. The drone optimized its routes to discharge only within the designated application areas while maintaining a constant rate at the prescribed value of 40 kg/ha. In addition to the field illustrated here ( F 21 ), the same drone model and identical spreading parameters and procedures were applied to fields F 11 , F 31 , F 71 , F 73 , and F 81 .
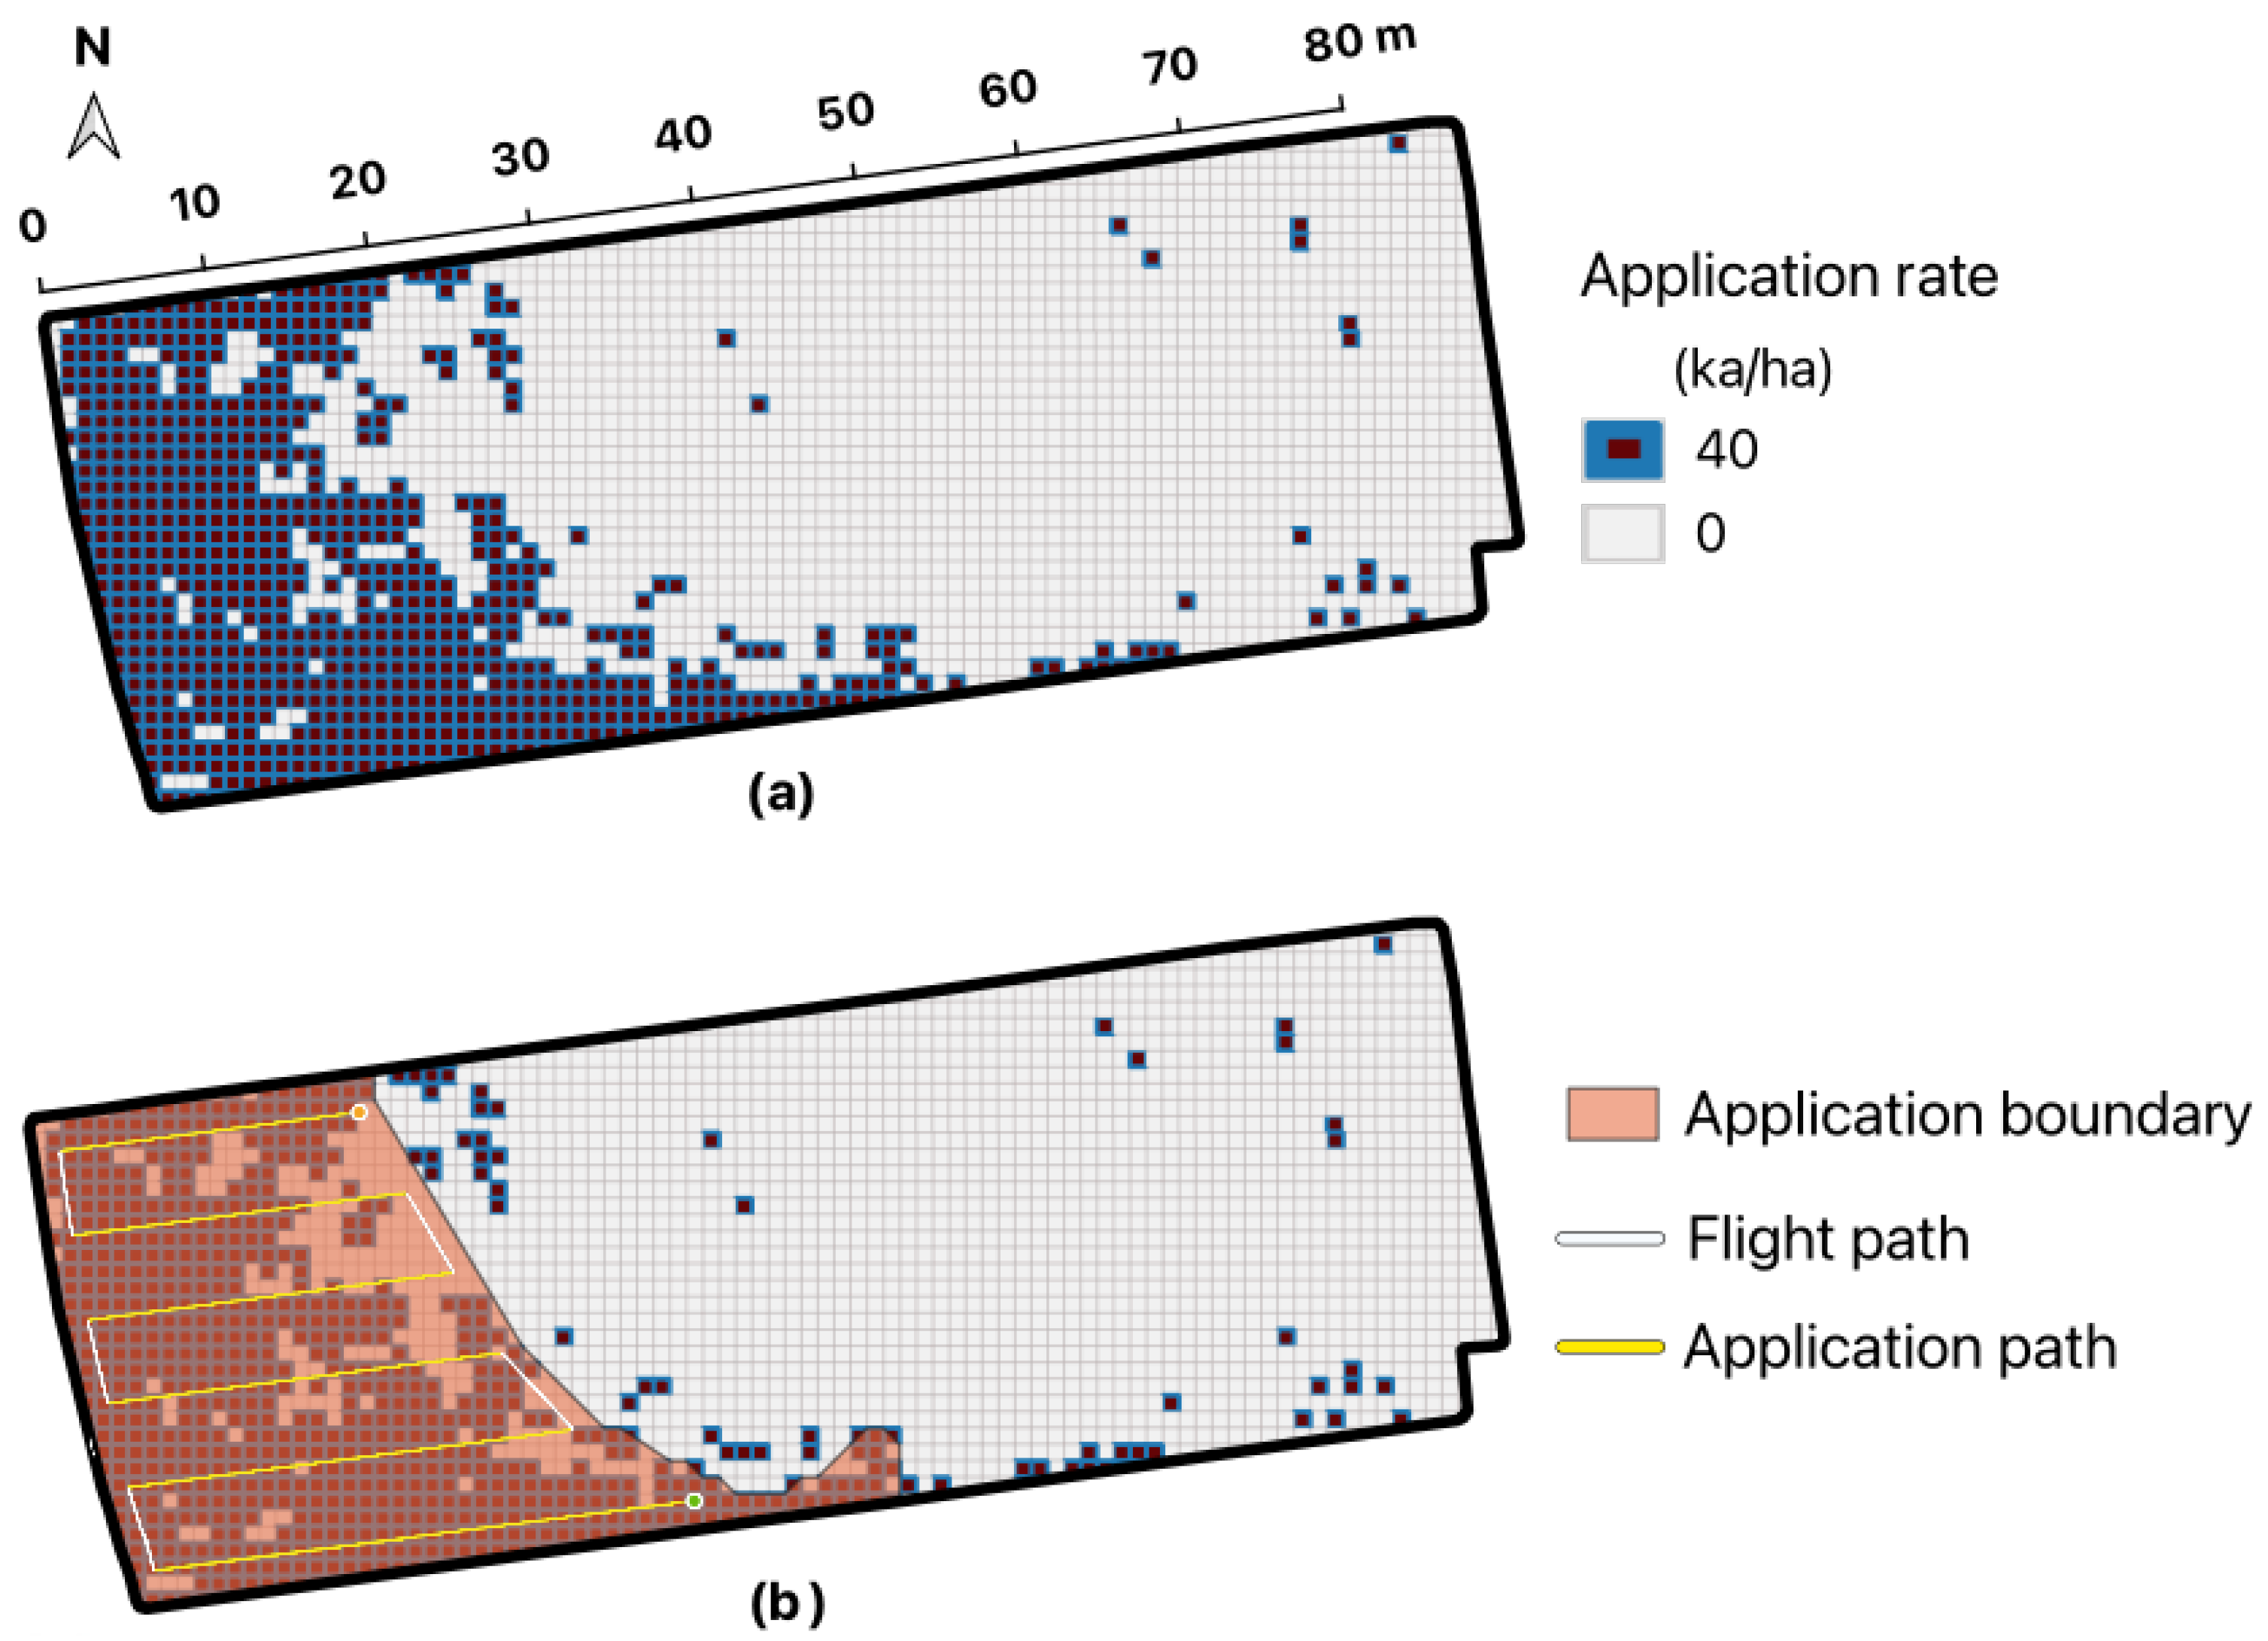
For using the Agras T10 drone, there are two methods for applying a prescription map. The first method is to convert the data contained in the 1 × 1 m grids of the specified field directly into a GeoTIFF raster file with a spatial resolution of 1 × 1 m. This raster file, together with the application-boundary definition file, is then transferred via an SD card to the Agras T10 remote controller. In the DJI Agras app, when importing the prescription map, the option “Resample with” is set to “Ave value.” Figure 4a shows the prescription map of another field, F 41 . During drone application, operations are performed only within the defined application boundary (Figure 4b), and the DJI Agras app automatically adjusts the hopper-gate opening to achieve variable-rate spreading based on the resampled prescription values. The second method uses only the application-boundary definition file to perform uniform spreading within that boundary, without importing the prescription map file. This method was applied to fields F 51 and F 61 .
Table 4 summarizes the actual application amounts converted to a per-hectare basis for the two drones, the ratios relative to the reference uniform application value of 40 kg/ha, and the resulting saving percentages. For the Nile-JZ Plus, an operational setting error occurred in field F 82 during uniform spreading, causing the actual application amount to reach 66.2 kg/ha. Although this value remained within the recommended dosage range for the molluscicide Sukumin Bait 3, it resulted in the overall mean exceeding the reference value. When using the Agras T10 for VRA within the site-specific boundary, the application amount became very small—4.6 kg/ha—likely because the option “Resample with” in the DJI Agras app was set to “Ave value” when importing the prescription map. Consequently, this value was excluded from the average calculation of the saving percentage. The mean saving percentage was 56.1%, ranging from 44.1% to 61.2%.

3.2. Evaluation of Damage Rates

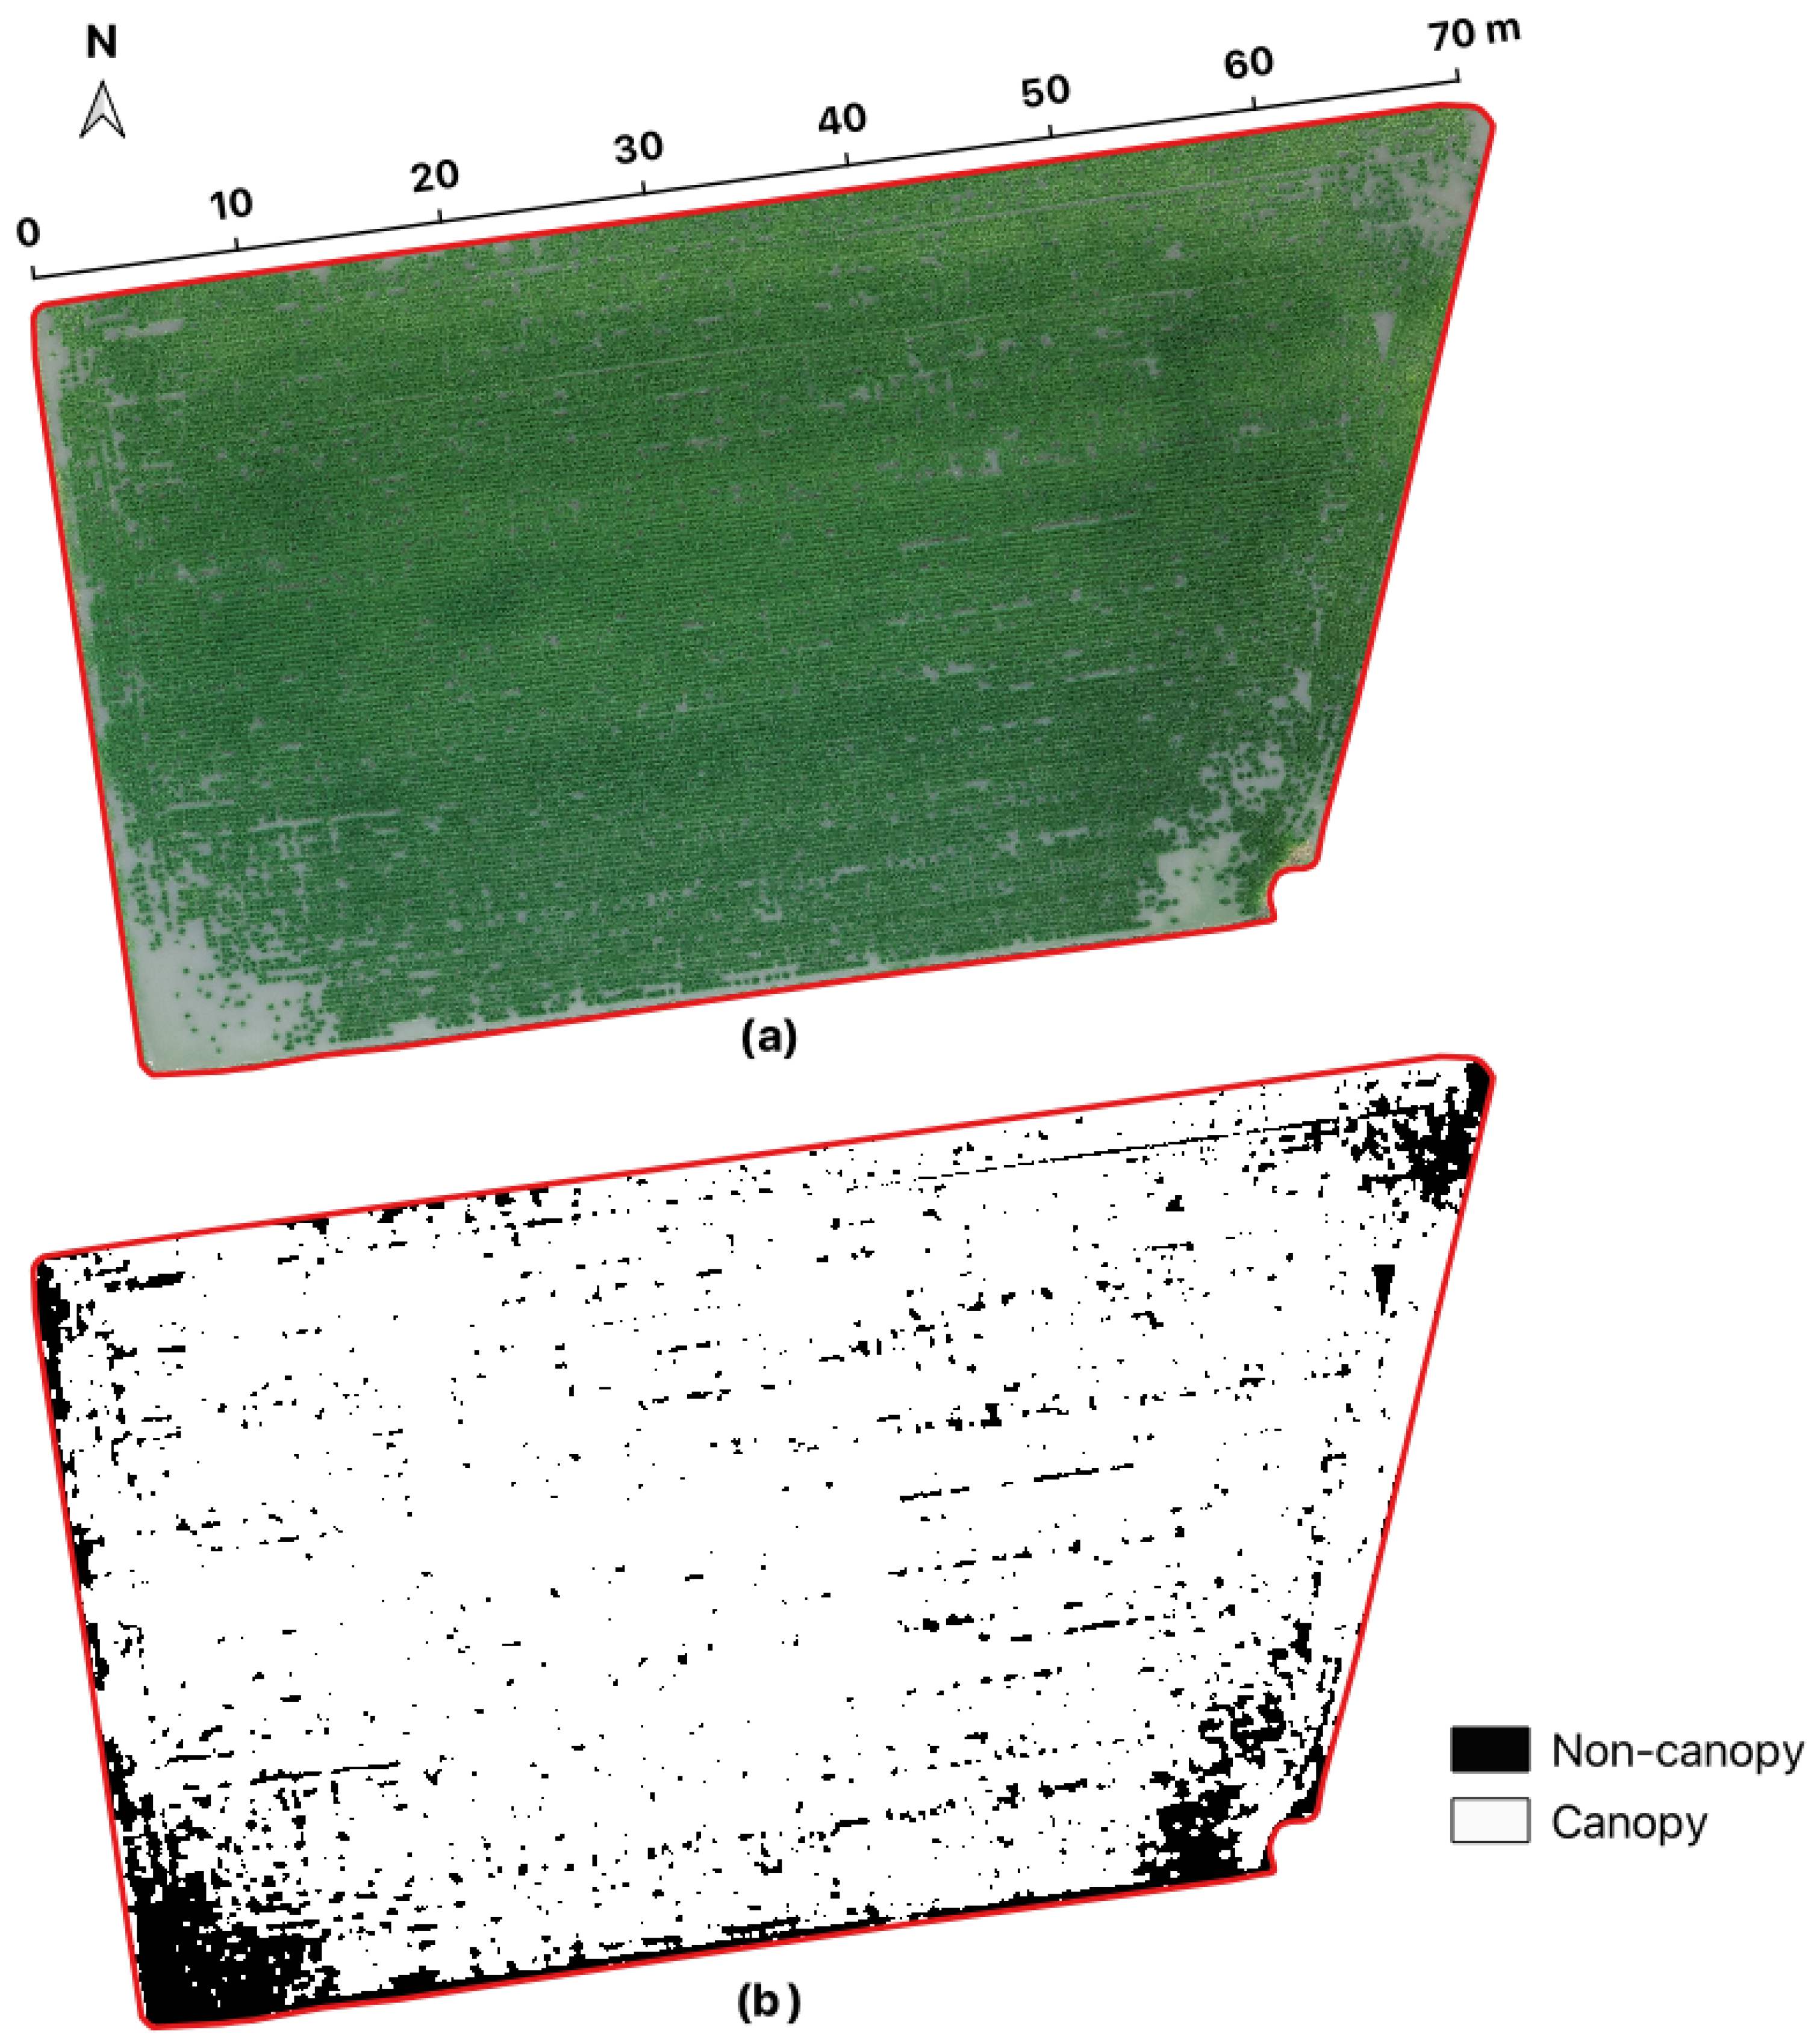
Damage rates were obtained from aerial images captured in late August. This timeframe corresponded to the period around rice heading, during which mildly affected rice plants had largely recovered, and the gaps between rows and plants were no longer visible. In contrast, the areas severely damaged by apple snails remained distinguishable because no rice plants were present. The calculation method followed Equations (3) and (4). Briefly, canopy presence was first determined from the pixel-level R, G, and B values in the orthomosaic map, and the non-canopy pixels were then aggregated to compute the overall damage rate for the field. Figure 5a shows the RGB orthomosaic map of field F 13 , in which the exposed water surface caused by missing rice plants is clearly visible in all four corners. Figure 5b presents the corresponding damage map, in which the black areas represent non-canopy (i.e., damaged) regions, and the total damage rate was 10.5%.
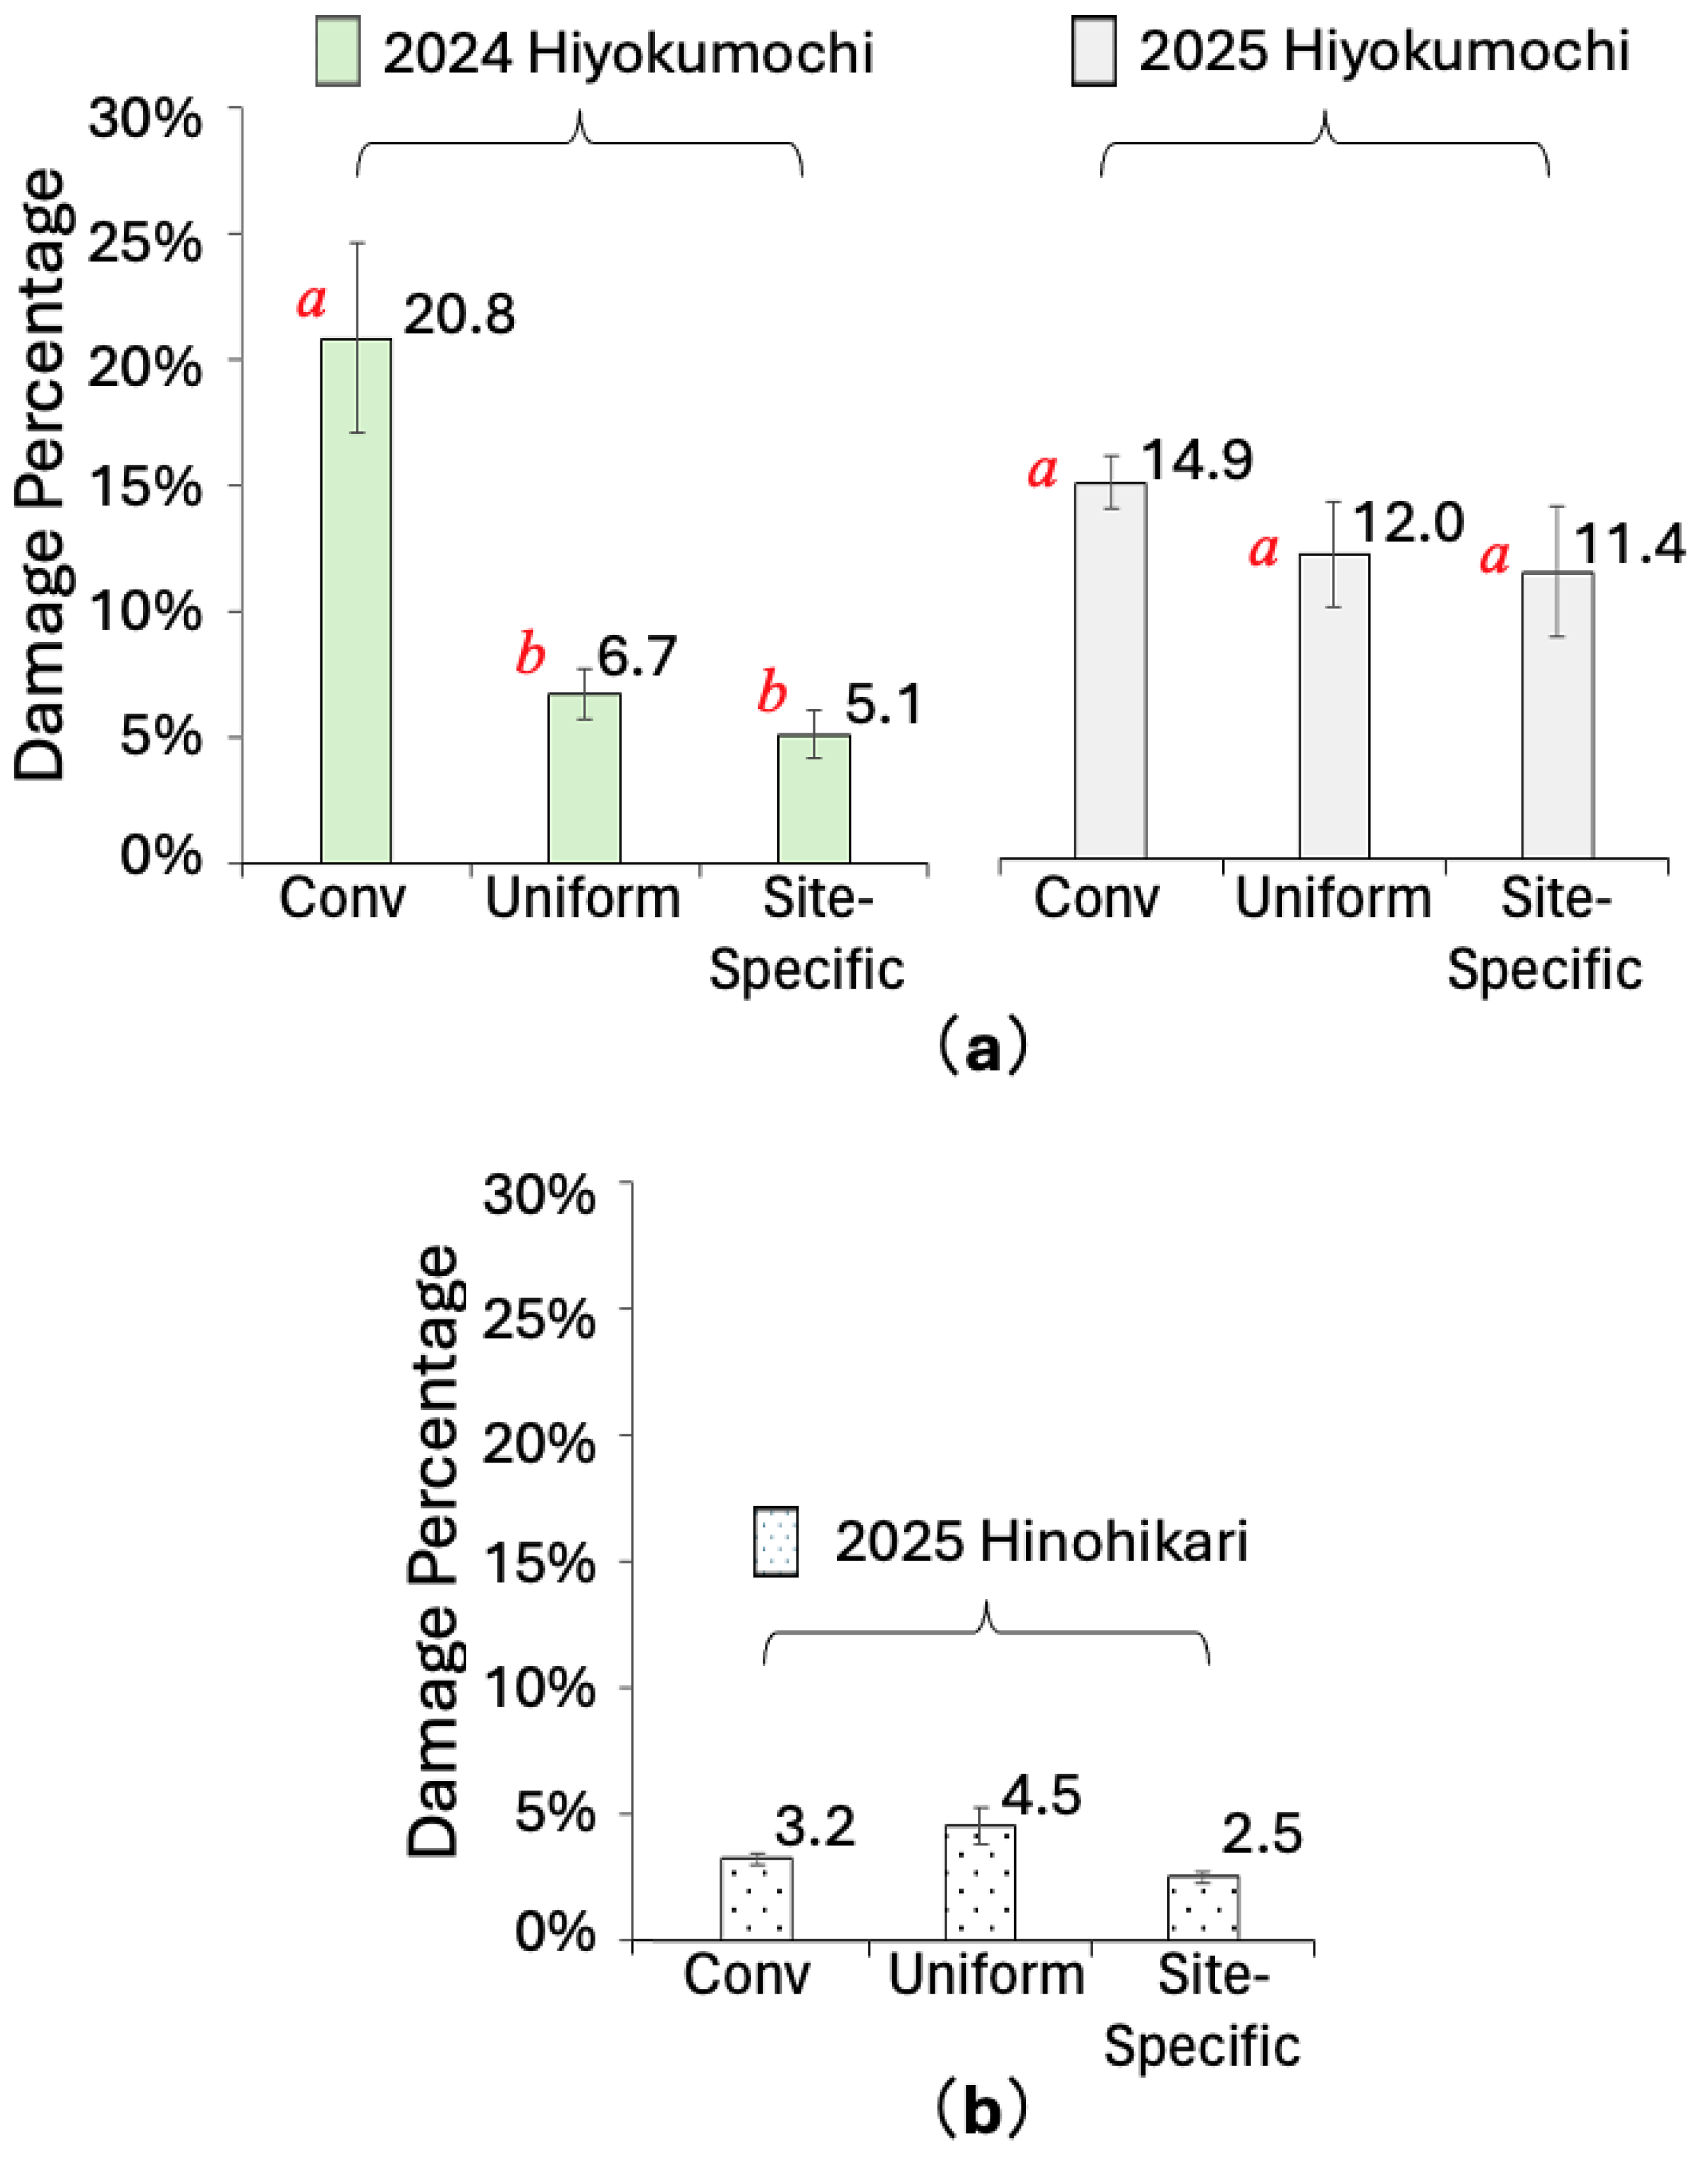
For all experimental fields, the damage rate was averaged by year, variety, and treatment, and standard errors were calculated. The results are shown in Figure 6. Except for the uniform treatment in the 2025 Hinohikari group, where the sample size was 2, all other treatments had a sample size of 3. As can be observed, in both Hiyokumochi groups for 2024 and 2025, the site-specific treatment had the lowest mean damage percentage (Figure 6a). In the 2024 Hiyokumochi group, the mean damage percentages of the site-specific and uniform treatments were significantly lower than those of the conventional treatment, according to a Tukey–Kramer test ( p < 0.05 ). However, for the 2025 Hiyokumochi group, although the mean damage percentages of the site-specific and uniform treatments were lower than those of the conventional treatment, conducting a significance test would produce no meaningful result.
In contrast, the group in Figure 6b represents a special case in which the rice variety was Hinohikari. The mean damage percentages of all three treatments were very small compared to those shown in Figure 6a. In addition to the overall low apple snail invasion levels in the region where these fields were located, a further contributing factor was that fields F 71 , F 72 , and F 73 had undergone crop rotation with soybeans in the previous year, resulting in very few surviving adult snails in these fields. Apple snails may exhibit feeding selectivity among rice varieties; however, we did not investigate this aspect. Because the mean damage percentages for the three treatments were negligible, a significance test would not provide meaningful information.

3.3. Yield Analysis

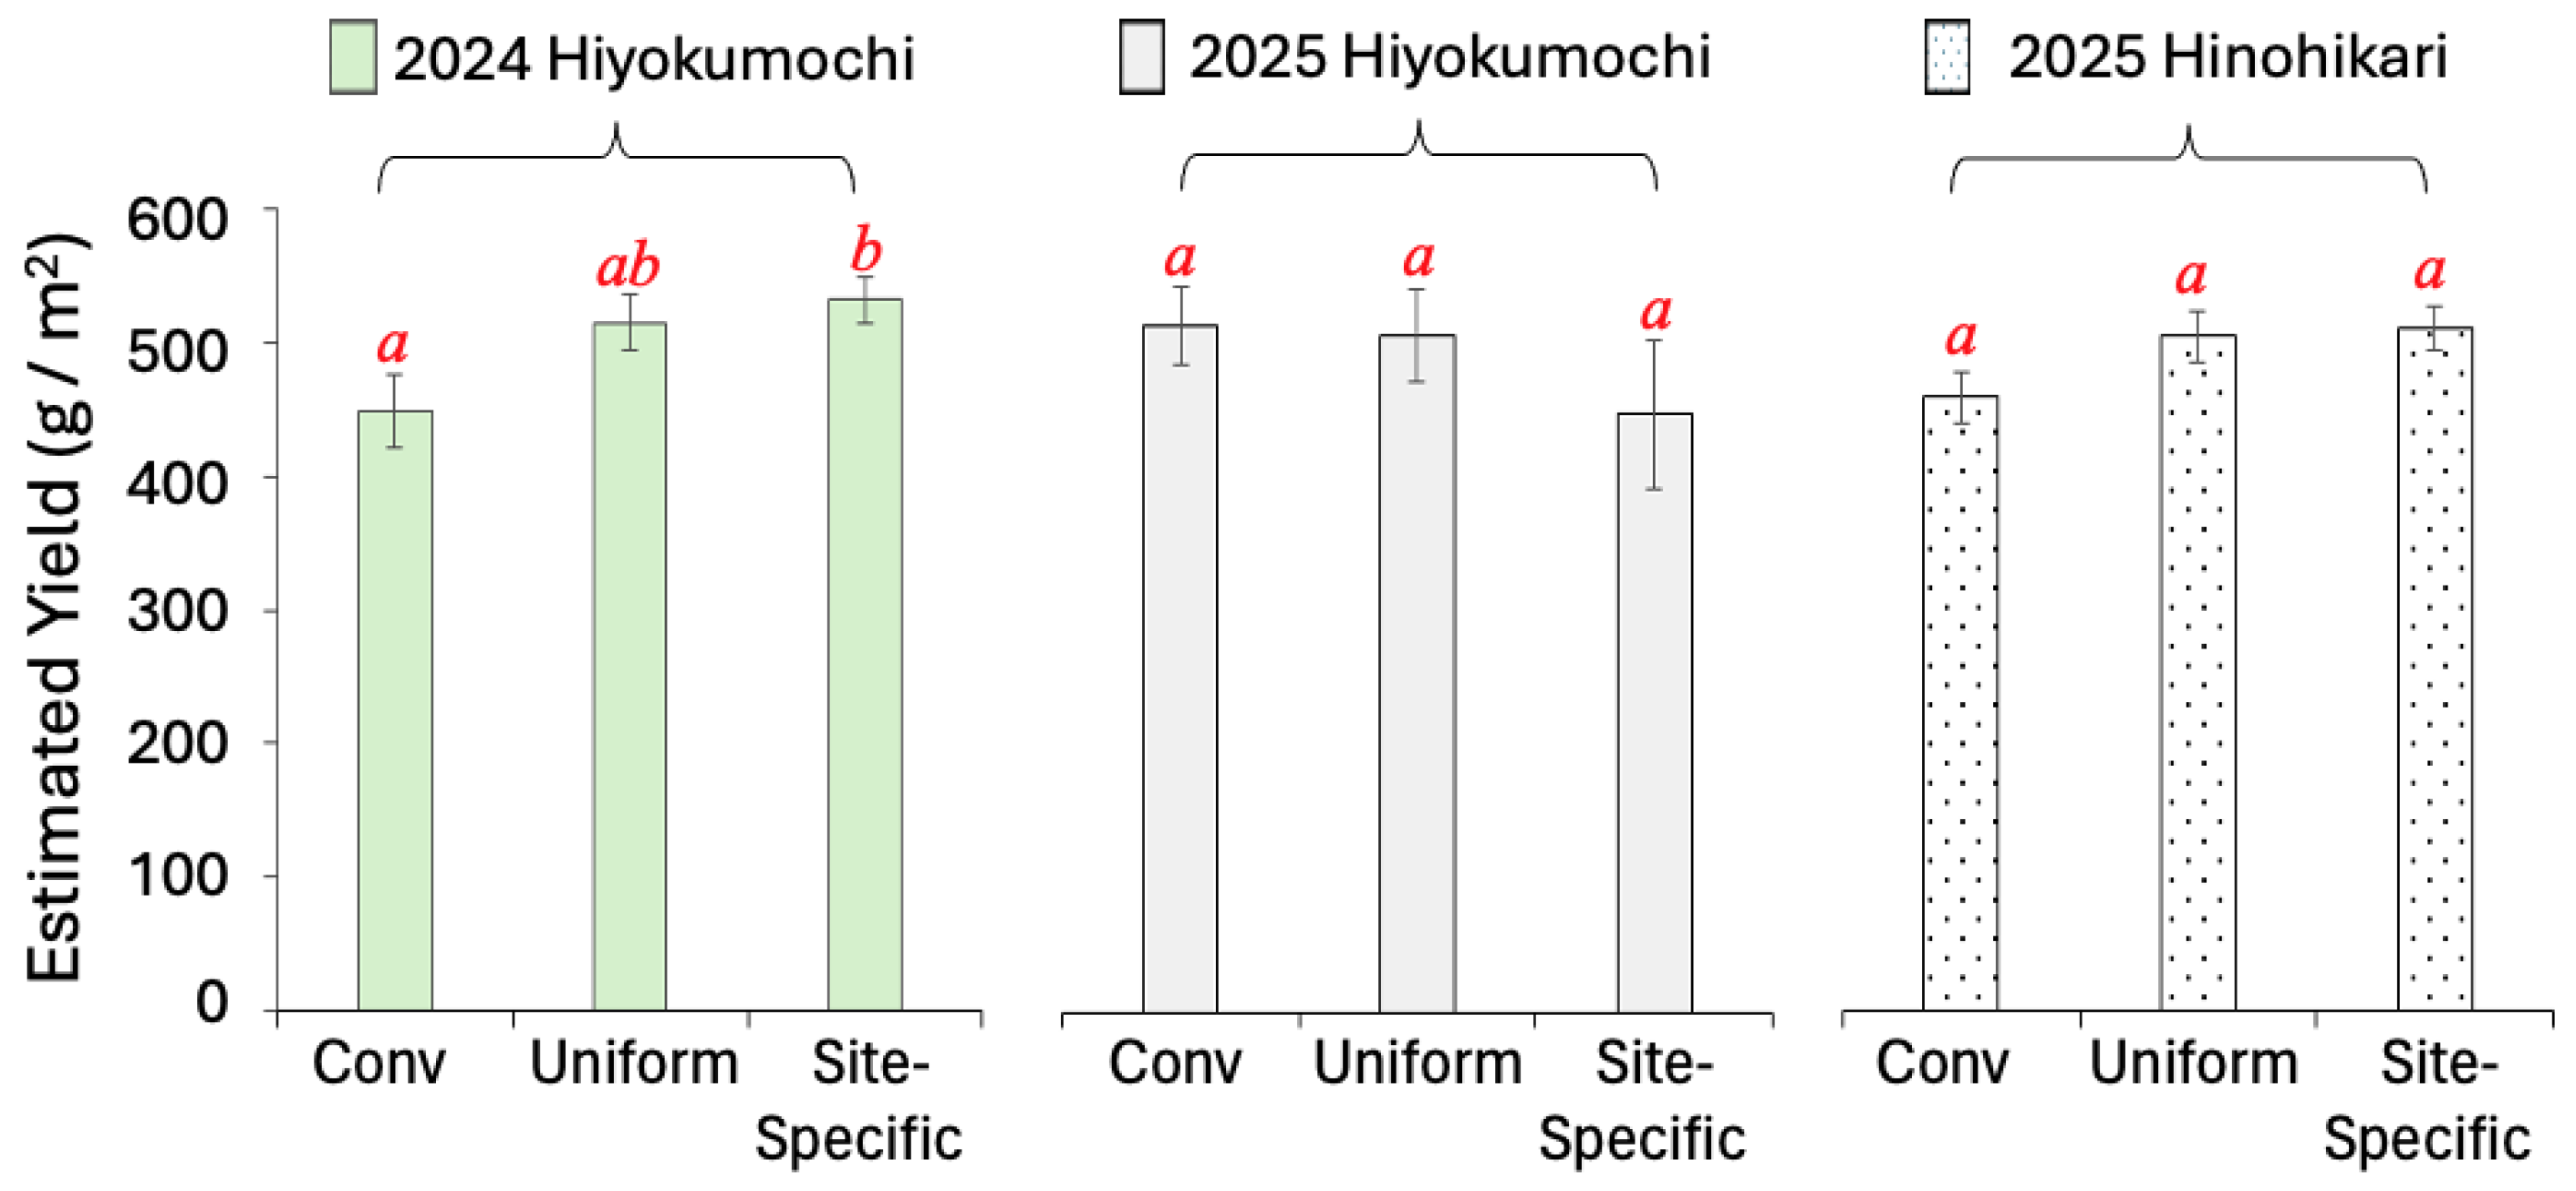
Yield was estimated by multiplying the yield per unit area, calculated from quadrat harvesting, by the overall damage rate of each field. The data were divided into three groups, as shown in Figure 7, each consisting of the following three treatments: conventional, uniform, and site-specific. Except for the uniform treatment in the 2025 Hinohikari group, which had six samples, all other treatments had nine samples each. Across the three groups, the mean yields of the three treatments were 449, 515, and 532 g/m2; 509, 502, and 443 g/m2; and 456, 501, and 507 g/m2, respectively. The corresponding standard errors were 27.5, 21.6, and 17.7; 29.4, 35.0, and 55.2, and 18.3, 19.1, and 16.4. According to the Tukey–Kramer test, no significant difference was found between the uniform and site-specific treatments in the first group, whereas both differed significantly from the conventional treatment. In the second and third groups, no significant differences were detected between the three treatments.
Within the site-specific treatment of the 2025 Hiyokumochi group, rice plants from fields F 41 and F 51 had noticeably lighter stems and leaves during quadrat harvesting, likely because of sheath blight, planthoppers, other pests, or disease damage. In contrast, rice plants in the other fields appeared to be generally healthy. Because we did not conduct detailed pest-and-disease surveys nor have records of agrochemical applications during the mid-to-late rice-growing stages, we cannot determine the exact cause of the lower yields in these fields with certainty. Consequently, the lighter stems and leaves of the rice plants in these fields ultimately affected the average yield of the site-specific treatment, making it lower than that of the uniform treatment.

4. Discussion

This study presented a field-validated drone-based application for controlling apple snail and evaluated its effects on chemical usage, damage rate, and final yield. Compared with our previous work [28], we expanded the system with a cloud-based UI designed for general users, introduced a method to assess field-level control indicators, supported additional output formats for prescription maps, extended drone model compatibility, and incorporated an analysis of the effects on the actual yield.
In our approach, the decisive data used for VRA and site-specific treatments were derived from the ground elevation distribution of individual fields, for which accuracy is of critical importance. Previous studies have reported the vertical accuracy of UAV-based photogrammetry can vary with flight altitude and camera configuration. Specifically, at relatively low flight altitudes (e.g., below approximately 60–80 m AGL), the root mean square error (RMSE) of DSMs tends to increase, whereas within a higher altitude range (approximately 80–120 m AGL), RMSE values become nearly constant [34,35]. Moreover, for flat terrains such as lowland rice paddies, vertical accuracy generally tends to improve at relatively higher flight altitudes. This effect has been demonstrated in the literature [36] as well as in our previous study [30]. Based on these considerations and prior experience, the UAV flight altitude for acquiring field-level elevation data in this study was set to 100 m AGL. Although the DSM generated at this altitude may exhibit an absolute vertical deviation of approximately 3–5 cm relative to true ground elevation, this deviation is systematic across DSMs derived from imagery acquired within the same survey period. Consequently, such uniform bias does not substantially affect the subsequent analysis of relative ground elevation distributions within individual fields, which were calculated with respect to the mean elevation of each field. Moreover, a flight altitude of 100 m AGL achieved an effective survey efficiency of approximately 27 ha per 20 min, allowing the entire aerial photography to be completed within a single flight without battery replacement. This level of efficiency is well suited for practical and scalable deployment in routine farm-level operations.
Nevertheless, although flights conducted at 100 m AGL were sufficient to meet our objectives, this altitude may not represent the optimal flight height. We did not perform systematic experimental validation to evaluate alternative altitudes; for example, an AGL of 120 m might also yield comparable or even improved results. Furthermore, the suitability of a fixed AGL over non-flat terrains remains unclear. In particular, in terraced paddy field landscapes, it is uncertain whether terrain-following flights that adjust altitude relative to ground elevation would be more appropriate. These issues were beyond the scope of the present study. Future investigations should therefore extend experiments to a wider range of terrain and ground-surface conditions.
To ensure experimental comparability, the fields used were selected based on a combination of factors, including the results of Moran’s I index and the Getis–Ord Gi* statistic, as well as subjective field grouping scheme (Section 2.3). The selection criteria were closely related to the final prescription map, which in turn led to an estimated reduction in pesticide use of 44.1–63.0%. For farmlands exhibiting extreme micro-topographic distributions—for example, those in which contiguous low-lying areas account for only approximately 10% of the total area—the potential pesticide savings could be even higher. For farmlands with relatively flat terrain, a management strategy that avoids molluscicide application and instead maintains a shallow water layer may be adequate.
Unlike dedicated experimental fields where conditions can be tightly controlled, our experiments were conducted in ordinary farmers’ fields, allowing us to obtain more robust data and more generalizable technology. Although we selected fields with similar conditions, differences in the surrounding environment, irrigation water sources, soil characteristics, and fertility, missing plants during transplanting, and subsequent field management inevitably influenced the final yields to varying degrees [37]. Owing to time and manpower constraints, these factors were not investigated or quantitatively analyzed in this study. Accordingly, the calculated damage rates in our results represent the portion assumed to be caused by apple snails without accounting for these other factors. In regions with low apple snail occurrence—such as the 2025 Hinohikari fields in Figure 6b—the overall damage rates remained low, and the three treatments (conventional, uniform, and site-specific) showed little difference, indicating that additional drone-based application is unnecessary. Beyond the control indicators used, prior assessment of apple snail abundance in both fields and irrigation channels is also important [38].
Feeding by apple snails leads to missing rice plants, which decreases the final yield. However, the surrounding rice plants may partially compensate for increased growth owing to reduced competition [39]. Sugimoto and Samoto [40] reported that an inter-plant spacing greater than 36 cm in rice results in a significant reduction in yield. In addition to missing hills, the final yield is affected by many factors, such as weeds and various pests and diseases [41]. These factors, however, were not considered in our analyses. In theory, if apple snail damage were the dominant factor affecting yield, the three treatments—conventional, uniform, and site-specific—would produce results similar to the 2024 Hiyokumochi group in Figure 7: fields without control measures would have larger damaged areas and lower yields, while the site-specific treatment would save approximately half of the pesticide amount yet achieve a yield comparable to the uniform treatment. However, when other yield-limiting factors are present, different outcomes may occur, as observed in the 2025 Hiyokumochi group in Figure 7, indicating the need for a quantitative analysis of these additional yield-limiting factors.
Furthermore, when agricultural drones spread granules, variations in particle properties and sizes often cause discrepancies between the intended and actual application amounts [42,43]. When an automatic flight path is generated within a designated field boundary, mismatches between the planned path spacing and the effective spreading width may result in local overlaps or gaps in coverage, thereby causing deviations from the intended application rate [44]. Such deviations are amplified in narrow and elongated fields such as F 82 (Table 4). A more feasible approach is to determine the release rate of the hopper opening and the drone speed based on the intended application amount and the total flight path length. DJI agricultural drones support VRA and automatically adjust the hopper aperture according to the prescription map. However, within regions where the prescription amount is zero, the hopper closes while the drone continues flying, thus wasting time and battery power. The most effective solution is to exclude the zero-application areas and operate only in the necessary regions, as illustrated by the “Application boundary” in Figure 4b, which can greatly improve spreading efficiency.
In the future, we plan to further develop UAV-based detection technologies to quantify apple snail populations in regional farmlands with diverse topographic conditions, popularize our cloud-based web-UI platform, and extend our prescription-creation methods to incorporate a wider range of vegetation indices, thereby enabling broader applications of drone-based VRA and site-specific management.

5. Conclusions

Over the past 2 years of field-validated experiments, we applied drone-based site-specific and VRA application for control of apple snail and evaluated its performance in terms of chemical usage, damage rate, and final yield. Our results showed that in regions with high apple snail occurrence, site-specific treatments successfully reduced chemical inputs without reducing yield. In contrast, in regions with low apple snail occurrence, the outcomes were comparable to those of the conventional treatment, suggesting that additional drone-based control is unnecessary in such areas. In the study, we developed a cloud-based interface that enables general users to generate prescription maps, without requiring specialized knowledge. This platform can be readily adopted by ordinary farming households and extended to broader precision-agriculture applications.

Author Contributions

S.G., conceptualization, methodology, investigation, software, validation and writing—original draft preparation, review and editing; K.T., conceptualization, methodology, project administration, investigation, supervision, funding acquisition, and writing—review. S.W., methodology, investigation, validation and writing—review; K.F., investigation, resources, and writing—review; H.O., investigation, resources, and writing—review; K.O., investigation, resources, and writing—review. All authors have read and agreed to the published version of the manuscript.

Funding

This research received no external funding.

Institutional Review Board Statement

Not applicable.

Informed Consent Statement

Not applicable.

Data Availability Statement

The data presented in this study are available on request from the corresponding author.

Acknowledgments

We sincerely thank Masumi Kabashima for dedicating substantial time and effort to software programming, packaging tests, data organization, and analysis, and for providing full technical support throughout this work. We are grateful to technicians Akitoshi Honbu, Sho Sawada, and Keisuke Matsuo from the Chikugo Technical Team for their assistance with UAV photography and drone-based spreading, field investigations and sampling, as well as yield measurements. Finally, we acknowledge Agribase Niiyama Ltd. for providing the experimental fields and experimental conditions, and Nileworks Co., Ltd. for their support in the drone-based spreading experiments.

Conflicts of Interest

The authors declare no conflicts of interest.

Abbreviations

The following abbreviations are used in this manuscript:
AGLAbove Ground Level
DSMDigital Surface Model
GSDGround Sample Distance
RMSERoot Mean Square Error
RTKReal-Time Kinematic
UAVUnmanned Aerial Vehicle
VRAVariable Rate Application

References

  1. Muthayya, S.; Sugimoto, J.D.; Montgomery, S.; Maberly, G.F. An overview of global rice production, supply, trade, and consumption. Ann. N. Y. Acad. Sci. 2014, 1324, 7–14. [Google Scholar] [CrossRef]
  2. Arouna, A.; Dzomeku, I.K.; Shaibu, A.G.; Nurudeen, A.R. Water management for sustainable irrigation in rice (Oryza sativa L.) production: A review. Agronomy 2023, 13, 1522. [Google Scholar] [CrossRef]
  3. Joshi, R.C. Problems with the Management of the Golden Apple Snail Pomacea canaliculata: An Important Exotic Pest of Rice in Asia. In Area-Wide Control of Insect Pests; Springer: Dordrecht, The Netherlands, 2007; pp. 257–264. [Google Scholar] [CrossRef]
  4. Yoshida, K.; Wada, T.; Matsukura, K.; Shiba, T. Potential overwintering areas of the alien apple snail, Pomacea canaliculata, in Japan at its northern distribution limit. Aquat. Invasions 2022, 17, 402–414. [Google Scholar] [CrossRef]
  5. Lei, J.; Chen, L.; Li, H. Using ensemble forecasting to examine how climate change promotes worldwide invasion of the golden apple snail (Pomacea canaliculata). Environ. Monit. Assess. 2017, 189, 404. [Google Scholar] [CrossRef]
  6. Yang, R.; Cao, R.; Gong, X.; Feng, J. Large shifts of niche and range in the golden apple snail (Pomacea canaliculata), an aquatic invasive species. Ecosphere 2023, 14, e4391. [Google Scholar] [CrossRef]
  7. Yusa, Y.; Sugiura, N.; Wada, T. Predatory potential of freshwater animals on an invasive agricultural pest, the apple snail Pomacea canaliculata (Gastropoda: Ampullariidae), in southern Japan. Biol. Invasions 2006, 8, 137–147. [Google Scholar] [CrossRef]
  8. Nusantoro, S.; Natsir, M.H.; Sjofjan, O. Nutritive value of golden apple snail (Pomacea canaliculata) as animal and aquaculture feed. Rev. Agric. Sci. 2024, 12, 147–164. [Google Scholar] [CrossRef] [PubMed]
  9. Jin, Y.N.; Yu, K.S.; Ri, U.J.; Song, C.N. Methods and Effectiveness of Using Apple Snails (Pomacea sp.) in Organic Rice Farming. Proc. Natl. Acad. Sci. India B Biol. Sci. 2022, 92, 495–504. [Google Scholar] [CrossRef]
  10. Takahashi, K.; Seki, M.; Nishida, H. Prevention of the Harm from Apple Snail with Rotary Cultivator. J. Jpn. Soc. Agric. Mach. 2002, 64, 101–107. [Google Scholar] [CrossRef]
  11. Takahashi, K.; Seki, M.; Higashi, S.; Miike, T. Development of Technology by Rotary Tiller to Control the Density of Apple Snail. J. Jpn. Soc. Agric. Mach. 2005, 67, 68–74. [Google Scholar] [CrossRef]
  12. Litsinger, J.; Estano, D.B. Management of the golden apple snail Pomacea canaliculata (Lamarck) in rice. Crop Prot. 1993, 12, 363–370. [Google Scholar] [CrossRef]
  13. Yoshida, K.; Suzuki, E.; Yusa, Y. Evaluation of attractants for traps of the apple snail Pomacea canaliculata in a rice field. Ann. Rept. Kansai Pl. Prot. 2021, 63, 151–154. [Google Scholar] [CrossRef]
  14. Yusa, Y.; Wada, T. Impact of the introduction of apple snails and their control in Japan. Naga ICLARM Q. 1999, 22, 9–13. [Google Scholar]
  15. Wada, T.; Ichinose, K.; Yusa, Y.; Sugiura, N. Decrease in density of the apple snail Pomacea canaliculata (Lamarck) (Gastropoda: Ampullariidae) in paddy fields after crop rotation with soybean, and its population growth during the crop season. Appl. Entomol. Zool. 2004, 39, 367–372. [Google Scholar] [CrossRef]
  16. Sin, T.S. Damage potential of the golden apple snail Pomacea canaliculata (Lamarck) in irrigated rice and its control by cultural approaches. Int. J. Pest Manag. 2003, 49, 49–55. [Google Scholar] [CrossRef]
  17. Makiyama, M.; Itoh, T. The Effects of Shallow Ponding Depth for Control of the Damage by Pomacea canaliculata. J. Agric. Eng. Soc. Jpn. 2005, 73, 793–796.a1. [Google Scholar] [CrossRef]
  18. Cowie, R.H. Apple snails (Ampullariidae) as agricultural pests: Their biology, impacts and management. In Molluscs as Crop Pests; CABI Publishing: Wallingford, UK, 2002. [Google Scholar] [CrossRef]
  19. Phatchuay, S.; Boontong, P. Development of Unmanned Aerial Vehicle to Monitor and Eradicate Golden Apple Snails in Agricultural Plots. KMUTT Res. Dev. J. 2021, 44, 647–665. [Google Scholar] [CrossRef]
  20. Tariman, S.R.M.; Villaverde, J.F. Detecting Eggs of Invasive Apple Snails on Rice Fields Using YOLOv8 Algorithm. In Proceedings of the TENCON 2024—2024 IEEE Region 10 Conference (TENCON), Singapore, 1–4 December 2024; pp. 961–966. [Google Scholar] [CrossRef]
  21. Cruz, K.M.S.D.; Ella, V.B.; Suministrado, D.C.; Pereira, G.S.; Agulto, E.S. A Low-Cost Wireless Sensor for Real-Time Monitoring of Water Level in Lowland Rice Field under Alternate Wetting and Drying Irrigation. Water 2022, 14, 4128. [Google Scholar] [CrossRef]
  22. Mandlburger, G.; Pfennigbauer, M.; Schwarz, R.; Flöry, S.; Nussbaumer, L. Concept and performance evaluation of a novel UAV-borne topo-bathymetric LiDAR sensor. Remote Sens. 2020, 12, 986. [Google Scholar] [CrossRef]
  23. Wang, D.; Xing, S.; He, Y.; Yu, J.; Xu, Q.; Li, P. Evaluation of a new lightweight UAV-borne topo-bathymetric LiDAR for shallow water bathymetry and object detection. Sensors 2022, 22, 1379. [Google Scholar] [CrossRef]
  24. Mora, O.E.; Suleiman, A.; Chen, J.; Pluta, D.; Okubo, M.H.; Josenhans, R. Comparing sUAS photogrammetrically-derived point clouds with GNSS measurements and terrestrial laser scanning for topographic mapping. Drones 2019, 3, 64. [Google Scholar] [CrossRef]
  25. Rivera, G.; Porras, R.; Florencia, R.; Sánchez-Solís, J.P. LiDAR applications in precision agriculture for cultivating crops: A review of recent advances. Comput. Electron. Agric. 2023, 207, 107737. [Google Scholar] [CrossRef]
  26. Zhang, J.; Wang, W.; Krienke, B.; Cao, Q.; Zhu, Y.; Cao, W.; Liu, X. In-season variable rate nitrogen recommendation for wheat precision production supported by fixed-wing UAV imagery. Precis. Agric. 2022, 23, 830–853. [Google Scholar] [CrossRef]
  27. Pawase, P.P.; Nalawade, S.M.; Bhanage, G.B.; Walunj, A.A.; Kadam, P.B.; Durgude, A.G.; Patil, M.G. Variable rate fertilizer application technology for nutrient management: A review. Int. J. Agric. Biol. Eng. 2023, 16, 11–19. [Google Scholar] [CrossRef]
  28. Guan, S.; Takahashi, K.; Watanabe, S.; Tanaka, K. Unmanned aerial vehicle-based techniques for monitoring and prevention of invasive apple snails (Pomacea canaliculata) in rice paddy fields. Agriculture 2024, 14, 299. [Google Scholar] [CrossRef]
  29. Matsukura, K. Recent Range Expansion of Apple Snails in East Asia and Novel Countermeasures. JARQ-Jpn. Agric. Res. Q. 2025, 59, 245–252. [Google Scholar] [CrossRef]
  30. Guan, S.; Takahashi, K.; Nakano, K.; Fukami, K.; Cho, W. Real-Time Kinematic Imagery-Based Automated Levelness Assessment System for Land Leveling. Agriculture 2023, 13, 657. [Google Scholar] [CrossRef]
  31. Moran, P.A. Notes on continuous stochastic phenomena. Biometrika 1950, 37, 17–23. [Google Scholar] [CrossRef]
  32. Ord, J.K.; Getis, A. Local spatial autocorrelation statistics: Distributional issues and an application. Geogr. Anal. 1995, 27, 286–306. [Google Scholar] [CrossRef]
  33. ISO 11783-10; Tractors and Machinery for Agriculture and Forestry—Serial Control and Communications Data Network—Part 10: Task Controller and Management Information System Data Interchange. ISO Copyright Office: Geneva, Switzerland, 2015.
  34. Agüera-Vega, F.; Carvajal-Ramírez, F.; Martínez-Carricondo, P. Accuracy of digital surface models and orthophotos derived from unmanned aerial vehicle photogrammetry. J. Surv. Eng. 2017, 143, 04016025. [Google Scholar] [CrossRef]
  35. Gómez-Candón, D.; De Castro, A.; López-Granados, F. Assessing the accuracy of mosaics from unmanned aerial vehicle (UAV) imagery for precision agriculture purposes in wheat. Precis. Agric. 2014, 15, 44–56. [Google Scholar] [CrossRef]
  36. Jiménez-Jiménez, S.I.; Ojeda-Bustamante, W.; Marcial-Pablo, M.d.J.; Enciso, J. Digital terrain models generated with low-cost UAV photogrammetry: Methodology and accuracy. ISPRS Int. J. Geo-Inf. 2021, 10, 285. [Google Scholar] [CrossRef]
  37. International Rice Research Institute. Rice Research Strategies for the Future; International Rice Research Institute: Los Baños, Philippines, 1982. [Google Scholar]
  38. Zhou, Y.; Li, Z.; Fan, D.; Feng, H.; Zhu, S.; Li, H.; Xue, J. Potential geographic distribution of Pomacea canaliculata, invasion and risk assessment of its harm to rice fields: A case study of Hubei Province in the Yangtze River Basin. Manag. Biol. Invasions 2025, 16, 991–1007. [Google Scholar] [CrossRef]
  39. Gomez, K.; De Datta, S. Missing Hills in Rice Experimental Plots. Agron. J. 1972, 64, 163–164. [Google Scholar] [CrossRef]
  40. Sugimoto, K.; Samoto, K. Compensatory Growth and Yield of Rice Plants Adjacent to Hills Without Plants in Relation to Planting of Young Seedlings. Jpn. J. Crop Sci. 1979, 48, 214–219. [Google Scholar] [CrossRef]
  41. Conde, S.; Catarino, S.; Ferreira, S.; Temudo, M.P.; Monteiro, F. Rice pests and diseases around the world: Literature-based assessment with emphasis on Africa and Asia. Agriculture 2025, 15, 667. [Google Scholar] [CrossRef]
  42. Zhang, Z.; Yang, L.; Ning, P. Effects of Application Rate and Particle Size on Distribution Uniformity of Fertilizer Application Using Unmanned Aerial Vehicle. Chin. Agric. Sci. Bull. 2025, 41, 63–70. [Google Scholar] [CrossRef]
  43. Wang, X.; Jiang, R.; Zhou, Z.; Huang, J.; Lin, J. Impact of airflow rectification on spreading uniformity for UAV-based multichannel pneumatic granular fertilizer spreader. Agronomy 2023, 13, 2661. [Google Scholar] [CrossRef]
  44. Liu, Y.; Yao, W.; Guo, S.; Yan, H.; Yu, Z.; Meng, S.; Chen, D.; Chen, C. Determination of the effective swath of a plant protection UAV adapted to mist nozzles in mountain Nangguo pear orchards. Front. Plant Sci. 2024, 15, 1336580. [Google Scholar] [CrossRef]
Figure 1. Geographical locations of the experimental fields.
Drones 10 00176 g001
Figure 2. Research methodology, instruments, and tools, highlighting additions, improvements, and extensions.
Drones 10 00176 g002
Figure 3. Ground elevation map, prescription map, and drone path for F 21 . (a) Ground elevation map visualized with color grading and 5 cm contours. (b) Prescription map construed from 1 × 1 m grids with assigned application rates. (c) Actual drone flight path (i.e., transit path) and application paths. Ⓗ denotes the home point for drone takeoff and landing.
Drones 10 00176 g003
Figure 4. Prescription map and drone path for Agras T10. (a) Prescription map with a spatial resolution of 1 × 1 m per pixel, associated with the assigned application rates; (b) Defined application boundary and drone flight path (i.e., transit path) and application path.
Drones 10 00176 g004
Figure 5. Damage rate map for F 13 . (a) RGB orthomosaic map. (b) Non-canopy (i.e., damaged) map.
Drones 10 00176 g005
Figure 6. Damage rates grouped by year and variety. Error bars indicate standard errors. (a) Damage percentages with significant differences between treatments in both Hiyokumochi groups for 2024 and 2025. Different red italic letters within the same group indicate significant differences among treatments. (b) Damage percentages between treatments for the 2025 Hinohikari group.
Drones 10 00176 g006
Figure 7. Estimated yields grouped by year and rice variety. Within each group, different red italic letters indicate significant differences among treatments according to the Tukey–Kramer test (p < 0.05).
Drones 10 00176 g007
Table 1. Information on the experimental fields.
GroupFieldArea (ha)LatitudeLongitudeTreatmentGrowing SeasonRice Variety
G1F110.19733.342251 N130.364823 ESite-specific
F120.26133.341890 N130.364869 EUniform
F130.24833.344736 N130.366079 EConventional
G2F210.29033.336610 N130.367264 ESite-specific
F220.20333.333742 N130.367162 EUniform2024Hiyokumochi
F230.19933.338267 N130.365016 EConventional
G3F310.36633.332729 N130.377274 ESite-specific
F320.10733.333138 N130.377147 EUniform
F330.24233.333259 N130.374903 EConventional
G4F410.28033.346800 N130.364019 ESite-specific v
F420.16133.346558 N130.364072 EUniform
F430.27833.347069 N130.363989 EConventional
G5F510.32433.342319 N130.365522 ESite-specific
F520.26133.341890 N130.364869 EUniform2025Hiyokumochi
F530.29533.342797 N130.365576 EConventional
G6F610.42733.332963 N130.374930 ESite-specific
F620.24233.333259 N130.374903 EUniform
F630.31433.333536 N130.374905 EConventional
G7F710.56433.326630 N130.396682 ESite-specific2025Hinohikari
F720.45833.326917 N130.398316 EUniform
F730.27533.326529 N130.396173 ESite-specific
F740.11833.327055 N130.399861 EUniform
F750.49933.326992 N130.398871 EConventional
G8F810.45133.339944 N130.402084 ESite-specific
F820.14233.337441 N130.403282 EUniform
F830.45533.338230 N130.404270 EConventional
v VRA within the site-specific boundary.
Table 2. Equations used.
I = n i = 1 n j = 1 n w i j · i = 1 n j = 1 n w i j ( x i x ¯ ) ( x j x ¯ ) i = 1 n ( x i x ¯ ) 2 (1)[31]
G i * = j = 1 n w i j x j x ¯ j = 1 n w i j S n j = 1 n w i j 2 j = 1 n w i j 2 n 1 (2)[32]
C = 1 , if B G < θ 1 and R G < θ 2 and 2 G R B > θ 3 0 , otherwise (3)[28]
r = 1 s u m ( C ) c o u n t ( C ) (4)[28]
Table 3. Software used.
SoftwareUsageVersion
DJI GS Pro (DJI, Shenzhen, China)flight app2.0.18 (iOS)
PIX4Dengine (PIX4D S.A., Lausanne, Switzerland)photogrammetry processing1.4
Python (Python Software Foundation, Wilmington, DE, USA)automated pipeline3.8–3.9
Django (Django Software Foundation, Huntersville, NC, USA)web UI4.2.23
R (R Foundation for Statistical Computing, Vienna, Austria)statistic analysis4.5.2
Table 4. Drone-based application amounts and molluscicide reduction percentages.
YearVarietyTreatmentModelAmount (kg/ha)Relative Ratio (to 40 kg)Saving Percentage (%)
2024HiyokumochiUniformNile-JZ Plus40.41.010−1.0
Site-specific22.40.55944.1
2025HinohikariUniformNile-JZ Plus46.71.167−16.7
Site-specific14.80.37063.0
HiyokumochiUniformAgras T1037.70.9435.7
Site-specific15.50.38861.2
Site-specific v4.60.11688.4
v VRA within the site-specific boundary.
Disclaimer/Publisher’s Note: The statements, opinions and data contained in all publications are solely those of the individual author(s) and contributor(s) and not of MDPI and/or the editor(s). MDPI and/or the editor(s) disclaim responsibility for any injury to people or property resulting from any ideas, methods, instructions or products referred to in the content.