Proceeding Paper

Recognition of Gait Activities Using Acceleration Data from A Smartphone and A Wearable Device †

by
Irvin Hussein Lopez-Nava
1,2,*,
Matias Garcia-Constantino
3 and
Jesus Favela
2
1
Consejo Nacional de Ciencia y Tecnología, Ciudad de Mexico 03940, Mexico
2
Department of Computer Science, Centro de Investigación Científica y de Investigación Superior de Ensenada, Ensenada 22860, Mexico
3
School of Computing, Ulster University, Jordanstown BT37 0QB, UK
*
Author to whom correspondence should be addressed.
Presented at the 13th International Conference on Ubiquitous Computing and Ambient Intelligence UCAmI 2019, Toledo, Spain, 2–5 December 2019.
Proceedings 2019, 31(1), 60; https://doi.org/10.3390/proceedings2019031060
Published: 21 November 2019

Abstract

:
Activity recognition is an important task in many fields, such as ambient intelligence, pervasive healthcare, and surveillance. In particular, the recognition of human gait can be useful to identify the characteristics of the places or physical spaces, such as whether the person is walking on level ground or walking down stairs in which people move. For example, ascending or descending stairs can be a risky activity for older adults because of a possible fall, which can have more severe consequences than if it occurred on a flat surface. While portable and wearable devices have been widely used to detect Activities of Daily Living (ADLs), few research works in the literature have focused on characterizing only actions of human gait. In the present study, a method for recognizing gait activities using acceleration data obtained from a smartphone and a wearable inertial sensor placed on the ankle of people is introduced. The acceleration signals were segmented based on the automatic detection of strides, also called gait cycles. Subsequently, a feature vector of the segmented signals was extracted, which was used to train four classifiers using the Naive Bayes, C4.5, Support Vector Machines, and K-Nearest Neighbors algorithms. Data was collected from seven young subjects who performed five gait activities: (i) going down an incline, (ii) going up an incline, (iii) walking on level ground, (iv) going down stairs, and (v) going up stairs. The results demonstrate the viability of using the proposed method and technologies in ambient assisted living contexts.

1. Introduction

Activity or action recognition is the process of inferring and assigning a label of a class to a dataset element of at least one source, such as video, images, or portable devices. One of the more active areas of research in activity recognition corresponds to the recognition of Activities of Daily Living (ADLs) [1] and instrumental ADLs [2] using acceleration data of portable and wearable devices [3,4]. These ADLs are usually very different from one another, for example, brushing teeth, preparing meals, and ambulating.
Gait analysis is the discipline that studies the locomotion and ambulation of people using techniques that branch from a brief observation to sophisticated computerized measurements [5]. Gait analysis is important because human gait may reflect early warning signs of senile dementia and Alzheimer’s disease [6] or the assessment of frailty [7]. In addition to this, the recognition of the human gait can be useful to identify the characteristics of the places where people move, which is important for monitoring their activities [8], abnormal behaviors [9], and risk factors [10]. Human gait is defined as the cyclic movement of the feet in which each foot alternates contact with the support surface [11]. To begin walking it is necessary to start from a situation of mechanical stability in standing. The walking activity involves the entire musculoskeletal system and various postural reflexes.
Periodic patterns occur in typical human gait captured by accelerometers, for instance, there are positive peaks in swing phases when a foot moves forward in a specific axis [12]. People change their gait due to age-related changes and pathological changes, which makes it difficult to distinguish patterns in the acceleration signals. Elderly people, for instance, drag their feet and have shorter step length. Gait events, such as heel strike and toe-off, are detected based on characteristic accelerations and decelerations detected as peaks [13].
In the present study, we present a method for recognizing gait activities using acceleration data obtained from a smartphone and from a wearable device based on the identification of human strides and using supervised classification. The remaining of the paper is organized as follows. In Section 2 related work is summarized. Section 3 and Section 4 detail the method proposed for recognizing gait activities and its evaluation, respectively. Finally, the conclusions and future directions are presented in Section 5.

2. Related Work

Technological advances have allowed collecting data of the activities of people mainly from the use of video cameras [14,15], environmental sensors [16], and portable devices [4,17,18]. The latter have the advantages of working properly outdoors and of not being sensitive to occlusion or lighting.
The most studied ambulating or gait activities are walking, jogging and running. For example, in [19] the authors propose a one-dimensional (1D) Convolutional Neural Network (CNN) -based method for recognizing those three activities using accelerometer data collected from smartphones of five subjects. The raw acceleration signals are combined in a vector magnitude and segmented in windows of 10 and 20 s. In another study, walking was classified into three speeds: slow, normal and fast [20]. Acceleration data were obtained from 25 subjects who carried a smartphone. Eight features were extracted from the acceleration magnitude vector, and seven classification techniques were applied for classifying the walking data by the speed.
In [21], the activities of running, being still, jumping and walking were classified using Support Vector Machines (SVM). Data was collected from a smartphone placed inside the pocket of 11 subjects. The features were extracted from raw acceleration segments of 5.12 s based on the Discrete Cosine Transform (DCT) coefficients and were selected using Principal Component Analysis (PCA). In another work, accelerometer and gyroscope signals were used to classify gait actions [22]. A smartphone was placed on the thigh and an Inertial Measurement Unit (IMU) on the chest of 24 subjects with the aim of classifying six activities: sitting, standing, lying, walking, running, and cycling. Time and frequency-domain features were extracted from the segmented signals (15 s) and classified using five different algorithms.
In contrast to previous work, two important aspects of our study can be highlighted: (i) the acceleration signals were dynamically segmented based on the automatic detection of the strides of the participants, and (ii) a double-comparison was made in two dimensions, comparing two devices (smartphone vs. IMU) and comparing two types of acceleration signals (forward-direction vs. magnitude vector). The objective of using two types of devices, one specialized (IMU) with a specific configuration, and another that most people are carrying nowadays (smartphone), is to assess whether the computational techniques applied are independent of the type of sensing device and its configuration.

3. Methods

The proposed method for recognizing gait activities is presented in Figure 1 and detailed below. The method is divided into two stages: (i) strides detection and (ii) gait classification. Data acquisition is detailed in Section 3.1. Once the data has been collected, the acceleration signals are segmented into strides (see Section 3.2). Finally, descriptive features are extracted from the signals in order to classify the gait activities, as it is detailed in Section 3.3.

3.1. Setup

Two devices that incorporate accelerometer sensors were used in data capturing. The first was a smartphone with the Android operating system using Physics Toolbox Suite (https://www.vieyrasoftware.net/) for acquiring acceleration data. The second was a LPMS-B2 miniature Inertial Measurement Unit (IMU) using LPMS-Control software (https://lp-research.com/software/) for recording acceleration data. The sampling rate of both devices was 200 Hz.
Seven test subjects (24–35 years) were asked the place where they typically carry their smartphone, and the majority answered that in the hand. For this reason, all subjects were asked to carry the smartphone in the right hand during capture sessions, while the IMU was firmly attached on the right ankle using an elastic band. All subjects declared not having any mobility impairment in their limbs. In Figure 2a, the IMU placed on the right ankle of a test subject is shown.
The gait activities to be performed were: (i) going down an incline, (ii) going up an incline, (iii) walking on level ground, (iv) going down stairs, and (v) going up stairs. The test subjects were asked to perform each activity three times at a speed comfortable to them. The environments to carry out the activities were the same for all subjects, two of them indoors (Figure 2c,d), and the other outdoors (Figure 2b). To start and finish a new trial it was required that the subjects remained in an anatomical position and performed a controlled movement to synchronize both devices.

3.2. Strides Detection

As mentioned earlier, strides are characterized by periodic movements of the limbs, so in this study they are used as a unit of analysis. At this stage, the acceleration signals captured during the test sessions are preprocessed and segmented according to the steps 1–3 in Figure 1. The complete description of the strides detection stage is detailed in Algorithm 1. This process for detecting strides is generic and can be applied to acceleration signals from the smartphone or IMU. Figure 3 shows the process for segmenting the acceleration signals a c c in strides using the data of a “walking on level ground” trial of a test subject.    
Algorithm 1: Summary of the strides segmentation stage.
Inputs:  a c c : time-series comprising three axes: { x , y , z } . a: filter coefficient. w: window size for searching strides.
Output:  a c c F D : Array of segmented forward-direction signal. a c c X Y Z : Array of segmented magnitude-vector of acceleration.
Notation:  F D signal representing forward-direction axis-signal. X Y Z magnitude vector of acceleration. S signal can be a c c x , a c c y , o a c c z .
Start
Preprocessing acceleration signals:
for time-series Sacc do
Proceedings 31 00060 i001
a c c F D s e g m e n t i n g ( F D , P b , P e ) ;
a c c X Y Z s e g m e n t i n g ( X Y Z , P b , P e ) ;
End
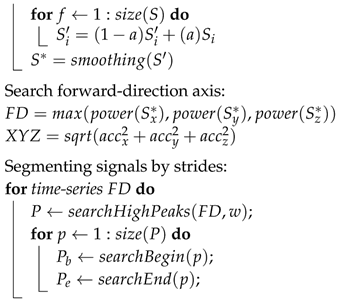
In the preprocessing step, a low-pass filter is applied to the acceleration signals a c c X ,   a c c Y ,   a c c Z of both devices, using the coefficient a which filters the highest frequencies. According to this filter, if the value of the coefficient is 1 the signal remains the same. The value of a directly depends on the magnitude of the signal to be filtered, which was manually selected at 0.05. The purpose of the filter is to avoid artifacts due to movement and to filter the noise in acceleration signals. A pseudo-Gaussian smoothing function is then applied to the filtered signals based on w window sliding-average. As an example, in Figure 3a,b the raw acceleration signals a c c and the filtered and smoothed signals S * are shown, respectively. The first step is applied to the three axes of acceleration.
Because the signal aligned with the sagittal plane of people is the one that records a greater magnitude of acceleration, a search is conducted to identify which of the three acceleration signals S x * ,   S y * ,   S z * has greater power (second step) and it will be labeled as the forward-direction signal a c c F D . In addition, the acceleration magnitude vector a c c X Y Z , also called magnitude of total acceleration, is calculated in order to use information of the three signals combined. This vector has been widely used as it is invariant to device rotations [23].
In the third step, the patterns in the forward-direction signal related to strides are searched. These patterns are consistent to the heel strike events included in a c c F D [13]. The high local maxima or peaks P are extracted using w as sample-rate. The value of w is related to the cadence of people, and a value of 200 frames was manually selected because the optimal cadence of young people, between 21–40 years, is 48 and 60 steps/min [24]. In Figure 3c the peaks related to strides in the a c c F D signal are shown. Finally, the a c c F D and a c c X Y Z signals are segmented based on the beginning P b and the end P e of each peak P. A simple way to find the limits of P is to search for the local minimums in the signals. The output of this stage is illustrated in Figure 3. The first and last strides were discarded in all trials because their anatomical characteristics with respect to the gait are atypical.

3.3. Gait Classification

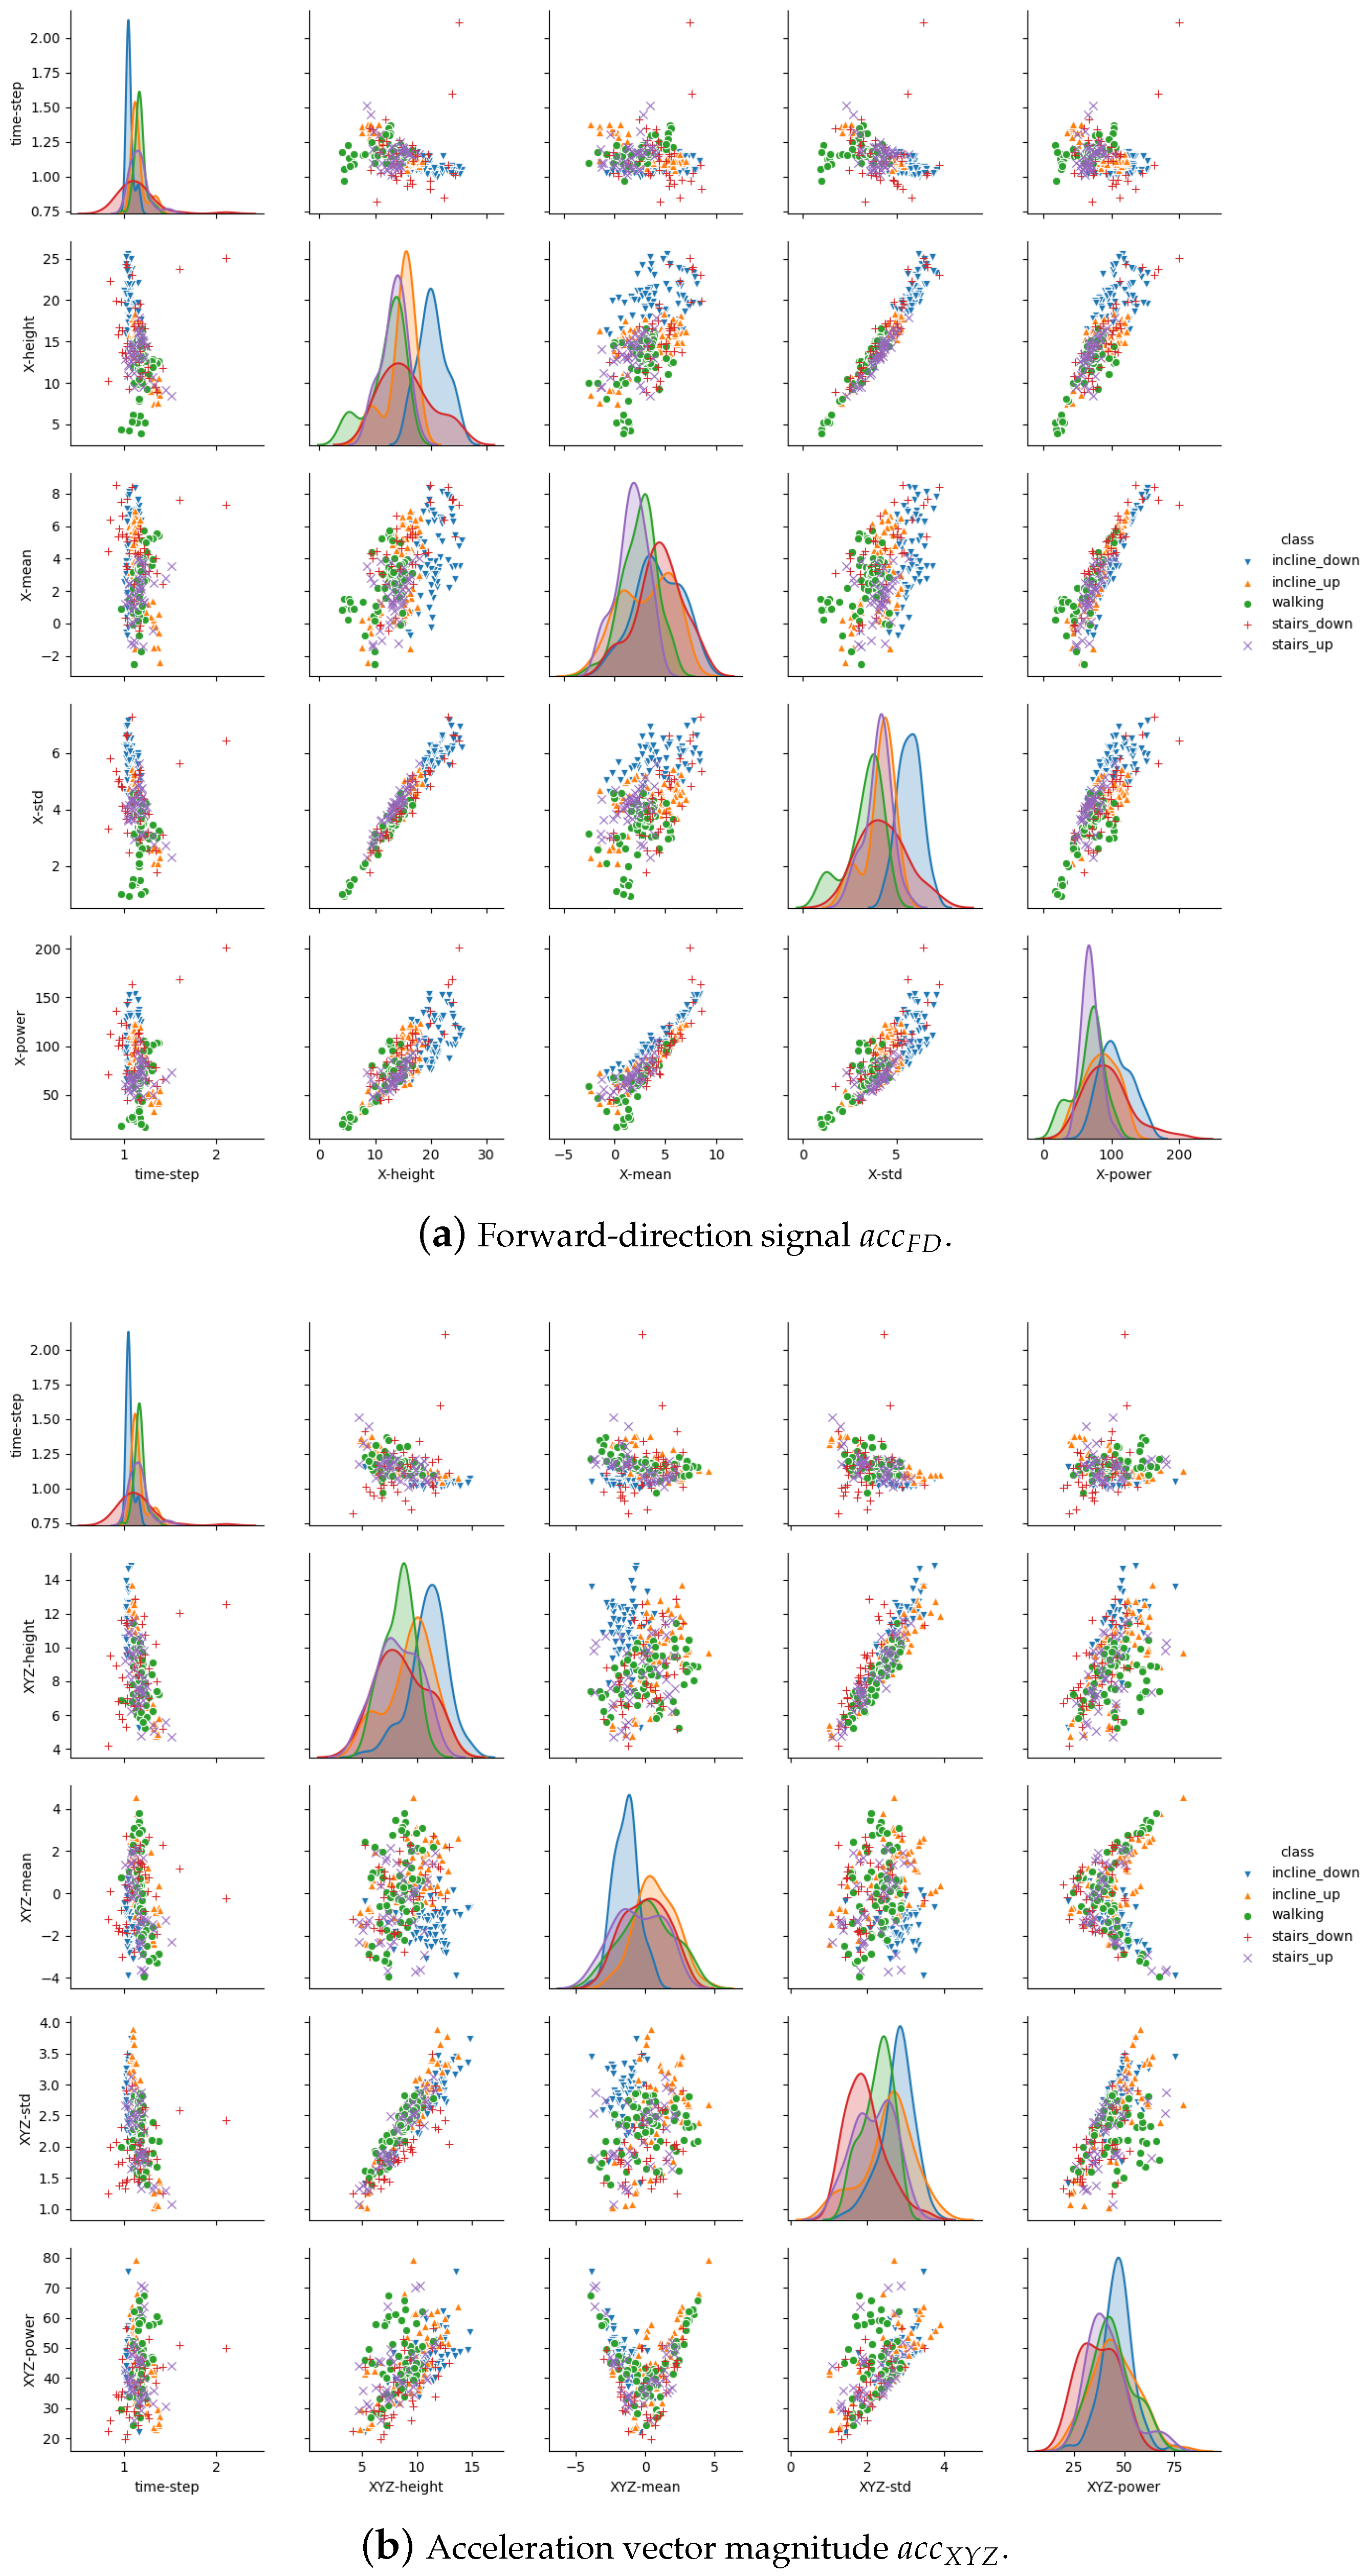
In the second stage, a supervised classification approach was implemented. Five descriptive features were extracted from each segment in the signals a c c F D and a c c X Y Z of both smartphone and IMU: (i) width of the peak ( t i m e _ s t e p ), (ii) height of the peak ( h e i g h t ), (iii) mean of the acceleration ( m e a n ), (iv) standard deviation of the acceleration ( s t d ), and (v) power of the acceleration ( p o w e r ). The 2D feature space for smartphone and IMU data are illustrated in Figure A1, Figure A2 of the Appendix A, respectively. As it can be noticed, data or instances of the “walking on level ground” activity can be seen more separable than the other activities from the different combinations of the features.
In the last step, the feature vectors of both smartphone and IMU acceleration data are used for building the gait activity classifiers. Four inference algorithms were selected because they are appropriate to deal with problems involving unbalanced data [25,26]. Naive Bayes (NB) classifier is a classification method founded on the Bayes theorem based on the estimated conditional probabilities [27]. C4.5 is a decision tree classifier that builds a binary classification tree; determined by a splitting criterion, features are selected as branching points that separate the two classes [28]. Support Vector Machines (SVM) classify unseen information by deriving selected features and constructing a high dimensional hyperplane to separate the data points into two classes [29]. K-Nearest Neighbors (KNN) is a non-parametric method that does not need any modeling or explicit training phase before the classification process [30].

4. Results and Discussion

In order to evaluate the gait classifiers, feature vectors were divided into three treatments: (i) including only features extracted from the forward-direction signal a c c F D , (ii) including only features extracted from the acceleration magnitude vector a c c X Y Z , and (iii) including both the a c c F D and a c c X Y Z signals. The treatments were the same for smartphone and IMU acceleration data as it is shown in Table 1. While the F D signal was used for segmenting the strides in F D and X Y Z , the feature t i m e s t e p is the same in treatments (i) and (ii). Data partition was made using leave-one-out cross-validation, which indicates that the classifiers were trained with the instances of six subjects (85.7% of instances) and tested with the instances of the remaining subject (14.3% of instances), repeating the process for the instances of each subject.
According to the classification results, the features extracted from the forward-direction signal improve the classification of the gait activities that when using the features extracted from the acceleration magnitude vector, both for smartphone data as for IMU data. In addition, in both cases, combining the characteristics of a c c F D and a c c X Y Z improves the correctly classified instances. In general, a better inter-class classification average is obtained using the IMU acceleration data, although the standard deviation is smaller for the smartphone acceleration data. These values can be confirmed in the box-plot shown in Figure 4. Regarding inference algorithms, in general, Naive Bayes and Support Vector Machines score the lowest results, while C4.5 and KNN score the best. In particular, features of the third treatment in combination with the KNN algorithm score the best results with 79.3% for the smartphone and 85.5% for the IMU.
For an in-depth analysis of the classification results for each gait activity, Table 2 shows the results of sensitivity (or true positive rate TPR) and specificity (or true negative rate (TNR)) for the treatment that includes a c c F D and a c c X Y Z features using the KNN algorithm.
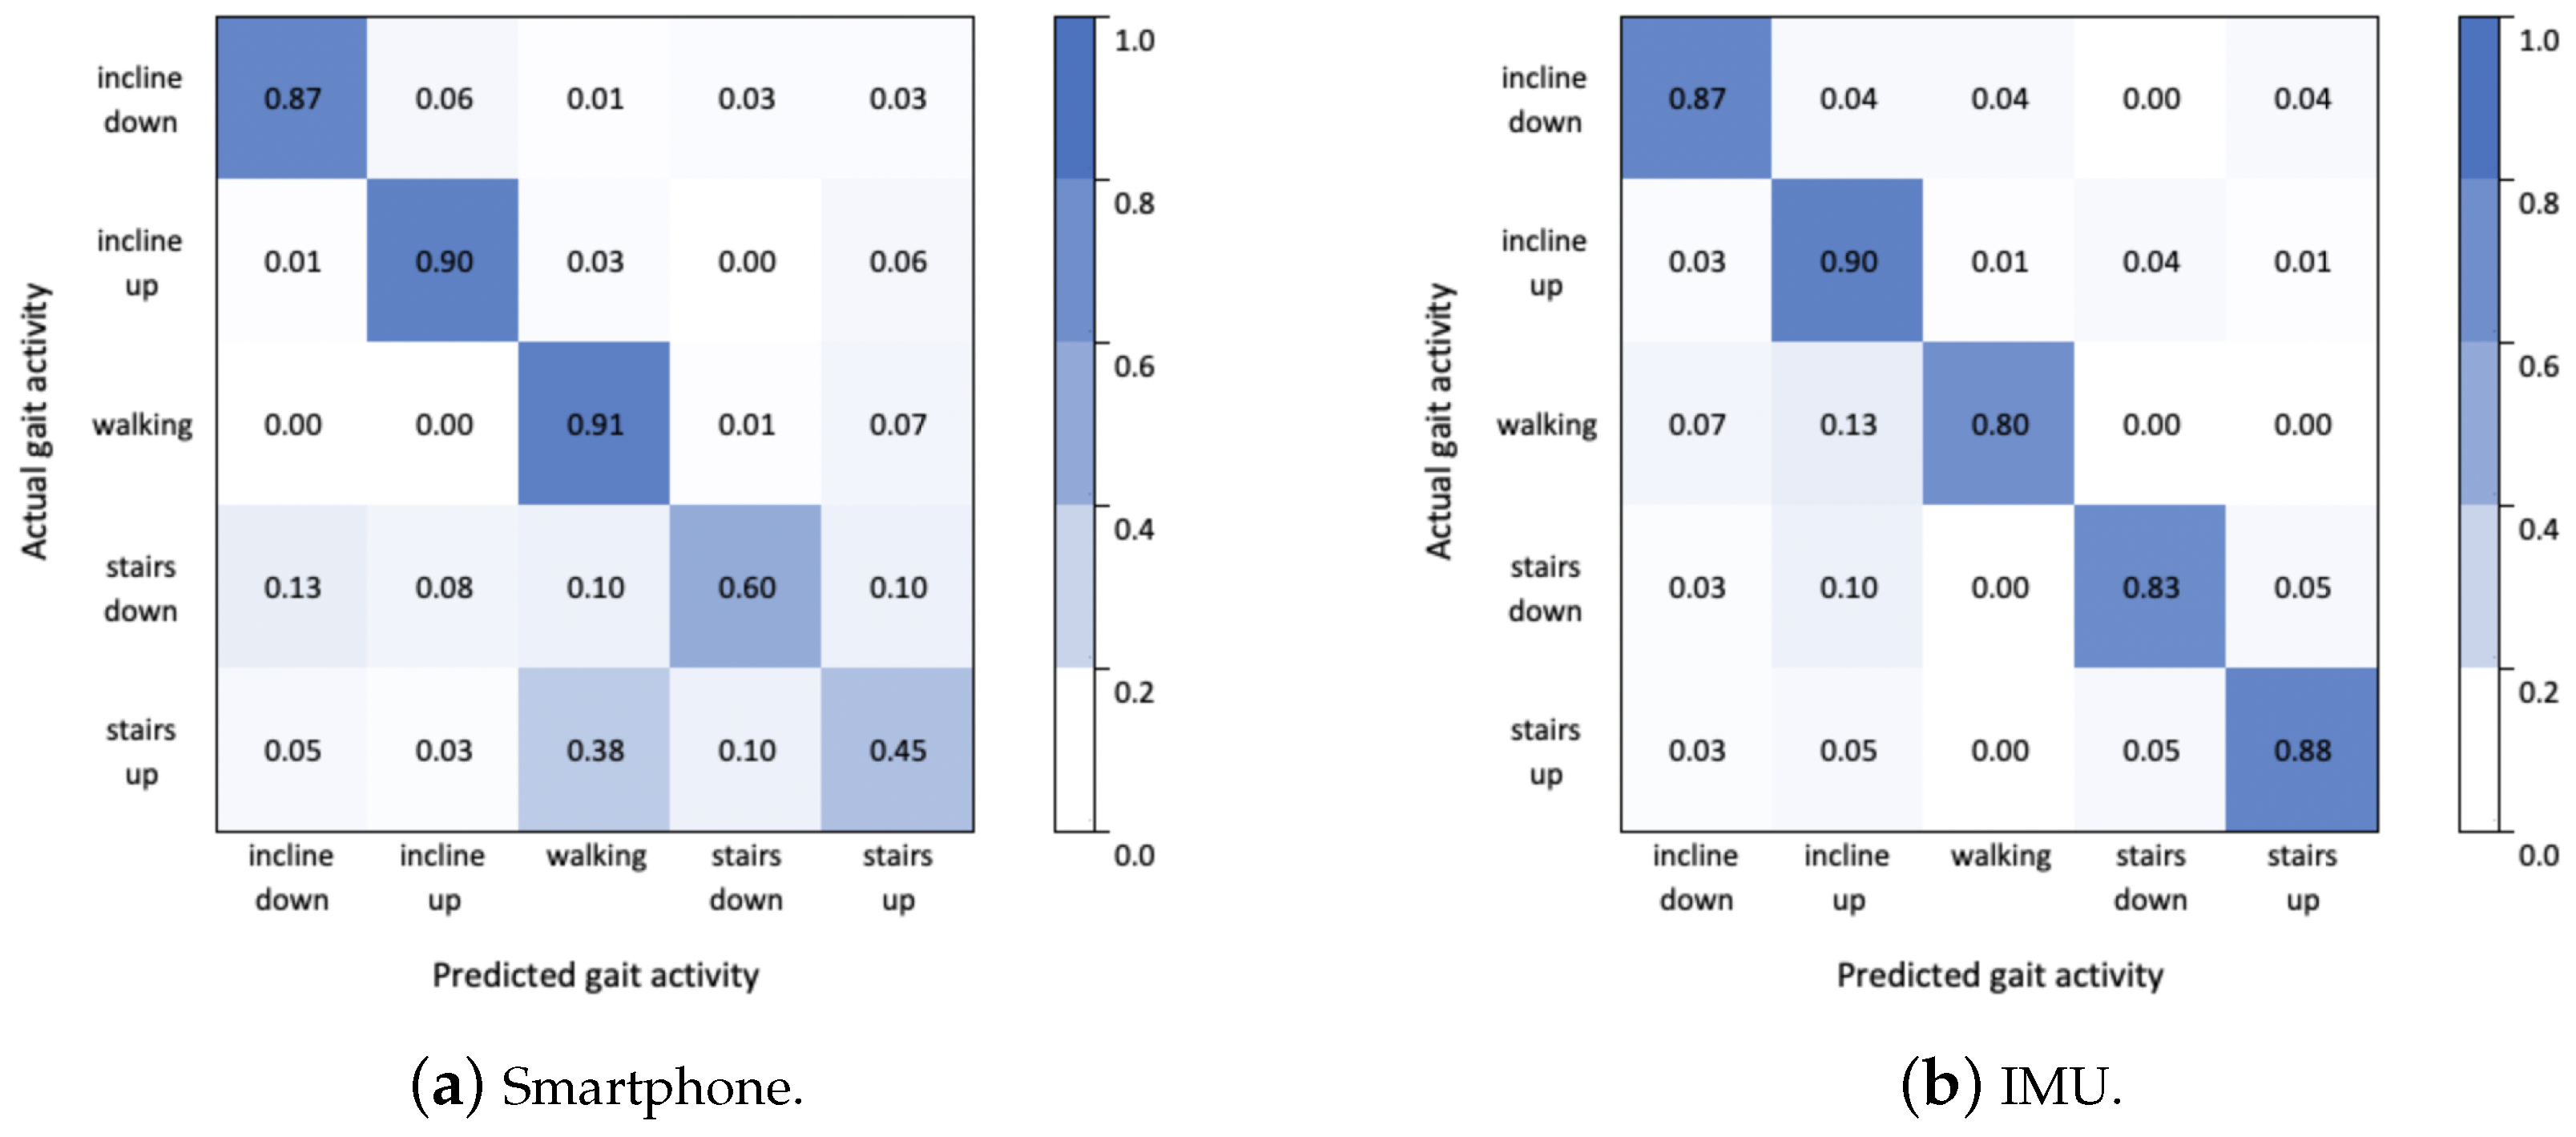
According to these two metrics and for the smartphone data, the activity “walking on level ground” has the best rate of true positives, while the activities of “going up stairs” and “going down stairs” score the worst record; in turn, “going down stairs” has the best specificity, which indicates that the instances of the other activities were not confused mainly with this class. Regarding IMU data, the two actions of “going up an incline” and “going down an incline” score the best sensitivity, while the activity “walking on level ground” scores the best true negative rate of all the records. These results can be observed in the confusion matrices presented in Figure 5.
As it can be seen in Figure 5a, the classification model was overfitted to the “walking on level ground” activity since it scores the highest sensitivity (0.914) but the lowest specificity (0.900) among the five classes. Therefore, despite the fact that the majority of their instances were correctly classified, there were also many instances of the “going down stairs” and “going up stairs” activities that were confused with this class; almost the same number of predicted instances of “going up stairs” (45%) were misclassified as “walking on level ground” (38%). On the other hand, misclassified instances of “walking on level ground” in Figure 5b were predicted as “going down an incline” (7%) or “going up an incline” (13%). Although acceleration data of smartphone scored the highest classification value individually (0.914), when using IMU data, classification values greater than 0.800 were obtained for all the actions.
One of the advantages of using KNN as an inference algorithm is that it is not necessary to parameterize the classification models, so it depends entirely on the training set. Another advantage is that it is easy to implement this algorithm for a multi-class problem. However, the efficiency of this algorithm declines as the size of the training set grows, thus an extra task could be needed for choosing the most representative instances before using the models. Another disadvantage of the KNN algorithm is that it is very sensitive to outliers, so the selection of the number of neighbors is important. The number of neighbors k selected was 5, which was chosen to be consistent with the number of classes, and Euclidean distance was selected as distance criteria.
Regarding the relevance of the studied features, they were ranked using Information Gain [31], which evaluates the worth of each feature by measuring the entropy with respect to the class, i.e., gait activities. According to this analysis, the most relevant features that coincided in both data (smartphone and IMU) were: (i) FD- s t d (0.641 and 0.798), (ii) FD- h e i g h t (0.662 and 0.516), and (iii) t i m e _ s t e p (0.538 and 0.471). New treatments, or data partitions, were generated and classifiers were constructed using KNN considering the five most relevant features for both sets, obtaining a correct classification rate of 64.1% and 77.9%, for smartphone and IMU data, respectively. In both cases, the results of the second treatment (58.6% and 75.9%) of Table 1 are improved, which corresponds to using only the features extracted from X Y Z , but they are less than the results of the first and third treatments, which corresponds to using the features extracted from F D (68.6% and 81.0%), and the combination of F D and X Y Z (79.3% and 85.5%). Therefore, the selection of relevant features did not help to improve the classification using the current data.
Finally, the results rely on the conditions of the study, i.e., the gait speed, the test subjects group, the environmental setting, among others. On the other hand, the proposed method is robust to the anatomical reference in which the sensing devices are carried or placed and to their rotation, as long as their position do not vary during the test session. Additionally, only the values of a and w have to be adapted in the preprocessing step; the first variable depends on the gait speed, and the second of the sampling rate.

5. Conclusions

In the present study, a method for recognition of gait activities was proposed based on the use of acceleration data of a commercial device widely adopted by the population (including seniors [32]), and a specialized low-cost device whose placement in the lower limb has been studied in the field [33]. These devices are a smartphone and an IMU, respectively.
This method of detecting gait that uses strides, or gait cycles, as a segmentation unit is independent of the sensing device of 3D acceleration. Currently, most portable devices incorporate a 3D acceleration sensor, from smartphones to lenses, such as Google Glass. Thus, we are considering to capture and evaluate acceleration data obtained by other commercial devices, such as smartwatches or fitness trackers.
The results obtained in this study are promising, and despite the conditions and limitations discussed previously, the gait activities studied are very similar to each other. This work is in development and the lessons learned will be used to improve the computational techniques applied. One of them to implement the method for online execution using the models learned. In addition, data from other populations will be collected, such as older adults, since the characteristics of their gait are different [34].

Author Contributions

Investigation and Writing, I.H.L.-N.; Review & Editing, M.G.-C. and J.F.

Funding

This research received no external funding.

Acknowledgments

We thank Jose Armando Menendez-Clavijo, Pablo Alberto Balboa-Trigo, and Adrian Acosta-Mitjans for their help in data capturing.

Conflicts of Interest

The authors declare no conflict of interest.

Abbreviations

The following abbreviations are used in this manuscript:
IMUInertial Measurement Unit
KNNK-Nearest Neighbors
NBNaive Bayes
SVMSupport Vector Machines
TNRTrue Negative Rate
TPRTrue Positive Rate

Appendix A. 2D Feature Space

Figure A1. Visualization of feature space in forward-direction signal (a) and acceleration vector magnitude (b) from smartphone data.
Proceedings 31 00060 g0a1
Figure A2. Visualization of feature space in forward-direction signal (a) and acceleration vector magnitude (b) from IMU data.
Proceedings 31 00060 g0a2

References

  1. Lawton, M.; Brody, E. Assessment of older people: Self-maintaining and instrumental activities of daily living. Gerontologist 1969, 9, 179–186. [Google Scholar] [CrossRef] [PubMed]
  2. Katz, S. Assessing self-maintenance: Activities of daily living, mobility, and instrumental activities of daily living. J. Am. Geriatr. Soc. 1983, 31, 721–727. [Google Scholar] [CrossRef] [PubMed]
  3. Lara, O.D.; Labrador, M.A. A survey on human activity recognition using wearable sensors. IEEE Commun. Surv. Tutor. 2013, 15, 1192–1209. [Google Scholar] [CrossRef]
  4. Shoaib, M.; Bosch, S.; Incel, O.; Scholten, H.; Havinga, P. A survey of online activity recognition using mobile phones. Sensors 2015, 15, 2059–2085. [Google Scholar] [CrossRef] [PubMed]
  5. Kirtley, C. Clinical Gait Analysis: Theory and Practice; Elsevier: Philadelphia, PA, USA, 2006. [Google Scholar]
  6. Haworth, J.M. Gait, aging and dementia. Rev. Clin. Gerontol. 2008, 18, 39–52. [Google Scholar] [CrossRef]
  7. Howe, C.; Saleh, A.; Mohler, J.; Grewal, G.; Armstrong, D.; Najafi, B. Frailty and Technology: A Systematic Review of Gait Analysis in Those with Frailty. Gerontology 2014, 60, 79–89. [Google Scholar]
  8. Gupta, J.P.; Singh, N.; Dixit, P.; Semwal, V.B.; Dubey, S.R. Human activity recognition using gait pattern. Int. J. Comput. Vis. Image Process. (IJCVIP) 2013, 3, 31–53. [Google Scholar] [CrossRef]
  9. Xiong, G.; Cheng, J.; Wu, X.; Chen, Y.L.; Ou, Y.; Xu, Y. An energy model approach to people counting for abnormal crowd behavior detection. Neurocomputing 2012, 83, 121–135. [Google Scholar] [CrossRef]
  10. Riva, F.; Toebes, M.; Pijnappels, M.; Stagni, R.; Van Dieen, J. Estimating fall risk with inertial sensors using gait stability measures that do not require step detection. Gait Posture 2013, 38, 170–174. [Google Scholar] [CrossRef]
  11. Everett, T.; Kell, C. Human Movement E-Book: An Introductory Text; Elsevier: Amsterdam, The Netherlands, 2010. [Google Scholar]
  12. López-Nava, I.H.; Muñoz-Meléndez, A. Towards ubiquitous acquisition and processing of gait parameters. In Mexican International Conference on Artificial Intelligence; Springer: Berlin/Heidelberg, Germany, 2010; pp. 410–421. [Google Scholar]
  13. López-Nava, I.; Muñoz-Meléndez, A.; Sanpablo, A.P.; Montero, A.A.; Urióstegui, I.Q.; Carrera, L.N. Estimation of temporal gait parameters using Bayesian models on acceleration signals. Comput. Methods Biomech. Biomed. Eng. 2016, 19, 396–403. [Google Scholar] [CrossRef]
  14. Aggarwal, J.K.; Xia, L. Human activity recognition from 3d data: A review. Pattern Recognit. Lett. 2014, 48, 70–80. [Google Scholar] [CrossRef]
  15. Ke, S.R.; Thuc, H.; Lee, Y.J.; Hwang, J.N.; Yoo, J.H.; Choi, K.H. A review on video-based human activity recognition. Computers 2013, 2, 88–131. [Google Scholar] [CrossRef]
  16. Zolfaghari, S.; Keyvanpour, M.R. SARF: Smart activity recognition framework in Ambient Assisted Living. In Proceedings of the IEEE 2016 Federated Conference on Computer Science and Information Systems (FedCSIS), Gdansk, Poland, 11–14 September 2016; pp. 1435–1443. [Google Scholar]
  17. Fortino, G.; Gravina, R.; Li, W.; Ma, C. Using Cloud-assisted Body Area Networks to Track People Physical Activity in Mobility. In Proceedings of the 10th EAI International Conference on Body Area Networks (BodyNets ’15), Sydney, New South Wales, Australia, 28–30 September 2015; ICST (Institute for Computer Sciences, Social-Informatics and Telecommunications Engineering). pp. 85–91. [Google Scholar]
  18. Mukhopadhyay, S.C. Wearable sensors for human activity monitoring: A review. IEEE Sensors J. 2014, 15, 1321–1330. [Google Scholar] [CrossRef]
  19. Lee, S.M.; Yoon, S.M.; Cho, H. Human activity recognition from accelerometer data using Convolutional Neural Network. In Proceedings of the IEEE International Conference on Big Data and Smart Computing (BigComp), Jeju, Korea, 13–16 February 2017; pp. 131–134. [Google Scholar]
  20. Derawi, M.; Bours, P. Gait and activity recognition using commercial phones. Comput. Secur. 2013, 39, 137–144. [Google Scholar] [CrossRef]
  21. He, Z.; Jin, L. Activity recognition from acceleration data based on discrete consine transform and SVM. In Proceedings of the 2009 IEEE International Conference on Systems, Man and Cybernetics, San Antonio, TX, USA, 11–14 October 2009; pp. 5041–5044. [Google Scholar]
  22. Guiry, J.J.; van de Ven, P.; Nelson, J.; Warmerdam, L.; Riper, H. Activity recognition with smartphone support. Med Eng. Phys. 2014, 36, 670–675. [Google Scholar] [CrossRef] [PubMed]
  23. O’Donovan, K.J.; Kamnik, R.; O’Keeffe, D.T.; Lyons, G.M. An inertial and magnetic sensor based technique for joint angle measurement. J. Biomech. 2007, 40, 2604–2611. [Google Scholar] [CrossRef] [PubMed]
  24. Tudor-Locke, C.; Aguiar, E.J.; Han, H.; Ducharme, S.W.; Schuna, J.M.; Barreira, T.V.; Moore, C.C.; Busa, M.A.; Lim, J.; Sirard, J.R.; et al. Walking cadence (steps/min) and intensity in 21–40 year olds: CADENCE-adults. Int. J. Behav. Nutr. Phys. Act. 2019, 16, 8. [Google Scholar] [CrossRef]
  25. Sun, Y.; Wong, A.K.; Kamel, M.S. Classification of imbalanced data: A review. Int. J. Pattern Recognit. Artif. Intell. 2009, 23, 687–719. [Google Scholar] [CrossRef]
  26. Liu, X.Y.; Wu, J.; Zhou, Z.H. Exploratory undersampling for class-imbalance learning. IEEE Trans. Syst. Man Cybern. Part (Cybernetics) 2009, 39, 539–550. [Google Scholar]
  27. Friedman, N.; Geiger, D.; Goldszmidt, M. Bayesian network classifiers. Mach. Learn. 1997, 29, 131–163. [Google Scholar] [CrossRef]
  28. Quinlan, J.R. C4.5: Programs for Machine Learning; Elsevier: Amsterdam, The Netherlands, 2014. [Google Scholar]
  29. Cortes, C.; Vapnik, V. Support-vector networks. Mach. Learn. 1995, 20, 273–297. [Google Scholar] [CrossRef]
  30. Keller, J.M.; Gray, M.R.; Givens, J.A. A fuzzy k-nearest neighbor algorithm. IEEE Trans. Syst. Man Cybern. 1985, SMC-15, 580–585. [Google Scholar] [CrossRef]
  31. Greven, A.; Keller, G.; Warnecke, G. Entropy; Vol. 47; Princeton University Press, 2014. [Google Scholar]
  32. Berenguer, A.; Goncalves, J.; Hosio, S.; Ferreira, D.; Anagnostopoulos, T.; Kostakos, V. Are Smartphones Ubiquitous?: An in-depth survey of smartphone adoption by seniors. IEEE Consum. Electron. Mag. 2016, 6, 104–110. [Google Scholar] [CrossRef]
  33. Caldas, R.; Mundt, M.; Potthast, W.; de Lima Neto, F.B.; Markert, B. A systematic review of gait analysis methods based on inertial sensors and adaptive algorithms. Gait Posture 2017, 57, 204–210. [Google Scholar] [CrossRef] [PubMed]
  34. Fontecha, J.; Gonzalez, I.; Hervas, R.; Bravo, J. Human gait analysis for frailty detection-quantitative techniques and procedures. In Active and Assisted Living: Technologies and Applications; Healthcare Technologies, Institution of Engineering and Technology: London, UK, 2016; pp. 179–202. [Google Scholar]
Figure 1. Proposed gait recognition method. This method is divided into two stages: (i) strides detection (steps 1–3) and (ii) gait classification (steps 4–5).
Proceedings 31 00060 g001
Figure 2. Setup of the experiment: the Inertial Measurement Unit (IMU) configuration (a) and the environments in which the gait activities were performed (b)–(d).
Proceedings 31 00060 g002
Figure 3. Data flow in strides segmentation process. Raw acceleration signals a c c X ,   a c c Y ,   a c c Z (a) are filtered and smoothed (b). Then, strides are estimated (c) and used for segmenting forward-direction F D and acceleration magnitude vector X Y Z signals (d).
Proceedings 31 00060 g003
Figure 4. Comparison of classification results using smartphone and IMU data from Table 1.
Proceedings 31 00060 g004
Figure 5. Confusion matrices for KNN classifiers built using the data treatment a c c F D + a c c X Y Z from smartphone (a) and IMU (b).
Proceedings 31 00060 g005
Table 1. Correctly classified instances (%) using acceleration data from smartphone and IMU. NB: Naive Bayes; SVM: Support Vector Machines; and KNN: K-Nearest Neighbors.
DeviceTreatmentFeaturesNBC4.5SVMKNNAvg ( σ )
Smartphone a c c F D 553.467.650.368.660.0 (9.5)
a c c X Y Z 552.861.450.058.655.7 (5.2)
a c c F D + a c c X Y Z 961.063.861.479.366.4 (8.7)
IMU a c c F D 560.063.858.681.067.1 (10.3)
a c c X Y Z 550.768.649.775.961.2 (13.1)
a c c F D + a c c X Y Z 959.768.663.885.569.4 (11.4)
Table 2. Classification results for each gait activity using the data treatment a c c F D + a c c X Y Z and the KNN algorithm. TPR = true positive rate; TNR =true negative rate.
SmartphoneIMU
Gait ActivityTPRTNRTPRTNR
Going down an incline0.8710.9640.8710.959
Going up an incline0.9000.9640.9000.918
Walking on level ground0.9140.9000.8000.982
Going down stairs0.6000.9720.8250.980
Going up stairs0.4500.9400.8750.976
Weighted average0.7930.9460.8550.960