Article

Responses of Winter Barley Genotypes to Low Nitrogen Supply Under Rainfed Conditions

1
Department of Breeding Small Cereals, National Agricultural Research and Development Institute Fundulea, 915200 Fundulea, Romania
2
Department of Spring Barley Breeding, Agricultural Research and Development Station Turda, 401100 Turda, Romania
3
Department of Technical Economic Sciences, Faculty of Management, Marketing in Economic Business, Constantin Brâncoveanu University of Pitești, 247415 Râmnicu Vâlcea, Romania
4
Department of Plant Breeding, Faculty of Agriculture, University of Agricultural Sciences and Veterinary Medicine Cluj-Napoca, 400372 Cluj-Napoca, Romania
*
Authors to whom correspondence should be addressed.
These authors contributed equally to this work.
Nitrogen 2026, 7(3), 104; https://doi.org/10.3390/nitrogen7030104
Submission received: 12 August 2026 / Revised: 10 September 2026 / Accepted: 14 September 2026 / Published: 16 September 2026

Abstract

Reducing nitrogen inputs while maintaining grain yield and quality is an important objective for sustainable barley production. This study evaluated 39 winter barley genotypes (20 six-row and 19 two-row) under two N management treatments following pea as the preceding crop during two contrasting growing seasons (2021–2022 and 2022–2023) under rainfed conditions. Both treatments received the same basal fertilization, while the fertilized treatment received an additional 46 kg N ha−1 as urea. Yield response to additional N differed between barley types and growing seasons. In six-row barley, grain yield increased by 5.9% in 2021–2022 but decreased by 4.8% in 2022–2023, whereas two-row barley maintained positive responses of 7.9% and 5.9%, respectively. Additional N consistently increased grain protein content by 17.2–21.7% in six-row and 17.1–19.0% in two-row barley, while starch content decreased in both barley types. NDVI generally increased following additional N application. GGE biplot analysis revealed substantial genotypic variation in performance and response across the four year × nitrogen combinations evaluated at the experimental location. Overall, two-row barley showed a more consistent yield response to additional N across the two growing seasons, while the identified genotypic variation provides useful material for selecting winter barley adapted to reduced N inputs following a legume preceding crop.

1. Introduction

Barley (Hordeum vulgare L.) is one of the major cereal crops worldwide and is widely used for human consumption, animal feed, and the malting industry [1]. Due to its high adaptability to abiotic stress conditions, particularly low temperatures, drought, and salinity, barley can be successfully grown as a winter cereal, ensuring relatively stable yields in areas where other crops, such as maize or rice, have limited adaptability and survival capacity [2]. The combination of high adaptability to diverse environmental conditions, a relatively short growing period, and stable yield potential gives barley considerable agronomic and economic importance in both temperate and semi-arid agricultural systems [3]. Improving the productivity and quality of winter barley requires increased attention to soil tillage systems and nutrient management. This need is justified by the fundamental role of soil as one of the most important natural resources and an essential medium for plant growth and development [4]. Nutrient deficiency, particularly nitrogen and phosphorus deficiency, is one of the most common constraints affecting soil fertility and directly influences yield levels. Maintaining soil fertility and health requires the balanced application of nitrogen, phosphorus, and potassium (N, P, and K) fertilizers at rates adapted to crop requirements [5]. Phosphorus contributes to photosynthesis and respiration and plays a key role in energy transfer and storage, as well as in cell division and expansion. Potassium is important for maintaining photosynthetic efficiency and facilitating the translocation of photosynthates to storage organs. Among these nutrients, N is one of the essential macronutrients for plant growth [6] and is required for chlorophyll synthesis and numerous physiological and biochemical processes that support plant development. As a primary nutrient, N plays an essential role in the metabolic processes of barley plants and is a key component of proteins and amino acids. In a field experiment evaluating three barley varieties, N application at 40–120 kg N ha−1 increased grain yield by approximately 57–74% relative to a 0 N control [7]. Both grain yield and protein content are closely related to available N levels, while nitrogen utilization may vary among genotypes [7]. In addition, an adequate N supply promotes root growth and enhances the plant’s ability to absorb other essential nutrients from the soil [5]. Efficient N management therefore requires a balance between crop demand and nutrient supply, contributing to efficient resources use, adequate crop productivity, and reduced adverse environmental impacts [8]. In the context of effective crop fertilization decisions, non-destructive methods for assessing plant N status provide valuable information on the physiological condition of plants and their nutrient requirements at different growth stages. Due to their speed and accuracy, these methods are increasingly used in precision agriculture for crop monitoring. Breeding barley varieties with improved N use efficiency represents an effective strategy for reducing fertilizer inputs, production costs, and the environmental impact associated with inappropriate N use [6,9,10].
The response of barley to N supply depends on both the amount of N available and the genotype. McKenzie et al. (2004) demonstrated that yield increased with N fertilizer application only up to a certain level, after which it reached a plateau and subsequently remained stable or declined as the application rate increased [11]. Thousand-kernel weight (TKW) generally follows an “inverted U” pattern with increasing N supply. Moderate N levels initially increase TKW by sustaining leaf area duration and photosynthetic capacity, resulting in larger and plumper grains. However, higher N inputs often lead to a reduction in TKW, as N resources are distributed across a larger number of tillers and greater vegetative biomass. In some studies, N application rates within the range of 100–180 kg N ha−1 have been associated with increased vegetative growth and reduced grain size [12,13]. However, whether such rates are excessive depends on factors such as baseline soil N availability, seasonal precipitation, yield potential, and genotype. Each morphological (plant height and biomass), physiological (nitrogen, ultraviolet radiation, and photosynthetically active radiation), quantitative (yield), and qualitative (TKW, protein content, and starch content) parameter is closely linked to the carbon-to-nitrogen (C:N) balance [14]. Among the three studied parameters, the effects of N on the morphology and biochemistry of four barley varieties were reported to be associated with the carbon-to-nitrogen balance in leaves. An imbalance in the carbon-to-nitrogen ratio caused by high CO2 levels interferes with N metabolism in barley as vegetative development progresses, while heat stress hinders grain formation and limits grain quality [15]. According to this recent study, barley grain protein yield under future abiotic stress conditions, particularly drought, may be affected by the combined effects of elevated CO2 and temperature. The level of N supply directly influences the protein-to-starch ratio in barley grains, triggering a metabolic shift between carbon allocation and N assimilation. The protein-to-starch ratio changes significantly depending on the level of N applied, with higher N rates favoring protein synthesis at the expense of starch accumulation [16]. Low N levels result in relatively stable starch content, as carbon skeletons are primarily allocated to carbohydrate structures. At the same time, grain protein accumulation is limited, resulting in a lower protein-to-starch ratio. A moderate N supply optimizes both carbon assimilation for starch biosynthesis, and N metabolism for amino acid synthesis. In terms of enzymatic activity, soluble starch synthase and granule-bound starch synthase function optimally, resulting in well-developed, plump grains [16,17]. These relationships indicate that N management affects not only barley productivity but also important grain quality characteristics.
Non-destructive assessment of crop N status may provide additional information for improving N management. Among modern technologies, portable sensors have proven to be effective tools for evaluating crop vigor under field conditions. The Normalized Difference Vegetation Index (NDVI), measured using the GreenSeeker sensor, is a useful tool for identifying and quantifying N excess or deficiency [18]. For crops such as maize, wheat, and rice, significant correlations have been reported between NDVI values and leaf N concentration. These two parameters are closely related because leaf N content influences the amount of light absorbed and reflected by the canopy, while N is an essential component of chlorophyll and therefore contributes to leaf color. In 2011, Cabrera-Bosquet et al. reported that NDVI had already been used in breeding programs to assess N content and that N content could be accurately predicted using this approach [19]. NDVI is also particularly useful because it allows a large number of measurements to be performed under different environmental conditions and can therefore be used as an indirect selection criterion in breeding programs. Seven years later, NDVI had become widely used for assessing crop yield, photosynthetic activity, and N status. Mirosavljević et al. (2018) demonstrated a relationship between variation in NDVI values and grain yield in two-row barley [20]. Hammad et al. (2025) used handheld sensor-based NDVI measurements as a non-destructive method to monitor crop growth and assess yield in maize, as NDVI can serve as an indicator of plant water and N requirements under semi-arid conditions [8]. Furthermore, NDVI has proven to be a useful tool for assessing forage yield potential in red clover germplasm [21]. The GreenSeeker sensor displays the measured NDVI value directly on its screen and allows rapid assessment of crop status, with readings ranging from 0.00 to 0.99. Measurements should be performed while avoiding a wet crop canopy. GreenSeeker-derived NDVI has been used in barley to assess canopy reflectance and has shown significant relationships with crop N uptake and grain yield, supporting its use as a non-destructive indicator of crop response to nitrogen supply [22].
The N requirement of barley may also be influenced by the preceding crop. Depending on tillage practices and the applied crop management system, biologically fixed N in pea can account for more than 80% of the N utilized by the plants, while contributing an average of 25–35 kg N ha−1 to the soil [23]. Given the amount of N supplied to the soil by pea (Pisum sativum L.), breeders can evaluate how different breeding lines allocate carbon and N under varying levels of N supply [24]. In a winter barley breeding program, evaluating genotypes for N use efficiency and their protein-to-starch response following pea as the preceding crop may provide useful selection criteria for identifying promising genetic material for reduced-N conditions [25]. Moreover, barley growth and yield may be influenced by spike type [26], providing a rationale for evaluating six-row and two-row genotypes separately under the same N management conditions. However, the comparative response of six-row and two-row winter barley genotypes to reduced N supply following pea as the preceding crop remains insufficiently documented, particularly in terms of agronomic performance, grain protein and starch content, and NDVI under contrasting growing conditions. Therefore, this study aimed to evaluate how reduced nitrogen fertilization following pea as the preceding crop affects agronomic performance, grain quality, and relationships among traits in six-row and two-row barley across two contrasting growing seasons.

2. Materials and Methods

2.1. Winter Barley Genotypes

The biological material used in this study was developed at the National Agricultural Research and Development Institute Fundulea (NARDI Fundulea), Romania, within the framework of the barley breeding program, which employed two breeding methods (pedigree and haploidy) over the breeding period from 1992 to 2023. A total of 39 winter barley genotypes (20 six-row and 19 two-row) were evaluated over two consecutive growing seasons (2021–2022 and 2022–2023), which differed in meteorological conditions, and under two technological sequences. Of the 20 six-row winter barley genotypes, 12 were varieties, and 8 were advanced breeding lines. Of the 19 two-row winter barley genotypes, 5 were varieties and 14 were advanced breeding lines. The list of winter barley genotypes used in this study, together with their year of release and breeding method, is presented in Supplementary Table S1.

2.2. Technological Sequences, Phenotypic and Agronomic Traits

The experiments involved winter barley genotypes (varieties and advanced breeding lines) sown in 5 m2 plots (eight rows, with 12.5 cm between rows), in three replicates, arranged in a triple balanced grid design. Autumn seedbed preparation involved one disc cultivation pass to a depth of 10–15 cm, followed by one harrow pass. A final harrow pass, performed perpendicular to the sowing direction, ensured a uniform sowing depth of 3 cm. A single application of 200 kg ha−1 DAP (diammonium phosphate) fertilizer (N:P:K 18:46:0, containing at least 18% NH3 and 46% P2O5) was applied one day before the final harrow pass. Sowing was carried out during the third decade of October at a target density of 350 seeds/m2. Harvesting took place during the second decade of June in the first growing season and during the first decade of July in the second growing season. Autumn weed control consisted of a pre-emergence application of Stomp Aqua 455 CS herbicide (3 L/ha, based on pendimethalin) applied two days after sowing. Spring treatments included one herbicide, Axial One (1 L/ha, based on cloquintocet-mexyl, florasulam, and pinoxaden), applied during stem elongation. Two fungicide applications were carried out after flowering. In 2022, Mizona 230 EC (based on fluxapyroxad and pyraclostrobin) and Falcon Pro EC 425 (prothioconazole, spiroxamine, and tebuconazole) were applied. In 2023, Nativo Pro (prothioconazole and trifloxystrobin) and Falcon Pro EC 425 were used. At the beginning of stem elongation in each growing season, 100 kg ha−1 urea (46% N corresponding to 46 kg N ha−1) was applied using a fertilizer spreader. Two technological sequences were evaluated: an unfertilized treatment (peas as the previous crop only) and a fertilized treatment with a low nitrogen supply (peas as the previous crop + 100 kg ha−1 commercial urea containing 46% N, applied as a single dose). No irrigation was applied during the growing season (Table 1). Throughout the manuscript, “unfertilized” refers to the treatment without additional spring N application, whereas “fertilized” refers to the treatment receiving an additional 46 kg N ha−1 as urea at the beginning of stem elongation.
The measured traits included the Normalized Difference Vegetation Index (NDVI1 and NDVI2 at BBCH ≥ 50 and BBCH ≥ 77 [27]), recorded at 125 and 135 days after sowing using a GreenSeeker handheld crop sensor (Trimble, Westminster, CO, USA); plant height (PLH, cm), measured with a ruler from the base of the plant to the tip of the ear (excluding awns) at BBCH ≥ 69 and expressed in cm; grain yield (YLD, kg ha−1, adjusted to 14% moisture), determined using a Wintersteiger experimental plot combine (WINTERSTEIGER AG, Ried im Innkreis, Austria); thousand-kernel weight (TKW, g), determined by counting 1000 kernels using a Contador seed counter (Pfeuffer GmbH, Kitzingen, Germany) and weighting each sample with a precision electronic balance (0.01 g accuracy); grain protein content (GPC, %); and starch content (STA, %), both determined separately for each field replication. After harvest, weighing, and sample conditioning, one 500 g grain sample was collected from each of the three replications and analyzed independently using an Infratec 1241 analyser (FOSS, Hillerød, Denmark). Accordingly, the three measurements represented independent biological replicates rather than technical subsamples.

2.3. Climatic Conditions and Soil Type

NARDI Fundulea is located in the eastern part of the Romanian Plain, in the transitional zone between the Vlăsia Plain and the Southern Bărăgan Plain, along the Mostiștea River, at 44°27′45″ N latitude and 26°31′35″ E longitude, at an elevation of 68 m above sea level. The climate is continental, with a mean annual temperature of 10 °C. January is the coldest month, with an average temperature of −3 °C, while July is the warmest, with an average temperature of 22 °C and an absolute maximum temperature of 41 °C. The 60-year average annual precipitation is 584 mm, of which 72% falls during the growing season, particularly in May and June. Only 35% of the total annual precipitation occurs during summer, often in the form of torrential rainfall. The frequency of drought years exceeds 40%. Dry spells lasting 10–14 days frequently occur during May and June (totaling approximately 30 days), as well as in early spring and, particularly, in early autumn. Winters are generally characterized by low snowfall. Meteorological data, including the 60-year average annual precipitation and mean annual temperature, as well as those recorded during the 2021–2022 and 2022–2023 growing seasons, were obtained from the NARDI Fundulea weather station (Table 2).
Rainfall during the two winter barley growing seasons showed considerable variation (Table 2). The total amount of rainfall from October to July in 2021–2022 was 316.8 mm, which was 169.3 mm lower than the 60-year average. During this growing season, positive deviations from the long-term average were recorded only in October (+14.1 mm) and April (+2.5 mm). Importantly, the rainfall in October ensured uniform plant emergence. However, precipitation in May (heading and flowering) and June (grain filling) was lower than the long-term average.
During the same period in 2022–2023, the total rainfall was 320.2 mm, only 3.4 mm higher than in the previous growing season. However, precipitation was unevenly distributed throughout the growing season. During plant emergence in October, rainfall was very low (only 5.2 mm). In contrast, April again recorded higher precipitation than the long-term average, whereas June was characterized by considerably lower rainfall (19.4 mm less than in the previous year). The highest monthly precipitation was recorded in April, with 77.2 mm. Thus, the first growing season (2021–2022) was characterized by high rainfall during plant emergence and relatively higher precipitation during grain filling, whereas the second growing season (2022–2023) was characterized by higher rainfall in January, before vegetative growth resumed, and in April, during stem elongation.
Mean air temperature also varied between the two growing seasons (Table 2). In 2021–2022, with the exception of October, when the average temperature was 1.1 °C lower than the 60-year average, monthly temperatures throughout the growing season were higher than the long-term average. In addition, the average monthly temperatures in January and February were above 0 °C. During the 2022–2023 growing season, the average monthly temperatures were higher than both those recorded in the previous year and the 60-year average. It is noteworthy that both growing seasons were considerably warmer than the long-term average. Moreover, average monthly temperatures increased from the first to the second year, with an average increase of 1.9 °C in 2021–2022 and 2.8 °C in 2022–2023 compared with the 60-year average. These higher temperatures coincided with substantially lower precipitation during the growing season, particularly in May (−32.4 mm in 2022 and −30.1 mm in 2023 relative to the 60-year average) and June (−15.3 mm in 2022 and −34.7 mm in 2023). Variations in precipitation and temperature during the barley growing season can have a significant effect on soil water use, as well as on nitrogen uptake and its efficient utilization by plants [28].
Regarding the soil, the transition from steppe to forest-steppe conditions has led to the formation of a cambic chernozem, with groundwater located at a depth of 10–12 m. The soil is characterized by an Ap horizon (0–27 cm) with a silty clay loam texture, a clay content of 36.5%, and a compact structure, as indicated by a bulk density of 1.41 g/cm3 [29]. From an agrochemical perspective, the soil contained 3.51% humus, was well supplied with phosphorus (51.22 mg/kg soil) and potassium (235.33 mg/kg soil), had a pH of 5.87, and a total nitrogen (Nt) content of 0.194%.

2.4. Statistical Analysis and Data Processing

All statistical analyses were performed separately for six-row and two-row barley using R software (version 4.6.1; R Foundation for Statistical Computing, Vienna, Austria) [30] within the RStudio environment (version 2026.06.0; Posit Software, PBC, Boston, MA, USA) [31]. Type III analyses of variance (ANOVA) were performed using the car package (version 3.1.5.) [32]. The statistical model included replicate as a blocking factor and the fixed effects of growing season (Year), nitrogen fertilization (Fertilization), genotype (Genotype), and all two-way and three-way interactions:
Y i j k l = µ + R i + Y j + F k + G l + ( Y × F ) j k + ( Y × G ) j l + ( F × G ) k l + ( Y × F × G ) j k l + ε i j k l
where μ is the overall mean, R is replicate, Y is growing season, F is fertilization treatment, G is genotype, and ε is the residual error. The assumptions of the ANOVA models were assessed by visual inspection of residual-versus-fitted plots and normal Q–Q plots of the model residuals. These diagnostic plots were examined for major deviations from normality and homogeneity of residual variance. No missing observations were present in the dataset used for the statistical analyses. Statistical significance was declared at p < 0.05. Whenever significant effects were detected, estimated marginal means (EMMs) were calculated using the emmeans package (version 2.0.4.) [33]. Pairwise comparisons among Year × Fertilization treatment combinations were performed using Tukey’s honestly significant difference (HSD) adjustment, and compact letter displays were generated using the multcomp (version 1.4.31.) and multcompView (version 0.1.11.) packages. Results are presented as estimated marginal means (EMMs) ± standard errors (SE).
To quantify the response to nitrogen fertilization, the absolute response (Δ) and the relative response (Δ%) were calculated for each barley type and growing season using the difference between fertilized (F) and unfertilized (UF) treatments. Agronomic nitrogen use efficiency (AEN) was calculated according to the methodology of [34] as the increase in grain yield per unit of applied nitrogen [34]. In addition, the unit response of agronomic and grain quality traits was calculated by dividing the difference between fertilized and unfertilized treatments by the nitrogen application rate (46 kg N ha−1). The calculated AEN and unit response values are presented in the Supplementary Material.
A E N ( k g   g r a i n   k g 1   N )   =   Y Y 0 F
where Y and Y0 represent grain yield (kg ha−1) under fertilized and unfertilized conditions, respectively, and F is the amount of nitrogen applied.
Relationships among agronomic, canopy development, and grain quality traits were evaluated using Pearson’s correlation coefficients calculated with the Hmisc package (version 5.2.6.) [35]. Principal component analysis (PCA) was performed on centered and standardized trait values using the prcomp() function. The first two principal components, together with their loadings, eigenvalues, and explained variance, were used to characterize multivariate relationships among traits and to construct PCA biplots.
Genotype performance and genotype × environment interaction were investigated using genotype plus genotype-by-environment (GGE) biplot analysis implemented in the metan package (version 1.19.0.). Mean values for each genotype within each Year × Fertilization combination were considered as environments. GGE biplots were generated using environment-centering, no scaling, and symmetrical singular value partitioning. Polygon (“which-won-where”) and average environment coordination (AEC) views were used to evaluate genotype performance, stability, and specific adaptation across the evaluated environments.

3. Results

3.1. Response of Six-Row Barley to Reduced Nitrogen Fertilization Across Two Growing Seasons

3.1.1. Grain Yield and Grain Quality Traits

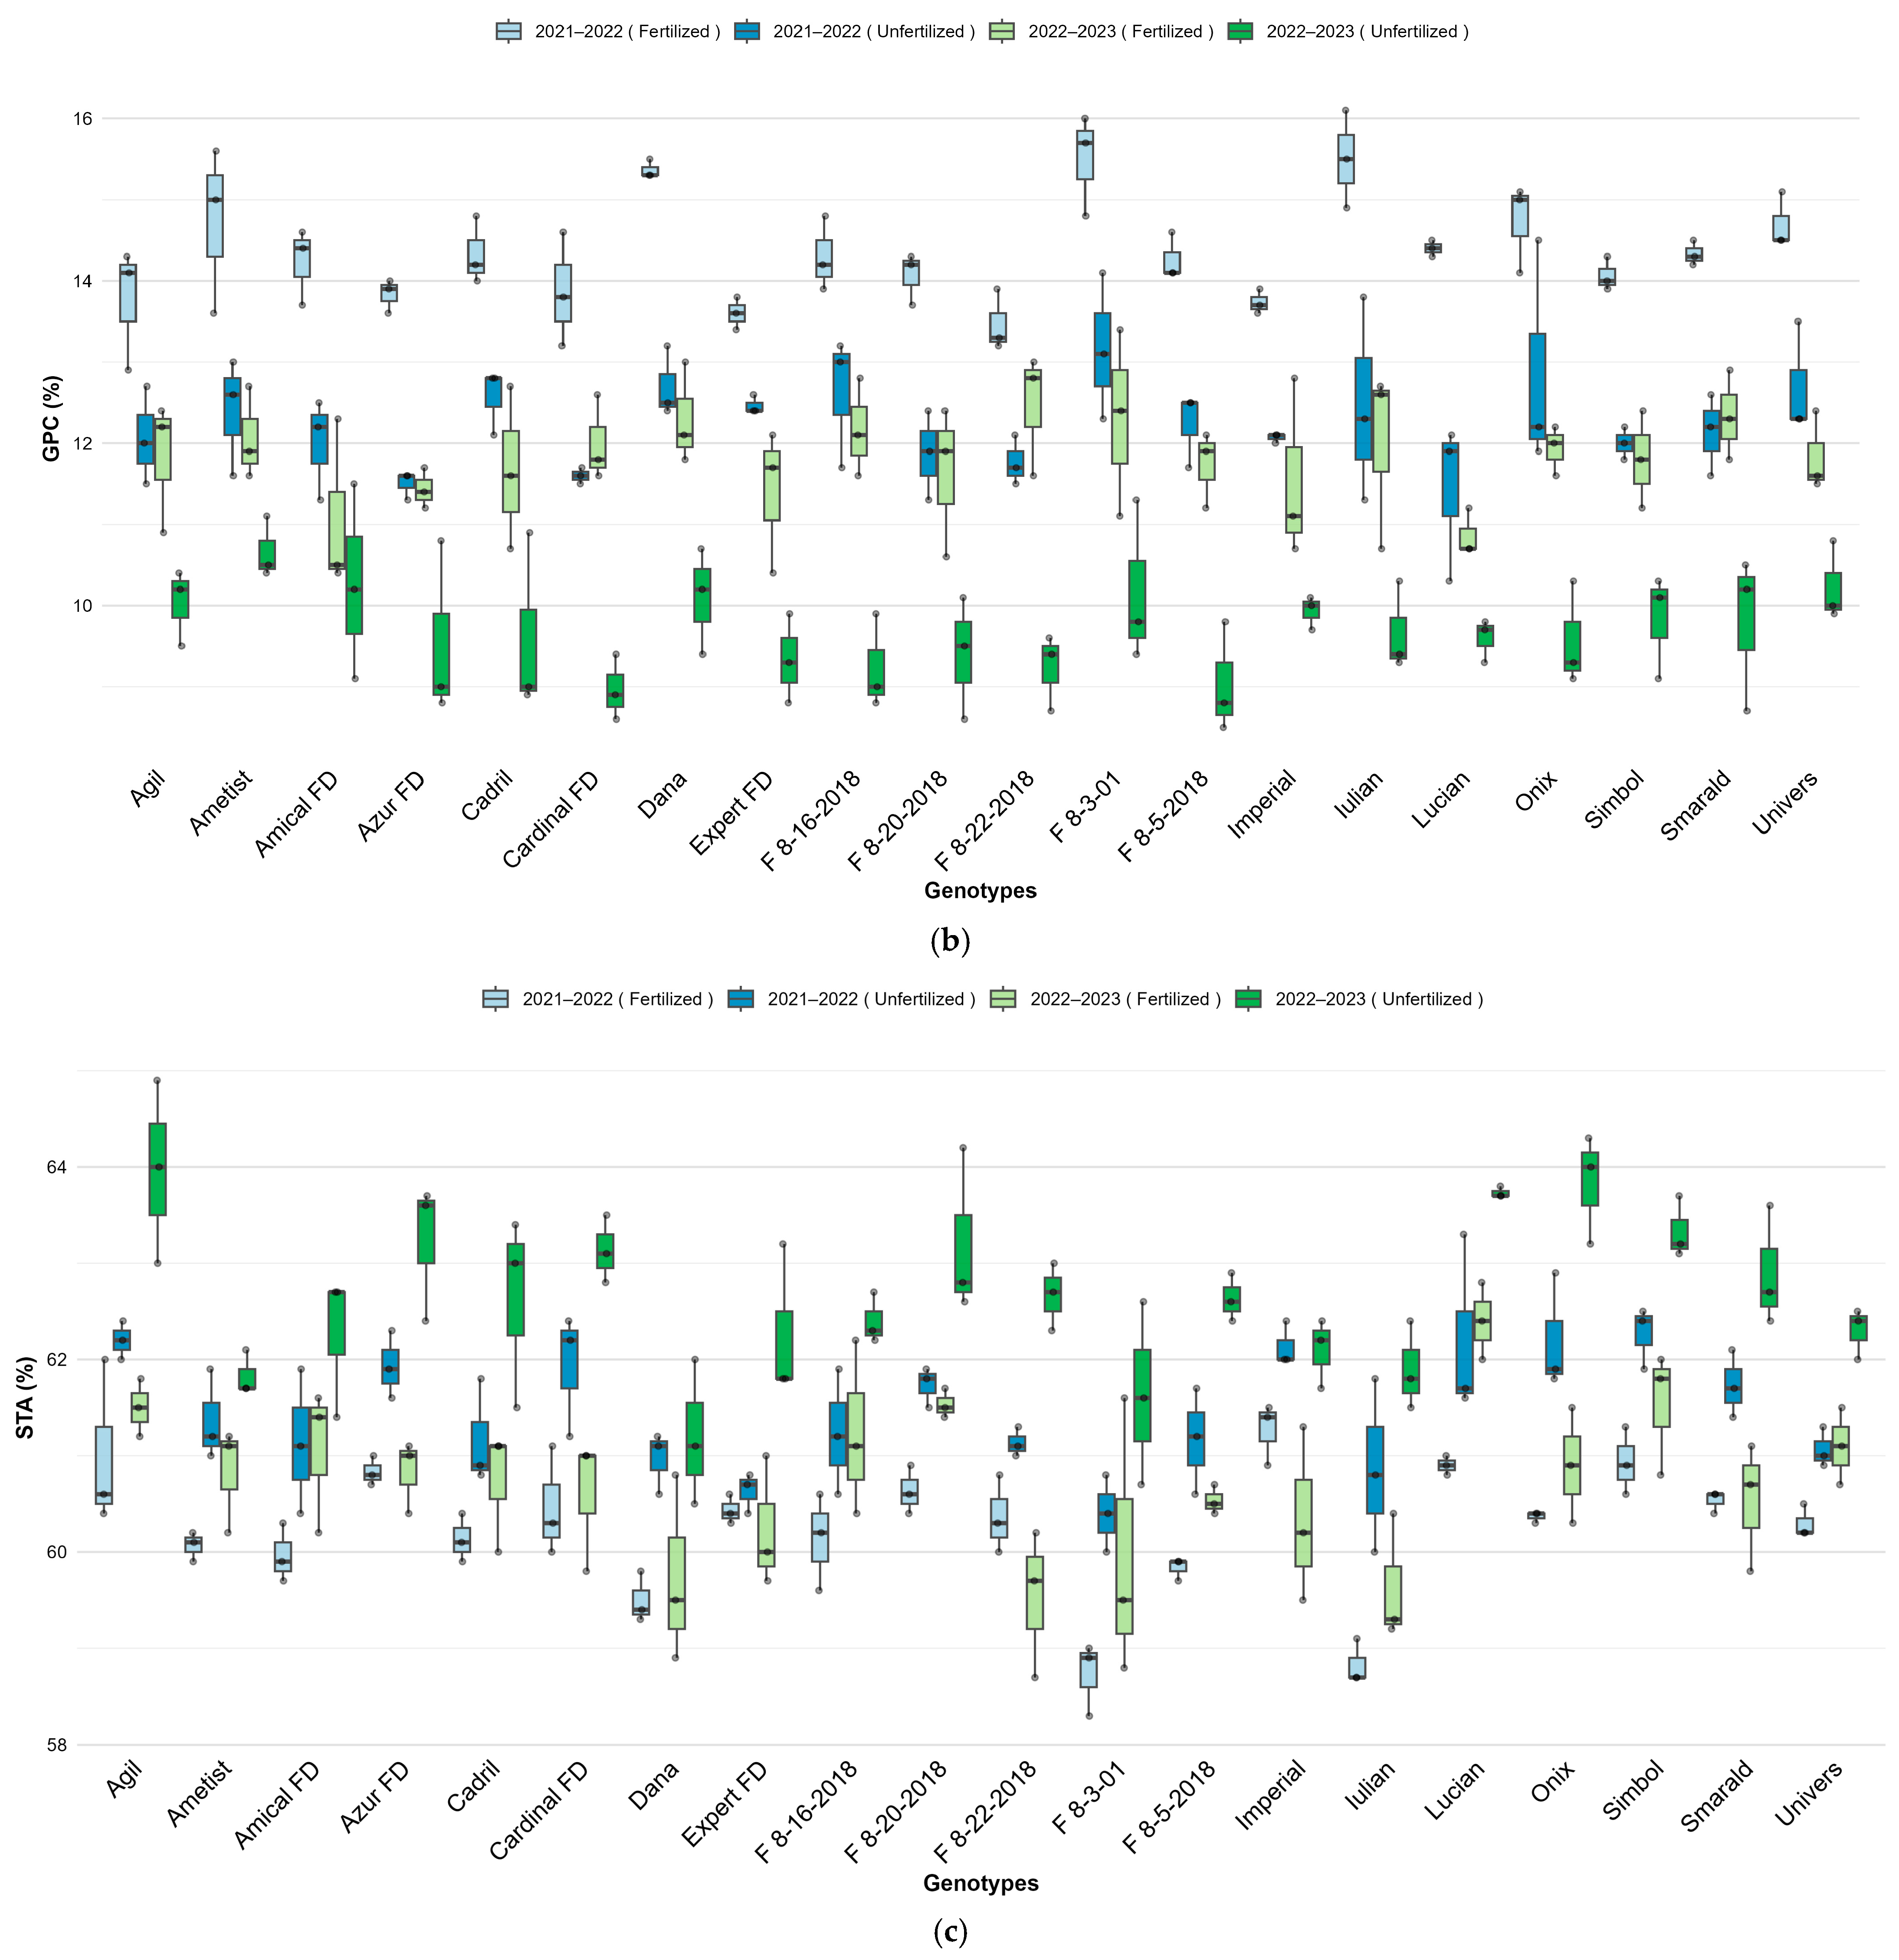
YLD of six-row barley differed markedly between the two growing seasons, whereas the response to nitrogen fertilization depended on seasonal conditions. Analysis of variance confirmed significant effects of growing season and genotype, together with significant Year × Fertilization, Year × Genotype, and Year × Fertilization × Genotype interactions, whereas the overall main effect of fertilization was not significant (Table S2). Estimated marginal means (EMMs) showed that nitrogen fertilization increased YLD from 8969.9 to 9500.4 kg ha−1 (+5.9%) in 2021–2022, whereas a reduction from 7064.3 to 6724.3 kg ha−1 (−4.8%) was observed in 2022–2023 (Table 3 and Table 4). This contrasting response was also evident in the distribution of genotype performance across treatments (Figure 1a).
GPC was significantly influenced by growing season, nitrogen fertilization and genotype, whereas no significant interactions involving nitrogen fertilization were detected (Table S2). Nitrogen application increased the EMMs of GPC by 2.11 percentage points in both growing seasons, from 12.23% to 14.34% in 2021–2022 and from 9.71% to 11.82% in 2022–2023, corresponding to relative increases of 17.2% and 21.7%, respectively (Table 3 and Table 4). GPC also differed substantially among genotypes, as illustrated by the boxplots (Figure 1b).
STA was significantly affected by growing season, nitrogen fertilization, and genotype, with significant Year × Fertilization and Year × Genotype interactions (Table S2). Fertilization reduced STA from 61.47% to 60.26% in 2021–2022 and from 62.66% to 60.74% in 2022–2023 (Table 3 and Table 4). Although STA varied among genotypes, the boxplots indicated a consistent reduction under fertilized conditions across both growing seasons (Figure 1c).

3.1.2. Agronomic and Canopy Development Traits

PLH, TKW, and canopy development, assessed by NDVI1 and NDVI2, were significantly influenced by growing season and genotype (Table S2). Nitrogen fertilization significantly affected PLH, TKW, and NDVI1, whereas its main effect on NDVI2 was not significant. Significant Year × Fertilization interactions were detected for PLH, TKW, and NDVI1, but not for NDVI2. For PLH, all two- and three-way interactions involving genotype were also significant, highlighting substantial differences in genotype-specific responses across years and nitrogen treatments (Table S2).
PLH was significantly affected by year, fertilization, and genotype, with significant Year × Fertilization, Year × Genotype, Fertilization × Genotype, and Year × Fertilization × Genotype interactions, indicating a strongly genotype-dependent response across growing seasons (Table S2). PLH was consistently reduced by nitrogen fertilization in both growing seasons. The EMMs decreased from 103.08 to 98.42 cm in 2021–2022 (−4.66 cm; −4.5%) and from 103.85 to 100.79 cm in 2022–2023 (−3.06 cm; −2.9%) (Table 3 and Table 4). In contrast, the response of TKW differed between growing seasons. During 2021–2022, fertilization increased TKW from 36.22 to 36.97 g (+2.1%), whereas in 2022–2023 it declined from 37.73 to 33.88 g, corresponding to a reduction of 3.85 g (−10.2%), consistent with the significant Year × Fertilization interaction (Table 3 and Table 4).
Canopy development also differed between nitrogen treatments and growing seasons. NDVI1 increased from 0.825 to 0.845 (+2.4%) in 2021–2022 and from 0.744 to 0.782 (+5.1%) in 2022–2023, while NDVI2 increased from 0.776 to 0.806 (+3.8%) and from 0.646 to 0.687 (+6.3%) (Table 3). Although considerable variation among genotypes was observed for all four traits, the boxplots revealed seasonal differences and highlighted different genotype responses under fertilized and unfertilized conditions (Figure S1).

3.1.3. GGE Biplots “Which-Won-Where”

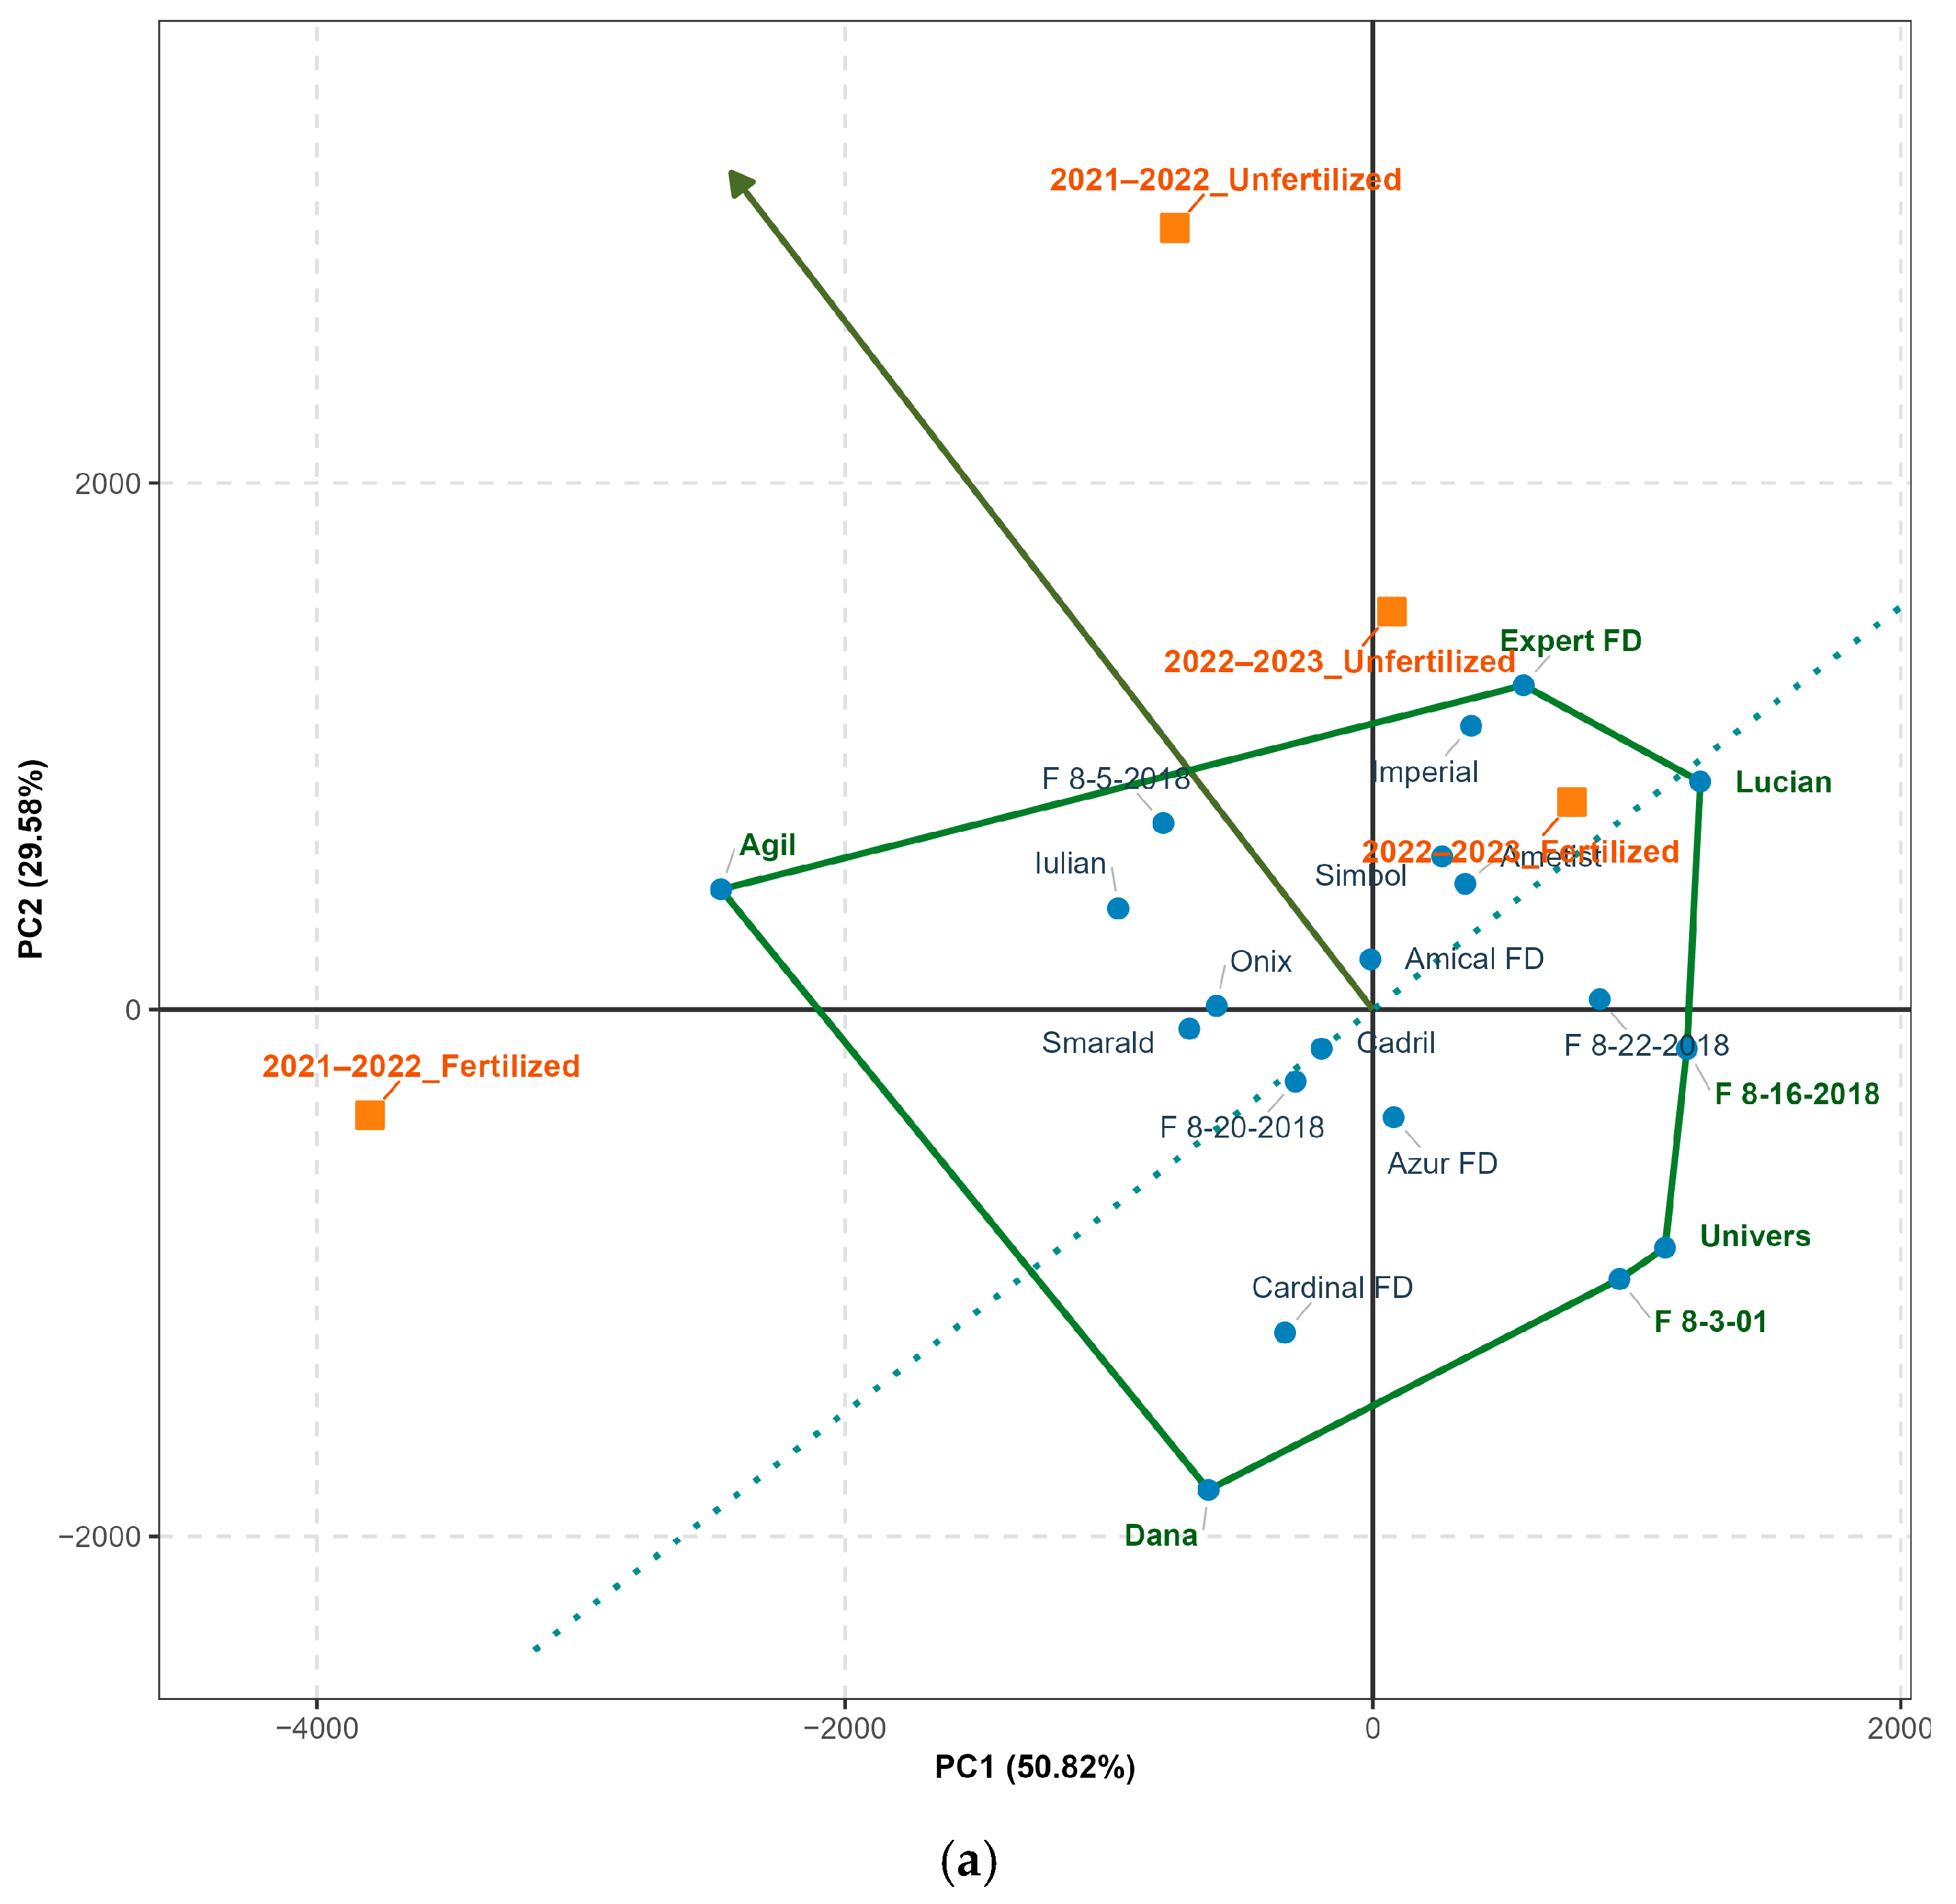
The GGE biplot for YLD explained 80.4% of the genotype and genotype × environment variation (PC1 = 50.8%, PC2 = 29.6%), indicating that the first two principal components adequately summarized genotype performance across the four year × nitrogen treatment combinations (Figure 2a). The polygon view showed a pronounced crossover genotype × environment interaction, with Agil, Dana, F 8-3-01, Univers, F 8-16-2018, Lucian, and Expert FD forming the vertex genotypes. Agil was associated with the fertilized environment in 2021–2022. Both environments in 2022–2023 were positioned within the sector defined by Expert FD and Lucian, indicating that these genotypes performed best under the environmental conditions prevailing during the second growing season.
The average environment coordination (AEC) view further differentiated genotypes according to their mean YLD and stability. Lucian and Expert FD were positioned in the positive direction of the AEC axis, indicating above-average YLD across environments. In contrast, Agil and Dana exhibited large projections away from the average environment and occupied vertex positions in opposite sectors of the polygon, indicating specific responses to particular year × nitrogen combinations rather than consistent performance across all evaluated combinations. Genotypes such as Cadril, Onix, and Amical FD, located close to the biplot origin, showed comparatively smaller genotype × environment interactions but also lower mean YLD than the leading genotypes. GGE analysis highlighted Expert FD as the genotype combining high grain yield with comparatively stable performance across the evaluated year × nitrogen combinations at the experimental location.
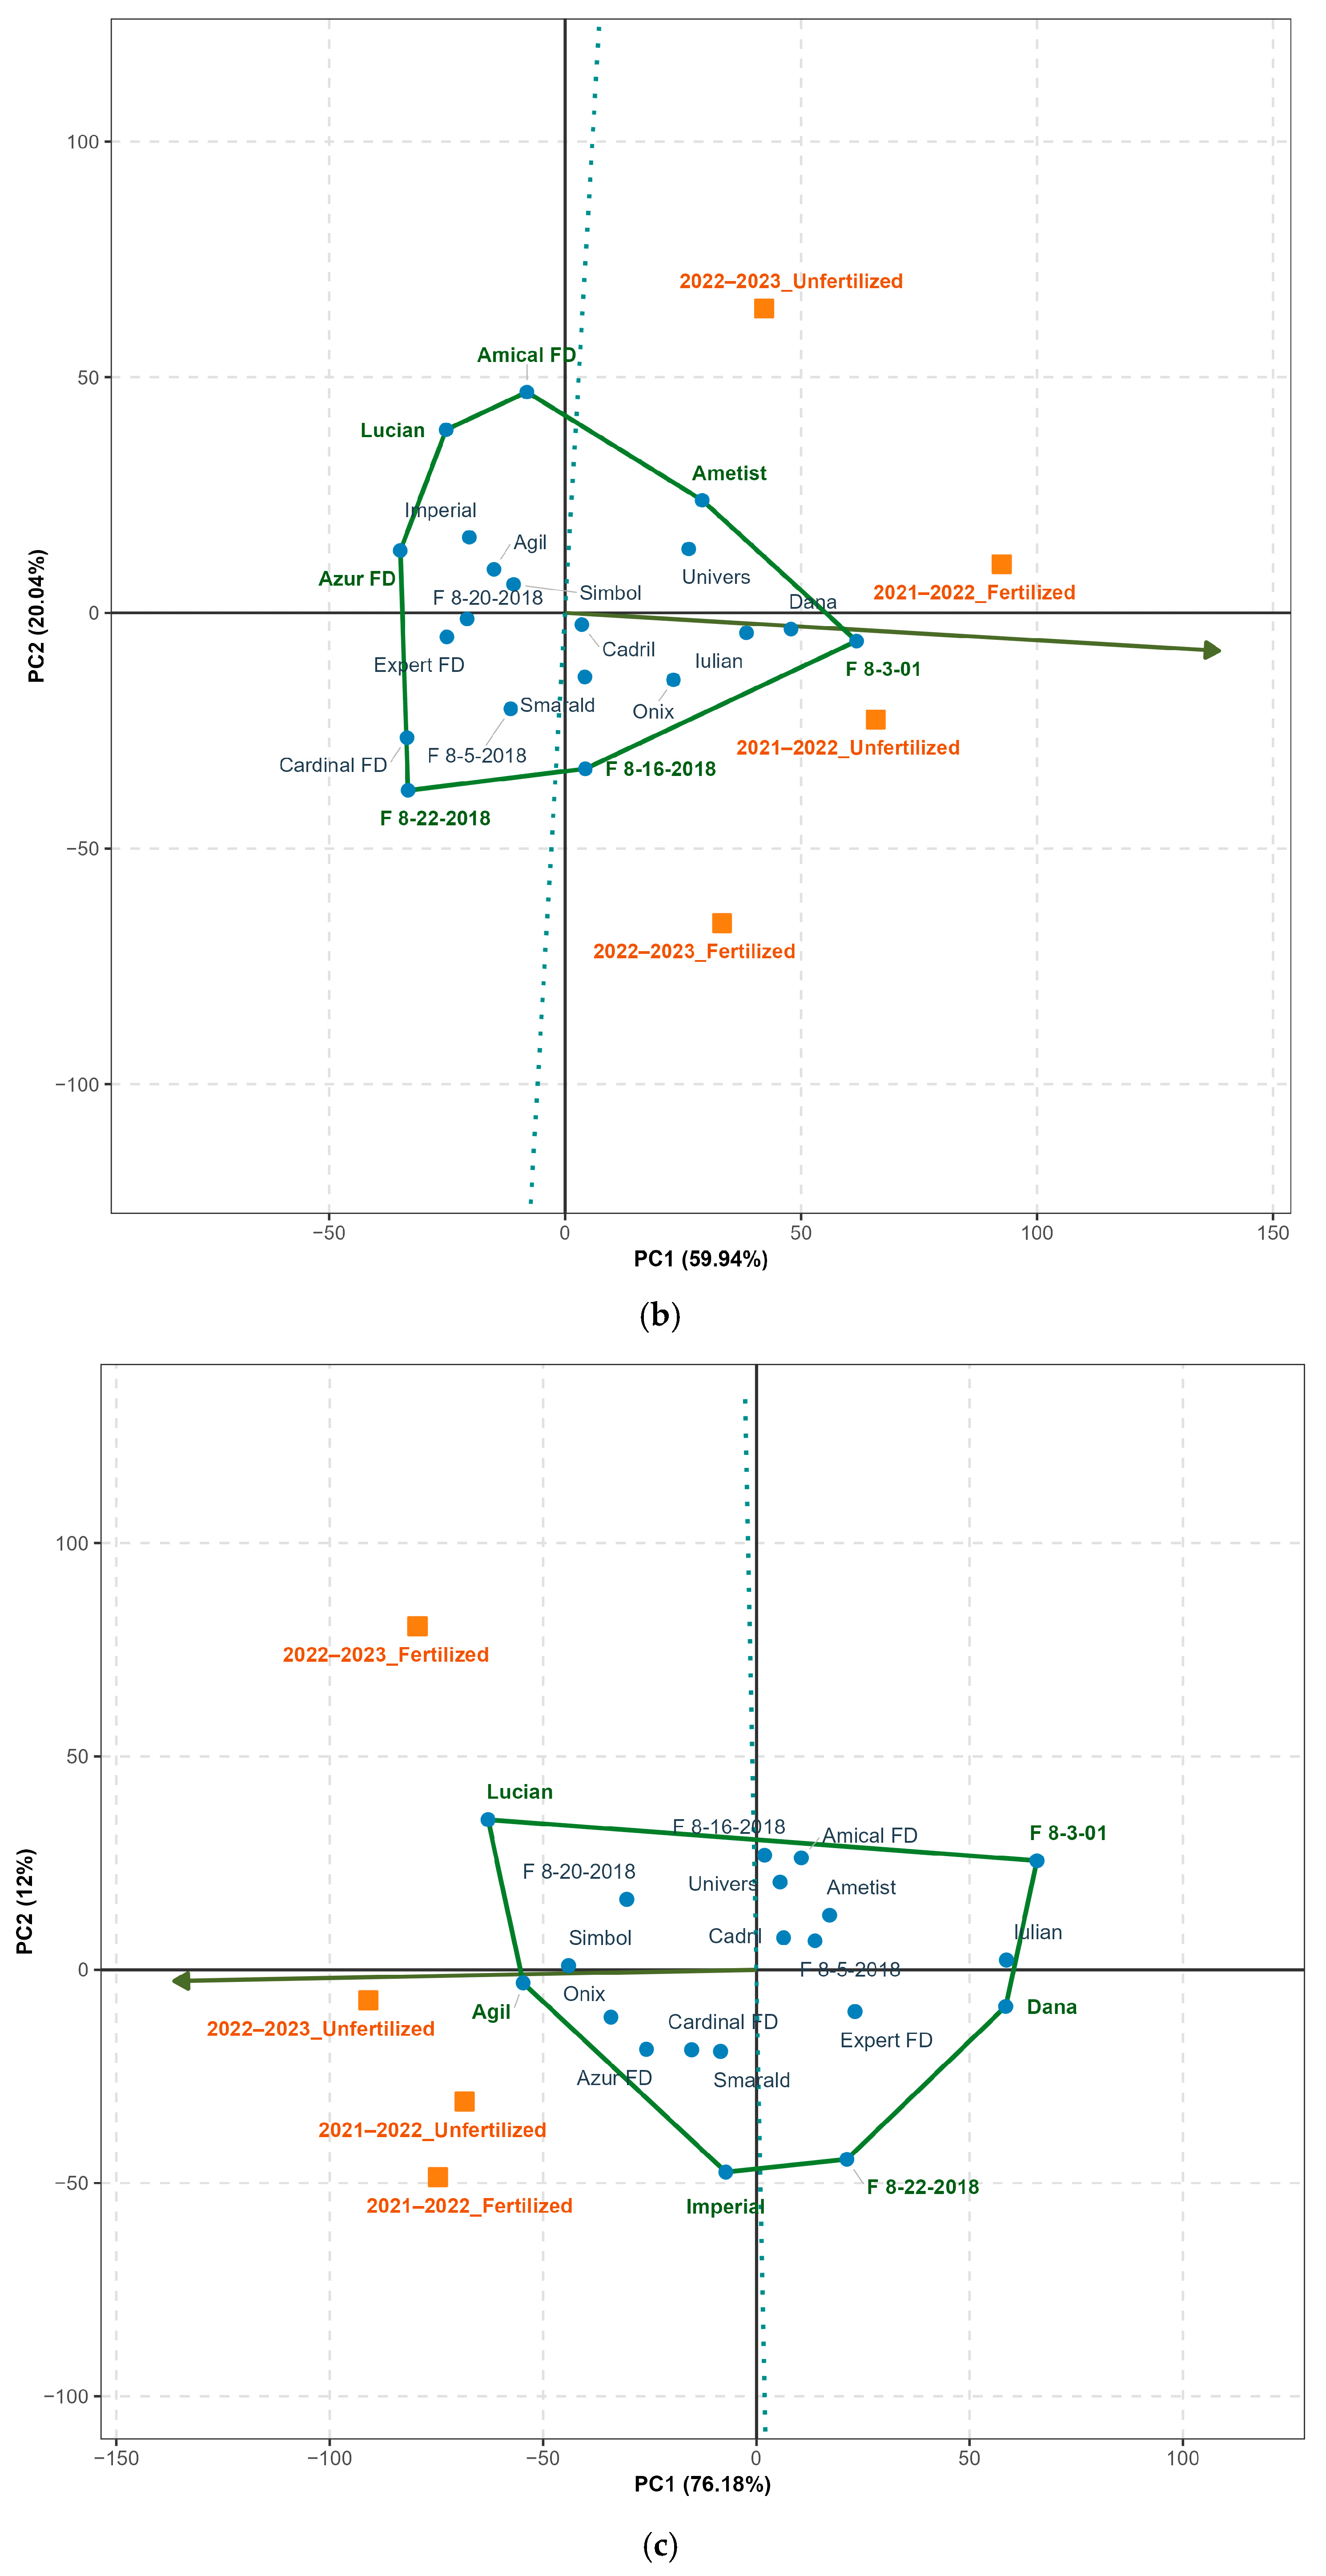
The GGE biplot for GPC explained 79.9% of the genotype and genotype × environment variation (PC1 = 59.9%, PC2 = 20.0%) (Figure 2b). The polygon view identified Lucian, Amical FD, Ametist, F 8-3-01, F 8-16-2018, F 8-22-2018, and Azur FD as the vertex genotypes. AEC indicated clear differences in mean GPC among genotypes. Dana, F 8-3-01, and Iulian were located in the positive direction of the AEC axis, indicating above-average GPC across environments. Among them, Dana combined high protein content with comparatively greater stability across the evaluated year × nitrogen combinations at the experimental location, whereas F 8-3-01 exhibited higher environmental responsiveness, as reflected by its larger deviation from the AEC axis.
The GGE biplot for STA explained 88.1% of the genotype and genotype × environment variation (PC1 = 76.1%, PC2 = 12.0%), indicating that the first two principal components adequately represented genotype responses across the four year × nitrogen treatment combinations (Figure 2c). The average environment coordination (AEC) separated genotypes according to their mean STA and stability across environments. F 8-3-01, Lucian, Dana, F 8-22-2018, Imperial, and Agil are the vertex genotypes. Agil was positioned in the positive direction of the AEC axis, indicating above-average STA. GGE analysis demonstrated that both genotype and genotype × environment interaction contributed to variation in STA.

3.1.4. Trait Relationships and Principal Component Analysis

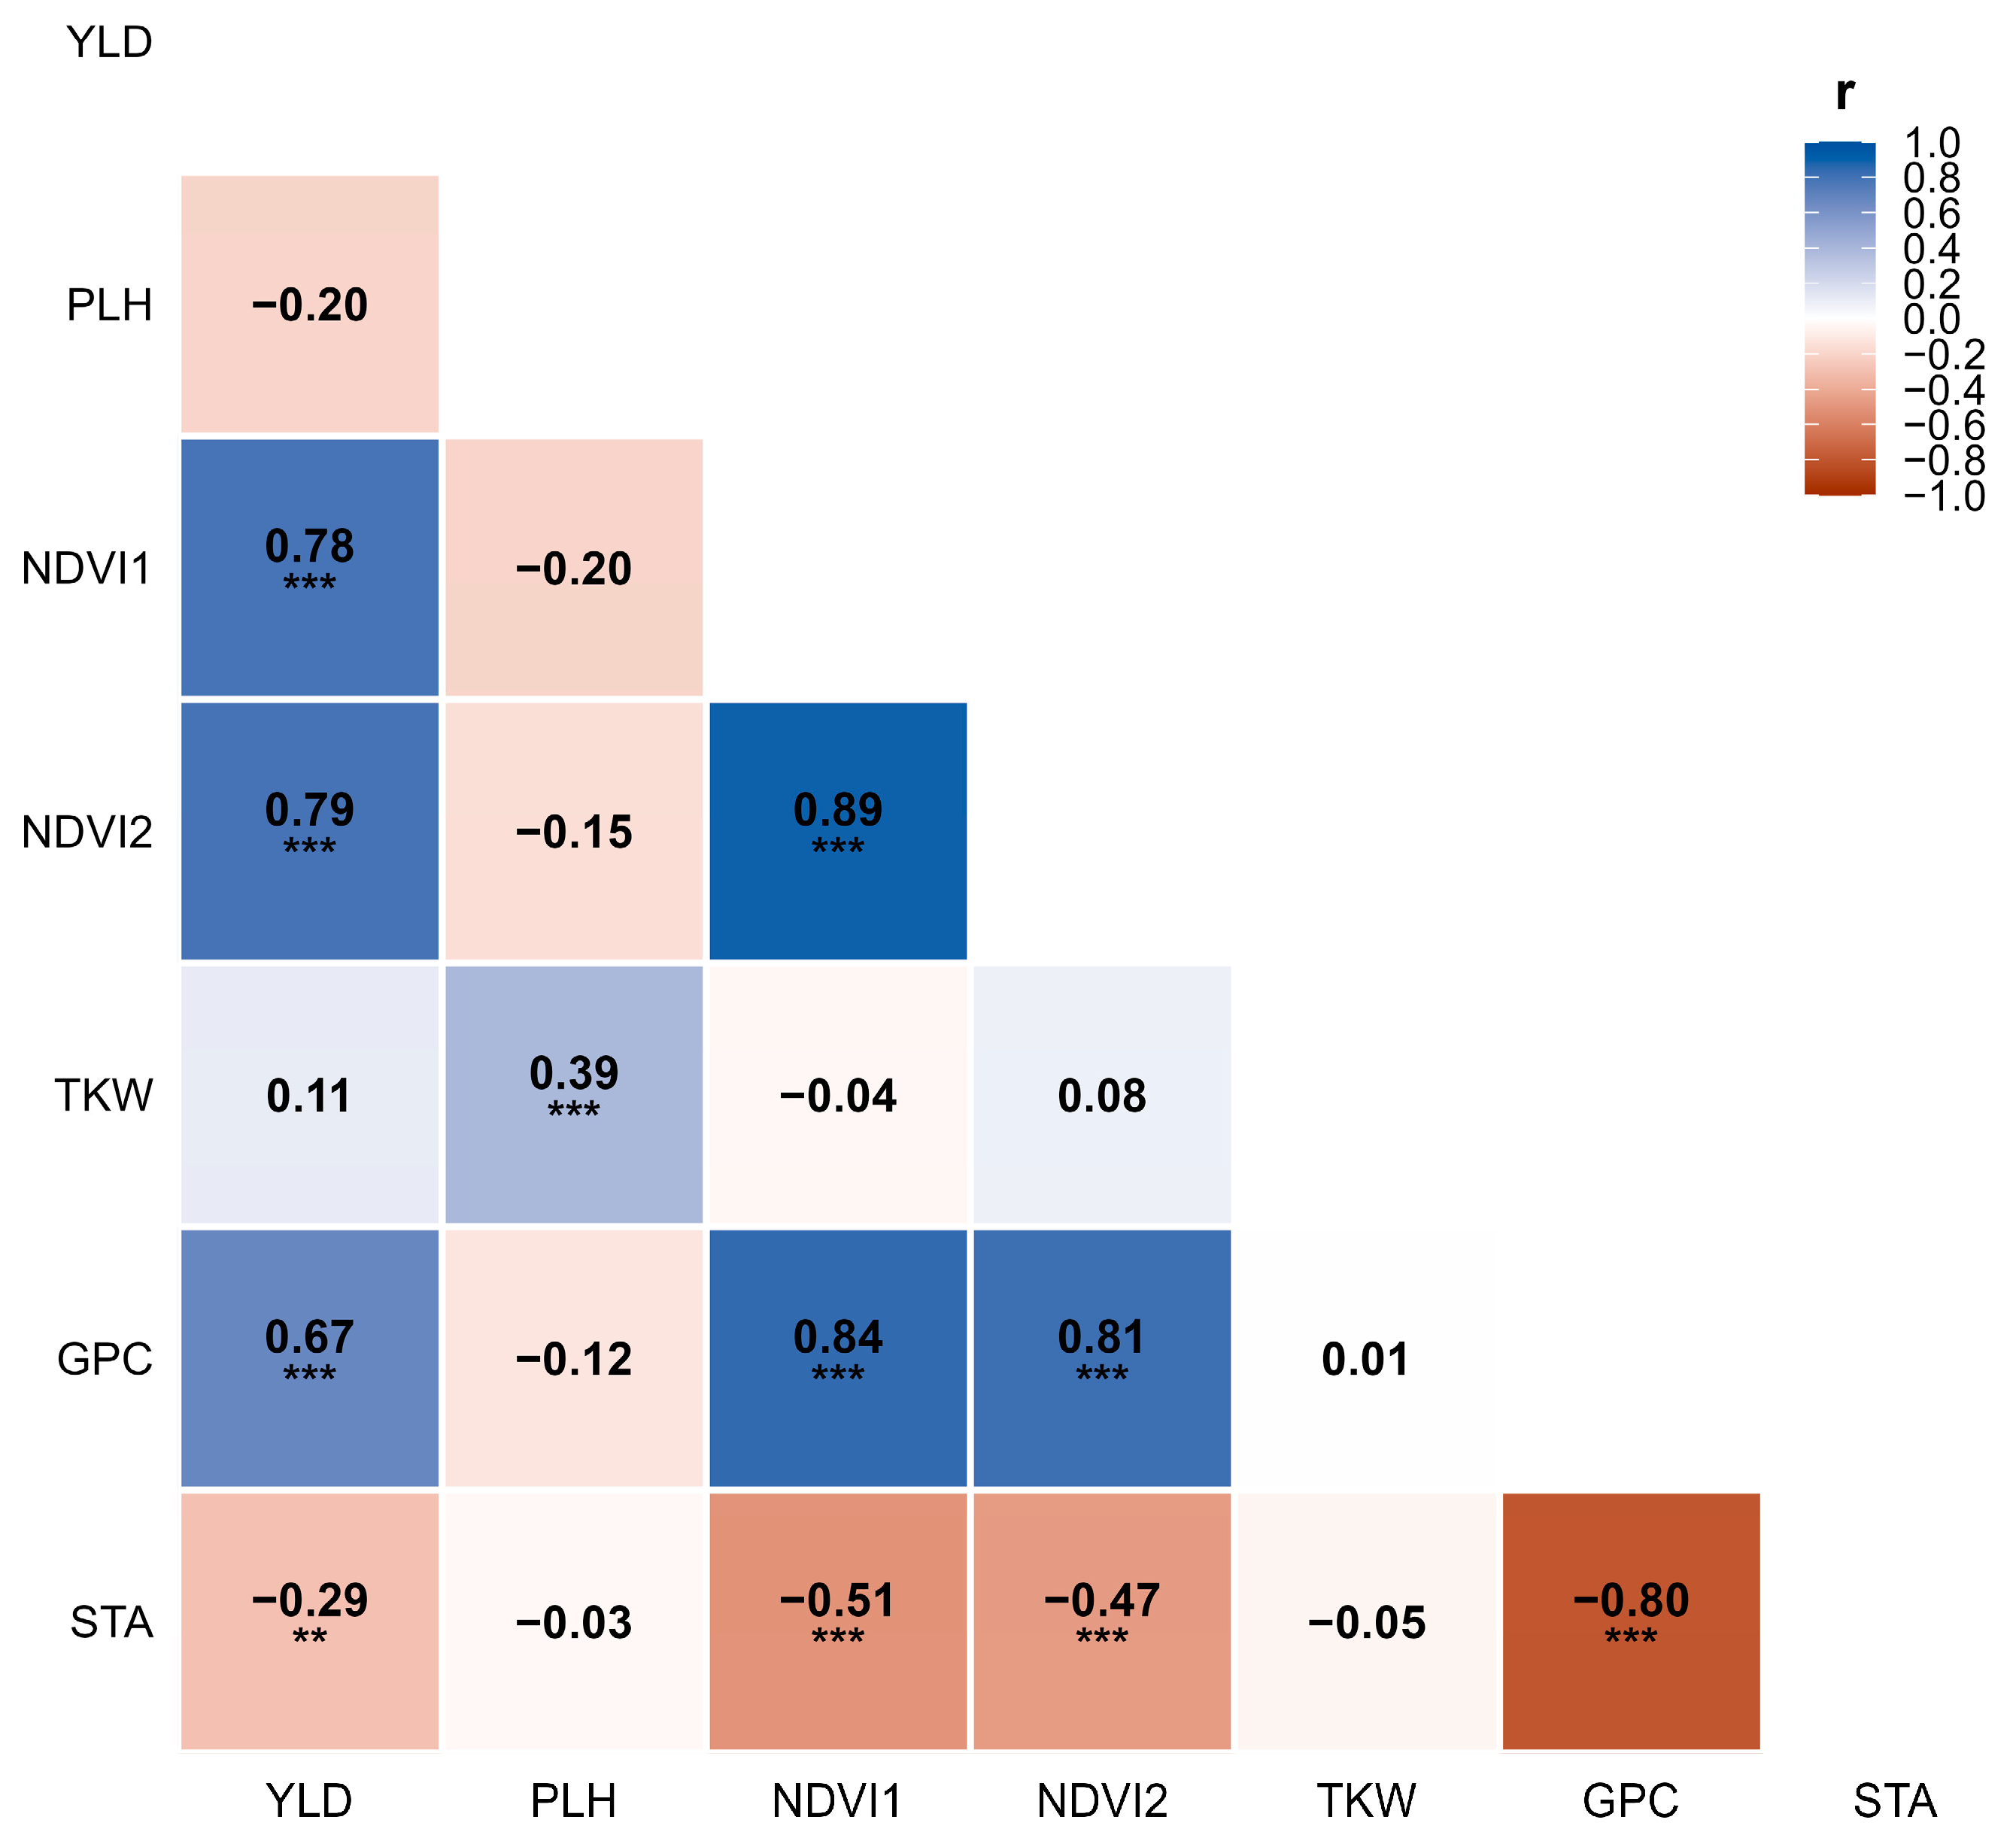
Pearson correlation analysis revealed consistent relationships among agronomic, canopy development, and grain quality traits in six-row barley (Figure 3). YLD showed strong positive correlations with NDVI1, NDVI2, and GPC, whereas STA was negatively associated with these traits. GPC was also negatively correlated with STA, indicating contrasting responses of the two grain quality traits under the evaluated nitrogen regimes.
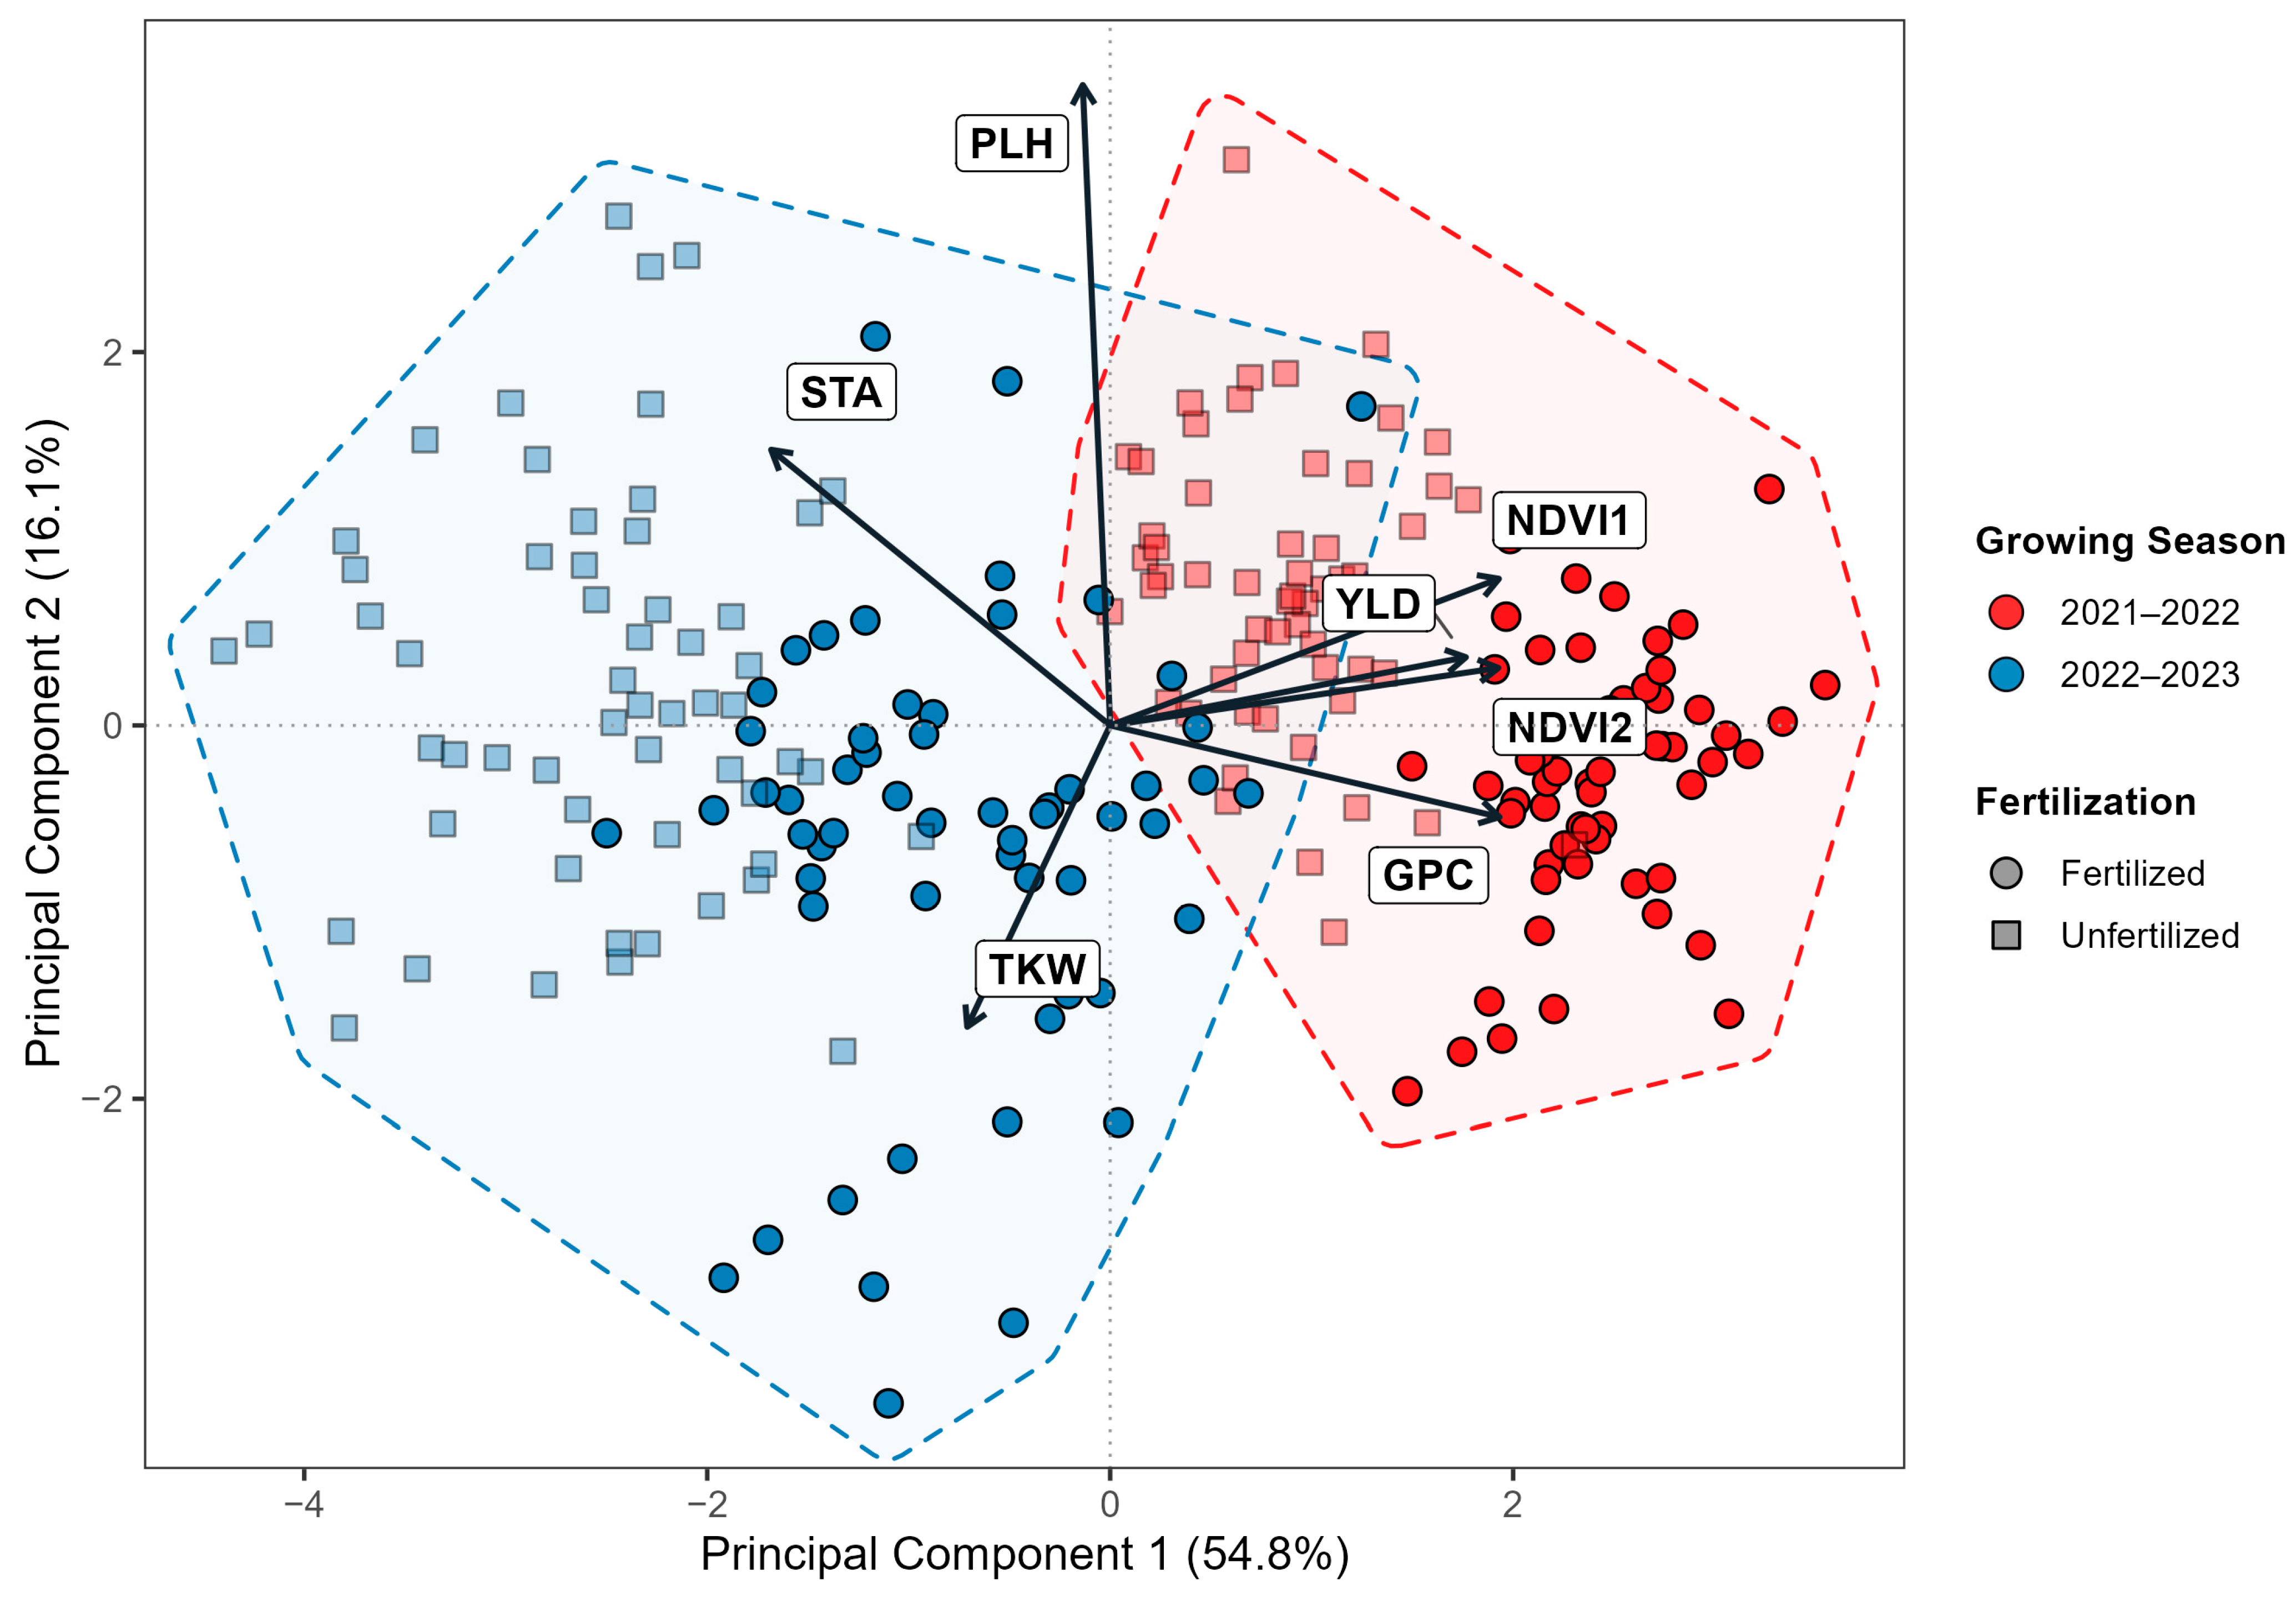
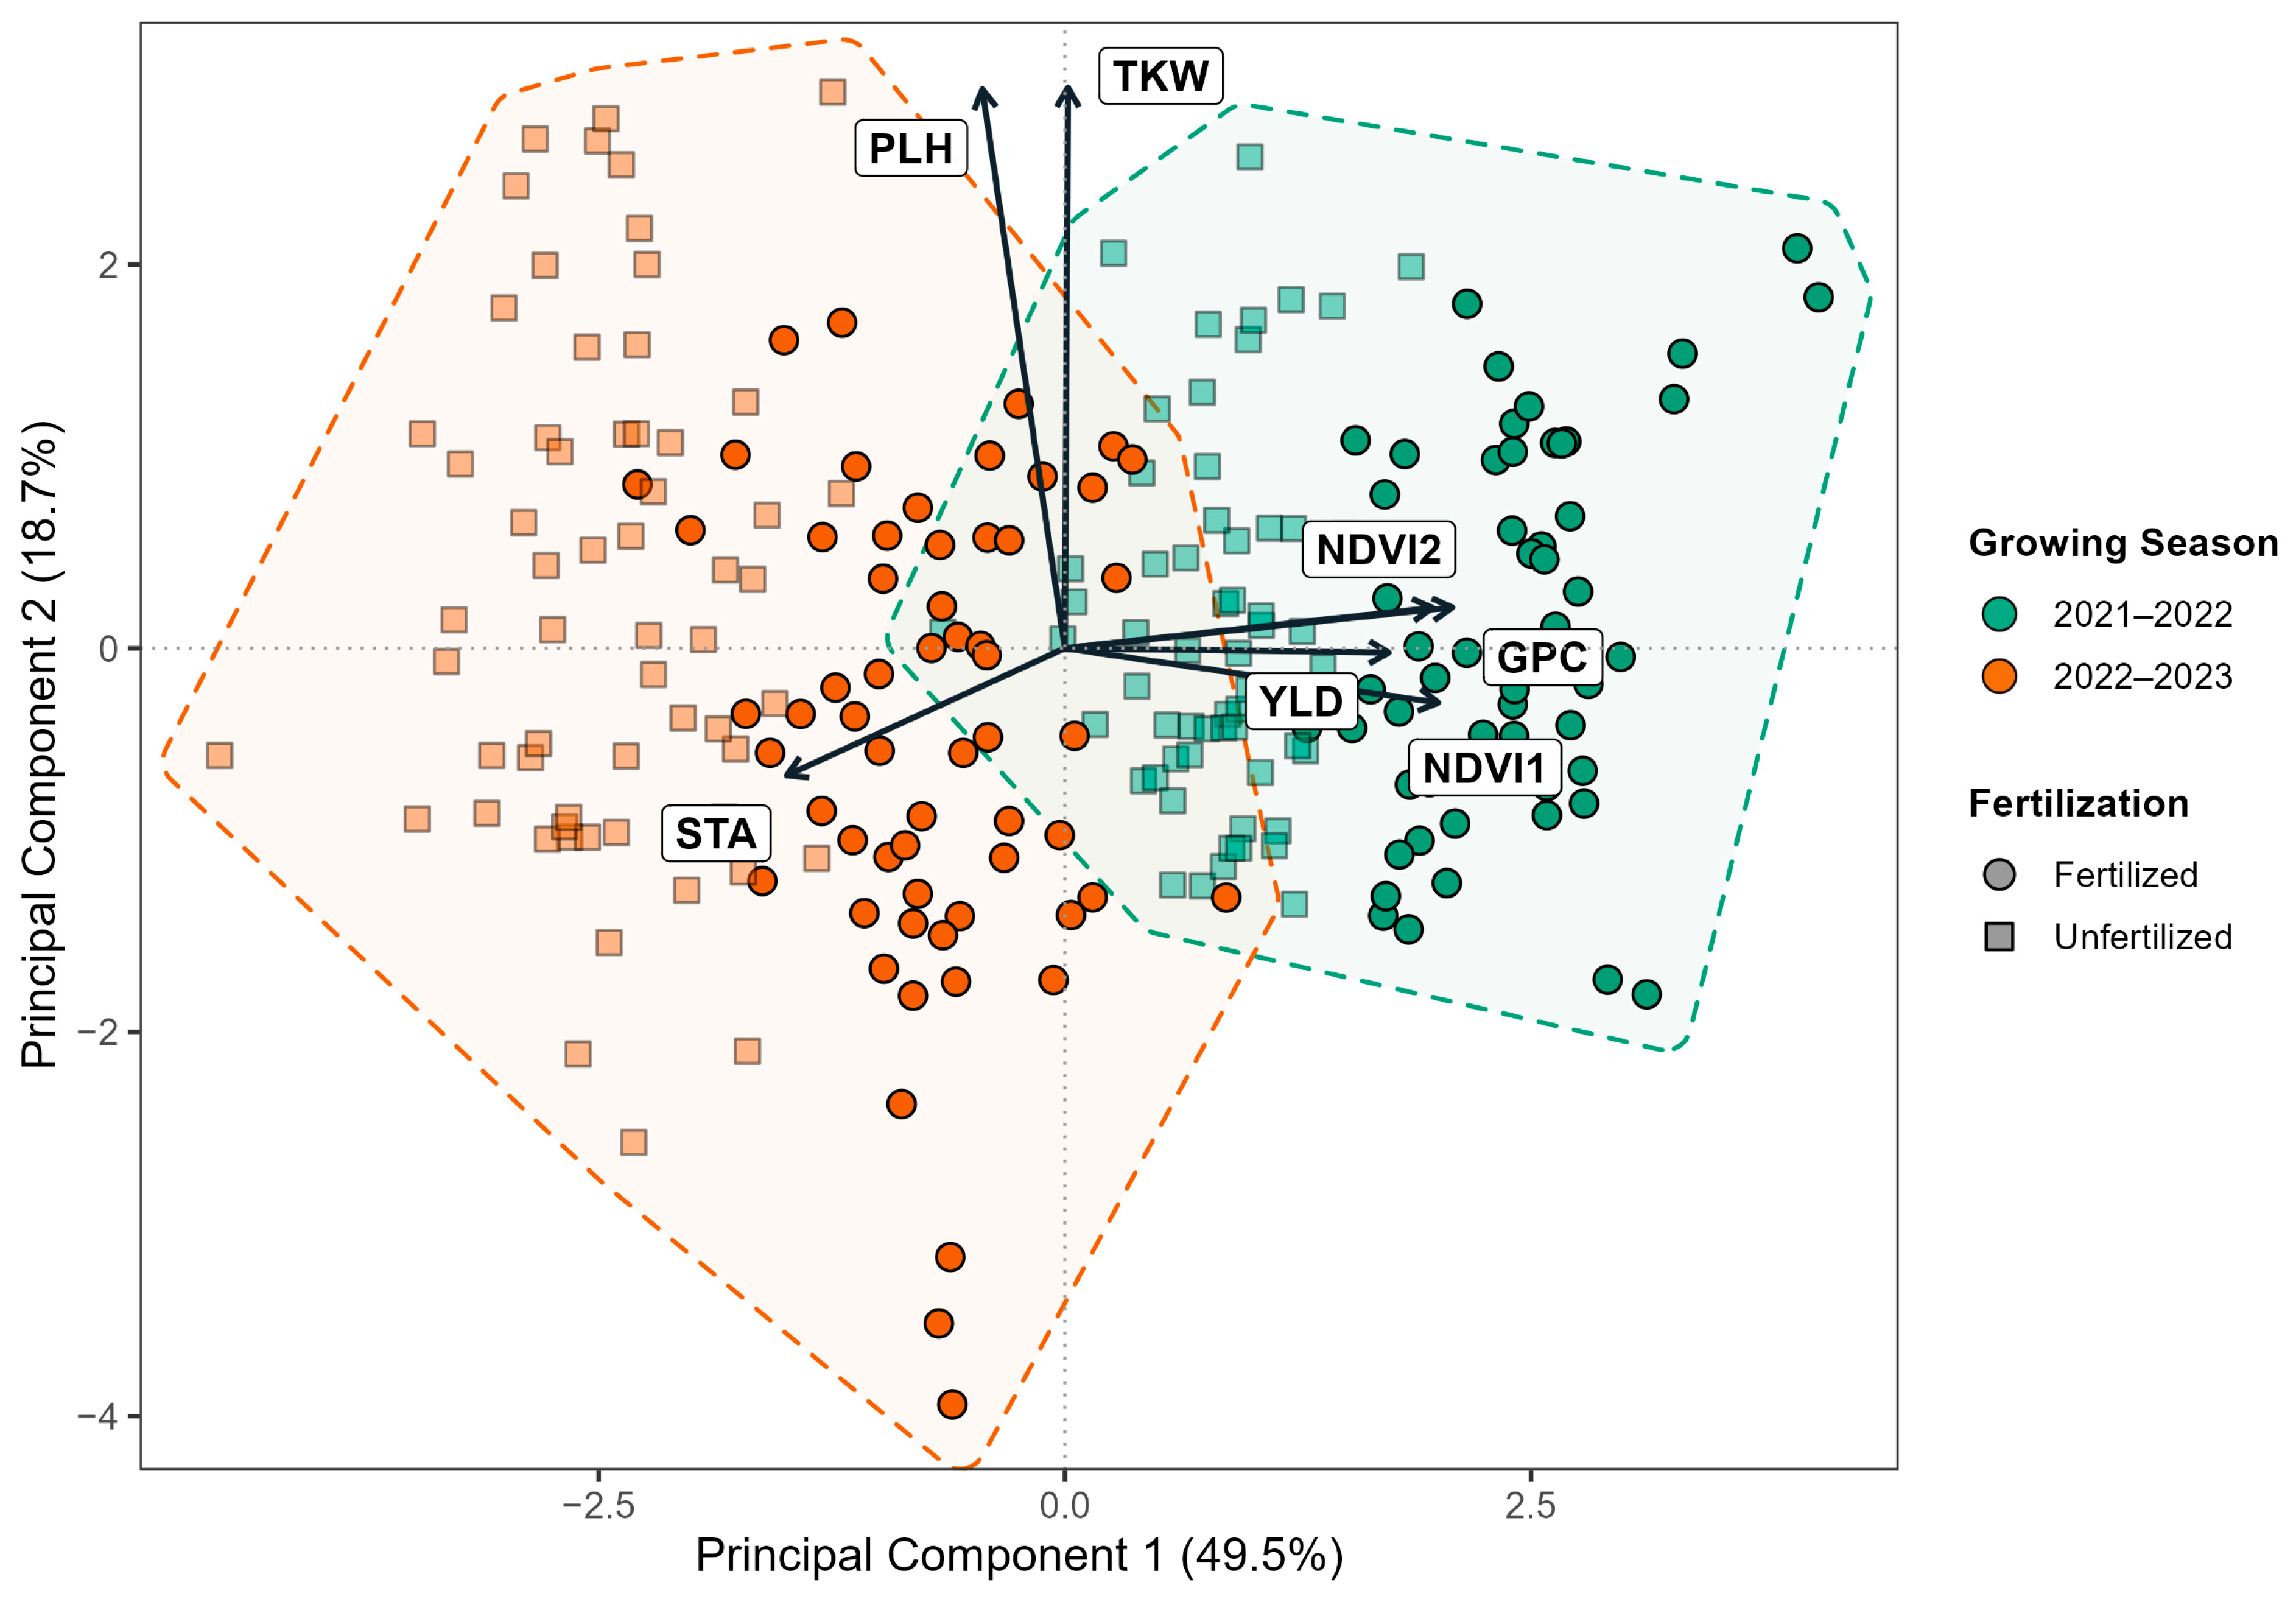
Principal component analysis (PCA) supported these relationships, with the first two principal components explaining 68.2% of the total variation (PC1 = 49.5%, PC2 = 18.7%). PC1 was primarily associated with YLD, NDVI1, NDVI2, and GPC, all of which showed strong positive loadings, whereas STA exhibited a negative loading on the same axis (Table 5). PC2 was mainly determined by PLH and TKW, indicating that these traits explained an additional and largely independent component of variation among genotypes. The PCA biplot clearly separated fertilized and unfertilized environments along the first principal component (Figure 4). Fertilized environments were associated with higher YLD, canopy development, and GPC, whereas unfertilized environments were positioned closer to STA, confirming the contrasting response of grain quality traits to nitrogen fertilization.

3.2. Response of Two-Row Barley to Reduced Nitrogen Fertilization Across Two Growing Seasons

3.2.1. Grain Yield and Grain Quality Traits

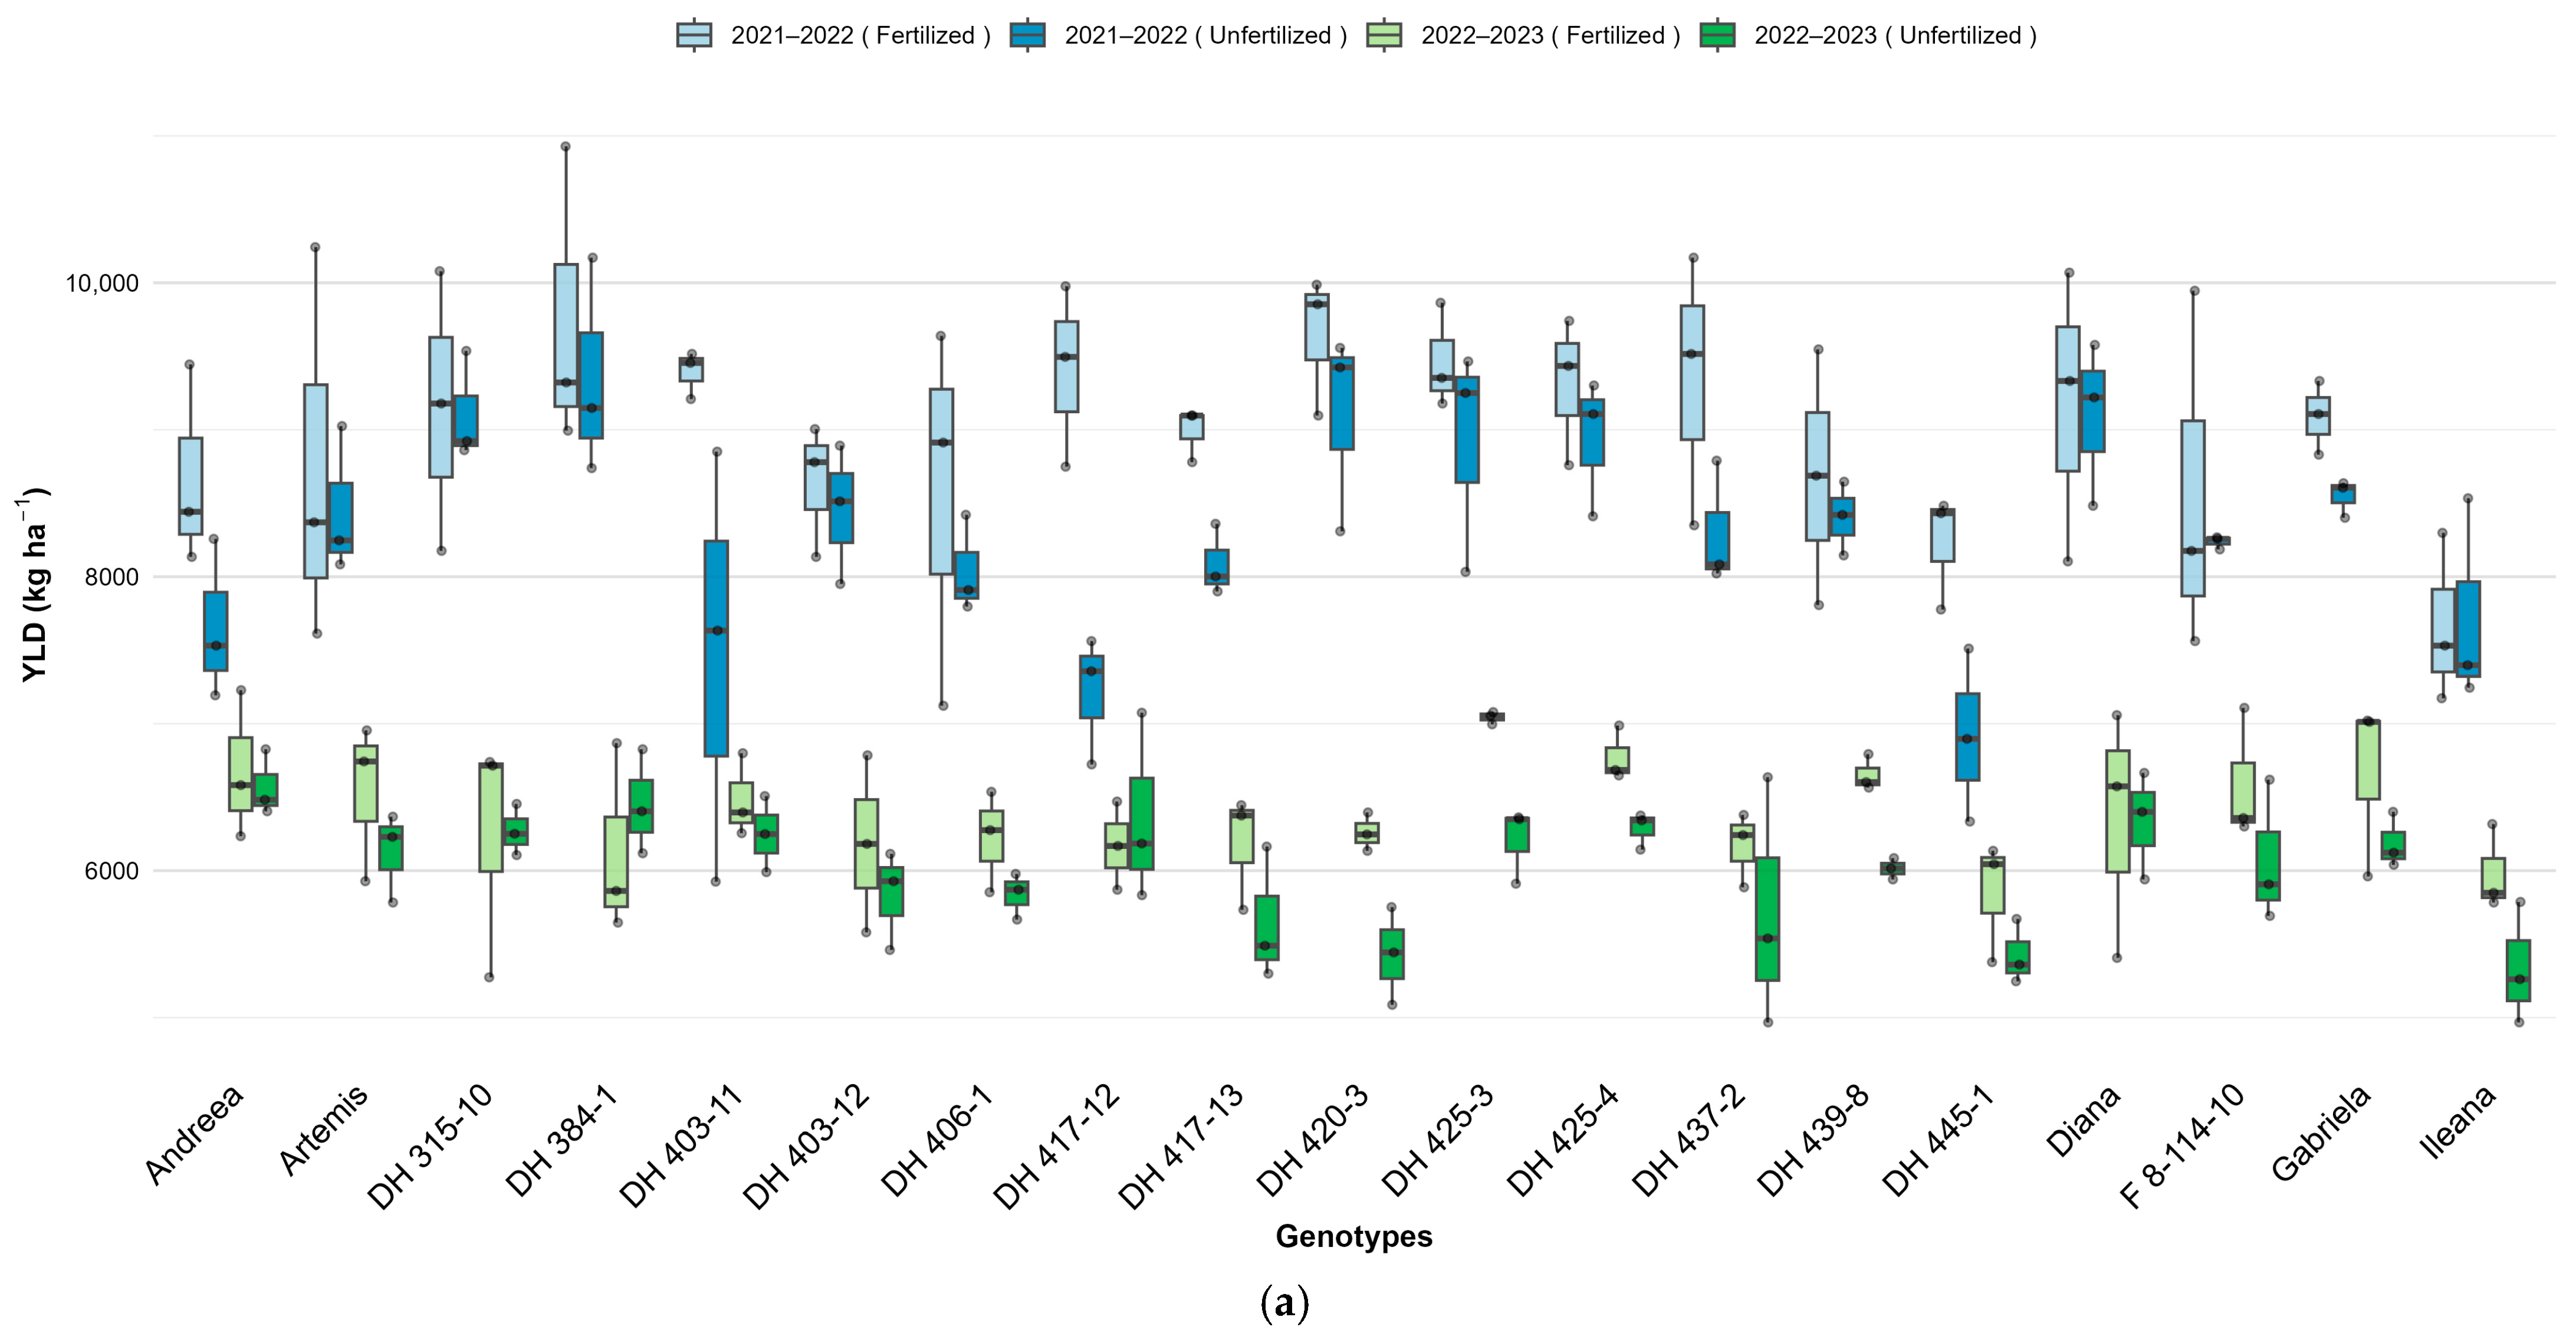
YLD of two-row barley was significantly influenced by growing season, nitrogen fertilization, and genotype, whereas the Year × Fertilization interaction was not significant (p = 0.051), indicating a relatively consistent response to nitrogen fertilization across the two growing seasons (Table S3). EMMs showed that nitrogen fertilization increased YLD from 8316.4 to 8971.8 kg ha−1 (+655.4 kg ha−1; +7.9%) in 2021–2022 and from 6019.0 to 6377.1 kg ha−1 (+358.1 kg ha−1; +5.9%) in 2022–2023 (Table 6 and Table 7). Unlike six-row barley, the positive response to nitrogen fertilization was maintained in both growing seasons, although the response was greater in 2021–2022.
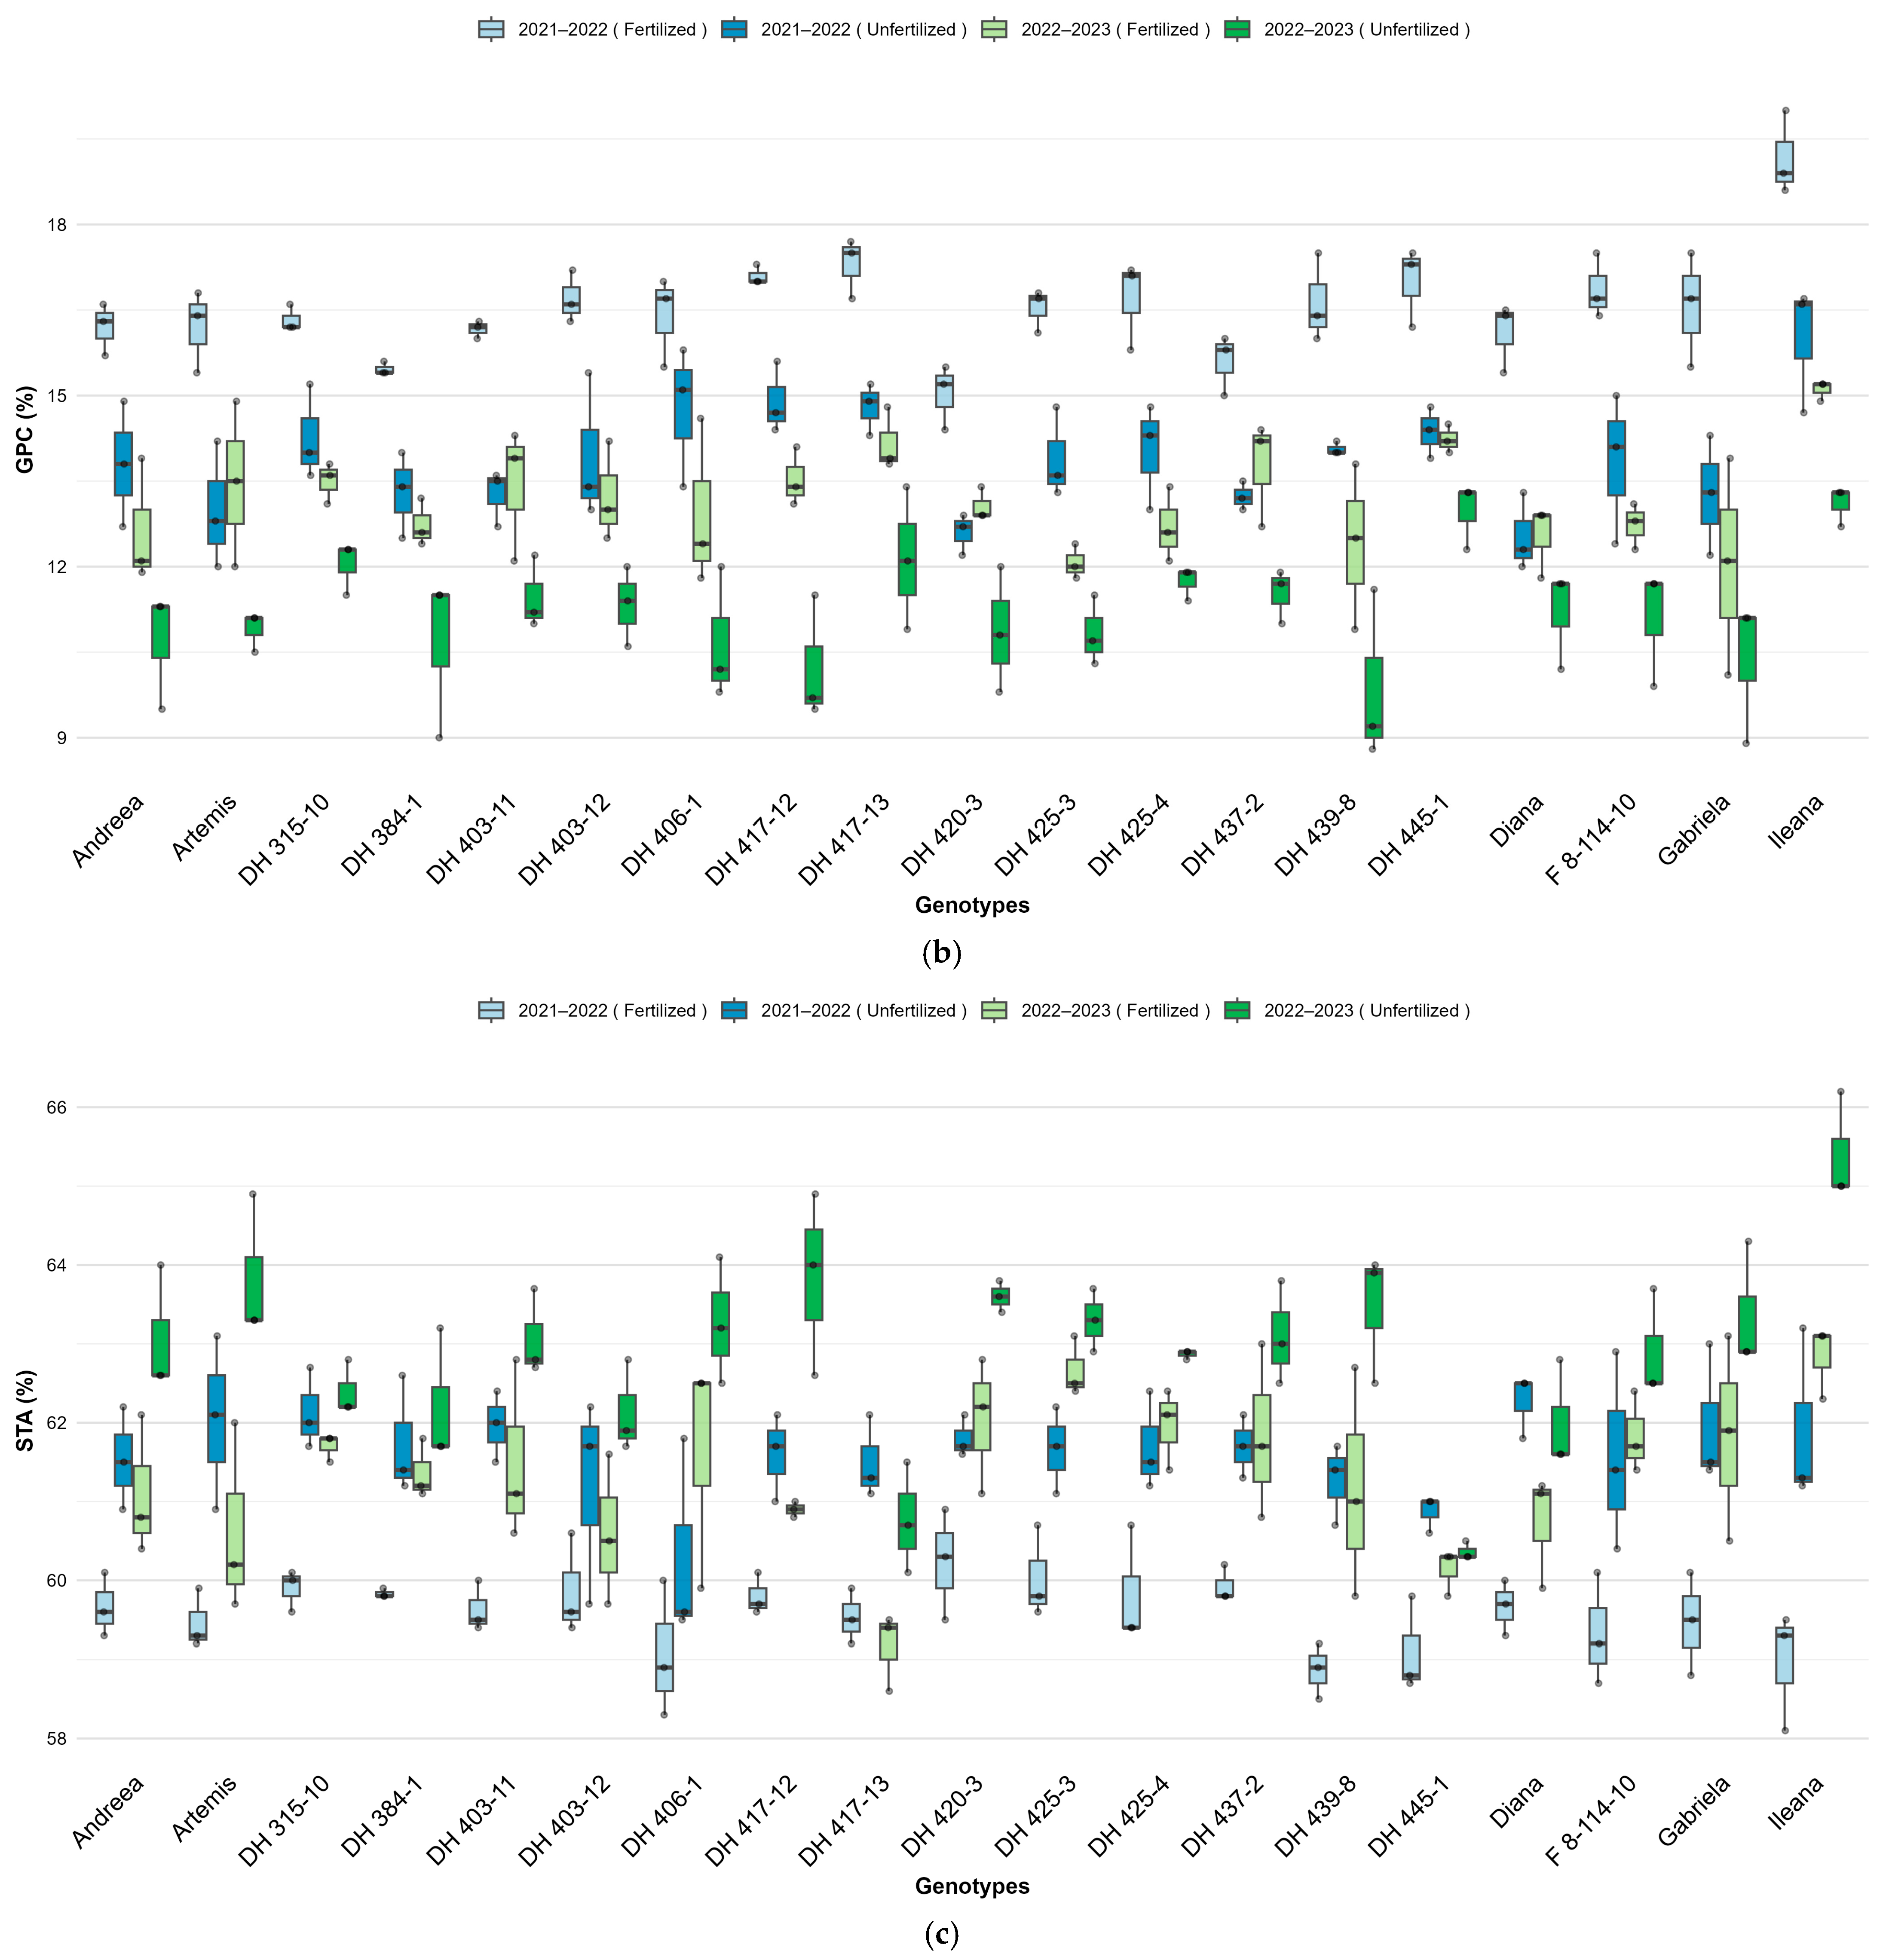
Both GPC and STA were significantly affected by growing season, nitrogen fertilization, and genotype, with significant Year × Fertilization and Year × Genotype interactions (Table S3). Nitrogen fertilization increased GPC from 13.89% to 16.53% in 2021–2022 and from 11.25% to 13.17% in 2022–2023 (Table 6 and Table 7). In contrast, fertilization reduced STA from 61.62% to 59.59% in 2021–2022 and from 62.89% to 61.35% in 2022–2023 (Table 6 and Table 7), confirming the opposite response of the two grain quality traits to nitrogen availability.
The distribution of genotype performance illustrated considerable variation for YLD, GPC, and STA, although the overall response to nitrogen fertilization remained more consistent than that observed in six-row barley (Figure 5). The positive effect of nitrogen on YLD and GPC, together with the reduction in STA, was evident in both growing seasons, despite the lower productivity recorded in 2022–2023.

3.2.2. Agronomic and Canopy Development Traits

PLH, TKW, NDVI1, and NDVI2 were significantly affected by growing season, and genotype, with significant Year × Fertilization interactions detected for all four traits (Table S3). Significant interactions involving genotype were also observed, indicating that the response of individual cultivars varied across growing seasons and nitrogen treatments.
Nitrogen fertilization reduced PLH in both growing seasons, from 103.73 to 99.30 cm in 2021–2022 and from 103.46 to 95.42 cm in 2022–2023 (Table 6 and Table 7). For TKW, the main effect of fertilization was not significant, whereas the Year × Fertilization interaction was highly significant (p < 0.001), reflecting the contrasting response between growing seasons. TKW increased by 4.3% under fertilization in 2021–2022 but decreased by 4.2% in 2022–2023.
Nitrogen fertilization increased canopy development in both growing seasons, as reflected by higher NDVI values. NDVI1 increased from 0.827 to 0.841 in 2021–2022 and from 0.726 to 0.766 in 2022–2023. Similarly, NDVI2 increased from 0.744 to 0.788 in 2021–2022 and from 0.578 to 0.660 in 2022–2023 (Table 6 and Table 7). The relative response of both NDVI1 and NDVI2 to nitrogen fertilization was greater in 2022–2023 than in 2021–2022. Considerable genotypic variation was observed for all four traits, as illustrated by the distributions presented in Figure S2.

3.2.3. GGE Biplots “Which-Won-Where”

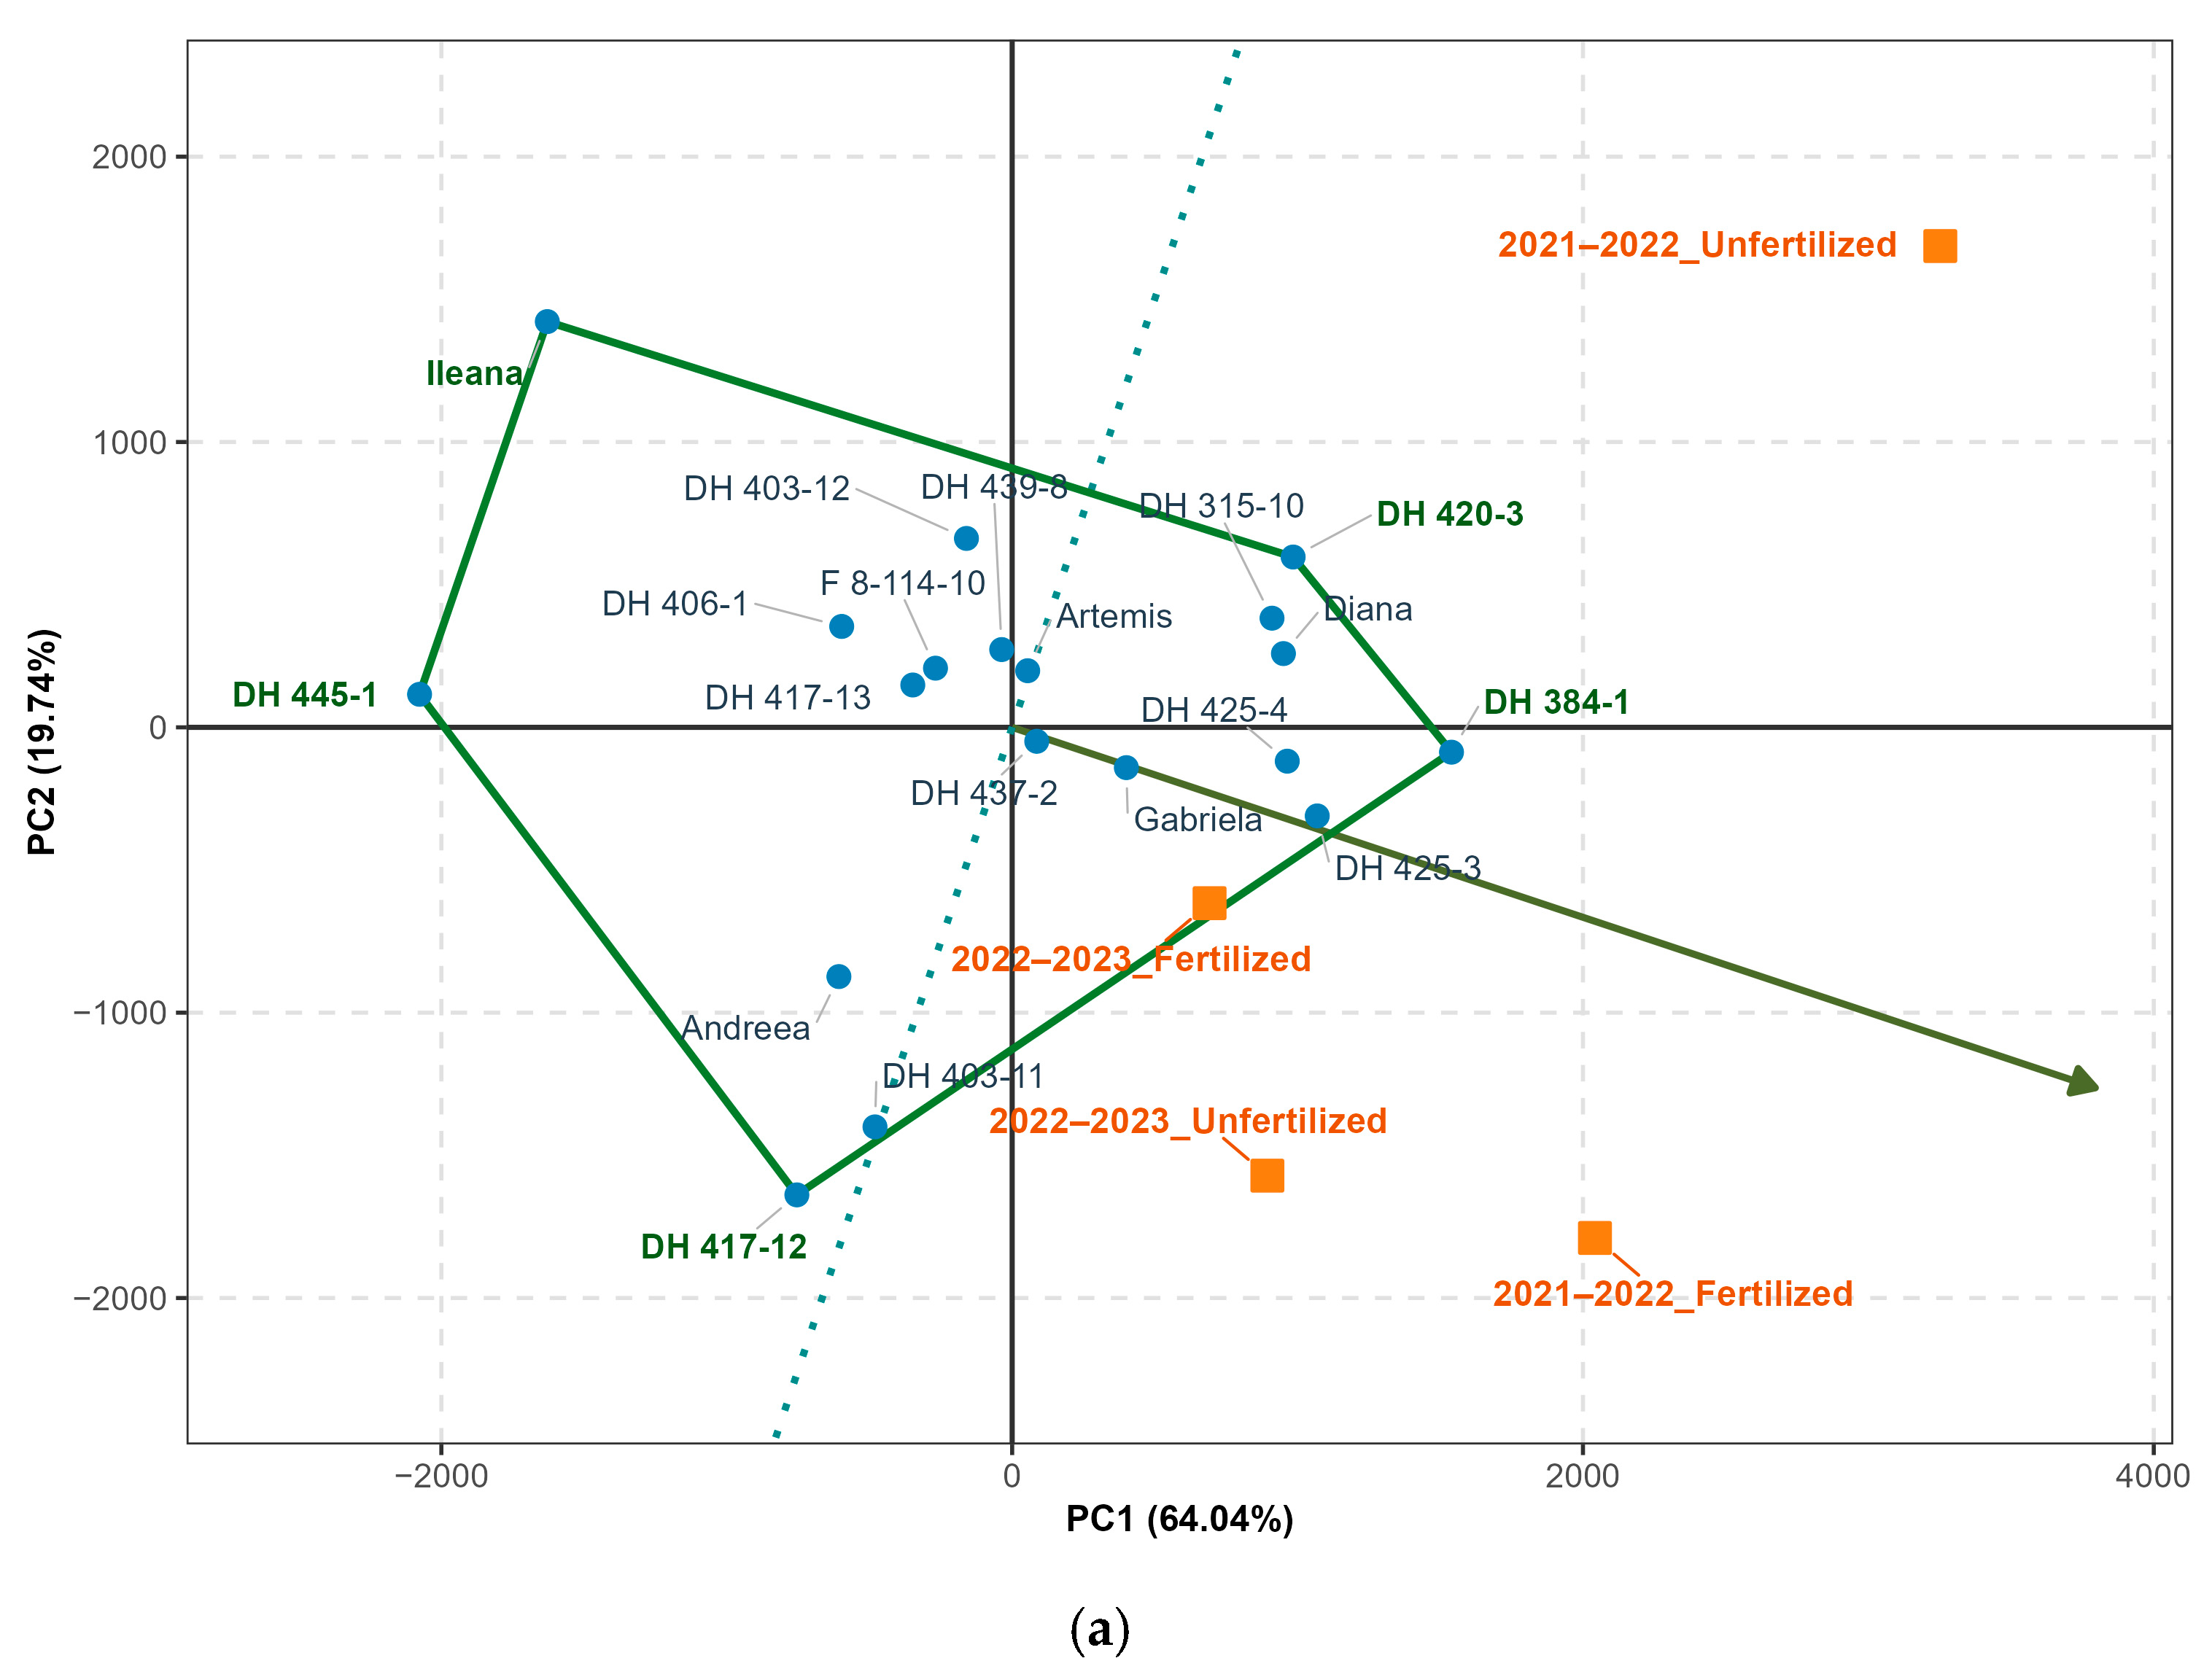
The GGE biplot for YLD explained 83.0% of the genotype and genotype × environment variation (PC1 = 64.0%, PC2 = 19.7%), indicating that the first two principal components adequately represented genotype performance across the evaluated environments (Figure 6a). The polygon view identified Ileana, DH 445-1, DH 417-12, DH 384-1, and DH 420-3 as the vertex genotypes. The environments from the 2021–2022 growing season were positioned on the positive side of PC1 and were associated primarily with the sectors defined by DH 384-1 and DH 420-3, whereas both environments from 2022 to 2023 were grouped closer together and projected in the same sector. AEC indicated that DH 384-1 and DH 420-3 showed good adaptation across environments. Ileana also showed above-average mean performance but was characterized by greater deviation from the AEC axis, indicating stronger genotype × environment interaction. The GGE biplot identified DH 384-1 and DH 420-3 as the highest-yielding genotypes across the evaluated nitrogen regimes.
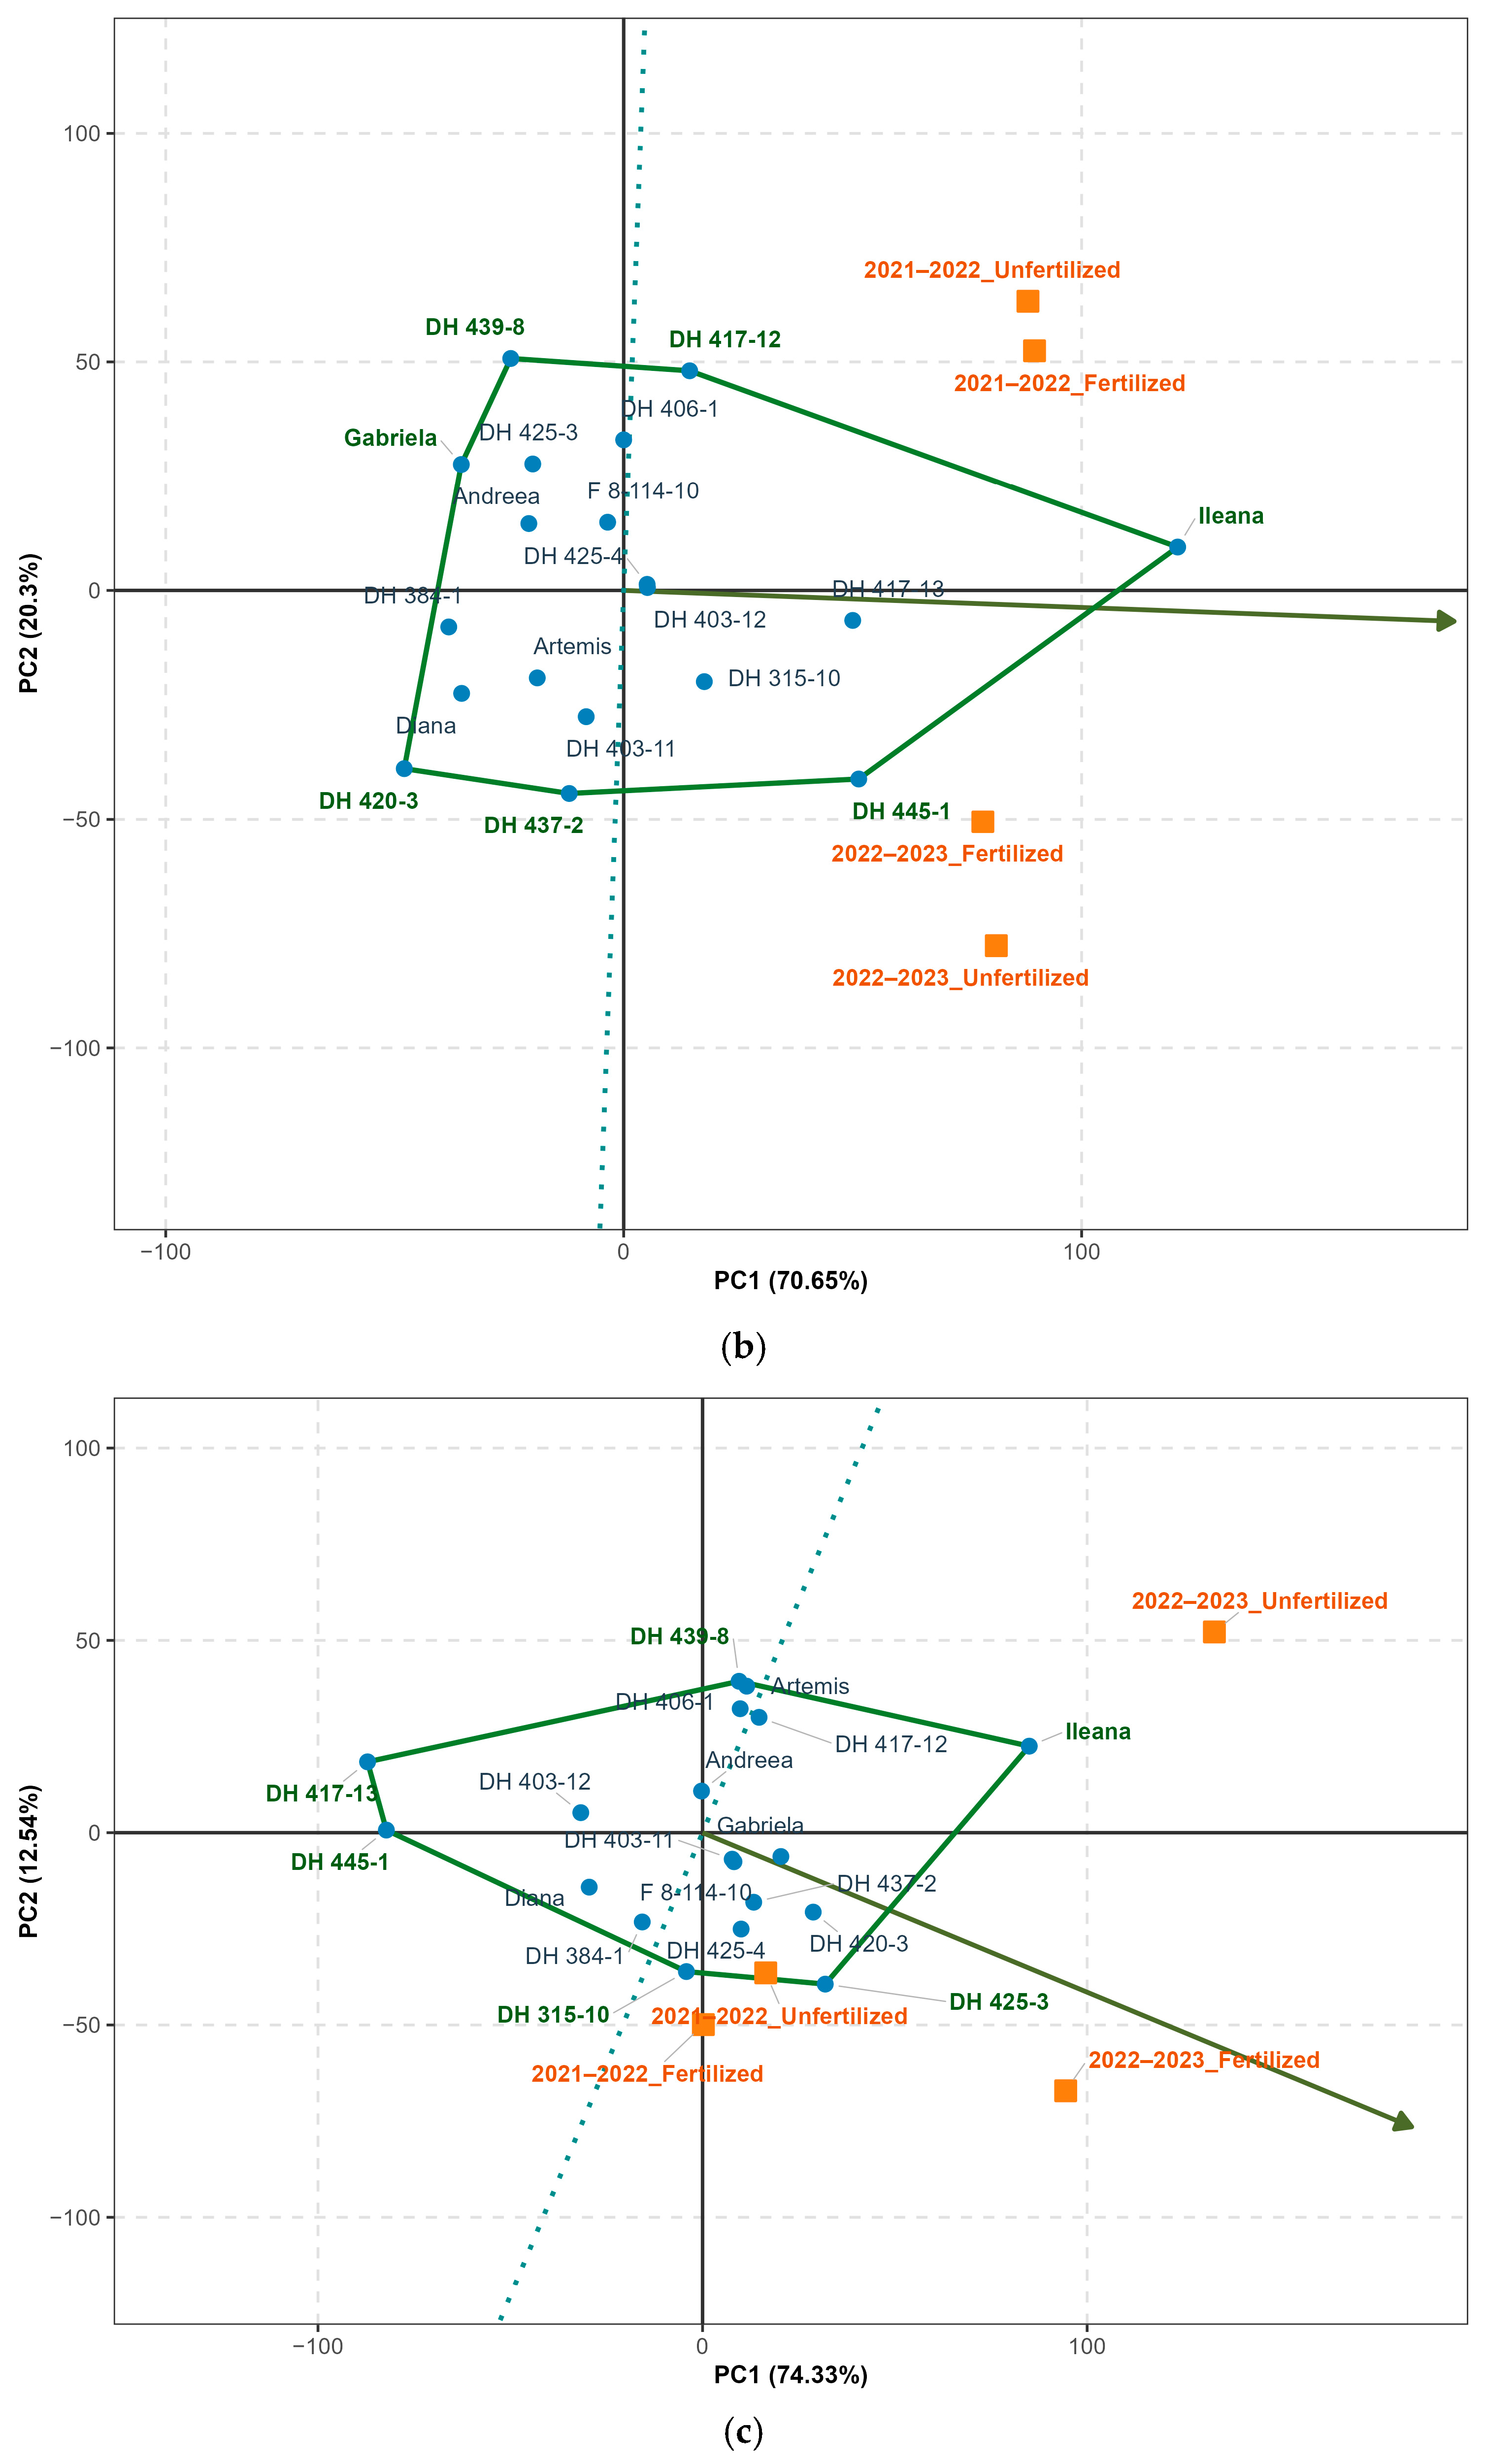
The GGE biplot for GPC explained 90.9% of the genotype and genotype × environment variation (PC1 = 70.7%, PC2 = 20.3%), indicating excellent representation of genotype responses across the evaluated environments (Figure 6b). The polygon was formed by DH 420-3, Gabriela, DH 439-8, DH 417-12, Ileana, DH 445-1, and DH 437-2. The two environments from the 2021–2022 growing season were closely associated, whereas the environments from 2022 to 2023 were separated along PC2, indicating differences in genotype responses between nitrogen treatments. The AEC view indicated that Ileana exhibited the highest average GPC across environments. Overall, the GGE analysis showed that GPC was characterized by relatively consistent genotype ranking, with smaller genotype × environment interaction than observed for YLD.
The GGE biplot for STA explained 86.9% of the genotype and genotype × environment variation (PC1 = 74.3%, PC2 = 12.5%) (Figure 6c). The polygon was defined by DH 417-13, DH 445-1, DH 315-10, DH 425-3, Ileana, and DH 439-8, indicating contrasting genotype responses across environments. The unfertilized environment in 2022–2023 formed a distinct sector associated with Ileana, whereas the remaining environments clustered more closely around the center of the biplot. The AEC view showed that DH 425-3 and Ileana were positioned in the positive direction of the average environment axis, indicating above-average STA. Among these, DH 425-3 was located closer to the AEC axis, suggesting greater stability across environments, whereas Ileana exhibited stronger environmental responsiveness. Genotypes such as DH 445-1, DH 315-10, and DH 417-13 were positioned on the opposite side of the AEC axis, indicating below-average STA. Overall, genotype ranking for STA was more consistent across environments than for YLD.

3.2.4. Trait Relationships and Principal Component Analysis

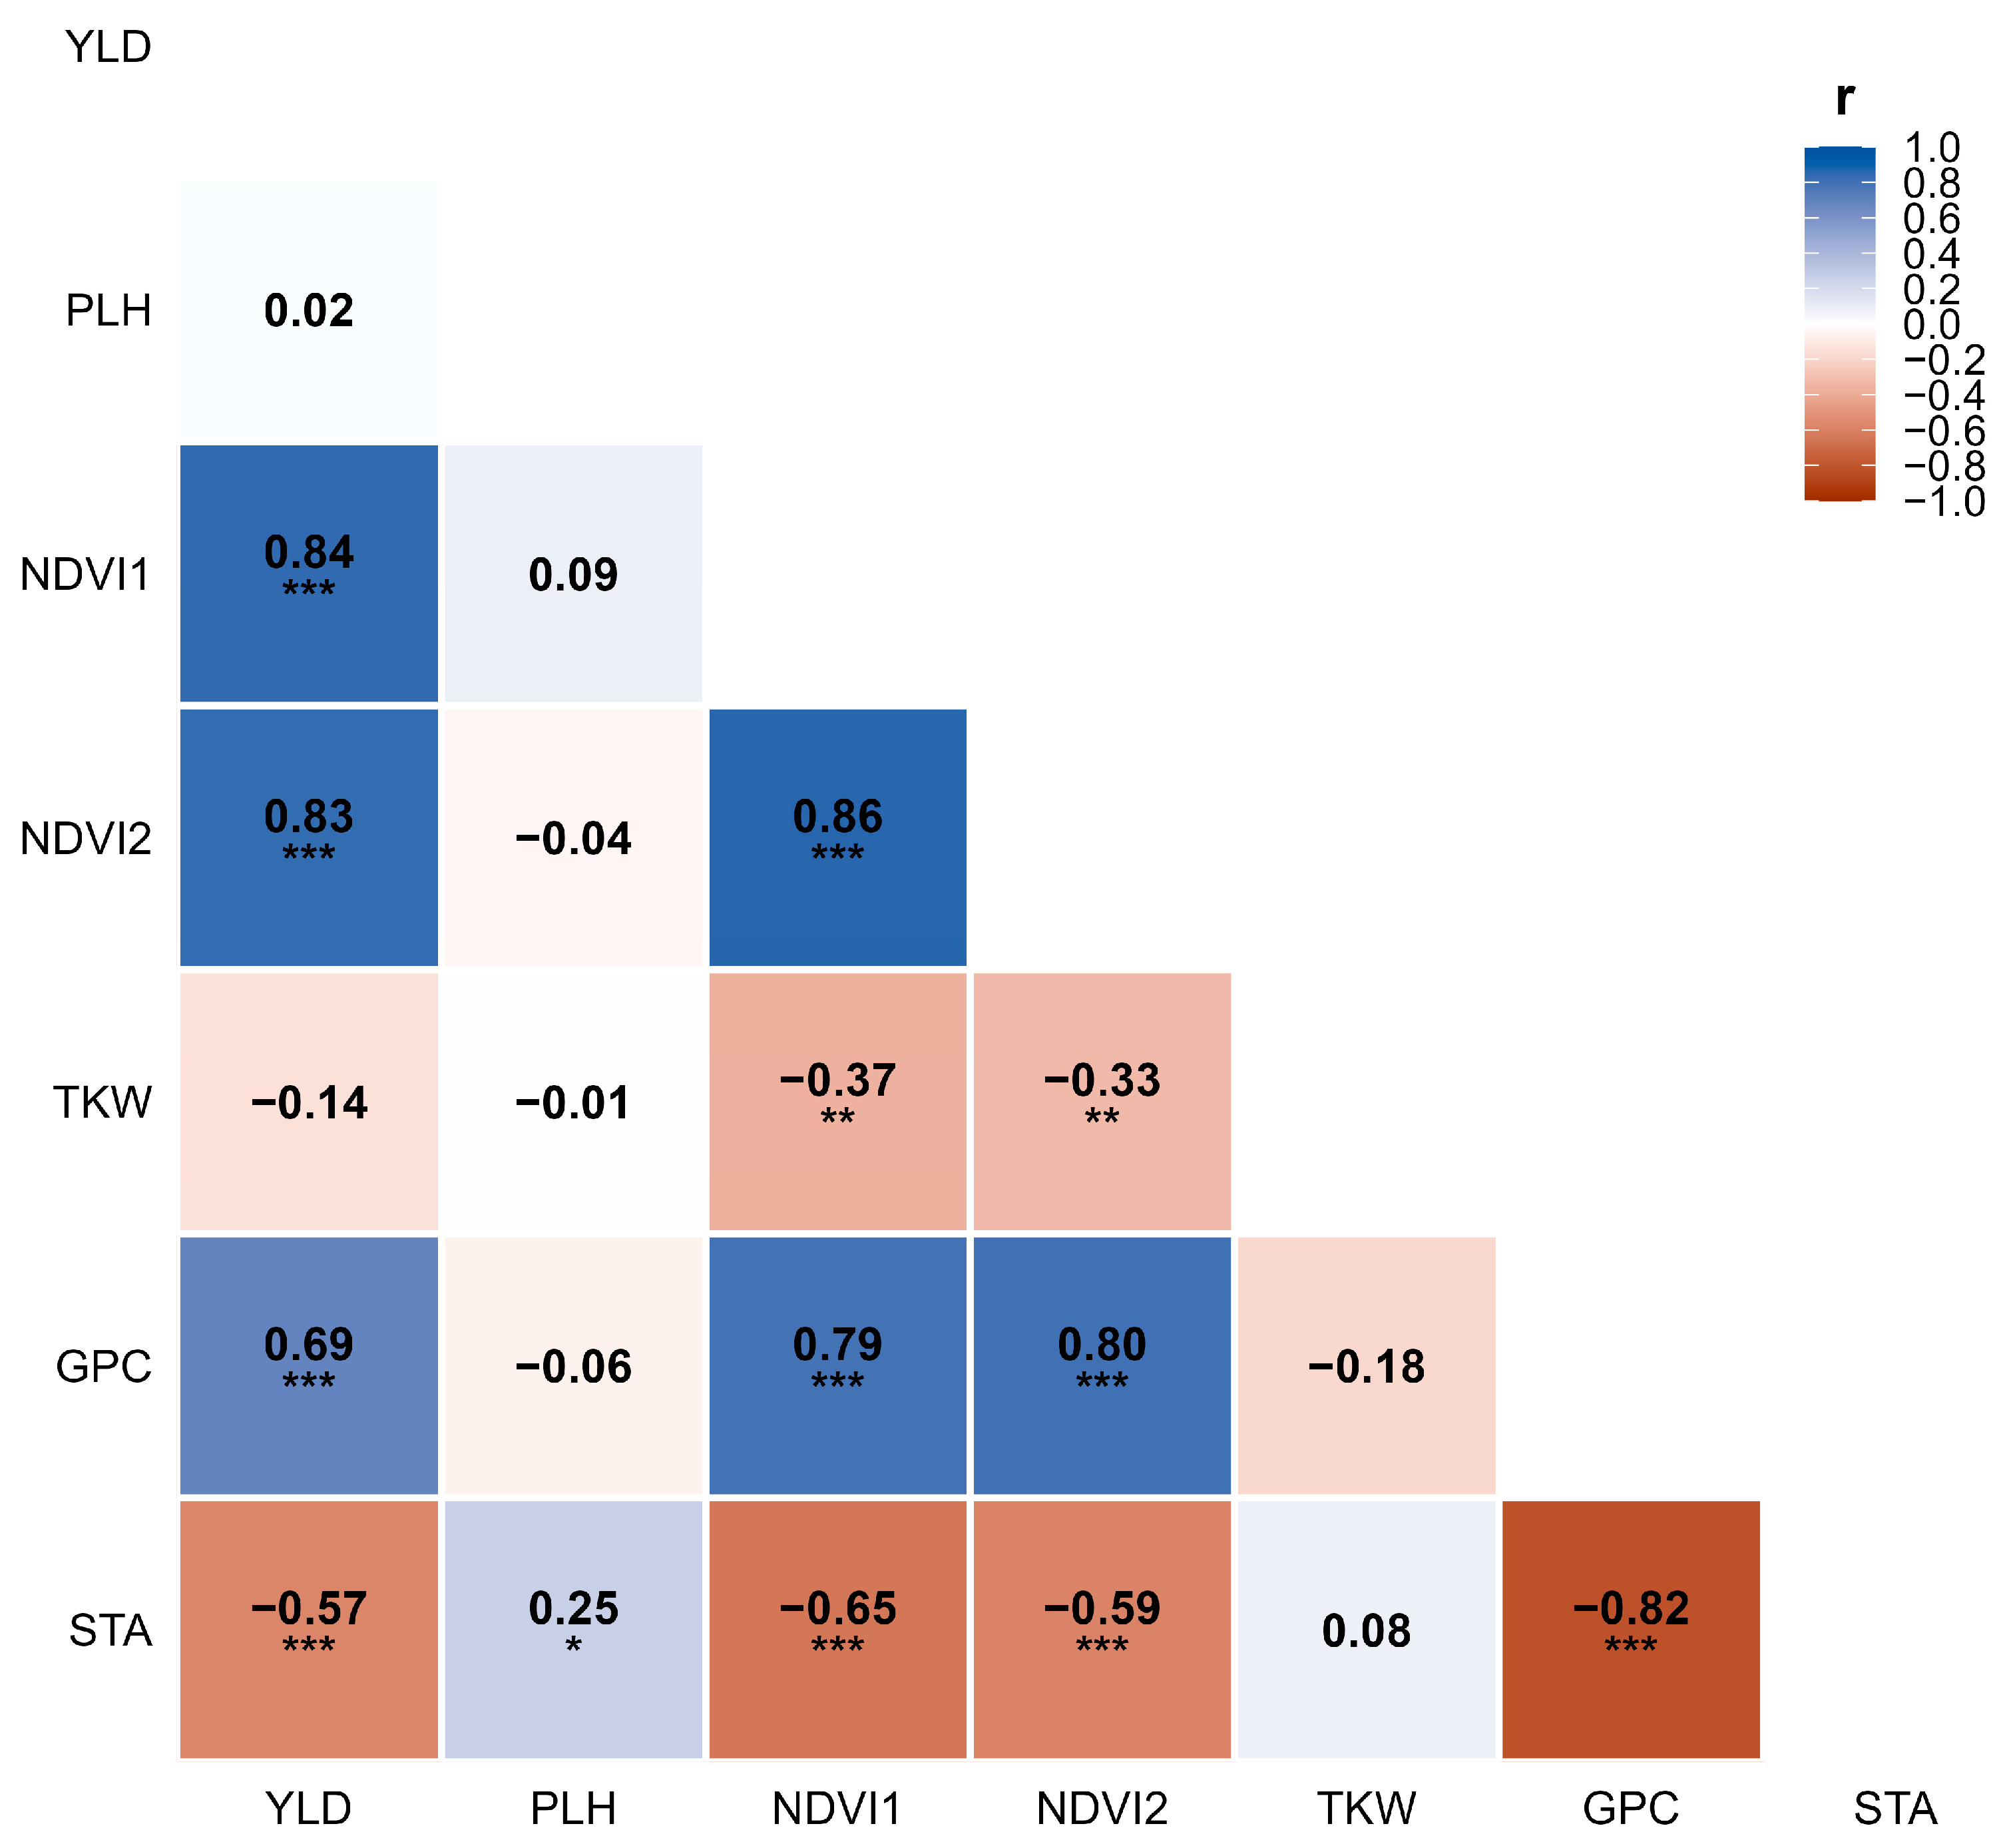
The correlation matrix revealed clear relationships among YLD, grain quality, and agronomic traits in two-row barley (Figure 7). YLD was positively associated with canopy development, as indicated by the positive correlations with NDVI1 and NDVI2, while GPC also showed a positive association with these traits. In contrast, STA exhibited negative correlations with YLD and GPC, confirming the contrasting response of the two grain quality traits under the evaluated nitrogen regimes. PLH and TKW displayed weaker correlations with YLD.
PCA further summarized the relationships among measured traits. The first two principal components accounted for the majority of the phenotypic variation, with PC1 primarily associated with YLD, NDVI1, NDVI2, and GPC, whereas STA was oriented in the opposite direction along the same axis (Table 8). PC2 was mainly related to PLH and TKW, reflecting an additional source of variation largely independent of YLD and grain quality traits. The PCA biplot separated fertilized and unfertilized environments mainly along the first principal component (Figure 8). Fertilized environments were associated with higher YLD, GPC, and canopy development, whereas unfertilized environments were positioned closer to STA. The close alignment of YLD with NDVI1, NDVI2, and GPC, together with the opposite orientation of STA, was consistent with the correlation analysis and summarized the principal patterns of phenotypic variation among two-row barley genotypes.

3.3. Comparative Response of Six-Row and Two-Row Barley to Reduced Nitrogen Fertilization

Although both barley types responded to nitrogen fertilization, six-row and two-row barley differed in their response to nitrogen (Table 3, Table 4, Table 6 and Table 7). YLD of six-row barley increased under nitrogen fertilization during the first growing season but declined slightly in 2022–2023, whereas two-row barley exhibited a positive YLD response in both years. Consequently, the average yield response to nitrogen fertilization was more consistent in two-row barley across the two contrasting growing seasons (Table 3, Table 4, Table 6 and Table 7).
Nitrogen fertilization increased GPC and reduced STA in both barley types (Table 3, Table 4, Table 6 and Table 7). The increase in GPC was more pronounced in two-row barley, particularly during the 2021–2022 growing season, whereas STA decreased under nitrogen fertilization in both barley types with comparable trends across years. These differences were consistent with the significant main effects and interactions detected by the type III ANOVA (Tables S2 and S3).
Agronomic and canopy development traits also differed between barley types (Table 3, Table 4, Table 6 and Table 7; Figure 3 and Figure 7). Two-row barley maintained a positive YLD response in both growing seasons, whereas six-row barley exhibited greater seasonal variation. In contrast, NDVI1 and NDVI2 increased following nitrogen fertilization in both barley types, with the relative increase being greater during the second growing season. The distributions of agronomic traits further highlighted the substantial variability among genotypes within each barley type (Figure 3 and Figure 7).
AEN showed contrasting patterns between barley types and growing seasons (Tables S4 and S5). In six-row barley, mean AEN was 11.53 kg grain kg−1 N in 2021–2022, when additional N increased grain yield, but decreased to −7.39 kg grain kg−1 N in 2022–2023, reflecting the negative average yield response to additional N in the second growing season. Fourteen of the 20 six-row genotypes showed positive AEN in 2021–2022, compared with only three in 2022–2023. In contrast, two-row barley maintained positive mean AEN in both growing seasons, with values of 14.25 and 7.78 kg grain kg−1 N in 2021–2022 and 2022–2023, respectively. Positive AEN was recorded for 18 of the 19 two-row genotypes in the first growing season and for 16 genotypes in the second. The unit-response indices for the other traits showed that additional N generally reduced PLH, increased NDVI1, NDVI2, and GPC, and reduced STA in both barley types, whereas the response of TKW changed from positive in 2021–2022 to negative in 2022–2023. Overall, the AEN results indicate a more consistent positive yield response to additional N in two-row barley than in six-row barley under the conditions evaluated in this study.
The GGE biplot analyses confirmed contrasting patterns of genotype performance (Figure 4 and Figure 8). In six-row barley, Expert FD combined above-average YLD with comparatively consistent performance across the evaluated year × nitrogen combinations at the experimental location, whereas Dana and F 8-3-01 showed superior performance for grain quality traits. In two-row barley, DH 384-1 and DH 420-3 were associated with high YLD across environments, while DH 425-3 and Ileana exhibited superior performance for GPC and STA. Overall, these findings indicate that genotype ranking and stability differed between six-row and two-row barley under reduced nitrogen fertilization (Figure 4 and Figure 8), highlighting the importance of genotype selection for low-input production systems.

4. Discussion

Improving both the yield and quality of winter barley genotypes is an important objective in barley breeding programs and modern agricultural systems. In agricultural practice, nitrogen application is widely used to enhance productivity due to its fundamental role as a component of proteins, nucleic acids, phospholipids, and chlorophyll. Consequently, nitrogen supports plant growth and development while contributing to more efficient water use.
Nitrogen induces numerous physiological changes and morphological responses in plants [36]. Legumes such as peas fix atmospheric nitrogen through biological nitrogen fixation in symbiosis with rhizobia and leave nitrogen-rich residues in the soil [37]. The residual soil nitrogen following peas as a preceding crop alters baseline soil fertility and, consequently, agronomic nitrogen efficiency [38].
Previous studies have shown that legume preceding crops may influence soil N availability, nitrogen use efficiency, and crop performance. Șimon et al. (2026) reported higher wheat yields following soybean than following maize, particularly under reduced N fertilization or without N application [39], while other studies have shown that preceding legumes may influence winter barley yield, N fertilizer response, and malting quality [24,26,39,40]. In the present study, however, pea was the preceding crop in all treatments; therefore, its residual N contribution could not be quantified or separated from the background soil N supply. Consequently, the present results should be interpreted as genotype responses to additional spring N under a common pea-preceded cropping system, rather than as direct evidence of a beneficial effect of pea itself.
Our findings revealed contrasting response patterns among winter barley genotypes under fertilized conditions (pea as the preceding crop plus 100 kg ha−1 urea) and unfertilized conditions (pea as the preceding crop without additional spring N fertilization). These differences were evident in the consistency of yield response across the evaluated year × nitrogen combinations, canopy development, and the contrasting responses of grain protein and starch content. Temperature and precipitation varied across the experimental years and, according to Balducci et al. (2024), together with soil nitrogen availability, these factors contributed to differences in yield between years in both six-row and two-row barley, with growth and yield also influenced by spike type [26].
Regarding yield, the genotypes showed contrasting response patterns across the evaluated year × nitrogen combinations, including genotype-specific responses to particular combinations and cases in which high yield was associated with comparatively consistent performance within the experimental location.
GGE analysis also revealed contrasting patterns for the two grain quality traits. For GPC, some genotypes combined high mean protein content with comparatively greater stability, whereas others showed stronger environmental responsiveness. STA showed a generally consistent negative response to additional N application, with higher starch content under the treatment without additional spring N. From a practical perspective, these results indicate that when maintaining grain starch content is an important quality objective, supplemental N following pea should be applied cautiously and balanced against the expected yield and protein response. Under the conditions of this study, the treatment without additional spring N generally maintained higher STA, whereas the additional 46 kg N ha−1 increased GPC but reduced STA. Therefore, N management should consider genotype and growing-season conditions as well as the intended grain-quality target. However, because only one supplemental N rate was evaluated, the present study cannot define an optimum N rate or a minimum N threshold required to maintain starch content above a specific quality standard. Further experiments including several N rates would be required to establish such recommendations. The inverse relationship between GPC and STA is consistent with the balance between carbon allocation to starch and nitrogen allocation to protein during grain filling [41]. Under the same experimental conditions, yield and grain quality parameters are also highly genotype-dependent [42].
For malting barley, grain protein content is commonly expected to remain within a relatively narrow range, although specific requirements vary among production regions and end-use markets. Published criteria frequently indicate values around 9.5–11.5% as suitable for malting purposes [43]. In the present study, mean GPC under additional N was 14.34% and 11.82% in six-row barley and 16.53% and 13.17% in two-row barley across the two growing seasons, indicating that several treatment means exceeded this commonly cited range. However, malting suitability cannot be inferred from GPC alone, because specific malting-quality traits were not evaluated in this study.
Although genetic progress has been achieved in cereal yield, Triboi and Triboi-Blondel (2002) noted that improvements in grain quality also reflect how selection within breeding programs has affected the carbon–nitrogen balance [44]. Protein accumulation in plants is influenced by several factors, including fertilization strategy, genetic characteristics, cropping system, and, particularly, climatic conditions. Under favorable growing conditions, conventional systems may provide higher product quality; however, integrated farming systems are often preferred because of their lower environmental impact [45].
When both nitrogen and water are sufficiently available, post-anthesis nitrogen uptake accounts for approximately 20% of the total nitrogen uptake at maturity. However, the interaction between genetic variation in nitrogen assimilation and nutrient and water availability throughout the crop cycle affects the proportion of grain nitrogen assimilated before and after anthesis, as well as nitrogen remobilization to the grain [44].
Additionally, in some barley genotypes grown under unfertilized conditions, nitrogen deficiency induced metabolic stress, resulting in reductions in both yield and quality [46]. In contrast, the application of a single nitrogen dose resulted in maximum growth traits, including plant height and yield [7].
Although Abeledo et al. (2008) reported higher nitrogen translocation efficiency towards grain yield in modern than in older barley varieties [47], the present experiment was not designed to statistically test the effect of varietal age. Nevertheless, the contrasting responses observed for Dana and Andreea suggest that release year alone may not explain the response to additional N under the evaluated conditions. Among six-row varieties, Dana, released in 1992, showed comparatively lower yields under the treatment without additional spring N, whereas among two-row varieties, Andreea, also released in 1992, maintained a favorable yield response relative to some more recently released varieties. This observation should therefore be considered preliminary and requires validation using a broader set of genotypes specifically analyzed for the effect of varietal age.
Barley yield and grain quality are determined by interactions among genotype, water availability, and nitrogen availability. These interactions influence whether nitrogen uptake occurs before or after flowering and, consequently, its remobilization within the plant during grain filling. Both the growing environment and genotype continuously influence nitrogen uptake from the soil during the later stages of plant development, as well as the mobilization of previously accumulated nitrogen [48,49]. In breeding programs, selection for yield and grain protein content is therefore closely related to selection for nitrogen utilization efficiency [25].
The variability in response to fertilization among the 20 six-row and 19 two-row winter barley genotypes highlights the contribution of genetic and seasonal factors to nitrogen response. Additional N application generally increased NDVI values, indicating greater canopy greenness or vigor under fertilized conditions. In the present study, some NDVI2 values, particularly in 2022–2023, were below 0.7; for example, two-row barley had mean NDVI2 values of 0.578 under the unfertilized treatment and 0.660 under additional N fertilization. Therefore, NDVI values were interpreted comparatively among treatments and growing seasons rather than against a fixed threshold for optimal N supply. These findings are consistent with the established role of nitrogen in chlorophyll synthesis and photosynthetic functioning [50]. The significant genotype-related effects and interactions observed for several traits further indicate that responses to nitrogen supply differed among genotypes, supporting the importance of genotype selection when targeting improved performance under reduced N inputs. Thus, integrating appropriate fertilization management with the selection of high-performing genotypes may contribute to maximizing yield and maintaining production stability under variable environmental conditions.
The strong seasonal effects observed in the present study are consistent with reports showing that the effect of nitrogen fertilization on grain quality depends on moisture conditions, with more favorable responses under adequate water availability and reduced responses under drought [51].

5. Conclusions

The results of the present study showed that reduced nitrogen fertilization affected barley performance differently depending on the trait evaluated, barley type, and growing season. Seasonal conditions were the main source of variation, strongly influencing agronomic performance, whereas grain quality traits responded more consistently to nitrogen supply. Across both barley types, fertilization increased GPC while reducing STA, confirming the contrasting responses of these quality traits. The two barley types also differed in their agronomic response to reduced nitrogen fertilization. Two-row barley maintained more stable YLD across contrasting growing seasons, whereas six-row barley showed greater sensitivity to seasonal environmental conditions. Under the conditions evaluated in this study, two-row barley showed a more consistent positive yield response to additional N than six-row barley. Pearson correlation and principal component analyses revealed consistent relationships among agronomic performance, canopy development, and grain quality traits. Positive associations among YLD, NDVI1, NDVI2, and GPC, together with the negative relationship between GPC and STA, indicate that the overall pattern of trait interactions remained stable despite differences in seasonal conditions and nitrogen availability. Overall, the success of reduced nitrogen fertilization in barley appears to depend primarily on seasonal growing conditions rather than on nitrogen supply alone. These results provide useful information for optimizing nitrogen management in legume-based crop rotations and support the development of more sustainable barley production systems with reduced fertilizer inputs. High-yielding six-row and two-row winter barley genotypes identified under unfertilized conditions, with pea as the preceding crop and no additional nitrogen fertilization, could be further investigated for root system architecture and responses to macro- and micronutrients under hydroponic conditions, allowing comparisons between laboratory and field results. These genotypes may also represent promising candidates for further evaluation under organic or low-input production systems. The responses of the studied winter barley genotypes under fertilized and unfertilized conditions may provide useful information for farmers when adapting management decisions to the weather conditions of a given growing season, with the aim of obtaining grain with protein and starch characteristics potentially relevant to malting and brewing. The findings may also inform future breeding programs targeting barley performance under reduced nitrogen inputs. The identified genotypes may provide useful material for further evaluation under reduced-N, organic, or other low-input production systems. Their potential agronomic value should, however, be confirmed in multi-location and longer-term experiments before practical recommendations are formulated.

Supplementary Materials

The following supporting information can be downloaded at https://www.mdpi.com/article/10.3390/nitrogen7030104/s1. Figure S1: Boxplots of (a) TKW, (b) PLH, (c) NDVI1, and (d) NDVI2 in six-row barley genotypes under fertilized and unfertilized conditions during the 2021–2022 and 2022–2023 growing seasons. Boxplots display the median, interquartile range (IQR), and individual replicate values; Figure S2: Boxplots of (a) TKW, (b) PLH, (c) NDVI1, and (d) NDVI2 in two-row barley genotypes under fertilized and unfertilized conditions during the 2021–2022 and 2022–2023 growing seasons. Boxplots display the median, interquartile range (IQR), and individual replicate values; Figure S3: GGE biplots “which-won-where” illustrating the performance of six-row barley genotypes for (a) TKW, (b) PLH, (c) NDVI1, and (d) NDVI2 across year × nitrogen fertilization treatment combinations; Figure S4: GGE biplots “which-won-where” illustrating the performance of two-row barley genotypes for (a) TKW, (b) PLH, (c) NDVI1, and (d) NDVI2 across year × nitrogen fertilization treatment combinations; Table S1: Winter barley genotypes evaluated in the study, including their year of release and breeding method; Table S2: Type III analysis of variance for the studied traits in six-row barley; Table S3: Type III analysis of variance for the studied traits in two-row barley; Table S4: Agronomic nitrogen efficiency (AEN) for grain yield and nitrogen response indices for agronomic, canopy development, and grain-quality traits of six-row genotypes under reduced nitrogen fertilization; Table S5: Agronomic nitrogen efficiency (AEN) for grain yield and nitrogen response indices for agronomic, canopy development, and grain-quality traits of two-row genotypes under reduced nitrogen fertilization; Table S6. PC1 and PC2 genotype scores from GGE biplot analyses for agronomic, canopy development, and grain quality traits in six-row and two-row winter barley.

Author Contributions

Conceptualization, L.V. and A.D.O.; methodology E.P., V.S.V. and A.S.; data curation, E.-I.P., V.S.V. and I.C.; software A.D.O. and L.M.; formal analysis, L.V., A.D.O., L.M., E.P., I.C. and V.S.V.; supervision, L.V., A.D.O. and L.M.; validation, A.D.O.; visualization, E.-I.P., V.S.V. and I.C.; writing—original draft, L.V., A.D.O., L.M., I.C., E.P., V.S.V., E.-I.P. and A.S.; writing—review and editing, L.V., A.D.O., L.M., I.C., E.P., V.S.V., E.-I.P. and A.S. All authors have read and agreed to the published version of the manuscript.

Funding

This research received no external funding.

Data Availability Statement

The raw data supporting the conclusions of this article will be made available by the authors on request.

Conflicts of Interest

The authors declare no conflicts of interest.

Abbreviations

The following abbreviations are used in this manuscript:
NARDINational Agricultural Research and Development Institute
NDVINormalized Difference Vegetation Index
BBCHBiologische Bundesanstalt, Bundessortenamt und CHemische Industrie
EMMsEstimated Marginal Means
PLHPlant Height
YLDYield
TKWThousand-Kernel Weight
GPCGrain Protein Content
STAStarch Content
GGEGenotype plus Genotype-by-Environment Interaction
PCAPrincipal Component Analysis
AECAverage Environment Coordination
AENAgronomic Efficiency of Applied Nitrogen
ANOVAAnalysis of Variance
HSDTukey’s Honestly Significant Difference
SEStandard Error

References

  1. Vasilescu, L.; Petcu, E.-I.; Vasilescu, V.S.; Sîrbu, A.; Muntean, L.; Ona, A.D. Phenotypic and Agronomic Evaluation of a Winter Barley Genotype Panel for Breeding Programs. Agronomy 2026, 16, 667. [Google Scholar] [CrossRef] [Scilit]
  2. Nguyen, T.N.P.; Kim, M.; Sung, J.; Fernie, A.R. Composition of Primary Metabolites in Winter Barley Grain as Affected by NPK Fertilization of Reclaimed Land. Plants 2026, 15, 1780. [Google Scholar] [CrossRef] [Scilit] [PubMed]
  3. Carter, A.Y.; Hawes, M.C.; Ottman, M.J. Drought-Tolerant Barley: I. Field Observations of Growth and Development. Agronomy 2019, 9, 221. [Google Scholar] [CrossRef] [Scilit]
  4. Bogale, A.A.; Kende, Z.; Tarnawa, A.; Miko, P.; Birkás, M.; Kovács, G.P.; Percze, A. Precision Nutrient and Soil Tillage Management for Sustainable Winter Barley Production (Hordeum vulgare L.) and Tillage Impact on Soil CO2 Emission. Agronomy 2025, 15, 2. [Google Scholar] [CrossRef] [Scilit]
  5. Vishwakarma, M.; Kulhare, P.S.; Tagore, G.S. Chlorophyll Content in Leaves of Wheat as Influenced by Inorganic, Organic and Integrated Sources of Nutrient Application. Int. J. Plant Soil Sci. 2021, 33, 31–45. [Google Scholar] [CrossRef] [Scilit]
  6. Chen, Z.; Li, L.; Halford, N.G.; Xu, H.; Huang, L.; Gao, R.; Lu, R.; Liu, C. Advances in Barley Breeding for Improving Nitrogen Use Efficiency. Agronomy 2022, 12, 1682. [Google Scholar] [CrossRef] [Scilit]
  7. Tuppad, P.; Kishore, A.; Kharad, S.S.; Sharma, J.D. Effect of Nitrogen Levels on the Growth and Yield of Barley (Hordeum vulgare L.) Varieties. Eco. Env. Cons. 2023, 29, 156–160. [Google Scholar] [CrossRef] [Scilit]
  8. Hammad, H.M.; Ahmad, A.; Abbas, F.; Farooque, A.A.; Willkerson, C.; Ahmad, S.; Hoogenboom, G. Handheld Sensor-Based NDVI Measurement as an Alternative to Destructive Sampling for Growth and Yield Assessment in Maize. Int. J. Plant Prod. 2025, 19, 363–376. [Google Scholar] [CrossRef] [Scilit]
  9. Galloway, J.N.; Townsend, A.R.; Erisman, J.W.; Bekunda, M.; Cai, Z.; Freney, J.R.; Martinelli, L.A.; Seitzinger, S.P.; Sutton, M.A. Transformation of the Nitrogen Cycle: Recent Trends, Questions, and Potential Solutions. Science 2008, 320, 889–892. [Google Scholar] [CrossRef] [Scilit] [PubMed]
  10. Ali, M.A.; Ghazy, A.I.; Alotaibi, K.D.; Ibrahim, O.M.; Al-Doss, A.A. Nitrogen Efficiency Indexes Association with Nitrogen Recovery, Utilization, and Use Efficiency in Spring Barley at Various Nitrogen Application Rates. Agron. J. 2022, 114, 2290–2309. [Google Scholar] [CrossRef] [Scilit]
  11. McKenzie, R.H.; Middleton, A.B.; Hall, L.; DeMulder, J.; Bremer, E. Fertilizer Response of Barley Grain in South and Central Alberta. Can. J. Soil Sci. 2004, 84, 513–523. [Google Scholar] [CrossRef] [Scilit]
  12. Ejigu, D.; Tana, T.; Eticha, F. Effect of Nitrogen Fertilizer Levels on Yield Components and Grain Yield of Malt Barley (Hordeum vulgare L.) Varieties at Kulumsa, Central Ethiopia. Res. Rev. J. Crop Sci. Technol. 2018, 4, 11–21. [Google Scholar]
  13. Loukakis, L.O.; Giannoulis, K.D.; Cavalaris, C.; Karamoutis, C.; Kotoulas, V.; Papastylianou, P.; Economou, G. Balancing Productivity, Grain Quality and Carbon Footprint in Malting Barley Through Soil Tillage Systems Under Mediterranean Conditions. Sustainability 2026, 18, 2956. [Google Scholar] [CrossRef] [Scilit]
  14. Klem, K.; Oravec, M.; Holub, P.; Šimor, J.; Findurová, H.; Surá, K.; Veselá, B.; Hodaňová, P.; Jansen, M.A.K.; Urban, O. Interactive Effects of Nitrogen, UV and PAR on Barley Morphology and Biochemistry Are Associated with the Leaf C:N Balance. Plant Physiol. Biochem. 2022, 172, 111–124. [Google Scholar] [CrossRef] [Scilit] [PubMed]
  15. Yoldi-Achalandabaso, A.; Miranda-Apodaca, J.; Gutiérrez-Fernández, I. The Grain Protein Yield of Barley under Future Drought Is Modified by the Joint Action of Elevated CO2 and Temperature. J. Exp. Bot. 2026, 77, 1807–1826. [Google Scholar] [CrossRef] [Scilit] [PubMed]
  16. Wang, J.; Jin, H.; Zhang, X.; Hao, Y.; Fang, B.; Zhang, D.; Yang, C.; Wang, H.; Yue, J.; Cheng, H.; et al. Nitrogen Topdressing Rate Alters Starch and Protein Properties in Grains at Different Spike Positions Under Long-Term Field Conditions. Plants 2025, 14, 3678. [Google Scholar] [CrossRef] [Scilit] [PubMed]
  17. Ling, L.; Wang, E.; Wang, K.; Cao, C.; Shi, S.; Jiang, Y. Nitrogen Fertilization Alters Rice Taste Quality through Layer-Specific Changes in Protein and Starch Composition. J. Cereal Sci. 2025, 123, 104157. [Google Scholar] [CrossRef] [Scilit]
  18. Kitameraki. Use of Normalized Difference Vegetation Index (NDVI) in Agriculture. Available online: https://www.kitameraki.com/post/ndvi-application-in-agriculture (accessed on 12 August 2026).
  19. Cabrera-Bosquet, L.; Molero, G.; Stellacci, A.M.; Bort, J.; Nogués, S.; Araus, J.L. NDVI as a Potential Tool for Predicting Biomass, Plant Nitrogen Content and Growth in Wheat Genotypes Subjected to Different Water and Nitrogen Conditions. Cereal Res. Commun. 2011, 39, 147–159. [Google Scholar] [CrossRef] [Scilit]
  20. Mirosavljević, M.; Momčilović, V.; Čanak, P.; Aćin, V.; Jocković, B.; Vujošević, B. Variation in NDVI Values and Relationship with Grain Yield in Two-Rowed Winter Barley. Rat. Povrt. 2018, 55, 118–124. [Google Scholar] [CrossRef] [Scilit]
  21. Tucak, M.; Perić, K.; Čupić, T.; Tokić, B.; Krizmanić, G.; Andrić, L.; Ravlić, M.; Žnidaršič, T. Using an NDVI Sensor to Assess the Forage Yield Potential of Red Clover Germplasm. Rom. Agric. Res. 2026, 43, 553–562. [Google Scholar]
  22. Misse, P.T.E.; Gupta, M. Sensor-Based Algorithms to Improve Barley Nitrogen Efficiency in Queensland. AJAR 2018, 13, 1476–1486. [Google Scholar] [CrossRef] [Scilit]
  23. Zhang, J.; Wang, N.; Li, S.; Brunel, B.; Wang, J.; Feng, Y.; Yang, T.; Zong, X. Genotypic Composition and Performance of Pea-Nodulating Rhizobia from Soils Outside the Native Plant-Host Range. Front. Microbiol. 2023, 14, 1201140. [Google Scholar] [CrossRef] [Scilit] [PubMed]
  24. Maw, M.J.W.; Lepcha, I.; Naumann, H.D. Previous Legume Crop Influences Winter Barley Yield, N Fertilizer Response, and Malting Quality in Missouri. Legume Sci. 2023, 5, e182. [Google Scholar] [CrossRef] [Scilit]
  25. Laidig, F.; Feike, T.; Lichthardt, C.; Schierholt, A.; Piepho, H.P. Breeding Progress of Nitrogen Use Efficiency of Cereal Crops, Winter Oilseed Rape and Peas in Long-Term Variety Trials. Theor. Appl. Genet. 2024, 137, 45. [Google Scholar] [CrossRef] [Scilit] [PubMed]
  26. Balducci, E.; Beccari, G.; Orfei, M.; Tini, F.; Covarelli, L.; Benincasa, P. Nitrogen Fertilization Management and Seeding Density Differently Affect Net Blotch Incidence and Grain Yield in One Two-Row and One Six-Row Cultivar of Barley. Ital. J. Agron. 2024, 19, 100019. [Google Scholar] [CrossRef] [Scilit]
  27. Meier, U. Growth Stages of Mono- and Dicotyledonous Plants: BBCH Monograph; Food and Agriculture Organization of the United Nations: Rome, Italy, 2018. [Google Scholar]
  28. Cammarano, D.; Holland, J.; Gianinetti, A.; Baronchelli, M.; Ronga, D. Impact of Nitrogen and Water on Barley Grain Yield and Malting Quality. J. Soil Sci. Plant Nutr. 2024, 24, 6718–6730. [Google Scholar] [CrossRef] [Scilit]
  29. Cizmaș, G.D. Efectul sistemului de agricultură conservativă asupra unor proprietăți fizice ale solului [The Effect of the Conservative Agriculture System on Some Physical Properties of the Soil]. An. INCDA Fundulea 2022, XC, 193–206. Available online: https://www.incda-fundulea.ro/anale/90/90.17.pdf (accessed on 13 September 2026).
  30. R Core Team. R: The R Project for Statistical Computing. Available online: https://www.r-project.org/ (accessed on 12 August 2026).
  31. Posit Team. RStudio: Integrated Development Environment for R. Available online: https://posit.co/products/open-source/rstudio (accessed on 12 August 2026).
  32. Fox, J.; Weisberg, S. An R Companion to Applied Regression, 3rd ed.; SAGE Publications: Thousand Oaks, CA, USA, 2019. [Google Scholar]
  33. Lenth, R.V.; Piaskowski, J.; Banfai, B.; Bolker, B.; Buerkner, P.; Giné-Vázquez, I.; Hervé, M.; Jung, M.; Love, J.; Miguez, F.; et al. R Package, version 1.8.5; Emmeans: Estimated Marginal Means, Aka Least-Squares Means; The R Foundation for Statistical Computing: Vienna, Austria, 2026. [Google Scholar]
  34. Dobermann, A. Nutrient Use Efficiency: Measurement and Management; University of Nebraska—Lincoln: Lincoln, NE, USA, 2007. [Google Scholar]
  35. Harrell, F.E., Jr.; Beck, C.; Dupont, C. R Package, version 5.2-5; Hmisc: Harrell Miscellaneous; The R Foundation for Statistical Computing: Vienna, Austria, 2026. [Google Scholar]
  36. Liu, Y.; Von Wirén, N. Ammonium as a Signal for Physiological and Morphological Responses in Plants. J. Exp. Bot. 2017, 68, 2581–2592. [Google Scholar] [CrossRef] [Scilit] [PubMed]
  37. Kebede, E. Contribution, Utilization, and Improvement of Legumes-Driven Biological Nitrogen Fixation in Agricultural Systems. Front. Sustain. Food Syst. 2021, 5, 767998. [Google Scholar] [CrossRef] [Scilit]
  38. Sainju, U.M. Nitrogen Fertilization to Malt Barley Enhances Pea Yield and Quality, Regardless of Cover Cropping, in the Malt Barley–Pea Rotation. Agron. J. 2025, 117, e70085. [Google Scholar] [CrossRef] [Scilit]
  39. Șimon, A.; Ceclan, O.A.; Chețan, F.; Popa, A.; Bărdaș, M.; Șopterean, L.; Vălean, A.-M. Influence of Preceding Crops and Fertilization Strategies on Wheat Performance and Disease Dynamics. Nitrogen 2026, 7, 21. [Google Scholar] [CrossRef] [Scilit]
  40. Sainju, U.M.; Lenssen, A.W.; Barsotti, J.L. Dryland Malt Barley Yield and Quality Affected by Tillage, Cropping Sequence, and Nitrogen Fertilization. Agron. J. 2013, 105, 329–340. [Google Scholar] [CrossRef] [Scilit]
  41. Yang, X.; Ahmed, H.G.M.D.; Yang, J.; Pu, X.; Li, X.; Yang, L.; Yang, G.; Guan, X.; Tian, J.; Iqbal, R.; et al. Differences in Nutrient Functional Composition among Different Types of Grains in Barley (Hordeum vulgare L.) Recombinant Inbred Lines. Appl. Ecol. Env. Res. 2025, 23, 7103–7121. [Google Scholar] [CrossRef] [Scilit]
  42. Jevtić, R.; Župunski, V.; Brbaklić, L.; Živančev, D.; Dolapčev Rakić, A.; Aćin, V.; Mikić, S.; Orbović, B. Potential for Enhancing Seed Yield and Quality of Spring Oat and Hull-Less Barley Through Intercropping with Pea Under the Pannonian Climate. Agronomy 2025, 15, 1349. [Google Scholar] [CrossRef] [Scilit]
  43. Barmeier, G.; Hu, Y.; Schmidhalter, U. Partitioning and Translocation of Dry Matter and Nitrogen During Grain Filling in Spring Barley Varieties and Their Roles in Determining Malting Quality. Front. Plant Sci. 2021, 12, 722871. [Google Scholar] [CrossRef] [Scilit] [PubMed]
  44. Triboi, E.; Triboi-Blondel, A.-M. Productivity and Grain or Seed Composition: A New Approach to an Old Problem—Invited Paper. Eur. J. Agron. 2002, 16, 163–186. [Google Scholar] [CrossRef] [Scilit]
  45. Jańczak-Pieniążek, M.; Kaszuba, J. The Influence of Agrotechnical Factors on the Yield and Quality Parameters of Winter Triticale Grain. Agriculture 2024, 14, 2219. [Google Scholar] [CrossRef] [Scilit]
  46. Wang, Q.; Li, S.; Li, J.; Huang, D. The Utilization and Roles of Nitrogen in Plants. Forests 2024, 15, 1191. [Google Scholar] [CrossRef] [Scilit]
  47. Abeledo, L.G.; Calderini, D.F.; Slafer, G.A. Nitrogen Economy in Old and Modern Malting Barleys. Field Crops Res. 2008, 106, 171–178. [Google Scholar] [CrossRef] [Scilit]
  48. Celedonio, R.P.d.S.; Abeledo, L.G.; Striker, G.G.; Miralles, D.J. Nitrogen Accumulation and Remobilisation in Wheat and Barley Plants Exposed to Waterlogging at Different Developmental Stages. Crop. Pasture Sci. 2022, 73, 615–626. [Google Scholar] [CrossRef] [Scilit]
  49. Govindasamy, P.; Muthusamy, S.K.; Bagavathiannan, M.; Mowrer, J.; Jagannadham, P.T.K.; Maity, A.; Halli, H.M.; Sujayanand, G.K.; Vadivel, R.; Das, T.K.; et al. Nitrogen Use Efficiency—A Key to Enhance Crop Productivity under a Changing Climate. Front. Plant Sci. 2023, 14, 1121073. [Google Scholar] [CrossRef] [Scilit] [PubMed]
  50. Lawlor, D.W. Carbon and Nitrogen Assimilation in Relation to Yield: Mechanisms Are the Key to Understanding Production Systems. J. Exp. Bot. 2002, 53, 773–787. [Google Scholar] [CrossRef] [Scilit]
  51. Andraș, B.-E.; Acs, P.-B.; Horga, V.-A.; Muntean, E.; Mondici, S.; Racz, I.; Duda, M.M. Agroclimatic and Agronomic Factors Affecting Triticale Grain Quality. Nitrogen 2026, 7, 52. [Google Scholar] [CrossRef] [Scilit]
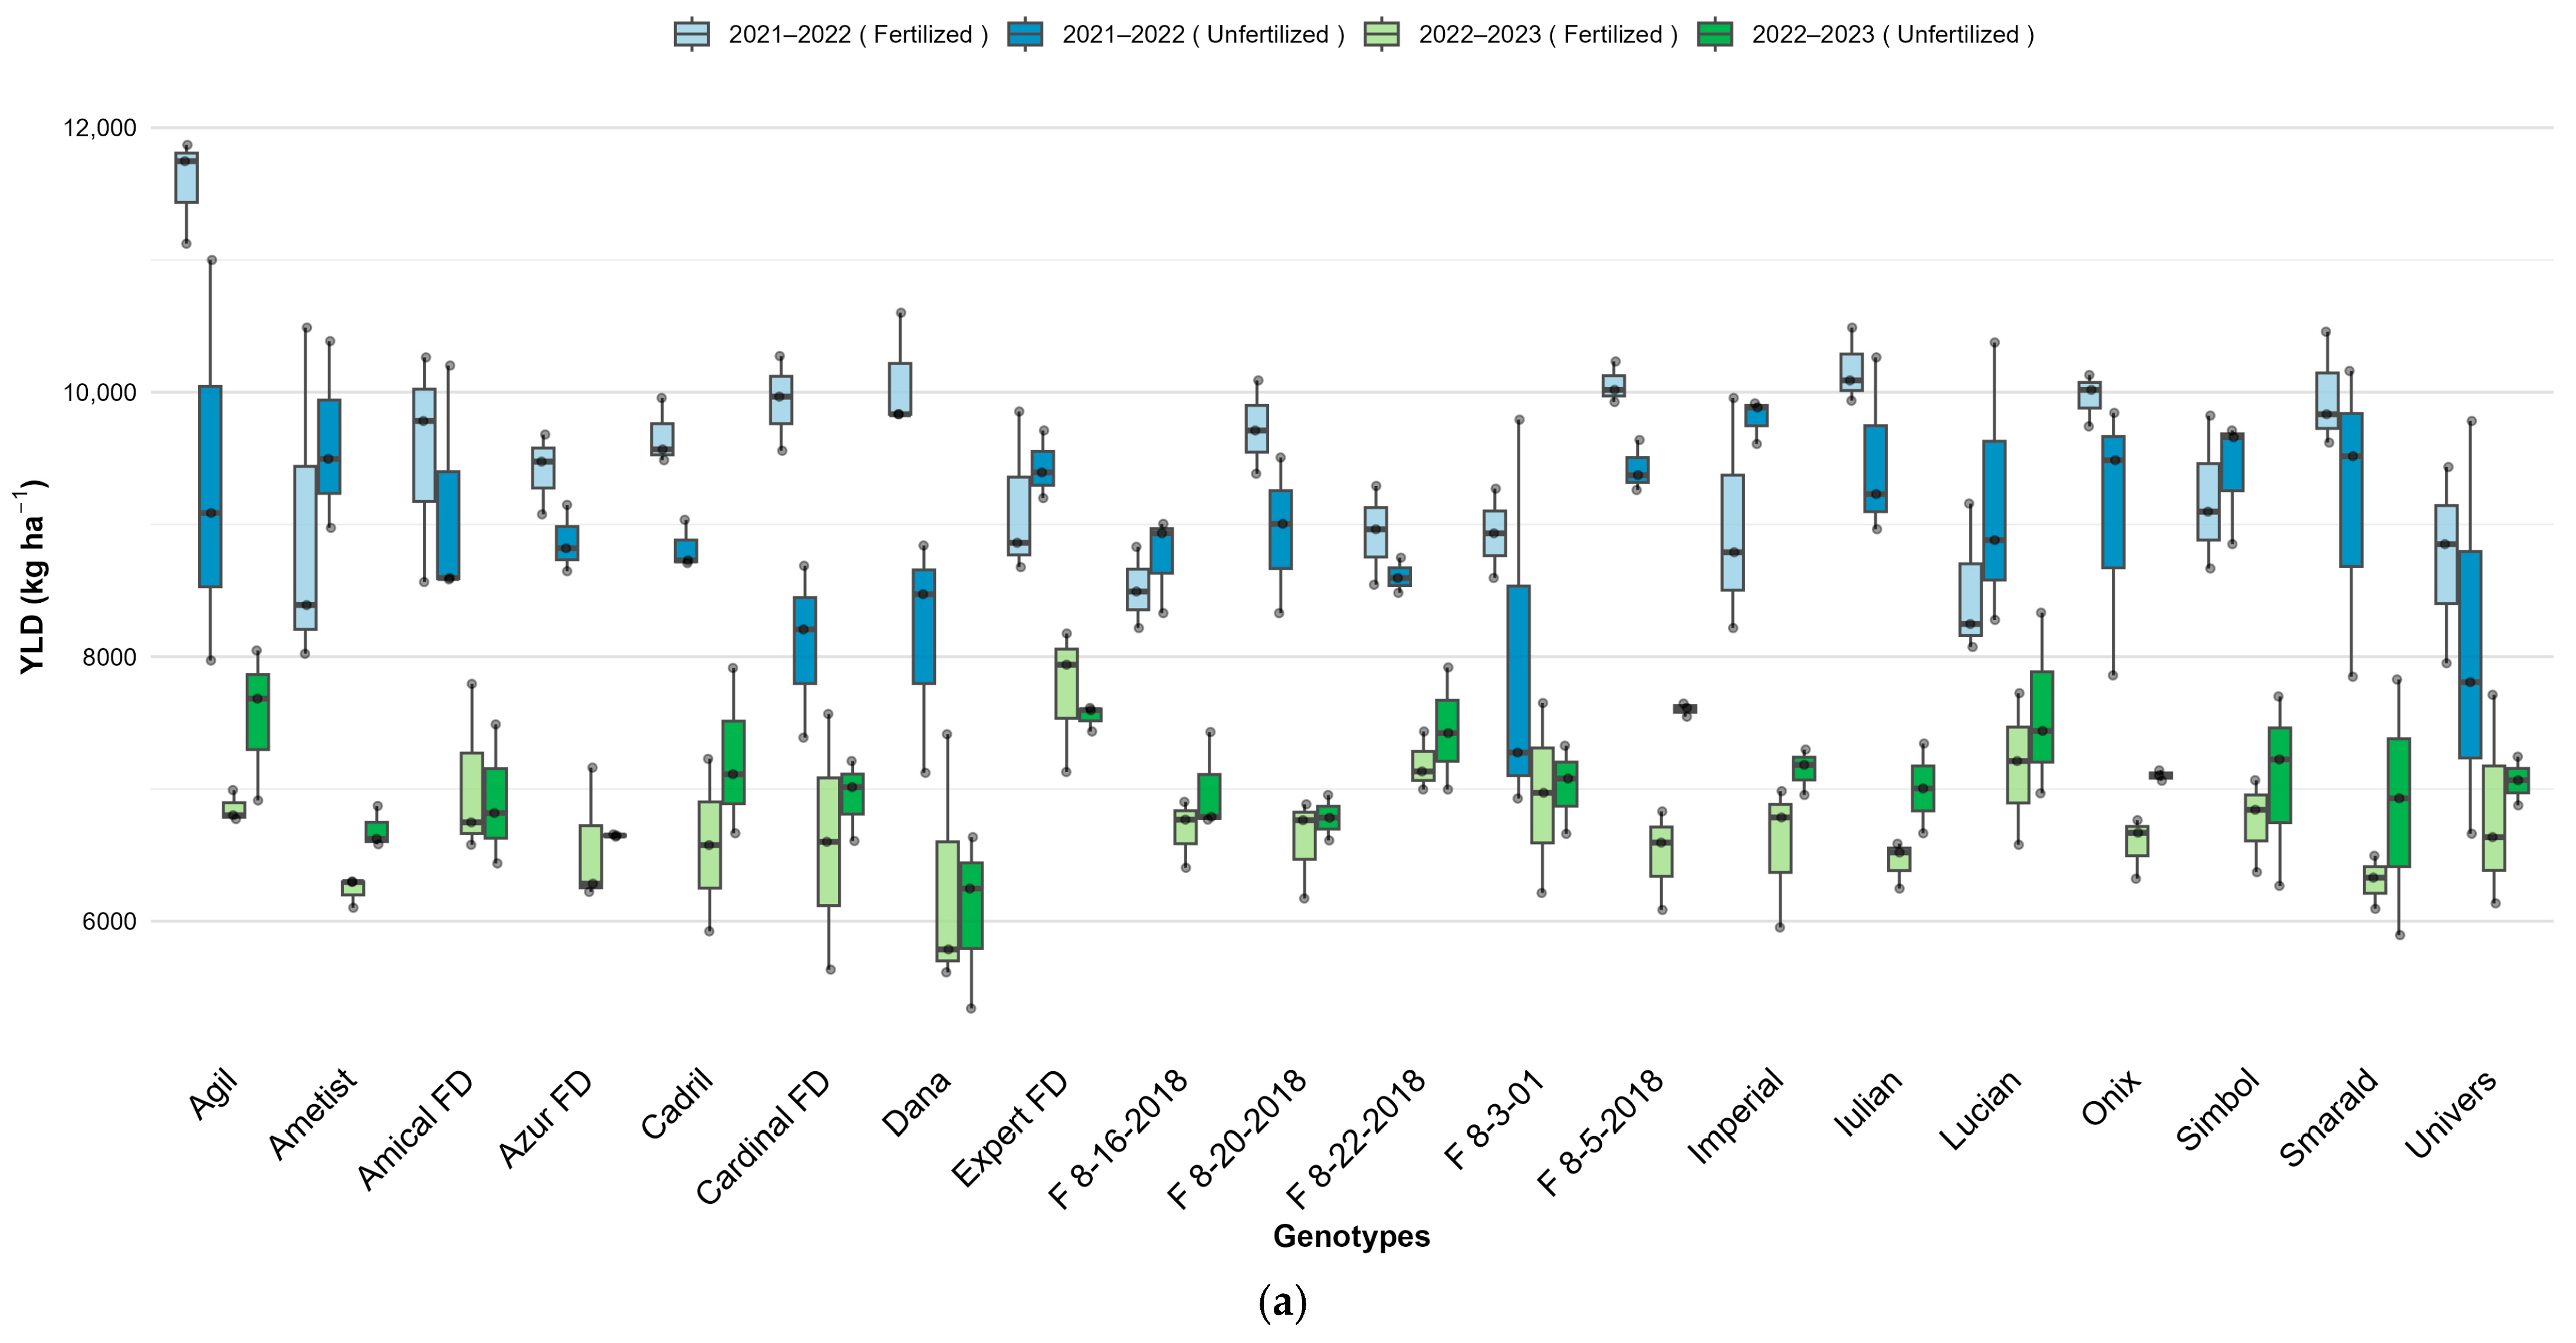
Figure 1. Boxplots of (a) YLD, (b) GPC and (c) STA of six-row barley genotypes under fertilized and unfertilized conditions during the 2021–2022 and 2022–2023 growing seasons. Boxplots display the median, interquartile range (IQR), and individual replicate values.
Nitrogen 07 00104 g001aNitrogen 07 00104 g001b
Figure 2. GGE biplots “which-won-where” illustrating the performance of six-row barley genotypes for (a) YLD, (b) GPC, and (c) STA across year × nitrogen fertilization treatment combinations.
Nitrogen 07 00104 g002aNitrogen 07 00104 g002b
Figure 3. Pearson correlation matrices showing relationships among agronomic, canopy development, and grain quality traits in six-row barley. Asterisks indicate significant correlations (** p < 0.01, *** p < 0.001). Blue and brown colors indicate positive and negative correlations.
Nitrogen 07 00104 g003
Figure 4. PCA biplot of agronomic performance, canopy development, and grain quality traits under fertilized and unfertilized nitrogen treatments across the 2021–2022 and 2022–2023 growing seasons in six-row barley.
Nitrogen 07 00104 g004
Figure 5. Boxplots of (a) YLD, (b) GPC, and (c) STA of two-row barley genotypes under fertilized and unfertilized conditions during the 2021–2022 and 2022–2023 growing seasons. Boxplots display the median, interquartile range (IQR), and individual replicate values.
Nitrogen 07 00104 g005aNitrogen 07 00104 g005b
Figure 6. GGE biplots “which-won-where” illustrating the performance of two-row barley genotypes for (a) YLD, (b) GPC, and (c) STA across year × nitrogen fertilization treatment combinations.
Nitrogen 07 00104 g006aNitrogen 07 00104 g006b
Figure 7. Pearson correlation matrices showing relationships among agronomic, canopy develop-ment, and grain quality traits in two-row barley. Asterisks indicate significant correlations (* p < 0.05, ** p < 0.01, *** p < 0.001). Blue and brown colors indicate positive and negative correlations, respectively.
Nitrogen 07 00104 g007
Figure 8. PCA biplot of agronomic performance, canopy development, and grain quality traits under fertilized and unfertilized nitrogen treatments across the 2021–2022 and 2022–2023 growing seasons in two-row barley.
Nitrogen 07 00104 g008
Table 1. Technological sequences applied during the two growing seasons under unfertilized and fertilized conditions.
YearSowing DateFertilization
(kg ha−1)
Herbicide
(Dose ha−1)
Fungicide
(Dose/No. of Treatments)
Harvest
Date
Autumn
N:P:K
Spring
Urea
Autumn
Stomp
Spring
Axial One
Spring
2021–202223 October 2021200 kg100 kg3 L ha−11 L ha−1Mizona—0.6 L ha−1
Falcon—0.7 L ha−1
19 June 2022
2022–202320 October 2022200 kg100 kg3 L ha−11 L ha−1Nativo Pro—0.7 L ha−1
Falcon Pro—0.7 L ha−1
4 July 2023
Table 2. Monthly rainfall (a) and mean air temperature (b) recorded during the 2021–2022 and 2022–2023 winter barley growing seasons, compared with the 60-year averages at the NARDI Fundulea meteorological station.
(a)
60-year average
monthly rainfall
OctoberNovemberDecemberJanuaryFebruaryMarchAprilMayJuneJuly
42.342.043.735.132.037.445.162.574.971.1
2021–2022 year56.433.837.64.85.412.347.630.159.629.2
2022–2023 year5.219.621.864.25.810.077.232.440.243.8
(b)
60-year average
monthly air
temperature
OctoberNovemberDecemberJanuaryFebruaryMarchAprilMayJuneJuly
11.35.40.0−2.4−0.44.911.317.020.822.7
2021–2022 year10.27.72.62.14.74.412.117.922.625.0
2022–2023 year13.59.03.54.93.38.210.816.922.326.1
Table 3. Estimated marginal means (EMMs ± SE) of agronomic and grain quality traits in six-row barley under unfertilized and fertilized conditions in two growing seasons.
Trait2021–20222022–2023p
(Y × F)
UnfertilizedFertilizedUnfertilizedFertilized
YLD (kg ha−1)8969.86 ± 79.19 b9500.42 ± 79.19 a7064.29 ± 79.19 c6724.29 ± 79.19 d<0.001
TKW (g)36.22 ± 0.32 b36.97 ± 0.32 ab37.73 ± 0.32 a33.88 ± 0.32 c<0.001
GPC (%)12.23 ± 0.08 b14.34 ± 0.08 a9.71 ± 0.08 d11.82 ± 0.08 c0.999
STA (%)61.47 ± 0.07 b60.26 ± 0.07 d62.66 ± 0.07 a60.74 ± 0.07 c<0.001
PLH (cm)103.08 ± 0.34 a98.42 ± 0.34 c103.85 ± 0.34 a100.79 ± 0.34 b0.018
NDVI10.83 ± 0.00 b0.85 ± 0.00 a0.74 ± 0.00 d0.78 ± 0.00 c0.005
NDVI20.78 ± 0.00 b0.81 ± 0.00 a0.65 ± 0.00 d0.69 ± 0.00 c0.207
Note: YLD = grain yield; TKW = thousand-kernel weight; GPC = grain protein content; STA = grain starch content; PLH = plant height; NDVI1 and NDVI2 = normalized difference vegetation index measured at two growth stages. Values are estimated marginal means (EMMs) ± standard error (SE). Means followed by different letters differ significantly according to Tukey’s test (p < 0.05). The last column shows the p-value for the Year × Fertilization interaction from the Type III ANOVA (Table S2).
Table 4. Response of six-row barley to reduced nitrogen fertilization following pea as the preceding crop.
TraitGrowing SeasonUnfertilizedFertilizedΔΔ (%)
YLD (kg ha−1)2021–20228969.99500.4+530.6+5.9
2022–20237064.36724.3−340.0−4.8
PLH (cm)2021–2022103.0898.42−4.66−4.5
2022–2023103.85100.79−3.06−2.9
NDVI12021–20220.8250.845+0.020+2.4
2022–20230.7440.782+0.038+5.1
NDVI22021–20220.7760.806+0.030+3.8
2022–20230.6460.687+0.041+6.3
TKW (g)2021–202236.2236.97+0.74+2.1
2022–202337.7333.88−3.85−10.2
GPC (%)2021–202212.2314.34+2.11+17.2
2022–20239.7111.82+2.11+21.7
STA (%)2021–202261.4760.26−1.21−1.9
2022–202362.6660.74−1.92−3.1
Note: Values represent arithmetic means for each combination of growing season and fertilization treatment. The unfertilized treatment consisted of barley grown after pea and received the basal DAP application only, whereas the fertilized treatment additionally received 100 kg ha−1 commercial urea (46% N) following pea. Δ represents the absolute response to nitrogen fertilization; Δ (%) represents the relative response to nitrogen fertilization.
Table 5. Correlation loadings, eigenvalues, and cumulative variance of the first two principal components for six-row barley.
TraitPC1 (49.5%)PC2 (18.7%)
YLD+0.77+0.01
PLH−0.20+0.79
NDVI1+0.89−0.08
NDVI2+0.87+0.06
TKW+0.01+0.80
GPC+0.92+0.06
STA−0.66−0.18
Eigenvalue3.461.31
Cumulative
Variance (%)
49.5%68.2%
Table 6. Estimated marginal means (EMMs ± SE) of agronomic and grain quality traits in two-row barley under unfertilized and fertilized conditions in two growing seasons.
Trait2021–20222022–2023p
(Y × F)
UnfertilizedFertilizedUnfertilizedFertilized
YLD (kg ha−1)8316.40 ± 75.44 b8971.81 ± 75.44 a6019.02 ± 75.44 d6377.07 ± 75.44 c0.051
TKW (g)42.94 ± 0.30 c44.78 ± 0.30 b46.91 ± 0.30 a44.92 ± 0.30 b<0.001
GPC (%)13.89 ± 0.11 b16.53 ± 0.11 a11.25 ± 0.11 d13.17 ± 0.11 c0.001
STA (%)61.62 ± 0.10 b59.59 ± 0.10 c62.89 ± 0.10 a61.35 ± 0.10 b0.014
PLH (cm)103.73 ± 0.34 a99.30 ± 0.34 b103.46 ± 0.34 a95.42 ± 0.34 c<0.001
NDVI10.83 ± 0.00 b0.84 ± 0.00 a0.73 ± 0.00 d0.77 ± 0.00 c<0.001
NDVI20.74 ± 0.00 b0.79 ± 0.00 a0.58 ± 0.00 d0.66 ± 0.00 c<0.001
Note: YLD = grain yield; TKW = thousand-kernel weight; GPC = grain protein content; STA = grain starch content; PLH = plant height; NDVI1 and NDVI2 = normalized difference vegetation index measured at two growth stages. Values are estimated marginal means (EMMs) ± standard error (SE). Means followed by different letters differ significantly according to Tukey’s test (p < 0.05). The last column shows the p-value for the Year × Fertilization interaction from the Type III ANOVA (Table S3).
Table 7. Response of two-row barley to reduced nitrogen fertilization following pea as the preceding crop.
TraitGrowing SeasonUnfertilizedFertilizedΔΔ (%)
YLD (kg ha−1)2021–20228316.48971.8+655.4+7.9
2022–20236019.06377.1+358.1+5.9
PLH (cm)2021–2022103.7399.30−4.43−4.3
2022–2023103.4695.42−8.04−7.8
NDVI12021–20220.8270.841+0.014+1.7
2022–20230.7260.766+0.040+5.6
NDVI22021–20220.7440.788+0.044+6.0
2022–20230.5780.660+0.081+14.1
TKW (g)2021–202242.9444.78+1.83+4.3
2022–202346.9144.92−1.99−4.2
GPC (%)2021–202213.8916.53+2.64+19.0
2022–202311.2513.17+1.92+17.1
STA (%)2021–202261.6259.59−2.03−3.3
2022–202362.8961.35−1.54−2.5
Note: Values represent arithmetic means for each combination of growing season and fertilization treatment. The unfertilized treatment consisted of barley grown after pea and received the basal DAP application only, whereas the fertilized additionally received 100 kg ha−1 commercial urea (46% N) following pea. Δ represents the absolute response to nitrogen fertilization; Δ (%) represents the relative response to nitrogen fertilization.
Table 8. Correlation loadings, eigenvalues, and cumulative variance of the first two principal components for two-row barley.
TraitPC1 (54.8%)PC2 (16.1%)
YLD+0.82+0.09
PLH−0.06+0.87
NDVI1+0.90+0.20
NDVI2+0.90+0.08
TKW−0.33−0.41
GPC+0.90−0.12
STA−0.78+0.37
Eigenvalue3.841.13
Cumulative
Variance (%)
54.8%71.0%
Disclaimer/Publisher’s Note: The statements, opinions and data contained in all publications are solely those of the individual author(s) and contributor(s) and not of MDPI and/or the editor(s). MDPI and/or the editor(s) disclaim responsibility for any injury to people or property resulting from any ideas, methods, instructions or products referred to in the content.